Industrial Investment in Nazi Germany: The Forgotten ... · PDF file1 Industrial Investment in...
45
1 Industrial Investment in Nazi Germany: The Forgotten Wartime Boom* Jonas Scherner University of Mannheim/Yale University March 2006 Abstract To date we lack reliable data on the level of industrial investment in the Third Reich. In addition our overall knowledge of the quantitative significance of the war-related branches – autarky and armaments industries – is extremely patchy. And yet, a precise knowledge of these figures is clearly crucial if we are to arrive at a proper characterization of the political economy of the Third Reich. Investment strategies with their long-run implications for industrial output are particularly revealing as to the debate about a Blitzkrieg strategy supposedly pursued by Hitler’s Germany early in the war. Furthermore, investment data may play a crucial part in demystifying Albert Speer’s so-called armaments miracle, about which it is commonly claimed that it depended on intensive rather than extensive growth. This paper, based on largely unknown sources, attempts to fill this gap, providing figure for industrial investment for the entire period between 1936 and 1944. It will be shown that actual investment was substantially larger after 1938 than has hitherto been recognized. The paper will also present detailed estimates for investment in armaments and autarky industries for the period 1934- 1943. These show that during the period 1940-1942 Germany experienced a spectacular investment boom, primarily directed towards widening the industrial base for war. This clearly should have substantial implications for the historiography, since it calls into question both the Blitzkrieg narrative and the conventional view of the armaments miracle. ∗ This paper was written while the author was visiting the Economic Growth Center at Yale University between August 2005 and April 2006. I am grateful to the Economic Growth Center for financial support. I thank Christoph Buchheim and Timothy Guinnane for many helpful comments.
Transcript of Industrial Investment in Nazi Germany: The Forgotten ... · PDF file1 Industrial Investment in...

1
Industrial Investment in Nazi Germany: The Forgotten Wartime Boom*
Jonas Scherner
University of Mannheim/Yale University
March 2006
Abstract
To date we lack reliable data on the level of industrial investment in the Third Reich. In addition our
overall knowledge of the quantitative significance of the war-related branches – autarky and
armaments industries – is extremely patchy. And yet, a precise knowledge of these figures is clearly
crucial if we are to arrive at a proper characterization of the political economy of the Third Reich.
Investment strategies with their long-run implications for industrial output are particularly revealing as
to the debate about a Blitzkrieg strategy supposedly pursued by Hitler’s Germany early in the war.
Furthermore, investment data may play a crucial part in demystifying Albert Speer’s so-called
armaments miracle, about which it is commonly claimed that it depended on intensive rather than
extensive growth. This paper, based on largely unknown sources, attempts to fill this gap, providing
figure for industrial investment for the entire period between 1936 and 1944. It will be shown that
actual investment was substantially larger after 1938 than has hitherto been recognized. The paper will
also present detailed estimates for investment in armaments and autarky industries for the period 1934-
1943. These show that during the period 1940-1942 Germany experienced a spectacular investment
boom, primarily directed towards widening the industrial base for war. This clearly should have
substantial implications for the historiography, since it calls into question both the Blitzkrieg narrative
and the conventional view of the armaments miracle.
∗ This paper was written while the author was visiting the Economic Growth Center at Yale University between August 2005
and April 2006. I am grateful to the Economic Growth Center for financial support. I thank Christoph Buchheim and
Timothy Guinnane for many helpful comments.

2
I. One of the most important questions regarding the political economy of the Third Reich is still a
subject of contoversy: how was at the German economy the end of the 1930s prepared to wage a war
and how fast did it mobilize at the beginnings of the 1940s. Many scholars claim that a true
mobilization did not occur until the end of 1941, allegedly because the Nazi regime intended to
achieve its expansionistic aims by fighting short wars (Blitzkriege) with a comparatively low number
of soldiers and arms. Not until December 1941 when the Red Army stopped the German Wehrmacht
near Moscow and the United States entered into World War II would this strategy have been changed.1
Now confronted with the prospect of a long-lasting war against the United States and Soviet Russia,
the German military planners acknowledged that they had to increase their armament production
considerably. Therefore some scholars characterize the German economy during the first two years of
the war a "peace-like war economy".2
This interpretation was first expressed by the Final Report of the United States Strategic Bombing
Survey (USSBS) published in October 1945: "The Germans did not plan for a long war, nor were they
prepared for it. Hitler's strategy contemplated a series of separate thrusts and quick victories (…)".3
Yet, this interpretation is based not on direct but only on indirect evidence. There is no single
document that reveals that the Nazis would have been planned the war as a Blitzkrieg.4 The indirect
evidence relies on the following observations: First, according to the index provided by the German
armament ministry munitions production remained static in 1940 and 1941. Second it is claimed that
armament capacities increased only slowly.5 Third, production of consumer goods decreased only
slightly in this period.6 Richard Overy raised some objections to this interpretation, noting that a 1 Barkai, Nazi Economics, p. 234-7.
2 Wagenführ, Industrie, p. 25.
3 United States Strategic Bombing Survey (ed.), Effects, p. 6. See also Klein, Economic Preparations; Milward,
Kriegswirtschaft.
4 See Overy, 'Hitler's War'.
5 United States Strategic Bombing Survey (ed.), Effects, p. 7; Janssen, Ministerium Speer, p. 67; Müller, 'Mobilisierung ', p.
353.
6 United States Strategic Bombing Survey (ed.), Effects, p. 130-1.

3
substantial share of consumer goods were used by the Wehrmacht and that the per-capita-consumption
of private households dropped after the war had started.7 In addition, Overy as well as Rolf-Dieter
Müller claim that the static armament production must be explained mostly by inefficiencies caused by
the polycratic structure of the Nazi regime.8 Yet, recently J. Adam Tooze questioned the latter view,
pointing on serious problems of the data used so far, which underestimated the real output of the
German war economy during the first years of the war.9 His results suggest that not only the
"Blitzkrieg-hypothesis" but also the "inefficiency-hypothesis" may be misleading.10
May be the most compelling argument, however, of the the supporters of the "Blitzkrieg-hypothesis"
regards the industrial investment structure in the last years before the beginning of the war. For, the
share of war-related investment (armament and autarky industries) on total industrial investment may
be an especial good indicator for revealing the intentions of the Nazi regime, given that normally
investments are planned at least one year beforehand. Burton H. Klein, one of the USSBS's
economists, claimed, based on the investment figures published by the Statistisches Reichsamt
(German Statistical Office): "Inspection of Germany's prewar pattern of investment shows that there
was no prounounced concentration of its investment in those activities associated with economic
preparations of war."11
7 Overy, War and Economy, p. 278, 288-90.
8 Overy, 'Hitler's War'; Overy, War and Economy; Müller, 'Mobilisierung '. To an overview about this discussion, see
Kershaw, Nazi Dictatorship, pp. 53-4; Tooze, 'No Room ', pp. 439-41.
9 Tooze, 'No Room '.
10 Other scholars have shown that a further assumption of the "inefficiency-hypothesis" supporters cannot be held: that before
1942 only cost-plus contracts were concluded between state and munitions producers, which did not induce incentives to
increase efficiency.Scherner, 'Ohne Rücksicht ', pp. 186-7; Budraß/Scherner/Streb, 'Demystifying '; Scherner/Streb, 'Ende
eines Mythos'. About this claim, see for instance Barkai, Nazi Economics, p. 237; Overy, 'Hitler's War', p. 286.
11 Klein, Economic Preparations, p. 15.

4
However, Klein's results contradict the findings of many studies of German business history, which
show that from 1936/37 on German industry was increasingly militarized in terms of investments and
production.12 Yet, these studies examine only companies of war-related branches. Thus, they must not
necessarily be representative of German industry as a whole. Klein's results also contradict the fact
that armament expenditure's share in German GDP increased sihnificantly in the last years before the
war. Given this, some authors feel entitled to christen the German economy at the end of the 1930s a
"war-like peace economy".13 In particular, as will be shown in detail in this paper, Klein's data about
industrial prewar investment are not reliable.14 The same is true regarding an estimate of industrial
investment during the war.
Detailed information about the amount and the structure of industrial investments may also contribute
to the discussion about the causes of the "so-called armament miracle", i.e. the significant increase of
the German armament production after Albert Speer had been appointed armament minister at the
beginnings of 1942. According to the conventional wisdom, increased munitions production was
mainly due to rationalization measures implemented by Speer.15 In other words, not extensive but
mainly intensive growth characterizes the performance of the German armament industry from the end
of 1941 on.16 A recent study based on airplane producers, however, questions this view, demonstrating
that the capital stock of the companies which were involved in the production of the JU 88, which was
the most manufactured combat airplane in Nazi Germany, increased significantly from 1942 on.17 Was
this only an exception or was the JU 88 production representative of the whole armament industry?
12 Hayes, Industry; Hayes, Degussa; Abelshauser, 'Germany'.
13 Barkai, Nazi Economics, p. 217-9.
14 About the amount of armament investments the literature provides only fragmentary information. See for instance United
States Strategic Bombing Survey (ed.), Effects, p. 60.
15 Abelshauser, 'Germany' pp. 122-76; Overy, War and Economy; pp. 356-63; Weyres-v. Levetzow, Rüstungswirtschaft, pp.
47-9.
16 See also Speer himself, Speer, Erinnerungen, p. 232.
17 Budraß/Scherner/Streb, 'Demystifying '.

5
Uderstanding the industrial investment level may make a contribution to another question, too: the
effects of strategic bombing in Nazi Germany. This discussion was re-opened by publications of Jörg
Friedrich. Friedrich argues, at least implicitly, that, given the allegedly relatively small damages on
industrial plants, the bombing of the population, which had no military effects, was especially
precarious from a moral point of view.18 The well-known information regarding small damages on
industrial plants is mainly based on observations by the USSBS and on a calculation of Rolf Krengel
in the 1950s. According to this estimate the West German industrial capital stock in 1945 even
exceeded that at the end of the 1930s.19 This calculation based on the following consideration: War
damages are the difference between the real postwar capital stock on the one hand and on the other
hand the potential postwar capital stock resulting from the real prewar capital stock plus war
investments minus normal capital consumption during the war. Obviously, real bombing damages
must have been bigger, if investments would have exceeded the numbers used so far.
Finally, such data may contribute to a further debate: the long-term effects of Nazi economic policy.20
Werner Abelshauser on the one hand argues this policy would have had modernizing effects on the
German economy, which significantly contributed to the massive growth in West Germany during the
1950s. Christoph Buchheim on the other hand characterizes the German economic development
during the Nazi period as "deformed growth", supposing huge investments in armament branches,
which were useless under "normal" economic conditions such as in Germany after the war. Yet, how
can we identify "useless investments" and estimate their share on total industrial investment?
18 Friedrich, Der Brand, pp. 296-7.
19 Krengel, Anlagevermögen, pp. 14-20, 76-7, 96.
20 About the beginning of this discussion, see Abelshauser, 'Kriegswirtschaft'; Buchheim, 'Wirtschaftsentwicklung'. See also
Tooze, 'Punktuelle Modernisierung'; Ritschl, 'Der späte Fluch '.

6
In sum, information regarding the amount and the structure of German industrial investment during
the Nazi period can be considered a research desideratum. This article tries to provide this information
by using sources widely neglected so far: files of the Wirtschaftsgruppe Maschinenbau, a semi public
trade organization that brought together machinery manufacturers, of the state-owned Deutschen
Revisions- und Treuhand AG, which audited armament companies, of the Statistisches Reichsamt, of
the Reichsfinanzministerium (ministry of finance), of the Reichsministerium für Rüstung und
Kriegsproduktion (armament ministry), and of the Four Year Plan agency. In section II it will be
shown that investment data used so far is incorrect. In the following section industrial machinery
investment will be estimated by using mainly unpublished data and by employing the commodity-
flow-method. Based on this time series and on further statistical data we re-estimate industrial
investment in the Nazi period, showing that the data used so far lead to a significant underestimation
of industrial investments, especially from 1938 on and during the first three years of the war. Finally,
new data regarding the investment structure are provided. It can be shown that the impact of autarky
investments on total industrial investment during the war was overestimated so far. An estimate of
armament investment according to which huge investments occurred in the first two years of the war
questions the prevailing "Blitzkrieg-hypothesis". For, this estimate suggests that the Nazi regime
created the preconditions for waging a big war by significantly enlarging the war-related industrial
capacities to the disadvantage of the civilian branches. The huge armament investments in 1942 and in
1943 indicate that the so-called armament miracle under munitions minister Albert Speer may have
been also caused by extensive growth. In addition, by using an indicator based on market signals it can
be shown that at least one third of total investment has to be considered capital misallocation. Finally,
given the investment boom during World War II effects of strategic bombing may have exceeded
significantly those estimated so far.
II. The Statistisches Reichsamt has published data about the level and structure of German industrial
investment until 1939.21 However, total investment numbers are incorrect because a large share of
21 Statistisches Handbuch von Deutschland, p. 612.

7
armament industry's investments is not included. For, from 1934 on the armed forces financed
munitions plants that were leased by private companies.22 In addition, the armed forces leased capital
goods to private industry – so called „reichseigene Maschinen“.23 Due to methodic reasons, neither
leasing plants nor leasing capital goods was included in the officially published investments
numbers.24 Furthermore, for concealing the German rearmament these numbers do also not contain the
whole investment in the air force armaments industry.25 Until 1939 about 1.6 billion RM was invested
in air force armament plants, more than 630 million RM in army leasing plants (Heereseigene
Industriebetriebe or HIB), and at least about 800 million in leasing machines – in sum an amount
which corresponds to total industrial investment in 1937 according the numbers published by the
Statistisches Reichsamt.26
22 Regarding army leasing plants, see Hopmann, MONTAN; regarding those of the air force, see Budraß, Flugzeugindustrie,
p. 366-8; regarding those of the navy, see for example, Meyhoff, Blohm & Voss, pp. 153, 183-6; regarding leasing plants,
Abelshauser, 'Rüstungsschmiede', p. 343.
23 Kluge, 'Reichseigene Maschinen', pp. 505-6; Weyres–v. Levetzow, Rüstungswirtschaft, p. 142*.
24 Industrial investment numbers published by the German Statistical Office included – as usal in industrial investment
statistics – only private investments, i.e. investments of companies, which had the legal form of a private profit-orientated
firm. See BArch 3102/2731, Die volkswirtschaftlichen Investitionen 1924-1938. See also for the case of the investment
statistic of the US, Gordon, '$45 Billion', p. 221. Investment figures of the German Statistical Office relied on surveys of
companies' investments or on assets changes provided by the balance sheets. However, in the balance sheets of the army
leasing plants' holding Montan GmbH leasing assets were not listed as "assets" but as "trust estate" because this holding was
a non-profit-corporation (BArch R 2301/5500, balance sheet of Montan GmbH, 31.12.1935, p. 29; Hopmann, MONTAN, p.
30; BArch R 2301/5463, Vertrag zwischen dem Deutschen Reich und der Verwertungsgesellschaft für Montanindustrie
GmbH vom 27.2.1936, § 5 (1).) And in the balance sheets of the leaseholders leasing assets were not mentioned (See for
instance, Fischer, WASAG, pp. 106-8, 121.)
25 BArch 3102/2731, Die volkswirtschaftlichen Investitionen 1924-1938; BArch R 3102/2701, p. 32-4. See also
Fremdling/Stäglin, 'Industrieerhebung'.
26 Regarding army leasing plants' investments, see Hopmann, MONTAN, p. 121 Tab. 14; regarding those of air force
armarment plants see BArch R 2/5551, Übersicht über die Investierung und Finanzierung der Luftwaffenrüstungsindustrie, p.
17. The investment amount of leasing machines relies on the following consideration: In 1944 their book value amounted to
about 800 million RM (BArch R 3/183, p. 213). Yet, in contrast to the peacetime period, the state provided leasing machines
only in a small extent during the war. Kluge, 'Reichseigene Maschinen', p. 506; Weyres–v. Levetzow, Rüstungswirtschaft, p.

8
For the war period, Dietrich Eichholtz estimated industrial investment.27 This estimate bases on an
estimate of investments in the former Central Germany (Mitteldeutschland; today: East Germany) by
Helmut Kupky and on an estimate of investments in West Germany (Westdeutschland) by Rolf
Krengel, both published by the German Institute of Economic Research (Deutsches Institut für
Wirtschaftsforschung or DIW).28 These estimates relied on the machinery investment numbers
between 1938 and 1944 in constant prices published after the war by the former chief statistician of
the Nazi armament ministry, Rolf Wagenführ.29 Kupky and Krengel assumed that in different
industrial branches the respective ratio between construction and machinery investments during the
period considered was fixed due to technical reasons. Thus, they felt entitled to employ the respective
prewar ratios provided by the Statistical Office for estimating industrial investment during the war. By
using information about price changes Kuypky and Krengel estimated total industrial investment (in
current prices) during the war period. For calculating the investments in the respective German
regions, the authors assumed a correlation between investment and the value added of these regions
provided by Bruno Gleitze.30 By using interpolation Eichholtz estimated investment for all of
Germany based on the information given by Krengel, Kupky, and Wagenführ.31
196. Therefore we assume that new leasing machines during the war (by value) corresponded to the depreciation (by value)
during the war.
27 Eichholtz, Kriegswirtschaft, p. 381
28 Krengel, 'Brutto-Anlage-Investitionen der westdeutschen Industrie', pp. 168-184; Kupky, 'Brutto-Anlage-Investitionen der
mitteldeutschen Industrie', pp. 391-407.
29 Krengel, 'Brutto-Anlage-Investitionen der westdeutschen Industrie', p. 181; Wagenführ, Industrie, p. 160. About
Wagenführ's career see Tooze, Statistics, pp. 262, 273-4, 284-5; Kehrl, Krisenmanager, pp. 267-9, 502. About the
Planungsamt (Plan Office), in which Wagenführ's statistical department was incorporated, see Müller, 'Albert Speer', pp.
343-8.
30 Kupky, 'Brutto-Anlage-Investitionen der mitteldeutschen Industrie', p. 392. Hereby, information about the value added of
these regions are based on estimates provided by Bruno Gleitze. See Gleitze, Ostdeutsche Wirtschaft.
31 Eichholtz, Kriegswirtschaft, p. 381

9
Yet, this estimate is problematic. First, it seems very questionable to assume during a rearmament
period a constant ratio between construction and machinery investment, as we will discuss in section
IV. Second, it is unclear what is included in Wagenführ's machinery investment numbers. Are they
equivalent to machinery investments in a narrow definition or do they contain all equipment such as
self-provided capital goods or trucks for example? Do they represent machinery investments of the
whole economy or only of the industrial sector as assumed by Eichholtz/Krengel/Kupky? Are these
numbers even correct? There are other data on machinery investment, as shown by table 1, that differ
significantly from those provided by Wagenführ – first, one of the armament ministry regarding
machinery investment in 1943 of the whole economy and the industrial sector only, and second a time
series of the domestic machinery sales between 1938 and 1944 provided by the USSBS.32 Even if
some scholars have noticed these differences, they were not able to explain them.33
Table 1: Machinery investment and sales in Germany 1938-44 (bn. RM)
USSBSa Armament ministryb Wagenführc
1938 3.657 2.9
1939 4.236 3.5
1940 4.336 3.7
1941 4.762 4.1
1942 4.802 4.2
1943 n.a. 5.028 (3.895) 3.7
1944 4.069 2.6 a United States Strategic Bombing Survey (ed.), Effects, p. 227, Appendix table 29 (domestic machinery sales). b BArch R 3/1960, Gliederung der Maschineninvestitionen nach den Fertigungen des
Gesamtaufwandplans,verbessertes Ergebnis, 15.9.1944, p. 175; in parenthesis machinery investment of the industrial sector.
c Wagenführ, Industrie, p. 160 (machinery investment).
32 Wagenführ abstained without comment from presenting these data despite of the fact that he knew them when he published
his book. BArch R 3/1960, Wagenführ to Baudisch, 18.9.1944, p. 172.
33 Weyres von Levetzow for instance was well aware about these differences. Weyres–v. Levetzow, Rüstungswirtschaft, pp.
115, 97*. Gerhard Gehrig did not use Wagenführ's data, when estimating the German capital stock in 1938. Obviously, he
considered them to low. Gehrig, 'Sachkapitalbestand', p. 18, Table 3, p. 46.

10
The original source of Wagenführ's data (table 1, column III) is an unpublished survey of the German
war economy provided by the armament ministry in the summer of 1944 (Bericht des Planungsamts
vom 29. Juni 1944 (Bericht über die deutsche Wirtschaftslage 1943/44)).34 This document could be
traced in the archives.35 Based on archival files we can also reconstruct the calculation of the time
series of machinery investment given by this document. In January 1944 the Wirtschaftsgruppe
Maschinenbau replied to an inquiry of the armament ministry regarding the machinery industry sales
between 1936 and 1943.36 Based on this information machinery sales could be disaggregated into
domestic and foreign sales. Domestic sales could be decomposed into armament goods, repairs of
machinery, production of new machinery (Neuproduktion) etc.37 In February 1944, Wagenführ
requested from the Wirtschaftsgruppe Maschinenbauindustrie information about machinery
investments. To do this the Wirtschaftsgruppe subtracted for each sub-branch from the domestic
production of new machinery sold in Germany in 1942 the sales of products that were input but not
capital goods (as for example ball bearing). The result was an investment number of 4,225 million
34 The number for 1944 relies on a postwar estimate of Wagenführ. About the method of this estimate Wagenführ did not
provide any information.
35 Institut für Zeitgeschichte (IFZ), PS 1946, Bericht zur deutschen Wirtschaftslage 1943/44, p. 184. There is no hint that
these numbers are expressed in constant prices – in contrast to Wagenführ's claim. However, given that the machinery price
index during this period was constant, this difference plays no role. About this document's history of origin and content, see
Scherner, 'Bericht'.
36 For 1936-42, see. BArch R 3/1917, Schreiben der Wirtschaftsgruppe Maschinenbau an Dr. Stoffregen im Planungsamt
vom 22.1.1944 inklusiver diverser Anlagen, pp. 19-63; for 1943, see BArch R 13 II/193, note, 24.7.1944. Stoffregen was the
chief of the subdepartment "Planing of iron and metal processing" (Fachabteilung "Planungen auf dem Gebiete der Eisen-
und Metallverarbeitung ohne Haushalts- und Wirtschaftswaren"), which was subordinated to the department "Technical
planing" (Hauptabteilung IV "Fachliche Planung") headed by Hans Kehrl. Kehrl, Krisenmanager, p. 501. The reason of this
inquiry was the survey about the German war economy mentioned above.
37 BArch R 3/1788, Die deutsche Industrie, pp. 8-9.

11
RM.38 Using the total input-capital goods ratio of 1942 Wagenführ's department estimated the
machinery investment between 1938 and 1943.
This estimate, however, has some shortcomings: First, by summing up the investment numbers of the
various sub-branches the official of the Wirtschaftsgruppe made an adding or writing mistake of 300
million RM. Instead of 4,525 million RM he calculated 4,225 million RM.39 Second, the extrapolation
method used by Wagenführ's department implies that (i) the input-capital goods ratios of different sub-
branches would be constant during 1936 and 1943 and (ii) that the shares of the different sub-branches
sales of total machinery sales would be invariant compared with the relations of 1942. Regarding the
performance of the input-capital goods ratios in the other years (except for 1942) we have no
information. Yet, it can be shown that the shares of the different sub-branches sales on total machinery
sales differed significantly in the years between 1936 and 1942.40 Third, Wagenführ's numbers do not
include machinery imports. As a consequence of these shortcomings Wagenführ 's method
underestimated the machinery investment especially before 1942. In addition, and in contrast to the
basic assumption of the Eichholtz/Krengel/Kupky estimates, machinery investment numbers contain
machinery, which were normally invested outside of the industrial sector as farm machinery.
Furthermore, they do not include all capital goods but only those manufactured by the sub-branches,
which belonged to the Wirtschaftsgruppe Maschinebau. Trucks, for instance, were excluded.
Also the numbers published by the USSBS, which in contrast to Wagenführ 's data include machinery
imports, have considerable shortcomings. They exclude two sub-branches of the Wirtschaftsgruppe
Maschinebau – the locomotive branch and the sub-branch that manufactured gears and rolling
bearings. The omission of the latter branch can probably be explained by the fact that the USSBS 38 Barch R 13 III/191, note about a meeting with Dr. Fey, 15.2.1944. Dr. Fey was a member of the department "Planing
statistics" (Hauptabteilung V Planstatistik) headed by Wagenführ. His job included among others the preparation of
investment statistics. Kehrl, Krisenmanager, p. 502.
39 This is the result of a re-calculation by the author.
40 See section III, table 2, 3, 4.

12
considered these goods as typical inputs. However, the USSBS considered all other branches' sales as
capital goods – contrary to the detailed information provided by the Wirtschaftsgruppe Maschinebau.
In sum, neither the Wagenführ nor the USSBS numbers represent adequate estimates of the capital
goods invested in Germany according to the narrow definition of the Wirtschaftsgruppe Maschinebau.
What about the investment data for 1943 provided by the armament ministry in 1944?41 In contrast to
the investment estimates of the Statistisches Reichsamt before the war, which relied on surveys of the
industrial companies, the armament ministry's estimate was based on the so-called commodity-flow-
method.42
Yet, also this estimate is not useful: The basis of this estimate was an assessment of the domestic new
machinery sales in 1943 of those branches, which belonged to the Wirtschaftsgruppe Maschinenbau.
This assessment (6,025 billion RM) overestimated the real value by far (5,343 million RM).43 These
shortcomings were probably the reasons that Wagenführ refused to use this estimate in his book.
However, the method used by the armament ministry for decomposing this estimate provides us with
useful information for estimating autarky and armament investments, which will be done in a further
section.44 The result of this section, however, is that the well known data provide neither reliable
41 This estimate was associated with the attempt to design a so-called Gesamtaufwandplan (Total Plan), which should be an
instrument for a more efficient planning of the German war economy. About this instrument see Tooze, Statistics, pp. 274-
81; Barch R 3/464.
42 Generally about this method, see Gehrig, 'Sachkapitalbestand', p. 14.
43 For the number used for the investment estimate of the armament ministry, se BArch R 13 III/192, note, 3.8.1944; for the
real value, see table 2.
44 For decomposing the estimated machinery sales, the armament ministry used different information. Machine tools and
woodworking machinery sales were estimated according to the iron allocation. This information was also used to identify the
purchaser branches of these machineries, which were characterized as so-called vermerkscheinpflichtige Maschinen
(machineries with preferential iron allocation). BArch R 13 III/192, note, 31.7.1944, Aufgliederung des Inlandsumsatzes
1943 in zulassungspflichtigen Maschinenarten nach Abnehmergruppen geschaetzt; BArch R 3/1960, Gliederung der
Maschineninvestitionen nach den Fertigungen des Gesamtaufwandplans, verbessertes Ergebnis, 15.9.1944, pp. 173-4. Sales
of so called zugelassene Maschinen were estimated on the basis of their sales orders in 1943. For manufacturing zugelassene
13
machinery investment numbers during the war period nor correct estimates of total industrial
investment during the Nazi period.
III. We will start the re-estimate of industrial machinery investments' by using the data about
mechanical engineering sales between 1936 and 1942, which the Wirtschaftsgruppe
Maschinenbauindustrie, as mentioned above, communicated to the armament ministry at the
beginning of 1944. The sales numbers are decomposed mainly into four categories, as shown by table
2: first, the domestic sold newly produced machinery, second the munitions production, third the
exported newly produced machinery, and fourth a category, which includes revenues of repairs etc.
The domestic sold newly produced machinery as well as the exported newly produced machinery are
disaggregated in sales of the 36 sub-branches that were included in the organization of the
Wirtschaftsgruppe Maschinenbauindustrie, as shown in Appendix I, table 1. Numbers for the years
1928, 1943 and 1944 rely on other sources or are estimated.45
Maschinen producers required a special permission. BArch R 13 III/192, note, 31.7.1944, Aufgliederung des Inlandsumsatzes
1943 in zulassungspflichtigen Maschinenarten nach Abnehmergruppen geschaetzt; BArch R 13 III/193. Estimated sales of
these machines were decomposed in different machinery sub-branches and in different purchasers according to the real sales
in the period between July 1943 and February 1944, which were collected by a special survey. BArch R 13 III/192, note,
3.8.1944. The difference between those two machinery categories and total machinery sales were so called zulassungs- und
vermerkscheinfreie Maschinen. The latter included especially machineries, which were inputs (as valves and fittings; gears
and rolling bearings) or capital goods of branches outside of the industrial sector (as farm machinery; locomotives; office
machinery; fire fighting apparatus; railroad safety equipment). BArch R 13 III/192, note, 1.8.1944, Aufgliederung des
Inlandsumsatzes 1943 in zulassungs- und vermerkscheinfreien Maschinenarten nach Fachgruppen geschaetzt. The sources
do not provide information in which way this amount was decomposed in different machinery sub-branches and in different
purchasers. However, we know that the armament ministry tried to eliminate input goods when estimating total investment.
BArch R 3/1960, Gliederung der Maschineninvestitionen nach den Fertigungen des Gesamtaufwandplans, verbessertes
Ergebnis, 15.9.1944, pp. 173-4.
45 See Appendix I.

14
Table 2: Sales of the German mechanical engineering sector 1928, 1936-44 (m. RM)
Domestic sales
newly produced machinery
munitions otherse
Export of newly produced machinery
Total sales
1928a 2,504 n.a. n.a. 1,100 3,726f
1936b 2,630 252c 258 660 3,800
1937 3,300 n.a. n.a. 880 4,500g
1938 4,211 541 199 856 5,807
1939 4,990 700 329 731 6,650
1940 5,305 1,537 337 525 7,694
1941 5,912 2,120 451 597 9,080
1942 5,996 2,500 405 560 9,431
1943d 5,343 2,602 n.a. 719 n.a.h
1944 4,888 3,264 n.a. 260 n.a.h a BArch R 13 III/193, Umsatz im Maschinenbau (Neufabrikation) mengen- und wertmaessig in den Jahren 1928 und
1938, 8.7.1941; BArch R 13 III/193, Vorlaeufige Ergebnisse ueber die Neufabrikation der deutschen Maschinenindustrie im Jahre 1937, 24.3.1938.
b For 1936-1942, see BArch R 3/1917, Wirtschaftsgruppe Maschinenbau to Dr. Stoffregen, 22.1.1944, pp. 19-63 (data refer to the current borders of the Reich).
c BArch R 3102/3541, production survey of the mechanical engineering sector 1936. d For the munitions production in 1943 and in 1944, see United States Strategic Bombing Survey (ed.), Effects,
Appendix Table 19, p. 219. For domestic and foreign sales of newly produced machinery in 1943 and in 1944 see Appendix I. All numbers are rounded.
e Repairs; commission processing; renting etc. f In this year domestic sales without newly produced machinery amounted to 122 m. RM. g In this year domestic sales without newly produced machinery amounted to 400 m. RM. h Total production in 1943 and 1944 may not be significantly lower than in 1941, given that according to USSBS
estimates machine tools repairs increased significantly in these years due to allied bombing. See United States Strategic Bombing Survey (ed.), Effects, pp. 44-5, 47-8.
In the following, based on these data and by using the commodity-flow-method, we re-estimate
industrial machinery investments. In other words, we infer from potential purchasers of the goods
produced by the different sub-branches on the investments in the different sectors of the economy. To
do this, we have first to add the imports to the domestic sold newly produced machinery. In a second
step we have to subtract from this amount the inputs and those goods that were typically invested
outside of the industrial sector.
Information about machinery imports and their crude decomposition according to the mechanical
engineering sector's sub-branches is published by various statistical sources. Numbers for the years

15
1942 and 1944, for which no information is available, could be estimated.46 For estimating the input
goods amount in the respective years, in a first step we multiply the input goods-sales ratios of
different sub-branches (as calculated by the Wirtschaftsgruppe Maschinenbau for 1942 and shown in
table 3) by the domestic sub-branches sales (documented in appendix I, table 1). In a second step we
add those machinery imports, which can be identified as input goods.47 The result of these procedures
is the machinery investment of the German economy between 1936 and 1944.
Table 3: Share of input goods on total sales of different mechanical engineering sub-branches in 1942a
Sub-branches Share of input goods on total sales (%)
washing machines 55b
combustion engine 100
air compressors 12
pumps 52
cranes, derricks and elevators 36
valves and fittings 64
gears and roller bearings 82
fire fighting apparatus 51 a BArch R 13 III/191, note about a conversation with Dr. Fey, 15.2.1944. b This was due to spare parts.
To estimate industrial machinery investment we have to subtract those investment goods that were
normally purchased by branches outside of the industrial sector. To identify these branches we use
general conclusions as well as information given by the industrial production statistic of 1936, which
in a detailed way decomposed the sales of the respective sub-branches in different products.48 Based
on this information we can conclude that the following sub-branches produced capital goods
predominantly invested outside of the industrial sector: farm machinery; locomotives; washing
machines; fire fighting apparatus; railroad safety equipment. In the case of some other sub-branches, it
46 See Appendix II.
47 See Appendix II.
48 See BArch R 3102/3541, Produktionserhebung im Maschinenbau 1936. Generally about this survey, see Tooze,
'Punktuelle Modernisierung'.

16
is not very clear who was the dominant purchaser (office machinery; steam turbines; sewing machines;
steam engines and locomobiles; heavy and calculating scales; safes and vaults; printing presses; roller
engraving plates; water turbines). Only the sales of the first three sub-branches were significant,
especially the office machinery industry with a share of 4 % on total domestic new machinery
production in 1939. However, there is information that the authorities were the primary purchasers of
this branch's production during the war.49 And in the case of the sewing machines we know that they
were almost exclusively sold during the war not to private households but to the clothing industry.50
Thus, we relate the former during the war to the service sector and the latter to the industrial sector.
For the prewar period (1936 to 1939) we assume, by default of further information, that 50% of the
sales of both sub-branches were invested by the industrial sector. In addition, to avoid an overestimate
of industrial investment we take for granted that between 1936 and 1944 the products of all other
unclear sub-branches listed above were invested outside of the industrial sector. In the case of all other
sub-branches we can conclude that they sold their products almost exclusively to the industrial sector
(as for example machine tools, textile machinery etc.). Based on these considerations we can estimate
and decompose the consumption of newly produced mechanical engineering products in Germany
between 1936 and 1944, as shown by table 4.
49 Müller, 'Mobilisierung ', p. 446. The same is true regarding printing machines. Ibid.
50 BArch R 3101/11269, Fachgruppe Naehmaschinenindustrie to Reichspropagandaamt Essen, 23.2.1944.

17
Table 4: German consumption of newly produced mechanical engineering products 1936-1944a (m. RM)
1936 1937 1938 1939 1940 1941 1942 1943 1944
1) Total consumption 2,660 3,327 4,249 5,040 5,361 6,051 6,247 5,629 5,121
2) Input import 11 10 13 22 27 58 110 128 105
3) Domestic produced inputs 488 621 770 898 1,051 1,289 1,408 1,398 1,326
4) Total input consumption 499 631 783 920 1,078 1,347 1,518 1,526 1,431
5) Non-industrial capital goods import 7 5 8 9 9 25 66 86 70
6) Domestic produced non-industrial capital goods 587 692 850 1,096 1,106 1,150 1,153 1,308 856
7) Total non-industrial investment 594 697 858 1,105 1,115 1,175 1,219 1,395 926
8) Industrial capital goods import 12 12 17 19 20 56 75 71 58
9) Domestic produced industrial capital goods 1,555 1,987 2,591 2,996 3,148 3,473 3,435 2,637 2,706
10) Total industrial investment 1,567 1,999 2,608 3,015 3,168 3,529 3,510 2,708 2,764
11) Total investment 2,161 2,696 3,466 4,120 4,283 4,704 4,729 4,103 3,690
12) Wagenführ's investment numbers 2,900 3,500 3,700 4,100 4,200 3,700 2,600 a About the method, see text. Consumer goods are subsumed under non-industrial capital goods, because their amount may have been very small.

18
Table 4 suggests a spectacular machinery investment boom in the German economy during the first
three years of the war. Which sectors of the German economy benefited from this machinery
investment boom, and in which way did the investment structure change, especially compared with
1928? To answer these questions, we selected those sub-branches that do not produce input goods and
whose products were almost exclusively invested by one of the following four categories: the
agricultural sector; railways; "war-related" industrial branches, and "non-war-related" industrial
branches (including consumer goods). About 50% of all sub-branches fulfill these conditions. In the
period between 1936 and 1944 they had a share of domestically produced machinery investments of
about 70%. Thus, this selection seems to be representative.51
51 We excluded imports because information given by statistical sources do not allow a detailed decomposition. However,
total imports had only a small impact on industrial investment as shown by table 4.

19
Table 5: Sectoral structure of machinery investments in Germany (1928; 1936-44)
War-related branchesb Non-war-related branchesc Railwaysd Agriculturee Real per-capita investment of the selected
branches (1928=100)a
Real per-capita investments (1928=100)
Share (in %)
Real per-capita investments (1928=100)
Share (in %)
Real per-capita investments (1928=100)
Share (in %)
Real per-capita investments (1928=100)
Share (in %)
1928 100 100 42 100 33 100 7 100 18
1936 129 176 57 72 19 112 6 145 20
1937 162 223 58 91 18 111 5 173 19
1938 176 247 59 93 18 122 5 184 19
1939 181 241 56 96 18 197 8 186 18
1940 191 284 62 71 12 252 9 173 16
1941 211 323 64 66 11 320 10 171 15
1942 205 320 65 50 8 407 14 148 13
1943 181 245 58 28 5 595 23 142 14
1944 161 261 68 25 5 414 18 81 9 Source: See appendix 1. a: Data about equipment prices provided by Krengel (Krengel, 'Brutto-Anlage-Investitionen der westdeutschen Industrie', p. 397) and data about German population published by Wagenführ
(Wagenführ, Industrie, p. 135) are used. b: Machine tools; expendable tools; woodworking machinery; heat treating ovens and blast furnaces; foundry equipment; smelter and rolling mill equipment; construction equipment and
machinery; chemical stills. c: Textile machinery; sewing machines; food processing machinery; shoe and leather machinery; printing machines. d Locomotives; railroad safety equipment. e Farm machinery.

20
Table 5, as an first indicator for German investment structure's performance during the Nazi period,
suggests some preliminary results:
1) It is sometimes claimed that railways and the agricultural sector were discriminated during the
Nazi period.52 This is not true in real terms but only in relative terms of machinery
investments – roughly spoken for agriculture during the war period and for railways during the
prewar period.53
2) In addition, it seems that already in 1936, and not, as sometimes suggested by the literature,
from 1937/38 on, the machinery investment structure was significantly changed in favor of the
war-related branches and to the disadvantage of the non-war-related industries – in absolute as
well as in relative terms, compared with 1928. However, it is remarkable that non-war-related
industries' share remained static during the last three peacetime years; the absolute values even
increased. This suggests that in spite of the huge investments in war-related branches desired
by the state private industry had substantial investment alternatives.
3) Interestingly enough, during the first years of the war, before the German economy
transformed into a true war economy, at least by some accounts, machinery investment
structure changed significantly in favor of the war-related branches, calling into question the
Blitzkrieg-hypothesis. In a further section we will try to decompose the investment
performance of war related industries into that of the autarky branches and that of the
armament industries.
IV. In a next step, however, we first try to estimate total industrial investment. To do this, we have to
use two different methods – one for the prewar period and one for the war. For the prewar period we
52 For railways, see for example United States Strategic Bombing Survey (ed.), Effects, pp. 68, 72; for agriculture, Barkai,
Nazi Economics, p. 293, table 6.
53 However, even if real agricultural machinery investment numbers were high, compared with 1928, this does not mean that
they were high enough, especially during the war, given the labour shortage in the German war economy on the one hand and
on the other hand German agriculture's low degree of mechanization. See for this argument, Tooze, 'Punktuelle
Modernisierung'.

21
add the investments of the air force munitions industries, of the army leasing plants, and of the leasing
machines to the industrial investment numbers published by the Statistisches Reichsamt.54 Yet, given
that data about navy leasing plants are not available, this method leads to an underestimate of
munitions branches' investment during the period considered. However, compared with investment of
the air force plants and army leasing plants these investments omitted by our estimate may have been
small.55 Private industry's investments in army and navy munitions plants are also excluded, but not
due to a lack of information. The reason is that we have no hint that the industrial investment numbers
published by the Statistisches Reichsamt does not already include these investments. Yet, these
numbers will be considered in a further section.
For the war period we are confronted with the problem that, except for 1943, we have data about
neither construction investments nor about equipment investments besides machinery, such as self-
provided capital goods or trucks for example. For 1943 Wagenführ's department provided a rough
estimate for self-provided capital goods. They amounted to 2 billion RM and belonged almost
exclusively to the chemical and fuel industry as well as to the mining branch.56 For the same year,
Wagenführ's department also provides data for industrial construction investments which amounted to
1.834 billion RM.57 Given the data gaps regarding these two investment components for almost the
whole war period we have to use other information for a reliable estimate of German industrial
investment in this time.
54 Given that we have only information about total air force armament investments until 1936 (260 million RM) and until
1939 (1,597 million RM), this amount is allocated relatively to single years according to those of the army leasing plants for
which detailed annual data is available. The same method is employed regarding leasing machines.
55 The navy was by far the smallest branch of the Wehrmacht.
56 BArch R 3/1960, Wagenführ to Baudisch, 18.9.1944, pp. 172-174.
57 BArch R 3/1960, Wagenführ to Baudisch, 1.8.1944, pp. 164-166. This number relies on industrial constructions permitted
by the authorities. Even if not all constructions permitted were realized, Wagenführ emphasized that the calculated amount
would have been realistic. For, constructions permitted in 1942 but not realized were effected in 1943. Ibid.

22
The starting point is information given by the Statistisches Reichsamt. This agency decomposed the
published industrial investments between 1935 and 1938 in construction and equipment numbers.58
During this period the ratio between construction and equipment investment was constant. This
suggests that we can also assume this ratio for 1939. Yet, the industrial investment figures published
by the Statistisches Reichsamt do not include, as mentioned, a substantial share of armament
investments. We cannot presume that the construction-equipment ratio of the armament investments
corresponded to that calculated by the Statistisches Reichsamt. For, armament capacities normally
required special construction investments, especially air attack protection.59 However, there are
sources that allow a rough estimate of armament industries' respective ratio.
Table 6: Indicators for the relationship between construction and equipment investments in the armament industries
annual construction-equipment investment ratio of air force armament industries
Heinkel (Oranienburg)a
Junkers (Dessau)b
Heinkel (Rostock)c
Luftfahrtanlagen GmbHd
construction-equipment assets ratio of army leasing plantse
1936 n.a. n.a. 197 n.a. n.a.
1937 n.a. n.a. n.a. n.a. n.a.
1938 n.a. n.a. 352 n.a. 108
1939 n.a. n.a. 104 309 69
1940 90 49 181 109 71
1941 79 65 87 154 76
1942 94 40 n.a. 75 79
1943 n.a. 49 n.a. n.a. n.a. a For 1940, BArch R 8135/7498, report 1940; for 1.1.1941-31.3.1941, BArch R 8135/7499, report 1.1.1941-
31.3.1941; for 1941, BArch R 8135/7499, report 1941/42; for 1942, BArch R 8135/7500, report 1942/43. From 1941 on the reporting year started with the beginning of April.
b For 1938/39, 1939/40, BArch R 8135/2548, report 1939/40; for 1940/41, BArch R 8135/7558, report 1940/41; for 1941/2, 1942/43 BArch R 8135/7960, report 1942/43. Calendar years in the table include investments form the beginning of October in the previous year until the end of September of the calendar year.
c For 1936, BArch R 8135/1491, report 1936; for 1938 BArch R 8135/4137, report 1938; for 1939 BArch R 8135/4137, report 1939; for 1940 BArch R 8135/4138, report 1940; for 1941, BArch R 8135/4735, report 1.1.1941-31.3.1941. The year 1941 in the table includes only investments in the period 1.1.1941 to 31.3.1942.
58 BArch R 3102/2701, Die Gesamtinvestitionen aufgeteilt nach Aufwendungen für Gebäude, Maschinen, Werkzeuge und
kurzlebige Wirtschaftsgüter (1935-1938), p. 36.
59 See e.g. BArch R 2301/5591, Stellungnahme betr. Rentabilität der Montanbetriebe vom 7.3.1942, p. 40; BArch R 2/5253,
Bericht der Deutschen Revisions- und Treuhand AG über die Wirtschaftliche Forschungsgesellschaft 1943, p. 89; United
States Strategic Bombing Survey (ed.), Effects, p. 149.

23
d For 1939, BArch R 8135/3980, report 1939/40, Al. I; for 1940, BArch R 8135/3980, report 1940/41, Al. I; for 1941, BArch R 8135/3982, report 1941/42, Al. I; für 1942, BArch R 8135/3982, report 1942/43, Al. I.
e For 1938, BArch R 2301/5550, Anschaffungswerte und Ausnutzung der „Montan“-Betriebe im Geschäftsjahr 1937/38 (1.4.37-31.3.1938), pp. 41-2; for 1939-42, BArch R 2301/5503, report 1941/42, p. 170.
By evaluating audit reports of important air force munitions companies – Junkers, Heinkel as well as
the holding company of all air force leasing plants, Luftfahrtanlagen GmbH – we can calculate a
weighted average ratio between construction and equipment investments of about 100%. This sample
seems to be somewhat representative because in 1940 and 1941 it contains investments of about 580
m. RM, which corresponds to approximately 22% of total air force armament industry investment in
this period. In the case of all army leasing plants this ratio was on average only a little bit lower, as
shown by table 6. Given these results, it seems clear that armaments industries' construction-
equipment ratio was significantly higher than that of "normal" industry, which according to the data of
the Statistisches Reichsamt mentioned above amounted to about 28%.
Thus, it seems acceptable to presume during the prewar period a construction-equipment ratio of the
armament industry (excluded leasing machines) of about 100%. Based on this assumption we can
calculate total construction and equipment investment of the whole German industry between 1936
and 1939 (Table 7, rows 10, 11). If we subtract from the equipment time series the machinery
investments estimated in the previous section, a time series for equipment without machinery, i.e. self-
provided equipment, trucks etc. results (Table 7, row 13).

24
Table 7: Machinery, equipment, construction and total investments in the German industry 1936-9 (1943) in m. RM
1936 1937 1938 1939 1940 1941 1942 1943 1944
1) Construction investment (armament ministry)a 1,834
2) Self-provided equipment (armament ministry)b 1,800
3) Industrial investment (Statistisches Reichsamt)c 2,159 2,843 3,691 4,432
4) Construction investment (Statistisches Reichsamt)d 458 616 814 977
5) Equipment investment (Statistisches Reichsamt)d 1,701 2,227 2,877 3,455
6) Estimated armament investmentse 334 494 988 1,473
7) Estimated industrial investmentf 2,493 3,337 4,679 5,905
8) Estimated armament industry construction investmentg 135 182 381 556
9) Estimated armament industry equipment investmentg 199 312 607 917
10) Estimated industrial construction investmenth 593 798 1,195 1,533
11) Estimated industrial equipment investmenti 1,900 2,539 3,484 4,372
12) Estimated industrial machinery investmentj 1,567 1,999 2,608 3,015 3,168 3,529 3,510 2,708 2,764
13) Estimated industrial equipment investment without machineryk 333 540 876 1,357a BArch R 3/1960, Bauinvestitionen 1943, gegliedert nach den Fertigungen des Gesamtaufwandsplans der deutschen Volkswirtschaft Großdeutsches Reich ohne Protektorat, 23.7.1944, p.
165. b BArch R 3/1960, Wagenführ to Baudisch, 18.9.1944, pp. 172-174. This document emphasizes that self-provided equipment belonged almost exclusively to the industrial sector. Therefore,
we assume a share of 90%. c Statistisches Handbuch von Deutschland, p. 605. d BArch R 3102/2701, Die Gesamtinvestitionen aufgeteilt nach Aufwendungen für Gebäude, Maschinen, Werkzeuge und kurzlebige Wirtschaftsgüter (1935-1938), p. 36. The ratio of 1939 is
extrapolated. e For army leasing plants, see Hopmann, MONTAN, p. 121 Tab. 14; for air force armament plants, see BArch R 2/5551, Übersicht über die Investierung und Finanzierung der
Luftwaffenrüstungsindustrie, p. 17. f Row 7 results from adding rows 3 and 6. g We assumed according to table 6 that the construction equipment ratio of armament plants (excluding leasing machines) amounted to 100%. h Row 10 results from adding rows 4 and 8. i Row 11 results from adding rows 5 and 9. j See table 4, row 10. The numbers include the production of Austria (1938 and 1939) and that of the Sudetenland (1939). The respective numbers, however, were in these years neglibile. k Row 13 results from row 11 minus row 12.

25
In the next step, based on these results, we can calculate the respective ratios in 1936-1939 between
the different components of total industrial investment – machinery investment (M), equipment
investment without machinery (E), and construction investment (C). When doing this, it can be shown
that the C/M ratio as well as the (C+E)/M, the C/(E+M), and E/M ratios increased significantly over
time.
Table 8: Ratios of total industrial investments' components 1936-9, 1943
C/M E/M (C+E)/M C/(E+M)
1936 38 21 59 31
1937 40 27 67 31
1938 46 34 79 34
1939 51 45 96 35
1940
1941
1942
1943 68 66 134 41
1944 Source: Table 7.
For 1943 we can also determine the different ratios. However, in this year the (C+E)/M as well as
E/M ratios represent a lower limit because self-provided equipment is only a subset of equipment
investments without machinery (and consequently the C/(E+M) ratio an upper limit). Anyway, the
ratios increased compared with 1939. This result seems to be plausible in spite of the huge increase.
First, we have to remark that the ratios relying on nominal values are somewhat distorted in the period
considered, especially between 1939 and 1943, given that construction prices grew significantly
whereas equipment prices remained static. Second, the net value (in constant prices) of German fuels
and chemical production as well as that of the metalworking branch, which includes the bulk of the
armament industries, grew above average between 1939 and 1943.60 In the former branch, self
60 United States Strategic Bombing Survey (ed.), Effects, p. 27 table 5. About the reliabilty of these data provided by the
USSBS, see Tooze, 'No Room for Miracles'. This estimate refers to the prewar borders of Germany. However, regarding the
total industrial product, annexed territories' impact was insignificant. See Scherner, 'Bericht'.
26
provided equipment and in the latter, construction investments had typically an investment share,
which exceeded that of the industry in average. And in both sectors companies normally operated at
full capacity at the end of the 1930s. Thus, we can assume above-average investment in both sectors
between 1939 and 1943. Regarding the armament industries, this conclusion is confirmed by another
indicator: the armaments industry's share of total machinery investments, which increased
considerably from 8% in 1939 to about 22% in 1943.61 Thus it seems apt to assume that in the 1940s
the (C+E)/M-ratio corresponded at least to the value of 1939, i.e. 96%. A alternative method is an
interpolation between the 1939 and 1943 values, which may represent an upper limit on Germany's
industrial investment. Both methods will be employed in the following (except for 1943).
V.
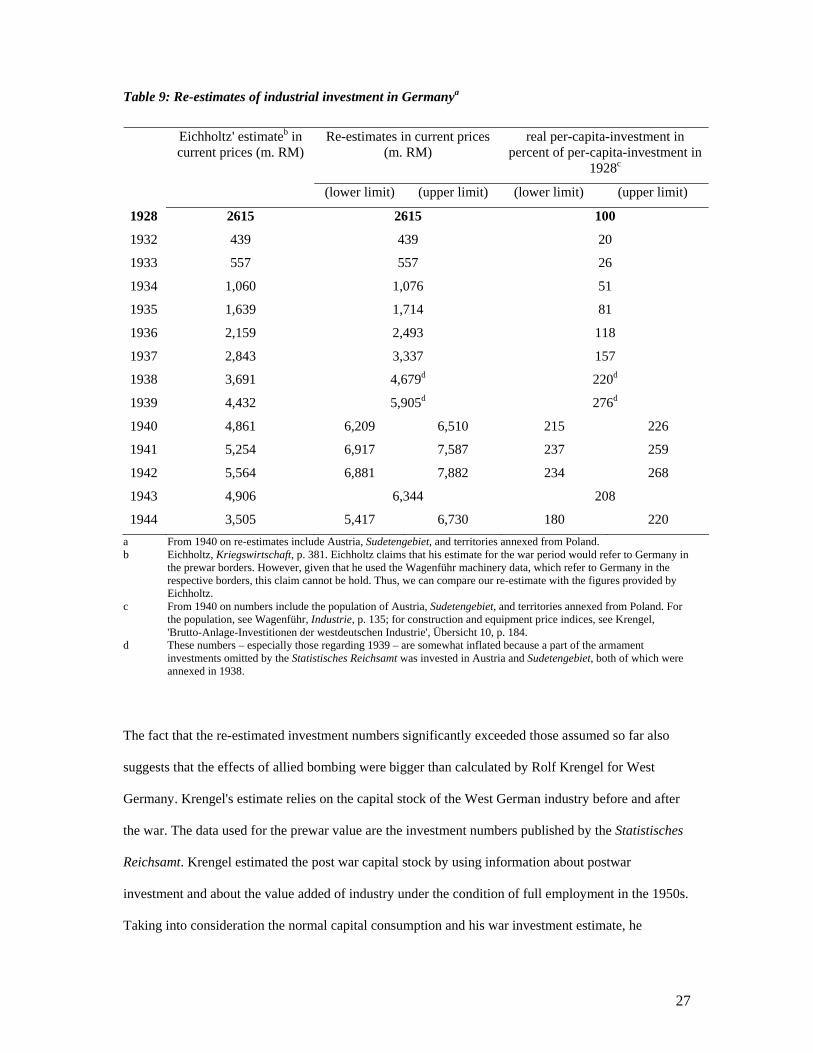
Both re-estimates of total industrial investment in Nazi Germany show – almost exclusively –
significantly higher numbers than those calculated by Eichholtz, especially from 1938 on. Even if also
according to the re-estimates investment decreased considerably from 1943 on, it was still high in the
final years of the war as be proven by a comparison of real per-capita-investment in these years with
those of the last prewar years. Still in 1944 this ratio corresponded at least to that of 1937, which is
considered as a boom year. Given the huge bombing damages from the beginning of 1944 on and the
attempts to dislocate industrial plants, this result does not seem to be surprising.62
61 See Appendix III, Appendix table 3.
62 The decrease of real per-capita investment between 1939 and 1940 – in contrast to the results of table 5 – can mainly be
explained by the fact that in the latter population numbers used include Austria and Sudetenland from 1938 on whereas in
table 9 not until 1940. The reason is based on the fact that in table 9 two different methods are used – one for the prewar time
mainly relying on published numbers of Germany in the 1937 borders, and one war estimate relying on machinery
investment of Greater Germany. In the case of the prewar border estimate, we therefore assume that significant armament
investments were not effected in Austria and Sudetengebiet before 1940.
27
Table 9: Re-estimates of industrial investment in Germanya
Re-estimates in current prices (m. RM)
real per-capita-investment in percent of per-capita-investment in
1928c
Eichholtz' estimateb in current prices (m. RM)
(lower limit) (upper limit) (lower limit) (upper limit)
1928 2615 2615 100
1932 439 439 20
1933 557 557 26
1934 1,060 1,076 51
1935 1,639 1,714 81
1936 2,159 2,493 118
1937 2,843 3,337 157
1938 3,691 4,679d 220d
1939 4,432 5,905d 276d
1940 4,861 6,209 6,510 215 226
1941 5,254 6,917 7,587 237 259
1942 5,564 6,881 7,882 234 268
1943 4,906 6,344 208
1944 3,505 5,417 6,730 180 220 a From 1940 on re-estimates include Austria, Sudetengebiet, and territories annexed from Poland. b Eichholtz, Kriegswirtschaft, p. 381. Eichholtz claims that his estimate for the war period would refer to Germany in
the prewar borders. However, given that he used the Wagenführ machinery data, which refer to Germany in the respective borders, this claim cannot be hold. Thus, we can compare our re-estimate with the figures provided by Eichholtz.
c From 1940 on numbers include the population of Austria, Sudetengebiet, and territories annexed from Poland. For the population, see Wagenführ, Industrie, p. 135; for construction and equipment price indices, see Krengel, 'Brutto-Anlage-Investitionen der westdeutschen Industrie', Übersicht 10, p. 184.
d These numbers – especially those regarding 1939 – are somewhat inflated because a part of the armament investments omitted by the Statistisches Reichsamt was invested in Austria and Sudetengebiet, both of which were annexed in 1938.
The fact that the re-estimated investment numbers significantly exceeded those assumed so far also
suggests that the effects of allied bombing were bigger than calculated by Rolf Krengel for West
Germany. Krengel's estimate relies on the capital stock of the West German industry before and after
the war. The data used for the prewar value are the investment numbers published by the Statistisches
Reichsamt. Krengel estimated the post war capital stock by using information about postwar
investment and about the value added of industry under the condition of full employment in the 1950s.
Taking into consideration the normal capital consumption and his war investment estimate, he

28
calculated that war damages corresponded to only 20% of the gross capital stock of 1942.63 War
damages were allocated to single years with different intensities, which seem to be correlated, even if
Krengel does not provide exact information, to the intensity of bombing attacks.64 Based on the results
of table 9, we can infer that in this period investments exceeded Krengel's estimate by about 2.2-4.4
billion RM.65 Thus, war damages measured in net values, i.e. in the time value of assets in 1944/45,
must have exceeded the figures calculated by Krengel by about 20-53% – instead of 8.681 billion DM
(in constant prices of 1950) about 10.4-13.3 billion DM!66 Without war destruction, West German
industry's net capital stock in 1945 would have exceeded the real one by about 27-35%, instead of
"only" about 23% as calculated by Krengel.67
What was the share of autarky investments in total industrial investments? First of all we have to note
that the well-known data about Four Year Plan investments between 1936 and 1942 given by Petzina
are not used because they are incorrect due to a transcription error.68 Therefore information about Four
Year Plan investments given by the original source is employed. Based on these data Four Year Plan
investments exceeded Petzina's numbers by a factor of 1.2 (Table 10, columns I, III). However, the
63 Krengel, Anlagevermögen, pp. 76, 94.
64 About quantitative data regarding the alliied bombing, see United States Strategic Bombing Survey (ed.), Effects.
65 We assumed that the West German share on total investment in Nazi Germany between 1934 and 1939 matched that
presumed by Krengel (about 60%, which matched also the West German population share on the population of Germany in
the 1937 borders). During the war period we presume a share of about 50%. This share exceeds a little bit that one of West
Germany's population on Greater Germany's population. Yet, the annexed territories were in average less industrialized than
West Germany.
66 Depreciations are calculated as suggested by Krengel, Anlagevermögen, pp. 70-1.
67 Own calculation based on the information given by table 9; Krengel, 'Brutto-Anlage-Investitionen der westdeutschen
Industrie', p. 170-71, Krengel, Anlagevermögen, pp. 96, 104.
68 The Four Year Plan agency's investment numbers are based on steel allocation for the Four Year Plan plants. Using
chemical industry's experience regarding the steel-investment ratio, the authorities estimated the amount invested. The
numbers published by Petzina, however, are steel allocation numbers in 1.000 tons. Staatsarchiv Nuernberg, NI-8915,
Vierjahresplan, Chemischer Erzeugungsplan, Steigerung der Erzeugung, Reichsmarschall Goering, Beauftragter fuer den
Vierjahresplan, Stand Januar 1943, pp. 9-10.

29
revised data still include investments in explosive and powder plants, i.e. investment that must be
subsumed to armament but not to autarky branches. Taking into consideration this (Table 10, column
IV) it can be shown that the data used so far significantly overestimated the share of autarky
investments of total industrial investment during the war (Table 10, column V). In addition, it seems
that just before the implementation of the Four Year plan German industrial investment structure was
considerably affected by autarky related capacity enlargements – for two reasons: First, autarky
investments in 1936 cannot really be caused by the Four Year Plan, given that this plan was
promulgated in the autumn of that year. Second, autarky investment numbers in 1936, as provided by
table 10, refer only to the last six months of that year. Therefore this result – at least quantitatively –
contradicts Petzina's statement that before the implementation of the Four Year plan only a weak
version of autarky policy existed.69 Yet, this result is not surprising given the fact that already the 1934
Gesetz zur Übernahme von Garantien zum Ausbau der Rohstoffwirtschaft (Law for the Assumption of
Guarantees for Expansion of the Raw Material Economy), the legal basis for state's support of the
autarky branches, explicitly emphasised to achieve the highest level of autarky possible.70
69 Petzina, Autarkiepolitik, pp. 24, 27, 48, 50.
70 Scherner, 'Gesetz', p. 348. This justification was never published in contrast to the normal practice – probably for
concealing the aims of the Nazi regime. Ibid.

30
Table 10: The impact auf autarky and armament investments on industrial investments in the Third Reich; 1934-43
Petzina's numbers Re-estimates I:
Four-Year-Plan
investment (m. RM)a
II: I in percent of industrial investmentb
III: Four-Year-
Plan investment (m. RM)c
IV: autarky
investment (m. RM)e
V: IV in percent of re-estimated industrial
investmentf
VI: armament investment (m. RM) g
VII: VI in percent of
re-estimated industrial
investmentf
VIII: IV + VI in
percent of re-estimated industrial
investmentf
IX: "free" real per-capita-investmentf in percent
of real per-capita-investmenth in 1928
1934 na na. na. 199 18 57 5 23
1935 na. na. na. 352 21 75 4 25
1936 750 34 >906 >906 >36 373 15 >51 <58
1937 1,500 53,5 1,811 1,811 54 575 17 71 46
1938 1,950 52,7 2,358 2,180 47 1,128 24 71 64
1939 2,100 47,7 2,536 2,178 37 1,699 29 68 88
1940 2,490 58 3,007 2,254 35-36 2,406 37-39 72-75 54-63
1941 2,490 54 3,007 2,127 28-31 2,619 35-38 62-68 76-98
1942 1,970 40 2,379 1,925 24-28 2,498 32-36 56-64 84-118
1943 na. na. 2,411d 2,408 38 1,793 28 66 71 a Petzina, Autarkiepolitik, p. 183. b Ibid. Industrial investment numbers used by Petzina are the sum of Krengel's estimate for West Germany and Kupky's estimate for Central Germany. c Staatsarchiv Nuremberg, NI-8915, Vierjahresplan, Chemischer Erzeugungsplan, Steigerung der Erzeugung, Reichsmarschall Goering, Beauftragter fuer den Vierjahresplan, Stand Januar
1943, pp. 9-10. The number for 1936 refers only to the last six month of the year. d See Appendix IV. e Autarky investments in 1934 and 1935 are calculated on the basis of investments in metal ore mining (Metallerzbergbau), cellulose fibre industry (Chemiefaserindustrie), and fuel industry
(Kraftstoffindustrie) given by the Statistisches Reichsamt. These branches were considered autarky branches according to the Law for the Assumption of Guarantees for Expansion of the Raw Material Economy promulgated in 1934. Powder and explosives investment for 1937-42 are based on Hopmann's data and that for 1943 rely on Appendix IV. Numbers for 1936 are not available.
f For 1940-2 upper and lower limit total industrial investment estimates are employed. g See Appendix V. h See table 9.

31
What was armament industry's share of total industrial investment? An estimate shows that at least
from 1936 on this ratio played an important role (Table 10, column VII).71 In addition, this estimate
contradicts the so-called "Blitzkrieg-hypothesis". For, it can be taken for granted that investments are
planned at least one year beforehand. If so, we can conclude given the dramatically increasing
armament investments between 1938 and 1941 that the Nazi planers reckoned that the existing
capacities would have been to small for realizing their expansionistic aims. Especially the capacity
enlargement during the Blitzkrieg period suggests that the Nazis prepared a long-standing war with
bigger dimensions than those of the campaigns so far.
We can confirm the claim of the literature that from 1937 on the Nazi economic policy's impact on the
investment structure was substantial by calculating the share of autarky and armament investments on
total industrial investment (Table 10, column VIII).72 However, that does not necessarily mean that
investments of which the state was not interested were totally crowded out. This is shown by
calculating an indicator for so-called "free" real investments per capita in the Nazi period as a percent
of real per-capita-investments in 1928 (Table 10, column IX).73 It is remarkable that this ratio
increased during the last three peacetime years, which corresponds to the results of table 5 regarding
non-war-related machinery investments. It is further remarkable that these numbers did not decrease
dramatically during the war. This suggests that in fact at the end of the 1930s the German economy
can be considered – in terms of investment structure – a "war-like peace economy".74 However, this
71 For this estimate see Appendix V.
72 See for instance Hayes, Degussa.
73 However, given the high profits in this period, "free" investments must be considered small. About industrial profits see
Spoerer, Von Scheingewinnen, p. 147. In addition, a big part of these investments were probably replacement investments.
On the other hand, a part of autarky investments would have been probably realized even without the economic framework
provided by the Nazi regime. For the case of the cellulosic fibre industry, for example, see Scherner, 'Chemiefaserindustrie'.
74 These results are confirmed when examining chemical giant IG Farben AG's share of real "free" investment, which in the
average of 1937-1940 amounted to at least 60% of those in 1928. Based on Plumpe, investments in metals, fuel, cellulosic
and synthetic fibres, synthetic rubber, as well as in explosives are considered investments desired by the state. Plumpe, IG-
Farbenindustrie-AG, pp. 467, 596, 594.
32
indicator also shows that there were alternatives, albeit limited ones, for the industry to invest outside
of the autarky and armament branches.75
Finally, the re-estimates allow us to draw conclusions regarding the share of capital misallocation on
total industrial investment – at least from an ex-ante perspective. To do this we have to incorporate
market signals in our analysis. For, generally companies were not forced to invest according to the
wishes of the Nazi regime.76 For inducing the investments desired the state offered a bundle of
different contracts. These contracts differed in the way that amortization risk was shared between the
state and private companies. Normally, companies chose a leasing contract, under which they run a
state-owned plant, if they assumed that they could not use these plants in the long run, especially in the
case of a normalization of the economic policy.77 Given this, it is not surprising that private companies
were normally not disposed to buy such leasing plants offered by the state during the war, even if the
price was very low compared with the capital invested.78 The same is true regarding leasing machines,
which the armament ministry intended to sell entirely from spring 1943 on.79 Only a small share of
these machines was sold despite significant price reductions compared with the net book values.80 In
addition, due to the high risk associated with using armament plants for peacetime purposes, the state
and the private industry concluded investment contracts in armament branches, with which the state 75 This is confirmed by a statement of Kehrl at the end of 1943, emphasizing the high industrial investments for peace-time
purposes. Müller, 'Mobilisierung', pp.446-7.
76 Scherner, 'Verhältnis '; Buchheim/Scherner, 'Role of Private Property'.
77 The same consideration is true for leasing machines. For an example, see BArch R 3/1825, Semperit Gummiwerke AG to
armament ministry, 23.12.1943, p. 243.
78 Hopmann, MONTAN, pp. 131-4.
79 BArch R 3/1825, Erlaß betr. Fertigungseinrichtungen in Rüstungsbetrieben (Maschinen-Grundsätze) vom 28.3.1943, pp.
251-255. BArch R 3/1825, Speer to High Army Comand (OKH), 15.5.1944, pp. 211-2.
80 BArch R 3/1825, Erlaß betr. Fertigungseinrichtungen in Rüstungsbetrieben (Maschinen-Grundsätze) vom 28.3.1943, p.
253. At the end of September 1943 the values of army leasing machines amounted to 743 m. RM. Until the end of March
1944 machine sales revenue amounted to only 12 m. RM. BArch R 3/183, p. 213. Also the US government effectuated only
small sales revenues, when selling state owned armament plants to private companies after World War II. Gordon, '$45
Billion'.

33
took the whole or almost the whole of the amortization risk.81 In other words, private companies'
contract choices suggest that they widely considered all these investments – at least a third of total
investments during the whole Nazi period and a half during the war – misallocations.82
Conclusion
1) It seems that industrial investments exceeded significantly – by 10-14 billion RM or 25-35% –
the numbers assumed so far. The biggest part of this difference – about 60-80% – belongs to
the war period. Thus, allied strategic bombing obviously had greater effects than estimated by
Krengel.
2) The share of actual autarky investments especially during the war was considerably smaller
than assumed by Petzina. This was first due to bigger total investments and second due to the
fact that investments in powder and explosive plants had an increasing impact on Four Year
plan investments. In addition, it seems that just before the implementation of the Four Year
plan, autarky played a significant role regarding the German industrial investment structure.
3) The results regarding the investment structure as well as those regarding the amount of
armament and autarky investments question the hypothesis that in this period the Nazi regime
assumed to achieve his expansionistic aims only by fighting Blitzkriege. In addition, these
results confirm the hypothesis that at least form 1937 on investment projects desired by the
81 In the case of private air force armament producers contracts were concluded which guaranteed invested capital's
armortization. Later, the state provided lost subsidies. Budraß, Flugzeugindustrie, p. 364; BArch R 2 Anh./37, pp. 31-3. In
addition, during the war companies could finance armament investments by means of public investment loans with a so
called war risk clause (Kriegsrisikoklausel), according to which in the case of a drop of orders the capital goods financed by
the loan passed in the property of the state as well as the company was freed to repay the loan. Kluge, 'Reichseigene
Maschinen', p. 506; Weyres-v. Levetzow, Rüstungswirtschaft, pp. 193, 139*.
82 Also some autarky investments must be considered misallocations from the view point of a "normal" market economy.
However, it seems that the share of misallocations on total autarky investments was significantly smaller than that in the
armament industry because leasing contracts and similar contractual types were less important than in the case of the latter.
For an example of leasing type contratcs in the case of the mining of copper ores, see Scherner, 'Ohne Rücksicht'.

34
state increased considerably. Measured by the investment structure, it seems apt to
characterize the German economy from this point of time on a "war-like peacetime economy".
However, "free" investment, i.e. investment not desired by the state, was still possible, even if
reduced compared with 1928. Therefore, we cannot say that companies did not have
alternatives to autarky and armament investments. This leeway, in spite of huge
misallocations, may have favored the rise of West Germany's economy in the 1950s.

35
Appendix I
The numbers provided by the Wirtschaftsgruppe Maschinenbauindustrie for 1936-42 are completed
for 1943-4 by information mainly published by the USSBS. The USSBS data – based on an study of
the Wirtschaftsgruppe Maschinenbauindustrie in the summer 1945 – provide information about
armament production and sales of newly produced machinery.83 However in the USSBS table "Annual
sales of capital goods, 1938-1944" information about the sub-branch that manufactured gears and
rolling bearings is omitted, and the sub-branch that produced locomotives is included in "rolling stock"
instead of "machinery".84 A further difference to the data provided by the Wirtschaftsgruppe
Maschinenbauindustrie in 1944 is that sales of machinery products are not decomposed in domestic
sales and exports. However, in another table the USSBS published export numbers except for 1943.85
The problem regarding the omitted gears and rolling bearings sales data is solved by using information
published after the war by the Statistisches Handbuch von Deutschland, which provides us a number
for 1944.86 The number for 1943 is estimated by calculating the mean of the 1942 and 1944 values.
The Statistische Handbuch also provides export data for 1943.87 Unfortunately, for some sub-branches
export data for 1943 as well as for 1944 (given by the USSBS) are aggregated. To resolve this, the
export share of the respective sub-branch on total exports in 1942 is extrapolated.88 Based on these
considerations and data, we can estimate total sales of the mechanical engineering sector as well as the
decomposition regarding newly produced machineries in the 36 sub-branches of the Wirtschaftsgruppe
Maschinenbauindustrie. 89
83 United States Strategic Bombing Survey (ed.), Effects, Appendix Table 17, p. 218; Appendix Table 19, p. 219.
84 Eichholtz was obviously not aware of this. See Eichholtz, Kriegswirtschaft, p. 373, Tab. 91.
85 United States Strategic Bombing Survey (ed.), Effects, Appendix Table 29, p. 227.
86 This number implies a lower limit because it refers to the Reich in the prewar borders.
87 Statistisches Handbuch von Deutschland, p. 409.
88 In addition, for 1943 and 1944 only aggregated data for the "Stationary engines and power units" sub-branch are available.
Given that the shares of steam turbines, steam engine and locomobiles, as well as water turbines continuously decreased, we
extrapolated this trend.
89 When subtracting the USSBS export data from the USSBS sales data for 1938-42, it can be shown that these numbers are
almost identical with those published by the Wirtschaftsgruppe at the beginning of 1944.

36
Appendix table 1: Domestic sales of sub-branches of newly produced German machinery 1928a, 1936-44bc (m. RM)
Sub-branches 1928 1936 1937 1938 1939 1940 1941 1942 1943 1944
1) Machine tools 143 352 448 508 605 788 877 886 742 727
2) Woodworking machinery 47 36 45 59 66 60 66 58 47 40
3) Expendable tools 59 108 163 197 239 330 379 378 293 351
4) Textile machinery 175 87 116 150 175 128 125 95 39 50
5) Sewing machines 88 58 66 76 91 52 37 29 25 17
6) Shoe and leather machinery 13 12 15 21 24 18 20 15 13 7
7) Farm machinery 248 298 355 436 521 485 479 414 400 226
8) Washing machines 29 11 14 16 18 15 12 11 6 9
9) Locomotives 66 70 67 81 185 244 311 401 616 438
10) Stationary engines and power units, category combustion engines 122 92 103 141 184 219 303 331 386 334
11) Stationary engines and power units, category steam turbine 32 43 59 73 69 77 68 64 57
12 Stationary engines and power units, category steam engine and locomobiles
10 14 16 16 16 16 14 13 10
13) Stationary engines and power units, category water turbine
.
.
72
6 8 14 12 9 10 9 9 6
14) Air compressors 156 181 242 326 405 424 467 457 430 447
15) Pumps 52 47 65 87 96 109 123 124 122 118
16) Smelter and rolling mill equipment 25 31 34 54 62 96 122 124 52 54
17) Heat treating ovens and blast furnaces 11 18 15 15 20 22 26 23 17 21
18) Foundry equipment 5 10 13 17 20 25 27 23 20 22
19) Construction equipment and machinery 173 165 197 277 313 284 318 309 236 303
20) Cranes, derricks and elevators 212 140 171 232 274 288 328 313 222 219
21) Paper producing machinery 35 11 16 25 29 22 19 15 9 11
22) Paper converting machinery 24 18 22 28 35 32 22 18 10 9
23) Printing presses 56 25 28 26 41 26 19 16 5 4
24) Food processing machinery 131 98 120 140 171 145 128 110 68 50
25) Chemical stills 121 135 164 253 261 272 316 305 221 205
26) Office machinery 70 110 141 175 212 155 110 97 74 29
27) Automates 4 10 11 11 9 1 1 0 0 0
28) Heavy and calculating scales 34 24 30 36 37 36 34 32 27 19
29) Testing machines 3 6 10 12 14 22 28 24 18 15
30) Safes and vaults 8 9 9 11 14 11 7 4 2 0
31) Valves and fittings 145 191 237 272 306 367 484 561 469 446
32) Gears and roller bearings 132 208 284 341 397 453 506 541 569 577
34) Fire fighting apparatus 12 15 21 24 27 47 71 113 138 113
35) Roller engraving plates 3 3 3 3 3 2 1 1 1 1
36) Railroad safety equipment 30 19 21 30 29 30 36 41 29 11
a BArch R 13 III/193, Umsatz im Maschinenbau (Neufabrikation) mengen- und wertmaessig in den Jahren 1928 und 1938, 8.7.1941.
b For 1936-1942, BArch R 3/1917, Wirtschaftsgruppe Maschinenbau to Dr. Stoffregen, 22.1.1944, pp. 19-63. c For 1943 and 1944 (except row 32), United States Strategic Bombing Survey (ed.), Effects, Appendix Table 17, p.
227, Appendix Table 20, p. 220, Appendix Table 21, p. 220-1. For estimates of exports in 1943 and the numbers of row 32, see method described by the text.

37
Appendix II
Import data shown by Appendix table 2 relies on information given by the Statistisches Handbuch and
the Statistisches Reichsamt.
Appendix table 2 Machinery imports, 1936-44a (m. RM)
1936 1937 1938 1939 1940 1941 1942 1943 1944
1) Expendable and farm tools 1,6 1,2 0,9 1,6 2,1 6,2 11,8 13,7 11,2
2) Machine tools and rolling mill equipment
6,2 5,7 8,2 10,3 13,5 44,4 61,5 59,7 48,9
3) Textile, shoe and leather machines 5,6 6,0 8,3 8,6 6,3 10,1 9,2 5,8 4,6
4) Farm machinery 2,6 2,2 2,0 2,6 3,4 3,7 5,5 5,7 4,6
5) Locomotives 0 0 0 0 0 1,6 28,6 47,0 38,6
6) Power machines 1,6 1,4 4,1 3,2 1,6 5,0 11,8 15,0 12,1
7) Pumps and air compressors 1,1 0,6 0,6 1,1 1,4 6,2 10.5 11,9 9,6
8) Cranes and derricks 0,5 0,1 0,1 0,2 0,3 1,4 3,5 4,6 3,7
9) Paper and printing machines 0,6 0,4 0,2 0,3 0,2 1,6 2,5 1,2 0,9
10) Office machinery 0,7 0,2 0,3 1,0 2,1 7,2 6,0 3,3 2,5
11) Food processing machinery 0,1 0,1 0,2 0,2 0,3 0,5 0,7 0,8 0,5
12) Other machines 11,3 9,0 12,7 20,8 25,7 52,1 99,1 115,6 95,1
13) Total import (sum of rows 1-12) 31,9 26,9 37,6 49,9 56,9 140,0 n.a. 284,3 n.a.
14) Total import (Wirtschaftsgruppe Maschinenbau)
30,6 25,8 37,9 43,6 48,5 141,7 251,1 n.a. n.a.
15) Total import (USSBS) n.a. n.a. 37,9 43,6 48,5 98,4 173,0 232,2 234,3 a Row 1-13: for 1936 and 1937, Statistisches Jahrbuch für das Deutsche Reich 1938, p. 262; for 1940, Statistisches
Jahrbuch für das Deutsche Reich 1941/42, p. 290; for 1939, 1941, 1943, Statistisches Handbuch von Deutschland, p. 408; for 1942 und 1944, own estimate. For the method, see text. For row 14, see BArch R 3/1917, Wirtschaftsgruppe Maschinenbau to Dr. Stoffregen, 22.1.1944, p. 26; for row 15, see United States Strategic Bombing Survey (ed.), Effects, Appendix Table 29, p. 227.
In 1942 and 1944, sub-branches numbers given by appendix table 2 are estimated, because total
machinery imports in these years are not decomposed by the published sources. To estimate the import
value of the respective sub-branches (according the classification in appendix table 2) for 1942, total
import value provided by the Wirtschaftsgruppe Maschinenbau is multiplied by the mean of the
relative import shares of the respective sub-branch of total imports in 1941 and 1943. To estimate the
import value of the respective sub-branches for 1944, total import value provided by the USSBS is
multiplied by the relative import share of the respective sub-branch on total imports in 1943. However,
import categories cannot be decomposed according the sub-branches categories used by the
Wirtschaftsgruppe Maschinenbau (as shown in appendix table 1). Thus, to estimate import

38
investments, we allocate import values respectively to inputs, industrial investments and investments
outside of the industry. To avoid overestimating industrial machinery investment, cases of doubts
(such as office machinery) are allocated either to inputs or to non-industrial investments.90
Appendix III
Appendix table 3: The impact of Wehrmacht machine tools purchase on the machinery production, 1938-43
I:
Wehrmacht machine tools purchase (m. RM)a
II:
Share of Wehrmacht machine tools purchase on total machine tools
salesb
III:
Share of Wehrmacht machine tools purchase on total industrial
machinery investmentsc
1938 152 30 6
1939 251 41,5 8
1940 536 68 17
1941 594 67,7 17
1942 656 74 19
1943 608 82 22
a BArch R 13 III/290; BArch R 13 III/192, note, 31.7.1944, Aufgliederung des Inlandsumsatzes 1943 in zulassungspflichtigen Maschinenarten nach Abnehmergruppen geschaetzt.
b I in percent of Appendix table 1, row 1. c II in percent of table 4, row 10.
Appendix IV
For 1943 we can calculate an upper and a lower limit of autarky as well as of Four Year Plan
investments. The armament ministry provides information about construction investment of Four Year
Plan branches (iron and steel; non-ferrous metals; fuels and chemicals, as well as powder and
explosives), which amounted to 850 million RM.91 Autarky machinery investment (572 million RM) is
calculated by multiplying our estimated industrial machinery investment (table 4, row 10) with the
90 As industrial investments are considered: Textile, shoe and leather machines; food processing machinery; cranes and
derricks; machine tools and rolling mill equipment. As inputs are considered: pumps and air compressors; other machines. As
non-industrial investments are considered: expendable and farm tools; farm machinery; locomotives; paper and printing
machines; office machinery; power machines.
91 BArch R 3/1960, Bauinvestitionen 1943, gegliedert nach den Fertigungen des Gesamtaufwandsplans der deutschen
Volkswirtschaft Großdeutsches Reich ohne Protektorat, 23.7.1944, p. 165.

39
share of autarky machinery investment of total machinery investment (21%), which can be computed
on the basis of information given by the armament ministry's estimate regarding machinery investment
mentioned above.92 In the sum of construction and machinery investment (1422 million RM),
however, self-provided equipment and equipment investment except machinery are not included.
Thus, this estimate represents a lower limit. Assuming for the autarky branches a construction-
equipment investment ratio of 25%, as calculated by the Statistisches Reichsamt for the chemical, fuel
and potash industry in the years 1935-8, an upper limit can be computed (about 3400 million RM).
This may be an upper limit because it seems probable that due to air raid protection also in these
branches the ratio may be increased compared to the prewar period. Thus, we assume that the mean of
the upper and the lower limit (2411 million) may be a realistic approximation of the true value. Taking
into consideration that according the data provided by the armament ministry machinery investments
in powder and explosive plants amounted to 3 million RM in 1943 (construction investment did not
occur), we can conclude that autarky investments represent 2408 million RM.
Appendix V
Armament investments from 1934 to 1939 are calculated as the sum of the numbers provided by table
7, row 6 on the one hand, and on the other hand of navy as well as army armament investments of
private companies, which until the end of the peacetime period amounted to at least 500 million RM.93
The latter amount is allocated to the single years according the growth rate of army leasing plants.
Again, given that data about navy leasing plants are not available, this method leads to an
underestimate of munitions branches' investment during the period considered. However, as already
mentioned, the investment of the latter were small. Armament investments in 1940 and 1941 are
calculated as the sum of investments in army leasing plants and in air force munitions plants.94
92 BArch R 3/1960, Gliederung der Maschineninvestitionen nach den Fertigungen des Gesamtaufwandplans, verbessertes
Ergebnis, 15.9.1944, pp. 173-4.
93 R 2/59967, Liste über Geheimdarlehen, pp. 4-6.
94 For army leasing plants see Hopmann, MONTAN, p. 121 Tab. 14; for air force munitions plants see BArch R 2/5551,
Übersicht über die Investierung und Finanzierung der Luftwaffenrüstungsindustrie, p. 17. At first glance, the latter document

40
Further, based on a rough estimate regarding private industries' army and navy armament plants'
investment, an amount of 100 million RM per year is added.95 Also for investments in leasing
machines an annual lump sum of 50 million RM is added.96 When estimating armament investments in
1942, it is assumed that the ratio between armament industry's machine tools investments and total
armament investments (except powder and explosives investments) corresponded to those in 1940 and
1941 (about 37%), resulting to an amount of 1773 million RM and by adding powder and explosives
investments to a sum of 2498 million RM. The same method is used for estimating armament
investments in 1943, which amounted to 1793 million RM.97 Also for these years, the lump sum of
150 million RM is added.
suggests investments of 5.2 billion RM between the beginning of the war and the end of 1941 (as also sometimes claimed in
the literature. See for example Eichholtz, Kriegswirtschaft, p. 526). Yet, a closer inspection shows, that of this number an
amount of 2500 million RM was planned; only about 2700 million RM was already invested. The air force plant investment
numbers in 1940 and 1941 are splitted up into the single years according the relation of air force machine tools purchases.
95 This estimate relies on the fact that we have information about investment loans for private army munitions producers
provided by a special public bank, the Heeresrüstungs-AG, a subisdary of the Industriebank AG. These loans amounted to
only 320 million RM until 1945. Further, the Industriebank provided investments loans to private army and navy munitions
producers, which amounted to 650 million RM. Boelcke, Die Kosten, p. 129; Cassier, Unternehmerbank, p. 147; BArch R 2
Anh./37, p. 30. However, a part of the latter loans were used for financing autarky plants (For an example, see Scherner,
'Verhältnis'). Thus, we assume an armament industry's investment amount financed by all these loans, which amounted to
500 million RM, which are allocated in equal shares to the armament investments between 1940 and 1944.
96 This is based on the observation that still between October 1943 and September 1944 at least about 50 million RM were
invested in leasing machines. BArch R 3/183, p. 213.
97 The validity of the 1943 estimate is proven when calculating armament investments in 1943 based on the information of
the armament ministry, employing the same method as in the case of autarky's investment estimate for 1943. In the sum of
construction and machinery investments (1512 million RM), however, self-provided equipment and equipment investment
except machinery are not included. Therefore, this estimate represents a lower limit.

41
References
Abelshauser, W., 'Germany: Guns, Butter and Economic Miracles', in: Harrison, M. (ed.), The
Economics of World War II: Six Great Powers in International Comparison (Cambridge
1998), pp. 122-76
Abelshauser, W., 'Kriegswirtschaft und Wirtschaftswunder. Deutschlands wirtschaftliche
Mobilisierung für den Zweiten Weltkrieg und die Folgen für die Nachkriegszeit', in:
Vierteljahreshefte für Zeitgeschichte 1999, pp. 503-38
Abelshauser, W., 'Rüstungsschmiede der Nation? Der Kruppkonzern im Dritten Reich und in der
Nachkriegszeit 1933 bis 1951', in: Gall, L. (ed.), Krupp im 20. Jahrhundert. Die Geschichte
des Unternehmens vom Ersten Weltkrieg bis zur Gründung der Stiftung (Berlin 2002), pp.
267-472.
Barkai, A., Nazi Economics. Ideology, Theory, and Policy (Oxford, 1990)
Boelcke, W., Die Kosten von Hitlers Krieg: Kriegsfinanzierung und finanzielles Kriegserbe in
Deutschland 1933-1948 (Paderborn, 1985)
Buchheim, C., Die Wirtschaftsentwicklung im Dritten Reich, in: Vierteljahreshefte für Zeitgeschichte
2001, pp. 653-64.
Buchheim, C./Scherner, J., 'Role of Private Property in the Nazi Economy: The Case of Industry', in:
Journal of Economic History (forthcoming)
Budraß, L., Flugzeugindustrie und Luftrüstung in Deutschland 1918-1945 (Düsseldorf 1998)
Budraß, L./Scherner, J./Streb, J., 'Demystifying the German Armament Miracle During World War II:
New Insights from the Annual Audits of German Aircraft Producers', in: Yale University
Economic Growth Center Discussion Paper, Nr. 905 (2005)
Cassier, S. C., Biographie einer Unternehmerbank. Der Weg der Industriebank (Industriekreditbank
AG – Deutsche Industriebank) und der langfristige Industriekredit in Deutschland (Frankfurt
a. M., 1977)
Eichholtz, D., Geschichte der deutschen Kriegswirtschaft 1939-1945, vol. II 1941-1943, part 2
(München 1999)

42
Fischer, W., WASAG: die Geschichte eines Unternehmens 1891-1966 (Essen, 1966)
Fremdling, R./Stäglin, R., 'Die Industrieerhebung von 1936: Ein Input-Output-Ansatz zur
Rekonstruktion der volkswirtschaftlichen Gesamtrechung für Deutschland im 19. und 20.
Jahrhundert – ein Arbeitsbericht', in: Vierteljahresschrift für Sozial- und Wirtschaftsgeschichte
90 (2003), pp. 416-28.
Friedrich, J., Der Brand. Deutschland im Bombenkrieg 1940-1945 (München, 2002)
Gehrig, G., 'Eine Zeitreihe fuer den Sachkapitalbestand (1925 bis 1938 und 1950 bis 1957)', in: IFO-
Studien (1961), pp. 7-60.
Gleitze, B., Ostdeutsche Wirtschaft. Industrielle Standorte und volkswirtschaftliche Kapazitäten des
ungeteilten Deutschland (Berlin, 1956)
Gordon, R. J., '$45 Billion of US Private Investment Has Been Mislaid', in: American Economic
Review, 59 (June 1969), pp. 221-38.
Hayes, P., Industry and Ideology: IG Farben in the Nazi Era (Cambridge, 1987)
Hayes, P., Die Degussa im Dritten Reich. Von der Zusammenarbeit zur Mittäterschaft (München,
2004)
Hopmann, B., Von der MONTAN zur Industrieverwaltungsgesellschaft (IVG) 1916-1951 (Stuttgart,
1996)
Janssen, G., Das Ministerium Speer: Deutschlands Rüstung im Krieg, (Berlin, Frankfurt/Main, Wien
19692)
Kehrl, H., Krisenmanager im Dritten Reich (Düsseldorf, 1973)
Kershaw, I., The Nazi Dictatorship. Problems and Perspectives of Interpretation (London 1993)
Klein, B. H., Germany’s Economic Preparations for War, Cambridge (Massachusetts 1959)
Kluge, F., 'Reichseigene Maschinen', in: Die Deutsche Volkswirtschaft, 1943, pp. 505-506.
Krengel, R., 'Die langfristige Entwicklung der Brutto-Anlage-Investitionen der westdeutschen
Industrie von 1924 bis 1955/6', in: Vierteljahreshefte zur Wirtschaftsforschung (1957), pp.
168-84.
Krengel, R., Anlagevermögen, Produktion und Beschäftigung der Industrie im Gebiet der
Bundesrepublik von 1924 bis 1936 (Berlin, 1958)

43
Kröner, B. R.., 'Die personellen Ressourcen des Dritten Reiches im Spannungsfeld zwischen
Wehrmacht, Bürokratie und Kriegswirtschaft 1939-1942', in: Militärgeschichtliches
Forschungsamt (ed.), Das Deutsche Reich und der Zweite Weltkrieg, vol. 5/1 (Stuttgart, 1988),
pp. 693-1016.
Kupky, H., 'Die langfristige Entwicklung der Brutto-Anlage-Investitionen der mitteldeutschen
Industrie von 1924 bis 1955/6', in: Vierteljahreshefte zur Wirtschaftsforschung (1957), pp.
391-407.
Meyhoff, A., Blohm & Voss im „Dritten Reich“. Eine Hamburger Großwerft zwischen Geschäft und
Politik (Hamburg 2001)
Milward, A. S., Die deutsche Kriegswirtschaft 1939-1945 (Stuttgart 1966)
Müller, R.-D., 'Die Mobilisierung der Deutschen Wirtschaft für Hitlers Kriegsführung', in:
Militärgeschichtliches Forschungsamt (ed.), Das Deutsche Reich und der Zweite Weltkrieg,
vol. 5/1 (Stuttgart, 1988), pp. 349-692.
Müller, R.-D., 'Albert Speer und die Rüstungspolitik im Totalen Krieg', in: Militärgeschichtliches
Forschungsamt (ed.), Das Deutsche Reich und der Zweite Weltkrieg, vol. 5/2 (Stuttgart 1999),
pp. 275-776
Overy, R. J., 'Hitler's War and the German Economy: A Reinterpretation', in: The Economic History
Review, New Series, Vol. 35, No. 2. pp. 272-91.
Overy, R. J., War and Economy in the Third Reich (Oxford, 1994)
Petzina, D., Autarkiepolitik im Dritten Reich. Der nationalsozialistische Vierjahresplan (Stuttgart,
1968)
Plumpe, G., Die IG-Farbenindustrie-AG, Wirtschaft, Technik und Politik 1904-1945 (Berlin, 1990)
Ritschl, A., 'Der späte Fluch des Dritten Reichs: Pfadabhängigkeiten in der Entstehung der
bundesdeutschen Wirtschaftsordnung', in: Perspektiven der Wirtschaftspolitik, Vol. 6, 2
(2005), pp.151-70.
Scherner, J., 'Zwischen Staat und Markt. Die deutsche halbsynthetische Chemiefaserindustrie in den
1930er Jahren', in: Vierteljahresschrift für Sozial- und Wirtschaftsgeschichte 89 (2002), pp.
427-448.

44
Scherner, J., '„Ohne Rücksicht auf Kosten“? Eine Analyse von Investitionsverträgen zwischen Staat
und Unternehmen im „Dritten Reich“ am Beispiel des Förderprämienverfahrens und des
Zuschussvertrags', in: Jahrbuch für Wirtschaftsgeschichte (2004/2), 167-88
Scherner, J., 'Das „Gesetz zur Übernahme von Garantien zum Ausbau der Rohstoffwirtschaft“ und die
NS-Autarkiepolitik' in: Bähr, J./Banken, R. (ed.), Wirtschaftssteuerung durch Recht im
Nationalsozialismus. Studien zur Entwicklung des Wirtschaftsrechts im Interventionsstaat des
„Dritten Reichs“ (Frankfurt a.M., 2006), pp. 343-64.
Scherner, J., 'Bericht zur deutschen Wirtschaftslage 1943/44. Eine Darstellung des Reichsministeriums
für Rüstung und Kriegsproduktion über die Entwicklung der deutschen Kriegswirtschaft bis
Sommer 1944 (Dokumentation)'. in: Vierteljahrshefte für Zeitgeschichte (forthcoming)
Scherner, J., 'Das Verhältnis zwischen NS-Regime und Industrieunternehmen – Zwang oder
Kooperation?', in: Zeitschrift für Unternehmensgeschichte (forthcoming)
Scherner, J./Streb, J., 'Das Ende eines Mythos? Albert Speer und das so genannte Rüstungswunder', in:
Vierteljahrschrift für Sozial- und Wirtschaftsgeschichte (forthcoming)
Speer, A., Erinnerungen (Berlin, 1969)
Spoerer, M., Von Scheingewinnen zum Rüstungsboom. Die Eigenkapitalrentabilität der deutschen
Industrieaktiengesellschaften 1925- 1941 (Stuttgart, 1996)
Statistisches Jahrbuch für das Deutsche Reich, different volumes
Statistisches Handbuch von Deutschland 1928-1944 (München, 1949)
United States Strategic Bombing Survey (ed.), The Effects of Strategic Bombing on the German War
Economy Overall Economic Effects Division, October 31, 1945, vol. 1 (New York 1976)
Tooze, J. A., Statistics and the German State 1900-1945: The Making of Modern Economic
Knowledge (Cambridge, 2001)
Tooze, J. A., 'Punktuelle Modernisierung: Die Akkumulation von Werkzeugmaschinen im "Dritten
Reich', in: Jahrbuch für Wirtschaftsgeschichte 2003/1, pp. 79-89.
Tooze, J. A., 'No Room for Miracles. German Industrial Output in World War II Reassessed', in:
Geschichte und Gesellschaft 2005/31,3, pp. 439-64

45
Volkmann, H.-E., 'Die NS-Wirtschaft in Vorbereitung des Krieges' in: Militärgeschichtliches
Forschungsamt (ed.), Das Deutsche Reich und der Zweite Weltkrieg, vol. 1 (Stuttgart, 1979),
pp. 177-370.
Wagenführ, R., Die deutsche Industrie im Kriege 1939-1945 (Berlin, 1954)
Weyres-v. Levetzow, H.-J., Die deutsche Rüstungswirtschaft von 1942 bis zum Ende des Krieges
(München, 1975)