INDUSTRIAL HYGIENE GUIDELINE: The assessment of … · INDUSTRIAL HYGIENE GUIDELINE: The assessment...
38
Authors : Jack SMIT (Solvay Weesp) Willy ASNONG (Solvay Bruxelles, DCRT-HSE) Version 3 : 20.06.2007 INDUSTRIAL HYGIENE GUIDELINE: The assessment of Exposure to Polyvinyl Chloride Dust
-
Upload
nguyentuong -
Category
Documents
-
view
222 -
download
0
Transcript of INDUSTRIAL HYGIENE GUIDELINE: The assessment of … · INDUSTRIAL HYGIENE GUIDELINE: The assessment...

Authors : Jack SMIT (Solvay Weesp) Willy ASNONG (Solvay Bruxelles, DCRT-HSE)
Version 3 : 20.06.2007
INDUSTRIAL HYGIENE GUIDELINE:
The assessment of Exposure to Polyvinyl Chloride Dust

Authors : Jack SMIT (Solvay ) Willy ASNONG (Solvay Bruxel, DCRT-HSE)
Version 3 : 20.06.2007
INDUSTRIAL HYGIENE GUIDELINE:
The assessment of Exposure to Polyvinyl Chloride Dust
SUMMARY
This document describes the assessment of the exposure to airborne Polyvinyl Chloride -dust in relation with the applicable occupational exposure limits. The guidance note is based on several documents from the European Centre of Normalisation (CEN), the Health and Safety Executive (HSE-UK) and the National Institute of Occupational Safety and Health-US (NIOSH) and has been reviewed by IndusTox Consult (Nijmegen Netherlands) who delivers services in the domain of exposure assessment of chemicals in the work environment.
Version 3
In version 3 is in the chapter 7.1 Initial monitoring, the conclusion under point 1:
1. If one or more of the exposure results is exceeding the limit value, the exposure is unacceptable.
is removed.
In place is now under conclusion 3.
3. If the mean exposure concentration is above 100% of the limit value, the exposure is unacceptable.
In the Netherlands a new MAC-value adopted
• 0.5 mg/m3 as respirable dust (1.1.2007)


1 Version 3 : 20.06.2007
INDUSTRIAL HYGIENE GUIDELINE:
The assessment of Exposure to Polyvinyl Chloride Dust
CONTENTS
1. INTRODUCTION................................................................................................................3
2. GENERAL PRACTICE......................................................................................................3
3. OBJECTIVES OF THE EXPOSURE ASSESSMENT ....................................................4
4. BASIC CHARACTERIZATION .......................................................................................5
5. ESTABLISHING SIMILAR EXPOSURE GROUPS (SEG)...........................................7
6. AIR MONITORING............................................................................................................8 6.1. INTRODUCTION ..................................................................................................8 6.2. AIR SAMPLING METHODS...............................................................................8 6.3. DIRECT READING MONITORS .........................................................................11 6.4. ANALYTICAL METHODS ..................................................................................12
6.4.1. Gravimetric method ......................................................................................12 6.4.2. Storage and transport of the filters ................................................................13 6.4.3. Determination of PVC-DUST by total Chloride analysis.............................13 6.4.4. Quality control ..............................................................................................14
6.5. MONITORING OBJECTIVES. .............................................................................15 6.5.1. Initial Monitoring..........................................................................................15 6.5.2. Periodic Monitoring ......................................................................................15 6.5.3. Diagnostic Monitoring ..................................................................................15
6.6. MONITORING METHODS ..................................................................................16 6.6.1. Personal air monitoring.................................................................................16 6.6.2. Attaching the sampling equipment on the worker ........................................16 6.6.3. Area monitoring ............................................................................................16
6.7. AIR SAMPLING PLAN.........................................................................................17 6.7.1. General ..........................................................................................................17 6.7.2. Initial monitoring ..........................................................................................18 6.7.3. Periodic measurements..................................................................................18
7. CONCLUSION OF THE ASSESSMENT OF OCCUPATIONAL EXPOSURE..........20 7.1. INITIAL MONITORING .......................................................................................20 7.2. PERIODIC MONITORING ..................................................................................20

2 Version 3 : 20.06.2007
7.2.1. Judge if the exposure profile has a log-normal distribution..........................21 7.2.2. Calculate the probability of exceeding OEL.................................................21 7.2.3. How to cope with nondetectable values in a statistical evaluation? .............21
8. RECORDKEEPING AND REPORTING.........................................................................22
9. LITERATURE .....................................................................................................................23
Annex 1 Inhalable dust samplers Annex 2 Respirable dust samplers Annex 3 Analytical methods for chlorides Annex 4 Flowsheet “Judging the exposure profile” Annex 5 Glossary Annex 6 Statistical Tool
3 Version 3 : 20.06.2007
1. INTRODUCTION
An exposure assessment program shall be established to evaluate the potential for employee exposure to airborne Polyvinyl Chloride dust in relation with the applicable occupational exposure limits and to determine if established control measures are functioning properly or if additional control measures are needed.
This document describes the assessment of the exposure to Polyvinyl Chloride dust and is based on several documents from the European Commission of Normalisation (CEN), HSE and National Institute of Occupational Safety and Health- US (NIOSH) and has been reviewed by IndusTox Consult (Nijmegen Netherlands) who delivers services in the domain of exposure assessment of chemicals in the work environment..
2. GENERAL PRACTICE
The common industrial hygiene practice is the following:
2.1. Exposure to Polyvinyl Chloride (PVC) dust like all chemicals should be kept as low as reasonably practicable.
2.2. In any case, exposure should not exceed the national legal occupational exposure limit.
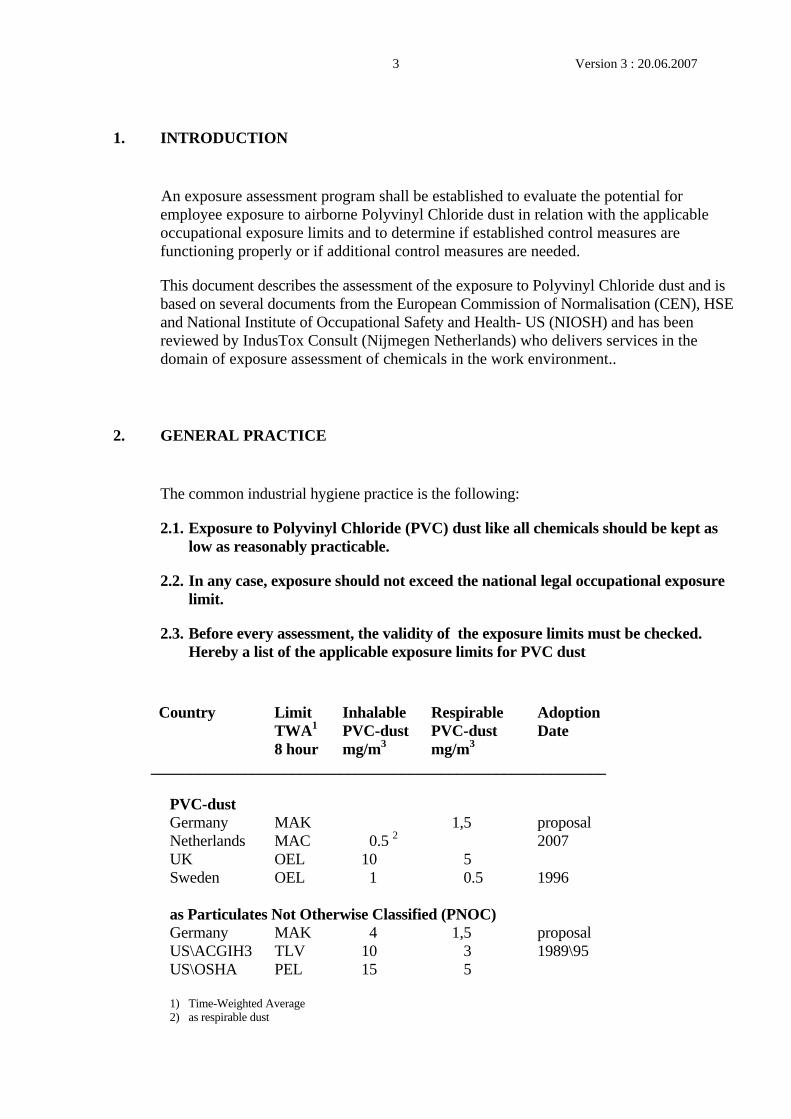
2.3. Before every assessment, the validity of the exposure limits must be checked. Hereby a list of the applicable exposure limits for PVC dust
Country Limit Inhalable Respirable Adoption TWA1 PVC-dust PVC-dust Date 8 hour mg/m3 mg/m3 __________________________________________________________ PVC-dust Germany MAK 1,5 proposal Netherlands MAC 0.5 2 2007 UK OEL 10 5 Sweden OEL 1 0.5 1996 as Particulates Not Otherwise Classified (PNOC) Germany MAK 4 1,5 proposal US\ACGIH3 TLV 10 3 1989\95 US\OSHA PEL 15 5 1) Time-Weighted Average 2) as respirable dust

4 Version 3 : 20.06.2007
• Which limit to comply with? The OELs for PVC dust in the different countries are based on either the inhalable dust fraction and/or the respirable dust fraction. In order to be able to merge the measurement data of all ECVM members for future epidemiological studies, it is recommended to conduct simultaneous measurements with both inhalable and respirable dust samplers in sufficient number of different exposure situations.
• Unusual Work Schedules
Normally the OELs are time weighted averaged for the convential 8 hour day and the 40 hour week . In case the working shift is longer the OEL should normally be adjusted. But for PVC dust no correction factor is necessary.(by Law of Haber5).
2.4 Adequate control of exposure
Where exposure to PVC-dust cannot be avoided, control should be achieved by material, plant and process controls or other suitable control techniques. Only where the measures taken do not prevent adequate control of exposure, suitable respiratory and other personal protective equipment should be worn.
3. OBJECTIVES OF THE EXPOSURE ASSESSMENT
Before the process starts, the exposure assessment goals must be clear to everyone involved in the assessment.
A strategy directed at assessing all exposure for all workers on all days is highly recommended. In addition to ensuring compliance with existing occupational limits (OELs), this strategy provides an understanding of the day-to-day distribution of exposures. Exposure assessment findings can then be used to address present-day health risks and to construct exposure histories. If a historical database is maintained, the exposure assessment data may be used to address future health issues for individual workers or groups of workers. In the latter case, the data may be used to support epidemiological studies.
5 Version 3 : 20.06.2007
The goals of a comprehensive exposure assessment include:
1. Characterisation of potential exposures to all PVC dust;
2. Characterisation of exposure intensity and temporal (hour-to-hour/day-to-day) variability faced by all workers;
3. Assessment of the potential risks (e.g.: risk of potential harm to employee health, risk of non-compliance with governmental regulations, etc…);
4. Prioritisation and control of exposures presenting unacceptable risks;
5. Identification of exposures for which additional information is needed (e.g.: Initial monitoring, etc...);
6. Documentation of exposures and control of efforts, and communication of exposure assessment findings to all affected workers and to those who are involved in worker health protection (e.g.: management, occupational physician, engineering staff, etc…);
7. Maintenance of a historical record of exposures for all workers so that future health issues can be addressed and managed relative to actual exposure information;
8. Accomplishment of the preceding steps with efficient and effective allocation of time and resources.
4. BASIC CHARACTERIZATION
Common description The collection and organisation of available information on the workplace, workforce, agents, historical exposure data, etc..., to assess and evaluate health risks.
As a minimum, the following questions must be answered:
• What processes and operations, and what tasks and work practices, pose significant potential for worker exposures to PVC dust?
• How is the work organised? • What are the significant sources of exposure? • What controls are in place, and how are they used?

6 Version 3 : 20.06.2007
Workplace information
Work involving PVC-dust should be assessed in order to identify sources of dust or the provision of new controls. The work should be re-assessed whenever changes are introduced which significantly affect the material, plant or process controls.
In practice exposure to PVC-dust in manufacturing or in user industries is most likely to arise during the following operations :
• Drying and screening, including cyclones • Handling, transfer and dispatching operations • Bagging and weighing • Bag opening and powder transfer • Batch weighing • Mixing and blending • Finishing of PVC articles (sanding, grinding, cutting) • Grinding PVC-recycled products
Preparing a written description and/or a schematic diagram of the process or operation can sources of potential exposure, location of chemicals and tasks, ventilation and other control methods.
Workforce information
The goal of the work force characterisation is to understand the division of labor and the work practices. Detailed knowledge of routine and non-routine work assignments, work schedules and tasks must be acquired. It helps to subdivide the workers in similar exposure groups, by describing jobs, tasks, and number of workers and frequency. The workforce characterisation should be based on a variety of resources, including the plant's organigram, job descriptions, worker interviews, management interviews and most important, careful observation of work practices and the workplace. If in grouping workers, the industrial hygienist deviates from the personnel system, accurate records will be needed relating the similar exposure groups to the personnel record keeping system. Incongruence between industrial hygiene and personnel job classification schemes could make investigation of future issues difficult.
More and more, many workplaces rely on contract labor to perform routine and nonroutine work. It is important for contractors to be included in the exposure assessment process. The mechanism and requirements for assessing the exposure of contract labor should be established in the contract. Larger or more sophisticated contractors may have their own exposure assessment capabilities. For other contractors, it might be more effective to rely on the skill and expertise of the client.
Example: Operator PVC: Spends about 40% of time in the PVC production areas checking equipment, adjusting flows, and preparing equipment for maintenance; about 10% of time is spent collecting process samples and an other 25% is spent in lab running analyses on all process samples; remaining time is spent in control room areas.
7 Version 3 : 20.06.2007
5. ESTABLISHING SIMILAR EXPOSURE GROUPS (SEG)
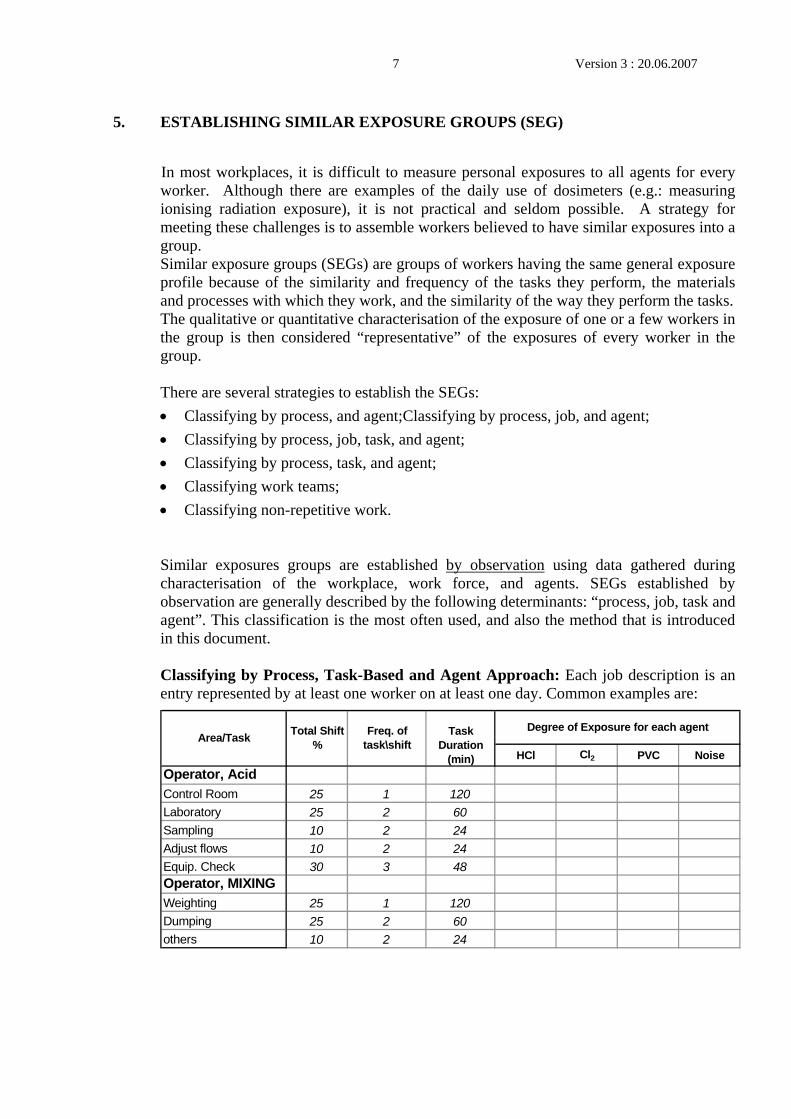
In most workplaces, it is difficult to measure personal exposures to all agents for every worker. Although there are examples of the daily use of dosimeters (e.g.: measuring ionising radiation exposure), it is not practical and seldom possible. A strategy for meeting these challenges is to assemble workers believed to have similar exposures into a group. Similar exposure groups (SEGs) are groups of workers having the same general exposure profile because of the similarity and frequency of the tasks they perform, the materials and processes with which they work, and the similarity of the way they perform the tasks. The qualitative or quantitative characterisation of the exposure of one or a few workers in the group is then considered “representative” of the exposures of every worker in the group. There are several strategies to establish the SEGs: • Classifying by process, and agent;Classifying by process, job, and agent; • Classifying by process, job, task, and agent; • Classifying by process, task, and agent; • Classifying work teams; • Classifying non-repetitive work. Similar exposures groups are established by observation using data gathered during characterisation of the workplace, work force, and agents. SEGs established by observation are generally described by the following determinants: “process, job, task and agent”. This classification is the most often used, and also the method that is introduced in this document. Classifying by Process, Task-Based and Agent Approach: Each job description is an entry represented by at least one worker on at least one day. Common examples are:
HCl Cl2 PVC Noise
Operator, AcidControl Room 25 1 120Laboratory 25 2 60Sampling 10 2 24Adjust flows 10 2 24Equip. Check 30 3 48Operator, MIXINGWeighting 25 1 120Dumping 25 2 60others 10 2 24
Degree of Exposure for each agentArea/Task Total Shift
%Freq. of
task\shiftTask
Duration (min)

8 Version 3 : 20.06.2007
6. AIR MONITORING
6.1. INTRODUCTION
A competent person in industrial hygiene shall define the air monitoring program. The goal of this program is to establish the sampling plan (e.g. sampling frequency, location, and sampling duration), selection of the air monitoring equipment, data evaluation and analysis of the samples and to verify:
1. whether the 8-hour time-weighted average concentrations of Polyvinyl Chloride dust in the breathing zone exceed the specified limits
2. if established control measures are functioning properly or if additional control measures are needed.
6.2. AIR SAMPLING METHODS
Inhalable versus respirable dust
There is a broad international agreement (ISO, ACGIH and CEN) on the qualitative and quantitative definitions of the exposure assessment criteria for aerosols that reflect as closely as possible the nature of the human exposure. Three main components are as follows :
• Inhalable fraction representing the aerosol fraction that enters the nose and/or mouth during breathing and the
• Thoracic fraction representing the subfraction of inhalable aerosols that penetrates into the respiratory tract below the larynx and the
• Respirable fraction representing the subfraction of the inhalable aerosol that penetrates to the alveolar region of the lung.
Only for the inhalable and respirable fractions OEL’s are established..
For PVC in most of the countries the inhalable and respirable fractions should be measured.

9 Version 3 : 20.06.2007
Principle
A measured volume of air is drawn by a pump through a membrane filter in a sampler. Samplers for inhalable dust and samplers for respirable dust (including a pre-selector) are described in Annex 1 and Annex 2.
Pumps
Battery-operated sample pumps can be used for personal and area sampling. These pumps are manufactured by a variety of vendors such as Gillian, SKC, MSA and Casella.
These pumps have to be capable to run for 8 hours or the duration of the total shift. Each pump should be calibrated with an air flow meter or other primary source (e.g. bubbletube, filmmeter) before and after sampling ( with a filter in the sampler head). The volume of air calculated by calibration after the sampling, should be within ± 5% of the volume of air calculated by calibration before the sampling.
Sampling Inhalable PVC-dust.
A sampler for inhalable dust should comply with the standardised conventions for health-related sampling of aerosols in workplaces ( EN481, ISO 7708).
The European Committee of Normalisation (CEN)1) has investigated eight personal inhalable dust samplers which are in use in various European countries and US (only closed face sampler). The results of this laboratory study identified correction factors for each sampler, to obtain satisfactory performance. In another study2) a new RespiCon 3-stage sampler was tested with 5 other samplers. With the RespiCon the respirable, thoracic and inhalable fractions can be measured. For the inhalable fraction the sum of the 3 filters must be calculated.
The new Button sampler is not yet tested, in the study2) only a prototype was tested with a different sample flow. But following the manufacturer, this sampler performs closely the ACGIH/ISO/NEN criteria.
The correction factors depend on the wind speed at the workplace. The 10 samplers are referred to in Annex 1. Sampling when the wind speed exceeds 1 m/s (197 feet/minute) is not recommended.
However, comparative field studies4 in the Netherlands show that in practice the difference between two different dust samplers can be 60% or higher.

10 Version 3 : 20.06.2007
RECOMMENDED APPROACH FOR SAMPLING INHALABLE PVC DUST
Every country has his own preference for a specific dust sampler, but for standardisation reasons it is recommended that everyone will use the same dust sampler. If all measurements are performed with the same method, the results of all ECVM-members will be easier to compare.
Each sampler has its advantages and disadvantages, but it is recommended that all sampling would be done by using the IOM-sampler. This IOM-sampler has been developed specifically, to sample the inhalable dust fraction and is the only one that is commercially available in all countries.
If measurements were already done in a appropriate way with one of the other samplers, it is recommended that in one or two exposure situations the measurements would be repeated in sampling simultaneously with the IOM-sampler and the sampler used in the previous measurement campaignWith this comparison also the other measurements can be corrected.
Example : an exposure situation is sampled simultaneously with the IOM-sampler and the sampler that was used in the past, and the IOM sampler gives a mean concentration of 4.0 mg.m3 and the other sampler gives a mean concentration of 3.2 mg.m3. The results of the sampling by the other sampler can be corrected with a factor of 4.0/ 3.2 = 1.25.
Sampling Respirable PVC-dust
A sampler for respirable dust should comply with the standardised conventions for health-related sampling of aerosols in workplaces ( EN481, ISO 7708).
There are a few samplers available, which comply with this standardisation. The samplers are referred to in Annex 2.
There is no information available, stating that one specific sampler should be recommended.
Filter material
If sampling of PVC-dust is carried out for the measurement of the gravimetric concentration, pre-weighed glass fibre filters (e.g. Whatman GF/A) may be used. Glass fibre is the easiest material to use, because there are no problems with static electricity. But fibre loss from glass fibre filter may occur during handling and may bias significantly the result if less than 1 mg dust is collected.
At lower concentrations silver or membrane filters (e.g. cellulose nitrate, polycarbonate, Teflon or PVC filters should be used.
Filters made of PVC, can show excessive static build up, mixed ester or cellulose filters do not have these drawback in the same degree. A static eliminator (plasma ion source or radioactive source) can be used to dissipate any electrostatic charge before weighing.
11 Version 3 : 20.06.2007
Filters made of mixed esters or cellulose can show excessive weight change due to moisture absorption. But there is some experience that also glass fibre filters showed excessive weight changes due high relative moisture.
If the determination of PVC in the collected material is required (see 5.2), a polycarbonate filter should be used.
Moisture problems The use of a desiccator can solve this problem; equilibrating the filters for at least 2 hr in a desiccator with on the bottom a saturated solution of K2CO3. This method gives a relative moisture of 44 %.
RECOMMENDED APPROACH FOR FILTER MATERIAL
For standardisation reasons it is recommended to use the polycarbonate filters. If all measurements are done with the same method, the results can be compared easier. Additionally, if afterwards it is deemed necessary to analyse the amount PVC on the filter, the polycarbonate filters are the appropriate ones.
Attaching the sampling equipment on the worker
Attach the sampler head to the operator, in preference on the lapel, not more than 30 cm away from the nose-mouth region. The sampler head is connected to the pump which is attached to a belt around the waist of the worker.
6.3. DIRECT READING MONITORS
A general feature of real-time dust monitors is the short average time, which makes these monitors suitable for objectives such as detection of peak exposures, emission source detection, and trend analyses of background concentrations.

12 Version 3 : 20.06.2007
6.4. ANALYTICAL METHODS
6.4.1. Gravimetric method
A balance capable of weighing with a resolution of 10 µg or better is suitable.
All filters should equilibrate for 30 minutes or more in the weighing room. When humidity is variable a desiccator should be used.
Weigh each filter before the sampling activities, including a minimum of three field blanks before sampling. Repeated weighing of the filters gives a better performance. The field blanks should be exposed to the same climate conditions as the filters used in the field.
After the sampling repeat the weighing including the blank filters.
The mean weight changes of these unexposed blank filters should be used as a correction factor (+ or -) in the calculation below (see b1).
Sample quantity
The limit of detection (LOD) of material that can be weighed with a balance with a weighing precision of 10 µg, is approximately 300 µg. For example at an air concentration of 0.5 mg/m3 it is necessary to collect a volume of 0,6 m3 air to achieve this.
For a balance with a weighing precision of 1 µg; the limit of detection (LOD) of material that can be weighed is approximately 50 µg. For an air concentration of 0.1 mg/m3 it is necessary to collect a volume of 0,5 m3 air to achieve this.
The limit of detection (LOD) of the gravimetric analysis can estimated as approximately three times the standard deviation of weight changes of the group of three (more is better) blank filters included in each batch of samples, weighed before and after sampling.
Calculation
For determination of inhalable or respirable PVC-dust : m1 = initial weight of filter (mg) m2 = weight of filter after sampling (mg) b1 = mean weight changes (m2 - m1) of unexposed filters (mg) (+ or -) q = sampling flow rate (l/min) t = sampling time (min) c = correction factor inhalable dust samplers (Annex 1)
The concentration of (PVC) dust in air
3112 m/mgcx
qt)bmm(1000 −−
=

13 Version 3 : 20.06.2007
6.4.2. Storage and transport of the filters
For samplers that collect the dust on a filter alone:
- Remove the filter from each sampler using a flat-tipped forceps,
- place in a labelled filter transport container and close with a lid,
- take particular care to prevent dust being dislodged from heavily loaded filters
For samplers that use an internal cassette (e.g. the IOM sampler),
- Remove the cassette from the sampler and fasten with the transport clip supplied by the manufacturer,
- label the cassette to ensure proper handling.
Transport the samples to the laboratory in a container designed to prevent damage during transit and label to ensure proper handling. Special precautions to recover lost material, for example the use of cassette covers or filter containers, are likely to be needed where samples are sent by post. In this case one should weigh the filter and the cassette together. After sampling, the filter is placed again in the cassette and both are weighed together.
6.4.3. Determination of PVC-DUST by total Chloride analysis
With the gravimetric method, all the sampled dust should be indicated as PVC-dust. So, if the measured concentration is exceeding the exposure limit, it may be important to determine the PVC-content in the sample in order to calculate the real concentration of PVC in the work environment.
Filter material If determination of PVC in the collected material is required, polycarbonate filters should be used.
Destruction of PVC The determination of the PVC content in the sample is based on the thermal destruction of PVC in a furnace with a capacity of >1000 °C which results in the liberation of the chloride ion. The chloride is trapped into 10 ml water. Also other destruction methods, can be used if it is possible to trap the chloride in water.
Analysis of chloride The amount of chloride in water is determined very easy spectrophotometrically with the Dr. Lange chloride test LK 311. This method has a very low detection limit of ± 10 µg chloride / filter.
For example, sampling during 15 minutes at a sample flowrate of 2 litres per minute, gives a minimum detection limit of < 0,3 mg chloride /m3 (i.e. 10µg/15'*2l). The calculation of the PVC concentration starting from the chloride concentration, must

14 Version 3 : 20.06.2007
take into account the percentage of chloride in the PVC-compound handled during the monitoring.
Principle : Cl-+ mercurythiocyanate → HgCl2↓ + SCN-1 + FE3+ → coloured Fe(SCN)3)
Warning : With this method not only the chloride of the sampled PVC will determined, but also background chloride from e.g. NaCl or FeCl2. When there is any doubt, background samples should be taken. Ask your COHYG for information about background sampling.
In annex 3, the analytical methods for chlorides is given
6.4.4. Quality control
Responsible person for monitoring program The person who is responsible for the assessment should have enough experience and education to perform this assessment and monitoring program.
Analytical Laboratory Before deciding which analytical laboratory is going to perform the weighing of the filters, calibrating the pumps or performing the specific analysis, one should verify if this laboratory is certified to perform this activities.
• Has the laboratory been certified by an external control agency: ISO, GLP, etc?
• Is the Laboratory Analyst qualified by training? e.g. school, on the job, course
• Is the laboratory participating in Round Robin performance tests?
• Are laboratory blanks used to check the accuracy of the analytical method. A media (laboratory) blank is an unexposed filter, not taken to the field or shipped, used for background correction of sample readings or for recovery studies?
• Do the laboratory reports the coefficient of variation of their analyses?
Sampling In order to check the accuracy of the air sampling and analytical method one should :
• Submit routinely field blank samples to the laboratory together with field samples? A field blank is a filter, handled exactly the same as the field samples, except that no air is drawn through it.
• Take some samples in duplicate
15 Version 3 : 20.06.2007
6.5. MONITORING OBJECTIVES.
There are different monitoring objectives or strategies that broadly can be grouped into three categories:
6.5.1. Initial Monitoring
In case the basic survey (e.g. EN689 / 5.1.4.2 or the company specific exposure assessment methodology) can not give sufficient information if an exposure profile of a Similar Exposure Group (SEG) is acceptable (< 10% of exposure limit) or unacceptable, (≥ 100% of exposure limit) the assessment of the exposure profile is uncertain.
In that case initial monitoring is mostly used to assess the compliance with an exposure limit. Only personal monitoring techniques are appropriate.
6.5.2. Periodic Monitoring
Periodic monitoring is used to evaluate periodically exposure profiles that are judged as acceptable and which have a mean concentration that is greater or equal to 10% and lesser than 100% of the exposure limit.
If documented properly, periodic-monitoring data can also be used for future epidemiological studies.
In the case of periodic compliance monitoring, only personal monitoring techniques are appropriate
6.5.3. Diagnostic Monitoring
When trying to identify the exposure source and to understand how source, tasks, and other variables (e.g. production rates) contribute to worker exposure, diagnostic monitoring should be conducted. The results can help the industrial hygienist to define the most appropriate and efficient control strategies for unacceptable exposures.
If the source is from a fixed piece of equipment, area-monitoring techniques are appropriate. If the source moves with the worker or depends on individual work practices, personal monitoring techniques are appropriate. In most cases, measurement averaging times should reflect process cycle times rather than the exposure limit averaging times. Using a longer averaging time will simply average out the actual data required for problem identification. For example when one intends to monitor the exposure during a task of 10 minutes but sampling time start 10 minutes before and continues 10 minutes after the task, you will measure a concentration 10’/30’ of the real concentration during the task.

16 Version 3 : 20.06.2007
6.6. MONITORING METHODS
6.6.1. Personal air monitoring
The best estimate of an individual's exposure is obtained by taking breathing zone samples (personal sampling) for the entire working period. This optimum is not always practical and the actual sampling time should be arranged so that it covers certainly the potentially highest exposures, and at least 75% of the reference period.
6.6.2. Attaching the sampling equipment on the worker
Attach the dust sampler to the operator, in preference on the lapel, not more than 30 cm away from the nose-mouth region. The sampler is connected to a pump that is attached to a belt around the waist of the worker.
6.6.3. Area monitoring
Area (or fixed-point) measurements can be done with the same devices as used for personal air monitoring or with a real-time dust monitor. Area monitoring can be used to identify the background concentrations at the workplace and are useful to measure the effectiveness of control measures (e.g. local exhaust ventilation) over a period of time.
Area-point measurements should not be used to verify compliance with an exposure limit.

17 Version 3 : 20.06.2007
6.7. AIR SAMPLING PLAN
6.7.1. General
To compare an exposure level of a substance with its exposure limit, one needs to know the concentration of the substance in the breathing zone extrapolated to the same reference period as that is used for the limit value (i.e. 8 hours for chlorides). At least 75% of the reference period should be sampled. However, if during more than 25% of the reference period no exposure occurs, a sampling time less than 75% is permissible. For work shifts greater than 8 hours, one should verify if the exposure limit must be adjusted and the sampling time should be 75% of the longer work shift .
Pump out or on when respirator is used? In assessing the compliance of a SEG with the exposure limit, one should sample the whole exposure period without taking into account the wearing of a respirator. That is what you can interpret and read in European guidelines and OSHA standards:
"Employee exposure" and other similar language referring to the air agent level to which an employee is exposed means the exposure to the airborne agent that would occur if the employee was not using respiratory protective equipment".
If an exposure of a SEG is not in compliance with the exposure limit, immediately the workers must wear respirators and technical measures must be considered to control exposure. If the technical measures cannot reduce exposure to an acceptable level, workers should continue to wear respirators.
In order to verify if the respirators do protect the workers adequately, one can measure the "daily intake” by the workers as follows :
Sample the most exposed task(s) for which the worker must wear adequate respirators and calculate the daily intake by subtracting this concentration from the result of the compliance measurement result for the same job; but taking into account also the protection factor of the respirator (e.g. half face P2 toxic dust mask has a protection factor of 10, that means that the concentration measured for the specific task must be divided by 10).
18 Version 3 : 20.06.2007
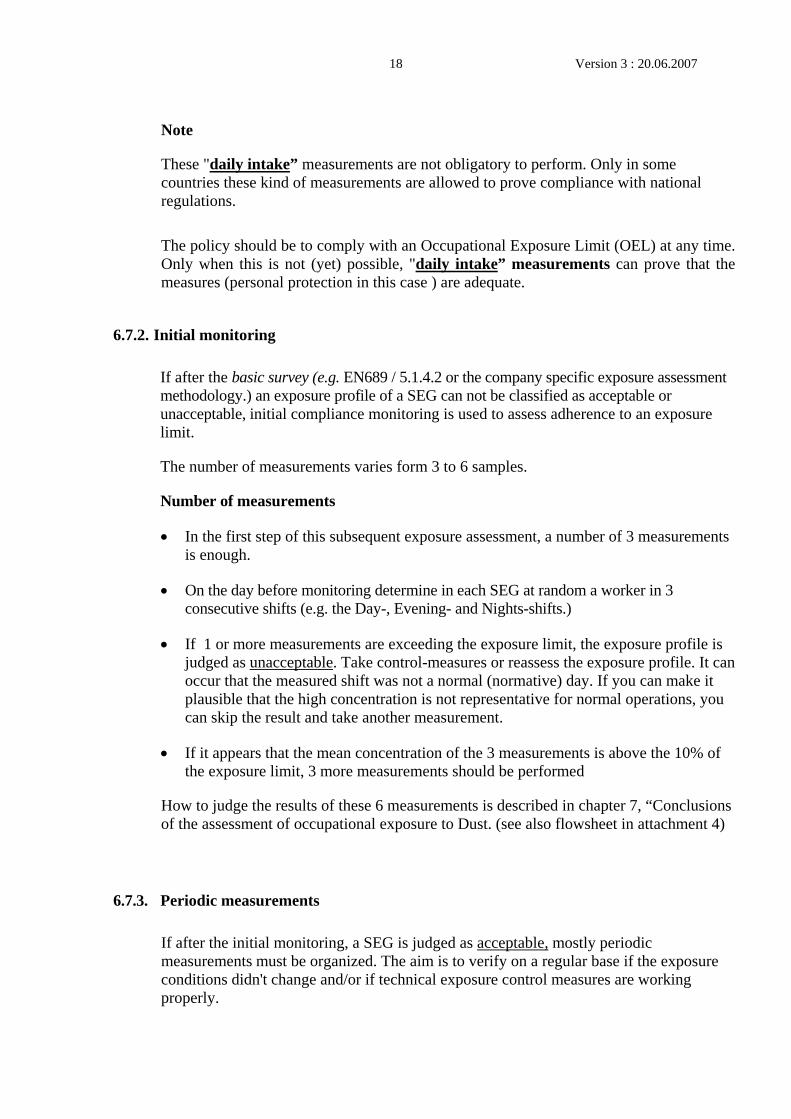
Note
These "daily intake” measurements are not obligatory to perform. Only in some countries these kind of measurements are allowed to prove compliance with national regulations.
The policy should be to comply with an Occupational Exposure Limit (OEL) at any time. Only when this is not (yet) possible, "daily intake” measurements can prove that the measures (personal protection in this case ) are adequate.
6.7.2. Initial monitoring
If after the basic survey (e.g. EN689 / 5.1.4.2 or the company specific exposure assessment methodology.) an exposure profile of a SEG can not be classified as acceptable or unacceptable, initial compliance monitoring is used to assess adherence to an exposure limit.
The number of measurements varies form 3 to 6 samples.
Number of measurements
• In the first step of this subsequent exposure assessment, a number of 3 measurements is enough.
• On the day before monitoring determine in each SEG at random a worker in 3 consecutive shifts (e.g. the Day-, Evening- and Nights-shifts.)
• If 1 or more measurements are exceeding the exposure limit, the exposure profile is judged as unacceptable. Take control-measures or reassess the exposure profile. It can occur that the measured shift was not a normal (normative) day. If you can make it plausible that the high concentration is not representative for normal operations, you can skip the result and take another measurement.
• If it appears that the mean concentration of the 3 measurements is above the 10% of the exposure limit, 3 more measurements should be performed
How to judge the results of these 6 measurements is described in chapter 7, “Conclusions of the assessment of occupational exposure to Dust. (see also flowsheet in attachment 4)
6.7.3. Periodic measurements
If after the initial monitoring, a SEG is judged as acceptable, mostly periodic measurements must be organized. The aim is to verify on a regular base if the exposure conditions didn't change and/or if technical exposure control measures are working properly.

19 Version 3 : 20.06.2007
In many countries the seasons will have some influence on the level of exposure. But also the day, evening and night-time periods within 24 hours can have considerable different exposures either due to weather changes or to work practice differences.
In case of dust it is suggested that the measurement strategy for some exposure profiles is based on measurements in 2 seasons and in the different shifts. The mean concentration of the exposure profile of the SEG will decide about the frequency of the measurements.
Mean concentration is ≥ 10% and < 100% of exposure limit,
For a SEG with a mean concentration greater or equal to 10% and lesser than 100% of the exposure limit, the following measurement strategy should be performed:
1. Establish every half-year one day of monitoring, e.g. monitor on February 5th and August 5th.
2. On the day before monitoring determine in each SEG at random a worker in 3 consecutive shifts (e.g. the Day-, Evening- and Nights-shifts.)
3. Carry out the measurements (also if there are less working activities) on that specific day and shift with the at random determined worker. But keep in mind that not the specific worker is important, but the function or activity that that worker is carrying out.
4. Calculate for the 6 measurements (for every SEG), the arithmetic mean concentration, verify if the distribution is log-normal or normal and calculate the probability of exceeding the exposure limit and judge if the exposure is acceptable.(see chapter 7)
Of course each set of 3 measurements can be evaluated on the acceptability, but for the evaluation of the long-term average, you need in this case 6 measurements. (see chapter 7)
Mean concentration is < 10 % of exposure limit
For a SEG with an mean concentration lower than 10 % of the exposure limit, periodic sampling is not necessary.
20 Version 3 : 20.06.2007
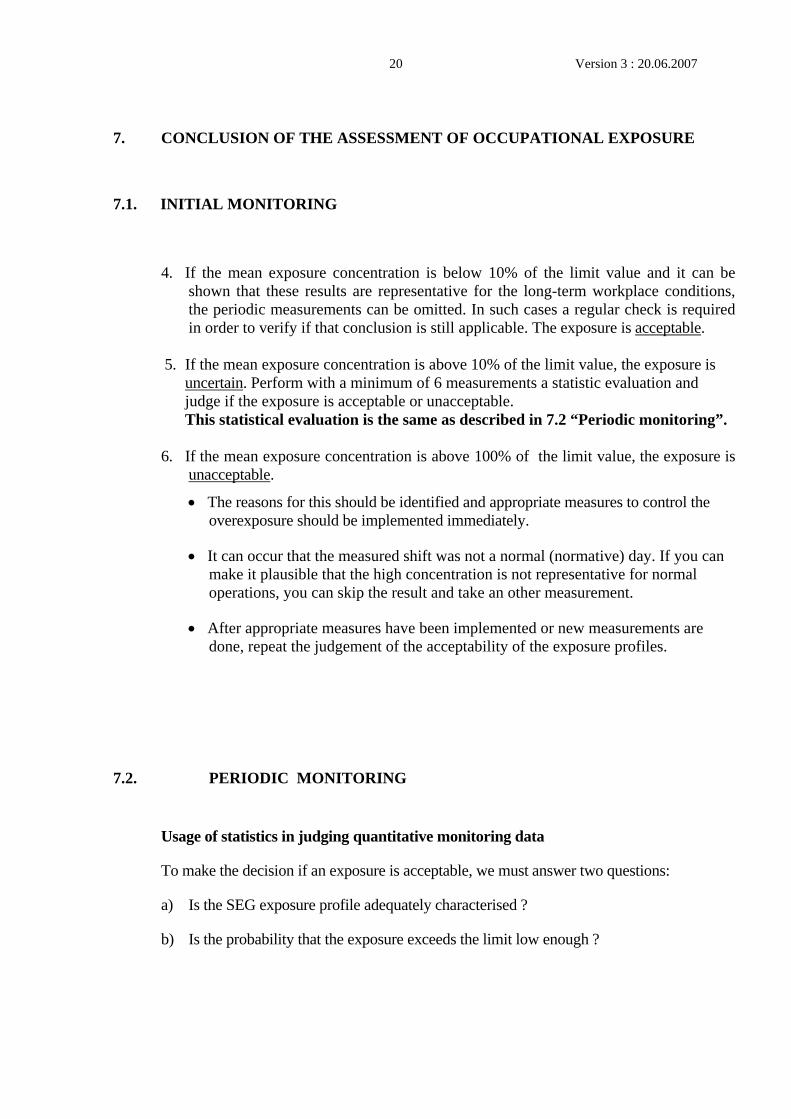
7. CONCLUSION OF THE ASSESSMENT OF OCCUPATIONAL EXPOSURE
7.1. INITIAL MONITORING
4. If the mean exposure concentration is below 10% of the limit value and it can be
shown that these results are representative for the long-term workplace conditions, the periodic measurements can be omitted. In such cases a regular check is required in order to verify if that conclusion is still applicable. The exposure is acceptable.
5. If the mean exposure concentration is above 10% of the limit value, the exposure is
uncertain. Perform with a minimum of 6 measurements a statistic evaluation and judge if the exposure is acceptable or unacceptable. This statistical evaluation is the same as described in 7.2 “Periodic monitoring”.
6. If the mean exposure concentration is above 100% of the limit value, the exposure is
unacceptable.
• The reasons for this should be identified and appropriate measures to control the overexposure should be implemented immediately.
• It can occur that the measured shift was not a normal (normative) day. If you can make it plausible that the high concentration is not representative for normal operations, you can skip the result and take an other measurement.
• After appropriate measures have been implemented or new measurements are done, repeat the judgement of the acceptability of the exposure profiles.
7.2. PERIODIC MONITORING
Usage of statistics in judging quantitative monitoring data
To make the decision if an exposure is acceptable, we must answer two questions:
a) Is the SEG exposure profile adequately characterised ?
b) Is the probability that the exposure exceeds the limit low enough ?

21 Version 3 : 20.06.2007
7.2.1. Judge if the exposure profile has a log-normal distribution.
If you must reject a distribution on its log-normality or normality characteristics, it is possible that the exposure profile is not adequately characterised for this SEG. Maybe the SEG you are examining contains two or more different exposure profiles. In this case you must divide the SEG in two or more new SEGs and re-start the assessment.
7.2.2. Calculate the probability of exceeding OEL
To determine the probability of exceeding the exposure limit, the lognormal distribution model is a common proposed statistical model. Specific software especially for industrial hygiene monitoring, like Altrex, Hyginist and LogNormal2 are useful to check the hypothesis of lognormal distribution and to determine the probability of exceeding the exposure limit. A simple but effective statistical tool that is developed by members of the AIHA is available together with the book3): Strategy for Assessing and Managing Occupational Exposures; 1999 In annex 6 an example of a statistical evaluation is given.
1. If the probability of exceeding the exposure limit is less than 0,1% and it can be shown that these values are representative for the long term workplace conditions the periodic measurements can be omitted
2. If the probability of exceeding the limit is between 0.1 and 5%, repeat the next set of compliance measurements within 52 weeks
3. If the probability of exceeding the exposure limit is >5%
• The reasons for this should be identified and appropriate measures to control the overexposure should be implemented immediately. Repeat the measurements after appropriate measures have been implemented
7.2.3. How to cope with nondetectable values in a statistical evaluation?
It is a common problem for industrial hygienist to select a valid way of dealing with those samples reported to contain nondetectable values.
There are different methods that are described in literature. The Maximum Likelihood Estimation (MLE) method, the Regression method and the 2 simpler alternatives involved the substitution of the detection limit (L) by L/2 or L/√2.
Because not every one has a dedicated statistical evaluation program, it is recommended to use the L/√2 substitution method.
For example a detection limit of 0.1 mg/m3 gives a substitution of :
0.1/√2 = 0.1/ 1.41= 0.07 mg/m3.

22 Version 3 : 20.06.2007
8. RECORDKEEPING AND REPORTING
It is very important that all relevant information of each exposure assessment is recorded and included in a summary report.
The report should contain:
- The job titles and a accurate description of the tasks undertaking the assessment and the measurements
- description of the workplace factors, including the task and process conditions during the measurements, SEG
- the sampler type and flowrate, the calibration - sampling method (personal, fixed point) - the measurement procedure - the time schedule (date, start and end of sampling) - the occupational exposure concentration - details of quality assurance (use of blanks, ...) - result of the comparison with the limit value - Personal Protection Equipment (PPE) worn - any abnormal conditions. - in the annex of the report: the primary analytical data as measurement time, pump
velocity, total volume of air sampled, concentration dust (PVC) on the filter
A record of files (containing a wide array of relevant information) should be maintained during at least 30 years for easy retrieval of information on specific surveys and for use in epidemiologic studies.

23 Version 3 : 20.06.2007
9. LITERATURE
- EU: European directive (89/391) “Framework Directive on the introduction of measures to encourage improvements in the safety and health of workers at work.”
- European Standard : EN 689 \ CEN "Workplace atmospheres guidance for the assessment of exposure by inhalation to chemical agents for comparison whit limit values and measurement strategy"
- European Standard : EN481, ISO 7708 Workplace atmosphere-specifications for conventions for measurement of suspended matter
- European Standard : EN482 "Workplace atmospheres: General requirements for the performance of procedures for measurements of chemical agents", 1994
- EH31 \ HSE "Control of exposure to polyvinyl chloride dust", 1982
- NIOSH method 500, Nuisance dust, total
- NIOSH method 600, Nuisance dust, respirable
- MDSH 14/3, HSE, 2000 "General methods for the gravimetric determination of respirable and total inhalable dust"
- 1) “A collaborative European study of personal aerosol sampler performance" Ann. occup Hyg., Vol 41 N02. pp135-153, 1997
- 2) Evaluation of Six Inhalable Aerosol Samplers, AJHAJ, 61:506-516
- 3) Strategy for Assessing and Managing Occupational Exposures; AIHA:1999
- 4) Vergelijkend veldonderzoek van IOM en PAS-6 stofmonsternemer, H. Kromhout LUW Wageningen, e.a., Tijdschrift voor toegepaste Arbowetenschap 10 (1997) nr 1.
- 5) Adjustment of Permissible Exposure Values to Unusual Work Schedules, AIHAJ (62( September/Oktober 2001, Jules Brodeur, e.o.

Appendix 1 Inhalable dust samplers 1 Version 3 : 20.06.2007
Inhalable dust samplers
Samplers of inhalable dust should comply with the standardised conventions for health-related sampling of aerosols in workplaces (EN481, ISO 7708).
Given is for each sampler, the manufacturer, filter diameter, flow rate of the pump, inlet position of the opening, recommended correction factors related to the degree of wind speed (m/s) on the workplace.
Eight samplers are tested in a European study1), this study has suggested using a correction factor in relation with the wind speed. Sampling with a wind speed of more than 1 m/s is not recommended. In another study2) a new RespiCon 3-stage sampler was tested with 5 other samplers. With the RespiCon the respirable, thoriac and inhalable fractions can measured. For the inhalable fraction the sum of the 3 filters must be calculated.
The new Button sampler is not yet tested, in the study2) only a prototype was tested with a different sample flow. But by the manufacturer this sampler follows closely the ACGIH/ISO/NEN criteria.
7-hole personal sampler (UK) Manufacturer : Casella, SKC and JS Holding filter : 25 mm flow rate : 2 l/min Inlet position : front Correction factor : 0 - 0,5 m/s = 1,0 0,6 - 1 m/s = 1,2 Button Aerosol Sampler (US) Manufacturer : SKC. filter : 25 mm flow rate : 4 l/min Inlet position : 360° Correction factor : not tested in EU study CIP10-I personal sampler, incl. pump (F) Manufacturer : Arelco A.R.C. filter : porous foam plug mm flow rate : 10 l/min Inlet position : up Correction factor : 0 - 0,5 m/s = 1,1 0,6 - 1 m/s = 1,15 Closed-face 37 mm polystyrene cassette (SE) Manufacturer : Millipore filter : 37 mm flow rate : 2 l/min Inlet position : below Correction factor : 0 - 0,5 m/s = 1,0 0,6 - 1 m/s = 1,2

Appendix 1 Inhalable dust samplers 2 Version 3 : 20.06.2007
GSP personal sampler (D) CIS sampler Manufacturer : Ströhlein (GSP), BGI CIS) filter : 37 mm flow rate : 3.5 l/min Inlet position : front Correction factor : 0 - 0,5 m/s = 1,0 0,6 - 1 m/s = 1,0 IOM Personal inhalable sampler (UK) Manufacturer : SKC filter : 25 mm flow rate : 2 l/min Inlet position : front Correction factor : 0 - 0,5 m/s = 0,9 0,6 - 1 m/s = 1,0 Open-face 37 mm polystyrene cassette (US) Manufacturer : Millipore filter : 37 mm flow rate : 2 l/min Inlet position : below Correction factor : 0 - 0,5 m/s = 1,15 0,6 - 1 m/s = 1,15 PAS-6 personal sampler (NL) Manufacturer : several manufacturers filter : 25 mm flow rate : 2 l/min Inlet position : front Correction factor : 0 - 0,5 m/s = 1,0 0,6 - 1 m/s = 1,25 PERSPEC personal sampler (IT) Manufacturer : Lavoro e Ambiente filter : 47 or 50 mm flow rate : 2 l/min Inlet position : below Correction factor : 0 - 0,5 m/s = 1,0 0,6 - 1 m/s = - RespiCon Sampler Model 8522 (US) Manufacturer : TSI Inc. filter : 3 x 37 mm flow rate : 3,1 l/min Inlet position : 360° Correction factor : not tested in EU study

Appendix 2 Inhalable dust samplers 1 Version 3 : 20.06.2007
Respirable dust samplers
A sampler of respirable dust should comply with the standardised conventions for health-related sampling of aerosols in workplaces (EN481, ISO 7708).
There are a 7 samplers in use, which comply with this standardisation, they are mentioned in alphabetic order:
CIP10-R personal sampler (France) (incl. pump) Manufacturer : Arelco A.R.C. filter : porous foam plug mm flow rate : 10 l/min Dorr-Oliver10-mm nylon cyclone (US) Manufacturer : e.g Sensidyne BDX 99R filter : 25 or 37 mm flow rate : 1,7 l/min GS Respirable Dust Cyclone (US) Manufacturer : SKC filter : 25 or 37 mm flow rate : 2.75 l/min SIMPEDS-cyclone (UK) Manufacturer : Casella, SKC filter : 37 mm flow rate : 2.2 l/min Respirable Dust Aluminum Cyclone (US) Manufacturer : SKC filter : 25 mm or 37 mm flow rate : 2,5 l/min RespiCon Sampler Model 8522 (US) Manufacturer : TSI Inc. filter : 3 x 37 mm ( 1 filter for the respirable fraction) flow rate : 3,1 l/min Inlet position : 360°

Appendix 3: Date of issue 19-NOV-2001
DETERMINATION OF PVC-DUST ON FILTERS
IHM 007 Page 1 of 5
PURPOSE
This IHM describes the determination of the possible presence of PVC in air.
Scope
Industrial Hygiene Services, Solvay.
authorization
Function Name Signature Date
− Head Analysis Chemical Supplies and Environmental Development
J.L.G. Thus
− Co-ordinator Industrial Hygiene Benelux & UK
J. Smit
− Corporate Industrial Hygienist,DCRT-HSE Brussels
W. Asnong
Definitions and Abbreviations IHM Industrial Hygiene Monitoring QC Quality Control

Appendix 3: Date of issue 19-NOV-2001
DETERMINATION OF PVC-DUST ON FILTERS
IHM 007 Page 2 of 5
1. PRINCIPLE Air, possibly containing PVC, is sampled by leading air through a polycarbonate filter. The amount of air sampled is dependent on the expected concentration, but at least 50 μg PVC should be sampled. The filters will be solved with THF, the PVC will be co-solved with it. After combustion of the solved filter and PVC in a furnace with a capacity of >1000°C, the freed chlorine will be trapped with an alkaline solution. The chloride is trapped into 10 ml water. The amount of chloride in water is determined spectrophotometrically, using commercial analytical kits: Fe3+ Cl- + mercurythiocyanate HgCl2 ↓ + SCN-1 coloured Fe (SCN)3 2. MATERIALS 2.1 Chemicals The following chemicals are used: Sodium hydroxide, 0.1M. Tetra hydrofuran, “Analyzed Reagent”, Baker or equivalent Oxygen Nitrogen 2.2 Miscellaneous Spectrophotometer Dr. Lange ISIS 9000 Dr. Lange chloride test LCK 311 Combustion Furnace, Euroglass, See Appendix 1 Poly carbonate filters, Isopore® Membrane filters, Type 5 μm TmTP, diameter 2.5 cm, cat.no. TMTP02500, Millipore. 3. DETERMINATION OF THE PVC CONTENT ON A FILTER 3.1 Sampling The polycarbonate filters will be mounted on a filter unit and connected to the pump. Depending on the expected concentration and air sampling rate, air will be sucked through the filter until at least 50 μg PVC is expected to be present or should be present with a MAC of 0.5 mg/m3. Hereafter the filter can be stored at ambient temperatures. 3.2. Sample preparation The filters will be transferred into a 10 ml vial and 1 ml THF will be added. The closed vials are placed in an ultrasonic bath for one hour. Pipette 10 ml of the alkaline solution (0.1 M NaOH) into the vigreux trap and close with a glass stopper. After cooling of the combustion “boat”, the THF solution will be transferred into the combustion “boat” of the Euroglas equipment (see appendix 1).
Do not place the stopper on the lid!

Appendix 3: Date of issue 19-NOV-2001
DETERMINATION OF PVC-DUST ON FILTERS
IHM 007 Page 3 of 5
With the lid still open, a stream of nitrogen will be passed over the sample solution for 30 minutes to evaporate the THF. After complete evaporation of the THF the lid wil be closed and the Euroglass combustion furnace will be started with the following parameters:
combustion time, 5 minutes. furnace temperature, 1000ºC. bypass or tracer temperature, 115ºC. flow furnace oxygen, 150 ml/min (18mm). flow bypass oxygen, 10 ml/min (5 mm). flow carrier nitrogen, 70 ml/min (20 mm).
The sample is combusted to hydrogenchloride which will be trapped by the alkaline solution. After combustion the alkaline solution is collected in a vial. From this solution a aliquot of 1.0 ml is transferred into a Dr. Lange LCK311 cuvette. All samples are analysed according to the instructions in “Dr. Lange Kuvettentest LCK311-NL”. Results are displayed in mg Cl¯/liter alkaline solution. The content of chloride in PVC is approximately 57%. 4. FILTER CONTENT The concentration in the alkaline samples is given by the Dr. Lange test in mg/L. The filter was extracted with 1 ml THF and after combustion of the solution, the resulting chloride was finally taken up in 10 ml alkaline solution (see § 3.3). The concentration factor is then 0,01. The amount of PVC on the filter is then: C (mg/L) x 0,01 _____________ X dilution factor = mg/filter 0.57 in which: C = concentration chloride as reported by the photometer in mg/L NaOH solution. 0.01 = volume of alkaline solution (L) 0.57 = correction factor for Cl content in PVC Example: C = 50 mg/L. This originates from 10 ml alkaline solution. The total volume of the filter solution was 1 ml. The content is then: 50 0.01 ___ x ___ = 0.88 mg PVC per filter 0.57

Appendix 3: Date of issue 19-NOV-2001
DETERMINATION OF PVC-DUST ON FILTERS
IHM 007 Page 4 of 5
5. VALIDATION In Table 1 the summarised results of the validation study after photometric analysis are shown. The storage conditions of the spiked filters was ambient temperature, dark. Table 1. Validation results Parameter Results Linear range Dr. Lange test
1-70 mg Cl- per liter (appr. 20 μg – 1300 μg PVC per filter)
Recoveries 280 μg PVC per filter 104.6%, VC= 4.8 % (directly measured) 1280 μg PVC per filter 83.0%, VC= 3.9 % (directly measured) 5220 μg PVC per filter 84.2%, VC= 1.1 % (10-fold dilution)
Storage No degradation of PVC is expected, determination of storage conditions is therefore not relevant.
LOD LOQ (=2.5 x LOD)
20 μg PVC /filter 50 μg PVC /filter

Appendix 3: Date of issue 19-NOV-2001
DETERMINATION OF PVC-DUST ON FILTERS
IHM 007 Page 5 of 5
APPENDIX 1
Combustion apparatus
9
5
6
4
8 3 2
7
11
1
10 Figure 1. Destruction and trapping deployment 1. Furnace 2. Quartz tube 3. Boat/boat inlet 4. Boat inlet controller 5. Temperature and flow controller 6. Furnace temperature, 1000ºC. 7. Tracer temperature, 115ºC. 8. Nitrogen carrier flow regulator, 70 ml/min (20 mm). 9. Furnace oxygen flow regulator, 150 ml/min (18mm). 10. Bypass oxygen flow regulator, 10 ml/min (5 mm). 11. Trap, vigreux type with 10 ml water
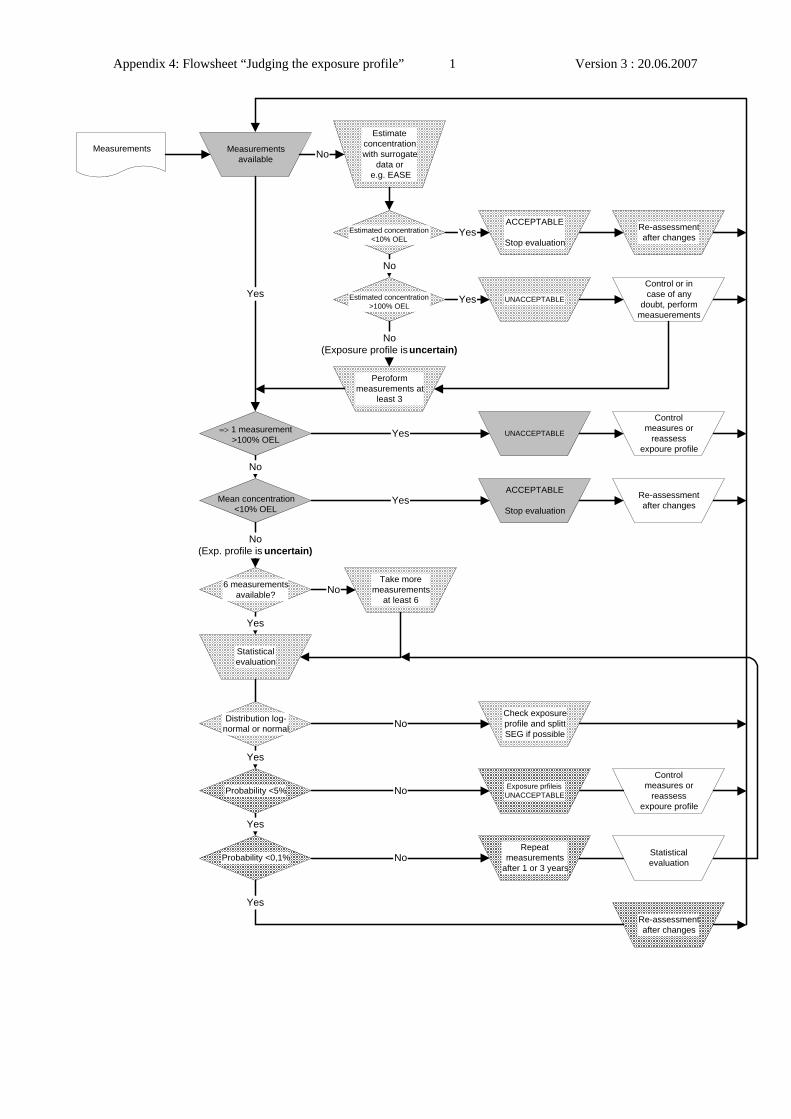
Appendix 4: Flowsheet “Judging the exposure profile” 1 Version 3 : 20.06.2007
Measurements Measurementsavailable
Estimated concentration<10% OEL
Peroformmeasurements at
least 3
Estimateconcentrationwith surrogate
data or e.g. EASE
UNACCEPTABLE
ACCEPTABLE
Stop evaluation
No
No
Re-assessmentafter changes
Yes
Controlmeasures or
reassessexpoure profile
Re-assessmentafter changes
=> 1 measurement>100% OEL
Mean concentration<10% OEL
Yes
Yes
6 measurementsavailable?
No
No(Exp. profile is uncertain)
Take moremeasurements
at least 6No
Statisticalevaluation
Yes
Distribution log-normal or normal
Check exposureprofile and splittSEG if possible
Controlmeasures or
reassessexpoure profile
Repeatmeasurements
after 1 or 3 years
Probability <5%
Probability <0,1%
Re-assessmentafter changes
Yes
Yes
Yes
No
No
No
YesACCEPTABLE
Stop evaluation
Estimated concentration>100% OEL
Control or incase of any
doubt, performmeasuerements
UNACCEPTABLE
No(Exposure profile is uncertain)
Yes
Statisticalevaluation
Exposure prfileisUNACCEPTABLE

Appendix 5: Glossary 1 Version 3 : 20.06.2007
GLOSSARY
ACGIH American Conference of Governmental Industrial Hygienists
CEN Comité Européen de Normalisation
COHYG Coordinateur en Hygiène Industrielle
EN European Norm
HSE Health and Safety Executive
Inhalable the mass fraction of total airborne particles which is inhaled through the nose and mouth
ISO International Organization for Standardization
m/s meter per second
MAC Maximaal Aanvaarde Concentratie (Netherlands)
MAK Maximal Arbeitsplatzkonzentration (Germany)
mg/m3 milligram per cubic meter
NIOSH National Institute for Occupational Safety and Health
OEL Occupational Exposure Limit (United Kingdom and as a common used name)
OSHA Occupational Safety and Health Administration (US)
LOD Limit of Detection
LOQ Limit of Quantitaion
PEL Permissible Exposure Limit (United States, OSHA)
PNOC Particulates Not Otherwise Classified
PPE Personal Protection Equipment
PVC polyvinyl chloride
Respirable The mass fraction of inhaled particles penetrating to the unciliated (alveolar) airways.
SEG Similar Exposure Group
TLV Threshold Limit Value (United States, ACGIH)
TWA Time Weighted Average

Appendix 6: Statistical Evaluation 1 Version 3 : 20.06.2007
STATISTICAL TOOL
A simple but effective statistical tool that is developed by members of the AIHA and is available together with the book3) In this annex an example of statistical evaluation is given.
Example: PVC-dust
The statistical evaluation of 6 personal 8 hours TWA measurements of inhalable PVC in a PVC production plant, see figure 1
The exposure limit of inhalable PVC = 10 mg/m3 TWA 8 hours.
The concentrations are: 4.95, 6.54, 0.25, 3.65, 1.06, 0.95 mg/m3
As described before the following evaluations are important:
• Test for distribution fit: Is the exposure profile log-normal or normal.
• If yes, the percent above the exposure limit (% > OEL) must be less than 5% to be acceptable.
In figure 1 of this Annex the statistical evaluation is shown of the 6 PVC dust measurements.
The distribution fit is = log-normal and normal
Percent above the exposure limit (% > OEL) = 8,174% = unacceptable

Appendix 6: Statistical Evaluation 2 Version 3 : 20.06.2007
Example:
Vinylchloride. The statistical evaluation of 6 personal TWA 8 hours’ measurements of PVC in a PVC production plant.
PLANT ExampleFACTORY PVC productionS.E.G. Travailleurs de ChargementSUBSTANCE PVCPERIOD 2000
OEL DESCRIPTIVE STATISTICS10 Number of samples (n) 6
Maximum (max) 6.54Sample Data Minimum (min) 0.25(max n = 50) Range 6.29No less-than (<) Percent above OEL (%>OEL) 0.000
or greater-than (>) Mean 2.9004.95 Median 2.3556.54 Standard deviation (s) 2.5390.25 Mean of logtransformed data (LN) 0.5653.65 Std. deviation of logtransformed data (LN) 1.2471.06 Geometric mean (GM) 1.7600.95 Geometric standard deviation (GSD) 3.479
TEST FOR DISTRIBUTION FITW-test of logtransformed data (LN) 0.928Lognormal (a = 0.05)? Yes
W-test of data 0.915Normal (a = 0.05)? Yes
LOGNORMAL PARAMETRIC STATISTICSEstimated Arithmetic Mean - MVUE 3.198
LCL1,95% - Land's "Exact" 1.543UCL1,95% - Land's "Exact" 61.886
95th Percentile 13.683UTL95%,95% 178.878
Percent above OEL (%>OEL) 8.174LCL1,95% %>OEL 1.013UCL1,95% %>OEL 35.349
NORMAL PARAMETRIC STATISTICSMean 2.900
LCL1,95% - t statistics 0.812UCL1,95% - t statistics 4.988
95th Percentile - Z 7.076UTL95%,95% 12.311
Percent above OEL (%>OEL) 0.258
Please do not distributeIndustrial Hygiene Statistics
Linear Probability Plot andLeast-Squares Best-Fit Line
1%2%
5%
10%16%25%
50%
75%84%90%
95%
98%99%
-10 -5 0 5 10 15Concentration
Logprobability Plot andLeast-Squares Best-Fit Line
1%2%
5%10%16%25%
50%
75%84%90%95%
98%99%
0 0 1 10 100Concentration
Idealized Lognormal Distribution
AM and CI's95%ile
0
0.05
0.1
0.15
0.2
0.25
0.3
0.35
0.4
0.45
0 10 20 30 40 50 60 70Concentration
Sequential Data Plot
0
1
2
3
4
5
6
7
0 1 2 3 4 5 6 7Sample NumberC
once
ntra
tion