INDUSTRIAL GROWTH PROSPECTS 2010 TO 2015, … · INDUSTRIAL GROWTH PROSPECTS: 2010 TO 2015,...
156
A MACRO-ECONOMIC ASSESSMENT OF THE WESTERN CAPE ECONOMY’S SECTORAL AND INDUSTRIAL GROWTH PROSPECTS: 2010 TO 2015, INCLUDING AN ASSESSMENT OF INTER- INDUSTRY LINKAGES A research report prepared for the Department of Economic Development & Tourism (DEDT), Provincial Government of the Western Cape (PGWC) by P Laubscher 29 June 2011
Transcript of INDUSTRIAL GROWTH PROSPECTS 2010 TO 2015, … · INDUSTRIAL GROWTH PROSPECTS: 2010 TO 2015,...
A MACRO-ECONOMIC ASSESSMENT OF THE WESTERN CAPE ECONOMY’S SECTORAL AND
INDUSTRIAL GROWTH PROSPECTS: 2010 TO 2015, INCLUDING AN ASSESSMENT OF INTER-
INDUSTRY LINKAGES
A research report prepared for the Department of Economic Development & Tourism (DEDT), Provincial Government of the Western Cape (PGWC) by P Laubscher
29 June 2011

Table of Contents
Executive Summary .......................................................................................................................... i
A macro-economic assessment of the Western Cape economy’s sectoral and industrial growth prospects, 2010 to 2015, including an assessment of the inter-industry linkages ............................................................................................................................. 1
Introduction .................................................................................................................................................. 1
Objectives of the research ....................................................................................................................... 2
Methodology ................................................................................................................................................. 2
World economic outlook .......................................................................................................................... 5
Growth........................................................................................................................................................................... 5
Inflation & commodity prices .............................................................................................................................. 8
Currencies .................................................................................................................................................................... 9
South African economic outlook ........................................................................................................... 9
Growth........................................................................................................................................................................ 11
Inflation & interest rates .................................................................................................................................... 15
Balance of payments and the rand exchange rate.................................................................................... 15
Sectoral outlook for the Western Cape economy .......................................................................... 18
Growth & employment, 2000-9 ....................................................................................................................... 18
Employment elasticities ........................................................................................................................................... 25
Growth & employment outlook: 2010-15 ................................................................................................... 27
The regional economy recovers from recession ............................................................................................ 27
Macro-economic parameters................................................................................................................................. 29
Economic growth ........................................................................................................................................................ 31
Employment ................................................................................................................................................................... 33
Exports ............................................................................................................................................................................. 36
Primary sector – overview ................................................................................................................................. 39
Agriculture ..................................................................................................................................................................... 40
Fishing & aquaculture............................................................................................................................................... 44
Secondary sector – overview ............................................................................................................................ 47
Agriculture processing .............................................................................................................................................. 50
Clothing & textiles ....................................................................................................................................................... 55
Craft industries ............................................................................................................................................................. 59

Metals & engineering................................................................................................................................................. 61
Oil & gas ........................................................................................................................................................................... 65
Electronics ...................................................................................................................................................................... 68
Boat building ................................................................................................................................................................. 71
Furniture ......................................................................................................................................................................... 74
Tertiary sector – overview................................................................................................................................. 80
Tourism ............................................................................................................................................................................ 82
Finance & insurance .................................................................................................................................................. 88
ICT ...................................................................................................................................................................................... 91
Call centres/ BPO ........................................................................................................................................................ 94
An assessment of Western Cape inter-industry linkages ........................................................... 99
Backward and forward linkages ...................................................................................................................... 99
GDPR and employment multipliers.............................................................................................................. 103
Concluding remarks/ summary ........................................................................................................ 106
References ................................................................................................................................................ 114
Appendix 1: The BER macro-economic model ........................................................................... 117
Appendix 2: The Quantec RSA Inter-Industry model ............................................................... 117
Appendix 3: The Quantec Western Cape Input-Output model ............................................. 119
Appendix 4: Sector classification in the Western Cape model – 41 sectors ..................... 127
Appendix 5: Suggested classification for forecasts: SIC & DEDT sector definitions reconciled ................................................................................................................................................. 128
Appendix 6: Calculating weighted proxies .................................................................................. 130
Appendix 7: Western Cape sectoral forecast of real GDPR growth: 2005-2015 ............ 134
Appendix 8: Western Cape sectoral forecast of employment growth: 2005-2015 ....... 135
Appendix 9: Western Cape sectoral forecast of real export growth: 2005-2015 .......... 136
Appendix 10: Quantification of inter-industry linkages (backward and forward) ...... 137
List of Figures Figure 1: Real GDP growth ....................................................................................................................................... 12
Figure 2: Real domestic spending during economic upswings ................................................................. 13
Figure 3: Overall balance on the SA balance of payments vs the rand exchange rate ..................... 16
Figure 4: Tendencies on the SA balance of payments ................................................................................... 16
Figure 5: Contribution to Western Cape average annual real GDPR growth, 2000-9...................... 19
Figure 6: Western Cape: Real GDPR and employment growth: 2000-9 ................................................ 22
Figure 7: Western Cape real GDPR growth across sectors: 2000-9 ........................................................ 23
Figure 8: Western Cape employment growth across sectors, 2000-9.................................................... 24
Figure 9: Western Cape: Employment growth per unit of real value added growth: 2000-9 ...... 25
Figure 10: Business confidence levels: Western Cape vs National .......................................................... 27
Figure 11: The Western Cape economy recovers from recession ............................................................ 28
Figure 12: Economic Barometer – Western Cape economy, 2011Q1* ................................................... 31
Figure 13: Western Cape: Average annual real GDPR growth, 2010-2015 .......................................... 32
Figure 14: Western Cape: Average annual employment growth, 2010-2015 ..................................... 34
Figure 15: Western Cape real export growth, 1995 – 2015 ....................................................................... 36
Figure 16: Western Cape: Sectoral contribution to cumulative real export growth, 2000-9 ....... 37
Figure 17: Western Cape: Average real export growth, 2010-15 ............................................................ 38
Figure 18: Composition of the WC primary sector: contribution to real value-add, 2000-9 ........ 39
Figure 19: Western Cape: Primary sector real GDPR growth, 1995 – 2015 ........................................ 39
Figure 20: WC gross farming income (GFI) 2007 R16.6 billion ................................................................ 40
Figure 21: WC real GDPR growth 2005–2015: agri-culture, forestry & fishing ................................. 42
Figure 22: Market channels for aquaculture products ................................................................................. 45
Figure 23: Composition of the WC manufacturing sector: contribution to real value-add, 2000-9
............................................................................................................................................................................................... 47
Figure 24: WC Manufacturing: Contribution to cumulative real GDPR growth, 2000-9 ................ 48
Figure 25: Western Cape: Secondary sector real GDPR growth, 1995–2015 ..................................... 49
Figure 26: WC real GDPR growth 2005–2015: Agriculture processing – food & beverages ........ 52
Figure 27: WC real GDPR growth 2005–15: Clothing & textiles ............................................................... 56
Figure 28: Business confidence (BER survey) .................................................................................................. 57
Figure 29: WC real GDPR growth 2005-2015: Metals & engineering..................................................... 62
Figure 30: Oil & gas industry: Business categories ........................................................................................ 67
Figure 31: WC real GDPR growth 2005-2015: Electronics industry (excl. ICT) ................................. 68
Figure 32: WC boat building support industry: distribution of firms .................................................... 71
Figure 33: WC real GDPR growth 2005-2015: Other transport equipment (incl. boat building) 72
Figure 34: WC real GDPR growth 2005-15: Furniture .................................................................................. 76
Figure 35: Composition of the WC tertiary sector: contribution to real GDPR, 2000-9 ................. 80
Figure 36: WC Tertiary sector: contribution to cumulative real GDPR growth, 2000-9 ................ 81
Figure 37: Western Cape: Tertiary sector real GDPR growth, 1995–2015 .......................................... 82
Figure 38: Number of international arrivals: 1991–2010: WC vs RSA .................................................. 82
Figure 39: SA overseas tourists: Region of residence ................................................................................... 83

Figure 40: WC real GDPR growth 2005-2015: Tourism ............................................................................... 84
Figure 41: WC real GDPR growth 2005–2015: Finance & insurance...................................................... 88
Figure 42: Ernst & Young Financial Services Index ....................................................................................... 89
Figure 43: ICT subsectors, 2011 ............................................................................................................................. 91
Figure 44: WC real GDPR growth 2005-2015: ICT sector ............................................................................ 93
Figure 45: WC real GDPR growth 2005-2015: Business services (incl. BPO) ..................................... 97
List of Tables Table 1: Outlook for world real GDP growth: 2010 to 2012 ......................................................................... 6
Table 2: South Africa – forecasts of key economic variables: 2011-13 .................................................. 12
Table 3: Western Cape real GDPR and employment growth: 2000 to 2009 (yoy % change) ...... 20
Table 4: WC agriculture, forestry & fishing (constant 2005 prices) ....................................................... 40
Table 5: Input-output relationships of the WC agriculture sector – 2008 basic values (Rm) ...... 43
Table 6: WC food & beverages – agriculture processing: 2007–15 (constant 2005 prices) ......... 50
Table 7: Input-output relationships of the WC food processing sector – 2008 basic values (Rm)
............................................................................................................................................................................................... 53
Table 8: Input-output relationships of the WC beverage & tobacco sector – 2008 basic values
(Rm) .................................................................................................................................................................................... 53
Table 9: WC clothing & textile sector: 2007-15 ............................................................................................... 55
Table 10: Input-output relationships of the WC textile sector – 2008 basic values (Rm) ............. 58
Table 11: Input-output relationships of the WC clothing sector – 2008 basic values (Rm) ......... 58
Table 12: WC broad metals & engineering sector: 2007-15 ....................................................................... 61
Table 13: Input-output relationships of the WC metal products sector – 2008 basic values (Rm)
............................................................................................................................................................................................... 64
Table 14: WC electronics industry (excl. ICT) 2007-15................................................................................ 68
Table 15: Input-output relationships of the WC electronics (proxy) sector – 2008 basic values
(Rm) .................................................................................................................................................................................... 70
Table 16: Input-output relationships of the WC other transport equipment (incl. boat building)
sector – 2008 basic values (Rm) ............................................................................................................................. 73
Table 17: WC furniture sector: 2007-15 ............................................................................................................. 75
Table 18: Input-output relationships of the WC furniture sector – 2008 basic values (Rm) ....... 78
Table 19: Input-output relationships of the WC tourism (proxy) sector – 2008 basic values (Rm)
............................................................................................................................................................................................... 87
Table 20: Input-output relationships of the WC finance & insurance sector – 2008 basic values
(Rm) .................................................................................................................................................................................... 90
Table 21: WC ICT sector (proxy): 2007-15 ........................................................................................................ 92

Table 22: Input-output relationships of the WC ICT (proxy) sector – 2008 basic values (Rm) .. 93
Table 23: Input-output relationships of the WC business services sector – 2008 basic values
(Rm) .................................................................................................................................................................................... 98
Table 24: Classification of backward and forward linkage results for the WC economy ............. 101
Table 25: Classification of WC industries i.r.o. their ‘induced effect’ multipliers ............................ 102
Table 26: Classification of WC sectors’ economy-wide GDPR and employment multipliers* .... 105
Table 27: Schematic layout of a two region input-output table .................................................................. 125
Table 28: SA Tourism expenditure by product, 2008 ................................................................................. 131
List of Abbreviations AEs: Advanced economies
AISA: Aquaculture Institute of South Africa
BER: Bureau for Economic Research
BFAP: Bureau for Food & Agricultural Policy
BPO: Business Process Outsourcing
CCDI: Cape Craft & Design Institute
CITI: Cape Information Technology Initiative
COGSI: Cape Oil & Gas Supply Initiative
CPI: Consumer Price Index
CSP: Community, Social and Personal services
CTBi: Cape Town Boatbuilding Initiative
CTICC: Cape Town International Convention Center
CTRU: Cape Town Routes Unlimited
DEDT: Department of Economic Development and Tourism
ECB: European Central Bank
EMs: Emerging economies
EU: European Union
FAO: Food & Agriculture Organization
GDE: Gross Domestic Expenditure
GDP: Gross Domestic Product
GDPR: Gross Domestic Product Regional
GVA: Gross Value Added
ICT: Information & Communications Technology
IMF: International Monetary Fund
LSM: Living Standards Measure

MEDS: Micro-Economic Development Strategy
MENA: Middle East & North Africa
NCA: National Credit Act
NTIP: National Tooling Initiative Program
OECD: Organization for Economic Cooperation & Development
OEM: Original Equipment Manufacturers
PERO: Provincial Economic Review and Outlook
PGWC: Provincial Government of the Western Cape
RSA: Republic of South Africa
SA: South Africa
SACU: South African Customs Union
SAGOA: South African Oil & Gas Alliance
SARB: South African Reserve Bank
SIC: Standard Industrial Classification
SPV: Special Purpose Vehicle
StatsSA: Statistics South Africa
TASA: Tooling Association of South Africa
TSA: Tourism Satellite Account
WC: Western Cape
WCFI: Western Cape Furniture Initiative

i
Executive Summary
Introduction. The Department of Economic Development & Tourism (DEDT), Provincial
Government of the Western Cape (PGWC) identified a need to analyse and assess the Western Cape
economy from a macro-economic perspective. The current study is a response to this need. The
study was conducted in order to obtain a real sense of the (relative) growth potential of the various
industries and the input-output modelling infrastructure was also utilised to investigate the region’s
inter-industry linkages.
The methodology followed was to feed the Bureau for Economic Research’s (BER’s) 5-year forecast
for the expenditure side of the SA economy into Quantec’s Inter-industry and Western Cape Input-
Output models. An attempt was made to reconcile the standard industry classification with the DEDT
working definitions as followed in the MEDS. The resultant projections were judgementally adjusted
where hands-on industry information/ desk research dictated that. The forecast results in respect of
the Western Cape economy, including more detailed discussions of key industry outlooks and
linkages, were presented in the main section of the report.
International economy. Whilst the anticipated shape and length of the ensuing business cycle
remains uncertain, it seems clear that the global, national and regional economies have all
embarked on a recovery from what is being described as the Great Recession (2008/9). At the global
level the recovery is characterised by a two speed expansion, with advanced economies (AEs)
expected to grow by a relatively modest 2.5% per annum and emerging market economies (EMs) by
6.5% per annum over the short to medium term. The major challenge for AEs is to exit their
stimulatory macro-economic policy stances (read: tighter national budgets and higher interest rates)
and for EMs to strike pre-emptively at nascent inflationary pressures, not only due to cost-push
factors (food and energy prices), but also due to overheating elements in some developing
economies (e.g. China). At the time of writing global economic forecasts were being scaled down
somewhat in respect of 2011, mainly as a result of the impact of the Japanese earthquake and
tsunami (March 2011) and the drag from the higher oil price. Global inflation is on the rise, albeit
that much slack remains in the AEs. The ECB already commenced with its normalisation of interest
rate levels and in the USA this is expected over the short term. The US dollar remains weak and is
likely to remain so in view of the US’s precarious fiscal position, which is only projected to unwind
slowly.
Provided relatively slow growth in the AEs, combined with a bullish commodity outlook,
international capital flows to commodity-based economies are expected to remain lively. The risk

ii
here is a harder landing in EMs. Other global economic risks, which have tended to intensify in
recent months, include possible debt restructuring in southern European sovereigns (e.g. Greece),
fiscal policy-related events in AEs, and political unrest in the MENA region, with its attendant
implications for the international oil price. Uncertainty is a hallmark of the global economy following
the financial crisis.
South African economy. In view of this global outlook, the domestic and regional economic
outlooks are somewhat uncertain. However, it seems that the specific constellation of global forces
dictates an economic environment where the rand exchange rate is likely to remain relatively strong
with no end in sight of potential volatility. This is negative for the tradable goods sectors, whilst the
tertiary sectors tend to benefit from lively domestic demand conditions, stimulated by the positive
income effects tied to a favourable terms of trade and low inflation and interest rates. It is
somewhat worrying that the initial phase of the economic recovery is dominated by the consumer,
with business confidence and fixed investment expenditure lagging and therefore employment
creation. In the absence of more meaningful fixed investment expenditure of the labour absorbing
kind, the sustainability of the business cycle upswing comes into question.
South Africa’s real GDP growth rate is projected to accelerate from 2.8% in 2010 (i.e. the first
calendar year of economic recovery, to around 3.5% in 2011 and 4-4.5% over the medium term. In a
different global economic climate and with a less robust domestic fixed investment prospect, this
outlook does not compare well with the high growth achieved over the 2004-7 period (5.2% per
annum); however, should be slightly above trend economic growth. Inflation is projected to
accelerate over the short term and possibly breach the upper range of the inflation target towards
the end of the year; however, is projected to remain inside but close to the upper 6% range of the
inflation target over the medium term. In the absence of unexpected shocks, prime interest rates
are projected to increase by 300 basis points (end 2011-13). The current account deficit on the
balance of payments is projected to increase from 2.8% in 2010 close to 6% in 2013/14.
Western Cape economic outlook. In the Western Cape, the tertiary sectors are again leading the
economic recovery and benefit from the macro-economic conditions (favourable terms of trade,
strong currency, low inflation and interest rates and a buoyant domestic market). Whilst this
represents a continuation of the structural trend in the regional economy, it runs counter to the
PGWC’s stated objective to stimulate semi- and unskilled labour intensive manufacturing activity.
The regional manufacturing sector has shed jobs on a large scale over the past decade and this
tendency needs to be arrested should the province want to achieve its socio-economic objectives
premised on poverty alleviation. This does not mean the tertiary sectors must be neglected, as the

iii
growth of these sectors is employment elastic, e.g. business services (including BPO) contribute and
have shown strong employment growth; wholesale & retail, catering & accommodation and tourism
are all responsive in terms of employment creation in a growing economy. However, special efforts
are required regarding the manufacturing industries, faced not only by an adverse track record, but
relatively hostile macro-economic conditions. Ultimately the tertiary industries are derived
industries, which imply that should the primary and secondary industries struggle, it will spin-off on
the tertiary sectors as well.
Sectoral growth pattern, 2000-9. The Western Cape economy has out-performed the national
economy, growing by 4.3% per annum versus 3.6% per annum over the period 2000 to 2009;
however, labour absorption in the region was poorer compared to national. The overall
employment elasticity for the regional economy is 0.28 compared to 0.40 for national; both ratios
are low, but especially true for the Western Cape economy. This state of affairs results from the
following tendencies in the regional economy:
Firstly, the high-growth sectors (7-9% real value-added growth) in the province (e.g. finance
& insurance, construction, communication; furniture, other transport equipment, including
boat building) are poor labour absorbers; furniture, leather & footwear and the automotive
sectors grew strongly and actually shed jobs on balance over the 2000s. It follows that for
these sectors favourable economic conditions are required only to maintain their work
forces, if at all.
Secondly, the leading employment creating sectors (e.g. the broad community, social &
personal services sector, the trade sector, electricity, mining, transport & storage and
tourism) exhibited relatively moderate growth rates (2-4% in real terms), i.e. the
employment creating sectors tend to be moderate to average growers. The business
services and ICT sectors are exceptions to this rule, showing both strong growth (5-8%
range) and meaningful job growth (2-5% per annum).
Thirdly, a whole range of primary and secondary industries shed jobs despite the relatively
lively general economic conditions over the biggest part of the 2000-9 period. This group is
led by the job-shedding that occurred in the agricultural and clothing & textile sectors; other
sectors included here are non-metal minerals, electronics, food & beverages, petro-
chemicals (all exhibiting below-average growth) and furniture, leather & footwear and
automotive (exhibiting high growth). These tendencies point to a higher degree of capital
intensity in most of the region’s primary and secondary industries.

iv
The outperformance of the Western Cape economy in terms of real GDPR growth is explained by the
strong contribution to growth made by the broad financial and business services sector, growing by
6.5% per annum and creating jobs at a rate of 3.8% per annum (with all the job growth accounted
for by the business services subsector). This sector, as well as the wholesale, retail, catering &
accommodation sector (including tourism), remain the mainstay of the regional economy; the trade
sector grew by 4.2% per annum and created jobs at a rate of 3.2% per annum. Transport, storage &
communication also made a significant contribution (3.9% per annum real GDPR growth and 1.7%
per annum employment growth) as did community, social & personal services (2.6% and 3.2%
respectively). The contribution by the manufacturing sector is also substantial (explaining close to
10% of the cumulative growth in the province over the 2000s); however, this is mainly due to its size
as the growth was anaemic (2.3%) and jobs were shed at a rate of 1.5% per annum.
From an employment perspective, the large job shedders were agriculture, forestry & fishing
(accounting for close to 50% of job losses in the province over the 2000s) and manufacturing
(accounting for 17% of the job losses). Within the manufacturing sector, clothing & textiles, leather
& footwear, furniture, electronics, and non-metal minerals were the leading job shedders as noted
above; the food & beverage subsector, automotive and petro-chemicals also shed jobs on balance,
however, only marginally so.
Industry outlook for the Western Cape economy, 2010 to 2015. A range of economic
indicators is conclusive that the regional economic recovery was well-established by the first quarter
of 2011. The recovery commenced during the third quarter of 2009 and has been led by improving
business conditions in the tertiary sectors, i.e. the mainstay of the Western Cape economy.
However, at the time of writing manufacturing conditions improved more meaningfully; it is only the
building & construction sector clearly lagging the economic recovery. Real GDPR growth is projected
to continue recovering, from an estimated 2.7% in 2010 to 3.9% in 2011 and between 4-4.5% over
the medium term, averaging 4% over the 2010-15 period. While the region’s outperformance of the
national economy is projected to continue, the margin of outperformance may decline and the level
of growth is likely to be well below that over the 2004-7 period. The province is faced with a
different global economic environment and its leading growth industry, i.e. financial services, is
unlikely to repeat its spectacular growth over the 2000s.
Considering the sectoral picture forecast over the 2010-15 period, three groups of industries are
identified, namely the high-growth sectors, the medium/ average growth sectors and the low-
growth sectors. It needs to be emphasised the sectors classified in this way include only those for
which real value added growth rates could be quantified; there are a number of smaller industries

v
growing rapidly off a low base for which growth projections could not be quantified and are
discussed qualitatively in the report (see below). Furthermore, the quantification of the growth
prospects was conducted for 26 industry groups, more or less at a 2-digit SIC level, including an
attempt to come closer to the DEDT’s working classification of industries – see Appendix 5. This
included the calculation of proxy sectors and growth rates (see Appendix 6).
The high-growth sectors, projected to grow between 4.4% and 8% per annum (2010-15),
include: communication (8%); finance & insurance (6%); ICT (5.5%); furniture (5.3%);
automotive (5.1%); other transport equipment (incl. boat building) (5.1%); construction
(5%); leather products & footwear (4.5%); and tourism (4.4%).
The medium/ average growth sectors, projected to grow by between 3% to 4.3% per annum,
include: metals & engineering (4.3%); electronics (4.2%); other manufacturing industries
(4.2%); petro-chemicals (4.1%); wholesale, retail, catering & accommodation (3.8%);
transport & storage (3.4%); business services (3.4%); other CSP services (3.2%); and
electricity (3.1%).
The low-growth sectors, i.e. subsectors projected to grow by less than 3% per annum are:
food & beverages (2.8%); agriculture, forestry & fishing (2.3%); government (2.1%); clothing
& textiles (1.9%); medical & health services (1.3%); wood, paper, printing & publishing (1%);
non-metal minerals (0.9%); and mining (-0.7%).
In terms of projected employment growth, a similar grouping of industries can be made. Whilst the
forecast employment growth rates tend to be optimistic compared to the 2000-9 history, the
emphasis should be on the relative employment performance rather than the absolute levels of the
projected growth.
The high employment growth sectors, with employment expanding at rates between 2.5%
and 3.5% are: automotive (3.1% per annum, 2010-15); business services (excl. ICT) (2.8%);
tourism (2.7%) and wholesale, retail, catering & accommodation (2.5%). The fast projected
employment growth for the automotive sector is surprising in view of the historical
experience, but could be linked to an optimistic export assumption.
The average-growing sectors in terms of employment are ICT (1.8%); other manufacturing
industries (1.6%); government (1.4%); medical & health services (1.3%); agriculture (1.3%);
metals & engineering (1%); other transport equipment (incl. boat building) (0.8%);
electronics (0.8%) and other CSP services (0.8%).

vi
Low job growth sectors include communications; wood, paper, printing & publishing; finance
& insurance, furniture, food & beverages and petro-chemicals and zero growth in the case of
construction. The work forces in these latter-mentioned subsectors are essentially projected
to remain stable. Subsectors projected to marginally shed jobs over the medium term
include: electricity & water supply, non-metal minerals, transport & storage, mining and
leather products & footwear. In the clothing & textiles sector job shedding is projected at a
rate of 2% per annum. As noted in the report, key policy intervention initiatives may prove
these projections, informed by the historical trends and relationships, overly pessimistic.
Regarding exports, the projected real growth (5.2% per annum, 2010-15), is likely to be below that
achieved over the 1995-2009 period (5.9%) and particularly over the 2000-7 period (6.8%). Demand
conditions abroad, particularly in the AE’s, are projected to be less robust compared to the 2000s.
Furthermore, the domestic macro-economic environment (read: buoyant domestic market and a
strong rand exchange rate) shaping up again may dictate against strong export growth. While the
agriculture and food (and beverages) processing sectors are likely to remain the mainstay of regional
exports, in terms of projected growth rates, leading the pack are:
The high export growth sectors, namely automotive (10.3% per annum); communications
(9.5%); metals & engineering (8.6%); agriculture (8.1%); electronics (7.8%) and business
services (including BPO) (7.4%).
Medium export growth sectors include: transport & storage (6.3%); electricity (6.3%); leather
products & footwear (6.3%); medical services (6.2%); tourism (6.2%); other transport
equipment (5.5%); other CSP services (4.9%); ICT (4.9%); petro-chemicals (4.8%) and
wholesale/ retail (4%).
Low export growth sectors include: furniture (3.1%); finance & insurance (2.3%); mining
(2.3%); food & beverages (1.7%); non-metal minerals (1.1%); and wood & paper (0.4%).
Clothing & textile exports are projected to contract by 3.3% per annum over the forecast
period. It needs to be emphasized, while food & beverages export growth is projected at a
relatively low level, this remains the province’s leading export sector in terms of size.
Finally, not appearing in these growth statistics, are the stellar performances of a number of small
industries, growing off a small base, but with huge potential (as discussed in the report). Included
here are the aquaculture industry, the (upstream) oil & gas subsector; boat building; crafts and call
centres/ BPO. Other sectors, which have been identified by DEDT but not discussed in this report,
vii
include arts & culture and film making. Whilst small, these industries all make an important
contribution to the growth and development of the Western Cape economy.
Inter-industry linkages. One of the novelties of input-output analysis is the fact that it facilitates
an analysis and understanding of the inter-connectedness of industries, both in a vertical and
horizontal dimension. The analysis of the growth outlook was complemented by an analysis of (the
intra-regional) forward and backward linkages (focussing on intermediate sales and supply) and
(value added and employment) multipliers (which includes the induced effects when the household
sector is made endogenous in the model). The following results emerged:
Regarding backward and forward linkages, the analysis revealed somewhat mixed results: the
relatively long list of generally independent manufacturing industries (with one or two services
sectors, e.g. other CSP services, catering & accommodation and communication) contrasts with
an equally long list of strong backwardly linked manufacturing industries, some with strong
forward links (e.g. beverages and petroleum products) and a list of services industries with
strong forward linkages (e.g. business services, finance & insurance, wholesale & retail, transport
& storage and government). Agriculture, forestry & fishing also reveal strong forward linkages.
Only the food, automotive and medical & health services sectors reveal both strong backward
and forward linkages.
Regarding the value-added and employment economy-wide multipliers, the analysis has shown a
long list of mainly manufacturing industries, which are relatively unresponsive in terms of value-
added and employment; the exceptions are food and plastic products in terms value-added and
furniture, clothing, leather products and textiles in terms of employment. The whole range of
services industries exhibit above average value-added multipliers; however, some combined
with weak employment responsiveness (e.g. finance & insurance, medical & health services,
business services, transport & storage and communication) and a few with above average
employment responsiveness (e.g. other CSP services, government, wholesale & retail and
catering & accommodation).
Concluding remarks. In all, the structural trend over the past decade in the Western Cape, namely
a rising contribution by the tertiary sectors of the regional economy, is expected to continue. The
province has a revealed comparative advantage in a number of these sectors (e.g. finance &
insurance, business services, wholesale & retail and tourism) and the macro-economic environment
is expected to benefit these sectors. For the most part these services sectors are dependent on
inter-industry sales, have strong links with the household sector and other provinces.
viii
In addition to the favourable prospects in the tertiary industries, the outlook for agriculture, forestry
& fishing and the food processing cluster appears promising from a price perspective and global food
shortages, with new opportunities opening up in South Africa’s trade with developing countries
(such as China and India). The food value chain is a well-connected industry, albeit that the
agriculture sector has disappointed from a growth and employment perspective.
Finally, while manufacturing prospects remain sub-par, there appears to be serious intent, both from
national and provincial government, to arrest the under-performance of a number of industries. The
analysis has shown some mixed results in respect of the regional manufacturing sector inter-industry
linkages, with a (somewhat surprisingly long) list of generally independent industries and industries
exhibiting below average value-added and employment multipliers, which tend to disqualify these
industries from receiving policy support. However, it should be emphasised that the current analysis
is of a cursory nature and aims to complement the existing MEDS research and any further research
required. There is also a relatively long list of strong backwardly linked secondary industries and
industries with above-average employment multipliers, which require the attention of the policy
authorities.
Pieter Laubscher1
Independent Economist
29 June 2011
1 I would like to acknowledge and am indebted for the guidance and inputs of Prof Philip Black (CER) and Claude van der Merwe
(Quantec Research).

1
A macro-economic assessment of the Western Cape economy’s sectoral and industrial growth prospects, 2010 to 2015, including an assessment of the inter-industry linkages
Introduction
The Western Cape regional economy is situated in the national and global economies. It is true that
the macro-economic context in which the regional economy grows and prosper exercises a
determining influence on the performance of the Western Cape economy. It is also true that this
macro-economic context changes over time and this change can be dramatic, both from a cyclical
and a structural point of view. Firstly, there are structural changes to consider at the global, national
and regional levels and, secondly, there is the issue of cyclical change. An assessment of the growth
potential of regional industries has to be located within this dynamic context.
The Department of Economic Development & Tourism (DEDT), Provincial Government of Western
Cape (PGWC) has identified a need to analyse and assess the Western Cape economy from a macro-
economic perspective in order to come to grips with the sectors and industries in the region
displaying high growth and/or potential to grow. In conjunction with the vast micro-economic
research that has been undertaken in the Micro-Economic Development Strategy (MEDS) project,
such a macro-economic assessment of regional growth prospects, where the emphasis is to come as
close as possible to the DEDT’s ‘working’ industry classification, could be useful in informing policy
interventions.
As changes in the macro-economic environment can exercise substantial influences on the economic
performance of businesses over the short to medium term, it is useful to periodically assess the
macro-economic prospects and how the bigger picture translates to and impact on the outlook for
individual industries and businesses.
The current report sets out outlining the international (first section) and national economic outlooks
(second section) before the focus moves to the regional economy (third section). In the third and
main section of the report, the implications of the global and national economic trends for the
regional industries are considered. First an analysis is conducted of the historical growth trends
(2000-9) in respect of GDPR growth, employment and exports. Secondly, the sectoral outlook (2010-
15) in respect of GDPR growth, employment and exports is considered, including an assessment of
the current cyclical state of the regional economy.
The general economic outlook for the primary, secondary and tertiary sectors of the province are
considered respectively. Within each of these broad categories, a template is constructed for
2
individual industries that have been identified by DEDT and the previous work done in terms of the
MEDS research. Each industry template contains data relating to the growth and employment of the
industry/ subsector, the main growth drivers, exports and including a brief outlook, as well as a
consideration of key constraints/ challenges faced by the industry/ subsector. The final section of
each industry template contains a brief analysis of the forward and backward inter-industry linkages.
The report ends with some concluding remarks and a summary of the main findings.
Objectives of the research
The central objective of the study is to assess the region’s industrial growth prospects across
industry groups as identified by the DEDT of the Provincial Government of the Western Cape (PGWC)
in order identify fast-growing industries. From one perspective, the study translates the implications
of the global and national economic outlooks for the regional economy at the sectoral level.
However, it also draws on ‘bottom-up’ information obtained by way of desk research in respect of
the individual industries/ sectors. The primary objective is to arrive at an assessment and five-year
forecast of each identified individual industry/ subsector in the Western Cape economy. A
secondary objective is to outline the inter-industry linkages of each industry/ subsector considered.
A novelty of the study is the fact that the sector definitions attempt to correspond with that of
DEDT’s working definitions, e.g. including an assessment of the tourism and ICT subsectors.
The proposed work was completed in three phases: during the first phase of the project a
preliminary sectoral forecast (2011-15) was prepared (the methodology and technical aspects
relevant to this stage are explored below and in the relevant Appendices); during the second phase
the forecasts were refined and finalized and written up in a report (and reproduced in the current
report); and during the third stage the inter-industry linkages were investigated to conclude with a
comprehensive and final research report.
Methodology
The first step in the first phase of the study was to come to grips with the macro-economic outlook
over the next five years. To this end, the BER five-year macro-economic forecast for the South
African economy (Economic Outlook, April 2011) and its short-term forecast (Economic Prospects,
2011Q2), were sourced, studied and prepared for input into the Quantec Inter-Industry model. The
macro-economic forecasts of the National Treasury and Reuters Consensus (2011 to 2014) were also
consulted.
The second step in the first phase of the study was to derive sectoral projections at the national
level. The expenditure variables of GDP (i.e. the demand side of the economy, contained in the BER

3
forecast) were fed into the Quantec Inter-Industry model in order to derive sectoral projections (i.e.
the supply side of the economy) of, inter alia, GDP, employment, exports and imports. The sectoral
output was disaggregated into 41 industry groups (see below).
In the third step of the first phase of the study, Quantec’s expanded (and existing) input-output
modelling infrastructure was utilised to generate a regional forecast for the Western Cape by sector.
The model projections were evaluated and adjusted where necessary in an iterative process
informed by extensive desk research, including in-depth interviews with Western Cape sector
specialists. Generic explanations of (1) the BER macro-econometric model used to generate the 5-
year forecast, (2) the Quantec Inter-industry model and (3) the Quantec Western Cape model are
provided in the relevant Appendices at the end of the report.
A standard sectoral forecast for the Western Cape economy already exists (see PERO, 2010). A key
challenge of the first phase of the project was to recalibrate the process in order to arrive at a
sectoral forecast which contains the industry groups as identified by MEDS/DEDT for the Western
Cape. The aim was to develop the existing modelling infrastructure further in order to generate
alternative industrial sector definitions in line with DEDT’s working industry definitions. Appendix 5
shows a reconciliation of the standard industrial classification (SIC) and the DEDT working sector
definitions, which guided the current study.
In order to adjust the forecast in terms of the standard classification of industries, a two-step
process was followed:
Firstly, the regional model was expanded to generate forecasts at a more disaggregated
level, i.e. 41 sectors instead of 26 as contained in the PERO forecast. A list of these 41
sectors is provided in Appendix 4.
Secondly, the forecasts of GDPR for the 41 sectors were then adjusted in one of three ways
to arrive at the 26 forecast sectors listed in Appendix 5, page 1282:
o Simply maintained if the definitions matched, e.g. agriculture; mining; motor
vehicles, parts & accessories; other transport equipment (incl. boat building);
furniture; other manufacturing industries; construction; finance & insurance;
medical & health services and government.
o Or sub-sectors were simply combined where the aggregate corresponded with the
suggested (DEDT) forecast definition if a priority sector or otherwise, e.g.
2 Please note that some of these sectors are DEDT non-priority sectors; however, forecasts were generated and included.

4
agriculture-processing (food and beverages)3; clothing & textiles; leather products &
footwear; wood, paper, printing & publishing; petroleum products, chemicals,
rubber & plastic; glass products & non-metal minerals; metals & engineering and
electricity & water supply.
o Or, in the case of some sectors, weighted proxies – corresponding with the DEDT
definition – were calculated, e.g. electronics; tourism and ICT. The method/research
used in order to calculate these proxies is discussed in Appendix 6, page 130. These
sectors were therefore combined across other sub-sectors (see Appendix 5); in
order, for the total over all sectors to add up, the shares of the proxies had to be
excluded, giving rise to new definitions of the SIC, e.g. wholesale, retail, catering &
accommodation (excl. tourism); transport & storage (excl. tourism); communication
(excl. ICT); business services (excl. ICT) and community, social & personal service
(excl. tourism).
The following DEDT priority sectors were not modelled as they were too disaggregated: aqua-
culture; crafts; oil & gas; call centres & BPO; film making; and arts & culture. Except for the latter-
mentioned two sectors, these sectors were studied on an individual basis during the second and
third phases of the project. Boat-building is also not forecast directly; however, the ‘other transport
equipment’ sub-sector can be used as a proxy in this regard.
During the second phase of the project, the assumptions and industry projections were refined and
finalised and the results were written up (and reproduced here). The third phase of the project,
involved the determination and outlining of the sectoral backward and forward linkages at the
regional level. For those industries included in the modelling, the derivation of the relevant
backward and forward linkages is a straightforward mechanical exercise where the relevant input-
output/ technical coefficients determine the respective linkages. Where modelling was not possible
recourse to other available research was taken.
3 It needs to be pointed out that a measure of approximation was allowed regarding industry/sector definitions as the current study is
concerned with growth trends. The aggregated food and beverage sector is not strictly defined as the agriculture processing industry; however, in a modeling context such approximation was thought to be acceptable; similar comments apply to the broad metals and engineering sector, assumed in the study to be approximated by the metals, metal products and machinery sector. For more detail, see Appendix 4, page 85.
5
World economic outlook
In its January 2011 update of the world economic outlook, the IMF stated that the 2009 contraction
of global economic activity was milder than expected and that the recovery momentum through
2010, particularly during the second half of the year, evolved somewhat stronger compared to
expectations. While substantial slack remains in the advanced economies (AEs), with lingering
unemployment, the economic recovery is well established; in the emerging economies (EMs) growth
has rebounded to pre-crisis levels, amidst signs of overheating in some economies.
The fact of the matter is that the world economy is moving beyond the Great Recession, sparked by
the onset of the 2007/8 financial crisis in the US subprime market. Current expectations are that the
recovery is set to continue, albeit not without attending risks – real GDP growth of around 2.5% per
annum is foreseen in the AEs (2011-12), while growth in excess of 6% per annum is forecast for EMs.
The IMF did not revise this forecast in its April 2011 World Economic Outlook; however, since
January the risks have intensified (see below). While growth is projected to be below par in the AEs,
the heartening development of recent months is the fact that the US and – to a lesser extent – the
Euro area are moving beyond the financial crisis as the financial institutions gradually return to
business as usual. Apart from the financial troubles in the Euro area periphery (and financial sector
solvency issues in the core European countries), financial conditions are more stable and should
continue to improve according to the IMF. However, the IMF did adjust its inflation forecast
noticeably upwards.
Growth
The consensus forecast for global growth during 2011/12 is around 4.5% per annum; however, we
have a two-speed recovery – as noted, much slack remains in the AEs with real GDP forecast to
expand around 2.5% per annum; in contrast, the growth momentum in EMs has picked up to pre-
crisis levels around 6.5% and expected to continue. Table 1 shows the forecast growth rates for
individual countries and regions, 2011/12. At the time of writing global economic forecasts were
being scaled down somewhat in respect of 2011, mainly as a result of the impact of the Japanese
earthquake and tsunami (March 2011) and the drag from the higher oil price.
An outstanding characteristic of the growth pattern in the AEs, is the expansionary monetary and
fiscal policies that prepared the way for the economic recovery. A central challenge for the AEs will
be the exit of these stimulatory policy stances. In terms of sequencing, the expectation is that fiscal
consolidation needs to happen first and in time the normalisation of interest rate levels. Fiscal
consolidation is much stronger in force in the Euro area periphery (beset by sovereign debt
problems), for instance, compared to core European countries and – for that matter – the USA,

6
where the latest moves have tended to be additional stimulus (e.g. the extension of the Bush tax
cuts, announced in December 2010 – see footnote). Monetary policy also remains – and according
to the IMF, should remain – stimulatory; core-inflation is not a problem (in the USA at 1.5%; Euro
area 1.1%) given the lingering output gaps and high rates of unemployment; inflation expectations
are also well-anchored. Fiscal consolidation in the AEs will be an enduring theme on the global front
and is the main reason why economic growth is forecast to moderate over the short term. The ECB
has already commenced the process of normalising interest rates due to the cost-push inflationary
effect of the increase in energy and food prices.
Table 1: Outlook for world real GDP growth: 2010 to 2012
2009 2010 2011F 2012F
Advanced economies (AEs) -3.4 3.0 2.4 2.6 USA -2.6 2.8 2.8 2.9 Euro area -4.1 1.7 1.6 1.8 Japan -6.3 3.9 1.4 2.1
Emerging economies (EMs) 2.7 7.3 6.5 6.5 Central & Eastern Europe -3.6 4.2 3.7 4.0 CIS -6.4 4.6 5.0 4.7 Developing Asia 7.2 9.5 8.4 8.4 China 9.2 10.3 9.6 9.5 India 6.8 10.4 8.2 7.8 Latin America -1.7 6.1 4.5 4.1 Middle East & North Africa 1.8 3.8 4.1 4.2 Sub-Sahara Africa 2.8 5.0 5.5 5.9
World real GDP -0.5 5.0 4.4 4.5
Source: IMF World Economic Outlook, April 2011
The household sectors in the USA and Euro area absorbed serious knocks during the recession and
are only now emerging from it; business fixed investment is also recovering driven by improved
profitability. However, while these developments on the expenditure side of the economy should
assist in closing the output gaps, a lengthy period of fiscal consolidation (the US budget deficit
measures in excess of 10% of GDP) is likely to exert an opposing influence for some time to come.
The financial systems of the US and Europe also need to be repaired and reformed while Japan has
reached the limits of fiscal sustainability. The short- to medium-term outlook is therefore for sub-
par economic growth in the major AEs – USA around 3% per annum; Euro area 1.7-2.5%; Japan 1.8%.
While the emerging and developing economies were affected by the sharp contraction of economic
activity in the AEs (-3.4% in 2009), the growth momentum in many of these economies (led by China,
India and East Asia and followed by Australia, Latin America and Africa) remained positive.
Developing Asia registered a 7% real GDP growth rate in 2009 according to IMF calculations (China
9.2% and India 6.8%), Latin America contracted by a mild 1.7% and sub-Sahara Africa continued to
grow by 2.8%. Most EMs rebounded strongly in 2010. Real economic growth in China and India re-
accelerated to above 10%, with these economies exerting a positive influence on commodity

7
markets. Commodity producing developing economies benefited from the associated positive terms
of trade effects tied to the sharp increase in commodity prices over the past year, as well as strong
capital inflows, which boosted the domestic demand components of these economies. The IMF
notes that signs of overheating have emerged in a number of EMs, which calls for a tightening of
economic policies. The IMF remains optimistic regarding the outlook for EM growth over the short
term, forecasting 6.5% real GDP growth during 2011/12; the corresponding forecast of the Sub-
Sahara region is 5.5% and 5.9% respectively.
The following risks are identified and have intensified in recent months:
While the sovereign debt and financial troubles in the European periphery were contained
(i.e. they did not spark wide contagion such as the US sub-prime debacle), the risk remains,
and particularly should the fiscal strategies in these economies (e.g. Greece, Ireland,
Portugal, Spain, and Italy) become unstuck. While the core EU countries’ economies – led by
Germany – are emerging robustly from the recession and the financial crisis, the financial
institutions in these economies have vast exposures to the troubled sovereigns in the south.
Any attempt at debt restructuring (in Greece, for instance, this looks imminent) could have
adverse implications for the banks in the core European countries. Tensions in the euro area
periphery could therefore spread to the core of Europe and from there beyond. Some
commentators are very negative on the potential repercussions a debt restructuring in
Europe may have.
While the political, social and economic tensions and instability in the Middle East & North
African (MENA) region has had in minimal impact on global economic activity thus far, the
increase of the oil price to above $120/b is ominous. The rising oil price, combined with
higher non-oil commodity prices, is lifting inflation levels throughout the globe, affecting real
household spending power. Further increases in commodity prices could cause economic
slowdown in both AEs and EMs.
The fiscal consolidation project in the major AEs (to a lesser extent in Europe) still need to
materialise and could deliver unwelcome surprises. Both the US and Japan recently
announced additional fiscal stimulation, which – according to the IMF – threatens medium-
term fiscal sustainability4.
4 The US budget deficit for fiscal 2011 is estimated at 10.9% of GDP following the extension of the Bush tax cuts and other fiscal
stimulation measures announced in December 2010. In Japan, the reconstruction effort following the earthquake and tsunami currently receives priority; however, the IMF urges that strategies be put in place to ensure medium-term fiscal sustainability.

8
The major risk in EMs is overheating economies, i.e. the policy authorities fail to act
decisively/ pre-emptively to contain nascent inflationary pressures. With the oil price (and
other commodity prices, e.g. food) having increased strongly in 2010 and jumping sharply in
January 2011 due to the political unrest in the MENA region, supply shocks to inflation are
already on the cards. EM central banks already faced with overheating economies, positive
terms of trade effects and strong capital inflows will have little option but to tighten policy
with the attendant risk of a boom-bust cycle/ hard economic landing. EMs account for 40%
of global household consumption and more than two thirds of global growth (IMF).
Inflation & commodity prices
The Economist $-based commodity price index increased by 47% in 2010 compared to 2009; the
North Sea Brent crude oil price increased by 30% on average. This sharp rebound in commodity
prices, which fell sharply in 2009, is driven by the demand stemming from China, India and other
commodity-intensive developing countries, the recovery of industrial demand in the major industrial
countries and food & oil price supply shocks. Oil prices have risen 30% since the fourth quarter of
last year due to the political upheaval in the MENA region. As a result, food prices have come under
renewed pressure following the heavy flooding-induced pressures during the winter months in the
Northern hemisphere. International food price inflation is running at close to 30% year-on-year
(wheat, sugar and edible oil prices have all raised sharply towards the end of 2010).
These supply shocks to inflation does not seriously threaten the economic conditions in the AEs
where substantial economic slack remains (a tightening of monetary policy – as opposed to a mere
normalisation of interest rate levels – is, for instance, not in prospect soon)5, but the picture is
different in EMs, notably China. Rising food & energy prices will in itself put poorer household
budgets under pressure and should second round inflationary pressures demand additional policy
tightening these economies can experience a harder landing. (These economies accord a higher
weighting to food & energy prices in their CPI baskets.)
The expectation is that headline inflation numbers in the AEs will rise over the short term due to the
impact of higher oil and food prices, but that core inflation and inflation expectations will remain
well-behaved in these economies (USA 1-2%; Euro area 1-2% and Japan 0-0.5%). The headline CPI
inflation forecast for the AEs has been revised upwards (in April from January) with 0.6 percentage
points to 2.2% in respect of 2011. In EMs, CPI inflation already measured above 6% on average in
5 JPM calculates that the 20% increase in oil price since the fourth quarter of 2010 will shave off 0.25% points from annualized global
growth during the first half of 2011. The impact is expected to be mild (obviously in the absence of additional shocks) as the oil price increases have not been accompanied by monetary policy tightening and/or an increase in risk aversion (geo-political concerns) which tend to affect business and consumer confidence.

9
2010 and is projected to approach 7% (2011) and to recede to between 5% and 6% over the
medium-term.
The oil price is projected to recede from recent spikes as the MENA political troubles stabilise and
due to the fact that crude oil stocks are at a five-year high. However, for other metal commodities,
e.g. copper and platinum, industrial demand is likely to underpin prices and as long as the Chinese
growth momentum in particular and the EM growth momentum in general persist, the fundamental
tendency in commodity prices is likely to remain favourable. The attendant risk here is clearly a hard
EM landing (led by China) noted above.
Currencies
The fundamental tendency in the US dollar has been to weaken against the euro and the yen, albeit
not without the accompanying volatility. Weakness against the yen is dictated by the savings surplus
Japanese economy with Japanese investors favouring to keep investments onshore due to the level
of uncertainty in the wake of the global financial crisis and recession. The destruction accompanying
the earthquake, tsunami and nuclear crisis boosted the yen further as Japanese firms/ investors
repatriated funds to finance reconstruction; the G7 major economies had to intervene in currency
markets to stem the appreciation of the yen. Weakness of the US dollar against the euro has not
been consistent – it gyrated along with the dictates of the sovereign debt problems in the Euro area
periphery countries, i.e. appreciates in times of crisis (Greece, 2010Q2; Ireland 2010Q4) and
depreciates when these ructions subside. While there is no view that the dollar will either
appreciate or depreciate sharply over the medium term, the unfavourable US fiscal position dictates
a weak dollar for the foreseeable future. The interest rate differential has also started to move
against the dollar following the ECB increasing its lending rate. The counter-balancing factor remains
Chinese and oil-exporting country purchases of US treasuries; this factor may avert a dollar crash.
South African economic outlook
The SA economy is a mixed economy sharing features both with the AEs (e.g. financial sector;
infrastructure) and the EM’s (e.g. poverty & unemployment levels). As a middle income developing
economy, real economic growth contracted during calendar 2009 along with the contraction in
global growth, but not as sharp as the AEs (1.7% versus 3.4%); EMs, in turn, grew by 2.8% in
aggregate, led by sustained high growth in China, India and other developing Asian economies. SA’s
GDP growth rebounded to 2.8% in 2010, ending the year with a higher than expected 4.4%
annualised growth rate (10Q4). CPI inflation bottomed at 3.2% in September 2010 and has since
accelerated to 4.2% (April 2011) mainly due to supply-side cost pressures, i.e. higher food and petrol
prices and some exchange rate depreciation; PPI inflation came in at 7.3% in March 2011. The

10
monetary policy stance remains accommodative, albeit that the next move in interest rates is likely
to be upwards (somewhere through 2011); fiscal policy also remains accommodative, but the recent
budget plans to reduce the deficit from the current 5.3% of GDP to 3.8% of GDP by the 2013/14
fiscal year.
Before the SA outlook is discussed, it is necessary to briefly consider the broad implications of the
international outlook:
With the global recovery expected to continue, external demand for SA’s exports is likely to
continue picking up; commodity prices should also benefit the SA terms of trade. The latter
index is currently at a multi-decade high, which provides a strong stimulus to the economy.
The prospect of low inflation in the AEs and accompanying low interest rates for the
foreseeable future implies that capital flows to EMs are likely to remain strong.
Unfortunately these capital flows consist mainly of portfolio investments (bonds & equities)
and tend to be volatile during periods of elevated risk aversion (e.g. during the Greece and
Irish sovereign debt crisis periods in 2010). This has implications for rand exchange rate
volatility, which has become an established trend in the SA economy6. The prospect of rand
exchange rate volatility will intensify once monetary policy tightening commences in the
AEs.
EM currencies are likely to be subject to appreciating pressure, given the outlook for a weak
dollar and strong inward capital flows. This is presenting the policy authorities with
headaches in terms of macro-management. The IMF prescription is contractionary fiscal
policy to counter the financial stimulus effect on domestic demand (witness the local
conditions, 2004-7). Such a macro environment is conducive to the non-tradable goods
(tertiary) sectors benefiting from buoyant domestic market conditions, but is adverse for the
tradable goods sectors such as manufacturing having to contend with stiffer import
competition and uncompetitive exports.
The higher oil and food prices still have to filter through fully to the local inflation indices
and this will be exacerbated in the event of currency depreciation. Whilst South Africa
shares the AE experience in terms of lingering unemployment/ a positive output gap and
well-anchored inflation expectations, the outlook for inflation is less favourable due to the
6 The IMF points out that the global current account imbalance remains in favour of the surplus countries/ regions (i.e. China and East
Asia, Japan, Germany and the oil-exporting countries), suggesting substantial excess savings globally flowing into and out of EM capital
markets depending on the degree of risk, real or perceived.

11
impact of rising food, petrol and electricity prices. The projected increase in inflation will put
disposable household incomes under pressure and invite first a normalisation and then a
tightening of monetary policy.
Towards the end of 2010 and during the early part of 2011 there was clear evidence of
buoyancy in the domestic market, benefiting from the combined stimulus tied to an
improved terms of trade and strong capital inflows (strong rand exchange rate, low inflation
& interest rates). The latest information on the domestic economic performance (2011Q2),
however, point to some slowdown in the consumer sector, possibly adjusting to a more
sustainable pace. While the recovery in the building and manufacturing sectors are shaping
up, this appears to be a slow process. Therefore, despite the increase in headline inflation,
the danger of secondary inflation appears limited and it is expected that the SARB will be
able to delay action on the monetary policy front. Interest rates are only expected to begin
increasing towards the end of the year/ early next year.
Growth
Real GDP began to expand again during the third quarter of 2009 following the recessionary
contraction during 2009 (-1.7% for the calendar year). From the third quarter of 2009 year-on-year
real GDP growth has accelerated from -2.4% to 3.7% at the end of 2010 and remained at that tempo
during the first quarter of 2011 – see Figure 1. While the SA Reserve Bank has not officially called the
end of the recession, indications are that the economy registered a lower turning point during the
third quarter of 2009. This would suggest that the recession was on a par with the shortest in the
post-WWII period. Amongst other, this is some reflection of the extent to which SA was shielded
from the impact of the global financial crisis and what has become known as the Great Recession.
Table 2 shows that most forecasts agree that economic growth is expected to continue accelerating
over the short- to medium term. Real GDP growth of 3.5% - 4% is forecast for 2011 (from 2.8% in
2010 and -1.7% in 2009), around 4% in 2012 and 4%-4.5% in 2013. The SARB reported huge upward
revisions to personal disposable income growth and household consumption expenditure during the
third quarter of 2010 – the household consumption expenditure annualised growth rate has picked
up to a 5-6% pace during the second half of 2010 according to the fourth quarter 2010 Quarterly
Bulletin. In contrast, the growth – albeit turning positive during the second quarter of 2010 – in
gross domestic fixed investment expenditure remains anaemic.

12
Figure 1: Real GDP growth
Source: SA Reserve Bank
Table 2: South Africa – forecasts of key economic variables: 2011-13
2009 2010est 2011F 2012F 2013F
Real GDP growth National Treasury -1.7 2.7 3.4 4.1 4.4 BER 2.8 3.7 3.8 3.8 Reuters Consensus - 3.5 3.8 4.1
CPI inflation National Treasury 7.1 4.3 4.9 5.2 5.5 BER 4.3 5.0 5.8 5.4 Reuters Consensus - 4.8 5.7 5.7
Prime overdraft interest rate (eop) National Treasury - - - - - BER 10.50 9.00 10.00 11.00 12.00 Reuters Consensus - 9.38 10.79 11.53
Current account balance (% of GDP) National Treasury -4.1 -3.2 -4.2 -4.9 -5.0 BER -2.8 -3.3 -4.9 -5.4 Reuters Consensus -3.7 -4.9 -5.4
Source: National Treasury: Budget Review 2011 / BER / Reuters Econometer, March 2011
Therefore, while domestic expenditure has become lively (real growth of 4.2% registered during
calendar 2010), the composition of growth is heavily in favour of the consumer at this stage of the
economic recovery. Consumer spending is running ahead at a similar stage (i.e. 6 quarters into the
economic recovery) compared to earlier economic upswing phases of the business cycle, while gross
domestic fixed investment is lagging badly (except compared to the weak trend in GDFI during the
late 1980s/ early 1990s) – see Figure 2.
-8
-6
-4
-2
0
2
4
6
8
10
Mar
-94
Mar
-95
Mar
-96
Mar
-97
Mar
-98
Mar
-99
Mar
-00
Mar
-01
Mar
-02
Mar
-03
Mar
-04
Mar
-05
Mar
-06
Mar
-07
Mar
-08
Mar
-09
Mar
-10
Mar
-11
yoy
% c
han
ge
Recession GDP GDP (qoq ann%)

13
Figure 2: Real domestic spending during economic upswings7
Household consumption expenditure (HCE) Gross domestic fixed investment (GDFI)
Source: SARB / BER
More detail regarding the projected tendencies are provided below.
The unfortunate fallout from a weak fixed investment trend is that employment creation is
lagging as well. The acceleration in household consumption spending has been driven by
higher real wage growth (measured at 7% points in 2010), which in turn, tends to undermine
employment growth. The weak trend in employment creation is also reflected in the
consumption spending patterns – whereas durable goods spending is running ahead (up
close to 25% year-on-year during 2010, boosted by low interest rates), the growth in
spending on non-durable goods is lagging behind (2.1% year-on-year over the corresponding
period). Statistics SA reported a 0.7% decline in formal sector employment growth during
calendar 2010; however, on the basis of a sustained general recovery and acceleration in
fixed investment spending, around 1.5-1.9% formal sector employment growth is forecast by
the BER for 2011/12.
The current pace in household consumption is expected to moderate over the near term due
to lower real wage growth as inflation accelerates, in turn, mainly due to cost pressures
resulting from higher food, petrol and electricity prices and, on top of this, higher interest
rates; these downside pressures are likely to be only partly compensated for by the
anticipated return to positive employment growth. The resulting growth in household
spending should be more sustainable (4-4.5%). Household debt levels remained elevated at
77.6% of personal disposable income during the fourth quarter of 2010.
7 The SARB has not determined the lower turning point of the 2008/9 economic downswing; however, statistical evidence point to the
third quarter of 2009. Both these charts were compiled on that basis. Only the first 16 quarters of SA’s long ’99-07 economic upswing (25 quarters) is shown.
90
100
110
120
0 1 2 3 4 5 6 7 8 9 10 11 12 13 14 15 16
tro
ug
h =
100
Quarters from start of upswing
78Q1-81q3 86Q2-89Q1 93Q2-96Q4 99Q3-07Q4 09Q3+
90
100
110
120
130
140
0 1 2 3 4 5 6 7 8 9 10 11 12 13 14 15 16
tro
ug
h =
100
Quarters from start of upswing
78Q1-81q3 86Q2-89Q1 93Q2-96Q4 99Q3-07Q4 09Q3+

14
The categories of GDP expenditure which need to accelerate more meaningfully are fixed
investment spending and exports. Gross domestic fixed investment spending registered two
consecutive calendar years of contraction – 2.2% in 2009 and 3.7% in 2010 according to
SARB estimates, i.e. the first time this occurs since the record recession of the early 1990s.
Both private and public sector fixed investment are under pressure. Part of the malaise,
apart from the passing of the World Cup Soccer event, is the under-spending of capital
budgets at the local authority level – estimated by National Treasury to amount to R8.2
billion (or 17.1% of budgets).
The high growth in public corporations capital expenditure in the run-up to the World Cup
(32.3% per annum over the preceding three years, underpinned by investment in public
infrastructure and Eskom and Transnet’s rapidly expanding capital budgets over this period)
was expected to cool down; henceforth the capital spending by Eskom and Transnet will
continue to boost the public corporations fixed investment trend, but the level of growth
(National Treasury projects a real growth rate of 5.7% per annum) will be lower compared to
the last couple of years.
Private fixed investment spending has to recover from the deep cutbacks during calendars
2009/10. The lively domestic market conditions, supportive interest rate levels and
improving production capacity utilisation should see acceleration in the private component
of GDFI (representing 62% of the total).
Real export growth for 2010 is estimated at 4.7%, which is very modest in view of the 20%
contraction in 2009, i.e. the main channel along which the global recession affected the
domestic economy. The strength of the rand exchange rate continues to inhibit
manufacturing sector growth and many of SA’s trading partner economies in Europe, the
USA and Japan are under pressure. The commodity sector should benefit from the high
prices and keen demand. However, the IMF warns about signs of overheating in EMs, which
could put the commodity price and export cycle under pressure over the short term should
these economies experience a harder economic landing. Both the BER and National Treasury
factor in a 6-6.5% real export growth rate into their forecasts over the medium term.
SA exporters will in future have to increasingly exploit the fast-growing EMs. The IMF
estimates that EMs can contribute 40% of global output by 2015; the BRICS’ (of which SA
was invited to become a member in December 2010) contribution to global output is
projected to increase from 8% in 2000 to 21.6% in 2015.
15
Inflation & interest rates
As noted above, domestic CPI inflation appears to have bottomed at 3.2% in September 2010; it has
since accelerated again to 4.2% in April 2011, mainly due to higher food and energy prices. While
international food prices have increased considerably over the past year due to keen demand
conditions and supply problems related to adverse weather conditions in key food producing
countries (Russia, Brazil and Australia), the local impact has been tempered due to a bumper maize
crop, the strong rand exchange rate and subdued demand conditions. These factors are expected to
gradually reverse, and combined with the impact of higher oil prices, this should lead to a sustained
acceleration in domestic inflation. However, inflation expectations currently appear to be well-
anchored at 5.5%. The forecasts in Table 2 suggest an inflation rate close to 5% in 2011 on average
and 5.5-6% during both 2012 and 2013; the Reuters Consensus is the most bearish, projecting CPI
inflation of 5.7% in both 2012/13.
Even in this relatively benign scenario, it is expected that interest rates will begin to rise at the latest
towards the end of 2011/ early 2012. The BER projects a cumulative 300 basis points increase in
prime overdraft rates by 2013; the Reuters Consensus is slightly more bullish (despite their inflation
projections) at 250 basis points. The risk is that the supply shocks to inflation are worse than
expected particularly should the rand exchange rate come under additional pressure, in which case
the interest rate hikes could be more than projected here.
Balance of payments and the rand exchange rate
Figure 3 shows that SA registered a sizeable surplus on its overall balance of payments since 2004 –
on average net capital inflows exceeded the deficit on the current account by R32.5 billion per year.
Whereas the current account deficit increased gradually from 1% of GDP in 2003 to a peak of 7.1% in
2008, the net capital inflow exceeded this by a healthy margin, which allowed the replenishment of
balance of payments reserves (valued at $45.5 billion at the end of January 2011) and explains the
strength of the rand exchange rate. Even during calendar 2009, at the height of the global financial
crisis, SA managed to attract more than sufficient capital inflows to finance the deficit on the current
account. The net capital inflow did decline from R188 billion in 2008 to R114 billion in 2009;
however, it recovered swiftly to an estimated R134 billion in 2010. The bulk of these capital inflows
(almost 100% in 2010) represented portfolio investment which tends to be volatile.
However, in the post-financial crisis world of low interest rates and anaemic growth in the major
AEs, commodity-producing countries in the EM universe benefit from a strong flow of portfolio
investment. Unfortunately, these capital flows tend to be volatile at times of heightened risk

16
perception, which have implications for exchange rate volatility in host countries like South Africa8.
The government has been quite aggressive in rebuilding reserves in an effort to take some pressure
off the appreciating rand exchange rate; the trade-weighted rand did depreciate by 10% in January
2011, but appreciated again since. The rand is expected to be relatively strong in a world of a weak
US dollar and low interest rates in the AEs.
Figure 3: Overall balance on the SA balance of payments vs the rand exchange rate
Source: SARB
Figure 4: Tendencies on the SA balance of payments
Terms of trade Current account balance
Source: SARB / BER
8 The National Treasury notes in its 2011 Budget Review that a few EM economies (Brazil, China, India, Indonesia, Malaysia, Mexico,
South Africa and Turkey) attracted 95% of the global portfolio equity flows, 78% of short-term debt flows and 50% of bond flows to EMs in 2010.
50
60
70
80
90
100
-20
-10
0
10
20
30
40
50
20002001200220032004200520062007200820092010
ind
ex
20
00
=10
0
R b
illio
n
Change in net reserves Trade-weighted rand
90
100
110
120
130
0 1 2 3 4 5 6 7 8 9 10 11 12 13 14 15 16
tro
ug
h =
100
Quarters from start of upswing
78Q1-81Q3 86Q2-89Q1 93Q2-96Q4 99Q3-07Q4 09Q3+
-10
-5
0
5
10
15
1 2 3 4 5 6 7 8 9 10 11 12 13 14 15 16 17
% o
f G
DP
Quarters from start of upswing
78Q1-81Q3 86Q2-89Q1 93Q2-96Q4 99Q3-07Q4 09Q3+

17
Figure 4 shows that a favourable tendency in SA’s terms of trade since the economic recovery
commenced is assisting the current account of the balance of payments; combined with the
continued strong capital inflows, this accommodates the current account deficit. However, as the
chart (right) indicates, the current economic recovery commences with a sizeable deficit (measured
close to 3% of GDP in calendar 2010). A poor performance in net export growth (i.e. exports minus
imports) should see a further increase in the deficit ratio, which can become risky in an environment
of investor uncertainty and/or deteriorating terms of trade. It follows that the current account of
the balance of payments is likely to be much more in the foreground in the ensuing economic revival
compared, for instance, to the previous record upswing (1999 to 2007) which registered a surplus on
the current account three years into the economic upswing.
The implications for the rand exchange rate are unpalatable to the extent that the commodity-
focussed capital flows will tend to dictate a strong rand (adverse for SA’s non-commodity exports)
and being volatile at times of investor uncertainty. While the precious metal prices have acted as a
shield in this regard, it may not be enough to rid the forex market from the inherent volatility.
Exchange rate volatility tends to be negative for (manufacturing) export growth.
18
Sectoral outlook for the Western Cape economy
In this section of the report, the outlook for the Western Cape economy (2010-15) is considered. By
way of background, the historic developments are first considered. Therefore, in the first section, an
analysis is conducted of the growth and employment record of 26 sub-sectors over the 2000-9
period, i.e. a full business cycle, including a historic long expansion phase (2000-7) and a
comparatively short downswing phase (2008-9). The growth in real value added (GDPR) and the
growth in employment, as well as employment elasticities across the 26 sub-sectors are
investigated. In the second section, it is shown that the regional economy has embarked on an
upward phase of the business cycle, recovering relatively swiftly from the 2008/9 economic
recession. In the final part of this section, the outlook for the region is discussed by a more detailed
look at individual subsectors/ industries. This section is divided into overviews of the primary sector
(agriculture and fishing & aquaculture); the secondary sector (agriculture processing, clothing &
textiles, metals & engineering, crafts, oil & gas, electronics, boat building and furniture); and the
tertiary sector (tourism, finance & insurance, ICT and call centres/BPO).
Growth & employment, 2000-9
The Western Cape economy’s outperformance in a national context is a known fact. It remains
necessary to investigate the source of this growth; which sectors are making the biggest contribution
to the region’s economic growth, both in terms of real value add and employment? This issue is first
investigated at an aggregated level (nine major SIC divisions) where-after the focus will move to a
more disaggregated level (26 industry groups).
Figure 5 shows that the broad sector, finance, insurance, real estate and business services by far
dominated the Western Cape economy’s growth performance over the 2000s – it contributed 43%
of the cumulative regional growth in GDPR. This substantial contribution is a function of high growth
(6.4% per annum, 2000-9) in the sector’s real value add and the fact that this sector accounted for a
third of the region’s GDPR in calendar 2009. The finance & insurance sector grew by close to 9% per
annum; business services grew by close to 5% per annum.
However, a stark feature of this growth was that employment levels in the finance & insurance
sector actually contracted somewhat (at an average rate of 0.2% per annum); all of the employment
(3.8% growth per annum) was created in the business services sector (at a rate of 4.8%). The
explosive growth in the call centre/BPO sector presumably explains some of this growth in
employment in the region; however, other business services contributed to the employment
creation.

19
Figure 5: Contribution to Western Cape average annual real GDPR growth, 2000-9
Source: Quantec Research; own calculations
The following additional remarks are in order (Table 3):
The second largest contributor to regional growth was retail, wholesale, catering &
accommodation (including tourism), contributing 14.8% of the cumulative Western Cape
GDPR growth over the period 2000-9. This broad sector contributed close to 15% of GDPR
and grew by 4.3% per annum over the 2000-9 period. The sector is also labour intensive and
employment grew by 3.2% per annum.
Third in line is the transport, storage & communication sector, contributing 12.4% of the
cumulative growth (with the sector accounting for 10% of GDPR and growing by a robust
5.5% per annum); this sector’s employment grew by a modest 1.5% per annum.
Fourth in line is the sizeable manufacturing sector in the province (accounting for close to a
fifth of GDPR), contributing 10.1% of the cumulative growth in GDPR over the 2000-9 period.
However, growth was actually relatively modest at 2.3% per annum while the sector shed
jobs on balance over this period at a rate of 1.5% per annum. This suggests a rise in the
capital intensity of the sector during the 2000s.
Fifth in line is the community, social and personal services sector (including government),
which also contributed close to 10% of the cumulative growth in GDPR, 2000-9 and
generated employment at a rate of 3.2% per annum; the sector’s GDPR growth was
relatively subdued at 2.5% per annum; however, the sector is highly labour intensive and
43.0%
14.8%
12.4%
10.1%
9.1%
7.4%
2.0% 1.1% -0.1%
Finance, insurance, realestate & business servicesWholesale, retail, catering& accommodationTransport, strorage &communicationManufacturing
Community, social &personal servicesConstruction
Agriculture, forestry &fishingElectricity, gas & water
Mining

20
became more so over the 2000s. This sector made the strongest contribution to cumulative
employment growth in the Western Cape economy.
In fact, in terms of employment, the finance & insurance, real estate and business services
sector (51%); retail wholesale, catering & accommodation (48%) and community, social and
personal services (57%) account for almost all the job growth in the region over the 2000s.
The agriculture, forestry & fishing sector (-48%) retrenched a substantial portion of its work
force; as well as manufacturing (subtracting 17% from the cumulative aggregate
employment growth).
Table 3: Western Cape real GDPR and employment growth: 2000 to 2009 (yoy % change)
Sector GDPR 2005 2006 2007 2008 2009 2010est
GDPR Employ-ment
Average 2000-9
Agriculture, forestry & fishing 5.9 -5.7 1.6 17.7 -5.5 0.7 2.1 -6.2
Mining 5.2 -5.6 0.9 -7.1 0.5 -8.8 -1.1 2.6
Manufacturing 5.3 6.3 5.2 2.1 -8.9 3.5 2.3 -1.5
Electricity, gas & water 6.0 2.0 2.4 -3.8 0.5 3.2 3.1 2.4
Construction 12.3 10.7 15.1 8.2 6.1 1.6 8.7 0.8
Wholesale, retail, catering &
accommodation 9.2 5.2 5.4 0.1 -2.8 2.6 4.3 3.2
Transport, storage & communication 9.0 4.2 7.0 2.3 0.7 3.4 5.5 1.5
Finance, insurance, real estate &
business services 4.4 9.4 8.2 7.5 0.5 3.0 6.4 3.8
Community, social & personal services 4.0 3.2 4.5 4.2 2.3 1.5 2.5 3.2
Total WC GDPR 6.1 5.9 6.4 4.5 -1.4 2.7 4.3 1.2
Source: Quantec Research
The sub-sectors responsible for growth and employment creation become clearer when the analysis
is done at a disaggregated level. Figure 6 depicts 26 Western Cape sub-sectors plotted depending on
the growth in real value add over the 2000-9 period of the sector (horizontal axis) and its rate of
employment growth over the corresponding period (vertical axis). The chart can be divided into four
quadrants, i.e. four groups of subsectors/industries, namely:
Firstly, the top left quadrant including sub-sectors displaying below average real GDPR
growth (i.e. less than 4.3% per annum, at which rate the regional economy grew) but
creating jobs on a net basis (i.e. positive average employment growth over the 2000-9
period). This quadrant contains the leading employment growth sectors, albeit sectors
exhibiting below average real GDPR growth. The leading employment growth sectors
included in this quadrant are the broad community, social & personal services (CSP) sector

21
(including medical & health services, other CSP services and government), the trade sector
(including retail, wholesale, catering & accommodation), electricity, mining, transport &
storage and tourism. The metals & engineering sector and ‘other industries’ are also in this
quadrant; however, employment growth was weak and in the case of ‘other industries’ also
real GDPR growth. The wood, paper, printing & publishing sector stagnated, both in terms of
GDPR growth and employment creation.
Secondly, the top-right quadrant including a small number of sub-sectors exhibiting above-
average real GDPR growth as well as creating jobs on a net basis. These sub-sectors are
business services, ICT, communication, construction and other transport equipment. Of
these five sectors, only business services and ICT displayed reasonable employment growth
(at a rates of 4.8% and 2.3% per annum respectively); all three other sectors only showed
marginal positive employment growth even though real GDPR expanded exceptionally
robustly (in excess of 7% per annum). These sectors have low employment elasticities
requiring exceptionally favourable business conditions in order to generate new
employment opportunities. Although the finance & insurance sector shed employment
opportunities on balance, this was marginal and the sector also posted exceptionally robust
real GDPR growth (close to 9% per annum), which serves as qualification to be classified in
this group of industries – fast growers with stable workforces, implying higher capital
intensity. Only business services and ICT generated substantial new jobs.
Thirdly, the bottom-left quadrant where jobs were shed on balance and real GDPR growth
was below average. Sub-sectors included here are petro-chemicals, food & beverages,
electronics, non-metal minerals, clothing & textiles and agriculture. The latter two
mentioned sectors are labour intensive and shed jobs on a grand scale, despite positive real
GDPR growth. Therefore low growth and job-shedding characterise sub-sectors in this group.
It may be noted that the petro-chemicals (3.7%) and electronics (3.7%) industries exhibited
reasonable real GDPR growth.
Fourthly, the bottom-right quadrant contains the high growers that also shed jobs. Only
three sub-sectors are classified here, namely automotive, furniture and leather products &
footwear. In the latter-mentioned industry, the growth came from leather products (mainly
car seats and hides for export); however, both leather products and footwear destroyed jobs
over the 2000-9 period. These industries therefore became substantially more capital
intensive during the 2000s.

22
Figure 6: Western Cape: Real GDPR and employment growth: 2000-9
Source: Quantec Research; own calculations
Figure 7 shows a ranking of the 26 sub-sectors in terms of real GDPR growth over the 2000-9 period.
Three groups are identified:
The high growth sectors, including construction (8.7%); finance & insurance (8.7% per
annum); communication (excluding ICT) (8.1%); furniture (7.6%); ICT (7.4%); leather
products and footwear (7.4%); and other transport equipment (including boat building)
(7.2%). These sub-sectors all reside in the top right and bottom right quadrants of Figure 6;
however, except for ICT, their employment creation record is rather poor in view of the high
growth in real value-added. This is particularly true in the case of the furniture, leather
products and footwear industries. It follows that a characteristic of the high-growth sub-
sectors in the Western Cape is a poor contribution to employment growth. The business
services and ICT sectors are exceptions to this rule.
-8.0
-6.0
-4.0
-2.0
0.0
2.0
4.0
6.0
-1.2 0.8 2.8 4.8 6.8 8.8
Ave
em
plo
yme
nt
gro
wth
: 20
00
-9
Ave real GDPR growth: 2000-9
Lth & ftw
Other ind
Government
Business services Health
Electronics
Automotive
Petro-chem
Food & bev
Metals
Electricity
Trade
Finance
Construction Communication
ICT
NMM Furniture
Total Tourism
Tpt & store
Other CSP
Other tpt
Agriculture
Cloth & tex
Mining
Wood & paper

23
Secondly, the average growth sectors include: automotive (5.5%); business services
(excluding ICT) (4.8%); wholesale, retail, catering & accommodation (excluding tourism)
(4.3% per annum); tourism (3.9%); transport & storage (3.9%); other CSP services (3.7%);
electronics (3.7%) and petro-chemicals (3.7%). Apart from the automotive sector, which
shed jobs on balance, these sub-sectors were generally good employment creators, business
services, wholesale, retail, catering & accommodation and other CSP services in particular. It
follows that the leading job-creating sectors in the province tend to be average growing
industries.
Figure 7: Western Cape real GDPR growth across sectors: 2000-9
Source: Quantec Research; own calculations
Thirdly, the low-growth sub-sectors include mining (contracting by 1.1% per annum); wood,
paper, printing & publishing and glass products & non-metal minerals (both subsectors
stagnating over the 2000-9 period); food & beverages (1.5%); other industries (1.7% per
-1.1
-0.2
0.2
1.5
1.7
2.1
2.1
2.2
2.9
3.1
3.1
3.7
3.7
3.7
3.9
3.9
4.3
4.3
4.8
5.5
7.2
7.4
7.4
7.6
8.1
8.7
8.7
-4.0 -2.0 0.0 2.0 4.0 6.0 8.0 10.0
Mining
Wood, paper, printing & publishing
Glass & products and other non-metallic…
Food & beverages - agric processing
Other industries
Government
Agriculture, forestry & fishing
Clothing & textiles
Medical, dental & other health & veterinary…
Electricity & water supply
Metals & engineering (incl. machinery)
Petroleum products, chemicals, rubber & plastic
Electronics (excl. ICT)
Other community, social & personal services…
Transport & storage (excl. tourism)
Tourism
Wholesale, retail, catering & accom (excl.…
Total GVA
Business services (excl. ICT)
Motor vehicles, parts & accessories
Other transport eqp (incl. boat building)
Leather & products and footwear
ICT
Furniture
Communication (excl. ICT)
Finance & insurance (excl. ICT)
Construction
Ave annual growth: real GDPR 2000-9
High
Medium
Low

24
annum); government (2.1%); agriculture, forestry & fishing (2.1%); clothing & textiles (2.2%);
medical & health services (2.9%); electricity & water supply (3.1%); and metals &
engineering (3.1%). This group of relative low growing sectors can be divided into those that
created jobs and those that shed jobs. In the former group are sub-sectors that exhibited
reasonable (2-3% per annum) growth, such as medical & health services, electricity & water,
and government; metals & engineering also succeeded in maintaining its workforce, while
petro-chemicals shed jobs marginally. The other sub-sectors in this group exhibiting low
growth shed jobs at a high rate, led by agriculture and clothing & textiles. The strong job
shedding that occurred in two of the region’s most labour intensive industries, namely
agriculture and clothing & textiles is a sorry feature of the Western Cape economic
performance over the 2000s.
Figure 8: Western Cape employment growth across sectors, 2000-9
Source: Quantec Research
-6.4
-6.2
-4.1
-2.9
-2.8
-2.6
-1.3
-1.2
-0.7
-0.2
0.0
0.3
0.4
0.6
0.8
0.9
1.1
1.2
1.7
2.3
2.4
2.6
2.8
3.3
3.7
4.8
5.0
-8 -6 -4 -2 0 2 4 6
Leather & products and footwear
Agriculture, forestry & fishing
Clothing & textiles
Glass & products and other non-metallic minerals
Furniture
Electronics (excl. ICT)
Food & beverages - agric processing
Motor vehicles, parts & accessories
Petroleum products, chemicals, rubber & plastic
Finance & insurance
Wood, paper, printing & publishing
Metals & engineering (incl. machinery)
Other transport eqp (incl. boat building)
Communication (excl. telecom)
Construction
Other industries
Tourism
Total employment
Transport & storage (excl. tourism)
ICT
Electricity & water supply
Mining
Other community, social & personal services…
Government
Wholesale, retail, catering & accom (excl.…
Business services (excl. ICT)
Medical, dental & other health & veterinary…
Ave annual growth: Employment 2000-9
High
Medium
Low

25
Employment elasticities
One method that can be applied to gauge the labour absorption of the growth that has taken place
across the sub-sectors is to calculate the employment elasticity for each sub-sector. The
employment elasticity is defined here as the ratio of the average growth in employment in the sub-
sector over the 2000-9 period divided by the average growth in real value added over the
corresponding period. Figure 9 contains the results for the 26 industry groups of the province. The
various ratios indicate the degree of labour absorption that occurred in the growth of the specific
sub-sector. The South African economy is known for its relatively poor labour absorption capacity,
borne out by the fact that aggregate employment only expanded by 1.5% per annum over the 2000-
9 period compared to average real GDP growth of 3.7% over the corresponding period, producing an
employment elasticity of 0.4, which is relatively low. A value of one and above suggests an elastic
labour response (i.e. labour intensive growth); conversely a value below one suggests poor labour
absorption. The province’s overall employment elasticity over the 2000-9 period (0.28) was below
the national average, suggesting even poorer labour absorption in the region.
Figure 9: Western Cape: Employment growth per unit of real value added growth: 2000-9
Source: Quantec Research; own calculations
-2.92 -2.45
-1.85 -0.88 -0.86
-0.70 -0.37
-0.22 -0.20 -0.09 -0.02
0.06 0.08 0.09 0.11
0.27 0.28 0.31 0.43 0.52
0.76 0.80 0.87 1.00
1.58 1.73
-4.00 -3.00 -2.00 -1.00 0.00 1.00 2.00
NM mineralsAgric
MiningCloth & tex
Lth & ftwFood & bev
Electronics (excl. ICT)Furniture
AutoPetro & chemicals
Wood & paperFinance
Other tpt eqpComm (ex telecom)
ConstructionMetals & eng
TourismTotal
ICTTpt & storage (ex tourism)
Other industriesOther CSPElectricity
Trade (ex tourism)Business services (excl. ICT)
GovernmentMedical & health
Employment elasticity

26
The sub-sectors with an employment elasticity of higher than one include medical & health services;
government and business services (excluding ICT). The relatively high employment elasticity of the
government and medical & health services reflects the expansion of employment in the public
sector, which has been a national trend, particularly during 2008/9 when substantial retrenchments
occurred in the private sector (see SA Reserve Bank, Quarterly Bulletin, March 2011, p. 13). These
sub-sectors posted moderate growth over the 2000-9 period (2.1% and 2.9% per annum
respectively). The business services (excluding ICT) sub-sector, in turn, was boosted by the growth in
call centres & BPO, which tend to be labour absorbing.
Other sub-sectors with relatively high employment elasticities – at least higher than the national
average – include wholesale, retail, catering & accommodation, electricity & water supply, other
community, social and personal services, other industries, transport & storage and ICT. The
wholesale, retail, catering & accommodation and other CSP services sectors are labour intensive;
this also applies in the case of tourism, which has a (proxy) employment elasticity close to the
regional average.
A whole range of industries exhibited employment elasticities close to zero, indicating relatively
unresponsive employment growth, e.g. metals & engineering, construction, communication
(excluding telecom), other transport equipment (mainly boat building), finance & insurance, wood &
paper, petro-chemicals and automotive.
The latter-mentioned two subsectors actually retrenched workers on balance per unit of real value-
added growth, i.e. employment elasticities of -0.20 and -0.22 respectively. The big job shedders,
however, are non-metal minerals (-15.06); agriculture (-2.92); mining (-2.45) and clothing & textiles
(-1.85); these sectors are highly labour intensive undergoing capital intensification over the 2000s.
The sharp decline in employment levels in the agricultural and clothing & textiles sub-sectors is an
outstanding characteristic of the Western Cape economic performance over the 2000s. According to
the provincial Department of Agriculture, the loss of employment in the agricultural sector mainly
involved seasonal workers. In the clothing & textile sector, competition from other developing
country producers (e.g. China and Indonesia) is a known source of shrinkage in the industry.
Other net job shedders per unit of real value-added growth include leather products & footwear (-
0.88), food & beverages (-0.86), electronics (excluding ICT) (-0.70) and furniture (-0.37).
In all, these results point to poor labour absorption in the province. The strong labour absorbing
subsectors have tended to post average to below average real GDPR growth, while the strong
growing subsectors, merely maintained their work forces or actually continued to shed labour. Two
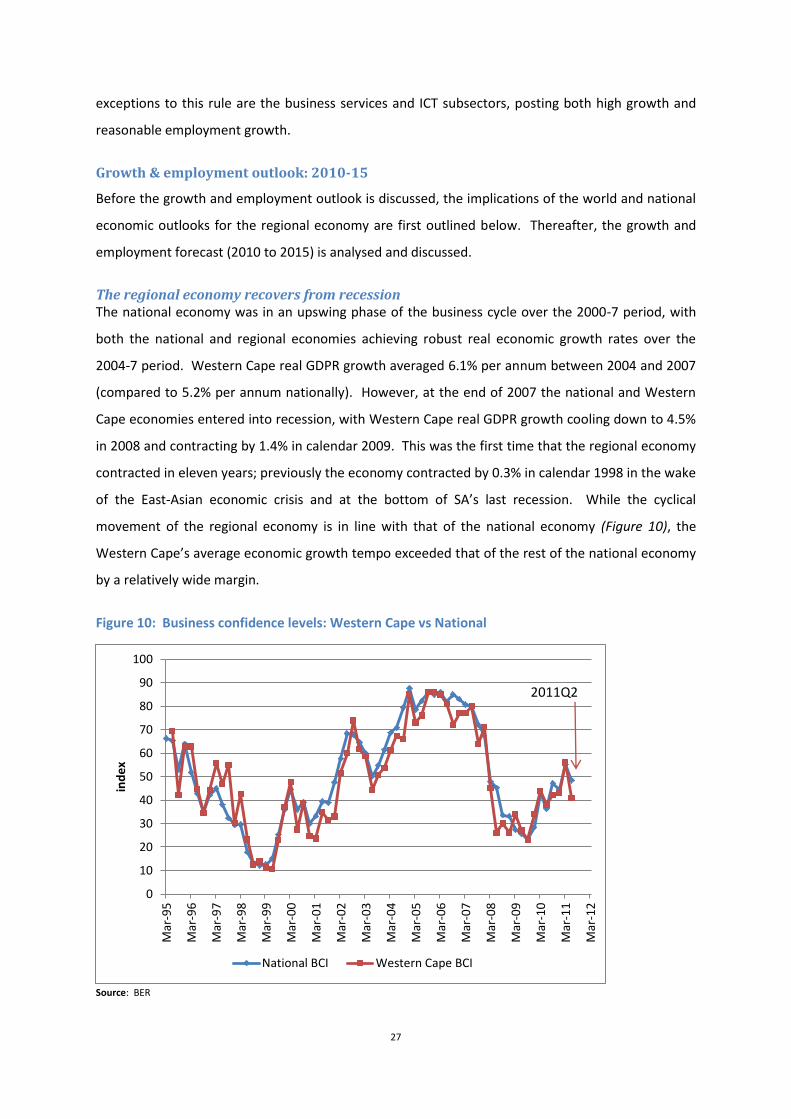
27
exceptions to this rule are the business services and ICT subsectors, posting both high growth and
reasonable employment growth.
Growth & employment outlook: 2010-15
Before the growth and employment outlook is discussed, the implications of the world and national
economic outlooks for the regional economy are first outlined below. Thereafter, the growth and
employment forecast (2010 to 2015) is analysed and discussed.
The regional economy recovers from recession The national economy was in an upswing phase of the business cycle over the 2000-7 period, with
both the national and regional economies achieving robust real economic growth rates over the
2004-7 period. Western Cape real GDPR growth averaged 6.1% per annum between 2004 and 2007
(compared to 5.2% per annum nationally). However, at the end of 2007 the national and Western
Cape economies entered into recession, with Western Cape real GDPR growth cooling down to 4.5%
in 2008 and contracting by 1.4% in calendar 2009. This was the first time that the regional economy
contracted in eleven years; previously the economy contracted by 0.3% in calendar 1998 in the wake
of the East-Asian economic crisis and at the bottom of SA’s last recession. While the cyclical
movement of the regional economy is in line with that of the national economy (Figure 10), the
Western Cape’s average economic growth tempo exceeded that of the rest of the national economy
by a relatively wide margin.
Figure 10: Business confidence levels: Western Cape vs National
Source: BER
0
10
20
30
40
50
60
70
80
90
100
Mar
-95
Mar
-96
Mar
-97
Mar
-98
Mar
-99
Mar
-00
Mar
-01
Mar
-02
Mar
-03
Mar
-04
Mar
-05
Mar
-06
Mar
-07
Mar
-08
Mar
-09
Mar
-10
Mar
-11
Mar
-12
ind
ex
National BCI Western Cape BCI
2011Q2

28
The Western Cape economy’s real economic growth rate averaged 4.3% over the period 2000-9
compared to 3.6% for the rest of the national economy. The national economy (outside the Western
Cape) contracted by a slightly more severe 1.6% in 2009. The dominance of the cyclically less
sensitive tertiary sectors in the Western Cape GDPR assist in explaining the less severe contraction of
regional economic activity.
Figure 11 shows that the Western Cape economy has emerged from the 2008/9 recession. The
BER’s Western Cape business confidence index registered a trough during the third quarter of 2009
where only 23% of the executives responding to the survey reported satisfactory general business
conditions; this index subsequently recovered to a level where more than half of the executives
reported satisfactory business conditions, namely 56% during 2011Q1. The tendency in the Western
Cape Barometer9 corresponds with the business confidence index. It registered a cyclical low during
the fourth quarter of 2009 (October at a level of 97.5) and increased close to 114 during the
subsequent 16 months. However, from both charts it is clear that the second quarter of 2011
witnessed a notable decline in confidence and it would appear growth momentum. The BER’s
reading of this slowdown is that it is likely to be temporary as the consumer sector adjusts to a more
sustainable growth tempo while the economic recovery spreads to the manufacturing and building
sectors.
Figure 11: The Western Cape economy recovers from recession
Source: BER/ BOE Private Bank
9 The Western Cape Barometer is a composite index of a whole range of regional economic indicators across all sectors produced by
economists.co.za (Director: Mike Schüssler) and sponsored by BOE Private Bank.
95
97
99
101
103
105
107
109
111
113
115
20
30
40
50
60
70
80
90
Mar-05 Mar-06 Mar-07 Mar-08 Mar-09 Mar-10 Mar-11
ind
ex
20
05
=10
0
ind
ex
WC Business confidence WC Barometer
2011Q1

29
All indications are that the regional (and national) economies are embarked on a recovery. National
economic growth came in at 2.8% in calendar 2010 and that estimated for the Western Cape is
2.7%10. The Western Cape economic momentum was initially a bit slow but gathered speed towards
the end of last year – the regional business confidence index jumped by 13 index points (to a level of
56) during the first quarter of 2011, before it dropped to 41 index points again during the second
quarter of 2011.
Macro-economic parameters The global and national economic outlooks were discussed above. What are the implications for the
Western Cape economy? The following remarks may be in order:
In terms of growth, as discussed in the introduction to this section, the regional economy
has embarked on a recovery from the recession, which commenced at the end of 2007. In
the near term the growth momentum should pick up steam, albeit that growth is unlikely to
be spectacular – there are simply too many uncertainties around, which are clearly
impacting business confidence levels. While real economic growth has regained positive
momentum during the second half of 2009, the employment picture only responded
towards the end of last year and more specifically early this year. Business animal spirits and
fixed investment spending are not out of the woods yet, it is happening slowly, but should
gain momentum as the year progresses and over the short term. Economic growth is
therefore expected to accelerate this year and over the short term from the 2.7% recovery
experienced last year (and the contraction in calendar 2009).
In an environment of low inflation and interest rates and high real wage increases, consumer
spending has been lively, albeit not sustainable in the absence of more meaningful
employment creation. In fact the early part of 2011 may experience some slowdown in
consumer spending as nominal wage rates recede from the high levels negotiated last year
on the back of high inflation and while job growth remains anaemic. Household budgets will
also be impacted by the increase in transport costs, the rise in food prices and electricity
costs. CPI inflation is expected to accelerate from the 3.7% registered in January/ February
2011 to actually breaching the upper range of the 3-6% inflation target towards the end of
the year. It is also this inflation prospect behind expectations of, first a normalisation of
interest rates (expected during the second half of 2011) and then, second, a tightening of
10
Actual provincial GDPR data is only available up to and including 2009; the first estimates in respect of calendar 2010 will be published
by Statistics SA in its November 2011 GDP release.
30
monetary policy next year and beyond. We are therefore faced by a rising interest rate cycle
over the short to medium term; interest rate levels are at 30-year lows currently.
The initial phase of the economic recovery was characterised by poor employment growth
and subdued conditions in the non-durable goods producing sectors, while consumer
spending on durable goods in particular has picked up rapid speed – nationally real
consumer spending on durable goods accelerated by 24% in 2010, generating lively demand
conditions in these goods producing sectors. The strong rand exchange rate is also keeping
a lid on prices, albeit also at the source of strong imports competing with local producers.
This competition has also put the local manufacturing sector recovery under pressure, albeit
encouraging that the latest data point to stronger momentum in this sector.
In a global environment with low interest rates in the advanced economies, a weak US
dollar, strong dollar-based commodity prices underpinned by robust growth in emerging and
developing economies, international capital flows to the latter group of countries, especially
those currencies exposed to commodities, are likely to be strong. This suggests a relatively
strong rand exchange rate, while the possibility of exchange rate volatility cannot be
excluded, i.e. may be the worst of two worlds for local manufacturers. On the other hand,
the non-tradable services sector should benefit from the strong currency to the extent that
it keeps a lid on inflation and interest rates and buoys the domestic market.
Figure 12 shows how the Western Cape Economic Barometer has responded positively in the
regional tertiary sectors during the first quarter of 2011, whilst lagging in the manufacturing
sector. The other sector where business conditions are clearly lagging is the building and
construction sector, which has not emerged from recession at the time of writing. The
combination of a weak housing market and a stricter credit environment (following the
introduction of the NCA), excess supply in the non-residential building market and the
aftermath of the Soccer World Cup- related infrastructure spending by the government are
impacting adversely on the building and construction sector. This is not only a regional, but
a national trend.
What the Economic Barometer and the BER Western Cape business confidence index
suggests, is that by the first quarter of 2011, the Western Cape economic recovery from the
2008/9 recession has developed meaningful momentum. While the improvement is clearly
led by the fast-growing tertiary sectors, scope remains for the recovery to spread to the
other sectors.
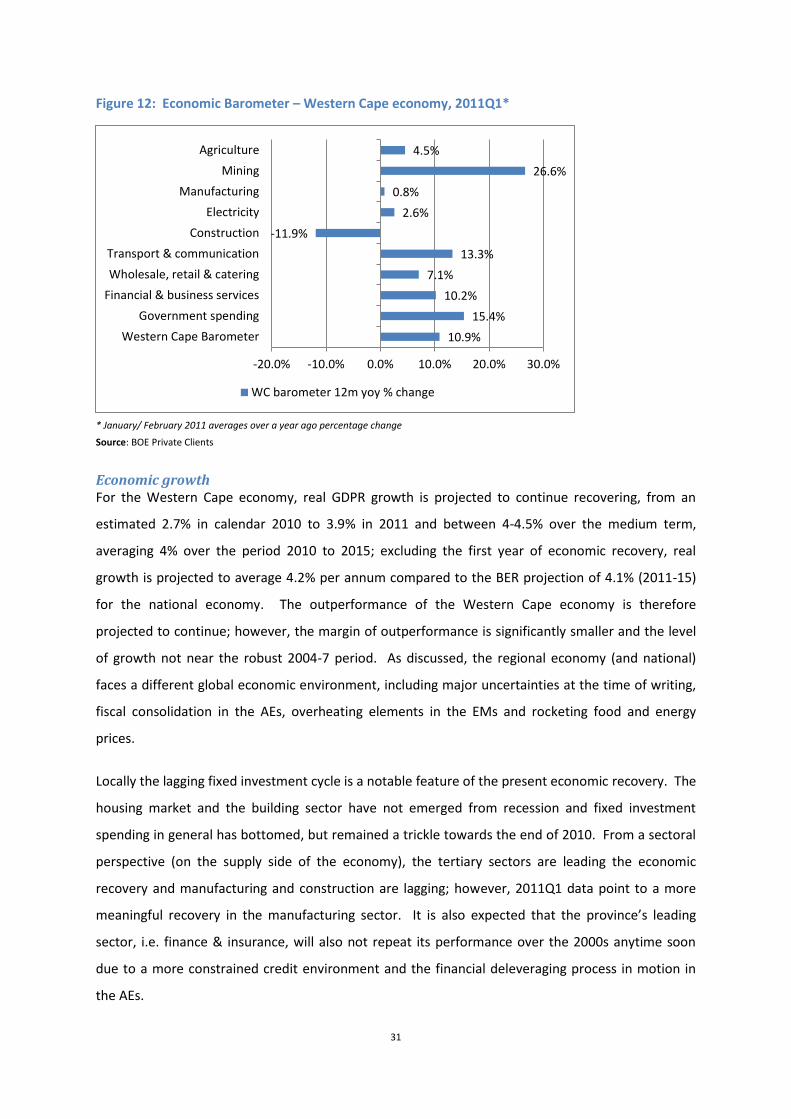
31
Figure 12: Economic Barometer – Western Cape economy, 2011Q1*
* January/ February 2011 averages over a year ago percentage change
Source: BOE Private Clients
Economic growth For the Western Cape economy, real GDPR growth is projected to continue recovering, from an
estimated 2.7% in calendar 2010 to 3.9% in 2011 and between 4-4.5% over the medium term,
averaging 4% over the period 2010 to 2015; excluding the first year of economic recovery, real
growth is projected to average 4.2% per annum compared to the BER projection of 4.1% (2011-15)
for the national economy. The outperformance of the Western Cape economy is therefore
projected to continue; however, the margin of outperformance is significantly smaller and the level
of growth not near the robust 2004-7 period. As discussed, the regional economy (and national)
faces a different global economic environment, including major uncertainties at the time of writing,
fiscal consolidation in the AEs, overheating elements in the EMs and rocketing food and energy
prices.
Locally the lagging fixed investment cycle is a notable feature of the present economic recovery. The
housing market and the building sector have not emerged from recession and fixed investment
spending in general has bottomed, but remained a trickle towards the end of 2010. From a sectoral
perspective (on the supply side of the economy), the tertiary sectors are leading the economic
recovery and manufacturing and construction are lagging; however, 2011Q1 data point to a more
meaningful recovery in the manufacturing sector. It is also expected that the province’s leading
sector, i.e. finance & insurance, will also not repeat its performance over the 2000s anytime soon
due to a more constrained credit environment and the financial deleveraging process in motion in
the AEs.
10.9%
15.4%
10.2%
7.1%
13.3%
-11.9%
2.6%
0.8%
26.6%
4.5%
-20.0% -10.0% 0.0% 10.0% 20.0% 30.0%
Western Cape Barometer
Government spending
Financial & business services
Wholesale, retail & catering
Transport & communication
Construction
Electricity
Manufacturing
Mining
Agriculture
WC barometer 12m yoy % change
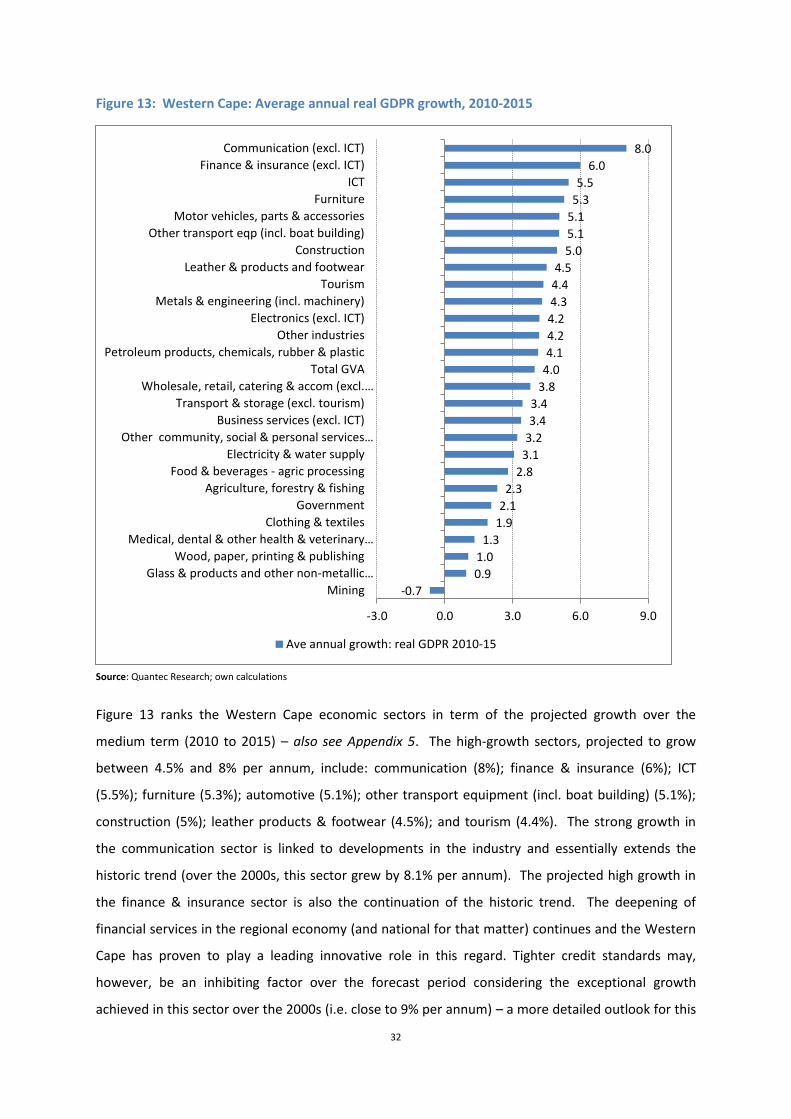
32
Figure 13: Western Cape: Average annual real GDPR growth, 2010-2015
Source: Quantec Research; own calculations
Figure 13 ranks the Western Cape economic sectors in term of the projected growth over the
medium term (2010 to 2015) – also see Appendix 5. The high-growth sectors, projected to grow
between 4.5% and 8% per annum, include: communication (8%); finance & insurance (6%); ICT
(5.5%); furniture (5.3%); automotive (5.1%); other transport equipment (incl. boat building) (5.1%);
construction (5%); leather products & footwear (4.5%); and tourism (4.4%). The strong growth in
the communication sector is linked to developments in the industry and essentially extends the
historic trend (over the 2000s, this sector grew by 8.1% per annum). The projected high growth in
the finance & insurance sector is also the continuation of the historic trend. The deepening of
financial services in the regional economy (and national for that matter) continues and the Western
Cape has proven to play a leading innovative role in this regard. Tighter credit standards may,
however, be an inhibiting factor over the forecast period considering the exceptional growth
achieved in this sector over the 2000s (i.e. close to 9% per annum) – a more detailed outlook for this
-0.7
0.9
1.0
1.3
1.9
2.1
2.3
2.8
3.1
3.2
3.4
3.4
3.8
4.0
4.1
4.2
4.2
4.3
4.4
4.5
5.0
5.1
5.1
5.3
5.5
6.0
8.0
-3.0 0.0 3.0 6.0 9.0
Mining
Glass & products and other non-metallic…
Wood, paper, printing & publishing
Medical, dental & other health & veterinary…
Clothing & textiles
Government
Agriculture, forestry & fishing
Food & beverages - agric processing
Electricity & water supply
Other community, social & personal services…
Business services (excl. ICT)
Transport & storage (excl. tourism)
Wholesale, retail, catering & accom (excl.…
Total GVA
Petroleum products, chemicals, rubber & plastic
Other industries
Electronics (excl. ICT)
Metals & engineering (incl. machinery)
Tourism
Leather & products and footwear
Construction
Other transport eqp (incl. boat building)
Motor vehicles, parts & accessories
Furniture
ICT
Finance & insurance (excl. ICT)
Communication (excl. ICT)
Ave annual growth: real GDPR 2010-15

33
sector is provided below. The ICT sector also has an established high-growth track record and it is
one of the contemporary high-growth areas of the economy (a more detailed look at the ICT sector
is provided below). The growth in the automotive subsector (mainly vehicle components in the
Western Cape) can be linked to the lively conditions in the vehicle manufacturing sector, benefitting
from keen domestic and export demand.
The strong links with this sector also assist in explaining the high projected growth in leather
products & footwear (mainly leather car seats) and furniture (upholstery car seats). Furniture
manufacturers also stand to benefit from keen household spending on durable goods. While the
construction sector is slow to recover, it is expected to regain momentum over the medium term.
The other key sector of the Western Cape, namely tourism, is also projected to continue doing well.
Tourist arrivals in the economy are expected to lift permanently following the Soccer World Cup; the
development initiatives within the sector, including marketing efforts, are expected to pay
dividends; a more detailed outlook for this sector is provided below.
In the middle of the range, i.e. subsectors growing by 3% to 4.3%, include: metals & engineering (see
below); electronics; other industries; petro-chemicals; wholesale, retail, catering & accommodation;
transport & storage; business services; other CSP services; and electricity.
At the bottom of the range, i.e. subsectors growing by less than 3% per annum are: food &
beverages (2.8% per annum); agriculture, forestry & fishing (2.3%); government (2.1%); clothing &
textiles (1.9%); medical services (1.3%); wood, paper, printing & publishing (1%); non-metal minerals
(0.9%); and mining (-0.7%).
Employment Employment in the Western Cape held up well in the first year of the recession, i.e. 2008, with total
employment still expanding by 2.7%. However, employment contracted sharply by close to 4% in
calendar 2009, with an estimated 72 000 job opportunities lost. Employment contracted across the
board, however, the sectors suffering double digit losses include: glass products & other non-metal
minerals (-19.6%); electricity & water supply (-13.2%); furniture (-12.2%); automotive (-12.1%); and
clothing & textiles (-11.8%). The sharp rates of retrenchments in the furniture, automotive and
clothing & textiles sectors reflect the slump experienced in durable and semi-durable goods sales
and household consumption. While consumer spending in these sectors recovered swiftly in 2010,
driven by low interest rates, the strength of the rand exchange rate favoured imports above local
production and further employment losses were experienced in 2010 – aggregate regional

34
employment is estimated to have declined by a further 1.3% in 2010, i.e. another 23 200 job
opportunities.
Figure 14: Western Cape: Average annual employment growth, 2010-2015
Source: Quantec Research; own calculations
As noted, while business confidence has recovered and confirming that the economic recovery is
well on track, business fixed investment spending is currently lagging the economic recovery and
therefore employment creation. However, provided the economic recovery stays put, the hiring of
workers is likely to follow; regional employment is forecast to grow by 1.9% in 2011 and slightly
above 2% on average over the remainder of the forecast period. Considering the sectoral
employment patterns, the following remarks are in order (also see Appendix 6):
The projections of employment growth in the various manufacturing sectors are generally
higher compared to the 2000-9 history. This is explained by the BER’s relatively bullish
-2.0
-0.7
-0.5
-0.5
-0.3
-0.2
0.0
0.1
0.1
0.2
0.4
0.4
0.6
0.8
0.8
0.8
1.0
1.3
1.3
1.4
1.5
1.6
1.8
2.5
2.7
2.8
3.1
-3.0 -2.0 -1.0 0.0 1.0 2.0 3.0 4.0
Clothing & textiles
Leather & products and footwear
Mining
Transport & storage (excl. tourism)
Glass & products and other non-metallic…
Electricity & water supply
Construction
Petroleum products, chemicals, rubber & plastic
Food & beverages - agric processing
Furniture
Finance & insurance
Wood, paper, printing & publishing
Communication (excl. telecom)
Other community, social & personal services…
Electronics (excl. ICT)
Other transport eqp (incl. boat building)
Metals & engineering (incl. machinery)
Agriculture, forestry & fishing
Medical, dental & other health & veterinary…
Government
Total employment
Other industries
ICT
Wholesale, retail, catering & accom (excl.…
Tourism
Business services (excl. ICT)
Motor vehicles, parts & accessories
Ave annual growth: employment 2010-15

35
forecast for real export growth (between 6-6.5% per annum), which benefits the
manufacturing sector. This export growth rate is high in view of the 4.5% average achieved
over the 2000-8 period (i.e. excluding the 2009 slump). It therefore follows that the
employment growth rates for the Western Cape manufacturing sector may be overstated
even being only marginally positive (0.3% per annum projected, 2010-15). However, it
should be noted that a range of initiatives are underway in a number of sectors, which may
arrest the historical trend.
In the tertiary sector, the projected employment growth rates are generally on a par with
the history, if not slightly lower, as one would expect in a slightly weaker economic growth
environment.
The fastest growing sectors in terms of employment creation (with employment expanding
at rates between 2.5% and 3.5%) are: automotive (3.1% per annum, 2010-15); business
services (excl. ICT) (2.8%); tourism (2.7%) and wholesale, retail, catering & accommodation
(2.5%).
Following these sectors are the average-growing sectors in terms of employment, namely
ICT (1.8%): other manufacturing industries (1.6%); government (1.4%); medical & health
services (1.3%); metals & engineering (1%); other transport equipment (incl. boat building)
(0.8%); electronics (0.8%) and other CSP services (0.8%).
Marginal job growth is projected in the case of communications; wood, paper, printing &
publishing; finance & insurance, furniture, food & beverages and petro-chemicals and zero
growth in the case of construction. The work forces in these subsectors are essentially
projected to remain stable. Subsectors projected to marginally shed jobs over the medium
term include: electricity & water supply, non-metal minerals, transport & storage, mining
and leather products & footwear. In the clothing & textiles sector job shedding is projected
at a rate of 2% per annum. As noted, key policy intervention initiatives may prove these
projections, informed by the historical trends and relationships, overly pessimistic.
The job losses in agriculture are projected to cease, with the workforce forecast to actually
grow marginally over the medium term; it is not certain that this is a realistic prospect in
view of the sector’s track record over the 2000s; however, agricultural prospects are bright
(see below).

36
Exports Western Cape real export growth averaged close to 6% per annum over the period 1995 to 2009.
The regional economy’s exports are sensitive to developments in our trading partner economies as
Figure 15 shows export volumes contracted sharply during 2009 in the wake of the global financial
crisis and subsequent recession, as well as during 2001 at the time of the previous (mild) global
recession. Real export growth tapered off from 11.8% in 2007 to -0.6% in 2008 and then fell sharply
by 14% in 2009; it is estimated to have recovered in 2010 posting a 3.1% overall growth rate. Real
export growth in the province averaged 4% per annum over the 2000-9 period.
The Western Cape region’s exports are dominated by the agricultural, forestry & fishing and food &
beverage sectors, i.e. the food value chain. In all, these two subsectors account for close to half
(45%) of the real export growth in the province over the 2000-9 period – agriculture, forestry &
fishing, 34.5% and food & beverages, 9.9% - see Figure 16. Other sectors that made a sizable
contribution include: metals & engineering (15.1%); business services (8.7%); other manufacturing
industries (7.9%); petro-chemicals (6.5%); communication (5.7%); and automotive (5.6%). Of the
sectors that made a positive contribution to export growth in the province, these sectors account for
83% of the cumulative export growth between 2000 and 2009.
Figure 15: Western Cape real export growth, 1995 – 2015
Source: Quantec Research; own calculations
The remaining 17% of the cumulative growth was contributed by wholesale & retail (3.2%);
electronics (2.8%); tourism (2.4%); transport & storage (2.3%); finance & insurance (2.3%); other
community, social & personal services (1.4%); ICT (1.4%) and other transport equipment (including
-15
-10
-5
0
5
10
15
20
19
95
19
96
19
97
19
98
19
99
20
00
20
01
20
02
20
03
20
04
20
05
20
06
20
07
20
08
20
09
20
10
20
11
20
12
20
13
20
14
20
15
yoy
% c
han
ge
Forecast Average 1995-2009

37
boat building) (0.7%). Subsectors that subtracted from export growth, include clothing & textiles (-
7%); leather & footwear (-1.7%); wood, paper, printing & publishing (-1.2%), furniture (-0.6%) and
non-metal minerals (-0.3%).
Figure 16: Western Cape: Sectoral contribution to cumulative real export growth, 2000-9
Source: Quantec Research; own calculations
Considering the outlook for export growth a number of factors dictate against a repeat of the high
growth witnessed over the 2000s (excluding the 2008/9 recession). Firstly, global economic growth
is projected to be more moderate compared to the 2000s; this is particularly true for the Western
Cape’s key trading partner economies in Europe and the USA. Secondly, the anticipated macro-
economic environment (already shaping up) is likely to dictate against exports, i.e. one with a
buoyant domestic market benefiting from a strong rand, relatively low interest rates and inflation
and a strong terms of trade. Manufacturers may opt to supply locally rather than to export,
particularly in the face of a demanding exchange rate, which is a third factor.
-7.0%
-1.7%
-1.2%
-0.6%
-0.3%
0.0%
0.0%
0.1%
0.2%
0.7%
1.4%
1.4%
2.3%
2.3%
2.4%
2.8%
3.2%
5.6%
5.7%
6.5%
7.9%
8.7%
9.9%
15.1%
34.5%
-10.0% -5.0% 0.0% 5.0% 10.0% 15.0% 20.0% 25.0% 30.0% 35.0% 40.0%
Cloth & tex
Lth & ftw
Wood & paper
Furniture
NM minerals
Construction
Medical & health
Electricity
Mining
Other tpt eqp
ICT
Other CSP
Finance (ex ICT)
Tpt & storage (ex tourism)
Tourism
Electronics (excl. ICT)
Trade (ex tourism)
Auto
Communication (ex telecom)
Petro-chemicals
Other industries
Business services (excl. ICT)
Food & bev
Metals & engineering
Agriculture
Contribution to growth: real Exports 2000-9
High
Medium
Low

38
Therefore, the projected export growth for the Western Cape over the 2010-15 period, namely 5.2%
per annum, is somewhat below the 1995-2009 trend rate of 5.9% (Figure 15) and the average
growth achieved over the period 2000-7, i.e. 6.8% (see Appendix 7). However, in view of the
constraints, this remains a positive export outlook. The projected growth rates for the individual
sectors are depicted in Figure 17; leading the pack are automotive, communications, metals &
engineering and agriculture all projected to grow exports by more than 8% per annum, as well as
electronics and business services.
In the sections below, the prospects for a selected number of individual primary, secondary and
tertiary industries/ subsectors are considered. The first section commences with an overview of the
primary sector.
Figure 17: Western Cape: Average real export growth, 2010-15
Source: Quantec Research; own calculations
-3.3
0.0
0.2
0.4
1.1
1.7
2.3
2.3
3.1
4.0
4.8
4.9
4.9
5.2
5.5
6.2
6.2
6.3
6.3
6.3
7.4
7.8
8.1
8.6
9.5
10.3
-6.0 -4.0 -2.0 0.0 2.0 4.0 6.0 8.0 10.0 12.0
Cloth & tex
Other industries
Construction
Wood & paper
NM minerals
Food & bev
Mining
Finance (ex ICT)
Furniture
Trade (ex tourism)
Petro & chemicals
ICT
Other CSP
Total
Other tpt eqp
Tourism
Medical & health
Lth & ftw
Electricity
Tpt & storage (ex tourism)
Business services (excl. ICT)
Electronics (excl. ICT)
Agriculture
Metals & engineering
Communication (ex telecom)
Auto
Ave annual growth: real Exports 2010-15
High
Medium
Low

39
95.0%
5.0%
Agriculture,forestry & fishing
Mining
Source: Quantec research
Primary sector – overview
The primary sector contributed 4.5% to
the Western Cape GDPR on average over
the period 2000-9. The bulk of the
primary sector GDPR originated in the
agricultural, forestry & fishing sector
(95%); the remainder was produced in the
mining sector (5%). The agricultural
sector is labour intensive and employed
more than 10% on average of the
Western Cape workforce over the period
2000-9 compared to its GDPR contribution of 4.3%. Mining is a small sub-sector in the province,
contributing only 0.2% both to GDPR and employment. Being heavily influenced by climatic
conditions, it follows that production in the agricultural sector (and therefore the primary sector)
can tend to be volatile – see Figure 19. Following a bumper year in calendar 2008, when real value
added grew by close to 18%, production contracted during calendar 2009. A modest recovery is
estimated for calendar year 2010 and projected to shape-up over the medium term; growth is
simply forecast to average around the trend rate. The recent developments and outlook for the
agricultural sector are discussed below.
Figure 19: Western Cape: Primary sector real GDPR growth, 1995 – 2015
Source: Quantec Research
-6.0
-4.0
-2.0
0.0
2.0
4.0
6.0
8.0
10.0
19
96
19
97
19
98
19
99
20
00
20
01
20
02
20
03
20
04
20
05
20
06
20
07
20
08
20
09
20
10
20
11
20
12
20
13
20
14
20
15
yoy
% c
han
ge
Forecast
Average 1995-2009
Figure 18: Composition of the WC primary sector: contribution to real value-add, 2000-9

40
2007 2008 2009
2000-09
2011-15f
Real GDPR Yoy% 1.6 17.7 -5.5 2.1 2.3 % of WC 3.7 4.2 4.0 4.3 3.7
Employment Yoy% -7.2 -5.7 -9.6 -6.2 1.3 % of WC 8.2 7.5 7.0 10.6 7.2
Exports Yoy% 5.6 19.6 -9.0 15.7 8.1
Source: Quantec Research; own calculations
46.9%
30.1%
13.4%
8.8%
0.7% Horticulture
Animals
Animal products
Field crops
Other
Source: Troskie, D: March 2010
Agriculture Background. The agricultural sector is one of the drivers of the Western Cape economy and it is
clear that the Western Cape has a comparative advantage in agriculture (and food processing) –
while the province contributed 14.9% to national GDP (2009), the agricultural sector contributed
23% to national agricultural value-add and 15.6% of national farm jobs; 7.2% of Western Cape
employment is in agriculture, forestry & fishing11. Output is diversified – fruit, poultry, winter grains,
viticulture and vegetables comprise 75% of total output.
Growth and employment. Agricultural real
value added grew at a relatively modest
rate of 2.1% per annum over the 2000-9
period; its longer term real growth rate is
2.5% (in line with national). With the
growth in agriculture real value added
below average for the province, it follows
that its share of the economy declined
(from around 5% in 1999 to 4% in 2009) and this is a long-term trend. Furthermore, despite the
positive growth in real GDPR, the number of farm jobs in the province declined quite sharply – from
238 000 in 2000 to 128 800 in 2009, with the sector’s share of overall provincial employment
declining from 15% in 1999 to 7% in 2009.
The rate of decline in employment in the
Western Cape was slightly faster than in the
rest of South Africa. According to the
Provincial Department of Agriculture, the
job shedding which occurred in the sector,
involved mainly seasonal workers
(Department of Agriculture, March 2010:
17).
Part of the secular decline in agriculture
simply reflects the higher economic growth
rates in the secondary and tertiary sectors of the economy. It needs to be emphasised that the
decline in agriculture is relative and, apart from employment levels, not in absolute terms. Real
11
Troskie points out that a far larger number of people depended on agriculture for more than 50% of their income. In 2005 an
estimated 182 000 people were employed in Western Cape agriculture, forestry & fishing; however, more than 280 000 people were dependent for more than 50% of their income from agriculture (Troskie, D, March 2010a: 12)
Figure 20: WC gross farming income (GFI) 2007 R16.6 billion
Table 4: WC agriculture, forestry & fishing (constant 2005
prices)
41
value added continues to expand and reflects higher levels of productivity in the agricultural sector.
The sector provides food to the country, earns foreign exchange, employs a large number of workers
and is a source as well as a market for industrial goods – see the sector’s input-output relationships
below.
Main growth drivers. The sector has major forward linkages with the food & beverage
sectors, as well as tourism (wine) – see Table 5 below. Market conditions in these sectors
will therefore be an important determinant of offset conditions for the agricultural sector.
Furthermore, and for obvious reasons, agricultural sector prospects are closely tied to the
climatic conditions. Apart from this fact, the rate of fixed investment spending in the sector
will be an important determinant of growth over the longer term. In this regard, the
provincial Department of Agriculture reports that capital spending in the sector has
increased to almost one third of national capital spending in the agricultural sector, which
reflects the degree of optimism and commitment within the Western Cape farming
community. Other important drivers of growth in the sector, include population growth,
living standards (i.e. the protein content of standard diets increases along with the wealth of
a nation), urbanisation, alternative uses of agricultural products (e.g. bio-fuel), research &
development and technology, which can have dramatic effects on yields in agriculture.
Exports. Agricultural exports performed exceptionally well over the past 10-15 years; it has
grown by 13.5% per annum in real terms between 2000 and 2009; the annual compound
rate of growth since 1995 has been 15.5% (Quantec Research), which is a stellar
performance. The two main export products are raw, dried & processed fruit as well as
wine. The leading export sector is the wine industry. Whilst part of the agriculture
processing sector (see below), the wine industry exports skyrocketed from 21 million litres
of wine in 1992 to 411 million litres in 2007 (Troskie, D, March 2010a: 16). It is important to
note that the export orientation of the wine industry underwent a major shift in recent
years, with the share of crops being exported skyrocketing from 5.2% in 1992 to 45% in 2008
(Troskie, D, March 2010a: 16). A range of other agricultural and (processed) food product
exports have also performed well, including fruit (citrus, apples & pears), tea, spices, meat,
vegetable fibres and fruit juices. The export success is so much more noteworthy as it
occurred in the face of substantial farming subsidies to competing producers in developed
countries in Europe, Japan and the USA. Furthermore, to the extent that tariffs are lowered
(the objective of Doha), these countries introduce ever more stringent sanitary and phyto-

42
-6
-3
0
3
6
9
12
yoy
% c
han
ge
Agric, forestry & fishing WC GDPRSource: Quantec Research; own calculations
sanitary measures, which renders it almost impossible for developing countries to achieve,
i.e. effective trade barriers.
Outlook. While the year-to-year
growth in agriculture real value
added is dependent on climatic
developments, the trend growth
rate of the sector is projected to
persist over the medium term. In
reality, the level of real value
added can fluctuate around this
trend (witness the history in this
regard – see Figure 21). In 2010,
the BFAP projected an average real growth rate in (national) net farm income of 2.8% over
the 10-year period up to 2019 (BFAP, 2010: vii). The Quantec projection for Western Cape
agricultural real value added is 2.3% per annum over the 2010-15 period12. The short-term
anticipated weather patterns are not conclusive insofar as the Western Cape region will
experience too much or too little rain, which points to the likelihood of a normal winter
season.
The OECD/FAO calculates that globally consumption of grains (wheat, rice and coarse grains)
exceeded production by an average 15 million tons per annum over the 2000-8 period
(Troskie, D, March 2010b: 3). This is a reflection of the global food shortages which are
arising as populous developing economies’ (e.g. China and India) living standards improve
and urbanisation flourishes. It furthermore assists in explaining the sharp increases in food
prices between 2006 and 2008 (apart from rising production costs tied to the increase in the
crude oil price). The increase in food prices embodies a trend break rather than a temporary
phenomenon (Troskie, D: Interview, 2011). Therefore, from a price perspective the general
outlook for agriculture seems to be rosy; however, a number of constraints and challenges
face the sector.
Constraints/ challenges. The major constraint facing the agricultural sector is resource availability; in
the Western Cape Province – known for its high dependence on irrigation – the prime concern is
12
It should be noted that the BFAP uses time series analysis methods to forecast agricultural net income, based on detailed and in-depth
analysis of key agricultural commodities. These forecasts should be regarded as superior. The Quantec projection, in turn, is valuable to the extent that it provides information on what is possible in a given macro-economic scenario and given historic trends and relationships.
Figure 21: WC real GDPR growth 2005–2015: agri-culture, forestry & fishing

43
water, not land. The planned increased height of the Clanwilliam dam is projected to put an
additional 5000 hectares under irrigation (Troskie, D: 2011). Research has shown how agricultural
yields can be increased by the careful management of water resources; this presents a key challenge
to the Western Cape agricultural sector. Another constraint regards slow progress with
transformation and the land reform programme, which creates uncertainty and impacts negatively
on capital spending in the sector. Increased competition from other southern hemisphere
developing economies (Chile, Brazil, Argentina, New Zealand) is another challenge, particularly in
view of the relatively strong performance of the rand exchange rate. As noted, the sanitary and
phyto-sanitary standards in the AEs represent effective trade barriers for local producers.
Furthermore, the tariff walls in developing countries such as India present additional challenges for
the local sector. Tariffs on agricultural imports to India, for instance, range from 38-50%. In this
regard the proposed trade deal between India and SACU presents interesting opportunities (Troskie,
D: 2011). An additional institutional challenge regards the compliance with international trade
regulatory requirements.
Inter-industry linkages. The agriculture, forestry & fishing sector has strong forward linkages with
the food & beverage sector – more than 80% of its output is directed at these two sectors (see Table
5); wood & paper products also feature as markets due to the forestry activities and packaging
needs; and the catering & hospitality sector for obvious reasons. The sector does not have strong
backward linkages; however, distribution (wholesale and retail), the food sector (supplying feed
stocks) and chemicals (fertilizer) are obvious important input sectors – 40% of total inputs derive
from these sectors – see Table 5.
Intermediate output comprises 47% of total output and close to half of the regional output meets
final demand, i.e. mainly consumer spending and exports (70% of final sales, or one third of output,
comprise exports), which reflects the export intensity of the agriculture, forestry and fishing sector
in the Western Cape.
Table 5: Input-output relationships of the WC agriculture sector – 2008 basic values (Rm)
Agriculture, forestry & fishing: Input data (2008) R million % share Cum %
Wholesale & retail trade 1099.3 13.9% 13.9% Food 1004.2 12.7% 26.7% Basic chemicals 930.4 11.8% 38.5% Transport & storage 895.6 11.4% 49.8% Agriculture, forestry & fishing 760.3 9.6% 59.5% Finance & insurance 678.8 8.6% 68.1% Coke & refined petroleum products 646.7 8.2% 76.3% Medical, dental & other health & veterinary services 624.9 7.9% 84.2% Motor vehicles, parts & accessories 176.6 2.2% 86.4% Other chemicals & man-made fibres 157.9 2.0% 88.4% Textiles 124.8 1.6% 90.0%
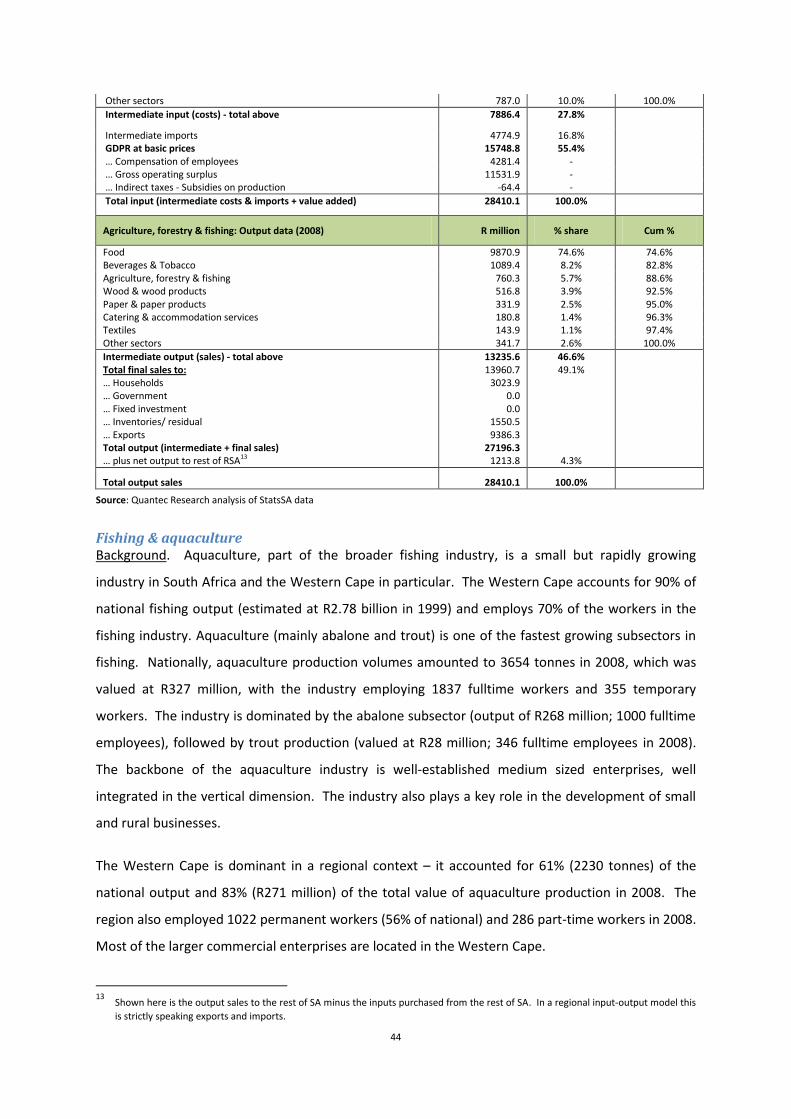
44
Other sectors 787.0 10.0% 100.0%
Intermediate input (costs) - total above 7886.4 27.8%
Intermediate imports 4774.9 16.8% GDPR at basic prices 15748.8 55.4% … Compensation of employees 4281.4 - … Gross operating surplus 11531.9 - … Indirect taxes - Subsidies on production -64.4 -
Total input (intermediate costs & imports + value added) 28410.1 100.0%
Agriculture, forestry & fishing: Output data (2008) R million % share Cum %
Food 9870.9 74.6% 74.6% Beverages & Tobacco 1089.4 8.2% 82.8% Agriculture, forestry & fishing 760.3 5.7% 88.6% Wood & wood products 516.8 3.9% 92.5% Paper & paper products 331.9 2.5% 95.0% Catering & accommodation services 180.8 1.4% 96.3% Textiles 143.9 1.1% 97.4% Other sectors 341.7 2.6% 100.0%
Intermediate output (sales) - total above 13235.6 46.6% Total final sales to: 13960.7 49.1% … Households 3023.9 … Government 0.0 … Fixed investment 0.0 … Inventories/ residual 1550.5 … Exports 9386.3 Total output (intermediate + final sales) 27196.3 … plus net output to rest of RSA13 1213.8 4.3%
Total output sales 28410.1 100.0%
Source: Quantec Research analysis of StatsSA data
Fishing & aquaculture Background. Aquaculture, part of the broader fishing industry, is a small but rapidly growing
industry in South Africa and the Western Cape in particular. The Western Cape accounts for 90% of
national fishing output (estimated at R2.78 billion in 1999) and employs 70% of the workers in the
fishing industry. Aquaculture (mainly abalone and trout) is one of the fastest growing subsectors in
fishing. Nationally, aquaculture production volumes amounted to 3654 tonnes in 2008, which was
valued at R327 million, with the industry employing 1837 fulltime workers and 355 temporary
workers. The industry is dominated by the abalone subsector (output of R268 million; 1000 fulltime
employees), followed by trout production (valued at R28 million; 346 fulltime employees in 2008).
The backbone of the aquaculture industry is well-established medium sized enterprises, well
integrated in the vertical dimension. The industry also plays a key role in the development of small
and rural businesses.
The Western Cape is dominant in a regional context – it accounted for 61% (2230 tonnes) of the
national output and 83% (R271 million) of the total value of aquaculture production in 2008. The
region also employed 1022 permanent workers (56% of national) and 286 part-time workers in 2008.
Most of the larger commercial enterprises are located in the Western Cape.
13
Shown here is the output sales to the rest of SA minus the inputs purchased from the rest of SA. In a regional input-output model this
is strictly speaking exports and imports.

45
28.7%
19.1% 16.9%
11.0%
5.9%
18.4%
Wholesale/exportDirect toconsumersFood processors
Restaurants
Retail
Other
Source: AISA, September 2009
Growth and employment. The
aquaculture industry is growing rapidly
off a small base. Real growth rates
averaged around 25% per annum during
the late 1990s; between 2005 and 2008,
the growth in production tonnage is
estimated at 7.8% per annum; 32% per
annum in value terms (PERO, 2010).
Employment in the aquaculture industry
is estimated to have grown by 80%
between 2005 and 2008, with growth in the abalone subsector doing particularly well. With South
Africa known to produce the second best quality abalone species in the world (Japan produces the
best quality) and given the international trend that half of all human fishing consumption is met by
the aquaculture industry, the growth potential of the local industry is huge. However, the sense in
the industry has matured to one of realism and major initiatives have been introduced in recent
years, culminating in the establishment of the Western Cape Aquaculture Development Initiative
(WCADI), which mission it will be to “assist in the economic growth, development and transformation
of the sector”. Sector specialists are optimistic that key challenges regarding unity of vision and an
end to the fragmentation characterising the industry in recent years will be overcome.
Main growth drivers/ inter-industry linkages. The aquaculture industry has evolved from
being production driven to being demand driven. Figure 22 shows the composition of the
main market channels for aquaculture producers. Ultimately aquaculture products are
destined for human consumption and it follows that the household consumer plays the
dominant role on the demand side of the industry. Apart from exports (in SA mainly
conducted via wholesalers), the remainder of aquaculture output is destined directly or
indirectly (via the retail and catering sector or the processing sector) to the local consumer.
The typical drivers of consumer demand for non-durable goods (e.g. food and beverages), or
services (e.g. restaurants) will also apply in the case of aquaculture products, namely after
tax real wage income, in turn determined by nominal wage rates, tax rates, inflation and
employment growth. While market intelligence studies are underway, it is to be expected
that the higher end of the consumer market (LSM8-10) will be relatively more exposed to
aquaculture products and one should expect cyclicality in demand in line with general
economic conditions. The domestic market is somewhat constrained as aquaculture is
relatively unknown and the local public is not fish eating, but specialists foresee growth in
Figure 22: Market channels for aquaculture products
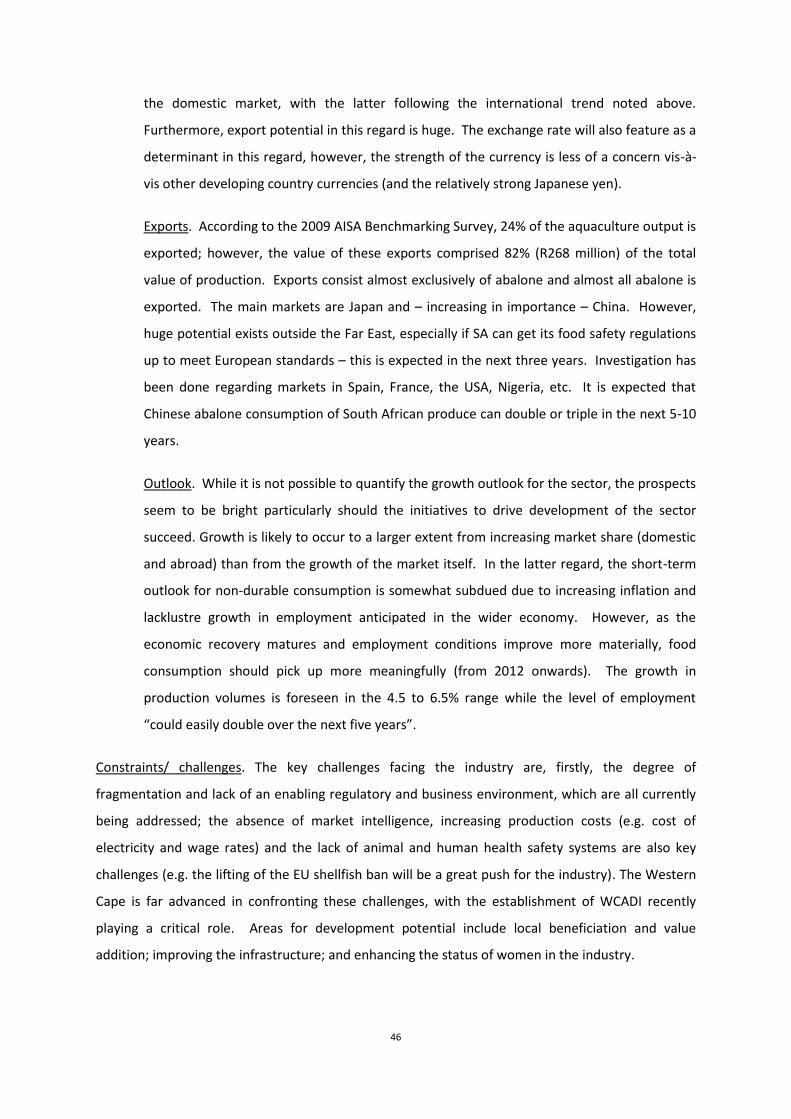
46
the domestic market, with the latter following the international trend noted above.
Furthermore, export potential in this regard is huge. The exchange rate will also feature as a
determinant in this regard, however, the strength of the currency is less of a concern vis-à-
vis other developing country currencies (and the relatively strong Japanese yen).
Exports. According to the 2009 AISA Benchmarking Survey, 24% of the aquaculture output is
exported; however, the value of these exports comprised 82% (R268 million) of the total
value of production. Exports consist almost exclusively of abalone and almost all abalone is
exported. The main markets are Japan and – increasing in importance – China. However,
huge potential exists outside the Far East, especially if SA can get its food safety regulations
up to meet European standards – this is expected in the next three years. Investigation has
been done regarding markets in Spain, France, the USA, Nigeria, etc. It is expected that
Chinese abalone consumption of South African produce can double or triple in the next 5-10
years.
Outlook. While it is not possible to quantify the growth outlook for the sector, the prospects
seem to be bright particularly should the initiatives to drive development of the sector
succeed. Growth is likely to occur to a larger extent from increasing market share (domestic
and abroad) than from the growth of the market itself. In the latter regard, the short-term
outlook for non-durable consumption is somewhat subdued due to increasing inflation and
lacklustre growth in employment anticipated in the wider economy. However, as the
economic recovery matures and employment conditions improve more materially, food
consumption should pick up more meaningfully (from 2012 onwards). The growth in
production volumes is foreseen in the 4.5 to 6.5% range while the level of employment
“could easily double over the next five years”.
Constraints/ challenges. The key challenges facing the industry are, firstly, the degree of
fragmentation and lack of an enabling regulatory and business environment, which are all currently
being addressed; the absence of market intelligence, increasing production costs (e.g. cost of
electricity and wage rates) and the lack of animal and human health safety systems are also key
challenges (e.g. the lifting of the EU shellfish ban will be a great push for the industry). The Western
Cape is far advanced in confronting these challenges, with the establishment of WCADI recently
playing a critical role. Areas for development potential include local beneficiation and value
addition; improving the infrastructure; and enhancing the status of women in the industry.
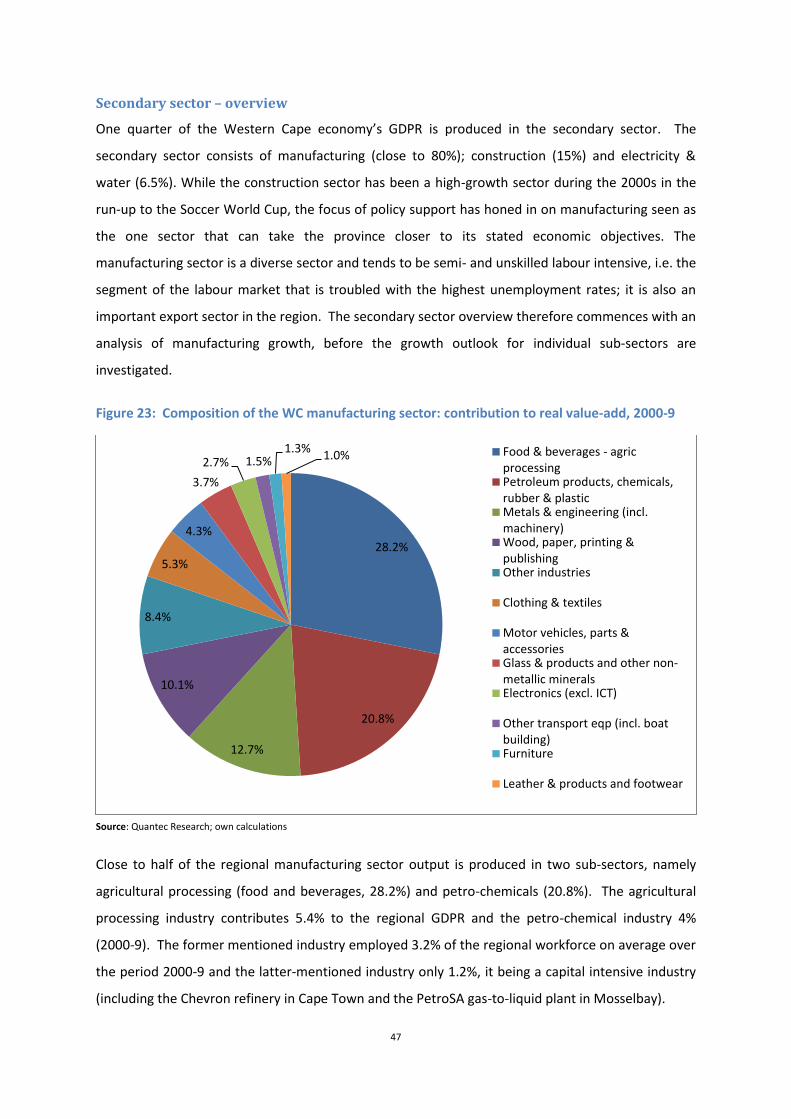
47
Secondary sector – overview
One quarter of the Western Cape economy’s GDPR is produced in the secondary sector. The
secondary sector consists of manufacturing (close to 80%); construction (15%) and electricity &
water (6.5%). While the construction sector has been a high-growth sector during the 2000s in the
run-up to the Soccer World Cup, the focus of policy support has honed in on manufacturing seen as
the one sector that can take the province closer to its stated economic objectives. The
manufacturing sector is a diverse sector and tends to be semi- and unskilled labour intensive, i.e. the
segment of the labour market that is troubled with the highest unemployment rates; it is also an
important export sector in the region. The secondary sector overview therefore commences with an
analysis of manufacturing growth, before the growth outlook for individual sub-sectors are
investigated.
Figure 23: Composition of the WC manufacturing sector: contribution to real value-add, 2000-9
Source: Quantec Research; own calculations
Close to half of the regional manufacturing sector output is produced in two sub-sectors, namely
agricultural processing (food and beverages, 28.2%) and petro-chemicals (20.8%). The agricultural
processing industry contributes 5.4% to the regional GDPR and the petro-chemical industry 4%
(2000-9). The former mentioned industry employed 3.2% of the regional workforce on average over
the period 2000-9 and the latter-mentioned industry only 1.2%, it being a capital intensive industry
(including the Chevron refinery in Cape Town and the PetroSA gas-to-liquid plant in Mosselbay).
28.2%
20.8%
12.7%
10.1%
8.4%
5.3%
4.3%
3.7%
2.7% 1.5% 1.3%
1.0% Food & beverages - agricprocessingPetroleum products, chemicals,rubber & plasticMetals & engineering (incl.machinery)Wood, paper, printing &publishingOther industries
Clothing & textiles
Motor vehicles, parts &accessoriesGlass & products and other non-metallic mineralsElectronics (excl. ICT)
Other transport eqp (incl. boatbuilding)Furniture
Leather & products and footwear

48
Three other sizable manufacturing sub-sectors are metals & engineering (12.7%); wood, paper,
printing & publishing (10.1%) and other manufacturing industries (8.4%). The clothing & textiles
sub-sector contributed 5.3% to the regional manufacturing real value add over the period 2000-9;
however, this sector’s contribution has shrunk considerably. Other smaller manufacturing sub-
sectors include motor vehicles, parts & accessories (4.3%); non-metal mineral products (3.7%);
electronics (2.7%); other transport equipment (mainly boat building, 1.5%) and furniture (1.3%).
The size of the sub-sectors is one dimension; if a second dimension, namely the growth in real value-
add over the 2000-9 period, is added the sectoral contribution to manufacturing growth can be
derived – see Figure 24. From this chart it can be seen that the two largest manufacturing sub-
sectors, petro-chemicals (31.2%) and agricultural processing (17.1%) accounted by far for the largest
contribution to the region’s manufacturing real value-add over the 2000-9 period. Unfortunately
both these sectors fall into the bottom-left quadrant of Figure 6, indicating that both industries
retrenched workers on balance over the 2000-9 period.
Figure 24: WC Manufacturing: Contribution to cumulative real GDPR growth, 2000-9
Source: Quantec Research; own calculations
The other sub-sector which made a strong contribution to regional manufacturing GDPR is metals &
engineering (16.2%), outgrowing the average regional manufacturing sector; however, its
contribution to job creation was only marginal (at a rate of 0.3% per annum over the 2000-9 period).
31.2%
17.1%
16.2%
9.6%
5.9%
4.9%
4.3%
4.1%
4.1%
3.0% 0.3% -0.7% Petroleum products, chemicals,rubber & plasticFood & beverages - agricprocessingMetals & engineering (incl.machinery)Motor vehicles, parts &accessoriesOther industries
Clothing & textiles
Other transport eqp (incl. boatbuilding)Electronics (excl. ICT)
Furniture
Leather & products and footwear
Glass & products and other non-metallic mineralsWood, paper, printing &publishing
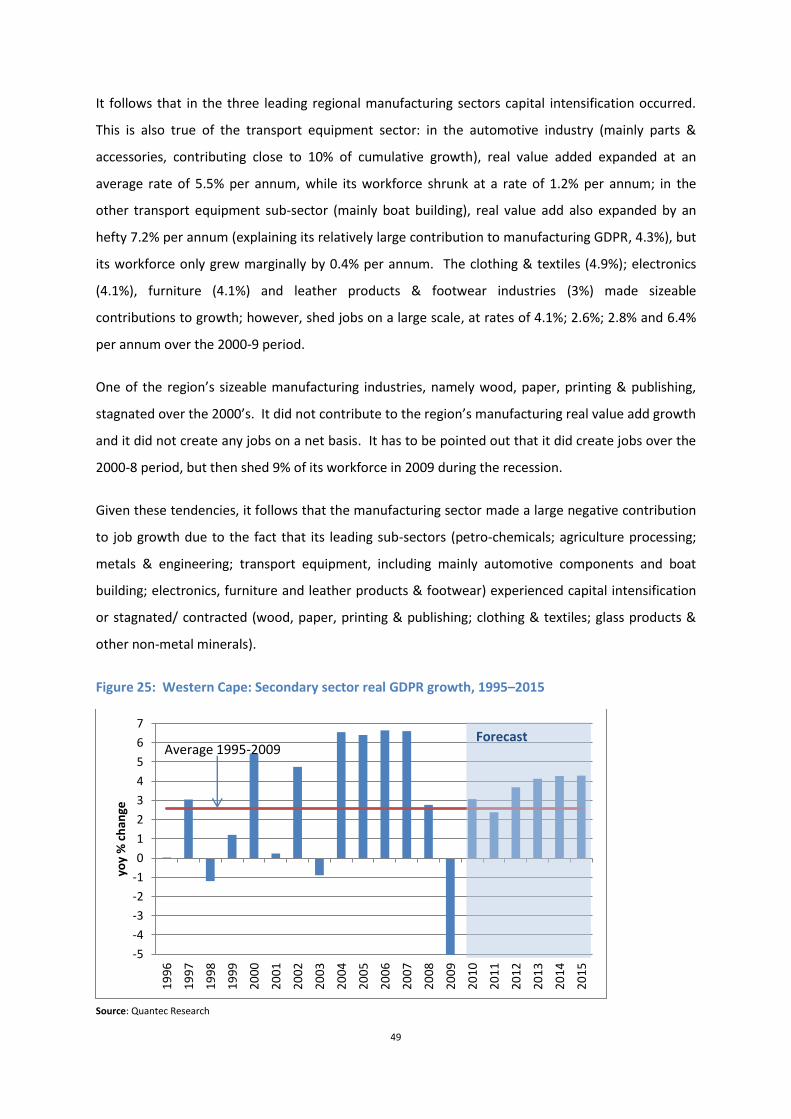
49
It follows that in the three leading regional manufacturing sectors capital intensification occurred.
This is also true of the transport equipment sector: in the automotive industry (mainly parts &
accessories, contributing close to 10% of cumulative growth), real value added expanded at an
average rate of 5.5% per annum, while its workforce shrunk at a rate of 1.2% per annum; in the
other transport equipment sub-sector (mainly boat building), real value add also expanded by an
hefty 7.2% per annum (explaining its relatively large contribution to manufacturing GDPR, 4.3%), but
its workforce only grew marginally by 0.4% per annum. The clothing & textiles (4.9%); electronics
(4.1%), furniture (4.1%) and leather products & footwear industries (3%) made sizeable
contributions to growth; however, shed jobs on a large scale, at rates of 4.1%; 2.6%; 2.8% and 6.4%
per annum over the 2000-9 period.
One of the region’s sizeable manufacturing industries, namely wood, paper, printing & publishing,
stagnated over the 2000’s. It did not contribute to the region’s manufacturing real value add growth
and it did not create any jobs on a net basis. It has to be pointed out that it did create jobs over the
2000-8 period, but then shed 9% of its workforce in 2009 during the recession.
Given these tendencies, it follows that the manufacturing sector made a large negative contribution
to job growth due to the fact that its leading sub-sectors (petro-chemicals; agriculture processing;
metals & engineering; transport equipment, including mainly automotive components and boat
building; electronics, furniture and leather products & footwear) experienced capital intensification
or stagnated/ contracted (wood, paper, printing & publishing; clothing & textiles; glass products &
other non-metal minerals).
Figure 25: Western Cape: Secondary sector real GDPR growth, 1995–2015
Source: Quantec Research
-5
-4
-3
-2
-1
0
1
2
3
4
5
6
7
19
96
19
97
19
98
19
99
20
00
20
01
20
02
20
03
20
04
20
05
20
06
20
07
20
08
20
09
20
10
20
11
20
12
20
13
20
14
20
15
yoy
% c
han
ge
Forecast Average 1995-2009

50
Yoy % change 2007 2008 2009 2000-
09 2010-
15f
Real GDPR 4.5 1.2 -9.0 1.5 2.8 Food 3.8 -1.7 -5.1 3.9 5.3 Beverages 5.1 3.8 -12.1 -0.2 0.4
Employment 2.4 2.2 -2.0 -1.3 0.1 Food -1.4 2.1 -3.0 -2.9 -0.1 Beverages 9.3 2.2 -0.4 2.1 0.4
Exports 12.2 -5.0 4.7 2.9 1.7 Food 7.8 -15.6 -4.6 -2.2 -0.1 Beverages 16.2 4.0 11.1 8.4 2.9
Source: Quantec Research
The other two sub-sectors in the secondary sector of the province are construction and electricity &
water supply. The construction industry was one of the fastest growing industries (with real value-
add growing by close to 9% per annum, 2000-9); however, it only made a marginal contribution to
net job growth (at a rate of 0.8% per annum). The construction sector accounts for 7-8% of the
regional workforce. The electricity & water supply sub-sector grew by a moderate 3.1% and created
jobs at a rate of 2.4% per annum; however, it only employs 0.4% of the regional workforce.
In all, Figure 25 shows that the secondary sector experienced above-trend growth over the 2004-7
period, following contractions in 1998 (when the national economy was in recession) and 2003
(when the manufacturing sector experienced a recession, both inside and outside the province due
to the rise in interest rates in 2002 and the dramatic strengthening of the currency in 2003). In line
with the national economy the sector witnessed a sharp downturn from the end of 2007, with real
value add growth declining from an average 6.5% over the 2004-7 period to 2.8% in calendar 2008
and to a precipitous contraction of 5.6% in 2009 at the trough of SA’s recent recession in the wake of
the global financial crisis. Growth bounced back in 2010 to an estimated 3.1%.
The outlook is also for 3.6% real value-added growth over the forecast period, which is above the
1995-2009 trend, but significantly below the robust growth of the 2004-7 period. More detail
regarding the outlook is provided below by considering developments and prospects within some
key sub-sectors.
Agriculture processing Background. The food (& beverage)-
processing sector14 is the largest
manufacturing subsector in the province,
both in terms of real value add and
employment. The sector contributed 28%
to real manufacturing GDPR on average
over the period 2000-9 and accounted for
17% of the real growth of the regional
manufacturing sector (see Figure 23 and
14
The agriculture processing sector here is defined according to the broad SIC classification of the food, beverages and tobacco sector,
consisting of the production, processing and preserving of meat, fish, fruit, vegetables, oils and fats; dairy products; grain mill products, other food products, beverages and tobacco products. Including beverages, for instance, this is not a strict definition of the food processing sector – see Kaiser Associates (2006: 6-8)
Table 6: WC food & beverages – agriculture processing: 2007–15 (constant 2005 prices)
51
Figure 24). Like agriculture (contributing 4.3% of Western Cape GDPR), food & beverages
(contributing 4% of GDPR) reveals a comparative advantage in the region considering the
contribution of these industries at the national level (3.2% and 2.7% respectively).
The food & beverage sector is also the largest export sector in the regional economy. It follows that
the food & beverage processing sector is a large contributor to the regional economy; unfortunately,
despite this fact and strong export growth, employment levels in the sector have declined from 60
500 in 2000 to 56 300 in 200915, i.e. an average decline of 1.3% per annum. This suggests that a
degree of mechanisation occurred in the (food processing) sector. Food processing industries tend
to be located outside the metro areas with them having an important impact on rural towns and
villages. Food processing also holds potential for the development of home-based industries. The
largest groups of food processing activities in the Western Cape include the following: fruit juicing,
canning and drying; cereal and grain milling (barley and wheat-based); poultry & pork products; red
meat products (mutton and ostrich); and dairy products (Kaiser Associates, 2006: 27).
Growth and employment. The growth in real value added in the food & beverage sector slowed
noticeably from 4.5% in 2007 to 1.2% in 2008 and contracting sharply by 9% in 2009 during the
recent recession; employment declined by 2% in 2009. The food & beverage sector is a complex,
diverse and well-established (mature) sector, with no SPV to direct the development of the sector.
Growth in real GDPR averaged a relatively modest 1.5% per annum over the 2000-9 period, i.e. well
below the average growth in the wider economy. However, growth did accelerate to a 4-5% level
over the lively 2004-7 period; excluding beverages, growth in food processing averaged 3.9% per
annum over the 2000-9 period.
Main growth drivers. The food & beverage sector has strong forward linkages with the retail
and catering & accommodation sectors, being a consumer goods manufacturing industry
(see linkages below). As such, the real after tax growth in employee compensation, in turn a
function of employment conditions and wage rates, social transfer payments and inflation, is
an important determinant of household spending on this category of household
consumption. In the Western Cape, tourism, with its strong linkages with the catering and
accommodation sector also plays an increasing important role.
Exports. Wine, canned fruit products, jams and dried fruit are key export products – the
rapidly growing developing economies like China, India with huge populations and not self-
15
According to Quantec Research, employment is split into 34 500 in food processing and 21 700 in beverages in 2009; the decline in
employment levels occurred in the food processing sector; in beverages employment grew by 2.1% per annum on average over the 2000-9 period.

52
-10
-5
0
5
10
yoy
% c
han
ge
Agric-processing WC GDPRSource: Quantec Research; own calculations
sufficient in food production present lucrative markets for the agriculture and processing
industries. Real food & beverage exports are projected to grow by 4.7% (2011-15); market
conditions in Europe will be a determining factor.
Outlook. With employment
conditions in the province and
the wider economy beginning to
pick up towards the end of 2010,
demand for food & beverage
products is likely to improve in
line; real GDPR growth for the
aggregate sector for calendar
2010 is estimated at 2.2% and
projected to average slightly
below 3% per annum over the next five years comparing well with the 2000-9 period
average of 1.5%. Over the short term, rising food prices and general inflation is likely to have
a negative bearing on household food & beverage consumption.
Constraints/ challenges. Whilst the Western Cape agricultural processing sector is a mature industry,
it appears to be well situated to accommodate new trends in the global food chain; the challenge in
terms of new growth is a matter of capitalising on these trends, e.g. specialist production linked to
farm and tourism activity; the export of higher value added products to niche markets overseas; etc.
(see Kaiser Associates, 2006: 1). Regarding constraints, with the sector having strong backward
linkages with the agricultural sector, water shortages and climate change are factors which could
affect such inputs. Furthermore, both within the industry and on the retail end there appears to be
competition issues. The concentration and strength of multinational brands and imports constrain
new entries into the industry and, secondly, the structure of the food retail market inhibits the
growth of small and medium enterprises. Kaiser Associates also identifies a need to address food
safety concerns.
Inter-industry linkages. The inter-connectedness between the agricultural and food processing
sectors are obvious from Table 5 and Table 7. The food sector has obvious strong backward linkages
with the agricultural sector (supplying 45% of total inputs); relatively strong intra-sector linkages also
exist (57% of output sales are directed within the sector) and the sector has keen distribution
requirements (wholesale & retail supply 15% of total inputs) – close to 75% of total inputs are
derived from these three sectors; business services and financial services are also two important
Figure 26: WC real GDPR growth 2005–2015: Agriculture processing – food & beverages

53
input sectors, along with transport & storage and plastic products sectors. On the output side, apart
from intra-industry sales, the agricultural, catering, leather products and beverages & tobacco
sectors are key offset areas. The bulk of output sales are directed to households (55%, mainly non-
durable goods sales) and to a lesser extent exports (14%).
Table 7: Input-output relationships of the WC food processing sector – 2008 basic values (Rm)
Food processing: Input data (2008) R million % share Cum %
Agriculture, forestry & fishing 9,870.9 45.1% 45.1% Food 3,225.6 14.7% 59.9% Wholesale & retail trade 3,214.4 14.7% 74.6% Business services 1,266.8 5.8% 80.3% Finance & insurance 790.3 3.6% 84.0% Transport & storage 627.2 2.9% 86.8% Plastic products 512.4 2.3% 89.2% Other community, social & personal services 416.2 1.9% 91.1% Other sectors 1,955.0 8.9% 100.0%
Intermediate input (costs) - total above 21,878.6 68.9%
Intermediate imports 2839.7 8.9% GDPR at basic prices 7032.3 22.1% … Compensation of employees 3860.5 - … Gross operating surplus 3193.8 - … Indirect taxes - Subsidies on production -22.0 -
Total input (intermediate costs & imports + value added) 31,750.6 100.0%
Food processing: Output data (2008) R million % share Cum %
Food 3,226 56.9% 56.9% Agriculture, forestry & fishing 1,004 17.7% 74.6% Catering & accommodation services 520 9.2% 83.7% Leather & leather products 287 5.1% 88.8% Beverages & Tobacco 208 3.7% 92.4% Other sectors 429 7.6% 100.0%
Intermediate output (sales) - total above 5672.3 17.9%
Total final sales to: 23351.5 73.5% … Households 17443.0 … Government 0.0 … Fixed investment 0.0 … Inventories/ residual 1463.4 … Exports 4445.1 Total output (intermediate + final sales) 29023.8 … plus net output to rest of RSA 2726.8 8.6%
Total output sales 31750.6 100.0%
Source: Quantec Research analysis of StatsSA data
Table 8: Input-output relationships of the WC beverage & tobacco sector – 2008 basic values (Rm)
Beverages & tobacco: Input data (2008) R million % share Cum %
Agriculture, forestry & fishing 1089.4 25.0% 25.0% Beverages & Tobacco 789.8 18.1% 43.2% Wholesale & retail trade 560.7 12.9% 56.1% Business services 385.2 8.9% 64.9% Paper & paper products 330.6 7.6% 72.5% Food 207.9 4.8% 77.3% Finance & insurance 198.2 4.6% 81.8% Metal products excluding machinery 167.2 3.8% 85.7% Glass & glass products 119.0 2.7% 88.4% Other community, social & personal services 111.1 2.6% 91.0% Other sectors 392.9 9.0% 100.0%

54
Intermediate input (costs) - total above 4351.9 32.1%
Intermediate imports 1560.2 11.5% GDPR at basic prices 7653.1 56.4% … Compensation of employees 2853.3 - … Gross operating surplus 4737.4 - … Indirect taxes - Subsidies on production 62.4 -
Total input (intermediate costs & imports + value added) 13565.2 100.0%
Beverages & tobacco: Output data (2008) R million % share Cum %
Beverages & Tobacco 790 71.4% 71.4% Catering & accommodation services 245 22.2% 93.5% Food 39 3.5% 97.0% Transport & storage 18 1.6% 98.6% Other sectors 15 1.4% 100.0%
Intermediate output (sales) - total above 1106.5 8.2%
Total final sales to: 11815.8 87.1% … Households 6618.0 … Government 0.0 … Fixed investment 0.0 … Inventories/ residual 883.1 … Exports 4314.7 Total output (intermediate + final sales) 12922.3 … plus net output to rest of RSA 642.9 4.7%
Total output sales 13565.2 100.0%
Source: Quantec Research analysis of StatsSA data
The input structure for the beverages & tobacco sector is similar to that of the food sector, i.e.
strong backward linkages with the agricultural sector, wholesale & retail, business services, paper
products and the food sector – including intra-industry inputs, these sectors supply more than 80%
of total inputs. Regarding packaging requirements, the metal & glass products sectors also feature as
key input sectors.
The beverage industry faces little import competition (given the licensing arrangements in the global
industry) and the bulk of output sales are directed at the household sector (close to 50%) and
exports (one third), similar to the food sector.

55
Yoy % change 2007 2008 2009 2000-
09 2010-
15f
Real GDPR 6.2 5.4 1.9 1.5 2.8 Textiles 8.1 6.8 -0.9 3.7 2.6 Clothing 4.9 4.5 4.0 1.5 1.5
Employment 0.6 -8.2 -11.8 -4.1 -2.0 Textiles 5.2 -2.7 -8.0 -2.3 -0.6 Clothing -1.5 -10.8 -13.8 -5.0 -2.9
Exports -19.5 -25.3 -12.6 -15.7 -3.3 Textiles -13.1 -16.9 -20.8 -10.3 -0.9 Clothing -24.1 -32.3 -4.1 -17.6 -5.6
Source: Quantec Research
Clothing & textiles Background. The share of clothing &
textile value-add in Western Cape GDPR
has declined from 2.5% in 1995 to 1% in
2009. The sector is under pressure from
intense competition from countries like
China, India & Indonesia. The sector
cannot compete against these countries in
the basic clothing range – Western Cape
firms tend to supply the higher end of the
market; the sector is forced to move higher up the value chain and exploiting niche markets. The
Western Cape clothing sector performs worse compared to the rest of the country (e.g. Gauteng and
KwaZulu-Natal) due to its domestic focus. The cost structure of the Western Cape sector is also
higher compared to the other provinces. The clothing industry has become design oriented and the
manufacture of garments is outsourced to CMT (Cut, Make and Trim) operators. The textile industry
has moved into the production of household and industrial textiles and do not supply the range of
fabrics required by the local clothing industry, which then have to import fabrics – this cause firms
not to meet rules-of-origin requirements for exports.
The sector employs 2% of the regional workforce; with the sector being in decline this has adverse
socio-economic implications for the provincial economy. The sector faces serious competitiveness
and growth challenges and while a range of support measures have been implemented in recent
years, it is too early to say whether these measures will arrest the declining employment trend. A
recent survey of 31 small businesses in the province found that employment levels can fall by a
further 5% in 2011, albeit that there is hope that the employment trend will stabilise and become
positive in 4-5 years’ time (Wolpe Strategic Economic Consultants, March 2010).
Growth and employment. Quantec Research data shows that real GDPR growth in the clothing &
textiles sector slowed sharply from 6.2% in 2007 to 1.9% in 2009, with 2.9% real growth estimated
for calendar 2010. These growth numbers reflects the fact that CMT industry sales (and
employment numbers) are growing. A major development in the sector is the production incentive
from central government amounting to R460 million allocated over two years; R220 million of this
support is destined for the Western Cape. The industry is in dire need of upgrading in order to
become competitive. According to sector specialists, this incentive will assist the industry materially.
It is aimed at stimulating manufacturing, fashion/ design, CMT’s and the retail sector. With the
incentive programme and the upgrading that is going to happen, analysts are positive that the
Table 9: WC clothing & textile sector: 2007-15

56
-6
-4
-2
0
2
4
6
8
yoy
% c
han
ge
Clothing & textiles WC GDPRSource: Quantec Research; own calculations
decline in the industry will be arrested. This is a bold expectation, but realistic should local retailers
come on board and place their orders with local companies. This is a main challenge for the sector.
There are individual companies doing well such as Prestige Clothing (CEO: Graham Choice) operating
a world class manufacturing plant.
Main growth drivers. The
clothing industry is a consumer
goods industry as its products
are ultimately destined for semi-
durable goods consumption by
households. The textile industry,
on the other hand, supplies both
to the household and the
industrial sectors – see the inter-
industry linkages in Table 10
below. Semi-durable goods
consumption (including clothing & footwear and household textiles) is a cyclical component
of real domestic expenditure. Apart from real personal disposable income (employment,
wage rates and tax rates), movements in interest rates also play a determining role. Another
important determinant of growth is relative price movements – clothing retailers have
grown business volumes substantially in recent years on the back of real price declines, in
turn, afforded by cheaper imports. This is a factor which may change going forward as
inflation in China is on the rise.
Exports. The clothing & textile sector is mainly focussed on the domestic market; only 12%
of clothing production is exported. Table 9 shows the adverse export trend in the sector –
the real value of textile & clothing exports declined by a massive 16% per annum over the
2000-9 period. However, initiatives are underway to improve clothing exports, such as the
establishment of the National Fashion Council (i.e. a forum for international role players in
the clothing industry), which is likely to give local players exposure to overseas companies
and markets.
Outlook. A key question regarding the outlook for the sector is whether the decline in the
industry will be arrested. While it is too early to make bold predictions in this regard, the
industry is poised at the cross roads: the cyclical recovery in household consumption is
relatively strong and well-established; the production incentive programme is being
Figure 27: WC real GDPR growth 2005–15: Clothing & textiles

57
Source: BER
implemented and clothing
manufacturers’ business confidence
have responded – see Figure 28.
The growth numbers in Table 9 are
based on historical relationships,
but could be too pessimistic. This
could be true for the clothing
sector; however, conditions and the
outlook for the textile sector
remains bleak, as reflected by the
persisting poor business confidence levels in the sector (Figure 28). Growth in real GDPR for
the clothing & textile sector is projected to average 2.8% over the next five years;
employment levels are projected to recede from 37 000 in 2009 to 32 700 by 2015.
However, this is a model projection, based on historical relationships and trends. The
outlook will be more positive should the recent support measures be effective.
Constraints/ challenges. The sector is under pressure to upgrade and improve its competitiveness for
longer-term sustainability. In the firm-level survey referred to above, low capital investment was
listed as the top obstacle to business growth in the clothing industry. In order of importance, the
other obstacles to growth listed were: increasing global competition; lack of raw materials;
restrictive industry regulations; and high production costs. The strong rand exchange rate is an
additional constraining factor. Retailers must source from local manufacturers – the DEDT has
software that shows that they can deliver at a similar price, higher margin should they source locally.
The big challenge is to get these retailers to come on board.
Inter-industry linkages. I n the textile sector intra-industry sales comprise a third of total output
sales; the sector’s links with other sectors are wide but not very strong (it is a relatively small sector
from an output perspective). On the input side distribution is a key requirement (wholesale &
retail), business services, man-made fibres and other chemicals, agriculture, and finance & insurance
– combined these sectors account for close to 80% of inputs; basic chemicals and plastic products
also feature as key inputs. On the output side, key offset areas are the clothing sector, the
automotive sector and agriculture – combined more than 75% of total output sales. Within the
province, final sales are directed at households and exports and comprise close to 40% of total
output.
Figure 28: Business confidence (BER survey)
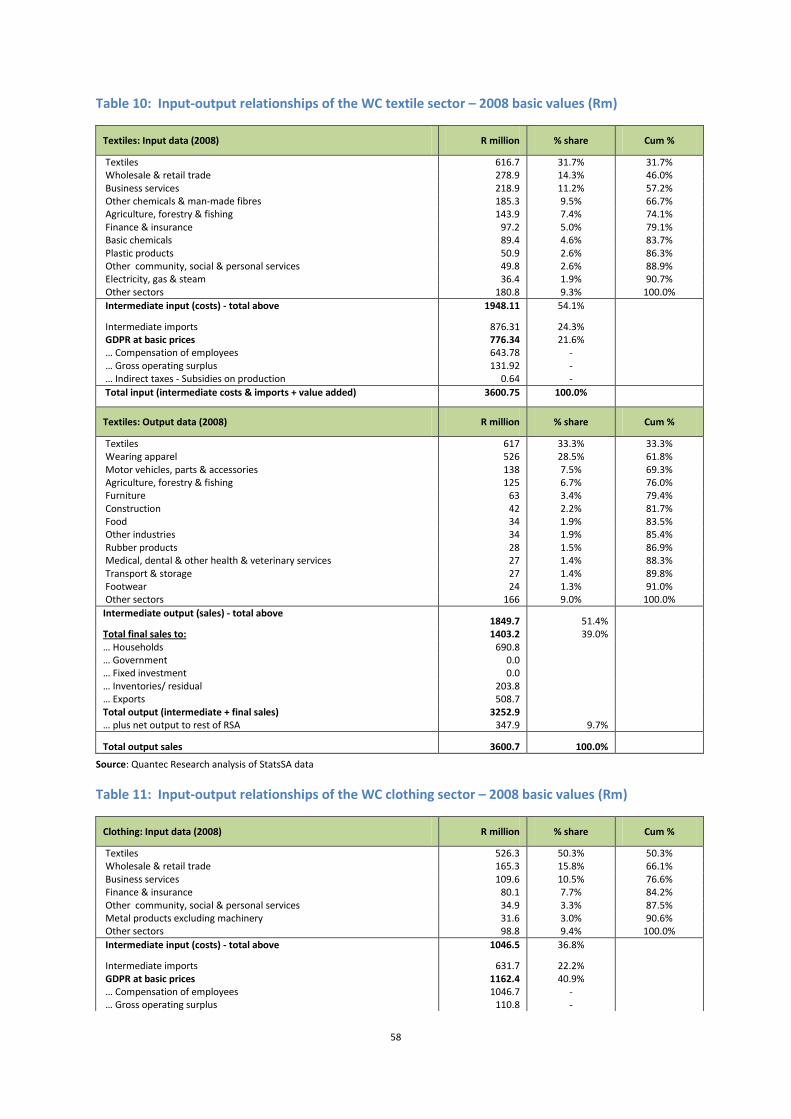
58
Table 10: Input-output relationships of the WC textile sector – 2008 basic values (Rm)
Textiles: Input data (2008) R million % share Cum %
Textiles 616.7 31.7% 31.7% Wholesale & retail trade 278.9 14.3% 46.0% Business services 218.9 11.2% 57.2% Other chemicals & man-made fibres 185.3 9.5% 66.7% Agriculture, forestry & fishing 143.9 7.4% 74.1% Finance & insurance 97.2 5.0% 79.1% Basic chemicals 89.4 4.6% 83.7% Plastic products 50.9 2.6% 86.3% Other community, social & personal services 49.8 2.6% 88.9% Electricity, gas & steam 36.4 1.9% 90.7% Other sectors 180.8 9.3% 100.0%
Intermediate input (costs) - total above 1948.11 54.1%
Intermediate imports 876.31 24.3% GDPR at basic prices 776.34 21.6% … Compensation of employees 643.78 - … Gross operating surplus 131.92 - … Indirect taxes - Subsidies on production 0.64 -
Total input (intermediate costs & imports + value added) 3600.75 100.0%
Textiles: Output data (2008) R million % share Cum %
Textiles 617 33.3% 33.3% Wearing apparel 526 28.5% 61.8% Motor vehicles, parts & accessories 138 7.5% 69.3% Agriculture, forestry & fishing 125 6.7% 76.0% Furniture 63 3.4% 79.4% Construction 42 2.2% 81.7% Food 34 1.9% 83.5% Other industries 34 1.9% 85.4% Rubber products 28 1.5% 86.9% Medical, dental & other health & veterinary services 27 1.4% 88.3% Transport & storage 27 1.4% 89.8% Footwear 24 1.3% 91.0% Other sectors 166 9.0% 100.0%
Intermediate output (sales) - total above 1849.7 51.4%
Total final sales to: 1403.2 39.0% … Households 690.8 … Government 0.0 … Fixed investment 0.0 … Inventories/ residual 203.8 … Exports 508.7 Total output (intermediate + final sales) 3252.9 … plus net output to rest of RSA 347.9 9.7%
Total output sales 3600.7 100.0%
Source: Quantec Research analysis of StatsSA data
Table 11: Input-output relationships of the WC clothing sector – 2008 basic values (Rm)
Clothing: Input data (2008) R million % share Cum %
Textiles 526.3 50.3% 50.3% Wholesale & retail trade 165.3 15.8% 66.1% Business services 109.6 10.5% 76.6% Finance & insurance 80.1 7.7% 84.2% Other community, social & personal services 34.9 3.3% 87.5% Metal products excluding machinery 31.6 3.0% 90.6% Other sectors 98.8 9.4% 100.0%
Intermediate input (costs) - total above 1046.5 36.8%
Intermediate imports 631.7 22.2% GDPR at basic prices 1162.4 40.9% … Compensation of employees 1046.7 - … Gross operating surplus 110.8 -

59
… Indirect taxes - Subsidies on production 4.8 -
Total input (intermediate costs & imports + value added) 2840.6 100.0%
Clothing: Output data (2008) R million % share Cum %
Printing, publishing & recorded media 58.4 17.7% 17.7% Wholesale & retail trade 49.5 15.0% 32.7% Communication 45.1 13.7% 46.4% Business services 31.5 9.5% 55.9% Medical, dental & other health & veterinary services 23.3 7.1% 63.0% Government 17.6 5.3% 68.3% Food 11.0 3.3% 71.6% Basic iron & steel 9.1 2.8% 74.4% Mining 8.5 2.6% 77.0% Other chemicals & man-made fibres 7.0 2.1% 79.1% Motor vehicles, parts & accessories 6.9 2.1% 81.2% Transport & storage 5.6 1.7% 82.9% Beverages & Tobacco 5.4 1.6% 84.5% Paper & paper products 5.0 1.5% 86.1% Machinery & equipment 4.8 1.5% 87.5% Metal products excluding machinery 4.3 1.3% 88.8% Basic chemicals 4.2 1.3% 90.1% Other sectors 32.7 9.9% 100.0%
Intermediate output (sales) - total above 329.8 11.6%
Total final sales to: 2110.9 74.3% … Households 1579.2 … Government 0.0 … Fixed investment 0.0 … Inventories/ residual 164.5 … Exports 367.2 Total output (intermediate + final sales) 2440.7 … plus net output to rest of RSA 399.9 14.1%
Total output sales 2840.6 100.0%
Source: Quantec Research analysis of StatsSA data
The clothing sector has relatively weak intermediate links with the other sectors of the economy; no
less than 22% of intermediate inputs are imported. Half of intermediate inputs are provided by the
textile sector while wholesale & retail, business services and finance & insurance are also key input
sectors – more than 80% of inputs are provided by these sectors. On the output side a whole range
of sectors acquires clothing products, however, inter-industry sales only account for 12% of total
output sales; three quarters of output sales are directed at final sales, mainly households (semi-
durable goods). A substantial part of output sales is directed at industries outside of the province.
Craft industries Background. Close to 1 in 3 craft producers nationally (6187) is found in the Western Cape (1662);
The Western Cape employs 15% of the national craft industry workforce (7156 workers); 60% of
hand craft retailers are situated in the Western Cape, with and estimated turnover of R200 to R500
million (2004). Retail is dominant in the provincial value matrix, followed by production and design.
The craft producers require extensive assistance in terms of marketing, export management and
product design; therefore intermediaries providing these services play a central role in the industry.
It is a diverse sector hosting small and micro enterprises in which the objectives are not always

60
uniform. The sector requires support to create commercially sustainable enterprises through
product development and supply chain integration, both within and with related sectors.
Producers aim for mid-to high end pricing with a wide product range. Consumer demand of African-
inspired handy crafts as well as corporate and government procurement demand present interesting
opportunities; as well as local and international tourism. Retail is the dominant aspect of the value
matrix in the Western Cape; this is followed by production (manufacturing) and design (services).
Constraints/ challenges. The key challenge is commercialisation, i.e. the migration of individual
enterprises to fully commercially oriented entities . Crafters tend to have individualistic mind-sets
which hamper cooperation and hence a high degree of fragmentation exists in the sector. The
industry is also known for its high failure rate – businesses come and go in and out of the sector. The
industry is also confronted with import competition – local crafters cannot compete in export
markets with other developing countries. In all, a lack of an integrated approach to the
implementation of development strategies and projects exists in the sector.
The vision for the sector is that by 2014, the crafts sector will consist of “professional commercial
manufacturing enterprises using hand-techniques, exceptionally skilled master crafters and
supportive intermediaries and retailers that work both independently and collaboratively.” (MEDS,
2008: 225). Funding of the CCDI has doubled, with the intention to boost employment and export
trade. Scope exists to create more jobs in the rural areas; the craft sector tended to be metro-based
in the past.
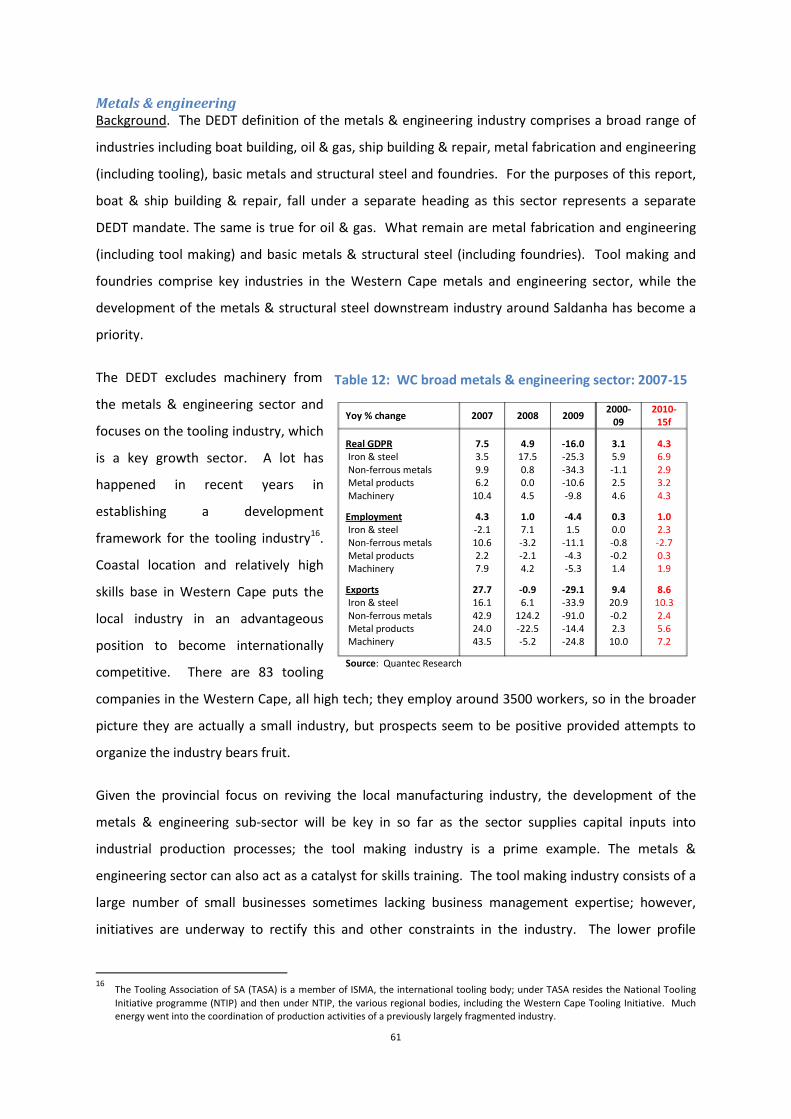
61
Yoy % change 2007 2008 2009 2000-
09 2010-
15f
Real GDPR 7.5 4.9 -16.0 3.1 4.3 Iron & steel 3.5 17.5 -25.3 5.9 6.9 Non-ferrous metals 9.9 0.8 -34.3 -1.1 2.9 Metal products 6.2 0.0 -10.6 2.5 3.2 Machinery 10.4 4.5 -9.8 4.6 4.3
Employment 4.3 1.0 -4.4 0.3 1.0 Iron & steel -2.1 7.1 1.5 0.0 2.3 Non-ferrous metals 10.6 -3.2 -11.1 -0.8 -2.7 Metal products 2.2 -2.1 -4.3 -0.2 0.3 Machinery 7.9 4.2 -5.3 1.4 1.9
Exports 27.7 -0.9 -29.1 9.4 8.6 Iron & steel 16.1 6.1 -33.9 20.9 10.3 Non-ferrous metals 42.9 124.2 -91.0 -0.2 2.4 Metal products 24.0 -22.5 -14.4 2.3 5.6 Machinery 43.5 -5.2 -24.8 10.0 7.2
Source: Quantec Research
Metals & engineering Background. The DEDT definition of the metals & engineering industry comprises a broad range of
industries including boat building, oil & gas, ship building & repair, metal fabrication and engineering
(including tooling), basic metals and structural steel and foundries. For the purposes of this report,
boat & ship building & repair, fall under a separate heading as this sector represents a separate
DEDT mandate. The same is true for oil & gas. What remain are metal fabrication and engineering
(including tool making) and basic metals & structural steel (including foundries). Tool making and
foundries comprise key industries in the Western Cape metals and engineering sector, while the
development of the metals & structural steel downstream industry around Saldanha has become a
priority.
The DEDT excludes machinery from
the metals & engineering sector and
focuses on the tooling industry, which
is a key growth sector. A lot has
happened in recent years in
establishing a development
framework for the tooling industry16.
Coastal location and relatively high
skills base in Western Cape puts the
local industry in an advantageous
position to become internationally
competitive. There are 83 tooling
companies in the Western Cape, all high tech; they employ around 3500 workers, so in the broader
picture they are actually a small industry, but prospects seem to be positive provided attempts to
organize the industry bears fruit.
Given the provincial focus on reviving the local manufacturing industry, the development of the
metals & engineering sub-sector will be key in so far as the sector supplies capital inputs into
industrial production processes; the tool making industry is a prime example. The metals &
engineering sector can also act as a catalyst for skills training. The tool making industry consists of a
large number of small businesses sometimes lacking business management expertise; however,
initiatives are underway to rectify this and other constraints in the industry. The lower profile
16
The Tooling Association of SA (TASA) is a member of ISMA, the international tooling body; under TASA resides the National Tooling
Initiative programme (NTIP) and then under NTIP, the various regional bodies, including the Western Cape Tooling Initiative. Much energy went into the coordination of production activities of a previously largely fragmented industry.
Table 12: WC broad metals & engineering sector: 2007-15

62
-20
-15
-10
-5
0
5
10
yoy
% c
han
ge
Metals & engineering WC GDPRSource: Quantec Research; own calculations
smaller producers need assistance in terms of coordination and on-going assessment rather than
investment incentives and marketing support, which suit the high-profile capital intensive firms
better.
Growth and employment. The aggregate sector, metals, metal products, machinery & equipment
contributed 2½% of Western Cape GDPR and employment on average over the period 2000-9. The
broad group has shown below-average growth and declining employment since 1995; however, the
negative employment trend stabilised over the past 10 years. In terms of growth in real value add,
the iron & steel sub-sector (e.g. Saldanha Steel) has outperformed, but is highly capital intensive
against the need to develop labour intensive downstream industry. The foundry industry used to be
an above-average growth sector; however, the large foundries are closing down due to a lack of
OEM presence – industries cannot integrate with production pipelines of OEMs such as is happening
in the case of the automotive sector. Metal products are also faced with problems due to the input
price of steel. Within the broader metals & engineering sector in the Western Cape, the machinery
subsector did relatively well, expanding real value add at a rate of 4.6% per annum and growing
employment by 1.4% per annum (2000-9).
Main growth drivers. The broader
metals and machinery sector
consists of a range of capital goods
industries supplying capital inputs
to other industries. The sector
produces a range of products from
structural steel (building &
construction sector) to machinery
and tools, dies and moulds. As
such the industry is strongly linked
with other secondary sectors, manufacturing in particular – see industry linkages below.
From the expenditure side of the economy, both public sector and private sector fixed
investment spending are key drivers of demand for capital goods like structural steel
products, machinery, etc. The general level of business confidence, the rate of production
capacity utilisation in the wider economy and the level of long-term interest rates are all key
determinants of capital goods spending. The broader manufacturing sector is a key driver of
demand conditions in the tooling industry. Specific sectors that are key customers are the
automotive sector (40% of the market); printing & packaging (30%) and others, such as
Figure 29: WC real GDPR growth 2005-2015: Metals & engineering

63
plastics, aerospace and medical services. Given the strong links with the fixed investment
cycle, the metals & engineering sector is a highly cyclical sector; witness the sharp slowdown
and contraction of real value add and employment during the 2008/9 recession (Table 12).
Exports. Regional exports in the broader metals & engineering sector took a huge knock
during the 2008/9 global recession, with volumes declining by 1% in 2008 and a further 30%
in 2009. Including this contraction, total exports in the sector grew by 9.4% per annum on
average over the 2000-9 period. The bulk of the exports in this sector consist of iron & steel
(45%) and machinery (40%); both these categories fared relatively well, with the average
growth rate in export volumes being in the double digit range (2000-9). Exports of metal
products and non-ferrous metals actually contracted over the 2000-9 period. Exports in the
tooling sub-sector are estimated at R2.5 million, which is very small in the bigger picture;
tooling firms tend to be small and micro enterprises not active in the export market.
Outlook. With the wider economic recovery well-established, growth has returned to the
metals & engineering sector; however, somewhat worrying is the slow pace of the recovery
in general fixed investment spending. This is particularly true in the building and
construction sector, which has not yet recovered from recession while the next upward cycle
in interest rates appears to be imminent. The slow recovery in the building sector will affect
demand conditions in the structural steel industries; however, public sector fixed investment
is likely to continue boosting construction works. Regarding the tooling industry, the outlook
for the automotive sector is bright while that of the broader manufacturing sector is
positive, albeit somewhat slow to recover, partly as a result of the relatively strong rand
exchange rate.
Medium-term, growth in real value add for the broader metals and engineering sector is
projected to accelerate to 4.3% per annum over the anticipated upward phase of the
business cycle, 2010-15. This compares well with the 2000-9 average, but is well below the
7.5% growth achieved over the 2004-7 period; employment is projected to expand by 1%
per annum. A number of support initiatives should assist the development of the broader
sector, e.g. the Saldanha Steel downstream steel beneficiation cluster and the Western Cape
Tooling Initiative – the government has approved funding of R120 million for the national
tooling industry.
Constraints/ challenges. Regarding the tooling industry, management practices and skills shortages
are key constraints; furthermore, the machinery and equipment is old and competition from abroad

64
is picking up. The industry structure has now been established (including a SPV) – there should be
better coordination and cooperation between all stakeholders in the industry – should these
processes remain in place, the outlook for the industry is positive; however, even in such an event,
growth of 2-4% per annum is foreseen, i.e. slightly below average. In order to facilitate job growth,
skills development needs to happen; there is, for instance, the TDM empowerment programme,
which aims to train 1000 artisans nationwide within three years; of these 1000, 200-300 are in the
WC. Add this to the current employment of around 1200, it translates to significant growth in
employment in the local tooling industry.
Inter-industry linkages. Given the focus on the tooling industry, the inter-industry relationships of
the metal products sector are displayed in Table 13. On the input side, the basic metals sector (iron
& steel and non-ferrous metals) accounts for close to 40% of total intermediate inputs.
Furthermore, distribution (wholesale & retail), finance & insurance and business services, as well as
intra-industry inputs comprise key supplying sectors – in all, providing close to 80% of all
intermediate inputs. The sector has strong forward linkages with the construction sector, the iron &
steel sector, machinery & equipment, intra-industry, automotive, food, mining, beverages,
wholesale & retail, other chemicals and business services – more than 80% of metal products
intermediate output sales are destined for these sectors. Half of the metal products output sales
comprise intermediate sales; final sales (48%) are mainly directed to business fixed investment (30%
of total output) and exports (14%).
Table 13: Input-output relationships of the WC metal products sector – 2008 basic values (Rm)
Metal products: Input data (2008) R million % share Cum %
Basic iron & steel 1274.6 31.0% 31.0% Wholesale & retail trade 620.4 15.1% 46.1% Basic non-ferrous metals 358.7 8.7% 54.8% Finance & insurance 347.8 8.5% 63.2% Metal products excluding machinery 342.9 8.3% 71.6% Business services 324.5 7.9% 79.4% Other community, social & personal services 157.2 3.8% 83.3% Other chemicals & man-made fibres 132.5 3.2% 86.5% Electricity, gas & steam 86.3 2.1% 88.6% Transport & storage 64.2 1.6% 90.1% Other sectors 405.3 9.9% 100.0%
Intermediate input (costs) - total above 4114.3 46.9%
Intermediate imports 1859.9 21.2% GDPR at basic prices 2789.5 31.8% … Compensation of employees 2072.1 - … Gross operating surplus 730.2 - … Indirect taxes - Subsidies on production -12.9 -
Total input (intermediate costs & imports + value added) 8763.7 100.0%
Metal products: Output data (2008) R million % share Cum %
Construction 1031.9 23.2% 23.2% Basic iron & steel 606.3 13.6% 36.8% Machinery & equipment 422.4 9.5% 46.3%

65
Metal products excluding machinery 342.9 7.7% 54.0% Motor vehicles, parts & accessories 234.2 5.3% 59.3% Food 230.3 5.2% 64.4% Mining 184.9 4.2% 68.6% Beverages & Tobacco 167.2 3.8% 72.4% Wholesale & retail trade 161.7 3.6% 76.0% Other chemicals & man-made fibres 148.9 3.3% 79.3% Business services 141.2 3.2% 82.5% Agriculture, forestry & fishing 99.4 2.2% 84.7% Communication 89.3 2.0% 86.7% Electrical machinery 79.6 1.8% 88.5% Furniture 76.7 1.7% 90.3% Other sectors 433.8 9.7% 100.0%
Intermediate output (sales) - total above 4450.6 50.8%
Total final sales to: 4170.3 47.6% … Households 138.0 … Government 0.0 … Fixed investment 2563.8 … Inventories/ residual 294.9 … Exports 1173.7 Total output (intermediate + final sales) 8620.9 … plus net output to rest of RSA 142.8 1.6%
Total output sales 8763.7 100.0%
Source: Quantec Research analysis of StatsSA data
Oil & gas Background. The oil & gas sector in the Western Cape consists of manufacturing and services
components. On the manufacturing side, the Chevron oil refinery in Cape Town and the PetroSA
gas-to-liquid refinery in Mosselbay comprise the bulk of the petro-chemical sector. However, these
refineries are considered part of the downstream activities of the sector and not included on the
services side, i.e. the services hub in Cape Town and Saldanha being established for the upstream
African oil & gas sector. For the purposes of the current study, and in terms of DEDT’s mandate, the
focus is purely on the upstream activity. Oil refining and petro-chemical production are part of
downstream manufacturing activity and are not considered here.
East, West and Southern Africa are rapidly establishing/ developing both onshore and offshore oil &
gas production facilities. The Cape Oil & Gas Supply Initiative (COGSI) has been created to assist in
the development of the Western Cape oil & gas services hub to supply the upstream African oil &
gas sector with the required products & services – including repair & maintenance of offshore
vessels & installations and technical services. A ship repair facility has been established in the Cape
Town harbour. The oil & gas sector has strong backward linkages with the metals & engineering
sector (see Figure 30; the industry value chain is discussed below).
Growth and employment. The upstream oil & gas industry developed from 2001 onwards with the
discovery of oil & gas offshore in Angola and Nigeria – whereas the ship repair companies usually
had 30% oil & gas vessel clients/ 70% sea going vessels; this changed so that currently their clientele
are 70% oil & gas and 30% sea trawlers. There are four oil & gas service companies active in Cape
66
Town; these are high return/ high standard specialized companies operating with high margins and
time/ quality production – a range of suppliers from top-end instruments (with high import content)
to ‘rope, soap and dope’ (low import content) are active in the industry. Ship/rig repair are bulky
projects, which cause fluctuating revenue streams; however, the regional industry turnover is
estimated at around R1 billion per annum. Ship repair is a relatively labour intensive economic
activity – a 3-month upgrade costing in the region of R15-20 million employs 750 – 1000 people for
three weeks; project duration is not always clear. Steelworks are also relatively labour intensive.
Main growth drivers. What drives demand are the oil & gas developments along the West
African coast – Angola and Nigeria; it is estimated that $15 billion spending is happening
along the West Coast of Africa and that the Western Cape has captured only 1% of the
market, which suggests huge growth potential. The market to service oil rigs is estimated/
projected to grow by R40 billion over 5 years (2009-13). Western Cape ports – Saldanha and
Cape Town – are deep water ports ideally suited for the servicing of oil rigs, especially well
located as the East Coast of Africa is also opening up for oil & gas exploration; oil service
companies are moving their headquarters to Cape Town (e.g. Halliburton).
Exports. All oil & gas revenues are exports as the work is done and services provided only
for offshore companies. No local companies are involved in oil & gas exploration; the work
for local refineries is on a limited scale.
Outlook. It is evident from interviews with role players in the industry and the national
survey conducted by SAOGA, that the upstream oil & gas industry outlook is bullish. Given
the projected exploration and production expenditure by foreign companies and SA’s small
share of the market, huge opportunities exist. Companies in the sector are optimistic
regarding growth and employment prospects – 85% of a 170 companies surveyed early 2011
anticipate revenue growth over the next three years; 79% of the respondents anticipate
growth in employment numbers (SAOGA, March 2011: 11-14).
Constraints/ challenges. A key constraint regards the efficiency of the ports and the Transnet mind-
set as the latter-mentioned parastatal tends to take a relatively dim view of ship repair (vis-à-vis the
more lucrative container business); there are also infrastructure constraints in the ports. Secondly,
the knowledge of the industry needs to change, i.e. the mind-set of stakeholders. Thirdly, logistics,
e.g. direct flights to Cape Town lacking for management people. Fourthly, shortages of skilled
artisans – the colleges do not produce the right quality of artisans for the ship repair/ boat building

67
29.4%
14.1%
13.5%
10.6%
7.6%
4.7%
20.0%
Engineering,maintenance & repairs
Technical &engineering consult
Equipment & materialsupply
Warehousing &logistics
Recruitment & training
Fabrication &construction
Other
Source: SAOGA, March 2011
industries. Artisans require highly specialized and specific skills. Finally, both the level and the
volatility of the rand exchange rate is a problem.
Inter-industry linkages. The oil &
gas sector involves support for
the upstream oil & gas
exploration and production
companies (of which there are
four active in Cape Town). The
value chain consists of 1)
exploration – including seismic
activity and the drilling of
exploration wells – here a range
of support services are required
both offshore and onshore; 2)
follows a highly technical phase – production drilling, requiring a range of engineering services
provided by local companies through overseas licensing companies; pneumatic services/ telecoms
etc.; 3) the third phase in the value chain is well completion, which is also the end of the exploration
phase and the beginning of the production phase requiring a highly sophisticated steel framework
for the production platform also produced by local companies under license from foreign oilfield
service companies. Required here is a range of piping and components; 4) the fourth and final phase
in the value chain is production onshore by FPSOs beginning with the separation of oil, gas and sand
– this also marks the distinction between upstream oil & gas exploration activity (all that happens
before separation) and downstream refinery/ chemicals (all that happens with and after separation).
Figure 30 provides an overview of the business categories involved in the oil & gas industry,
spanning engineering services, manufacturing, transport & storage, recruitment & training and other
services (e.g. financial services & catering)17.
17
This information was obtained from a national survey by the SA Oil and Gas Alliance (SAOGA) of 170 firms active in the sector. For
only 25% of the 170 firms surveyed, their oil & gas business accounted for more than 50% of revenue, which makes it impossible to
classify oil & gas economic activity separately in a standard industrial classification system.
Figure 30: Oil & gas industry: Business categories

68
2007 2008 2009
2000-09
2010-15f
Real GDPR Yoy% 5.6 5.5 -3.9 3.7 4.2 % of WC 0.5 0.5 0.5 0.5 0.5
Employment Yoy% -0.5 3.2 -5.5 -2.6 0.8 % of WC 0.4 0.4 0.4 0.4 0.4
Exports Yoy% 21.9 -1.2 -19.9 7.2 7.8
Source: Quantec Research
-5
0
5
10
15
yoy
% c
han
ge
Electronics (ex. ICT) WC GDPRSource: Quantec Research; own calculations
Electronics Background. The Western Cape electronics
industry contributes 22% of the sector’s
national value-add, i.e. an estimated R13.6
billion of R62 billion in 2004. In the
Western Cape, the sector consisted of 74
companies in 2004; however, this number is
likely to have declined since. The firms are
mainly lower volume niche manufacturing
units. The combined contribution to GDPR of the broad electrical machinery & apparatus and TV,
radio, instruments, watches & clocks sector was 0.5% in 2009; whilst the sector employed 0.4% of
the provincial workforce. The industry employs highly skilled engineers, which are trained in the
Western Cape three universities. Given a relatively low level of economic activity in the industry,
there does not appear to be huge capacity to create employment; however, the industry is known
for its stable employment conditions (MEDS, 2008: 205).
Growth and employment. The
electronics industry’s share in the
regional GDPR remained stable over the
2000s (around 0.5%); real growth in
GDPR averaged 3.7% per annum (2000-
9); however, employment in the industry
contracted at an annual rate of 2.6% over
the corresponding period. Real GDPR
contracted by 3.9% in 2009 and
employment by 5.5% in the face of
recession. The reason for the decline of the industry (measured by number of firms and
employment) is the small domestic market and a poor international presence, which prohibits
investment in large scale manufacturing activities (Coote, E & Coetzee, K, 2006: 18). The sector’s
international competitiveness is being undermined by high wage costs and logistical difficulties in
view of the distance to markets. Due to the lack of competitiveness, South Africa tends to import
electronic components for local assembly.
Main growth drivers. Electronics is a capital goods industry, with strong forward linkages
with the telecommunications, automotive, IT, consumer electronics, power electronics,
defence, aerospace and security industries. The general level of demand conditions in the
Table 14: WC electronics industry (excl. ICT) 2007-15
Figure 31: WC real GDPR growth 2005-2015: Electronics industry (excl. ICT)

69
wider economy and associated fixed investment spending will be an important driver of
demand for the electronics industry’s products. The level of interest rates will also play a
key role in this cyclical industry. The strength of the rand exchange rate has stimulated the
importation of components from countries such as Germany for local assembly, with the
final product re-exported back to European and other developed countries. South Africa’s
labour rate compares favourably with these countries’ labour rates.
Exports. Exports account for less than 10% of GDPR (Coote, E & Coetzee, K, 2006: 16);
however, export growth has been relatively lively over the 2000-9 period (7.2% real growth
per annum). Growth contracted sharply during the 2008/9 recession – see Table 14. The
strength of the rand exchange rate has also undermined the export effort. There are
pockets of strength in electronics industry exports, such as photovoltaic cells, which has
shown phenomenal export growth off a low base. Export volumes are projected to increase
by 7.8% per annum, 2010-15.
Outlook. Of the three fast-growing electronics markets, i.e. automotive electronics,
consumer electronics and power electronics, the Western Cape is best suited to grow the
latter mentioned industry. A major trend in the sector is systems integration, i.e. the
combining of two or more modules into a new one serving a different purpose, rather than
manufacturing the product from scratch. The component modules are generally imported.
A number of initiatives from the government’s side and local developments (e.g.
Technopark) have been boosting the industry outlook.
Constraints/ challenges. In the Western Cape the electronics industry is a disparate sector and
difficult to identify growth areas. The sector is characterised by industry fragmentation and a
general lack of inter-industry cooperation, with insufficient resources devoted to research &
development; high labour cost and fierce competition from low-cost producers in East Asia are
further challenges facing the sector. A range of constraints facing the industry has been listed:
Firstly, a general lack of venture capital and other finance; secondly, a lack of local customers – the
South African electronics sector has a small local market with most of the output being exported to
other countries with bigger demands; thirdly, cost of regulatory compliance; and finally, lack of
government support and support services.
Inter-industry linkages. The combined electrical machinery, radio, TV and communications
equipment and professional and scientific equipment sector has been used as a proxy for the
electronics industry; the aggregated input-output relationships are shown in Table 15. The sector

70
has strong backward linkages, with wholesale & retail, non-ferrous metals, intra-industry, other
chemicals, business services, basic iron & steel, plastic products and finance & insurance being key
input sectors. On the output side, and apart from intra-industry sales, construction and the
electricity sectors are key customers, as well as communication, the automotive industry and
medical services. Sixty percent of output sales are final sales, mainly to business fixed investment
and exports, but also to households.
Table 15: Input-output relationships of the WC electronics (proxy) sector – 2008 basic values (Rm)
Electronics - proxy: Input data (2008) R million % share Cum %
Wholesale & retail trade 693.3 20.2% 20.2% Basic non-ferrous metals 446.7 13.0% 33.2% Electrical machinery 377.7 11.0% 44.1% Other chemicals & man-made fibres 287.4 8.4% 52.5% Business services 255.0 7.4% 59.9% Basic iron & steel 213.5 6.2% 66.1% Plastic products 187.9 5.5% 71.6% Finance & insurance 173.2 5.0% 76.6% Other community, social & personal services 100.5 2.9% 79.5% Metal products excluding machinery 84.2 2.4% 82.0% Transport & storage 71.9 2.1% 84.1% Television, radio & communication equipment 62.5 1.8% 85.9% Other industries 58.5 1.7% 87.6% Paper & paper products 56.3 1.6% 89.2% Non-metallic minerals 51.0 1.5% 90.7% Other sectors 319.1 9.3% 100.0%
Intermediate input (costs) - total above 3,438.6 55.3%
Intermediate imports 1505.8 24.2% GDPR at basic prices 1270.4 20.4% … Compensation of employees 947.5 - … Gross operating surplus 315.9 - … Indirect taxes - Subsidies on production 7.1 -
Total input (intermediate costs & imports + value added) 6,214.8 100.0%
Electronics - proxy: Output data (2008) R million % share Cum %
Construction 645.6 25.4% 25.4% Electricity, gas & steam 314.8 12.4% 37.7% Electrical machinery 222.0 8.7% 46.5% Communication 221.0 8.7% 55.1% Motor vehicles, parts & accessories 189.2 7.4% 62.6% Television, radio & communication equipment 178.0 7.0% 69.6% Medical, dental & other health & veterinary services 149.0 5.9% 75.4% Business services 106.8 4.2% 79.6% Machinery & equipment 105.1 4.1% 83.7% Government 104.0 4.1% 87.8% Mining 56.3 2.2% 90.0% Other sectors 253.5 10.0% 100.0%
Intermediate output (sales) - total above 2545.2 41.0%
Total final sales to: 3745.9 60.3% … Households 516.1 … Government 0.0 … Fixed investment 1284.8 … Inventories/ residual 193.1 … Exports 1751.8 Total output (intermediate + final sales) 6291.1 … plus net output to rest of RSA -76.3 -1.2%
Total output sales 6214.8 100.0%
Source: Quantec Research analysis of StatsSA data

71
46.0%
30.0%
19.0%
5.0% Marine eqp &accessories
Consumer goods& services
Business goods &services
Engines & enginesystems
Source: CTBi Directory 2008
Boat building Background. The Western Cape hosts
90% of the national boat building
industry. While the standard industrial
classification (SIC 384, falling under
transport equipment) makes provision
for both ship building and repair (SIC
3841) and boat building and repair (SIC
3842), the Western Cape sector (and
DEDT/MEDS focus) includes mostly the
building & repairing of pleasure and
sporting boats (e.g. inflatables and yachts). The sub-sectors identified in the industry include multi
hulls (e.g. catamarans); mono hulls; inflatables; activity vessels (kayaks & canoes); motor boats;
commercial craft (fishing, military, and diamond vessels) and other speciality craft.
The total annual turnover of the industry (60 boat builders) was estimated at R2 billion and the
export value at R1.2 billion in 2008; the industry employs 3000-3500 workers and supports an equal
number indirect jobs. The industry’s contribution to Western Cape GDPR amounts to 0.2%; it also
employs 0.2% of the regional work force; and accounts for 2.5% of regional exports (CTBi Market
Survey Report, 2008). Apart from the 60 boat-building companies, a range of support businesses
exist (224 companies in total) – see Figure 32. These firms range from manufacturers of boat
building materials and equipment, electronics and electrical accessories and interior furnishings;
consumer goods and services (including boat clubs, retail shops and boat maintenance services);
business goods and services (including design, surveying and project management) and engines and
engine system suppliers. Including the support industries, the total industry turnover was estimated
at R13 billion in 2007/8; and employment at 13 900, i.e. 0.7% of the Western Cape work force in
2008.
Growth and employment. Western Cape boat builders produce high-end yachts/ catamarans and
they compete well with overseas builders which benefit from state subsidies. The sector had a
booming period 1999-2007 growing by 20% per annum but took a knock with the 2008/9 recession.
However, the sector remained remarkably resilient, with only one local company being a casualty
during the recession. Indications are that local companies gained market share during the recession.
The industry experiences much competition from French boat builders who are subsidised by the
French government; the level of the exchange rate is also a key variable in this regard. Imports of
leisure craft increased strongly between 2000 and 2007, hinting at intensifying import competition.
Figure 32: WC boat building support industry: distribution of firms

72
-20
-15
-10
-5
0
5
10
15
yoy
% c
han
ge
Other tpt eqp (incl. boat building) WC GDPRSource: Quantec Research; own calculations
Most of the local boat production is exported, but the marketing exercise is challenging (foreign
expeditions, where boats are sold, are expensive to attend). Efforts are also on-going to upgrade
skills levels in the industry.
Main growth drivers/ exports. The boat building sector produces mainly for the export
market – 85% of the market is USA/ Caribbean, a third of which is catamaran/ sailing vessels;
one third mono-hulls and a third small sailing vessels/ kayaks etc. Total export revenues
from commercial, leisure and other boats (including inflatables, dredges, etc.) grew from
R698 million in 2000 to R1.4 billion in 2007, i.e. a compound growth rate of 10% per annum.
More than 90% of aggregate industry exports are leisure craft (i.e. sailboats, inflatables,
motorboats and rowing shells). Export revenue accounted for two-thirds of the estimated
industry turnover in 2007. It follows that high-end consumer demand abroad is a key driver
of growth in the local industry; the same applies to the local market: sales are sensitive to
interest rate developments and therefore the general business cycle. Furthermore, on the
export side the exchange rate will play a key role – both the strength and the volatility of the
rand exchange rate affect sales. However, as the local industry’s growth is still derived to a
large extent from capturing new market share, the influence of cyclicality and exchange rate
strength and volatility can be mitigated.
Outlook. The world economic
recovery is becoming well-
established, with fears of a
second leg of a double-dip
recession fading. US consumer
spending has returned to a firmer
footing and it is to be expected
that demand for local boat
builders’ products will pick up
again. However, the keen
demand conditions experienced
over the 2000-7 period are unlikely to repeat themselves anytime soon, i.e. more moderate
growth rates are foreseen in US consumer spending and general economic growth,
particularly when the withdrawal of the massive policy support currently in place
commences (expected from next year onwards). It follows that supply-side initiatives can go
a long way to boost efforts in the industry to capture new market share. In this regard the
Figure 33: WC real GDPR growth 2005-2015: Other transport equipment (incl. boat building)
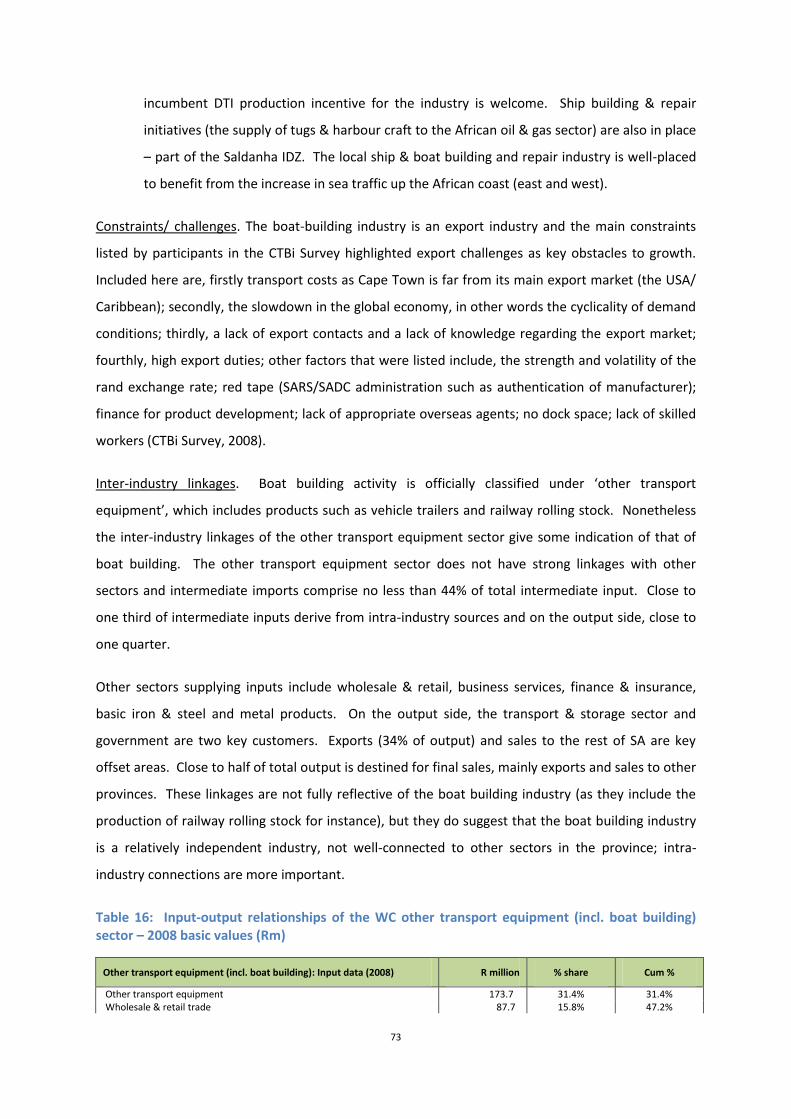
73
incumbent DTI production incentive for the industry is welcome. Ship building & repair
initiatives (the supply of tugs & harbour craft to the African oil & gas sector) are also in place
– part of the Saldanha IDZ. The local ship & boat building and repair industry is well-placed
to benefit from the increase in sea traffic up the African coast (east and west).
Constraints/ challenges. The boat-building industry is an export industry and the main constraints
listed by participants in the CTBi Survey highlighted export challenges as key obstacles to growth.
Included here are, firstly transport costs as Cape Town is far from its main export market (the USA/
Caribbean); secondly, the slowdown in the global economy, in other words the cyclicality of demand
conditions; thirdly, a lack of export contacts and a lack of knowledge regarding the export market;
fourthly, high export duties; other factors that were listed include, the strength and volatility of the
rand exchange rate; red tape (SARS/SADC administration such as authentication of manufacturer);
finance for product development; lack of appropriate overseas agents; no dock space; lack of skilled
workers (CTBi Survey, 2008).
Inter-industry linkages. Boat building activity is officially classified under ‘other transport
equipment’, which includes products such as vehicle trailers and railway rolling stock. Nonetheless
the inter-industry linkages of the other transport equipment sector give some indication of that of
boat building. The other transport equipment sector does not have strong linkages with other
sectors and intermediate imports comprise no less than 44% of total intermediate input. Close to
one third of intermediate inputs derive from intra-industry sources and on the output side, close to
one quarter.
Other sectors supplying inputs include wholesale & retail, business services, finance & insurance,
basic iron & steel and metal products. On the output side, the transport & storage sector and
government are two key customers. Exports (34% of output) and sales to the rest of SA are key
offset areas. Close to half of total output is destined for final sales, mainly exports and sales to other
provinces. These linkages are not fully reflective of the boat building industry (as they include the
production of railway rolling stock for instance), but they do suggest that the boat building industry
is a relatively independent industry, not well-connected to other sectors in the province; intra-
industry connections are more important.
Table 16: Input-output relationships of the WC other transport equipment (incl. boat building) sector – 2008 basic values (Rm)
Other transport equipment (incl. boat building): Input data (2008) R million % share Cum %
Other transport equipment 173.7 31.4% 31.4% Wholesale & retail trade 87.7 15.8% 47.2%

74
Business services 63.9 11.6% 58.8% Finance & insurance 52.1 9.4% 68.2% Basic iron & steel 50.1 9.0% 77.2% Metal products excluding machinery 30.2 5.5% 82.7% Plastic products 11.7 2.1% 84.8% Basic non-ferrous metals 11.3 2.0% 86.8% Other community, social & personal services 8.8 1.6% 88.4% Other chemicals & man-made fibres 7.9 1.4% 89.9% Electrical machinery 7.2 1.3% 91.2% Other sectors 48.9 8.8% 100.0%
Intermediate input (costs) - total above 553.5 21.7%
Intermediate imports 1126.9 44.2% GDPR at basic prices 870.4 34.1% … Compensation of employees 769.7 - … Gross operating surplus 98.1 - … Indirect taxes - Subsidies on production 2.6 -
Total input (intermediate costs & imports + value added) 2550.8 100.0%
Other transport equipment (incl. boat building): Output data (2008) R million % share Cum %
Transport & storage 267.6 37.3% 37.3% Government 207.4 28.9% 66.2% Other transport equipment 173.7 24.2% 90.4% Agriculture, forestry & fishing 33.4 4.7% 95.0% Mining 24.1 3.4% 98.4% Other sectors 11.5 1.6% 100.0%
Intermediate output (sales) - total above 717.7 28.1%
Total final sales to: 1194.5 46.8% … Households 75.3 … Government 0.0 … Fixed investment 119.7 … Inventories/ residual 130.7 … Exports 868.8 Total output (intermediate + final sales) 1912.2 … plus net output to rest of RSA 638.6 25.0%
Total output sales 2550.8 100.0%
Source: Quantec Research analysis of StatsSA data
Furniture Background. The Western Cape hosted an estimated 361 furniture manufacturers in 2009, including
five sub-sectors, namely upholstery, board, solid wood and office furniture. The industry appears to
be concentrated as less than 9% of the firms employed more than half (51%) of the industry work
force; however, the remaining 49% of the work force is employed by small and micro furniture
manufacturers. The largest share of the sector is in the upholstery, board and solid timber sub-
sectors (88%); the remainder is in the bedding & office subsectors. Western Cape firms account for
20%`` of the national industry, Kwa-Zulu-Natal for 25% and Gauteng 40%.
There is huge pressure in the sector for constant product and design changes; most furniture
manufacturers have found a niche in the market; firms tend to be in survival mode. Skills shortages,
poor work ethic, high labour cost, lack of education & literacy amongst work force all appear to be
problem areas in the industry.

75
2007 2008 2009
2000-09
2010-15f
Real GDPR Yoy% 4.2 4.6 -6.4 7.6 5.3 % of WC 0.3 0.3 0.2 0.2 0.3
Employment Yoy% 7.8 -8.2 -12.2 -2.8 0.2 % of WC 0.5 0.4 0.4 0.5 0.4
Exports Yoy% 25.9 -39.2 -24.9 -4.9 3.1
Source: Quantec Research
Growth and employment. According to
Quantec Research data the furniture sector
posted strong growth over the 2000-7
period18; however, growth tapered down
sharply in 2008 and real value add
contracted by 6.4% in 2009 in the face of
recession. Over the 2000-9 period, the real
growth in furniture value added averaged
7.6% per annum; however, employment in the industry contracted by close to 3% per annum.
Whereas local manufacturers traditionally served the low- to mid-market range (with high-end
products being imported), this has changed with the advent of low-cost/ high quality import
competition from developing countries such as China competing in all market segments.
Furthermore, the small manufacturers confronted intensifying competition from the large scale and
vertically integrated local producers (such as Steinhoff) and many were forced to close down, which
partly explains the adverse employment trend in the sector. Western Cape furniture employment
has declined from around 10 500 in 1995 to 7 000 in 2009 (Quantec Research). The smaller
manufacturers tend to be diversified in their product offering which prevents them from achieving
economies of scale which have become important in an otherwise very price competitive industry; a
higher degree of specialisation and longer production runs are called for.
Main growth drivers. Furniture industry sales are strongly influenced by what happens in
the building industry, i.e. both residential and non-residential construction and renovation.
The building sector, in turn, is highly interest rate sensitive, which also applies to household
durable goods consumption in general, being a discretionary spending category. It follows
that the demand for furniture is highly cyclical, being sensitive to interest rate
developments, the availability of credit and the growth in real personal disposable incomes.
Total furniture output consists of home furniture (85%; bedding, dining room and kitchen
furniture) and office furniture (15%). Household demand is therefore the key driver. In the
Western Cape, the thriving tourism and hospitality industry is a further important source of
demand. Other forward linkages include (non-residential) commercial market and
community, social and personal services – recreation (theatres), schools, hospitals and
churches (office furniture) – see Table 18.
18
The 6.2% per annum GDPR growth achieved over the 2000-9 period may have been boosted by leather seats for the auto industry,
which are classified as upholstery (Van Wyk, M: Interview).
Table 17: WC furniture sector: 2007-15
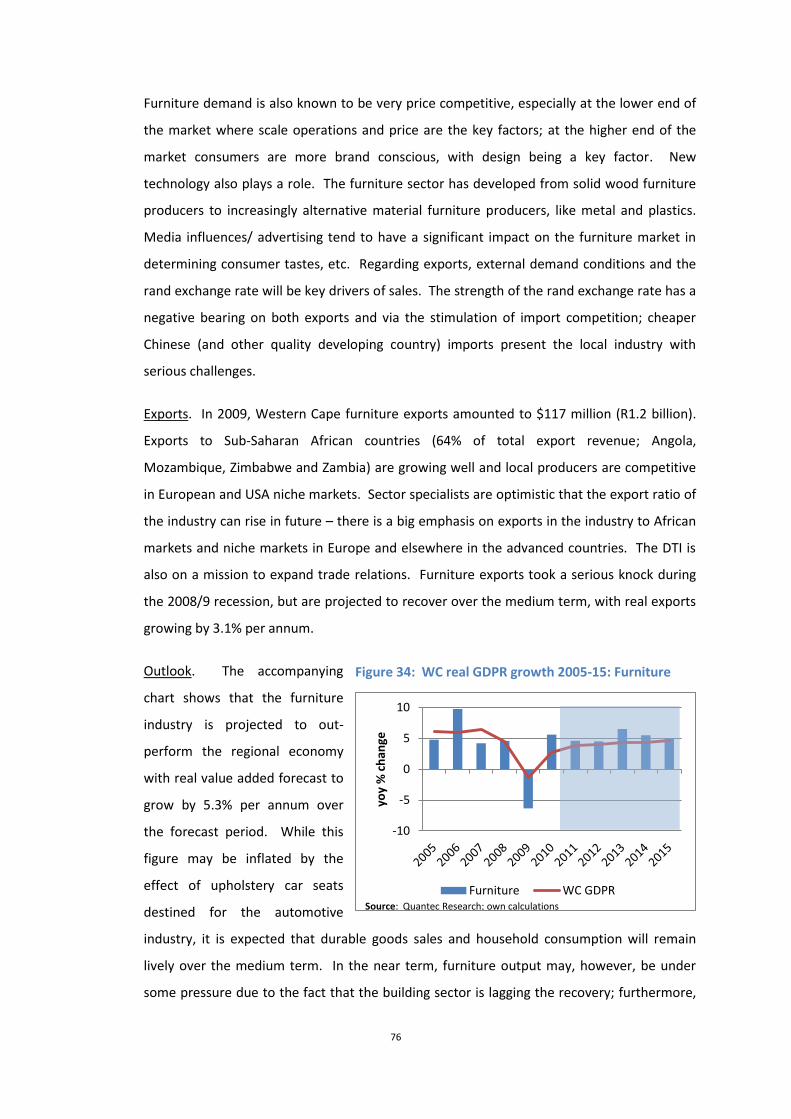
76
-10
-5
0
5
10
yoy
% c
han
ge
Furniture WC GDPRSource: Quantec Research; own calculations
Furniture demand is also known to be very price competitive, especially at the lower end of
the market where scale operations and price are the key factors; at the higher end of the
market consumers are more brand conscious, with design being a key factor. New
technology also plays a role. The furniture sector has developed from solid wood furniture
producers to increasingly alternative material furniture producers, like metal and plastics.
Media influences/ advertising tend to have a significant impact on the furniture market in
determining consumer tastes, etc. Regarding exports, external demand conditions and the
rand exchange rate will be key drivers of sales. The strength of the rand exchange rate has a
negative bearing on both exports and via the stimulation of import competition; cheaper
Chinese (and other quality developing country) imports present the local industry with
serious challenges.
Exports. In 2009, Western Cape furniture exports amounted to $117 million (R1.2 billion).
Exports to Sub-Saharan African countries (64% of total export revenue; Angola,
Mozambique, Zimbabwe and Zambia) are growing well and local producers are competitive
in European and USA niche markets. Sector specialists are optimistic that the export ratio of
the industry can rise in future – there is a big emphasis on exports in the industry to African
markets and niche markets in Europe and elsewhere in the advanced countries. The DTI is
also on a mission to expand trade relations. Furniture exports took a serious knock during
the 2008/9 recession, but are projected to recover over the medium term, with real exports
growing by 3.1% per annum.
Outlook. The accompanying
chart shows that the furniture
industry is projected to out-
perform the regional economy
with real value added forecast to
grow by 5.3% per annum over
the forecast period. While this
figure may be inflated by the
effect of upholstery car seats
destined for the automotive
industry, it is expected that durable goods sales and household consumption will remain
lively over the medium term. In the near term, furniture output may, however, be under
some pressure due to the fact that the building sector is lagging the recovery; furthermore,
Figure 34: WC real GDPR growth 2005-15: Furniture
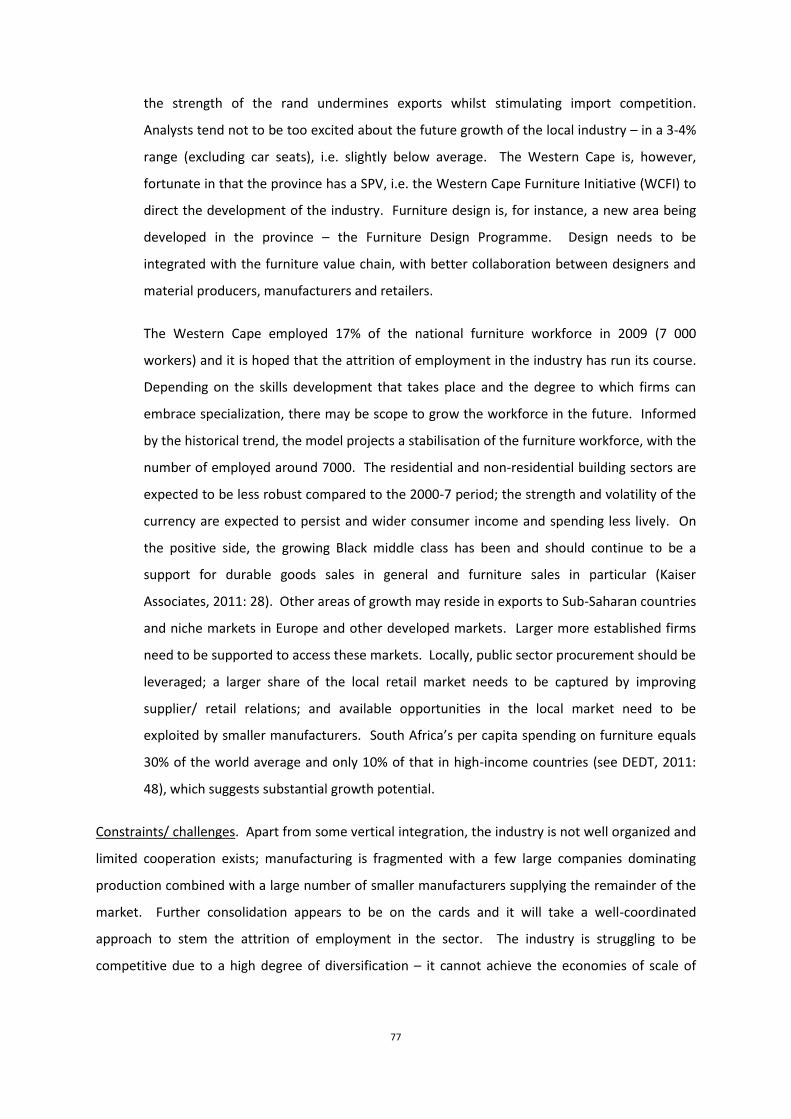
77
the strength of the rand undermines exports whilst stimulating import competition.
Analysts tend not to be too excited about the future growth of the local industry – in a 3-4%
range (excluding car seats), i.e. slightly below average. The Western Cape is, however,
fortunate in that the province has a SPV, i.e. the Western Cape Furniture Initiative (WCFI) to
direct the development of the industry. Furniture design is, for instance, a new area being
developed in the province – the Furniture Design Programme. Design needs to be
integrated with the furniture value chain, with better collaboration between designers and
material producers, manufacturers and retailers.
The Western Cape employed 17% of the national furniture workforce in 2009 (7 000
workers) and it is hoped that the attrition of employment in the industry has run its course.
Depending on the skills development that takes place and the degree to which firms can
embrace specialization, there may be scope to grow the workforce in the future. Informed
by the historical trend, the model projects a stabilisation of the furniture workforce, with the
number of employed around 7000. The residential and non-residential building sectors are
expected to be less robust compared to the 2000-7 period; the strength and volatility of the
currency are expected to persist and wider consumer income and spending less lively. On
the positive side, the growing Black middle class has been and should continue to be a
support for durable goods sales in general and furniture sales in particular (Kaiser
Associates, 2011: 28). Other areas of growth may reside in exports to Sub-Saharan countries
and niche markets in Europe and other developed markets. Larger more established firms
need to be supported to access these markets. Locally, public sector procurement should be
leveraged; a larger share of the local retail market needs to be captured by improving
supplier/ retail relations; and available opportunities in the local market need to be
exploited by smaller manufacturers. South Africa’s per capita spending on furniture equals
30% of the world average and only 10% of that in high-income countries (see DEDT, 2011:
48), which suggests substantial growth potential.
Constraints/ challenges. Apart from some vertical integration, the industry is not well organized and
limited cooperation exists; manufacturing is fragmented with a few large companies dominating
production combined with a large number of smaller manufacturers supplying the remainder of the
market. Further consolidation appears to be on the cards and it will take a well-coordinated
approach to stem the attrition of employment in the sector. The industry is struggling to be
competitive due to a high degree of diversification – it cannot achieve the economies of scale of

78
their overseas competitors who tend to be more specialized. Local industry is only now learning this
lesson. In all, this represents a major challenge confronting the sector.
In a survey of manufacturing companies (62 mostly small companies) the most serious constraints
listed were: the availability of raw materials (due to competing demands on a limited natural
resource); delivery times; availability of technology; rand strength; and lack of skilled labour. The
survey also found a general lack of investment in machinery and a lack of skills training. Most of the
small firms are relatively old firms well established in their ways and not easily adaptable to new
international trends, specifically the movement away from wooden furniture to alternative
materials, including metal, plastic, polypropylene and glass.
Inter-industry linkages. The furniture sector has strong backward linkages, but relatively weak
forward linkages. On the input side, the wood & wood products sector supplies more than 40% of
the sector’s intermediate inputs. Furthermore, distribution is a key requirement (wholesale & retail),
business services, metal products and textiles. Other sectors that feature on the input side include
other chemicals, iron & steel and finance & insurance; all these sectors account for 80% of the
furniture sector’s intermediate inputs. Only 19% of output sales are intermediate sales, with
wholesale & retail and construction key customers. The household sector and exports are the two
key offset areas, with 78% of total output sales destined as final sales.
Table 18: Input-output relationships of the WC furniture sector – 2008 basic values (Rm)
Furniture: Input data (2008) R million % share Cum %
Wood & wood products 608.0 41.1% 41.1% Wholesale & retail trade 163.6 11.1% 52.2% Business services 105.5 7.1% 59.4% Metal products excluding machinery 76.7 5.2% 64.5% Textiles 63.4 4.3% 68.8% Other chemicals & man-made fibres 53.2 3.6% 72.4% Basic iron & steel 49.7 3.4% 75.8% Finance & insurance 47.8 3.2% 79.0% Paper & paper products 43.8 3.0% 82.0% Leather & leather products 34.0 2.3% 84.3% Plastic products 32.5 2.2% 86.5% Transport & storage 31.0 2.1% 88.6% Agriculture, forestry & fishing 30.2 2.0% 90.6% Other sectors 138.3 9.4% 100.0%
Intermediate input (costs) - total above 1477.6 62.6%
Intermediate imports 379.6 16.1% GDPR at basic prices 503.0 21.3% … Compensation of employees 443.2 - … Gross operating surplus 59.8 - … Indirect taxes - Subsidies on production 0.0 -
Total input (intermediate costs & imports + value added) 2360.2 100.0%
Furniture: Output data (2008) R million % share Cum %
Wholesale & retail trade 91.8 20.8% 20.8% Construction 71.6 16.2% 37.1% Business services 66.5 15.1% 52.2%
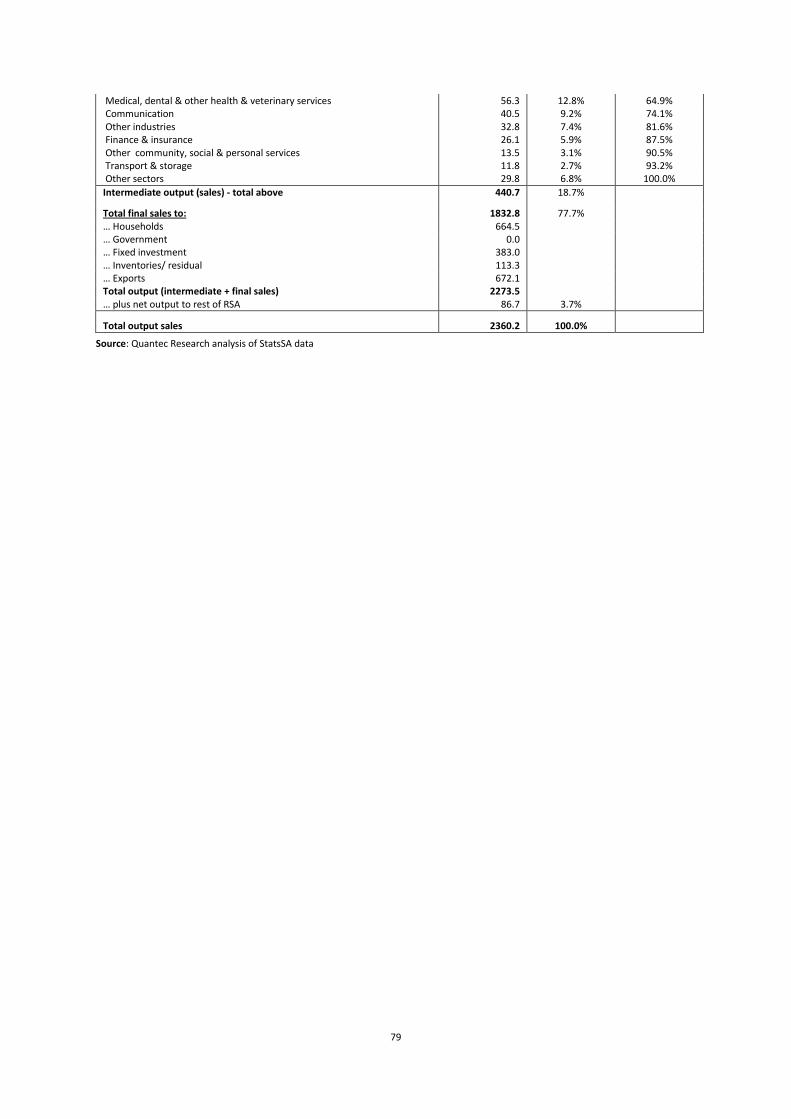
79
Medical, dental & other health & veterinary services 56.3 12.8% 64.9% Communication 40.5 9.2% 74.1% Other industries 32.8 7.4% 81.6% Finance & insurance 26.1 5.9% 87.5% Other community, social & personal services 13.5 3.1% 90.5% Transport & storage 11.8 2.7% 93.2% Other sectors 29.8 6.8% 100.0%
Intermediate output (sales) - total above 440.7 18.7%
Total final sales to: 1832.8 77.7% … Households 664.5 … Government 0.0 … Fixed investment 383.0 … Inventories/ residual 113.3 … Exports 672.1 Total output (intermediate + final sales) 2273.5 … plus net output to rest of RSA 86.7 3.7%
Total output sales 2360.2 100.0%
Source: Quantec Research analysis of StatsSA data
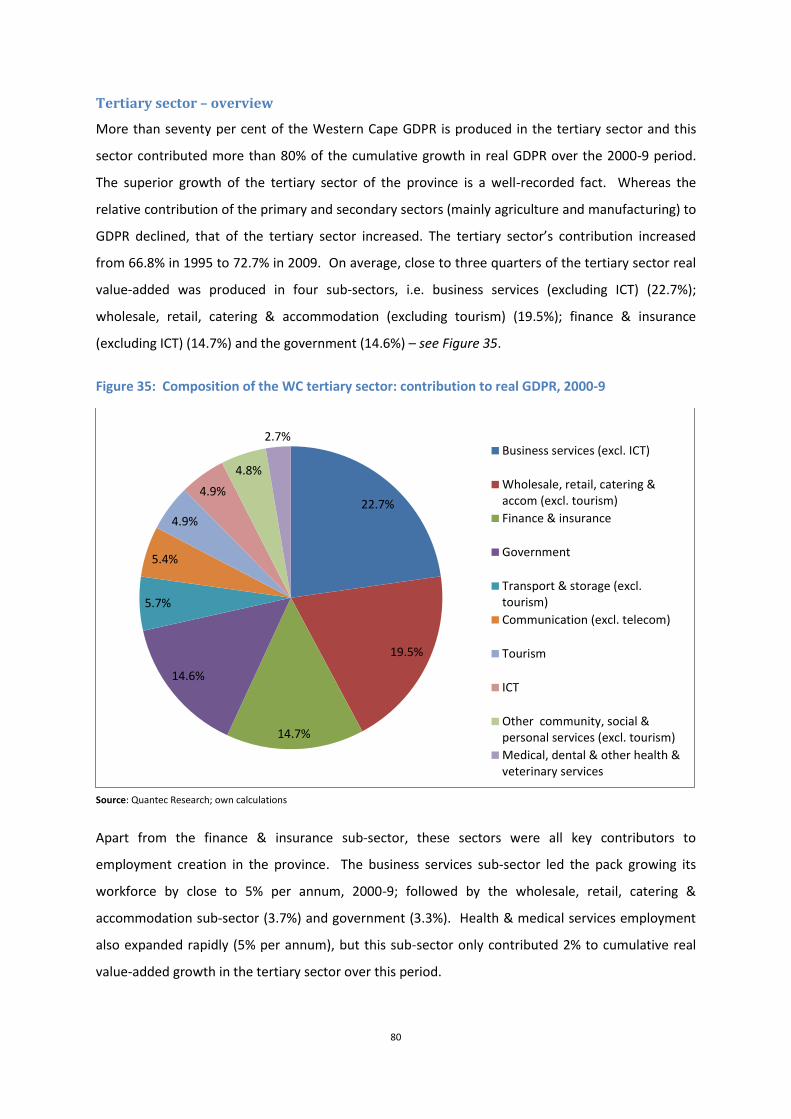
80
Tertiary sector – overview
More than seventy per cent of the Western Cape GDPR is produced in the tertiary sector and this
sector contributed more than 80% of the cumulative growth in real GDPR over the 2000-9 period.
The superior growth of the tertiary sector of the province is a well-recorded fact. Whereas the
relative contribution of the primary and secondary sectors (mainly agriculture and manufacturing) to
GDPR declined, that of the tertiary sector increased. The tertiary sector’s contribution increased
from 66.8% in 1995 to 72.7% in 2009. On average, close to three quarters of the tertiary sector real
value-added was produced in four sub-sectors, i.e. business services (excluding ICT) (22.7%);
wholesale, retail, catering & accommodation (excluding tourism) (19.5%); finance & insurance
(excluding ICT) (14.7%) and the government (14.6%) – see Figure 35.
Figure 35: Composition of the WC tertiary sector: contribution to real GDPR, 2000-9
Source: Quantec Research; own calculations
Apart from the finance & insurance sub-sector, these sectors were all key contributors to
employment creation in the province. The business services sub-sector led the pack growing its
workforce by close to 5% per annum, 2000-9; followed by the wholesale, retail, catering &
accommodation sub-sector (3.7%) and government (3.3%). Health & medical services employment
also expanded rapidly (5% per annum), but this sub-sector only contributed 2% to cumulative real
value-added growth in the tertiary sector over this period.
22.7%
19.5%
14.7%
14.6%
5.7%
5.4%
4.9%
4.9%
4.8%
2.7% Business services (excl. ICT)
Wholesale, retail, catering &accom (excl. tourism)
Finance & insurance
Government
Transport & storage (excl.tourism)
Communication (excl. telecom)
Tourism
ICT
Other community, social &personal services (excl. tourism)
Medical, dental & other health &veterinary services
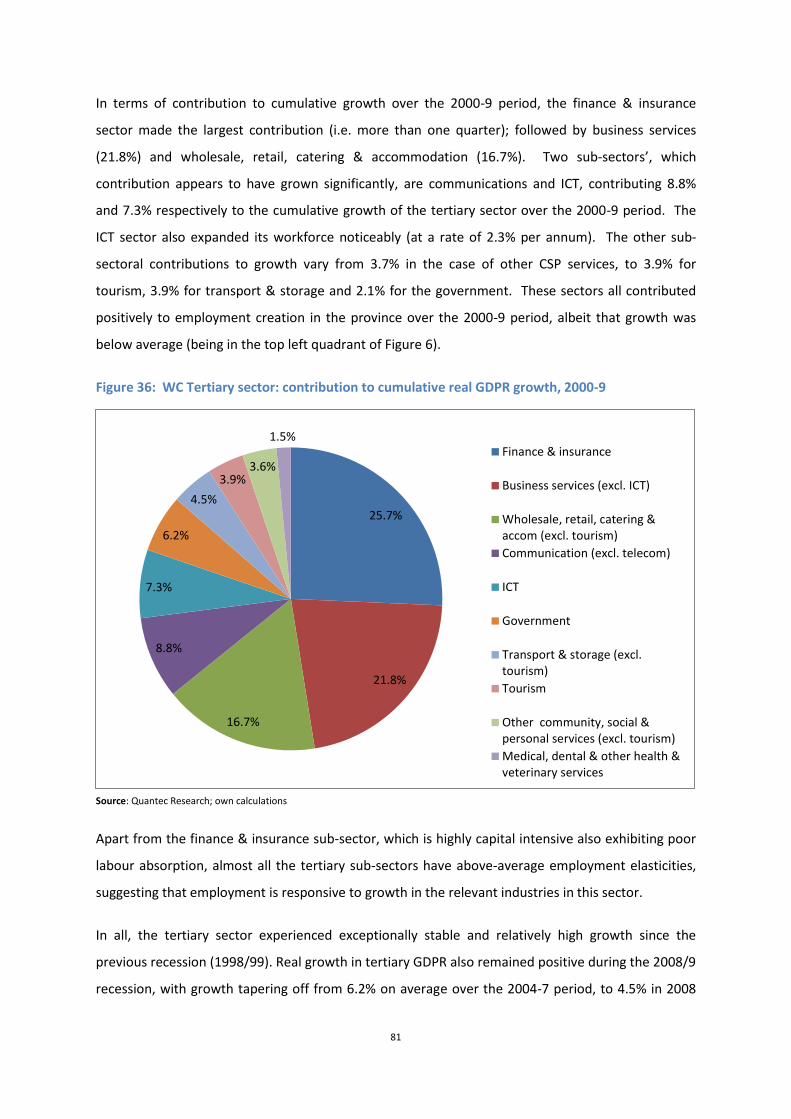
81
In terms of contribution to cumulative growth over the 2000-9 period, the finance & insurance
sector made the largest contribution (i.e. more than one quarter); followed by business services
(21.8%) and wholesale, retail, catering & accommodation (16.7%). Two sub-sectors’, which
contribution appears to have grown significantly, are communications and ICT, contributing 8.8%
and 7.3% respectively to the cumulative growth of the tertiary sector over the 2000-9 period. The
ICT sector also expanded its workforce noticeably (at a rate of 2.3% per annum). The other sub-
sectoral contributions to growth vary from 3.7% in the case of other CSP services, to 3.9% for
tourism, 3.9% for transport & storage and 2.1% for the government. These sectors all contributed
positively to employment creation in the province over the 2000-9 period, albeit that growth was
below average (being in the top left quadrant of Figure 6).
Figure 36: WC Tertiary sector: contribution to cumulative real GDPR growth, 2000-9
Source: Quantec Research; own calculations
Apart from the finance & insurance sub-sector, which is highly capital intensive also exhibiting poor
labour absorption, almost all the tertiary sub-sectors have above-average employment elasticities,
suggesting that employment is responsive to growth in the relevant industries in this sector.
In all, the tertiary sector experienced exceptionally stable and relatively high growth since the
previous recession (1998/99). Real growth in tertiary GDPR also remained positive during the 2008/9
recession, with growth tapering off from 6.2% on average over the 2004-7 period, to 4.5% in 2008
25.7%
21.8%
16.7%
8.8%
7.3%
6.2%
4.5%
3.9% 3.6%
1.5% Finance & insurance
Business services (excl. ICT)
Wholesale, retail, catering &accom (excl. tourism)
Communication (excl. telecom)
ICT
Government
Transport & storage (excl.tourism)
Tourism
Other community, social &personal services (excl. tourism)
Medical, dental & other health &veterinary services

82
0.0
0.5
1.0
1.5
2.0
0
2
4
6
8
10
12
1991 1994 1997 2000 2003 2006 2009
mill
ion
mill
ion
RSA Western CapeSource: Statistics SA
and 0.3% in 2009. Real growth recovered to an estimated 2.7% in 2010 and is projected to average
4.2% over the forecast period, i.e. on a par with the trend growth rate. More detail regarding the
outlook for the tertiary sector is discussed below by considering conditions in a number of specific
tertiary industries.
Figure 37: Western Cape: Tertiary sector real GDPR growth, 1995–2015
Source: Quantec Research
Tourism Background. The Western Cape tourism
sector is a hallmark of the province
(Peninsula and Cape Wine lands; the
Overberg region; the Cape West Coast;
the Garden Route and Klein Karoo and
the Groot Karoo, all regions with unique
characteristics on offer for the discerning
tourist). Tourism is globally and locally in
a strong growth phase19. Tourism
economic activity is unfortunately not
captured in the standard industrial classification – it spans a number of sectors: catering &
accommodation (hotels, guest houses, camping, game lodges and restaurants), tour operating,
travel agencies and the utilisation of different types of transport by road, air, sea and rail. Tourism
19
Globally tourism took a knock from the 2008/9 world recession as tourism volumes declined by 4% in 2009; however, in calendar 2010
volumes bounced back by 6.7%, going beyond the 2008 peak in international arrivals (913 million).
0
1
2
3
4
5
6
7
19
96
19
97
19
98
19
99
20
00
20
01
20
02
20
03
20
04
20
05
20
06
20
07
20
08
20
09
20
10
20
11
20
12
20
13
20
14
20
15
yoy
% c
han
ge
Forecast Average 1995-2009
Figure 38: Number of international arrivals: 1991–2010: WC vs RSA
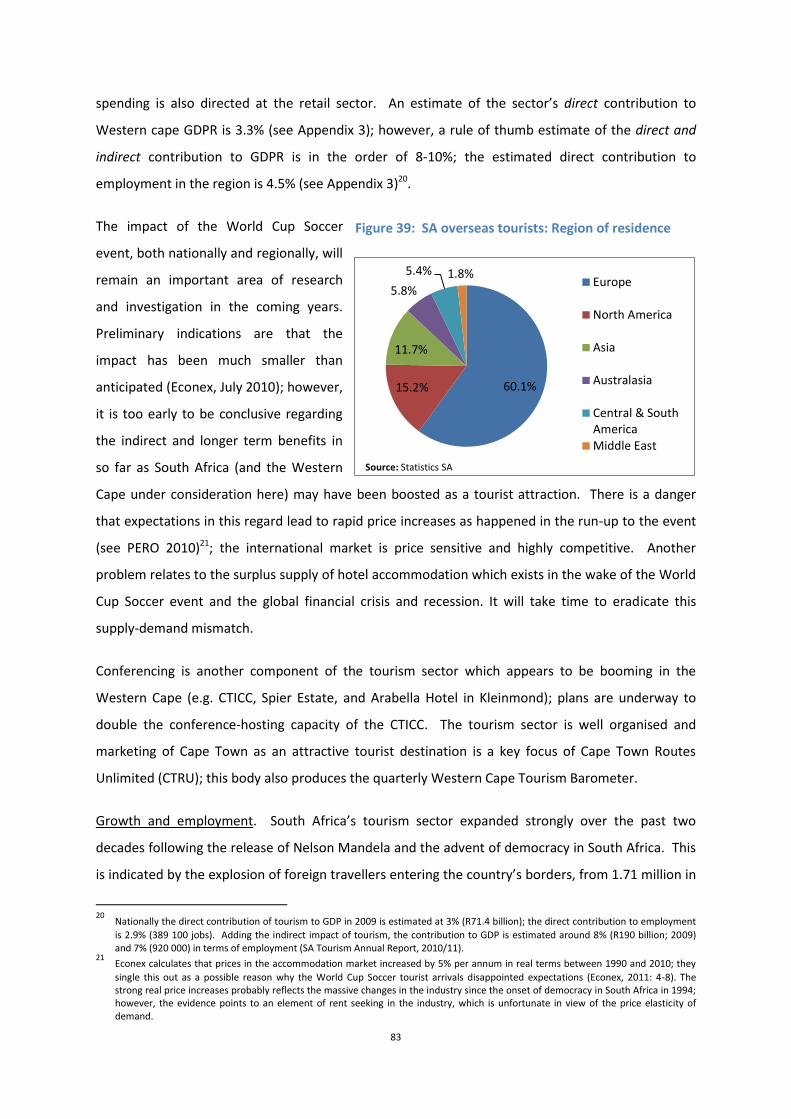
83
60.1% 15.2%
11.7%
5.8%
5.4% 1.8% Europe
North America
Asia
Australasia
Central & SouthAmericaMiddle East
Source: Statistics SA
spending is also directed at the retail sector. An estimate of the sector’s direct contribution to
Western cape GDPR is 3.3% (see Appendix 3); however, a rule of thumb estimate of the direct and
indirect contribution to GDPR is in the order of 8-10%; the estimated direct contribution to
employment in the region is 4.5% (see Appendix 3)20.
The impact of the World Cup Soccer
event, both nationally and regionally, will
remain an important area of research
and investigation in the coming years.
Preliminary indications are that the
impact has been much smaller than
anticipated (Econex, July 2010); however,
it is too early to be conclusive regarding
the indirect and longer term benefits in
so far as South Africa (and the Western
Cape under consideration here) may have been boosted as a tourist attraction. There is a danger
that expectations in this regard lead to rapid price increases as happened in the run-up to the event
(see PERO 2010)21; the international market is price sensitive and highly competitive. Another
problem relates to the surplus supply of hotel accommodation which exists in the wake of the World
Cup Soccer event and the global financial crisis and recession. It will take time to eradicate this
supply-demand mismatch.
Conferencing is another component of the tourism sector which appears to be booming in the
Western Cape (e.g. CTICC, Spier Estate, and Arabella Hotel in Kleinmond); plans are underway to
double the conference-hosting capacity of the CTICC. The tourism sector is well organised and
marketing of Cape Town as an attractive tourist destination is a key focus of Cape Town Routes
Unlimited (CTRU); this body also produces the quarterly Western Cape Tourism Barometer.
Growth and employment. South Africa’s tourism sector expanded strongly over the past two
decades following the release of Nelson Mandela and the advent of democracy in South Africa. This
is indicated by the explosion of foreign travellers entering the country’s borders, from 1.71 million in
20
Nationally the direct contribution of tourism to GDP in 2009 is estimated at 3% (R71.4 billion); the direct contribution to employment
is 2.9% (389 100 jobs). Adding the indirect impact of tourism, the contribution to GDP is estimated around 8% (R190 billion; 2009) and 7% (920 000) in terms of employment (SA Tourism Annual Report, 2010/11).
21 Econex calculates that prices in the accommodation market increased by 5% per annum in real terms between 1990 and 2010; they
single this out as a possible reason why the World Cup Soccer tourist arrivals disappointed expectations (Econex, 2011: 4-8). The strong real price increases probably reflects the massive changes in the industry since the onset of democracy in South Africa in 1994; however, the evidence points to an element of rent seeking in the industry, which is unfortunate in view of the price elasticity of demand.
Figure 39: SA overseas tourists: Region of residence

84
-2
0
2
4
6
8yo
y %
ch
ange
Tourism WC GDPRSource: Quantec Research; own calculations
1991 to 11.6 million by 2010, i.e. a compound annual growth rate in excess of 10% - see Figure 38.
Excluding the day travellers, the number of tourists measured slightly more than 8 million in 201022,
of which 2.2 million were classified as overseas tourists and 5.7 million from African countries
(mainly SADC countries, 5.6 million). Figure 39 shows the regions of residence of the overseas
tourists; it is clear that Europe (60%) is by far the largest source of overseas tourism into SA (with the
leading countries being, the UK, Germany, the Netherlands and France); secondly, North America
(15.2%; mainly the USA) and thirdly, Asia (11.7%; mainly India, China and Japan). The leading SADC
countries of residence are Zimbabwe, Lesotho, Botswana, Namibia, Zambia and Malawi.
Of the 8 million overseas tourists in 2010,
an estimated 1.75 million23 came to the
Western Cape, i.e. up from 790 000 in
1999 or a compound annual growth rate
of 8.6%. However, Figure 38 shows that
while inward tourism to the Western
Cape performed better over the 2000-7
period (compared to national) the region
was more seriously affected by the global
recession, with international arrivals
contracting by 7.5% and 6.2% in 2008/9 respectively. Contrary to the rest of the country, the
overseas tourism segment in the Western Cape constitutes a larger share of the total tourism
market; domestic tourist arrivals to the Western Cape measured 3.6 million in 2009, down from 4.5
million in 200724. During the third quarter of 2010, close to half of the foreign tourist arrivals in the
province came from Europe, 22% came from Africa and the Middle East, 17% from the Americas and
13% from Asia & Australasia (SA Tourism Index, July to September 2010: 45).
The World Cup impact was visible in 2010Q1/Q2 as tourist arrivals picked up in the run up to the
event and from the third quarter the year-on-year growth rate entered a double digit range.
Nationally tourist arrivals in 2010 increased by 15% compared to calendar 2009, which is an
exceptional annual growth rate particularly in view of the fact that it was the first calendar year of
economic recovery from the 2008/9 global recession. The tourism impact of the World Cup and the
22
A tourist is defined as a traveller that overnight at least once. 23
At the time of writing the audited 2010 figure was not available; this is an estimate assuming the Western Cape share of international
arrivals remained unchanged from 2009. 24
These numbers include visitors that do not overnight and should not be compared with the tourist arrivals, which is defined as a
traveller that overnight at least once.
Figure 40: WC real GDPR growth 2005-2015: Tourism

85
doubling of the CTICC’s capacity are both major developments in the regional tourism sector, which
will influence the growth of the industry in the years to come.
Main growth drivers. Tourism spending tends to be a luxury and is sensitive to the state of
the general economic conditions. As noted, the most important markets are the UK,
Germany, Netherlands, USA and France; and, within SADC, Lesotho, Swaziland, Mozambique
and Zimbabwe. The rand exchange rate is another important variable, particularly in respect
of overseas tourism as the latter is very price sensitive. When the exchange rate is strong
you typically find that groups are smaller and stays are shorter. Furthermore, the tendency
becomes one of self-catering rather than groups booking through agents. Competition with
other tourist destinations are strong and sharp price increases could affect tourist arrivals.
The trajectory of international arrivals depicted in Figure 38 reveals the sensitivity to the
general economic conditions in the source markets; overseas tourism blossomed over the
2000-7 period when the global economy experienced lively economic conditions, however,
contracted subsequently; the strengthening of the rand exchange rate possibly exacerbated
the contraction. Domestic tourist arrivals tend to be more seasonal; however, real personal
disposable income growth and the general economic/ business conditions will also play an
important role in driving the growth of tourism from the demand side.
Apart from these (demand side) economic determinants of tourism, other (supply) factors
that drive tourism to South Africa include the beautiful scenery, the cultural experience, the
opportunity to go on safari, relaxation, the warm climate and the friendly people; in a survey
gauging the impact on tourism of the 2010 World Cup, it was found that price discounts (on
accommodation, flights and safari packages) could move tourists to consider returning to
South Africa (SAT, December 2010: 35), again reflecting the price sensitivity of tourism.
Exports. International tourism spending account for close to half of aggregate tourism
spending in South Africa, i.e. estimated at R70 billion in 2008 of total tourism spending of
R147 billion (Statistics SA, 2009). In the Western Cape the foreign component of tourism
spending will even be larger as tourism in the province is skewed in favour of overseas
tourist arrivals vis-à-vis domestic arrivals and arrivals from African countries. According to
SA Reserve Bank data, (national) tourism receipts (i.e. tourist export revenue) increased
from R42.8 billion in 2003 to R66.4 billion in 2010, i.e. an annual compound growth rate of
6.5%.

86
Outlook. It can only be assumed that the prospects for tourism remain bright; this is
certainly the global outlook. However, a factor that needs to be borne in mind is the fact
that economic growth in the advanced economies (SA’s main tourism markets) is expected
to be below par for the foreseeable future. In view of this prospect, it will be difficult to
match the 7% compound annual growth rate in international arrivals (nationally) over the
2000-10 period over the next 4-5 years. The 15% jump in international tourist arrivals in
2010 is encouraging and it is to be hoped that the World Cup injection will be sustained in
the coming years25. The proxy calculated for the Western Cape tourism GDPR is projected to
grow by 4.4% per annum, i.e. slightly faster than the region’s economy – see Figure 4026.
Constraints/ challenges. In the 2001 Provincial Tourism Whitepaper a number of challenges facing
the industry were listed, such as tourist safety; the limited involvement of previously disadvantaged
communities – particularly in townships and rural areas; inadequate funding; institutional
fragmentation; destructive competition i.e. short term private sector vision; poor service levels;
inadequate infrastructure for tourist needs; and tourist infrastructure spending at the expense of
other spending; Cape specific issues listed were: only icons (like Table Mountain) were marketed;
the seasonality of the market; pricing limitations; and air travel constraints (Standish, B, 2006: 10).
Since then a number of these challenges were met, e.g. the expansion and upgrade of the Cape
Town airport; addressing the institutional fragmentation (by the creation of CTRU, for instance);
addressing issues regarding tourist safety; and the diversification of local tourist destinations and the
marketing thereof. These and the other issues need to be constantly addressed in order to
effectively market the Western Cape as a tourist destination of choice. The big challenge currently
for the local tourism sector is to exploit the opportunity presented by the hosting of nine of the 2010
World Cup Soccer events. To ensure this, product quality and service delivery will be critical.
Furthermore, a key challenge will be to address pricing in the industry in order for the industry to
remain internationally competitive. Finally, the skills development in the industry is critical –
particularly management skills are in short supply.
Inter-industry linkages27. The linkages shown in Table 19 are proximate in nature, calculated from
the four subsectors constituting the tourism sector. On the input side, business services (travel
25
International arrivals dipped in December 2010, which is unusual as it marks the beginning of the local high season. This could hint at
a base effect given the build-up to the 2010 World Soccer Cup, which began about that time last year. Should this be the case, lower growth, if not contraction, may be expected in 2011, particularly in view of the major global uncertainties (MENA unrest; European debt crisis; Japanese nuclear crisis).
26 Please note that this time series of the regional tourism real value add is a proxy calculated from the component tourism-linked
subsectors such as catering & accommodation, transport, retail and sport & recreation – refer to Appendix 6. 27
Please note that the linkages shown in Table 19 are proximate in nature; a tourism proxy was calculated from four subsectors, namely
catering & accommodation, transport & storage, wholesale & retail and other CSP services – refer to Appendix 6. The linkages in each of these four subsectors were simply aggregated using the estimated real GDPR shares, which may not be a satisfactory method; e.g.

87
agents, tour operators and car rental, for instance), wholesale & retail, finance & insurance,
petroleum products, food & beverages, transport and automotive can be highlighted as important
connected industries. On the output side, the linkages shown in Table 19 are less obvious; one
would expect relatively weak intermediate use of tourism services, rather mainly final sales to
households and exports (i.e. inward tourists). More research is required in this regard.
Table 19: Input-output relationships of the WC tourism (proxy) sector – 2008 basic values (Rm)
Tourism - proxy: Input data (2008) R million % share Cum %
Business services 1217.2 18.3% 18.3% Wholesale & retail trade 1086.3 16.3% 34.6% Finance & insurance 958.2 14.4% 48.9% Coke & refined petroleum products 672.9 10.1% 59.0% Food 343.7 5.2% 64.2% Communication 327.6 4.9% 69.1% Electricity, gas & steam 201.9 3.0% 72.1% Motor vehicles, parts & accessories 188.3 2.8% 75.0% Transport & storage 177.4 2.7% 77.6% Beverages & Tobacco 164.7 2.5% 80.1% Construction 144.1 2.2% 82.2% Catering & accommodation services 127.4 1.9% 84.2% Agriculture, forestry & fishing 118.2 1.8% 85.9% Paper & paper products 114.8 1.7% 87.7% Non-metallic minerals 103.5 1.6% 89.2% Other transport equipment 80.3 1.2% 90.4% Other sectors 639.3 9.6% 100.0%
Intermediate input (costs) - total above 6665.7 35.6%
Intermediate imports 1558.8 8.3% GDPR at basic prices 10523.9 56.1% … Compensation of employees 3808.0 - … Gross operating surplus 6570.9 - … Indirect taxes - Subsidies on production 145.1 -
Total input (intermediate costs & imports + value added) 18748.4 100.0%
Tourism - proxy: Output data (2008) R million % share Cum %
Mining27 1070.0 14.7% 14.7% Wholesale & retail trade 1017.3 14.0% 28.6% Business services 844.5 11.6% 40.2% Coke & refined petroleum products 433.0 5.9% 46.2% Government 418.3 5.7% 51.9% Transport & storage 377.6 5.2% 57.1% Communication 373.8 5.1% 62.2% Food 372.1 5.1% 67.3% Medical, dental & other health & veterinary services 359.0 4.9% 72.2% Agriculture, forestry & fishing 326.9 4.5% 76.7% Basic chemicals 209.8 2.9% 79.6% Basic iron & steel 154.5 2.1% 81.7% Finance & insurance 141.2 1.9% 83.7% Motor vehicles, parts & accessories 124.4 1.7% 85.4% Non-metallic minerals 114.5 1.6% 86.9% Other chemicals & man-made fibres 107.6 1.5% 88.4% Construction 102.7 1.4% 89.8% Paper & paper products 96.4 1.3% 91.1% Other sectors 645.3 8.9% 100.0%
Intermediate output (sales) - total above 7288.8 38.9%
Total final sales to: 8372.2 44.7%
30% of the transport & storage sector is defined as part of the tourism industry; however, transport is strongly (forwardly) linked with the mining sector, which, in turn, can hardly be an important customer of the tourism sector. Likewise, the final sales to fixed investment can hardly be attributed to tourism activity; however, this reflects the wholesale links with business capital spending. More research is required to better come to grips with the tourism sector’s linkages.

88
-5
0
5
10
15
20
yoy
% c
han
ge
Finance & insurance WC GDPRSource: Quantec Research; own calculations
… Households 4970.6 … Government 0.0 … Fixed investment 304.8 … Inventories/ residual 691.1 … Exports 2405.7 Total output (intermediate + final sales) 15660.9 … plus net output to rest of RSA 3087.5 16.5%
Total output sales 18748.4 100.0%
Source: Quantec Research analysis of StatsSA data
Finance & insurance Background. The financial services sector
(finance & insurance) has a stronger
presence in the Western Cape compared
to the situation nationally. This sector
equals the largest in the region (i.e.
business services), contributing 15.8% of
GDPR in 2009 (up from 9.8% in 2000,
reflecting exceptionally strong growth
averaging close to 9% per annum over
this period). Nationally, the finance &
insurance industry contributes only 9.4% of GDP, which suggests finance & insurance has a strong
revealed comparative advantage in the Western Cape. The Western Cape accounted for 19.1% of
the national finance & insurance sector in 2009; insurance, banking and asset management are the
core regional activities. Large insurance companies began their businesses in Cape Town and
consequently have their head offices in Cape Town (Old Mutual moved its head office to
Johannesburg recently). Cape Town and environs remain an attractive option for financial service
firms to locate and with modern electronic communications technology the distance from the stock
exchange, for instance, is not a problem.
The sector employs highly skilled workers; however, indirectly its growth impacts favourably on both
skilled and semi-and unskilled employment. The sector has a high investment rate (23.7% of output)
and contributes 32.7% of regional GDFI (MEDS, 2008: 253). Employment growth has not been as
strong, averaging 0.5% per annum, 2000-2008 and contracting by close to 6% in 2009; the sector
employed 3.3% of the regional workforce on average, 2000-9; 58% in the insurance sub-sector; 31%
in banking and 11% in investment banking (MEDS, 2008: 254; Quantec Research). The composition
of the work force (being more or less the same in all the branches of finance & insurance) is: 50%
clerical & sales; 20% technical support; 20% professional and 10% senior management.
Figure 41: WC real GDPR growth 2005–2015: Finance & insurance
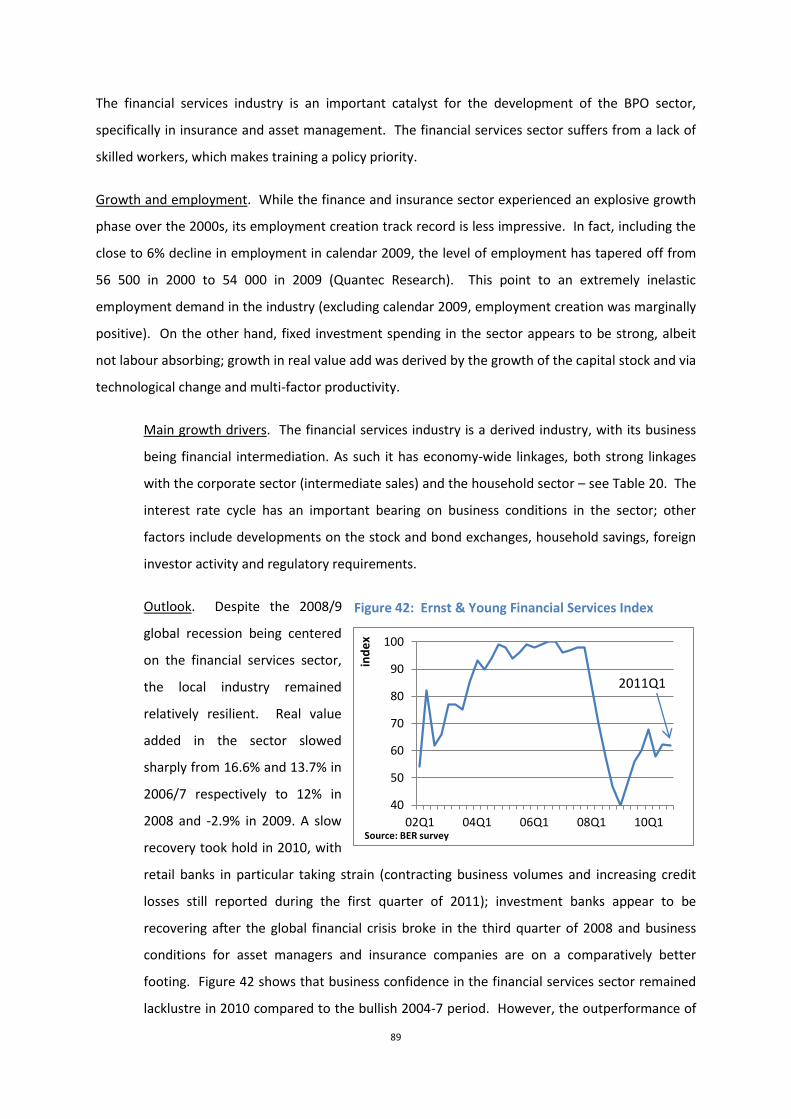
89
40
50
60
70
80
90
100
02Q1 04Q1 06Q1 08Q1 10Q1
ind
ex
Source: BER survey
2011Q1
The financial services industry is an important catalyst for the development of the BPO sector,
specifically in insurance and asset management. The financial services sector suffers from a lack of
skilled workers, which makes training a policy priority.
Growth and employment. While the finance and insurance sector experienced an explosive growth
phase over the 2000s, its employment creation track record is less impressive. In fact, including the
close to 6% decline in employment in calendar 2009, the level of employment has tapered off from
56 500 in 2000 to 54 000 in 2009 (Quantec Research). This point to an extremely inelastic
employment demand in the industry (excluding calendar 2009, employment creation was marginally
positive). On the other hand, fixed investment spending in the sector appears to be strong, albeit
not labour absorbing; growth in real value add was derived by the growth of the capital stock and via
technological change and multi-factor productivity.
Main growth drivers. The financial services industry is a derived industry, with its business
being financial intermediation. As such it has economy-wide linkages, both strong linkages
with the corporate sector (intermediate sales) and the household sector – see Table 20. The
interest rate cycle has an important bearing on business conditions in the sector; other
factors include developments on the stock and bond exchanges, household savings, foreign
investor activity and regulatory requirements.
Outlook. Despite the 2008/9
global recession being centered
on the financial services sector,
the local industry remained
relatively resilient. Real value
added in the sector slowed
sharply from 16.6% and 13.7% in
2006/7 respectively to 12% in
2008 and -2.9% in 2009. A slow
recovery took hold in 2010, with
retail banks in particular taking strain (contracting business volumes and increasing credit
losses still reported during the first quarter of 2011); investment banks appear to be
recovering after the global financial crisis broke in the third quarter of 2008 and business
conditions for asset managers and insurance companies are on a comparatively better
footing. Figure 42 shows that business confidence in the financial services sector remained
lacklustre in 2010 compared to the bullish 2004-7 period. However, the outperformance of
Figure 42: Ernst & Young Financial Services Index

90
the sector is projected to return from 2012 onwards – see Figure 41. Real growth in real
value added is projected to average 6% per annum, 2010-15. This is well above the
economy-wide projected average, but significantly slower than that recorded over the 2000-
9 period. In the banking sector, the National Credit Act has introduced a structural change
(implemented in July 2007) and is expected to keep a lid on credit extension. Banks are
likely to increasingly focus on growing non-interest incomes. The financial dis-
intermediation occurring in the advanced economies of the world is also likely to impact
adversely on the local financial sector over the medium term.
Constraints/ challenges. Being a highly skill-intensive industry, skills development, particularly at
managerial and professional level, remains a key constraint and challenge for the sector.
Inter-industry linkages. The finance & insurance sector has strong forward linkages, but relatively
weak backward linkages; intra-industry linkages feature prominently – no less than two thirds of
intermediate inputs and 43% of intermediate outputs. On the input side the business services sector
(e.g. BPO activity) is an important supplying industry and – to a lesser extent – health services,
printing & publishing and wholesale & retail. A characteristic of the financial services sector is its
strong forward linkages – financial services are used by most industries; prominent are business
services and wholesale & retail and – to a lesser extent – transport & storage and the government;
including the intra-industry output sales, these sectors account for more than 80% of the
intermediate sales. Total final sales account for 27% of total output sales, mainly to households and
exports; it is also notable that this sector has strong regional forward links with the other provinces –
13% of net output is destined to the rest of SA.
Table 20: Input-output relationships of the WC finance & insurance sector – 2008 basic values (Rm)
Financial services: Input data (2008) R million % share Cum %
Finance & insurance 17046.8 67.3% 67.3% Business services 3703.3 14.6% 81.9% Medical, dental & other health & veterinary services 1099.7 4.3% 86.3% Printing, publishing & recorded media 906.3 3.6% 89.9% Wholesale & retail trade 635.7 2.5% 92.4% Other sectors 1928.8 7.6% 100.0%
Intermediate input (costs) - total above 25320.7 38.4%
Intermediate imports 969.0 1.5% GDPR at basic prices 39680.5 60.1% … Compensation of employees 18379.3 - … Gross operating surplus 20718.3 - … Indirect taxes - Subsidies on production 582.8 -
Total input (intermediate costs & imports + value added) 65970.1 100.0%
Financial services: Output data (2008) R million % share Cum %
Finance & insurance 17046.8 43.0% 43.0%
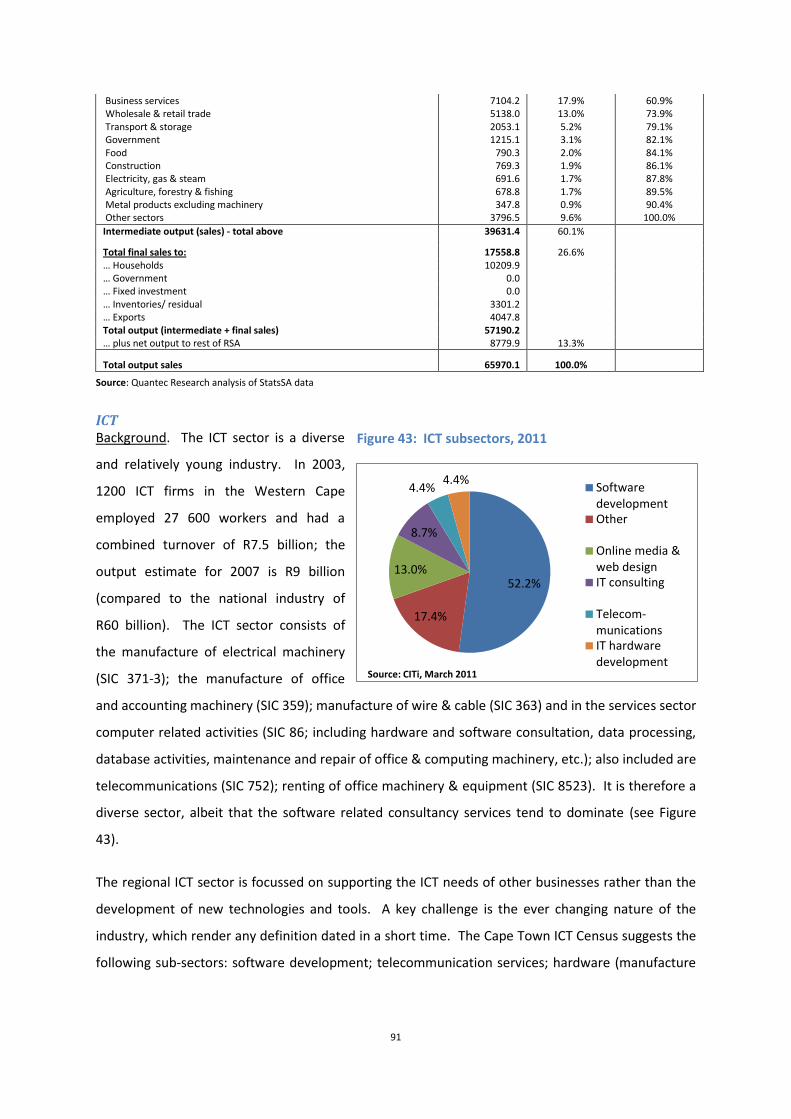
91
52.2%
17.4%
13.0%
8.7%
4.4% 4.4%
SoftwaredevelopmentOther
Online media &web designIT consulting
Telecom-municationsIT hardwaredevelopment
Source: CITi, March 2011
Business services 7104.2 17.9% 60.9% Wholesale & retail trade 5138.0 13.0% 73.9% Transport & storage 2053.1 5.2% 79.1% Government 1215.1 3.1% 82.1% Food 790.3 2.0% 84.1% Construction 769.3 1.9% 86.1% Electricity, gas & steam 691.6 1.7% 87.8% Agriculture, forestry & fishing 678.8 1.7% 89.5% Metal products excluding machinery 347.8 0.9% 90.4% Other sectors 3796.5 9.6% 100.0%
Intermediate output (sales) - total above 39631.4 60.1%
Total final sales to: 17558.8 26.6% … Households 10209.9 … Government 0.0 … Fixed investment 0.0 … Inventories/ residual 3301.2 … Exports 4047.8 Total output (intermediate + final sales) 57190.2 … plus net output to rest of RSA 8779.9 13.3%
Total output sales 65970.1 100.0%
Source: Quantec Research analysis of StatsSA data
ICT Background. The ICT sector is a diverse
and relatively young industry. In 2003,
1200 ICT firms in the Western Cape
employed 27 600 workers and had a
combined turnover of R7.5 billion; the
output estimate for 2007 is R9 billion
(compared to the national industry of
R60 billion). The ICT sector consists of
the manufacture of electrical machinery
(SIC 371-3); the manufacture of office
and accounting machinery (SIC 359); manufacture of wire & cable (SIC 363) and in the services sector
computer related activities (SIC 86; including hardware and software consultation, data processing,
database activities, maintenance and repair of office & computing machinery, etc.); also included are
telecommunications (SIC 752); renting of office machinery & equipment (SIC 8523). It is therefore a
diverse sector, albeit that the software related consultancy services tend to dominate (see Figure
43).
The regional ICT sector is focussed on supporting the ICT needs of other businesses rather than the
development of new technologies and tools. A key challenge is the ever changing nature of the
industry, which render any definition dated in a short time. The Cape Town ICT Census suggests the
following sub-sectors: software development; telecommunication services; hardware (manufacture
Figure 43: ICT subsectors, 2011

92
2007 2008 2009
2000-09
2010-15f
Real GDPR Yoy% 10.8 9.5 -1.1 7.4 5.5 % of WC 3.8 3.9 3.9 3.5 4.1
Employment Yoy% 0.8 5.8 -6.5 2.3 1.8 % of WC 1.5 1.5 1.5 1.5 1.5
Exports Yoy% 16.2 3.5 -17.0 5.9 4.9
Source: Quantec Research; own calculations
& repair); online digital media and IT services. In Figure 43 the spread of 23 ICT companies surveyed
recently are shown (CITi, March 2011).
Growth and employment. According to the
proxy calculated for the ICT sector from
Quantec Research data (see Appendix 3),
the ICT sector has been one of the fastest
growing subsectors in the Western Cape.
Real value added grew by an annual
compound rate of 7.4% over the period
2000 to 2009; employment in the industry
grew by 2.3% per annum over the corresponding period. The combination of high growth with a
reasonable employment response makes it one of the top performing industries in the Western
Cape. Growth did taper down during the recession and contracted mildly in 2009 (-1.1%);
unfortunately employment did contract sharply in 2009 (-6.5%). The ICT industry contributes an
estimated 4% to regional GDPR and employs 1.5% of the regional workforce.
Main growth drivers. The ICT sector is a services industry with strong linkages with the
whole range of other businesses in the wider economy – see Table 22 below. The financial
services industry is an important driver of growth in the sector; the sector has also done well
in the penetration of foreign markets despite firms being generally small. The local ICT
sector has huge growth potential especially following steps to liberalise the
telecommunications market in South Africa. The development of the ICT industry also
embodies key positive externalities for the wider regional economy. A key catalyst for the
regional industry will be the establishment of a broadband metropolitan area network – this
is on the agenda of the PGWC.
Exports. While distance to markets is a key challenge for the local ICT industry and ICT firms
tend to be small enterprises, the industry has done well in terms of export growth – real
exports have grown by 5.9% per annum over the 2000-9 period and the share of real value
add being exported measures 15% on average over this period. ICT exports did contract
sharply in 2009 due to the sharp slowdown in the global economy and the financial sector in
particular.
Table 21: WC ICT sector (proxy): 2007-15
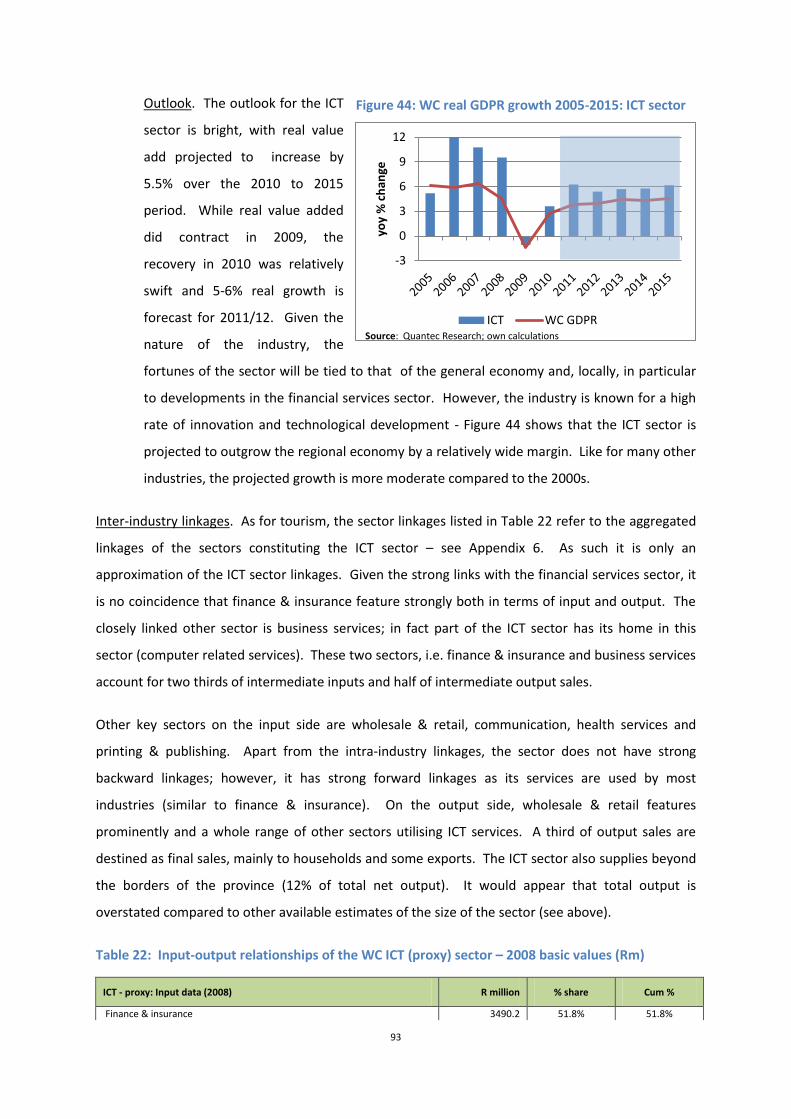
93
-3
0
3
6
9
12
yoy
% c
han
ge
ICT WC GDPRSource: Quantec Research; own calculations
Outlook. The outlook for the ICT
sector is bright, with real value
add projected to increase by
5.5% over the 2010 to 2015
period. While real value added
did contract in 2009, the
recovery in 2010 was relatively
swift and 5-6% real growth is
forecast for 2011/12. Given the
nature of the industry, the
fortunes of the sector will be tied to that of the general economy and, locally, in particular
to developments in the financial services sector. However, the industry is known for a high
rate of innovation and technological development - Figure 44 shows that the ICT sector is
projected to outgrow the regional economy by a relatively wide margin. Like for many other
industries, the projected growth is more moderate compared to the 2000s.
Inter-industry linkages. As for tourism, the sector linkages listed in Table 22 refer to the aggregated
linkages of the sectors constituting the ICT sector – see Appendix 6. As such it is only an
approximation of the ICT sector linkages. Given the strong links with the financial services sector, it
is no coincidence that finance & insurance feature strongly both in terms of input and output. The
closely linked other sector is business services; in fact part of the ICT sector has its home in this
sector (computer related services). These two sectors, i.e. finance & insurance and business services
account for two thirds of intermediate inputs and half of intermediate output sales.
Other key sectors on the input side are wholesale & retail, communication, health services and
printing & publishing. Apart from the intra-industry linkages, the sector does not have strong
backward linkages; however, it has strong forward linkages as its services are used by most
industries (similar to finance & insurance). On the output side, wholesale & retail features
prominently and a whole range of other sectors utilising ICT services. A third of output sales are
destined as final sales, mainly to households and some exports. The ICT sector also supplies beyond
the borders of the province (12% of total net output). It would appear that total output is
overstated compared to other available estimates of the size of the sector (see above).
Table 22: Input-output relationships of the WC ICT (proxy) sector – 2008 basic values (Rm)
ICT - proxy: Input data (2008) R million % share Cum %
Finance & insurance 3490.2 51.8% 51.8%
Figure 44: WC real GDPR growth 2005-2015: ICT sector

94
Business services 1023.8 15.2% 67.0% Wholesale & retail trade 424.6 6.3% 73.3% Communication 357.2 5.3% 78.6% Medical, dental & other health & veterinary services 252.3 3.7% 82.3% Printing, publishing & recorded media 223.0 3.3% 85.6% Transport & storage 145.3 2.2% 87.8% Construction 123.6 1.8% 89.6% Paper & paper products 89.0 1.3% 90.9% Other sectors 611.3 9.1% 100.0%
Intermediate input (costs) - total above 6740.2 37.5%
Intermediate imports 713.2 4.0% GDPR at basic prices 10510.9 58.5% … Compensation of employees 4173.9 - … Gross operating surplus 6052.8 - … Indirect taxes - Subsidies on production 284.2 -
Total input (intermediate costs & imports + value added) 17964.3 100.0%
ICT - proxy: Output data (2008) R million % share Cum %
Finance & insurance 3292.8 34.0% 34.0% Business services 1684.7 17.4% 51.4% Wholesale & retail trade 1398.4 14.4% 65.8% Transport & storage 448.3 4.6% 70.5% Medical, dental & other health & veterinary services 341.4 3.5% 74.0% Government 332.2 3.4% 77.4% Construction 303.4 3.1% 80.6% Communication 267.6 2.8% 83.3% Food 216.6 2.2% 85.6% Electricity, gas & steam 165.1 1.7% 87.3% Agriculture, forestry & fishing 124.5 1.3% 88.6% Metal products excluding machinery 86.8 0.9% 89.5% Catering & accommodation services 76.9 0.8% 90.2% Other sectors 944.2 9.8% 100.0%
Intermediate output (sales) - total above 9683.1 53.9%
Total final sales to: 6081.0 33.9% … Households 3660.0 … Government 0.0 … Fixed investment 400.9 … Inventories/ residual 898.0 … Exports 1122.1 Total output (intermediate + final sales) 15764.2 … plus net output to rest of RSA 2200.1 12.2%
Total output sales 17964.3 100.0%
Source: Quantec Research analysis of StatsSA data
Call centres/ BPO Background. Call centres and Business Process Outsourcing (BPO) have become blossoming
industries in the Western Cape. The sector is currently still small in the bigger context (annual
turnover of the provincial industry is estimated between R2.5 to R3.3 billion), but it is growing
rapidly; the industry employed 27 800 staff in 2007/8, up from 10 000 in 2004. It is a labour
intensive, export oriented services industry, consisting of a whole range of activities, including
human resources & payroll administration, finance & accounting back office operations; asset
management back office functions; banking and related data processing, website and database
maintenance; travel & tourism management functions, etc.
The key subsectors in the BPO industry are: Firstly, call centres, which currently forms the backbone
of the provincial BPO industry; these centres are responsible for the employment and training of 20

95
000 people per annum. Secondly, the growth of the BPO industry has to be accommodated by the
capacity of the ICT sector; the province is fortunate to have a rapidly growing ICT sector. Thirdly,
telecommunications; while telecommunication costs are currently high and uncompetitive, they are
destined to decline. Fourthly, Internet Service Providers (ISPs); and fifthly, financial services,
including custody services, asset management and employee benefits. Other minor sectors
associated with the BPO industry, include the food & beverage industry, film, security, media,
transport, marketing, retail, healthcare, human resource management and tourism. The inter-
industry linkages of the broader business services sector are shown in Table 23 below.
The industry operates in a very competitive international market; the rand exchange rate is
therefore a key variable. The current tendency in the industry is to move away from call centres to
the supply of back-office operations (BPO). Cape Town as a conduit into the African continent
appears to be an attractive option for overseas corporations (e.g. Amazon). Cape Town is one of the
fastest growing metropolitan areas and it is one of the world’s top five tourist destinations. The
competitive advantages for local operations are language and culture and low wage costs, which
gives the industry inroads into the advanced economy markets such as the UK, USA and Europe.
Growth and employment. The development of the BPO sector commenced in the mid-1980s with
the establishment of call centres for companies with high customer contact requirements, such as
Sanlam, Old Mutual, Telkom and Woolworths. The sector remained stable for a long period, until
recently (2003) with the influx of new international operations and growing demand for call centres
in the domestic market. Employment in the industry grew from 10 000 in 2004 to 27 800 in 2008,
accounting for 1.2% of the regional workforce; it is expected that employment can be boosted to 85
000 in the next five years. Companies that entered the Cape Town market with small operations
soon invested and expanded. Call volumes are growing at rates of 10-15% per annum due to
increased mobile phone penetration, new technologies, new products (in the financial services
sector) and the rapid growth of the financial services industry. From 2005/6, South Africa became to
be seen as an attractive alternative destination to India and the Philippines for call centre work. In
2007/8 close to 3000 agents worked on offshore programmes, accounting for 15% of the industry
(currently around 5000 people are employed in the offshore sector) (Bux, S; Interview, 2011). The
UK is the prime market for offshore call centre work.
Main growth drivers. The sector is driven by what happens in the other sectors of the
economy – when business activity is growing, demand for servicing of clients increase, which
then spinoff to the BPO sector. Strong forward linkages exist with the financial services
industry (insurance and asset management), travel & tourism; telecommunication and retail.

96
The sector’s main competitive advantage is low price – 30-40% cheaper than UK for
instance; the local industry also benefits from risk diversification away from India. Half of
offshore business in South Africa is located in Cape Town. The growth in the local market is
not so much happening as a result of the growth conditions in the advanced economies, but
it is a case of local firms capturing an increasing market share.
The industry is very sensitive to cost fluctuations as it operates on low margins. It is a labour
intensive industry with labour costs comprising 50% of the cost base; another 8-10% is
telecommunication costs (which are a key constraint for the industry); skills shortages is
another problem area not so much at the lower job categories but in middle to higher
management. While the industry easily absorbs unemployed matrics, it is often the case
that additional education/ grooming and skills development is required. The sector has
important indirect linkages – for every one job created in the industry, another three
indirect jobs are created. (e.g. IT, rent, cleaning and training).
Exports. Offshore activity comprises about 10-15% of total employment (Bux: Interview,
2011). The most important markets are the UK, USA and Europe; India is a key competing
service provider. Currently the DEDT focuses its development support on the offshore
sector. From a base of 5000 jobs, the aim is to create 1700 new jobs by March 2012 and an
additional 4200 by March 2013 – this is only in the offshore sector (10% of the broader
sector, including back office activity). The trend of BPO offshoring is set to continue, with
large skilled worker shortages projected for countries like the USA (17 million by 2025),
France, Germany and Spain (short 3 million each) and Italy and the UK (short 2 million each).
Declining educational enrolments and the retirement of ‘baby boomers’ is likely to
exacerbate these shortages (Wesgro, 2011: 19).
Outlook. The Western Cape’s BPO sector has been booming and the outlook remains
promising. There are big new investments in the pipeline and the industry is confident
regarding the targeted job growth planned for the sector. Both national and provincial
government are supporting skills development in the sector, as well as stimulating
operations. The 2011 national budget contained a key incentive for the industry –
amounting to a 20% cost reduction: R100 000 per seat over three years, which can be an
important boost to the industry over the short to medium term.
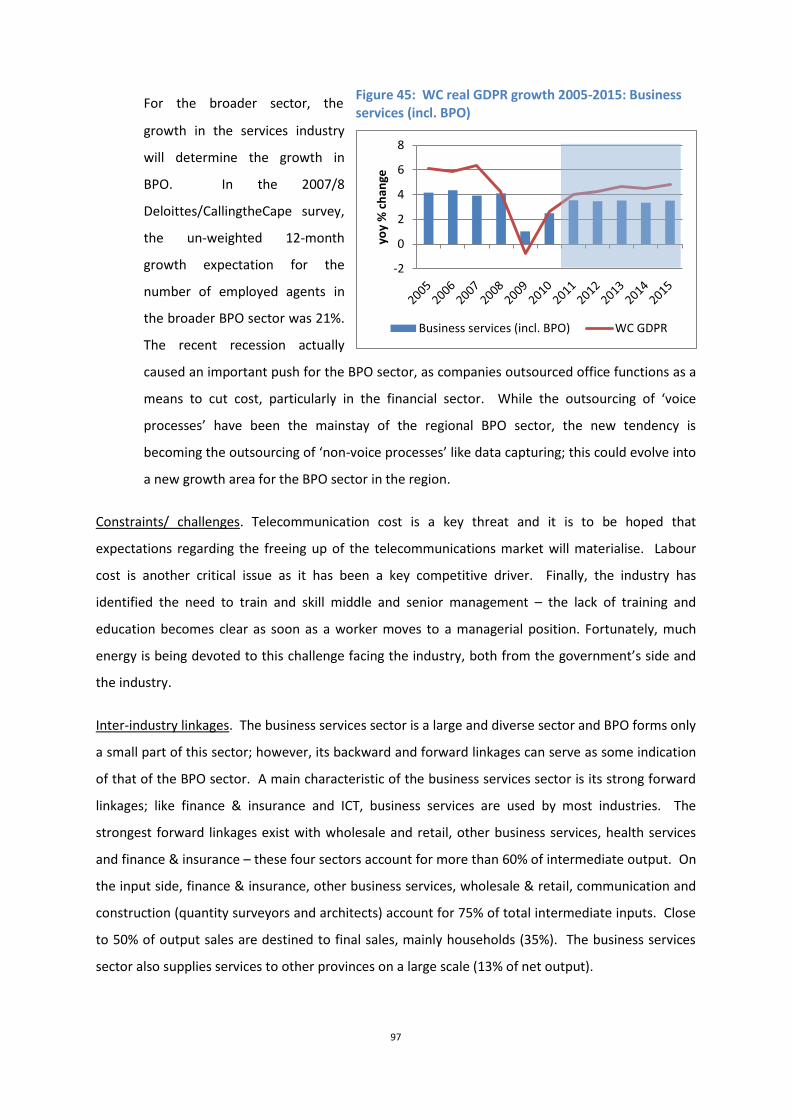
97
-2
0
2
4
6
8
yoy
% c
han
ge
Business services (incl. BPO) WC GDPR
For the broader sector, the
growth in the services industry
will determine the growth in
BPO. In the 2007/8
Deloittes/CallingtheCape survey,
the un-weighted 12-month
growth expectation for the
number of employed agents in
the broader BPO sector was 21%.
The recent recession actually
caused an important push for the BPO sector, as companies outsourced office functions as a
means to cut cost, particularly in the financial sector. While the outsourcing of ‘voice
processes’ have been the mainstay of the regional BPO sector, the new tendency is
becoming the outsourcing of ‘non-voice processes’ like data capturing; this could evolve into
a new growth area for the BPO sector in the region.
Constraints/ challenges. Telecommunication cost is a key threat and it is to be hoped that
expectations regarding the freeing up of the telecommunications market will materialise. Labour
cost is another critical issue as it has been a key competitive driver. Finally, the industry has
identified the need to train and skill middle and senior management – the lack of training and
education becomes clear as soon as a worker moves to a managerial position. Fortunately, much
energy is being devoted to this challenge facing the industry, both from the government’s side and
the industry.
Inter-industry linkages. The business services sector is a large and diverse sector and BPO forms only
a small part of this sector; however, its backward and forward linkages can serve as some indication
of that of the BPO sector. A main characteristic of the business services sector is its strong forward
linkages; like finance & insurance and ICT, business services are used by most industries. The
strongest forward linkages exist with wholesale and retail, other business services, health services
and finance & insurance – these four sectors account for more than 60% of intermediate output. On
the input side, finance & insurance, other business services, wholesale & retail, communication and
construction (quantity surveyors and architects) account for 75% of total intermediate inputs. Close
to 50% of output sales are destined to final sales, mainly households (35%). The business services
sector also supplies services to other provinces on a large scale (13% of net output).
Figure 45: WC real GDPR growth 2005-2015: Business services (incl. BPO)

98
Table 23: Input-output relationships of the WC business services sector – 2008 basic values (Rm)
Business services (including BPO): Input data (2008) R million % share Cum %
Finance & insurance 7104.2 28.3% 28.3% Business services 5648.4 22.5% 50.8% Wholesale & retail trade 2469.9 9.8% 60.7% Communication 1853.5 7.4% 68.1% Construction 1793.5 7.1% 75.2% Medical, dental & other health & veterinary services 917.9 3.7% 78.9% Transport & storage 913.9 3.6% 82.5% Printing, publishing & recorded media 799.8 3.2% 85.7% Catering & accommodation services 677.7 2.7% 88.4% Coke & refined petroleum products 456.8 1.8% 90.2% Other sectors 2450.5 9.8% 100.0%
Intermediate input (costs) - total above 25085.9 31.0%
Intermediate imports 4589.3 5.7% GDPR at basic prices 51269.6 63.3% … Compensation of employees 11628.2 - … Gross operating surplus 36473.7 - … Indirect taxes - Subsidies on production 3167.7 -
Total input (intermediate costs & imports + value added) 80944.8 100.0%
Business services (including BPO): Output data (2008) R million % share Cum %
Wholesale & retail trade 5820.5 18.7% 18.7% Business services 5648.4 18.1% 36.8% Medical, dental & other health & veterinary services 4442.3 14.2% 51.0% Finance & insurance 3703.3 11.9% 62.9% Construction 1512.9 4.9% 67.8% Food 1266.8 4.1% 71.8% Government 1259.8 4.0% 75.9% Transport & storage 1001.1 3.2% 79.1% Catering & accommodation services 958.3 3.1% 82.2% Other chemicals & man-made fibres 699.9 2.2% 84.4% Communication 405.2 1.3% 85.7% Beverages & Tobacco 385.2 1.2% 86.9% Metal products excluding machinery 324.5 1.0% 88.0% Machinery & equipment 315.5 1.0% 89.0% Paper & paper products 298.6 1.0% 89.9% Basic chemicals 292.6 0.9% 90.9% Other sectors 2843.8 9.1% 100.0%
Intermediate output (sales) - total above 31178.8 38.5%
Total final sales to: 39285.0 48.5% … Households 27926.6 … Government 0.0 … Fixed investment 4693.9 … Inventories/ residual 4355.1 … Exports 2309.5 Total output (intermediate + final sales) 70463.8 … plus net output to rest of RSA 10481.0 12.9%
Total output sales 80944.8 100.0%
Source: Quantec Research analysis of StatsSA data

99
An assessment of Western Cape inter-industry linkages
For policy intervention purposes, there are, amongst other, two issues of concern to the policy
maker. Firstly, it is important to understand the ‘connectedness’ of any particular sector/ industry in
the economy. The question is to what extent any particular industry is dependent on intermediate
inputs from supplying sectors and/or dependent for its intermediate sales to other purchasing
sectors. The greater this dependence, the larger the impact of any policy intervention is likely to be.
This brings us to the second issue (related to the former), namely the multiplied impact of an
exogenous change in the economy. When the final demand for a particular industry changes, for
instance, the impact does not only include the initial shock, but a series of indirect and induced
effects on output, value-added, employment, labour income, imports, etc. as the linked industries
respond to the change. Once more, the scope of these multiplied impacts is important to the policy
maker keen to maximise the effectiveness of any policy intervention.
Both these issues – i.e. backward and forward linkages and multipliers – are facilitated in input-
output analysis and receive brief attention in this section of the report.
Backward and forward linkages
The production in a particular sector has two economic effects on other sectors in the economy (in
an input-output modelling framework): firstly, backward linkages are defined as the upstream
purchases of inputs in order to increase output in a particular sector/industry; and, secondly,
forward linkages, i.e. when a particular industry’s output increases, more units of output are
available for use as inputs by downstream industries/sectors. In an input-output modelling context,
the backward linked sectors can be viewed across the columns of the input-output matrix, Z
(containing the inter-industry flows); and the forwardly linked sectors across the rows of Z (see
Appendix 10). These input-output relationships were outlined above in the main section of the
report in respect of each of the sectors considered.
In a further step, it is possible to quantify these inter-industry linkages. When a specific industry has
strong backward and/or forward linkages for instance, it may be worthwhile for the authorities to
support that industry as such policy support is likely to have a higher impact given the multiplied
effects likely to be generated in the process. For the purpose of the current study, it was therefore
decided to calculate both the backward (BL) and forward (FL) linkages of the 41 industry groups as
per the standard industry classification in Appendix 428. A technical note on the calculation of the
28
For the purposes of this exercise it was necessary to stick to the standard classification of industries as intricate input-output modelling
is required to calculate the inter-industry linkages; this can only be done “in-model”. Furthermore, it was decided to restrict the

100
backward and forward linkages is provided in Appendix 10. On the basis of the computed
normalised backward and forward linkages, each sector was classified into four industry groups – see
Table 24.
1. Both BLj > 1 and FLj > 1: This implies sector j is an above-average connected sector, both
dependent on inputs from other upstream sectors and dependent on inter-industry demand
for its output sales – see bottom right quadrant (IV): generally dependent/ well-connected
sectors;
2. Both BLj < 1 and FLj < 1: This implies sector j is an above average independent sector, not
being dependent on upstream supplies or downstream inter-industry sales – see top left
quadrant (I): generally independent sectors;
3. BLj > 1 and FLj < 1: This implies sector j is dependent on upstream sectors for inputs, but it
does not conduct much sales with other downstream sectors – see bottom left quadrant
(III): sectors dependent on inter-industry supply; and
4. BLj < 1 and FLj > 1: This implies sector j does not rely or depend much on upstream sectors
for its input, but has above average connections to downstream sectors for its output sales –
see top right quadrant (II): sectors dependent on inter-industry demand.
Grouping the various industries in this way provides valuable information for policy intervention
purposes.
The results in Table 24 are for the most part not surprising, except for the long list of generally
independent (manufacturing) sectors. One would expect that your manufacturing industries are
well-connected to other sectors, both backwardly and forwardly. However, the table shows a long
list of relatively independent manufacturing industries in the Western Cape, such as other transport
equipment, other industries, non-ferrous metals, clothing, printing & publishing, plastics, footwear,
machinery, non-metallic products and basic chemicals industries.
On the other hand, a whole range of manufacturing industries have strong backward linkages (see
quadrant III, Table 24), namely leather products, paper products, rubber, furniture, wood products,
iron & steel, other chemicals, the electronics industry, textiles and metal products. A number of
these industries are earmarked for policy support, which can be supported from this analysis; wood
analysis to the intra-regional linkages, i.e. not to consider the inter-regional linkages at this stage; this is an area for potentially fruitful future research.
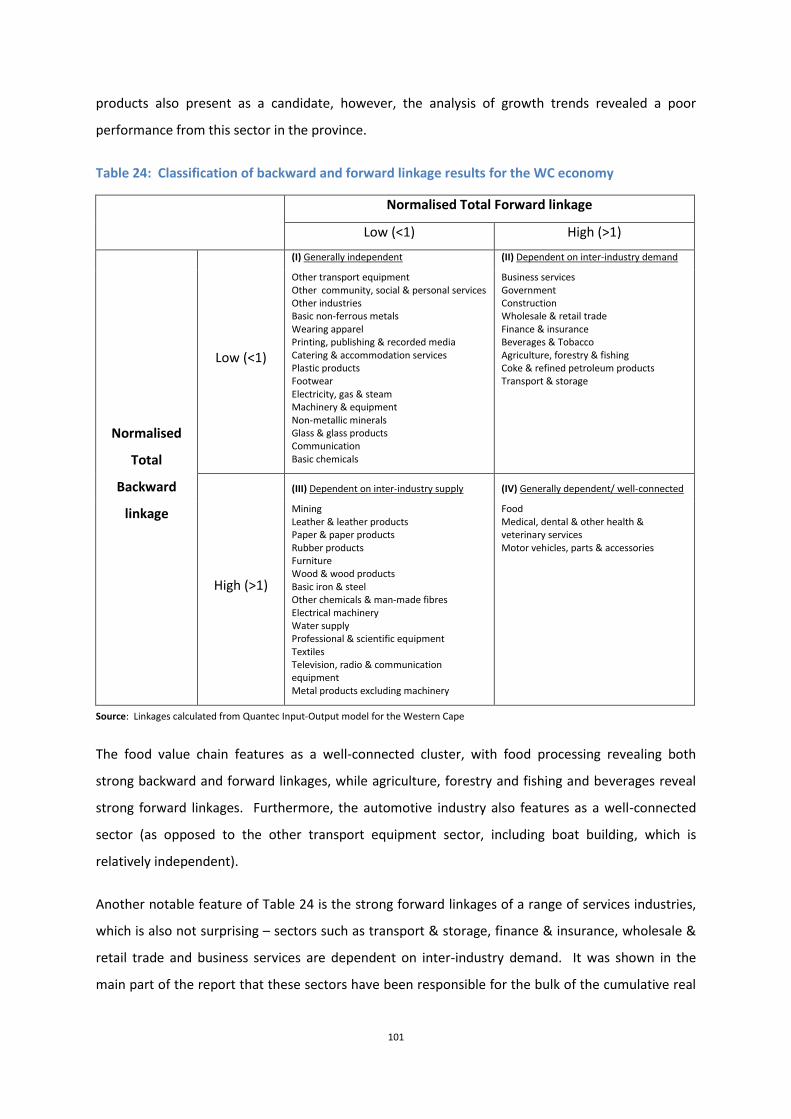
101
products also present as a candidate, however, the analysis of growth trends revealed a poor
performance from this sector in the province.
Table 24: Classification of backward and forward linkage results for the WC economy
Normalised Total Forward linkage
Low (<1) High (>1)
Normalised
Total
Backward
linkage
Low (<1)
1. (I) Generally independent (II) Dependent on inter-industry demand
Other transport equipment Other community, social & personal services Other industries Basic non-ferrous metals Wearing apparel Printing, publishing & recorded media Catering & accommodation services Plastic products Footwear Electricity, gas & steam Machinery & equipment Non-metallic minerals Glass & glass products Communication Basic chemicals
Business services Government Construction Wholesale & retail trade Finance & insurance Beverages & Tobacco Agriculture, forestry & fishing Coke & refined petroleum products Transport & storage
High (>1)
(III) Dependent on inter-industry supply (IV) Generally dependent/ well-connected
Mining Leather & leather products Paper & paper products Rubber products Furniture Wood & wood products Basic iron & steel Other chemicals & man-made fibres Electrical machinery Water supply Professional & scientific equipment Textiles Television, radio & communication equipment Metal products excluding machinery
Food Medical, dental & other health & veterinary services Motor vehicles, parts & accessories
Source: Linkages calculated from Quantec Input-Output model for the Western Cape
The food value chain features as a well-connected cluster, with food processing revealing both
strong backward and forward linkages, while agriculture, forestry and fishing and beverages reveal
strong forward linkages. Furthermore, the automotive industry also features as a well-connected
sector (as opposed to the other transport equipment sector, including boat building, which is
relatively independent).
Another notable feature of Table 24 is the strong forward linkages of a range of services industries,
which is also not surprising – sectors such as transport & storage, finance & insurance, wholesale &
retail trade and business services are dependent on inter-industry demand. It was shown in the
main part of the report that these sectors have been responsible for the bulk of the cumulative real

102
economic growth in the region. Construction and petroleum products also feature in quadrant II of
Table 24, i.e. sectors dependent on inter-industry demand.
In all, the results from the analysis above are somewhat mixed: the relatively long list of generally
independent manufacturing industries (with one or two services sectors, e.g. other CSP services,
catering & accommodation and communication) contrasts with an equally long list of strong
backwardly linked manufacturing industries, some with strong forward links (e.g. beverages and
petroleum products) and a list of services industries with strong forward linkages (e.g. business
services, finance & insurance, wholesale & retail, transport & storage and government). Agriculture,
forestry & fishing also reveal strong forward linkages. Only the food, automotive and medical &
health services sectors reveal both strong backward and forward linkages.
The analysis of inter-industry linkages is restricted to intermediate inputs (supply) and sales
(demand). When we allow for the induced effect, i.e. the multiplier effect arising from introducing
the household sector into the model (i.e. the additional inputs/ outputs required to meet the
additional spending from households/ labour stimulated by the initial and indirect boosts to
production), so-called economy-wide multipliers can be computed. As noted, the current analysis
includes a brief consideration of value-added (or GDPR) and employment multipliers.
Table 25: Classification of WC industries i.r.o. their ‘induced effect’ multipliers
Normalised induced effect multiplier
Low (< 1) High (>1)
Metal products excluding machinery Rubber products Professional & scientific equipment Machinery & equipment Construction Television, radio & communication equipment Leather & leather products Electrical machinery Other chemicals & man-made fibres Agriculture, forestry & fishing Footwear Beverages & Tobacco Other transport equipment Water supply Glass & glass products Textiles Other industries Paper & paper products Basic iron & steel Non-metallic minerals Basic non-ferrous metals Basic chemicals Motor vehicles, parts & accessories Coke & refined petroleum products
Other community, social & personal services Government Finance & insurance Wholesale & retail trade Medical, dental & other health & veterinary services Electricity, gas & steam Plastic products Mining Catering & accommodation services Wood & wood products Business services Transport & storage Wearing apparel Food Furniture Printing, publishing & recorded media Communication
Source: Quantec Research
103
However, before the attention focuses on this, the list of 41 industries is partitioned into two
sections: one, industries with an (normalised) induced effect multiplier less than unity; and second, a
list of industries with a normalised induced effect multiplier of greater than one – see Table 25. An
induced effect below unity suggests the particular industry has below average links with the
household sector and/or may be relatively capital intensive; the converse applies i.r.o. the last
mentioned list of industries with an above-average induced effect multiplier (see following section).
GDPR and employment multipliers
As noted, an analysis of backward and forward linkages is restricted to the inter-industry multipliers
(the quantified backward linkage of sector j is, for instance, nothing else than the direct & indirect
output multiplier of sector j, i.e. with the household sector exogenous in the model). Multiplier
analysis can, however, be extended: when the input-output model is closed with the household
sector (alternatively made endogenous), economy-wide multipliers can be calculated, which include
the direct, indirect and induced effects of a unit change in final demand of sector j (see Appendices 3
and 10).
Furthermore, apart from output multipliers, the calculation of other multipliers is possible, such as
multipliers for value-added (GDP), employment, labour income, taxes, imports, etc. The central
question regarding multipliers is what the (direct, indirect and induced) impact on output, GDP,
labour income, operating surpluses, tax revenue, etc. (whatever the quantity that is being
investigated) may be given one unit change in final demand in the economy.
It is often argued that value added (i.e. the difference between the value of a sector’s output and
the costs of its intermediate inputs) is a better measure of a sector’s contribution to the economy
(compared to output, for instance) as it measures the true value added to the economy by the
relevant sector engaging in production. Furthermore, as employment creation is a high priority on
the economic policy agenda, it is also important to gauge the employment impact of a unit change in
final demand (and output). For the purpose of the present exercise, economy wide value-added (or
GDPR) and employment multipliers were calculated and classified on a similar basis than was done
for the backward and forward linkages29 – see Table 26.
A key difference between the classification in Table 26 and that of Table 24 is the fact that the
induced effect (additional to the direct and indirect effects) of a unit change in final demand is
included. It therefore does not follow that the results of Table 26 must replicate that of Table 24;
29
It needs to be emphasized that the multiplier analysis – as with the analysis of backward and forward linkages (see footnote 28) – was
also restricted to a consideration of the intra-regional effects only; the consideration of inter-regional multipliers is an area for future
research.
104
rather, the results in Table 26 should be read in conjunction with that of Table 25. The 41 sectors in
the Western Cape input-output model (see Appendix 4) were classified into four groups depending
on the sizes of the normalised GDPR (m(va)) and employment (m(l)) multipliers:
1. Both m(va) > 1 and m(l) > 1: The sectors in this quadrant (bottom right, Table 26) reveal
both above-average impacts on GDPR and employment in response to a unit change in
output/ final demand;
2. Both m(va) < 1 and m(l) < 1: The sectors in this quadrant (top left, Table 26) reveal both
below-average impacts on GDPR and employment in response to a unit change in
output/ final demand;
3. M(va) > 1 and m(l) < 1: The sectors in this quadrant (bottom left, Table 26) reveal an
above-average impact on GDPR and a below-average impact on employment in
response to a unit change in output/ final demand;
4. M(va) < 1 and m(l) > 1: The sectors in this quadrant (top right, Table 26) reveal a below-
average impact on GDPR and an above-average impact on employment in response to a
unit change in output/ final demand.
A notable feature of Table 26 is the long list of manufacturing industries classified in the first
quadrant – these sectors show weak value-added and employment responses to a unit change in
final demand/ output. In fact, a number of these sectors also appeared in the first quadrant of Table
24 (i.e. with relatively weak backward and forward linkages): printing & publishing; machinery; non-
metallic products; other industries; footwear; non-ferrous metals; other transport equipment and
basic chemicals. This is explained by the fact that all these industries exhibit relatively low induced
effect multipliers as well.
Therefore, on both counts considered here (backward & forward linkages and value-added &
employment multipliers), these sectors will find it difficult to motivate industrial policy support.
Sectors, which may have been candidates on the basis of strong backward linkages, may be
disqualified being unresponsive in terms of value-added and employment impacts: included here are
rubber products; the electronics cluster; metal products; other chemicals; paper products; iron &
steel; the automotive sector and water supply. Sectors with strong forward linkages, but poor value-
added and employment responsiveness include beverages; petroleum products and agriculture.

105
On the other hand, a few sectors classified as generally independent, but do show some
responsiveness in terms of value added and employment when economy-wide multipliers are
considered, include: other community, social and personal services and catering and
accommodation, both sectors are linked with tourism on the supply side and have above-average
induced effect multipliers. In fact, wholesale and retail, also linked with tourism and a sector with
strong forward linkages are classified in this quadrant (i.e. above average value-added and
employment multipliers). An interesting sector in this quadrant is the government (also with above-
average forward linkages).
Table 26: Classification of WC sectors’ economy-wide GDPR and employment multipliers*
Economy-wide employment multiplier
Below average (<1) Above average (>1)
Economy-
wide GDPR
multiplier
Below
average
(<1)
Rubber products Professional & scientific equipment Agriculture, forestry & fishing Metal products excluding machinery Printing, publishing & recorded media Water supply Beverages & Tobacco Television, radio & communication equipment Machinery & equipment Other chemicals & man-made fibres Glass & glass products Other industries Electrical machinery Paper & paper products Non-metallic minerals Footwear Basic non-ferrous metals Basic iron & steel Other transport equipment Basic chemicals Motor vehicles, parts & accessories Coke & refined petroleum products
Furniture Construction Wearing apparel Leather & leather products Textiles
Above
average
(>1)
Finance & insurance Electricity, gas & steam Medical, dental & other health & veterinary services Business services Transport & storage Mining Communication Food Plastic products
Other community, social & personal services Government Wholesale & retail trade Catering & accommodation services Wood & wood products
* Normalised value-added and employment multipliers.
Source: Quantec Research
An industry which moves to the foreground is wood products: whilst a stagnating industry in the
province, it reveals strong backward linkages and shows some responsiveness in terms of value-
added and employment. Given the size of this industry in the local manufacturing sector, both in

106
terms of employment and value-added, further research maybe required into the viability of policy
support.
Other industries showing above-average value-added responses, but below-average employment
responses and which are classified as relatively independent, include: electricity; communication and
plastic products. Industries with strong forward linkages and high value-added responsiveness, but
with poor employment reactions, include: finance & insurance; medical & health services; business
services; food and transport & storage.
The only sectors with an above average employment response include furniture, construction,
clothing, leather products and textiles. These industries are known to be relatively labour intensive.
Whilst support for the clothing sector is ruled out on the basis of the industry’s linkages, it may be
justified in terms of its employment responsiveness. Textiles and furniture also revealed above-
average backward linkages and may also qualify for policy support on the basis of their employment
responsiveness.
In all, the analysis of value-added and employment multipliers has shown a long list of mainly
manufacturing industries, which are relatively unresponsive in terms of value-added and
employment; the exceptions are food and plastic products in terms of above average value-added
multipliers and furniture, clothing, leather products and textiles in terms of employment multipliers.
The whole range of services industries exhibit above average value-added multipliers; however,
some combined with weak employment responsiveness (e.g. finance & insurance, medical & health
services, business services, transport & storage and communication) and a few with above average
employment responsiveness (e.g. other CSP services, government, wholesale & retail and catering &
accommodation).
Concluding remarks/ summary
The current study’s main objective was to arrive at a macro-economic assessment of the outlook for
the Western Cape economy across the various industries, including some perspective on the region’s
inter-industry linkages. This was done in order to obtain a real sense of the (relative) growth
potential of the various industries and specifically those identified by the DEDT as priority sectors.
The anticipated macro-economic climate for Western Cape firms over the next five years can be
summarised as follows:
Whilst the anticipated shape and length of the ensuing business cycle remains somewhat
uncertain, what is clear is that the global, national and regional economies have all

107
embarked on a recovery from what is being described as the Great Recession (2008/9). At
the global level the recovery is characterised by a two speed expansion, with AEs expected
to grow by a relatively modest 2.5% per annum and EMs by 6.5% per annum (2011-15). At
the time of writing global economic forecasts were being scaled down in respect of calendar
2011; however, wide agreement existed that the world economy was not about to enter a
second down leg of the 2008/9 recession. Global inflation is on the rise, albeit that much
slack remains in the major AEs, making it easier to absorb the rise in food & energy prices; in
the EMs, with larger exposures to food & energy in their CPI indices, the inflation threat is
more urgent. The ECB already commenced with its normalisation of interest rate levels and
in the USA this is expected over the short term. The US dollar remains weak and is likely to
remain so in view of the US’s precarious fiscal position, which is only projected to unwind
slowly over the medium term. Provided relatively slow growth in the AEs, combined with a
bullish commodity outlook, international capital flows to commodity-based economies are
expected to remain lively. The risk here is a harder landing in EMs. Other global economic
risks, which have tended to intensify in recent months, include possible debt restructuring in
southern European sovereigns (e.g. Greece), fiscal policy-related events in AEs, and political
unrest in the MENA region, with its attendant implications for the international oil price.
In view of this global outlook, the domestic and regional economic outlooks are somewhat
uncertain. However, what seems to be clear is that the specific constellation of global
forces, dictate an economic environment where the rand exchange rate is likely to remain
relatively strong with no end in sight of potential volatility. This is negative for the tradable
goods sectors, whilst the tertiary sectors tend to benefit from lively domestic demand
conditions, stimulated by the positive income effects tied to a favourable terms of trade
(booming commodity prices) and low inflation and interest rates. Nonetheless, inflation is
projected to rise over the short term and the economy is about to enter the next up-cycle in
interest rates. It is somewhat worrying that the initial phase of the economic recovery is
dominated by the consumer, with business confidence and fixed investment expenditure
lagging and therefore employment creation. In the absence of more meaningful fixed
investment expenditure of the labour absorbing kind, the sustainability of the business cycle
upswing comes into question.
South Africa’s real GDP growth rate is projected to accelerate from 2.8% in 2010 (i.e. the first
calendar year of economic recovery, to around 3.5% in 2011 and 4-4.5% over the medium
term. In a different global economic climate and a less robust domestic fixed investment

108
prospect, this outlook does not compare well with the high growth achieved over the 2004-7
period (5.2% per annum); however, should be slightly above trend economic growth.
Inflation is projected to accelerate over the short term and possibly breach the upper range
of the inflation target towards the end of the year; however, is projected to remain inside
but close to the upper 6% range of the inflation target over the medium term. In the
absence of unexpected shocks, prime interest rates are projected to increase by 300 basis
points between the middle of 2011 and the end of 2013. The rand exchange rate is
projected to remain close to its purchasing power parity with the US dollar; however,
fluctuations around this trend are likely. The current account deficit on the balance of
payments is projected to increase from 2.8% in 2010 close to 6% in 2013/14, which need to
be financed by inward capital flows.
In the Western Cape, the tertiary sectors are again leading the economic recovery and
benefit from the macro-economic conditions (favourable terms of trade, strong currency,
low inflation and interest rates and a buoyant domestic market). However, during the first
half of 2011, the manufacturing sector’s recovery made more meaningful momentum and
there were signs that the adverse conditions in the building & construction sectors were
bottoming out.
Regarding the sectoral growth pattern over the 2000-9 period, including both the upswing and
downswing phases of the business cycle, the following trends are highlighted:
The Western Cape economy has out-performed the national economy, growing by 4.3% per
annum versus 3.6% per annum (2000-9); however, labour absorption in the region was
poorer compared to national. This state of affairs results from the following tendencies in
the regional economy: Firstly, the high-growth sectors in the province (e.g. finance &
insurance, construction, communication; furniture, other transport equipment, including
boat building) are poor labour absorbers; furniture, leather & footwear and the automotive
sectors grew strongly and actually shed jobs on balance over the 2000s. It follows that for
these sectors favourable economic conditions are required only to maintain their work
forces, if at all. Secondly, the leading employment creating sectors (e.g. the broad
community, social & personal services sector, the trade sector, electricity, mining, transport
& storage and tourism) exhibited relatively moderate growth rates (2-4% in real terms), i.e.
the employment creating sectors tend to be moderate to average growers. The business
services and ICT sectors are exceptions to this rule, showing both strong growth (5-8%
range) and meaningful job growth (2-5% per annum). Thirdly, a whole range of primary and

109
secondary industries shed jobs despite the relatively lively general economic conditions over
the biggest part of the 2000-9 period. This group is led by the job-shedding that occurred in
the agricultural and clothing & textile sectors; other sectors included here are non-metal
minerals, electronics, food & beverages, petro-chemicals (all exhibiting below-average
growth) and furniture, leather & footwear and automotive (exhibiting high growth). These
tendencies point to a higher degree of capital intensity in most of the region’s industries,
particularly in the primary and secondary sectors.
The outperformance of the Western Cape economy in terms of real GDPR growth is
explained by the strong contribution to growth made by the broad financial and business
services sector, growing by 6.5% per annum and creating jobs at a rate of 3.8% per annum
(with all the job growth accounted for by the business services subsector). This sector, as
well as the wholesale, retail, catering & accommodation sector (including tourism), remain
the mainstay of the regional economy; the trade sector grew by 4.2% per annum and
created jobs at a rate of 3.2% per annum. Transport, storage & communication also made a
significant contribution (3.9% per annum real GDPR growth and 1.7% per annum
employment growth) as did community, social & personal services (2.6% and 3.2%
respectively). The contribution by the manufacturing sector is also substantial (explaining
close to 10% of the cumulative growth in the province over the 2000s); however, this is
mainly due to its size as the growth was anaemic (2.3%) and jobs were shed at a rate of 1.5%
per annum.
From an employment perspective, the large job shedders were agriculture, forestry & fishing
(accounting for close to 50% of job losses in the province over the 2000s) and manufacturing
(accounting for 17% of the job losses). Within the manufacturing sector, clothing & textiles,
leather & footwear, furniture, electronics, and non-metal minerals were the leading job
shedders as noted above; the food & beverage subsector, automotive and petro-chemicals
also shed jobs on balance, however, only marginally so.
Regarding the industry outlook for the Western Cape economy (2010 to 2015), the following
tendencies can be highlighted:
A range of economic indicators is conclusive that the regional economic recovery was well-
established by the first quarter of 2011. Real GDPR growth is projected to continue
recovering, from an estimated 2.7% in 2010 to 3.9% in 2011 and between 4-4.5% over the
medium term, averaging 4% over the 2010-15 period. While the region’s outperformance of
110
the national economy is projected to continue, the margin of outperformance may decline
and the level of growth is likely to be well below that over the 2004-7 period. The province
is faced with a different global economic environment and its leading growth industry, i.e.
financial services, is unlikely to repeat its spectacular growth over the 2000s.
Considering the sectoral picture forecast over the 2010-15 period, three groups of industries
are identified, namely the high-growth sectors, the medium/ average growth sectors and the
low-growth sectors. It needs to be emphasised the sectors classified in this way include only
those for which real value added growth rates could be quantified; a number of smaller
industries growing rapidly off a low base have been identified by the DEDT as priority
sectors; however, growth projections for these could not be quantified and are discussed
qualitatively in the report (see below). Furthermore, the quantification of the growth
prospects was conducted for 26 industry groups, more or less at a 2-3 digit SIC level,
including an attempt to come closer to the DEDT’s working classification of industries – see
Appendix 5. This included the calculation of proxy sectors and growth rates (see Appendix
6).
The high-growth sectors, projected to grow between 4.4% and 8% per annum (2010-15),
include: communication (8%); finance & insurance (6%); ICT (5.5%); furniture (5.3%);
automotive (5.1%); other transport equipment (incl. boat building) (5.1%); construction
(5%); leather products & footwear (4.5%); and tourism (4.4%).
The medium/ average growth sectors, projected to grow by between 3% to 4.3% per annum,
include: metals & engineering (4.3%); electronics (4.2%); other manufacturing industries
(4.2%); petro-chemicals (4.1%); wholesale, retail, catering & accommodation (3.8%);
transport & storage (3.4%); business services (3.4%); other CSP services (3.2%); and
electricity (3.1%).
The low-growth sectors, i.e. subsectors projected to grow by less than 3% per annum are:
food & beverages (2.8%); agriculture, forestry & fishing (2.3%); government (2.1%); clothing
& textiles (1.9%); medical & health services (1.3%); wood, paper, printing & publishing (1%);
non-metal minerals (0.9%); and mining (-0.7%).
In terms of projected employment growth, the fastest growing sectors, with employment
expanding at rates between 2.5% and 3.5% are: automotive (3.1% per annum, 2010-15);
business services (excl. ICT) (2.8%); tourism (2.7%) and wholesale, retail, catering &

111
accommodation (2.5%). Following these sectors are the average-growing sectors in terms of
employment, namely ICT (1.8%): other manufacturing industries (1.6%); government (1.4%);
medical & health services (1.3%); agriculture (1.3%); metals & engineering (1%); other
transport equipment (incl. boat building) (0.8%); electronics (0.8%) and other CSP services
(0.8%). Marginal job growth is projected in the case of communications; wood, paper,
printing & publishing; finance & insurance, furniture, food & beverages and petro-chemicals
and zero growth in the case of construction. The work forces in these latter-mentioned
subsectors are essentially projected to remain stable. Subsectors projected to marginally
shed jobs over the medium term include: electricity & water supply, non-metal minerals,
transport & storage, mining and leather products & footwear. In the clothing & textiles
sector job shedding is projected at a rate of 2% per annum. As noted in the report, key
policy intervention initiatives may prove these projections, informed by the historical trends
and relationships, overly pessimistic.
Regarding exports, the projected real growth (5.2% per annum, 2010-15), is likely to below
that achieved over the 1995-2009 period (5.9% per annum) and particularly over the 2000-7
period (6.8% per annum). Demand conditions abroad, particularly in the AE’s, are projected
to be less robust compared to the 2000s. Furthermore, the domestic macro-economic
environment (read: buoyant domestic market and a strong rand exchange rate) shaping up
again may dictate against strong export growth. While the agriculture and food (and
beverages) processing sectors are likely to remain the mainstay of regional exports, in terms
of projected growth rates, leading the pack are automotive (10.3% per annum, 2010-15);
communications (9.5%); metals & engineering (8.6%); agriculture (8.1%); electronics (7.8%)
and business services (including BPO) (7.4%).
Finally, not appearing in these growth statistics, are the stellar performances of a number of
small industries, growing off a small base, but with huge potential (as discussed in the
report). Included here are the aquaculture industry, the (upstream) oil & gas subsector;
boat building; crafts and call centres/ BPO. Other sectors, which have been identified by
DEDT but not discussed in this report, include arts & culture and film making. Whilst small,
these industries all make an important contribution to the growth and development of the
Western Cape economy.
Regarding the analysis of the inter-industry linkages, the following conclusions are highlighted:
112
Regarding backward and forward linkages, the analysis revealed somewhat mixed results:
the relatively long list of generally independent manufacturing industries (with one or two
services sectors, e.g. other CSP services, catering & accommodation and communication)
contrasts with an equally long list of strong backwardly linked manufacturing industries,
some with strong forward links (e.g. beverages and petroleum products) and a list of
services industries with strong forward linkages (e.g. business services, finance & insurance,
wholesale & retail, transport & storage and government). Agriculture, forestry & fishing also
reveal strong forward linkages. Only the food, automotive and medical & health services
sectors reveal both strong backward and forward linkages.
Regarding the value-added and employment economy-wide multipliers, the analysis has
shown a long list of mainly manufacturing industries, which are relatively unresponsive in
terms of value-added and employment; the exceptions are food and plastic products in
terms value-added multipliers and furniture, clothing, leather products and textiles in terms
of employment multipliers. The whole range of services industries exhibit above average
value-added multipliers; however, some combined with weak employment responsiveness
(e.g. finance & insurance, medical & health services, business services, transport & storage
and communication) and a few with above average employment responsiveness (e.g. other
CSP services, government, wholesale & retail and catering & accommodation)
In all, the structural trend over the past decade in the Western Cape, namely a rising contribution by
the tertiary sectors of the regional economy, is expected to continue. The province has a revealed
comparative advantage in a number of these sectors (e.g. finance & insurance, business services,
wholesale & retail and tourism) and the macro-economic environment is expected to benefit these
sectors. For the most part these services sectors are dependent on inter-industry sales, have strong
links with the household sector and other provinces.
In addition to the favourable prospects in the tertiary industries, the outlook for agriculture, forestry
& fishing and the food processing cluster appears promising from a price perspective and global food
shortages, with new opportunities opening up in South Africa’s trade with developing countries
(such as China and India). The food value chain is a well-connected industry, albeit that the
agriculture sector has disappointed from a growth and employment perspective.
Finally, while manufacturing prospects remain sub-par, there appears to be serious intent, both from
national and provincial government, to arrest the under-performance of a number of industries. The
analysis has shown some mixed results in respect of the regional manufacturing sector inter-industry

113
linkages, with a (somewhat surprisingly long) list of generally independent industries and industries
exhibiting below average value-added and employment multipliers, which tend to disqualify these
industries from receiving policy support. However, it should be emphasised that the current analysis
is of a cursory nature and aims to complement the existing MEDS research and any further research
required. There is also a relatively long list of strong backwardly linked secondary industries and
industries with above-average employment multipliers, which require the attention of the policy
authorities.
Pieter Laubscher
Independent Economist
29 June 2011

114
References
1. AISA (September 2009): Aquaculture Benchmarking Survey
2. BER (April 2011): Economic Prospects, 2nd Quarter 2011, http://www.ber.ac.za
3. BER (April 2011b): Preliminary Forecast Results, http://www.ber.ac.za
4. BER (January 2011): Economic Prospects, 1st Quarter 2011, http://www.ber.ac.za
5. Black, PA & Kloppers, JP (March 2011): Western Cape Tooling Sector Intelligence Report.
Provincial Government of the Western Cape (PGWC): Department of Economic Development
& Tourism (DEDT)
6. Black, PA & Parker, C (2010): Micro-economic Development Strategy (MEDS) – Statistical
Baseline Study, Corporation for Economic Research (CER).
7. BOE Private Clients (April 2011): Western Cape Barometer (April 2011). Online
http://www.fin24.com/Barometer
8. Bureau for Food and Agricultural Policy (BFAP) (2010): The South African Agricultural
Baseline. Universities of Pretoria and Stellenbosch.
9. CallingtheCape (2007/8): Contact Centres and Business Process Outsourcing: Key Indicator
Report.
10. Cape IT Initiative: (March 2011): Cape ICT Sector: Economic Indicator Survey. Draft report.
11. Cape Town Routes Unlimited (CTRU) (2011): Western Cape Tourism Barometer: Your
Provincial Tourism Intelligence Source. Volume 5, Issue 1, October – December 2010. Online
http://www.tourismcapetown.co.za
12. Coote, E & Coetzee, K (2006): The Scope of the Electronics Industry in the Western Cape.
Access Market International (Pty) Ltd, South Africa. Online http://www.capegateway.gov.za
13. CTBi (March 2011): Annual Boatbuilding Sector Intelligence Report.
14. CTBi (September 2008): The Western Cape Boatbuilding Industry: Market Survey.
15. Department of Agriculture (March 2010): Strategic Plan for the fiscal years 2010/11-
2014/15. Online http://www.capegateway.gov.za

115
16. IMF (April 2011): World Economic Outlook. Online http://www.imf.org.com
17. IMF (January 2011): World Economic Outlook Update. Online http://www.imf.org.com
18. Kaiser Associates (June 2006): Microeconomic Development Strategy: Food sector study,
Department of Economic Development & Tourism, Provincial Government Western Cape.
19. Kaiser Associates (March 2011): Furniture Industry Market Development Programme,
Western Cape Furniture Initiative.
20. Kaplan, D (ed.) (2008): Micro-Economic Development Strategy for the Western Cape (MEDS) -
Synthesis Report. Online http://www.capegateway.gov.za/eng/pubs/reports_research/m
21. Miller, RE & Blair, PD (2009): Input-Output Analysis: Foundations and Extensions. Cambridge
University Press, 2nd Edition.
22. Pan African Research & Investment Services (March 2010): A Framework/Model to
Benchmark Tourism GDP in South Africa What is the role of tourism in the economy and what
drives tourism in South Africa. Online http://www.sat.org.za
23. Provincial Government of the Western Cape (2010): Provincial Economic Review & Outlook
(PERO). Online http://www.capegateway.gov.za
24. Provincial Government of the Western Cape (PGWC) (March 2001): White Paper on
Sustainable Tourism Development and Promotion in the Western Cape.
25. Provincial Government of the Western Cape (PGWC): Department of Economic Development
& Tourism DEDT) (March 2011): Western Cape ICT Sector Intelligence Report.
26. Shalala, E (April 2011): Western Cape Aquaculture Development Initiative (WCADI): Sector
Indicator report.
27. South African Oil & Gas Alliance (SAOGA) (March 2011): Upstream Oil & Gas Sector
Intelligence Report.
28. South African Tourism (SAT) (2011): Annual Report 2010/11. Online http://www.sat.org.za
29. South African Tourism (SAT) (2011): South African Tourism Index: July to September 2010.
Online http://www.sat.org.za

116
30. Statistics South Africa (StatsSA) (2011): Final Supply and Use Table 2005. Report No. 04-04-
01 (2005). Online http://www.stattsa.org.za
31. Statistics South Africa (StatsSA) (2011): Supply and Use Table 2009. Online
http://www.stattsa.org.za
32. Statistics South Africa (StatsSA) (2011): Tourism Satellite Account for South Africa: Final 2005
and provisional 2006 to 2008. Report No. 04-05-07 (2010). Online http://www.stattsa.org.za
33. Statistics South Africa (StatsSA) (2011): Tourism, 2010. Report No. 03-51-02 (2010). Online
http://www.stattsa.org.za
34. Statistics South Africa (StatsSA) (July 2010): Domestic Tourism Survey 2009. Statistical
Release P0352.1. Online http://www.stattsa.org.za
35. Troskie, D (March 2010a): The Agricultural Economy of the Western Cape in Context.
Unpublished paper. Department of Agriculture, Provincial Government of the Western Cape.
36. Troskie, D (March 2010b): Agriculture’s Place in Society: Some Issues and Considerations
relevant to Provincial Interventions. Unpublished paper. Department of Agriculture,
Provincial Government of the Western Cape.
37. Wesgro (2010): BPO Sector Brief. Online http://www.wesgro.co.za
38. Winde, A (March 2011): Budget Speech, Provincial Government Western Cape: Provincial
Treasury. Online http://www.capegateway.gov.za
39. Wolpe Strategic Economic Consultants (March 2011): Western Cape Clothing Sector
Intelligence Report. Provincial Government of the Western Cape (PGWC): Department of
Economic Development & Tourism (DEDT).
40. Wolpe Strategic Economic Consultants: (March 2011): Western Cape Furniture Sector
Intelligence Report. Provincial Government of the Western Cape (PGWC): Department of
Economic Development & Tourism (DEDT).

117
Appendix 1: The BER macro-economic model
The broad structure of BER's model can be described as that of a demand-orientated
macro-econometric model. Although the model essentially determines South Africa's gross domestic
product (GDP) from the demand side (i.e. GDP is determined as the sum of final consumption
expenditure by households, final consumption expenditure by general government, gross fixed
capital formation, inventory investment and exports of goods and services, less imports of goods and
services), specific supply elements in the form of a measure of potential output and economy-wide
capacity utilisation have been included in an attempt to capture the production side of the economy.
Capacity utilisation, which is measured as the inverse of the gap between actual and potential
output, enters the equations for imports and prices as a variable supply constraint.
The BER's model of the South African economy contains 135 equations, of which 30 are
econometrically estimated equations and 105 are identities and transformations. The latest version
of the E-views econometric package, E-Views 5, was employed to estimate the equations and to
compile the model. Co-integration techniques were used to estimate the majority of the behavioural
equations in the BER's model. These techniques, which are currently used by, inter alia, the SA
Reserve Bank, the SA National Treasury and the Bank of England to construct macro-econometric
models, have several advantages compared to the standard techniques such as Ordinary Least
Squares (OLS). The most important advantages are that they provide an answer to the so-called
spurious correlation problem and provide for specification of both the long run theory-based
relationships between the variables as well as the short-run dynamic relationships.
Appendix 2: The Quantec RSA Inter-Industry model
In order to generate supply-side projections, the BER relies on the input-output analysis
conducted by Quantec Research. Quantec utilizes an input-output based inter-industry model of the
South African economy consisting of 43 industries that can be incorporated recursively into the
BER’s macro-economic forecasting model. This equation block, a scaled down version of a fully-
fledged industry model, utilizes the final demand forecast from the BER’s macro-economic forecast
to estimate economic activity in the various industries to satisfy a specific macro-economic outcome.
Behavioural equations in this model are estimated as functions of sector-specific variables.
The model is dynamic, with changing I-O coefficients and with investment dependent upon the rate
of output growth. The model forecast a specific sequence of future years, not equilibrium at some
future point without specifying the path to the equilibrium. The causation in this specific industry
block (as modified for this project) runs from the macroeconomic demand totals (as derived from

118
the BER macroeconomic model simulations) to the industry detail. The central input-output
identities provide structural consistency to the model.
Data for final demand originates from the BER macroeconomic model and are evaluated
and production, income and labour requirements are calculated for 43 producing sectors.
Government purchases are exogenous (8 functions); other components of final demand are
determined by behavioural equations in the BER macro-economic model. Personal consumption
equations have been estimated for 22 categories of expenditures, using relative prices, real income,
and demographic variables. Machinery and equipment and transport equipment and investment
equations have been estimated for 5 asset types and depend upon changes in outputs and changes
in the relative prices of capital and labour. The EASyData International Trade Database contributes
product-specific explanatory variables for foreign trade. Exports by product are a function of foreign
demands for imports and relative prices, which incorporate exchange rate movements. Imports by
product are a function of product-specific domestic demand and relative foreign to domestic prices.
The solution of the I-O equation, q = Aq + f yields the solution for output by industry.
The output and other supply-side outcomes of the forecast are also back cast and modelled on
the actual data for these variables by industry. These industry level equations are then utilised
to adjust the supply-side outcomes for technological and other change over time.
Although there is no feedback from the industry block to the macro-economic model, the
industry block on its own is semi-dynamic, i.e. the input-output coefficients will change over time.
The industry block is able to estimate real economic activity and employment by industry; the model
output results include: intermediate or inter-industry purchase/inputs; employment by skill level
(highly skilled, skilled, semi- and unskilled); labour remuneration; value added (GDP); gross operating
surplus; net operating surplus; depreciation charges by asset type (building & construction works,
machinery & equipment, transport equipment); gross domestic fixed investment by asset type
(building & construction works, machinery & equipment, transport equipment); and capital stock by
asset type (building & construction works, machinery & equipment, transport equipment).
The industry classification follows the 28 manufacturing industries (3-digit SIC scheme)
reported by Statistics South Africa (SSA) in its monthly sales, production, price and employment
releases and a 2-digit scheme for the 17 non-manufacturing industries. Historical data are available
since 1970 at the national level for estimation purposes. The forecasting horizon is typically 5-years
although forecasting up to 15-years is possible.

119
The industry model’s primary data source is the EasyData Standardised Industry databases.
Subsidiary data sources will include the SARB Quarterly Bulletin database (national accounts, balance
of payments and public sector), Statistics South Africa time-series and industry indicators (industry
value added, input-output tables, detailed industry remuneration and gross operating surplus, price
and output, gross domestic fixed investment, employment); South African Revenue Service
(international trade data, etc.); National Treasury (government expenditures/revenue); Department
of Labour (manpower surveys); Quantec Research (calculated depreciation, capital stock and
inventory investment, estimated input-output tables) and the EasyData International Trade
Database.
Appendix 3: The Quantec Western Cape Input-Output model
A regional input-output table provides a systematic base from which to understand the
linkages between economic activities to assist in strategic planning and resource distribution and to
assess the economic value of different projects and initiatives for a region. Also, regional input-
output tables provide users with the ability to undertake regional economic impact assessments of
capital formation and policy changes. Regional input-output tables can also be used to investigate
the impact of new or existing economic activities on the local economy.
To summarise, a regional input-output model is a powerful tool that can be used for a wide
range of economic analyses including:
the identification and measurement of the composition and level of economic activity in a region
the understanding of the inter-relationships between industries in a region and the rest of the
economy
the studying of the effects of changes in supply and demand on a region and the rest of the
economy
the analyses of the flow of goods and services between industries and final users in the regions
providing the basis for the calculation and measurement of Gross Value Added (GVA) by industry.
Regional input-output tables are frequently used to undertake impact analysis which can
be performed for new developments or existing operations. Regional input-output tables provide
important source data for assessing the effect of economic activity and development. Normally the
impacts are calculated from Type I and Type II multipliers derived from regional input-output tables.
Type I multipliers (direct and indirect) measures the cumulative effect of a change in final demand
for a particular output in a modelled input-output representation of the economy, with households'
income and expenditure treated as being exogenous to the model (determined independently of the

120
model). Type II multipliers (economy-wide) measures the cumulative effect of a change in final
demand for a particular output in a modelled input-output representation of the economy, with
households' income and expenditure treated as being endogenous within the model (determined
within the model).
Within South Africa, no official regional input-output tables are compiled. Quantec Research uses
non-survey-based methods for regional input-output table development that rely on the national
level input-output tables published by Statistics South Africa (SSA). It is unlikely that any official
regional input-output tables will be developed in the foreseeable future. The key methodological
issue facing any private developer is the limited data availability on specifically inter-regional trade
flows to construct regional input-output tables. Currently the non-trade flow data sources for
regional input-output development in South Africa include:
SSA labour, financial and production (industry level) data that includes regional information
SSA financial and non-financial data on municipalities and provinces
SSA financial data on general government
SSA household income and expenditure surveys
SSA population censuses and community surveys
SARS international trade data by origin and destination
Quantec Research standardised regional indicator database
This report applies a methodology based on a variation of the simple location quotient technique
that allows interregional input-output tables to be derived, one for each region, that is: the Western
Cape and the rest of South Africa. Location quotients and open and closed multipliers are calculated
for 41 production activities (industries).
Regionalising coefficients. In the literature there are a number of methodologies for estimating
regional coefficients. One such method, which is well suited to accommodate the data set used in
this study, will be described below. Following Millar & Blair (2009: 72), the following can be
distinguished
National input coefficients ( S
ija ), available from the national input-output (I-O) table
Regional input coefficients ( R
ija ), consisting of a combination of local and regionally imported
supply
Regional technical coefficients ( RR
ija ), locally supplied portion is reflected in these coefficients

121
The process of arriving at the regional technical coefficients ( RR
ija ) using the national input
coefficients ( S
ija ) can be broken up into two steps:
i. Determining regional input coefficients ( R
ija ), from national input coefficients ( S
ija )
The following relationship is used:
R R S
ij ij ija a
(1)
Where R
ij factor larger than zero, representing regional differences in production structure.
ii. Finding a factor R
ij
This factor is non-negative but smaller than unity, so that
RR R R
ij ij ija a (2)
Substitution of equation (1) into equation (2) shows that the relationship between the
national coefficient and the regional technical coefficient is as follows:
RR R R S R S
ij ij ij ij ij ija a a (3)
According to Millar & Blair (2009: 74) a number of methodologies are available to find values
for the factor R
ij. The simple location quotient method, which argues that if the relative
position of a sector in a region (in terms of value added, employment or gross value of
production) is larger than the position of that sector in national economy, the relevant
sector will be able to supply all of its local demand (intermediate as well as final demand). If
the relative position is smaller in the region compared to the nation as a whole, the relevant
sector is assumed to import part of the local demand for its products in relation to the
regional sector’s relative position as captured by the location quotient.
R RR ii S S
i
X XLQ
X X (4)
Where
R
iX = net value of production of sector i in region R
S
iX = net value of production of the same sector at the national level
RX = total sectoral value added in region R
SX = the economy-wide sectoral value added
Regional technical coefficients ( RR
ija ) can now be determined as follows:

122
(5)
As pointed out by Millar & Blair (2009:74), the if-statement introduces an asymmetry in the process
of adjusting the regional input coefficient. If the sector i is underrepresented in the region, the
location quotient R
iLQ will be smaller than unity. This reflects an import orientation which drives
the adjustment made to the regional input coefficient. However, if the sector is better represented
in the region compared to the nation as a whole, the regional input coefficient is not adjusted and
will coincide with the regional technical coefficient, RR
ija .
Generating regional input-output tables. Diagram 2.1 below provides a summarised
methodology to produce regional input-output tables for South Africa. These tables can be produced
for any region in South Africa, including the nine provinces, metropolitan councils and district
municipalities. Quantec maintains a comprehensive collection of derived electronic regional socio-
economic databases based on Statistics South Africa (SSA) and Reserve Bank (SARB) primary
statistics. These databases facilitates the generation of structured and systematic regional input-
output tables greatly. The methodology consists of three phases, namely:
Updating national South African table to the latest year for which national accounting data is
available
Regionalisation of the national table into a two region table consisting of the primary region and
the rest of South Africa as represented in Table 2.1
Generating the final four quadrant regional table as in Table 2.1 and calculating the direct and
inverse coefficient matrices, multipliers and other economic indicators
In more detail the three phases can be described as follows:
Phase 1: Update the national table
The national table is updated for volume and price changes. This requires the combination of data
from several sources. Particular attention is paid to updating the primary input and final demand
categories. For example, international trade data from the South African Revenue Service (SARS)
harmonised international trade database is used to update international imports and exports.
Similarly, primary input and final demand figures are aligned to figures released by the SARB. Value
added data by industry is obtained from SSA. Once the table has been updated the table are
balanced using the RAS bi-proportional balancing technique.
if 1
if 1
R R R
i ij iRR
ij R R
ij i
LQ a LQa
a LQ

123
Phase 2: Regionalisation of the national table
In this phase, the updated national table is regionalised in the following fashion:
The updated national table is converted into technical coefficient format. This assumes that the
national and regional technologies applied in production are the same.
Non-competitive imports are calculated. If production in industry i doesn’t occur in the region,
then any inputs from industry i into industry j are treated as regional imports. Thus, the technical
coefficient in the relevant industry row is set to zero in the regional table, and the difference is
added to the regional import coefficient.
Competitive imports calculation. This requires estimation of the degree of self-sufficiency in each
regional industry. This is undertaken by using simple and cross industry location quotients. If local
supply is unable to satisfy local demand in an industry (that is the LQ < 1) then imports are
assumed to be required. This is modelled by multiplying technical coefficients in the relevant
industry row by the corresponding location quotient, and apportioning the difference to the
regional import coefficient. If local supply is able to satisfy local demand in an industry (that is the
LQ >= 1) then the regional technical coefficient is set equal to its national equivalent. Note that
regional technical coefficients never exceed their national counterparts.
Industry aggregation. This requires converting the regional technical coefficients back to
transaction values (using regional output estimates derived by multiplying national output figures
by ratios of regional to national value added). Once expressed in transaction values industries
may be aggregated as desired. Tables used for multiplier calculation are generally kept as
disaggregated as possible to avoid “aggregation bias” from affecting multiplier estimates.
Table balancing. The tables are balanced using inter-regional exports based on a “supply-demand
pool” approach. This is a commodity balancing approach commonly used in input-output table
construction. Balancing is however not required if the table is being produced purely for the
generation of multipliers.
Insert superior data and knowledge. This can be undertaken at almost any point in the above
process. For example, if the developer believes that a mechanically produced LQ is not reflective
of the degree of self-sufficiency in an industry, say, because of productivity differences, then
adjustments could be made. Similarly, if survey data is available then this could be included.
Phase 3: Transactions table, inverse table, multipliers and indicators In this phase, a regional transactions matrix with all four quadrants (see table 2.1) is developed,
Leontief inverse matrices calculated and multipliers generated. Type I and II multipliers are
developed for output, income, value added, imports and employment. Other aggregate economic

124
indicators can also be produced, namely gross value added, balance of trade, labour and capital
productivity and so on.
Diagram 2.1: Summary of the modified process of generating the regional input -output tables
National input-output (IO) transactions table
Estimate by industry:
$ Output and gross value added (GVA)$ Household consumption$ Government consumption $ Capital formation and change in inventories
$ International trade
Using SSA and SARB data: PPI; CPI;
Employment and earnings survey; Household income and expenditure survey; National accounts on GVASARS international trade data
Convert national table into coefficient form with the national and regional technology coefficients (TC)
assumed the same.
Non-competitive imports. If production of an industry doesn’t occur in a region, coefficients in the
regional table are added to interregional imports in the national table and set to zero in the regional
If 0 < LQ < 1 If LQ = 1 If LQ > 1
Regional technological coefficient
(TC) = LQ x national TC
Difference between national and regional TC’s added to import coefficient
TC unaltered Regional TC = National TC
Competitive imports. If production occurs in a region then regional self sufficiency is calculated using
simple location quotients (LQ)
LQ adjusted where other data better reflects the true situation
By industry, coefficients are multiplied across the row by simple LQs
Tables are aggregated to produce reduced coefficients matrix for
calculation of multipliersRegional coefficients matrix inspected in light of superior data
Addition of superior data, if
Regional table produced with all four quadrants
Unbalanced table balanced using inter- regional imports and exports
If required, further adjustments or
aggregations made to the tableRequired inverses and multipliers produced
Phase 1: Update the national table
Phase 2: Regionalisation of the national table
Phase 3: Transactions table, inverses, multipliers and indicators

125
Table 27: Schematic layout of a two region input-output table
Table classification. The industry-by-industry regional tables used for this study (see Table 27) are
produced at the following sector aggregations:
2 regions, one for the Western Cape and one for the rest of South Africa
41 industries
final demand by 41 industries for household consumption expenditure, government consumption
expenditure, capital formation, changes in inventories and exports
value added by 41 industries consisting of labour remuneration, net operating surplus,
consumption of capital, indirect taxes on goods and services and subsidies on goods and services
imports by 41 industries and final demand component
More detail regarding the structure of a two-region interregional input-output model are provided in
Millar & Blair (2009: 77-80), as well as more detail on the interregional feedbacks in the two-region
model (2009: 80-82). However, as the current study focuses on the intra-regional linkages, this
technical detail is not discussed here, except to point out the distinction between intra-regional,
inter-regional and national multipliers.
Output Intermediates Final demand Total output
Input Region Rest of RSA Region Rest of RSA
Inte
rme
dia
tes Region
Intraregional intermediates
( )
Interregional exports of intermediates
( )
Locally supplied final demand
( )
Interregional exports of final demand
( )
Output of region
( )
Rest of RSA
Interregional imports of intermediates
( )
Intraregional intermediates
( )
Interregional imports of final demand
( )
Locally supplied final demand
( )
Output of rest of RSA
( )
Val
ue
ad
de
d
Region
GVA; net indirect taxes; international import
( )
Net indirect taxes; international import
GVA; net indirect taxes; international import in region
Rest of RSA
GVA; net indirect taxes; international import
( )
Net indirect taxes; international import
GVA; net indirect taxes; international import in the rest of RSA
Total input Input of region
( )
Input of rest of RSA
( )
Final demand of region
Final demand of rest of RSA

126
Type I output multipliers show how much the intraregional-wide, regional-wide or country-wide
output have to increase to meet a R1 increase in final demand for the output of sector j in regions R
(Western Cape) or N (rest of South Africa) respectively. However, in the calculation of Type I output
multipliers the matrix elements are restricted to those in the transactions matrix of the two-region
interregional inter-industry table. This effectively excludes the impact of changes in household
income and final demand arising from the positive impact of additional economic activity on
employment, since household income and consumption is outside of the transactions matrix.
Type II multipliers address this issue by expanding the transactions matrix to include household
consumption and compensation of employees. Households are effectively treated as another
production industry in Type II multiplier analysis, producing labour services and demanding
consumption goods and services. For the analysis in this report household disposable income were
calculated as the sum of:
compensation of employees or earned earnings (from the input-output tables)
self-employed earnings (derived from SSA’s Income and Expenditure Survey)
unearned earnings or return on investment earnings (derived from SSA’s Income and
Expenditure Survey)
subtracting tax from that sum using a personal income tax rate derived from the SARS personal
tax rates
The Type II output multipliers are calculated exactly as in the case of Type I multipliers except for the
expansion of the matrices to include an additional industry representing household’s disposable
income (sale of labour and unearned income after provision for personal tax) and consumption
expenditure.
Other regional multipliers. Type I and II multipliers for other variables such as household
income, gross value added (GVA), imports, employment and capital required can also be
calculated. In principle these are calculated in the same way as for output multipliers. The
distinction is that changes in industry output arising from a R1 change in final demand are scaled
(weighted) by each industry’s variable under consideration, such as the GVA input coefficient, or any
other of the previously mentioned variables. The GVA input coefficients are calculated using the GVA
row of the input-output table and dividing each industry GVA by the same industries input and using
this as the scaling weight.

127
Concluding remarks. Input-output models and their associated multipliers can be useful for
purposes of sectoral analysis since the structure of the domestic economy can be determined on a
very disaggregated sectoral level. The fundamental purpose of an input-output analysis is to analyse
the interdependence of industries in an economy so that economic impact studies for specific
projects can be conducted. The advantage of an input-output analysis is that a distinction can be
made between the different impacts such as the initial, first round, indirect and ultimately, the
induced effects, on various magnitudes and sectors.
Appendix 4: Sector classification in the Western Cape model – 41 sectors
L01 Agriculture, forestry & fishing
L02 Mining
L03 Food
L04 Beverages & Tobacco
L05 Textiles
L06 Wearing apparel
L07 Leather & leather products
L08 Footwear
L09 Wood & wood products
L10 Paper & paper products
L11 Printing, publishing & recorded media
L12 Coke & refined petroleum products
L13 Basic chemicals
L14 Other chemicals & man-made fibers
L15 Rubber products
L16 Plastic products
L17 Glass & glass products
L18 Non-metallic minerals
L19 Basic iron & steel
L20 Basic non-ferrous metals
L21 Metal products excluding machinery
L22 Machinery & equipment
L23 Electrical machinery
L24 Television, radio & communication equipment
L25 Professional & scientific equipment

128
L26 Motor vehicles, parts & accessories
L27 Other transport equipment
L28 Furniture
L29 Other industries
L30 Electricity, gas & steam
L31 Water supply
L32 Construction
L33 Wholesale & retail trade
L34 Catering & accommodation services
L35 Transport & storage
L36 Communication
L37 Finance & insurance
L38 Business services
L39 Medical, dental & other health & veterinary services
L40 Other community, social & personal services
L41 Government
Appendix 5: Suggested classification for forecasts: SIC & DEDT sector definitions reconciled
Primary sector Comments 1 Agriculture, forestry & fishing Use aggregate sector as proxy
2 Mining & quarrying Small sector in WC (0.3% of 2009 GDPR) - aggregate is fine; excluded are oil & gas exploration
Secondary sector
3 Food & beverages – agric processing WC priority sector – while not 100% agriculture processing, projection can be used as proxy; in future cluster can be defined including agriculture & fishing - food value chain
4 Clothing & textiles WC priority sector – SIC 311-4; leather products & footwear are excluded here (SIC 315-7)
5 Leather products & footwear Leather products mainly car seats & hides for export; footwear industry has ‘disappeared’
6 Wood, paper, printing & publishing Not WC priority sector, except ‘crafts’ which cannot be isolated here
7 Petroleum products, chemicals, rubber & plastic Not WC priority sector, except oil & gas**; aggregate sector is fine as proxy
8 Glass & products and other non-metallic minerals Not WC priority sector; aggregate sector is fine
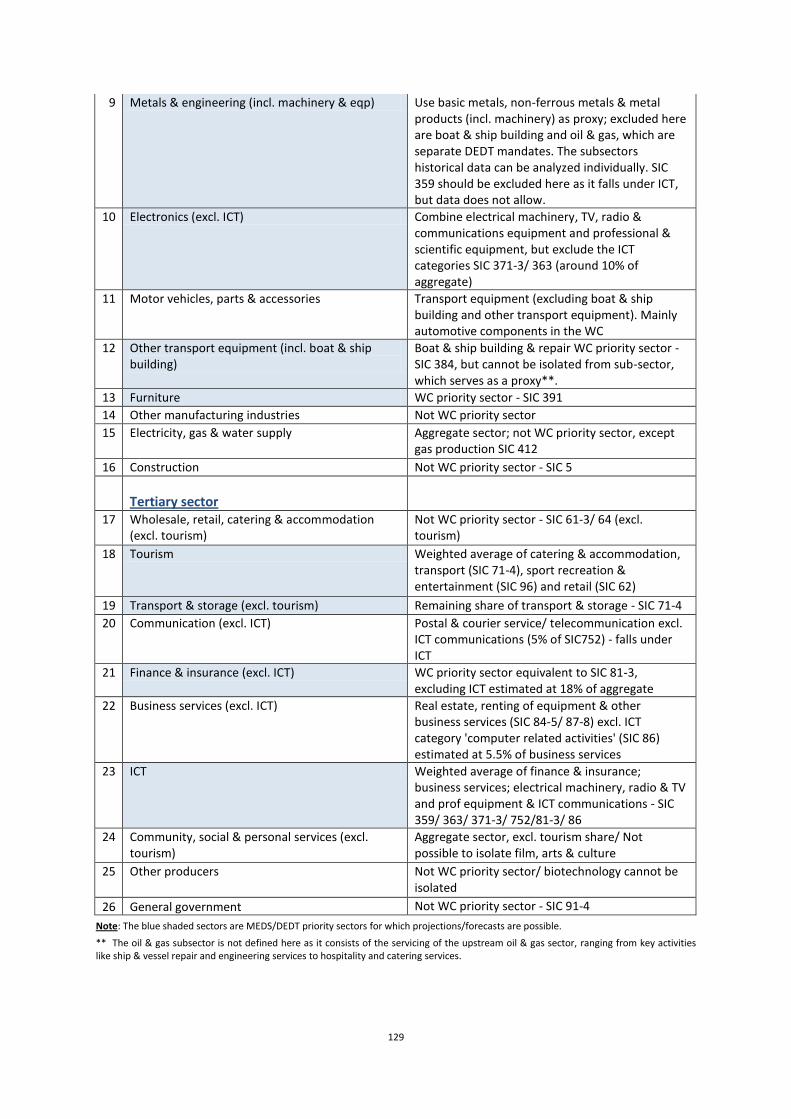
129
9 Metals & engineering (incl. machinery & eqp) Use basic metals, non-ferrous metals & metal products (incl. machinery) as proxy; excluded here are boat & ship building and oil & gas, which are separate DEDT mandates. The subsectors historical data can be analyzed individually. SIC 359 should be excluded here as it falls under ICT, but data does not allow.
10 Electronics (excl. ICT) Combine electrical machinery, TV, radio & communications equipment and professional & scientific equipment, but exclude the ICT categories SIC 371-3/ 363 (around 10% of aggregate)
11 Motor vehicles, parts & accessories Transport equipment (excluding boat & ship building and other transport equipment). Mainly automotive components in the WC
12 Other transport equipment (incl. boat & ship building)
Boat & ship building & repair WC priority sector - SIC 384, but cannot be isolated from sub-sector, which serves as a proxy**.
13 Furniture WC priority sector - SIC 391
14 Other manufacturing industries Not WC priority sector
15 Electricity, gas & water supply Aggregate sector; not WC priority sector, except gas production SIC 412
16 Construction Not WC priority sector - SIC 5
Tertiary sector
17 Wholesale, retail, catering & accommodation (excl. tourism)
Not WC priority sector - SIC 61-3/ 64 (excl. tourism)
18 Tourism Weighted average of catering & accommodation, transport (SIC 71-4), sport recreation & entertainment (SIC 96) and retail (SIC 62)
19 Transport & storage (excl. tourism) Remaining share of transport & storage - SIC 71-4
20 Communication (excl. ICT) Postal & courier service/ telecommunication excl. ICT communications (5% of SIC752) - falls under ICT
21 Finance & insurance (excl. ICT) WC priority sector equivalent to SIC 81-3, excluding ICT estimated at 18% of aggregate
22 Business services (excl. ICT) Real estate, renting of equipment & other business services (SIC 84-5/ 87-8) excl. ICT category 'computer related activities' (SIC 86) estimated at 5.5% of business services
23 ICT Weighted average of finance & insurance; business services; electrical machinery, radio & TV and prof equipment & ICT communications - SIC 359/ 363/ 371-3/ 752/81-3/ 86
24 Community, social & personal services (excl. tourism)
Aggregate sector, excl. tourism share/ Not possible to isolate film, arts & culture
25 Other producers Not WC priority sector/ biotechnology cannot be isolated
26 General government Not WC priority sector - SIC 91-4
Note: The blue shaded sectors are MEDS/DEDT priority sectors for which projections/forecasts are possible.
** The oil & gas subsector is not defined here as it consists of the servicing of the upstream oil & gas sector, ranging from key activities like ship & vessel repair and engineering services to hospitality and catering services.

130
Appendix 6: Calculating weighted proxies
Due to the particular method applied in the standard industrial classification of industries (SIC) it so
happens that for some industries, spanning a whole range of subsectors, the standard industrial
classification does not make provision for. Good examples of such ‘clusters’ of industrial activity are
oil & gas, for instance, and tourism, ICT and electronics, are all sectors that have been identified by
the DEDT as priority sectors in the Western Cape. As the SIC does not provide for these sectors, a
second best option was to calculate ‘weighted proxies’ of these sectors’ real value add across the
subsectors they each are composed of. In this study, such proxies were calculated for three DEDT
priority sectors, namely electronics, tourism and ICT. Of these three, the calculations for the tourism
sector are on a solid footing given the availability of research by StatsSA (Tourism Satellite Account,
November 2010 – TSA; and Domestic Tourism Survey 2009 – DTS). StatsSA’s Supply & Use Table
(SUT) for calendar 2009 was also used to derive weights in the case of tourism and ICT. However, no
research could be accessed to do the same for the electronics industry, the problem being to
exclude ICT from the former. The method for calculating the proxies is outlined below for these
three sectors.
Electronics. A simple assumption was made that 10% of the combined electrical machinery; radio,
TV and communication equipment and professional & scientific equipment industries comprise ICT;
the balance of this combined sector is defined as electronics. The yardstick for the estimated size is
GDPR at constant 2005 prices. The basis for this assumption was that the balance of the combined
electrical machinery; radio, TV and communication equipment and professional & scientific
equipment industries, i.e. 90% more or less agreed with the estimated real value add and
employment numbers in the industry. The 10% ICT share also agrees in the case of the ICT weighted
proxy, i.e. the real value add and employment numbers.
Tourism. The TSA outlines the flow of tourism expenditure through the SA economy and shows
that the tourism sector spans firstly, tourism characteristic products, i.e. the accommodation and
catering services; passenger transport services (including car rental and travel agencies); and sport,
cultural and recreational services; secondly, tourism related products, i.e. various categories of retail
goods ranging from food & beverages to clothing & footwear, pharmaceutical products, appliances
and petrol; and, finally, non-specific products, including a range of goods and services classified
under retail and elsewhere. Table 28 shows the tourism expenditure in SA (demand), the domestic
supply and what is defined as the ‘tourism product ratio’, i.e. the share of the supply (output) of a
product used by tourists. It follows that four sectors from the list of 41 forecast sectors (see the
Appendix 4) can be combined in order to calculate a proxy ‘tourism’ sector, i.e.

131
Table 28: SA Tourism expenditure by product, 2008
Product Domestic spend (1)
Foreigner spend (2)
Total demand (3)=(1)+(2)
Total domestic supply (4)
Tourism product ratio
(5)=(3)/(4)
R million %
Catering & accommodation services 18711 17353 36064 55981 64.4 Passenger transport services (incl. car rental & travel agencies)
39106 16854 55960 114481 48.9
Cultural, recreational and sport services 1885 3884 5770 19037 30.3 Retail trade services 7884 8388 16272 159482 10.2 Other goods & services 9328 23484 32812 4413359 0.7
Total tourism expenditures 76914 69964 146878 4762340 3.1
Source: Tourism Satellite Account for South Africa, final 2005 and provisional 2006 to 2008
catering & accommodation services;
transport & storage (which contain passenger transport services);
other community, social & personal services (which contains cultural, recreational & sport
services) and
wholesale & retail (which contain retail trade services).
The tourism product ratios (Table 28) can be applied to determine the share of each tourism
industry segment. However, before this can be done, the shares of the tourism industry segments in
each of the broader sectors listed above need to be determined. To this end, the Supply & Use
Tables (2009) produced by StatsSA was consulted.
Regarding catering & accommodation, the tourism product ratio (i.e. 64.4% or rounded to
65%) can be applied directly as it is not part of a larger aggregate.
Regarding transport & storage, passenger transport and transport support services account
for 60% of the broader sector (freight transport services for the remainder); applying the
relevant tourism product ratio, it follows that 29.4% (or rounded to 30%) can be used as the
relevant weight.
Regarding other community, social & personal services, the Supply Table (2009) indicates
that recreation, cultural and sport activities comprise 15% of this sector; again, applying the
relevant tourism product ratio (30%), it follows that 4.5% (or rounded to 5%) can be used as
the relevant weight.
Regarding wholesale & retail trade, the Supply Table shows that retail services account for
41.2% of this sector. The tourism product ratio for tourism-related products in the retail
sector is 10.2%; however, for other goods & services (spanning retail and other sectors) the
ratio is 0.7% - this latter share of tourism spending is ignored for now as it is difficult to
allocate to other sectors. This may cause an underestimation of the size of the ‘tourism’

132
sector; however, unlikely to cause misleading growth trajectories. Given the above ratios
the weight of the wholesale & retail trade sector to enter the ‘tourism’ proxy is 4.2% (or
rounded to 5%).
While a fixed weight would be an acceptable route to follow, it may not do justice to the growth of
the sector. StatsSA’s provisional TSA for 2008 shows that, for instance, the tourism product ratio in
the case of the catering & accommodation sector increased from 62.8% in 2005 to 64.4% in 2008,
i.e. an annual increment of 0.5% points. In the case of transport, the annual increment was 0.25%
points and retail 0.1% points. It was therefore decided to allow for varying weights assuming these
increments would continue over the 2009 to 2015 period.
Therefore: Tourism GDPR =
65% (plus annual increment of 0.5%) of ‘catering & accommodation’ +
30% (plus annual increment of 0.15%) of ‘transport & storage’ +
5% (plus increment of 0.1%) of ‘wholesale & retail’ +
5% of ‘other community, social & personal services’.
The current price weights are applied to the constant price forecast data and it is assumed that the
Western Cape picture is similar to national. This is also a limiting assumption as the composition of
tourism spending in the Western Cape may vary from that of national; however, until a TSA for the
region is compiled this will be the soundest assumption to make. Calculating the tourism GDPR in
this manner (at constant 2005 prices), the share of the sector in total regional GDPR is 3.3% (and for
employment 4.5%) in calendar 2008, which corresponds with the TSA estimating 3.1% and 4.4%
respectively for the national tourism industry contribution30.
ICT. The corresponding calculations regarding the ICT sector are based on what could be
ascertained from the SUT of StatsSA and the composition of employment numbers for the regional
sector (DEDT, 2011)31. The sector spans four major industries, i.e. (in order of importance) computer
related activities of the business services sector; financial services; the electrical machinery, radio,
TV, communication and professional & scientific equipment sector and the telecommunications
industry. While the definition of the ICT sector is ever changing due to the rapid development in the
industry, we have to work with the available data. The ICT proxy was calculated as follows:
30
It is problematic to use constant weights as this may conceal the actual growth of the tourism industry. During phase 2 this matter
can receive attention – the TSA is available for calendar 2005 (final) and provisionally for 2006 to 2008 and is compiled annually. 31
This is a major revision from the assumption adopted in the preliminary forecast and resulted in a slightly smaller estimate of the
GDPR contribution to the region’s GDPR, i.e. 4% versus 5.2% estimated previously.

133
As noted, a simplifying assumption was made that 10% of the combined electrical
machinery, radio, TV & communication equipment and professional & scientific equipment
sector comprises ICT; this may be an underestimation, but in lieu of further information
remains at that.
The estimated employment of ICT workers in the finance & insurance industry is 10 000,
which comprised 18% of this subsector’s total employment in 2009.
Regarding the broader business services sector, ‘computer related activities’ account for
close to 5% of the sector’s GDPR; and according to the employment numbers provided by
DEDT, 5.9%. It was therefore decided to use 5.5% as the relevant weight for the ICT sector.
In the communications sector, consisting of postal & courier services (7%) and
telecommunications (93%) according to the 2009 SUT (StatsSA), these ratios are simply
applied and it is assumed that fixed line and mobile telecommunications account for 95% of
the telecommunications subsector’s GDPR. Therefore 4.5% of the communications sector
GDPR is regarded as ICT GDPR (ITC telecommunications).
Therefore: ICT GDPR =
10% of ‘electrical machinery, radio, TV & communication eqp and professional & scientific
eqp’ +
4.5% of ‘communication’ +
5.5% of ‘business services’+
18% of finance & insurance.
Fixed weights were assumed to apply throughout the forecast period (and the history), which is a
simplifying assumption. According to this calculation (applying the ratios to constant price GDPR
data), the ICT sector directly contributed 4% to the regional GDPR in 2009 and employed 1.5% of the
regional workforce. Calculated in this way, the estimated employment number in 2009 is 26 265,
which fully agrees with independent estimates (DEDT, 2011).
At this stage a simplifying assumption was made in order to calculate the projections in terms of
employment, exports and imports; namely that the GDPR weights can be applied here as well. In
the case of employment (a size indicator) it is still a useful assumption; also in terms of intermediate
imports, but not exports. When more disaggregated historical data becomes available alternative
estimates of these variables can be made.

134
Appendix 7: Western Cape sectoral forecast of real GDPR growth: 2005-2015
Sector 2005 2006 2007 2008 2009 2010est 2011F 2012F 2000-9 2010-15F
1 Agriculture, forestry & fishing 5.9 -5.7 1.6 17.7 -5.5 0.7 1.0 2.0 2.1 2.3
2 Mining 5.2 -5.6 0.9 -7.1 0.5 -8.8 1.0 1.0 -1.1 -0.7
3 Food & beverages - agric processing 4.7 5.4 4.5 1.2 -9.0 0.7 2.0 3.3 1.5 2.8
4 Clothing & textiles -3.7 3.0 6.2 5.4 1.9 2.9 0.1 2.2 2.2 1.9
5 Leather & products and footwear 6.2 6.6 8.3 9.8 -8.2 3.7 5.2 3.5 7.4 4.5
6 Wood, paper, printing & publishing 1.3 2.4 4.0 1.2 -12.1 0.4 1.7 1.1 -0.2 1.0
7 Petroleum products, chemicals, rubber & plastic 7.1 7.8 4.8 -1.1 -2.8 2.5 4.7 4.4 3.7 4.1
8 Glass & products and other non-metallic minerals 3.9 5.9 5.2 0.5 -23.1 -3.3 1.9 1.8 0.2 0.9
9 Metals & engineering (incl. machinery) 6.3 7.8 7.5 4.9 -16.0 7.7 1.5 4.2 3.1 4.3
10 Electronics (excl. ICT) 13.2 11.0 5.6 5.5 -3.9 3.8 4.1 4.9 3.7 4.2
11 Motor vehicles, parts & accessories 14.3 8.6 7.3 2.4 -8.0 7.9 5.0 4.3 5.5 5.1
12 Other transport eqp (incl. boat building) 10.2 10.5 7.1 1.6 -16.6 11.4 2.4 3.4 7.2 5.1
13 Furniture 4.8 9.7 4.2 4.6 -6.4 5.6 4.6 4.5 7.6 5.3
14 Other industries 5.4 5.0 4.0 5.6 -10.1 12.1 1.7 2.8 1.7 4.2
15 Electricity & water supply 6.0 2.0 2.4 -3.8 0.5 3.2 1.4 3.4 3.1 3.1
16 Construction 12.3 10.7 15.1 8.2 6.1 1.6 1.9 4.9 8.7 5.0
17 Wholesale, retail, catering & accom (excl. tourism) 9.3 5.4 5.3 0.1 -2.9 2.8 3.8 3.7 4.3 3.8
18 Tourism 7.0 2.9 5.7 0.0 -1.1 1.8 4.5 4.6 3.9 4.4
19 Transport & storage (excl. tourism) 6.2 2.2 5.4 0.1 -1.1 1.7 3.5 3.6 3.9 3.4
20 Communication (excl. ICT) 13.4 7.1 9.1 5.1 2.7 5.2 9.2 7.9 8.1 8.0
21 Finance & insurance (excl. ICT) 4.8 16.6 13.7 12.1 -2.9 4.0 6.9 5.8 8.7 6.0
22 Business services (excl. ICT) 4.2 4.4 3.9 3.6 3.7 2.2 3.9 3.6 4.8 3.4
23 ICT 5.2 12.5 10.8 9.5 -1.1 3.6 6.2 5.4 7.4 5.5
24 Medical, dental & other health & veterinary services 3.4 2.7 6.2 3.4 -1.4 1.5 1.7 1.2 2.9 1.3
25 Other community, social & personal services (excl. tourism) 4.8 5.1 5.1 4.5 0.0 -1.1 3.3 4.0 3.7 3.2
26 Government 3.9 2.6 4.0 4.2 3.9 2.4 1.9 1.8 2.1 2.1
Total Western Cape GDPR 6.1 5.9 6.4 4.5 -1.4 2.7 3.9 4.0 4.3 4.0
Average % change

135
Appendix 8: Western Cape sectoral forecast of employment growth: 2005-2015
Sector 2005 2006 2007 2008 2009 2010est 2011F 2012F 2000-9 2010-15F
1 Agriculture, forestry & fishing -6.7 -10.6 -7.2 -5.7 -9.6 4.5 0.3 0.7 -6.2 1.3
2 Mining 3.2 15.3 33.0 22.1 10.7 -3.9 0.9 0.0 2.6 -0.5
3 Food & beverages - agric processing 4.8 -1.1 2.4 2.2 -2.0 -2.6 0.3 0.4 -1.3 0.1
4 Clothing & textiles -8.0 -5.4 0.6 -8.2 -11.8 -8.8 0.4 0.0 -4.1 -2.0
5 Leather & products and footwear -1.5 0.1 -1.3 -0.5 -0.1 -8.9 1.1 0.8 -6.4 -0.7
6 Wood, paper, printing & publishing -0.6 0.6 1.7 2.2 -8.9 -1.7 1.1 0.8 0.0 0.4
7 Petroleum products, chemicals, rubber & plastic 3.4 -0.7 1.0 3.5 -6.8 -3.6 1.1 0.8 -0.7 0.1
8 Glass & products and other non-metallic minerals 4.5 1.6 1.8 -3.8 -19.6 -7.7 1.7 1.5 -2.9 -0.3
9 Metals & engineering (incl. machinery) 2.1 2.2 4.3 1.0 -4.4 -2.8 1.1 1.8 0.3 1.0
10 Electronics (excl. ICT) 5.0 -1.0 -0.5 3.2 -5.5 -1.2 1.8 1.5 -2.6 0.8
11 Motor vehicles, parts & accessories 2.2 -2.1 -1.1 3.0 -12.1 7.5 1.9 2.1 -1.2 3.1
12 Other transport eqp (incl. boat building) 2.0 -2.1 0.9 6.8 -1.2 -7.0 2.0 2.4 0.4 0.8
13 Furniture 0.0 -1.9 7.8 -8.2 -12.2 -4.5 0.6 1.4 -2.8 0.2
14 Other industries 3.4 -0.1 1.6 -7.7 -6.9 -0.1 0.9 2.1 0.9 1.6
15 Electricity & water supply 13.0 4.5 18.3 -2.6 -13.2 -4.1 -0.1 0.7 2.4 -0.2
16 Construction 5.8 12.2 -2.0 -5.3 -7.0 -6.3 -0.2 0.8 0.8 0.0
17 Wholesale, retail, catering & accom (excl. tourism) 9.5 5.8 2.1 2.8 -1.4 -0.4 2.5 3.0 3.7 2.5
18 Tourism 6.1 3.3 0.4 2.6 -0.6 -0.2 2.2 3.0 1.1 2.7
19 Transport & storage (excl. tourism) 1.5 -1.3 0.6 9.2 -4.4 -3.2 -0.3 -0.1 1.7 -0.5
20 Communication (excl. ICT) -1.2 -5.1 -4.4 1.1 -2.4 -7.6 2.9 2.3 0.6 0.6
21 Finance & insurance (excl. ICT) 2.5 -5.7 -4.5 3.0 -5.8 0.2 0.1 0.4 -0.2 0.4
22 Business services (excl. ICT) -2.3 3.3 4.7 7.9 -7.1 -2.3 3.3 3.6 4.8 2.8
23 ICT -0.1 -0.7 0.8 5.8 -6.5 -1.5 2.1 2.3 2.3 1.8
24 Medical, dental & other health & veterinary services 7.4 -2.6 -1.7 -0.3 0.3 -0.4 1.9 1.5 5.0 1.3
25 Other community, social & personal services (excl. tourism) 5.0 0.4 4.6 5.8 -1.0 -1.3 0.4 1.1 2.8 0.8
26 Government 5.9 1.3 4.9 7.0 2.5 0.4 1.4 1.6 3.3 1.4
Total Western Cape employment 2.7 1.2 1.6 2.7 -3.8 -1.3 1.5 1.9 1.2 1.5
Average % change

136
Appendix 9: Western Cape sectoral forecast of real export growth: 2005-2015
Sector 2005 2006 2007 2008 2009 2010est 2011F 2012F 2000-9 2010-15F
1 Agriculture, forestry & fishing 40.3 -12.1 5.6 19.6 -9.0 35.6 4.9 -0.6 15.7 8.1
2 Mining 5.7 9.8 2.5 8.2 -12.7 1.0 4.0 0.3 1.1 2.3
3 Food & beverages - agric processing 7.2 -5.1 12.2 -5.0 4.7 -13.0 3.6 2.3 2.9 1.7
4 Clothing & textiles -23.8 -26.1 -19.5 -25.3 -12.6 -18.1 -1.8 -1.6 -15.7 -3.3
5 Leather & products and footwear 23.5 3.6 -20.3 -65.6 -27.0 17.7 1.2 1.1 -6.4 6.3
6 Wood, paper, printing & publishing 8.8 -17.9 -2.0 -34.7 6.1 -11.7 2.9 1.9 -4.3 0.4
7 Petroleum products, chemicals, rubber & plastic 19.4 -1.9 12.2 -6.5 -18.2 -12.7 -4.8 8.9 3.2 4.8
8 Glass & products and other non-metallic minerals 10.6 -15.4 18.1 -1.7 -32.9 -21.6 17.9 3.0 -3.7 1.1
9 Metals & engineering (incl. machinery) 12.7 7.4 27.7 -0.9 -29.1 2.4 9.7 10.8 9.4 8.6
10 Electronics (excl. ICT) 28.1 8.0 21.9 -1.2 -19.9 -19.5 19.7 28.3 7.2 7.8
11 Motor vehicles, parts & accessories -10.2 -6.3 14.4 -9.2 -35.0 7.5 9.8 11.6 11.0 10.3
12 Other transport eqp (incl. boat building) 44.9 27.9 16.2 -6.6 -41.2 -22.6 -6.1 15.8 3.2 5.5
13 Furniture -8.0 3.1 25.9 -39.2 -24.9 4.3 -5.4 1.0 -4.9 3.1
14 Other industries 26.2 29.9 25.0 15.2 -55.0 -12.7 -1.0 1.0 13.1 0.0
15 Electricity & water supply 11.7 6.9 0.2 -15.7 1.0 -0.6 16.5 4.3 2.3 6.3
16 Construction 15.8 22.6 16.2 -18.4 -1.1 -17.6 -0.5 3.2 0.7 0.2
17 Wholesale, retail, catering & accom (excl. tourism) 9.3 6.7 4.7 -4.4 -13.6 -0.3 1.7 4.5 2.8 4.0
18 Tourism 8.5 3.6 10.9 -9.6 -7.0 5.6 4.6 6.0 3.3 6.2
19 Transport & storage (excl. tourism) 2.4 4.3 7.6 -12.0 -6.1 7.0 9.2 5.3 3.0 6.3
20 Communication (excl. ICT) 17.1 13.4 17.4 -10.0 -0.5 21.1 3.0 5.6 15.8 9.5
21 Finance & insurance (excl. ICT) 7.5 15.4 16.9 2.8 -21.9 3.6 1.8 2.0 3.6 2.3
22 Business services (excl. ICT) 16.4 18.2 5.6 21.0 -3.8 1.5 6.2 6.7 14.2 7.4
23 ICT 13.4 14.1 16.2 3.5 -17.0 0.1 5.6 7.9 5.9 4.9
24 Medical, dental & other health & veterinary services 37.2 -1.0 3.8 -11.4 -21.0 5.1 10.3 5.5 1.5 6.2
25 Other community, social & personal services (excl. tourism) 14.3 19.9 22.7 11.4 -1.2 5.3 1.7 4.3 13.8 4.9
26 Government - - - - - - - - - -
Total Western Cape exports 14.9 0.6 11.8 -0.6 -14.0 3.1 4.3 4.6 4.0 5.2
Average % change
137
Appendix 10: Quantification of inter-industry linkages (backward and forward)
The information contained in an input-output model is very useful in order to assess the direct and
indirect effects that an exogenous change in the economy can have on the production sectors and/or
other components of the economy. A central issue is that of changes in final demand in an economy
(i.e. household consumption, government consumption, business fixed investment and exports) and
how this impacts on the production sectors of the economy. In multiplier analysis, the difference
between the initial effect and the indirect/induced impact (or total impact) of the exogenous change in
the economy is of particular concern. Typically we study the multiplied impact that a unit change in final
demand in the economy may have on output, value added, household income and employment.
When the (final) demand for, say sector j’s product increases, the output of that industry has to increase
by at least the same amount to meet the changed level of demand. In order to supply this higher level
of output, sector j will demand additional inputs from other sectors in the economy. This additional
(intra and inter-industry demand and output) is the direct impact of the (exogenous) increase in (final)
demand. However, in order to produce the additional product, the industry(s) concerned will demand
more inputs from its supplying industries, generating another round of increased demand; in fact, a
whole chain of indirect effects is set in motion, with each round of new demand generating a new
supply response across the linked industries. This increased demand and output from the supplying
industries constitute the indirect effect from the original increase in demand. The supplying industries,
in turn, will require additional inputs, including labour, in order to increase their production levels. The
additional income paid to households supplying the labour will also generate new demand and
therefore output in the general economy. This is the induced effect.
When all the output effects – direct, indirect and induced – are added up and divided by the initial effect
(i.e. the original change in output of sector j to satisfy the exogenous increase in final demand), the
economy-wide (or total) output multiplier for sector j is derived (also called Type II multipliers). If we
exclude the induced effect, the direct or simple output multiplier is derived (also called Type I
multipliers). Multiplier analysis is typically conducted in respect of output, value added, household
income and employment, but can be expanded to quantities such as profits, taxes, imports, etc.
However, what are of concern in the current section are the (intra-regional) interconnectedness of the
various industries/ sectors of the economy, alternatively the backward and forward linkages within the
province.
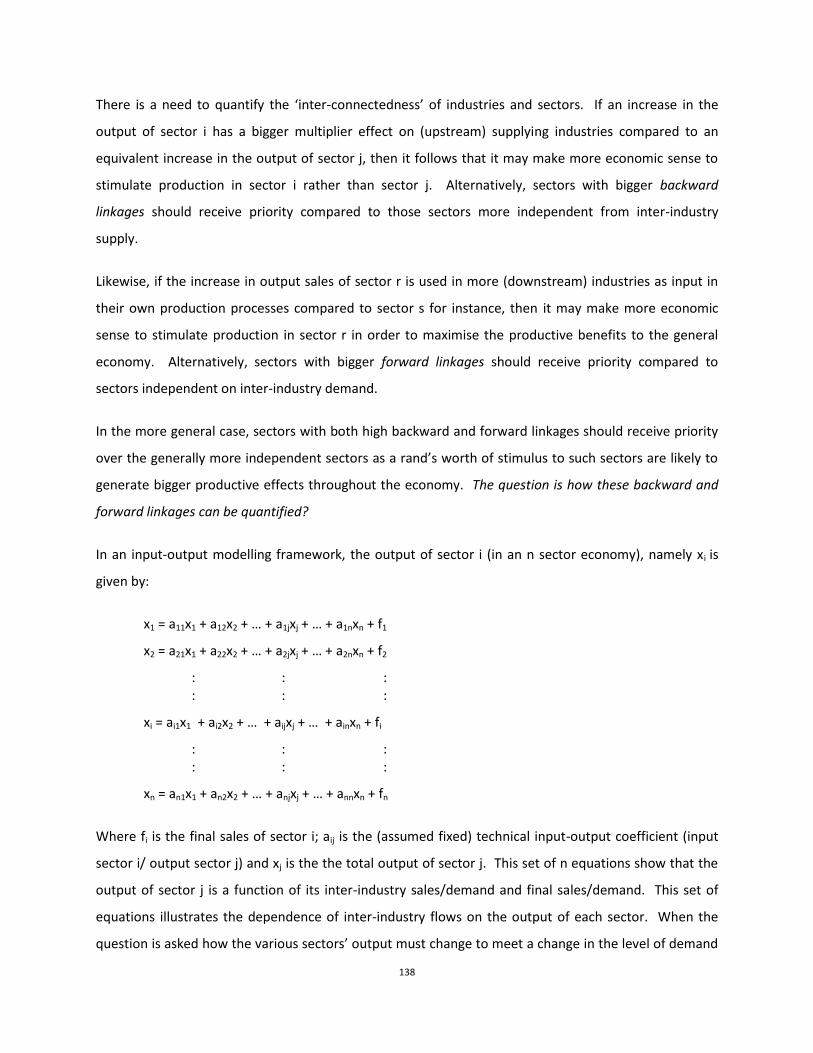
138
There is a need to quantify the ‘inter-connectedness’ of industries and sectors. If an increase in the
output of sector i has a bigger multiplier effect on (upstream) supplying industries compared to an
equivalent increase in the output of sector j, then it follows that it may make more economic sense to
stimulate production in sector i rather than sector j. Alternatively, sectors with bigger backward
linkages should receive priority compared to those sectors more independent from inter-industry
supply.
Likewise, if the increase in output sales of sector r is used in more (downstream) industries as input in
their own production processes compared to sector s for instance, then it may make more economic
sense to stimulate production in sector r in order to maximise the productive benefits to the general
economy. Alternatively, sectors with bigger forward linkages should receive priority compared to
sectors independent on inter-industry demand.
In the more general case, sectors with both high backward and forward linkages should receive priority
over the generally more independent sectors as a rand’s worth of stimulus to such sectors are likely to
generate bigger productive effects throughout the economy. The question is how these backward and
forward linkages can be quantified?
In an input-output modelling framework, the output of sector i (in an n sector economy), namely xi is
given by:
x1 = a11x1 + a12x2 + … + a1jxj + … + a1nxn + f1
x2 = a21x1 + a22x2 + … + a2jxj + … + a2nxn + f2
: : : : : :
xi = ai1x1 + ai2x2 + … + aijxj + … + ainxn + fi
: : : : : :
xn = an1x1 + an2x2 + … + anjxj + … + annxn + fn
Where fi is the final sales of sector i; aij is the (assumed fixed) technical input-output coefficient (input
sector i/ output sector j) and xj is the the total output of sector j. This set of n equations show that the
output of sector j is a function of its inter-industry sales/demand and final sales/demand. This set of
equations illustrates the dependence of inter-industry flows on the output of each sector. When the
question is asked how the various sectors’ output must change to meet a change in the level of demand
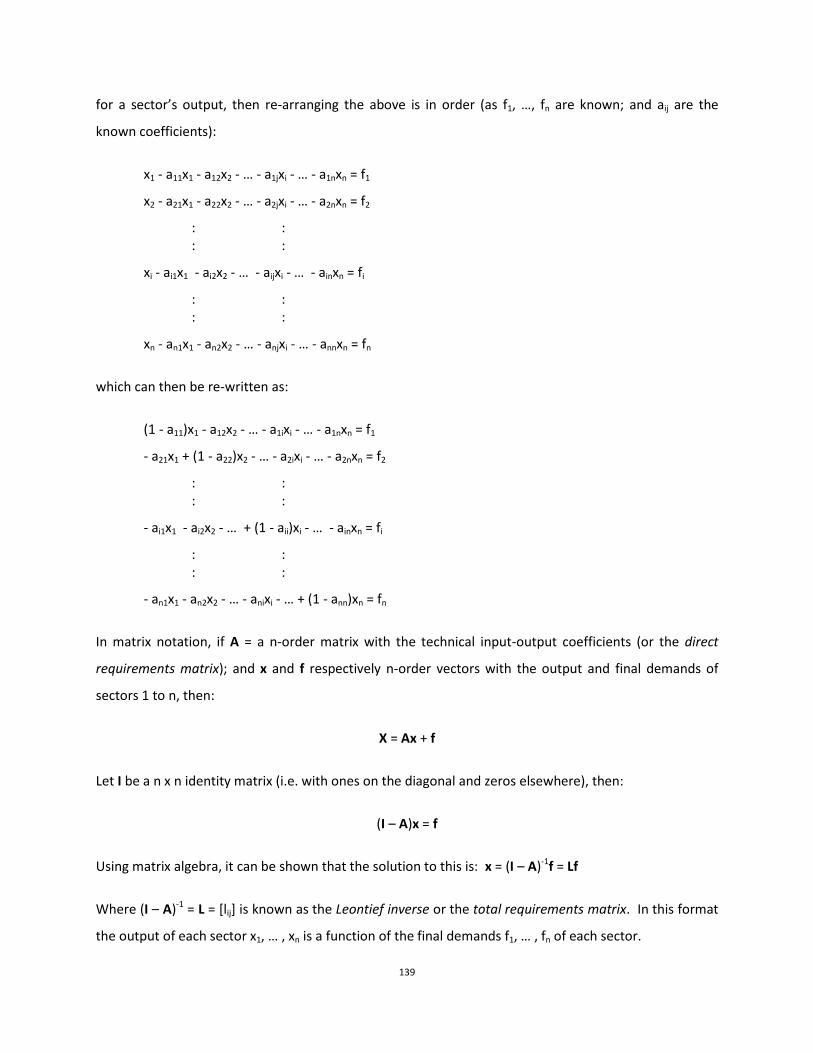
139
for a sector’s output, then re-arranging the above is in order (as f1, …, fn are known; and aij are the
known coefficients):
x1 - a11x1 - a12x2 - … - a1jxi - … - a1nxn = f1
x2 - a21x1 - a22x2 - … - a2jxi - … - a2nxn = f2
: : : :
xi - ai1x1 - ai2x2 - … - aijxi - … - ainxn = fi
: : : :
xn - an1x1 - an2x2 - … - anjxi - … - annxn = fn
which can then be re-written as:
(1 - a11)x1 - a12x2 - … - a1ixi - … - a1nxn = f1
- a21x1 + (1 - a22)x2 - … - a2ixi - … - a2nxn = f2
: : : :
- ai1x1 - ai2x2 - … + (1 - aii)xi - … - ainxn = fi
: : : :
- an1x1 - an2x2 - … - anixi - … + (1 - ann)xn = fn
In matrix notation, if A = a n-order matrix with the technical input-output coefficients (or the direct
requirements matrix); and x and f respectively n-order vectors with the output and final demands of
sectors 1 to n, then:
X = Ax + f
Let I be a n x n identity matrix (i.e. with ones on the diagonal and zeros elsewhere), then:
(I – A)x = f
Using matrix algebra, it can be shown that the solution to this is: x = (I – A)-1f = Lf
Where (I – A)-1 = L = [lij] is known as the Leontief inverse or the total requirements matrix. In this format
the output of each sector x1, … , xn is a function of the final demands f1, … , fn of each sector.

140
In this form of the model, i.e. x = Lf (or ∆x = L∆f), impact analysis and forecasting van be conducted: for
any specified change in the elements of f (i.e. the final demands of sectors 1 to n), the impact on the
production sectors (i.e. the elements of x) can be determined.
In multiplier analysis, it is seen that the elements of matrix L are the sector-to-sector multipliers, lij,
relating final demand in sector j to output in sector i. An (simple) output multiplier for sector j is defined
as the jth column sum of the total requirements matrix (L) and represents sector-to-economy wide
multipliers, relating final demand in sector j to economy-wide output. When the input-output model is
closed with respect to households, the household sector becomes endogenous in the model and the
(total) output multiplier captures the induced effect as well. Total output multipliers are therefore
larger than direct (simple) output multipliers.
In its simplest form, the measure of the strength of the backward linkage of sector j, i.e. the amount by
which sector j production depends of inter-industry (intermediate) inputs, is given as the jth column total
of the direct requirements matrix A, namely ∑aij, i = 1, …, n. As the input coefficients in A measures the
direct effect only, this is called the direct backward linkage; for sector j it is defined as:
BL(d)j = ∑aij i = 1, …, n
In order to capture both the direct and indirect linkages in an economy, the column sums of the total
requirements matrix (L above) need to be calculated. The total backward linkage measures both the
direct and indirect linkages in an economy and, for sector j, is defined as:
BL(t)j = ∑lij i = 1, …, n
Where lij are the elements of the total requirements matrix, L. The total backward linkage for sector j
(BL(t)j) therefore is the jth column sum of the total requirement matrix, L.
The backward linkage indices (for each sector j, j = 1, …, n) can be normalised so that the average value
of all the backward linkages is equal to one and for sectors with (normalised) BL(t) > 1 then identified as
those with “above average” backward linkages and for those sectors with (normalised) BL(t) < 1, as
sectors with “below average” backward linkages.
In similar fashion to backward linkages, forward linkages can be quantified; however, with an important
difference, i.e. to transpose the vertical view of the input-output model (backward linkages as the

141
column sum of the input matrix), with a horizontal view. Instead of expressing the input requirements
as a ratio of the sector’s output (A) in a demand-driven model (x = Lf), which relates sectoral output to
the amount of final demand, Ghosh (1958) suggested an alternative interpretation relating sectoral
output to the primary inputs. Therefore, instead of dividing each column of Z by the gross output of the
sector associated with that column to derive the direct (and total) requirements matrices A (L), we
divide each row of Z by the gross output of the sector associated with that row to derive what is called
the direct-output coefficients matrix, B, and the Ghosh inverse (or output inverse), G, where G = (I – B)-1
(similar to L = (I – A)-1, i.e. the Leontief inverse also called the input inverse; where I is an identity matrix).
In its simplest form then, the direct forward linkage of sector i is given by:
FL(d)i = ∑aij j = 1, …, n
This only captures the direct forward linkage; in order to capture both the direct and indirect forward
linkages of sector I, the row sums of the Ghosh inverse need to be calculated:
FL(t)i = ∑gij j = 1, …, n
Similar to the backward linkages, (for each sector i, i = 1, …, n) the forward linkage indices can be
normalised so that the average value of all the forward linkages is equal to one and for sectors with
(normalised) FL(t) > 1 then identified as those with “above average” forward linkages and for those
sectors with (normalised) FL(t) < 1, as sectors with “below average” backward linkages.
For more reading on the topic, see chapters 6 and 12 of Miller, RE & Blair, PD: Input-Output Analysis:
Foundations and Extensions. Cambridge University Press, 2nd edition, 2009.