
Industrial Energy Management - Literature...
32
January 2012 Industrial Energy Management — Market Research Report Rockwell Automation © 2012 Rockwell Automation 1 Industrial Energy Management Market Research Report by Rockwell Automation January 2012
-
Upload
truongdiep -
Category
Documents
-
view
215 -
download
1
Transcript of Industrial Energy Management - Literature...

January 2012
Industrial Energy Management — Market Research Report Rockwell Automation
© 2012 Rockwell Automation 1
Industrial Energy Management
Market Research Report by Rockwell Automation
January 2012

January 2012
Industrial Energy Management — Market Research Report Rockwell Automation
© 2012 Rockwell Automation 2
Introduction Industrial Energy Management is a market research report that examines the state of industrial energy usage, assesses the readiness of industrial companies to take action to reduce consumption of WAGES (water, air, gas, electric, and steam), and presents the Rockwell Automation Industrial GreenPrintTM, a four-stage methodology for progressively achieving improvements through existing and key new investments. 1. Energy Today Amid an environment of rising energy costs and volatile energy markets, industrial enterprises (manufacturers, oil and gas producers, refineries, mining, processors, etc.) need to develop an energy-management strategy — many are slow to develop an energy-management culture, while others have aggressively captured energy savings and gained a competitive advantage. 2. Energy Awareness Monitor facility-level energy consumption in order to inform big-picture operations decisions, and track machine-level energy consumption in real time for timely energy-management decisions. 3. Energy Efficiency Leverage energy-consumption data to make incremental and proactive behavioral, control, and equipment improvements (e.g., forecasting, load aggregation, and rate-analysis exercises). 4. Energy Optimization Model and simulate energy solutions that factor in energy as an economic variable in coordination with energy-compliance criteria as a production variable. In doing so, improve plant floor assets, balance process variables inherent to manufacturing, increase profitability, and improve the total cost of ownership of operational assets. 5. Energy Aggregation Analyze extensive WAGES information against production output data and other ERP-level information to gain higher returns on resource expenses — ultimately documenting energy on production bill of materials — and develop energy-management documentation and scorecards to support energy-centric supply-chain strategies. 6. Going Forward Industrial companies that start today in building an Industrial GreenPrint™ methodology for energy management will hold leadership positions tomorrow.

January 2012
Industrial Energy Management — Market Research Report Rockwell Automation
© 2012 Rockwell Automation 3
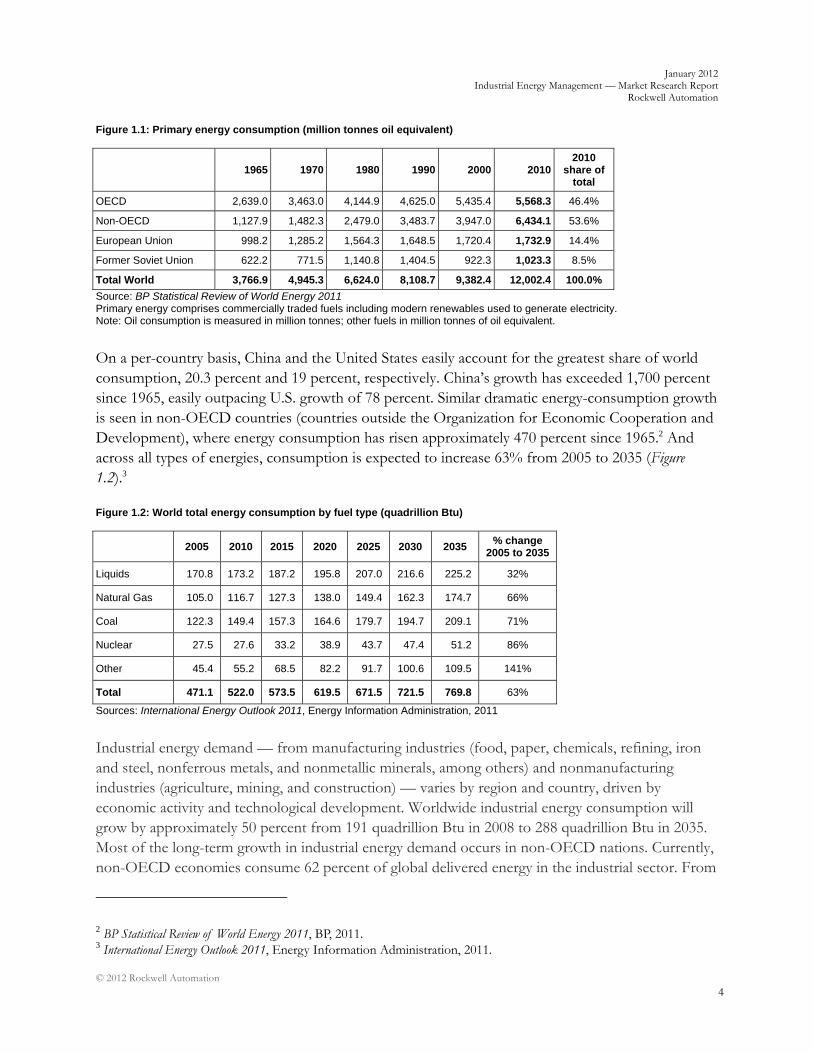
1. Energy Today It would be difficult for companies today to be unaware of energy use in their facilities, i.e. consumption of water, air, gas, electric, and steam. Energy consumes an increasingly larger share of operating costs, and extracting, producing, or making anything — from beverages and chemicals to machinery and raw materials — demands energy for myriad processes: prototyping, refining, processing, mixing, heat-treating, blending, stamping, painting, assembling, etc. Even amid a business environment surrounded by energy usage, many executives still fail to consider the many ways that energy use is not productive. Many activities routinely contribute to unnecessary energy consumption: e.g., surges of equipment during sudden starts; poorly maintained equipment; poor selection of product-design attributes that result in higher energy usage; inaccurate temperatures that use excessive fuels; and product rework due to human, machine, material, or management errors. Too often companies willingly accept that energy is simply a cost of doing business, cognizant of their volume of energy usage and their energy bills, but not moving quickly — or at all — to do something meaningful about them. Many manufacturing executives do not consider how energy management contributes to their bottom lines and to their stakeholders. Examining the current state of energy consumption shows the enormous dollar opportunities for manufacturers. Energy consumption trends A decades-long perspective of global energy consumption indicates the vast modernization that has occurred around the world and continues to take place in emerging market economies (EMEs). And with modernization comes the increased use of energy. In no area of the planet has the hunger for fuel been abated. Global energy consumption has risen by more than 200 percent since 1965, from 3,767 million tonnes of oil equivalent (Mtoe) to 12,002 Mtoe in 2010. From 2000 to 2010, energy consumption increased approximately 28 percent (Figure 1.1).1
1 BP Statistical Review of World Energy 2011, BP, 2011.
January 2012
Industrial Energy Management — Market Research Report Rockwell Automation
© 2012 Rockwell Automation 4
Figure 1.1: Primary energy consumption (million tonnes oil equivalent)
1965 1970 1980 1990 2000 20102010
share of total
OECD 2,639.0 3,463.0 4,144.9 4,625.0 5,435.4 5,568.3 46.4%
Non-OECD 1,127.9 1,482.3 2,479.0 3,483.7 3,947.0 6,434.1 53.6%
European Union 998.2 1,285.2 1,564.3 1,648.5 1,720.4 1,732.9 14.4%
Former Soviet Union 622.2 771.5 1,140.8 1,404.5 922.3 1,023.3 8.5%
Total World 3,766.9 4,945.3 6,624.0 8,108.7 9,382.4 12,002.4 100.0%
Source: BP Statistical Review of World Energy 2011 Primary energy comprises commercially traded fuels including modern renewables used to generate electricity. Note: Oil consumption is measured in million tonnes; other fuels in million tonnes of oil equivalent.
On a per-country basis, China and the United States easily account for the greatest share of world consumption, 20.3 percent and 19 percent, respectively. China’s growth has exceeded 1,700 percent since 1965, easily outpacing U.S. growth of 78 percent. Similar dramatic energy-consumption growth is seen in non-OECD countries (countries outside the Organization for Economic Cooperation and Development), where energy consumption has risen approximately 470 percent since 1965.2 And across all types of energies, consumption is expected to increase 63% from 2005 to 2035 (Figure 1.2).3 Figure 1.2: World total energy consumption by fuel type (quadrillion Btu)
2005 2010 2015 2020 2025 2030 2035 % change
2005 to 2035
Liquids 170.8 173.2 187.2 195.8 207.0 216.6 225.2 32%
Natural Gas 105.0 116.7 127.3 138.0 149.4 162.3 174.7 66%
Coal 122.3 149.4 157.3 164.6 179.7 194.7 209.1 71%
Nuclear 27.5 27.6 33.2 38.9 43.7 47.4 51.2 86%
Other 45.4 55.2 68.5 82.2 91.7 100.6 109.5 141%
Total 471.1 522.0 573.5 619.5 671.5 721.5 769.8 63%
Sources: International Energy Outlook 2011, Energy Information Administration, 2011
Industrial energy demand — from manufacturing industries (food, paper, chemicals, refining, iron and steel, nonferrous metals, and nonmetallic minerals, among others) and nonmanufacturing industries (agriculture, mining, and construction) — varies by region and country, driven by economic activity and technological development. Worldwide industrial energy consumption will grow by approximately 50 percent from 191 quadrillion Btu in 2008 to 288 quadrillion Btu in 2035. Most of the long-term growth in industrial energy demand occurs in non-OECD nations. Currently, non-OECD economies consume 62 percent of global delivered energy in the industrial sector. From
2 BP Statistical Review of World Energy 2011, BP, 2011. 3 International Energy Outlook 2011, Energy Information Administration, 2011.

January 2012
Industrial Energy Management — Market Research Report Rockwell Automation
© 2012 Rockwell Automation 5
2008 to 2035, industrial energy use in non-OECD countries will grow by an average of 2 percent per year, compared with 0.5 percent per year in OECD countries. 4 Energy challenges Growing energy demand, diverse energy sources, and diverse user needs pose challenges for industrial companies, including increased regulatory and legislative activity intended to minimize environmental impact from energy-use and energy-pricing increases in reaction to supply volatility. The United States continues to explore legislation intended to reduce greenhouse gas emissions and spur more clean energy and energy efficiency. Other countries require designated or large consumers to report their energy consumption. Still other regulatory measures include requirements to put in place energy managers or mandatory maintenance of energy-consuming equipment.5 Especially challenging for companies are rising energy prices: four major categories of primary energy — West Texas Intermediate crude, gasoline, diesel, and home-heating oil — will increase by approximately 50% from 2009 to 2012 (Figure 1.3).6 1.3: Short-term energy outlook
2009 2010 2011 2012 % change
2009 to 2012
West Texas Intermediate Crude (dollars per barrel)
$61.65 $79.40 $93.80 $91.13 48%
Gasoline (dollars per gallon; average regular pump price)
$2.35 $2.78 $3.54 $3.46 47%
Diesel (dollars per gallon; on-highway retail)
$2.46 $2.99 $3.84 $3.79 54%
Heating Oil (dollars per gallon; U.S. residential average)
$2.51 $2.96 $3.73 $3.77 50%
Natural Gas (dollars per thousand cubic feet; U.S. residential average)
$12.12 $11.19 $10.97 $11.56 -5%
Electricity (cents per kilowatt hour U.S. residential average)
$11.51 $11.58 $11.77 $11.92 4%
Coal (dollars per million Btu; electric power generation fuel cost)
$2.21 $2.26 $2.41 $2.44 10%
Source: Short-Term Energy Outlook, Energy Information Administration, November 2011.
At a facility or site level, companies continue to face rising energy costs: for example, 63 percent of manufacturing plants report utility/energy costs increased in the past year, according to the 2011
4 International Energy Outlook 2011, Energy Information Administration, 2011. 5 Energy Efficiency Policies Around the World: Review and Evaluation, World Energy Council, Jan. 2008. 6 Short-Term Energy Outlook, Energy Information Administration, Nov. 8, 2011.

January 2012
Industrial Energy Management — Market Research Report Rockwell Automation
© 2012 Rockwell Automation 6
MPI Manufacturing Study (Figure 1.4). One-fifth of plants saw energy costs rise by more than 10 percent.7 Figure 1.4: Change to utility/energy expenses on per unit basis (% of plants)
All United States International
Decreased more than 10% 0.7% 0.5% 1.3%
Decreased 6 - 10% 0.7% 0.9% 0.0%
Decreased 1 - 5% 2.7% 3.7% 0.0%
No change 7.5% 8.4% 5.1%
Increased 1 - 5% 32.8% 35.5% 25.3%
Increased 6 - 10% 34.5% 32.2% 40.5%
Increased more than 10% 21.2% 18.7% 27.9%
Source: 2011 MPI Manufacturing Study
Seeing the broader energy picture — volumes, pricing, and legislative activities surrounding energy consumption today — should alert companies that business as usual should no longer guide energy-management practices. Industrial firms need to determine how they can strategically address all of their energy challenges simultaneously. How will companies evaluate energy-management effectiveness and develop a better perspective of how their products and processes use energy? The closer a company gets to the load or unit of power — rather than watching transformer volume or total energy costs — the clearer the understanding of how to take action. A bottom-up approach helps companies to make optimal choices to manage energy consumption, but it requires a top-down commitment to energy management in order to engage operations and the workforce. By establishing top-down strategies that support bottom-up actions, industrial companies begin to reduce their energy consumption, lower their vulnerability to volatile energy pricing, improve their margins, and prepare for energy and emissions legislation that poses a threat to their businesses. They also will prepare to differentiate themselves from others in their industries, capture competitive advantage, and prepare for changing energy-market dynamics as new ways of generating, transmitting, and exchanging energy emerge. “The available evidence and the historical record indicate that we should expect to see a small but net-positive gain for the U.S. economy both in terms of employment and income — all as a result of increased levels of investment in innovation and emissions-reducing technologies,” wrote John A. “Skip” Laitner. “Changing our investment mix away from traditional, energy-intensive patterns toward one that emphasizes more productive technologies and behaviors, greater energy efficiency,
7 MPI Manufacturing Study of 228 plants (332 U.S. plants and 94 international plants), The MPI Group, December 2011.

January 2012
Industrial Energy Management — Market Research Report Rockwell Automation
© 2012 Rockwell Automation 7
and more labor-intensive activities can yield higher rates of economic growth along with lower economic and environmental costs. In many ways, the effect is much like the rebalancing of a retirement portfolio to take advantage of changing market conditions and new growth opportunities.”8 Similarly, in Europe, reducing energy intensity poses sizeable payoffs for companies and the European Commission. The European Commission Directorate-General for Energy and Transport estimated that it is technically and economically feasible to save at least one-fifth of the EU’s total primary energy by 2020 compared to 2005, and this is “on top of what would be achieved anyway through price effects and structural changes in the economy, along with natural replacement of technology and measures already in place.” Within that overall savings figure, manufacturers alone are estimated to be able to achieve a 25 percent savings: 95 Mtoe in savings from a “business as usual” 382 Mtoe usage figure.9 Energy management pioneers Many countries, companies, and individuals are beginning to treat energy as a tangible good rather than a cheap, limitless commodity. Because of the awareness of leading companies and countries, the economic efficiency of energy usage (energy intensity) has improved or remained comparable throughout the world during the past two decades. In 1980, 15,000 Btu of energy were needed for every dollar of GDP produced in the U.S., compared with less than 9,000 Btu in 2006. Most countries, including China, have experienced similar gains in efficiency due to advances in technology and more sophisticated business management practices.10 But this change in energy intensity is not occurring for all — which creates competitive advantages for those on the leading edge of energy consumption. Many organizations, especially energy-intensive industrial companies, are beginning to understand that a holistic approach to control- and information-driven energy optimization can lead to lower production costs and optimal profits. But it’s not an immediate move from the dark ages to a new era. Companies must recognize the cost-draining trap of passive energy usage (or as many executives lament, “an unavoidable cost that contributes to overhead”) and strategically manage all WAGES resources: improve control of energy usage, lower energy costs as percentage of operating costs, and minimize the volatile risks of energy supply, pricing, and legislation.
8 John A. “Skip” Laitner, Climate Change Policy as an Economic Redevelopment Opportunity: The Role of Productive Investments in Mitigating Greenhouse Gas Emissions, Report Number E098, American Council for an Energy-Efficient Economy, October 2009. 9 2020 Vision: Saving Our Energy, European Commission, Directorate-General for Energy and Transport, European Communities, 2007. 10 Global Energy Use, citing EIA World Per Capita Primary Energy Consumption and EIA World Energy Intensity, Globalization101.org, a Project of The Levin Institute, The State University of New York.

January 2012
Industrial Energy Management — Market Research Report Rockwell Automation
© 2012 Rockwell Automation 8
Given the trio of supply, pricing, and legislation, industrial operations should be motivated to continuously improve energy management as they work to build more sustainable business practices. Many, especially manufacturers, are rapidly striving to be more sustainable. In 2011, 59 percent of manufacturers rate sustainability as highly important or important to their organizations’ success over the next five years, an increase from just 35 percent of companies in 2009. Along with an increased focus on sustainability has come more companies rating their operations as at or near world-class sustainability: 28% in 2011 vs. 20% in 2009 (Figure 1.5).11 Figure 1.5: Sustainability
Importance to organization’s success over next five years
2009 2011
1=Not important 15.6% 5.8%
2 22.6% 12.9%
3 26.7% 22.1%
4 19.4% 27.7%
5=Highly important 15.7% 31.5%
Progress toward world-class sustainability
2009 2011
1=No progress 20.8% 11.3%
2 32.0% 27.1%
3 27.2% 34.2%
4 14.7% 22.2%
5=World-class 5.4% 5.3%
Source: 2011 Next Generation Manufacturing Study
What’s striking about the 2011 Next Generation Manufacturing Study (NGM) findings is that 97 percent of companies at or near world-class sustainability believe the strategy is highly important or important vs. just 45 percent of firms furthest from world-class status — indicating a clear correlation between intent and performance. This world-class sustainability grouping also helps to identify best practices that drive improved energy management and results of those efforts:
Company-specific strategy: 89 percent of companies at or near world-class sustainability have a
company-specific sustainability strategy, compared to 31 percent of companies furthest from world-class sustainability.
Business systems and equipment: 90 percent of companies at or near world-class sustainability
have business systems and equipment that are either adequate for current sustainability requirements or state-of-the-art and able to provide long-term support, compared to 43 percent of companies furthest from world-class sustainability.
11 Next Generation Manufacturing Study, The MPI Group, 2009 and 2011.

January 2012
Industrial Energy Management — Market Research Report Rockwell Automation
© 2012 Rockwell Automation 9
Energy reductions: 35 percent of companies at or near world-class sustainability annually
reduced energy per unit of product by 10 percent or more, compared to 13 percent of companies furthest from world-class sustainability. 12
The NGM Study findings show that many companies want to know exactly where valuable energy is being used, and they indicate that they are working to develop the tools and practices to better manage usage. Their comments also indicate willingness, based on their technology and equipment investments, to track and improve energy usage. One trend is to capture energy usage within the production bill of materials (BOM). The production BOM serves as a checklist for everything needed to make and deliver a product, so why not include energy-use and environmental-compliance criteria? With visibility of energy usage in the BOM, companies can predict usage and leverage price incentives for load management — energy goes from being a “cost of doing business” to a “cost of goods sold (COGS).” But how does a company begin to progress from a state of business as usual (energy as an unavoidable cost) to one of energy management (energy as a cost of the good, which can be managed in response to product attributes, energy supply, and energy-market dynamics)? As the NGM Study data show, a first step is to recognize the criticality of this effort and elevate it to a strategic objective within the organization. Only after energy management becomes strategy can a company then cascade the objective across the organization and into tangible goals/targets for business units, plants, processes, and product lines:
How will a specific production facility contribute to achieving the corporate energy-management objective? What is its share of the energy pie?
What existing automation can be leveraged at the site to enable energy visibility and
control? What power-control investments and resources will be required?
How will management know that energy inefficiencies and waste are being minimized or eliminated? What is the assessment plan for the facility — starting out and going forward?
Organizations should embark on an energy-management path. First, identify and resolve pressing problems and work to get out-of-control issues in hand. This initial phase will bring modest gains, and spur action to identify long-term improvements and put in place the means to reach those objectives (practices, resources, equipment, etc.). Given the myriad opportunities to manage energy and its contribution to cost of goods sold, it helps to have an energy-management framework in place for progressively achieving improvements through existing and key new investments. 12 Ibid.

January 2012
Industrial Energy Management — Market Research Report Rockwell Automation
© 2012 Rockwell Automation 10
2. Energy Awareness The first stage in the Industrial GreenPrint™ methodology for energy management is to establish a documented view of WAGES usage at facility, production, and, eventually, product levels. Surprisingly, many organizations lack the skills, technology, or incentives to monitor and evaluate energy usage at even a facility or site level. Without seeing and assessing facility energy-usage data, these firms are unlikely to reduce costs via improved energy consumption — and even less likely to take the more analytical and beneficial steps of examining energy usage of equipment, lines, work areas, and by SKU. Energy awareness lays the cornerstone for ISO-50001 compliance, the framework for industrial plants, commercial facilities, and entire organizations to manage energy; the standard was published in June 2011, and ISO estimates it will have a positive impact on as much as 60 percent of the world’s energy use. Yet many companies remain on the energy-management sidelines, their inability to grasp energy monitoring driven by a one-dimensional view that industrial energy consumption is an “unavoidable” cost of doing business, and so they:
Treat energy consumption from the “outside in,” looking at consumption within their facility as a lump cost.
Allocate energy costs evenly across a facility based solely on square footage, process unit, or similar measures.
Accept high energy bills as overhead.
By failing to see other dimensions of energy usage, they fail to leverage energy management to their financial benefit. And without routine, consistent monitoring at the facility, production, and product levels, few if any gains will ever occur — if you don’t measure it, you won’t improve it. Facility monitoring Companies should be monitoring and assessing facility-level energy consumption to know a facility’s energy demand and environmental impact over a period of time, and how that demand (and costs associated with it) vary by what’s occurring in the plant. Even simple, spreadsheet-based models for facility monitoring can offer benefits at the outset. A number of U.S. government programs also help manufacturers to get out of the starting blocks:
The Energy Star program offers an Energy Program Assessment Matrix to help organizations compare their energy-management practices to Energy Star guidelines, as well as a Facility Energy Assessment Matrix to help evaluate energy management at facilities.13
13 Energy Star, U.S. Environmental Protection Agency, U.S. Department of Energy, www.energystar.gov.

January 2012
Industrial Energy Management — Market Research Report Rockwell Automation
© 2012 Rockwell Automation 11
The U.S. Department of Energy conducts Industrial Technologies Program (ITP) Save Energy Now® energy assessments. Save Energy Now is a national initiative that aims to drive a reduction of 25 percent or more in industrial energy intensity in 10 years.14
ITP also works cooperatively with Save Energy Now® ALLY Organizations to expand industry
access to resources and accelerate reductions in industrial energy intensity. ALLY Organization members consist of U.S. trade associations, suppliers, utilities, state organizations, universities, nonprofit organizations, consultants, and other groups. Rockwell Automation, which has assisted companies with Energy Star profiles, is an ALLY Organization.15
The U.S. Council for Energy-Efficient Manufacturing (U.S. CEEM) runs the Superior
Energy Performance (SEP) initiative, which is intended to foster an organizational culture of continuous improvement in energy efficiency; develop a transparent system to validate energy-intensity improvements and management practices; and create a verified record of energy savings and carbon emission reductions with potential market value that could be widely recognized both nationally and internationally.16
Yet these programs only scratch the surface of what companies can learn about their energy-consumption habits; over time, industrial leaders develop systems that offer real-time visibility into the quantity and quality of energy usage. With ongoing plant-level monitoring, management will collect, time-stamp, and store live data for all energy resources — water, air, gas, electricity, steam — relative to equipment usage and environmental conditions. Once housed, management can evaluate trends in usage (peak periods by hour, day, month) as well as the quality of the energy consumption: Did peak consumption correspond with peak output or high quality and productivity, or was the consumption indicative of waste in the facility? Trending data also enable a firm to establish internal benchmarks, critical for improving energy usage. For example, 81 percent of manufacturers report that they had reduced energy consumption per unit of product output over the past year by less than 10 percent. Just a handful of companies reported superior energy-management performance: 1 percent reduced energy consumption per unit of product output by more than 25 percent. The inability to secure deeper energy reductions is typical of most industries (Figure 2.1).17 14 Save Energy Now, U.S. Department of Energy, Energy Efficiency & Renewable Energy, Advanced Manufacturing Office, www1.eere.energy.gov/industry/saveenergynow. 15 Ibid. 16 Achieving Superior Energy Performance, www.superiorenergyperformance.net. 17 2011 Next Generation Manufacturing Study, The MPI Group, September 2011.

January 2012
Industrial Energy Management — Market Research Report Rockwell Automation
© 2012 Rockwell Automation 12
Figure 2.1: Annual reduction in energy per unit of product output
<10% 10-25% 26-50% >50%
Food Manufacturing 73.3% 23.3% 3.3% 0.0%
Paper Manufacturing 73.7% 26.3% 0.0% 0.0%
Chemical Manufacturing 87.0% 13.0% 0.0% 0.0%
Plastics and Rubber Products Manufacturing 80.0% 17.5% 2.5% 0.0%
Nonmetallic Mineral Product Manufacturing 88.9% 11.1% 0.0% 0.0%
Primary Metal Manufacturing 75.6% 19.5% 2.4% 2.4%
Fabricated Metal Product Manufacturing 81.6% 17.7% 0.7% 0.0%
Machinery Manufacturing 86.6% 11.8% 1.6% 0.0%
Computer and Electronic Product Manufacturing 87.2% 11.6% 1.2% 0.0%
Electrical Equipment, Appliance, and Component Manufacturing
78.6% 21.4% 0.0% 0.0%
Transportation Equipment Manufacturing 86.8% 13.2% 0.0% 0.0%
Furniture and Related Product Manufacturing 58.3% 37.5% 4.2% 0.0%
Miscellaneous Manufacturing 86.7% 13.3% 0.0% 0.0%
No description available 70.0% 25.0% 5.0% 0.0%
Total 81.2% 17.4% 1.3% 0.1%
Source: 2011 Next Generation Manufacturing Study. Grouped by primary product per North American Industry Classification System (NAICS) codes for industries with 15 or more companies responding.
Without a big-picture view of energy consumption, it’s impossible to affect even these basic measures of energy per unit of production. In contrast, companies with access to good consumption data can correlate energy use to their operations, thereby beginning the process of estimating the amount of energy used for various products or outputs. This simple improvement can drive dramatic production changes. For example, a company operating a liquid-blending application might use a series of pumps that run continuously at 7 to 8 megawatts (MW). On a day with low production targets, personnel decide to perform a routine maintenance task that requires activating a set of backup pumps. For approximately 45 minutes, both sets of pumps operate during the changeover process, pushing energy consumption from 8 MW to 13 MW. If this routine maintenance occurs during the peak-demand window, peak-penalty charges will be incurred. Over the course of a year, these charges alone can equal a month’s profit. Overall historical data allow facility management personnel to make operational changes to reduce energy consumption and costs, such as shedding loads or lowering power levels for a few minutes when the facility is approaching peak use. Historical data also permit management personnel to manage power-quality issues, such as voltage sags or harmonics, thereby saving thousands in damaged machines or poor-quality product coming from those machines, and avoiding penalty fees associated with power-factor problems on the energy grid.

January 2012
Industrial Energy Management — Market Research Report Rockwell Automation
© 2012 Rockwell Automation 13
Companies lower energy usage through scheduling production intelligently (e.g., timing of equipment changeovers) and use of more efficient equipment or design improvements (e.g., reuse of waste heat). They can leverage technologies, such as variable-frequency drives and power-control devices, energy-efficient components, and advanced motion-control solutions (e.g., servo motors and direct-drive technology) to significantly reduce the amount of energy required to power their processes. Executives staring at blank energy-management worksheets — i.e., no reliable information on plant-level energy usage — need to establish an ongoing program of audits and assessments, even if these begin as simple walk-arounds. Walk-arounds identify where quick returns are likely to be found, target key metrics to monitor, establish preliminary goals for facility improvements, and generate ideas to improve monitoring (Figure 2.2). Recommendations may include low-investment modifications, such as shifting maintenance operations to nonpeak times, or may be more complex, such as programming changes to equipment or the purchase of new equipment and control devices.

January 2012
Industrial Energy Management — Market Research Report Rockwell Automation
© 2012 Rockwell Automation 14
Figure 2.2: Initial energy and environmental audit targets
Energy source Measure External factors Opportunities/recommendations
Electricity Usage by period (hour, shift, day, etc.)
Usage per output
Peak pricing periods Penalty issues
Weather
Production flexibility/allocation Maintenance scheduling flexibility
Capex options
Petroleum Usage by period (hour, shift, day, etc.)
Usage per output
Peak pricing periods Supply volatility Pricing volatility
Weather
Evaluate energy alternatives Capex options
Natural gas Usage by period (hour, shift, day, etc.)
Usage per output
Peak pricing periods Supply volatility Pricing volatility
Weather
Evaluate energy alternatives Capex options
Coal Usage by period (hour, shift, day, etc.)
Usage per output
Peak pricing periods Supply volatility Pricing volatility
Weather
Evaluate energy alternatives Capex options
Renewables Usage by period (hour, shift, day, etc.)
Usage per output Incentives Weather
Capex options Applicability to operations
Water Usage by period (hour, shift, day, etc.)
Usage per output
Supply volatility Pricing volatility
Incentives Weather
Capex options
Other (compressed air, geothermal)
Usage by period (hour, shift, day, etc.) Usage per output
Incentives Weather
Production flexibility/allocation Improvements via maintenance
Capex options Applicability to operations
Environmental impact
VOCs per output Carbon emissions per output
EPA warnings/violations Emerging regulations
Capex options
Production monitoring Plant-floor visibility of energy usage and quality must become ever more targeted and granular to achieve optimal energy-management performance. This means collecting, storing, and assessing data on energy usage and environmental impact by line, area/cell, and machine. Companies addressing energy usage at this level develop a more refined (and more cost-effective) perspective of the energy quality of their operations. Just as operating equipment efficiency/effectiveness (OEE)18 tells how well equipment effectively produces goods, an energy component can be factored in as well — OEEE. For example, production staff may push a piece of equipment beyond its optimal run rate, and the piece of equipment could still be 1) running and 2) producing good parts. Yet the machine’s energy consumption may be high because scheduled maintenance has been delayed (i.e., a less efficient machine in operation) or, by exceeding machine performance parameters, creates excessive energy draw. The tradeoff between energy costs and making more parts may not be worth it.
18 Performance metric calculation: % machine availability X % quality yield X % of optimal run rate.

January 2012
Industrial Energy Management — Market Research Report Rockwell Automation
© 2012 Rockwell Automation 15
A majority of facilities already track OEE; 60 percent of plants reported OEE metrics for the 2011 MPI Manufacturing Study. As monitoring OEE data helps achieve performance improvement (Figure 2.3)19, so, too, could energy efficiency be improved. Figure 2.3: Operating equipment efficiency (OEE)
U.S. plants International
plants Total plants
OEE: Current year
Median 80.0% 83.5% 80.0%
Average 75.6% 79.4% 76.7%
OEE: Three years ago
Median 75.0% 70.0% 75.0%
Average 71.1% 70.7% 71.0%
Source: MPI Manufacturing Study, 2011
Not surprisingly, as more data are collected within a facility, it becomes increasingly challenging to capture and leverage this information manually. A walkthrough audit may work for the initial steps of facility monitoring, but imagine staff trying to apply this approach to many pieces of equipment and production lines. Improved tracking typically requires dedicated resources. But note that not all equipment or lines initially require around-the-clock monitoring. Working with maintenance and/or an automation-solutions provider can help a company target those machines and processes with the heaviest and most variable energy usage, establishing these first-priority locations as data-collection points and programming information systems to store and analyze that data. As an organization becomes more sophisticated in its approach to production monitoring, more lines and equipment are added, including those where initial productivity gains seemed modest but where additional efficiencies can be achieved as conditions change. For example, production monitoring usually evolves as machine OEMs bring new products to market, as the OEMs learn how equipment performs under different situations and within certain industries and facilities. Indeed, many companies with newer equipment are already collecting data useful for energy management in their control and information systems (e.g., food or life sciences companies may be collecting this information for regulatory reasons). However, most plants still do not leverage these data for energy-management purposes, and allow this crucial information to be overwritten in their equipment controllers. Sophisticated production monitoring will review energy-usage data in the context of operations metrics (as with OEE); plants pull in information to identify product quality, startup problems, or 19 2011 MPI Manufacturing Study, The MPI Group, December 2011.

January 2012
Industrial Energy Management — Market Research Report Rockwell Automation
© 2012 Rockwell Automation 16
power surges. Micromonitoring also allows them to track and project energy expenditures according to actual use throughout the facility, providing the ability to separate plant-floor consumption data from facility consumption data, such as energy usage in offices, data centers, or warehouses. Energy-usage information is best viewed within a reporting dashboard, which allows a plant manager to pinpoint variable energy costs on the plant floor and evaluate ways to improve profitability. For example, a production-monitoring system could alert a plant manager to excessive heat and friction in critical machines caused by insufficient lubrication, a big contributor to unnecessary energy consumption. Plant managers also may notice that motors or compressors never surge or approach peak usage. That’s generally perceived as good, but also indicative of equipment that is oversized — i.e., even though energy usage is stable on that piece of equipment, it could be lower with a properly sized motor. It’s not unusual for production monitoring to influence machine design practices that affect energy management, such as specifying motors in variable power ranges as well as advising on the type and location of monitoring devices to assist with data collection. Energy savings (and cost-effectiveness) increase as companies begin to evaluate the data coming from their equipment, establish energy-usage patterns, categorize problems, and ask questions to get at root causes. With the right data in hand, solutions can be simple (lubricant) or they may involve more complex equipment and organizational changes. For example, if equipment operators are evaluated based on their ability to produce high volumes, these employees will be driven by that structure to simply produce more; they’re not likely to consider energy consumption. But just as a manager can program equipment with manufacturing execution systems (MES) to prohibit operators from turning on equipment they’re not qualified to operate, a manager also can program equipment to shut down when a peak-demand period is approaching, preventing the operator from running the equipment and incurring penalty fees. Product monitoring As companies move forward in assessing energy usage at a production level, they ultimately need to know more than how a plant or piece of equipment consumes energy. They need a detailed understanding of how energy is consumed relative to each product — an overview that, not surprisingly, requires far more granular energy-consumption data than is typically collected. Similar products or materials can have completely different energy-consumption profiles, even when being produced on or processed from the same piece of equipment. This level of data capture allows managers and engineers to more accurately evaluate past energy consumption and prepare future production schedules. You can’t manage what you can’t measure. This adage is at the root of improvement methodologies, including Lean Manufacturing. Indeed, a first phase in many Lean deployments is to map the flow of

January 2012
Industrial Energy Management — Market Research Report Rockwell Automation
© 2012 Rockwell Automation 17
product and information as goods move through a company and out to customers. For each process step along the way, information and the extent of value-added work is recorded, as well as the amount of “waste” that occurs (e.g., an operator waiting for parts to arrive). Lean proponents typically categorize seven wastes (e.g., overproduction, waiting, conveyance, processing, inventory, motion, correction20) that don’t add value to an end customer. Minimizing these wastes allows a company to increase the proportion of value that their processes deliver — and to increase margins. Over the years, some companies have added an eighth waste — the failure to tap employees’ unused knowledge, creativity, and problem-solving capabilities. Today, energy has emerged as a ninth waste, and, like the others, the objective is to identify and minimize it. “Traditionally, the direct identification of energy-efficiency opportunities has not been a part of the Lean process, but rather a peripheral capture gained in the effort to reduce other wastes like time and materials. The energy costs used in the manufacturing processes, however, have historically comprised such a small portion of the total cost that it has not factored in as a separate ‘waste’ to be managed through the Lean process. Recent energy price spikes, price fluctuations, and the certainty of more to come have placed energy as a central resource when considering more cost-effective industrial production changes.”21 Many companies believe they’re tracking product energy by only calculating energy per unit of product output (monthly, quarterly, or annual energy consumption divided by the number of products or batches produced). This method only works — and even then only approximately — in repetitive, low-mix production environments with few product changeovers. But without addressing energy variables such as peak-demand usages, it’s impossible to see how energy was consumed (or could have been minimized) when actually producing product. Agile companies running a range of products need the capability to see energy usage per product, per machine, per line as it is consumed. Similar to efforts in identifying other wastes, managers must “go to the gemba” — where the work occurs — and observe energy consumption at the most granular level possible. Only by capturing product-specific energy data where it occurs can managers determine the energy required to bring a given product to market — and the true overall costs of that product.
The ability to actively manage energy consumption by product allows manufacturers to improve corporate citizenship and profitability. California Portland Cement (CPC), an Energy Star partner since 1996, has used data-archiving systems to monitor energy performance at its plants since the 20 Lean Lexicon, Fourth Edition, edited by Chet Marchwinski, John Shook, and Alexis Schroeder, Lean Enterprise Institute, March 2008. 21 Michael Sciortino and Suzanne Watson of the American Council for an Energy-Efficient Economy, and Rosemary Presnar of Maine Manufacturing Extension Partnership, The Importance of Energy Efficiency in Lean Manufacturing: Declaring Energy the Ninth Waste, Summer 2009.

January 2012
Industrial Energy Management — Market Research Report Rockwell Automation
© 2012 Rockwell Automation 18
mid-1990s. CPC monitors power consumption and fuel usage per unit of production at each phase of production, and the data are examined at a corporate level in quarterly cost-review meetings. By 2006 the company had received numerous local, state, and national awards for its energy-reduction efforts, attained more than $3 million in energy-cost savings, and reduced process emissions since its broad-based energy-management program was formed.22 “In 2007, CPC continued its energy-reduction trend by cutting energy intensity by 2.5 percent from 2006 levels for a savings of nearly 363 trillion Btu. This savings reduced CO2 emissions by 34,366 metric tons, which is the equivalent of providing electricity to 4,644 American homes.”23
22 Steve Coppinger, “Proactive Energy Management at California Portland Cement,” Reliable Plant, Summer 2006. 23 “California Portland Earns EPA’s Energy Star® Sustained Excellence Award,” PCA Executive Report, Portland Cement Association, March 24, 2008.

January 2012
Industrial Energy Management — Market Research Report Rockwell Automation
© 2012 Rockwell Automation 19
3. Energy Efficiency It’s not enough to simply collect energy-consumption data about what machines require and what products consume as they’re produced. Savvy, energy-conscious companies react to internal and external conditions, coordinating their collected data in real time with equipment and processes to capture energy savings. Companies use automated decision-making to control production, energy usage, and emissions, and then coordinate production decisions with external market factors to improve energy efficiency. During this stage of the Industrial GreenPrint™ methodology, companies make incremental and proactive behavioral, control, and equipment improvements (e.g., devices to transmit energy data in real time). They automate their decision making (without management/employee intervention) to allow real-time production tradeoffs among customer demand, corporate objectives, and energy expenditures. And they begin to implement forecasting, load aggregation, and rate analysis exercises, which allow them to coordinate internal production requirements and production schedules with external energy markets. Controlling production Few facilities operate “lights out” (i.e., running without any human intervention), but thousands of plants rely heavily on automated equipment and processes. Many production environments couldn’t exist any other way. Yet automation often requires equipment to follow strict scheduling and routines, with few changes to accommodate different parts or products. During a single shift, production modifications may only occur to resolve abnormal conditions that threaten product quality or plant safety (i.e., the equipment stops, and maintenance intervenes). Now automation assumes a new critical role in improving operations, influencing not only safety and OEE (quality, yield, and uptime) but energy consumption as well. Making WAGES information visible via internal dashboards keeps managers and workforces focused on capturing further energy-management improvements and accrues significant cost, compliance, and performance benefits. But without regular measurements, reviews, and revisions — systematic PDCA (plan, do, check, adjust) — efforts to continuously improve lose organizational benefit. Visible and actionable WAGES data ensures a PDCA cycle that allows the workforce to constantly see and resolve issues. It’s especially important to secure ongoing gains because improved management of energy consumption won’t necessarily deliver sudden, substantial improvements. Energy management is a marathon, rather than a sprint, with savings measured in hour-to-hour and day-to-day increments: When and why did a machine exceed typical energy draw? Why did an equipment changeover cause startup surges? Why did a component change extend the production cycle into a peak-draw period?

January 2012
Industrial Energy Management — Market Research Report Rockwell Automation
© 2012 Rockwell Automation 20
Visibility is the only practical way to keep track of conditions (successes and failures) and to gauge the effectiveness of practices, processes, devices, and equipment in minimizing energy consumption. But unlike PDCA cycles based on human observation and intervention — involving managers and team members that perform the activities of plan, do, check, and adjust — the key to energy improvement lies within the streams of data running to, through, and from equipment. Process automation supercharges PDCA energy management. “Plants are using process automation for increased energy efficiency,” Larry O’Brien, research director at ARC Advisory Group Inc., told Automation World magazine. “Most end users don’t think of their automation as a platform for optimizing energy, but we’ve seen integration between energy systems and control that’s very successful.”24 To make this happen, industrial technologies, such as variable-frequency drives (VFD) and servo and linear-motion devices, are necessary to transfer energy intelligence into energy-usage action. VFDs, as an alternative to fixed-speed controllers and throttling devices, improve operating performance, control capability, and energy savings by:
Avoiding peak demand charges: Ramp motors up to speed gradually during times of peak demand.
Optimizing power in relation to load: Use the precise (i.e., not excess) amount of energy required by the equipment to fulfill demand.
Generating energy: Many VFDs are capable of regenerating power, which can then be routed back to the system or sold to utilities.
Optimizing performance: Intelligent motor controls integrate advanced networking and diagnostic capabilities to optimize performance, increase productivity, and reduce energy use.25
Machine builders are well aware of customers’ interest in sustainability and energy reduction; many are modifying existing equipment to incorporate VFDs and other technologies, or they are developing new equipment that supports energy-efficiency initiatives. These technologies allow companies to utilize the data sets provided by their energy audits and production software applications, such as manufacturing execution systems (MES), which enable an automated solution to control production and energy usage. Accurate data is the key, as production processes and equipment adjust to achieve optimum productivity as well as energy-usage requirements in response to:
Ambient temperatures, humidity, and other environmental factors; Equipment stress, maintenance schedules, and changeover requirements;
24 Rob Spiegel, “Automation Controls Energy Consumption,” Automation World, March 2010. 25 “Energy Frequency with Variable Frequency Drives,” Rockwell Automation, December 2007.

January 2012
Industrial Energy Management — Market Research Report Rockwell Automation
© 2012 Rockwell Automation 21
Product specifications with varying energy demands; Real-time energy draw across production; and Emissions-credit limitations.
For example, what happens if a plant manager receives an urgent customer request as the facility approaches a peak-energy window and equipment is overdue on its maintenance? How can the manager balance competing priorities and still efficiently satisfy customers and maintain reasonable levels of productivity? Automated solutions resolve these problems — minimizing energy consumption while meeting customer demand — by rescheduling maintenance to the nearest schedule window while reducing energy usage elsewhere in the plant by drawing down noncritical processes and equipment. Allen Avery writes in an ARC Advisory Group report: “A willingness to apply state-of-the-art information and automation technologies can have a major impact on the success of energy-management programs. Applications such as advanced process control, energy-management software packages, and decision support can be used to optimize processes and coordinate energy-management activities across functional areas in the plant. Judging from our survey, Leaders [a benchmark set of high-performing companies] are more likely to apply new technologies to the problem of energy management and to invest in technology upgrades such as boiler control systems, digital control systems, and intelligent field devices. They are also more likely to leverage information technology to collect, manage, and analyze energy-management information… Leaders also try to envision ways to fundamentally change the process itself to reduce energy consumption, and are more willing to put their R&D departments to work on the problem.”26 A benchmark study by the Aberdeen Group found that “best-in-class” companies are more likely to have implemented technology to manage energy: energy management/intelligence, carbon management, emissions systems/analysis; and alert/event management. Best-in-class companies also are more likely to collect energy data automatically and in real time, gathering information from sub-meters and plant automation (programmable logic controllers, distributed control systems, supervisory control and data acquisition systems).27 Automated data collection and management, combined with the use of motor controls and VFDs, then allows manufacturers to make incremental changes in how processes and equipment operate — slowly ramping up machines — with all these small changes adding up to millions of dollars in energy-consumption savings. “Motor-driven equipment accounts for 64 percent of the electricity consumed in the U.S. industrial sector. Within the nation’s most energy-intensive industries — which are the focus of [the Industrial
26 Allen Avery, “Best Practices for Energy Management,” ARC Best Practices, ARC Advisory Group, January 2009. 27 Nuris Ismail, “Energy Intelligence: Driving Optimization with Visibility,” Aberdeen Group, July 2011.

January 2012
Industrial Energy Management — Market Research Report Rockwell Automation
© 2012 Rockwell Automation 22
Technology Program’s] Industries of the Future strategy — motor systems consume approximately 290 billion kWh per year. In these industries alone, improvements to motor systems could yield dramatic energy and cost savings. The key to these savings is applying energy-efficiency equipment or implementing sound energy-management practices.”28 Intelligent motor controls — such as variable-frequency drives (VFDs), intelligent software, and a networked motor control center — provide an immediate, measurable, and sustainable impact on energy use and operational efficiency by improving the efficiency of how energy is delivered to start and run motors. For example, chemical developer Amtex modernized a Colombia facility that produces thousands of tons of anionic polymer. Among the plant’s problems were rising energy consumption and production downtime. Amtex installed VFDs with soft-starting capabilities and was able to increase production, slash electricity usage, and reduce maintenance frequency and mechanical wear.29 The La Union S.A. sugar mill in Guatemala uses waste energy to produce power for its factory. In 2002, La Union replaced its steam turbines with more efficient electrical motors and variable-speed AC drives in its boiler fans and pumps. After five years the new drive system had provided 1,420 kW of electrical power, with the same 23,000 lbs. of steam, for additional revenue of $158,480.30 “At the end of the day, it’s your understanding at the sensor level and the historian level that lets you tweak for efficiency,” says Simon Jacobson, research director at Gartner Research Inc., Boston. “Control vendors are using modeling and visualization to get the most out of their equipment.”31
28 “Best Practices: Motors, Pumps, and Fans,” Industrial Technologies Program, U.S. Department of Energy. 29 “Energy Control Drivers Energy Management and Sustainability,” Automation Today, Asia Pacific, March 2010. 30 “Energy Frequency with Variable Frequency Drives,” Rockwell Automation, December 2007. 31 Rob Spiegel, “Automation Controls Energy Consumption,” Automation World, March 2010.

January 2012
Industrial Energy Management — Market Research Report Rockwell Automation
© 2012 Rockwell Automation 23
4. Energy Optimization Energy management truly becomes proactive when companies model, simulate, and analyze energy as an economic variable in coordination with energy-compliance criteria and production requirements. WAGES information gets codified on production bill of materials as an input, factored into strategies from product ideation to product delivery, and companies increase profitability and improve the total cost of ownership of operational assets. Modeling production leverages collected WAGES data and taps into production metrics, regulatory reports, and climate data. For example, firms model energy-cost data with production energy demands, and select optimal energy options at the optimal times during a day or shift: a spike in natural gas prices triggers an alert to rely on alternative energies or facility-generated power. Sophisticated control systems also can incorporate emissions data into modeling algorithms and direct production to use non-emissions-generating energy sources when emissions credits are nearly depleted. Energy-usage data at a product or SKU level offers new opportunities to improve energy management, but that alone is like driving a car by looking in the rear-view mirror. That view shows where you’ve been but offers little help navigating what’s ahead. A predictive dashboard provides visibility into conditions ahead and proactive strategies for managing energy-specific production decisions every minute of every day. Imagine taking all historical energy data — per product, per machine, per line, per facility — and using it to model future facility behaviors. The captured what-is data enables what-if modeling perspectives. Modeling is not new; many companies model how their supply chains function, determining the right combinations of suppliers, carriers, and logistics techniques to bring goods and materials to market in the most efficient manner. At a plant level, modeling examines the right combination of labor and equipment to produce goods. Until recently, energy wasn’t a part of modeling, either within simple mapping exercises or more advanced software simulations. With product-specific energy-usage data available, modeling can incorporate energy criteria to predict the real total cost to produce, pairing energy information with other production variables. Using software simulation tools, production managers can input variables — peak and off-peak energy costs, equipment requirements, raw material costs, labor, projected emissions, overhead, product delivery scheduling — and then test what-if scenarios to see how production outputs and costs (including energy) will change as a result of modifications. Modeling with software simulators helps companies deal with multiple data inputs, providing a way to effectively manage all events in variable and complex production processes. It also enables a production manager to weigh characteristics and incorporate as much information as possible to minimize the chances of flawed analysis and poor decision-making. Spreadsheet calculations simply

January 2012
Industrial Energy Management — Market Research Report Rockwell Automation
© 2012 Rockwell Automation 24
cannot deal with multiple, changing variables — production is not a fixed equation at a single moment, but a constantly changing flow of variables across time. By modeling, companies can simulate process and equipment behaviors by utilizing statistical distributions that the processes and systems mimic. The simulation can then randomly sample those distributions to create events in the system (customer arrival, failure events, etc.) or the duration of an individual event (process time, failure downtime, etc.). These events are then “scheduled,” allowing staff to look at how the system performs over time. The power of simulation is that it allows a user to account for these event interactions and evaluate their effects on the performance of the system, including energy consumption. With modeling, companies forecast the most economical way to produce — including energy costs — coordinating production assets and testing production schedules, including product sequencing and changeovers. For high-mix operations with numerous one-off product runs, this capability is crucial, allowing them to visualize production schedules based on many variables — energy, labor, equipment, raw materials — without needing to run physical production tests, which always incur scrap and, because of their limitations, can result in erroneous production sequences. Modeling allows companies to forecast:
Production burdens: What is the likelihood that a production schedule will push energy volumes into peak-power periods and become an energy burden? What adjustments can be modeled to maximize production during off-peak-power windows? These same questions will be coordinated with burdens on equipment (e.g., increased potential for scrap and rework as OEE declines) and labor (e.g., overtime and operator burdens that can drive up costs and drive down quality).
Capacities: Sometimes no amount of modeling will enable a facility to efficiently schedule
production and eliminate excessive burdens on energy, equipment, and/or labor. When models show the drain on internal resources to be too great, external options (outsourcing) can be incorporated. Given the extent that facilities outsource at least a portion of their functions, this modeling view is critical. Internal vs. external modelings also help build evidence for plant expansions or the development of new facilities.

January 2012
Industrial Energy Management — Market Research Report Rockwell Automation
© 2012 Rockwell Automation 25
5. Energy Aggregation Modeling provides insights into WAGES consumption that allows companies to react to production conditions and then simulate and implement energy-efficient production strategies. Aggregation integrates data with enterprise resource planning (ERP)-level information, such as production output data, and incorporates energy on the bill of materials — WAGES data brings value to the entire business beyond production. For example, aggregation enables review of product portfolios and market opportunities, examining how potential products can be produced (along with their cost structures). This can lead to more effective pricing for new products (e.g., revise an existing product to reduce input variables and costs) and an improved product pipeline (e.g., eliminate products that exceed reasonable cost structures). Embedded energy information also allows manufacturers to proactively respond to external energy conditions. Companies that aggregate and evaluate energy requirements in a full business context make more informed decisions for resource planning, scheduling, product portfolios, and allocation of assets across their networks of facilities; they gain greater returns on their resource expenses. Aggregating to the BOM Most companies currently track the material and labor that go into a product, rolling those component costs into a cost of goods sold (COGS) figure. An energy component also can be incorporated into COGS as well as appear on the BOM (or for process industries, into the recipe or list of ingredients) along with parts, part numbers, specifications/compliance standards, suppliers, assembly documentation, equipment requirements, pricing. Companies manage energy as if it’s a raw material — a manageable, documented input to production — and identify how much energy each production load requires and plan energy costs in advance. With energy-consumption data in the BOM, a company continuously builds a repository of energy-usage information related to specific products and batches. This repository allows operations leaders and facility managers to analyze in real time what’s occurring and spot trends, as well as apply this information to more advanced product-specific modeling. Energy usage for a given product, batch, or SKU also can be cross-examined alongside the equipment used to produce it, building unit-level consumption comparisons (e.g., which product runs most efficiently on which machines or in which facilities). BOM energy-consumption data also offer insights into corporate strategy and planning for:
Product development: Product engineers use WAGES data to evaluate similar products with varying energy-consumption requirements, determining which product gets the green light;

January 2012
Industrial Energy Management — Market Research Report Rockwell Automation
© 2012 Rockwell Automation 26
also, WAGES data allow product designers and sales engineers to more accurately define pricing parameters.
Capacity planning: Executives redistribute production to other corporate plants or contract facilities as peak-energy usage begins to escalate at current sites. This trending data can spur a company to explore outsourcing options.
Distribute energy: Operations leaders will increasingly assess energy as a finite resource, examining their production networks to determine where best to invest their energy dollars.
Capital investments: Operations executives incorporate energy data into their facility-network planning. For example, if a given site has a superior energy-usage track record for specific SKUs, and long-term demand for those SKUs is projected to increase beyond current capacity, a company might choose to expand the facility rather than move future orders elsewhere or build another plant.
Incorporating energy market data Aggregation of WAGES data ensures that energy-management strategies aren’t developed in a vacuum. Energy optimization requires coordination with external market and regulatory influences. External forces (volatile pricing and supply, greenhouse gas regulations, etc.) drove pursuit of energy-management principles, and companies can adjust to these conditions rather than see their margins damaged by them:
Adjust energy consumption based on energy-market fluctuations. Adjust energy consumption based on regulatory changes. Identify the availability of excess power (energy credits or internally generated energy) and
sell that power back to utilities or to the market. Revise production based on the changing values of emissions or efficiency credits. Leverage external data available via emerging smart-grid technologies.
The ability to manage energy consumption in direct response to energy supply and pricing volatility is critical to remain competitive. For example, from 1998 to 2008 (prior to the recession) the cost of fuels and electricity consumed by U.S. manufacturers rose from 1.63 percent of the value of shipments to 2.16 percent of value of shipments. By comparison, capital expenditures fell from 3.88 percent of value of shipments in 1998 to 3.07 percent of value of shipments in 2008, while annual payroll costs decreased by 4 percentage points (Table 5.1).32 What if dollars consumed by energy had been invested in equipment or workforces? 32 Annual Survey of Manufactures, 2008 and 1998; analysis by The MPI Group.

January 2012
Industrial Energy Management — Market Research Report Rockwell Automation
© 2012 Rockwell Automation 27
Table 5.1: Energy as Percentage of Value of Shipments
1998 2008
Value of shipments $3.91 trillion $5.47 trillion
Fuels and electricity costs $63.97 billion $118.27 billion
Fuels and electricity as % of value of shipments 1.63% 2.16%
Annual payroll $590.04 billion $607.45 billion
Annual payroll as % of value of shipments 15.07% 11.07%
Capital expenditures $151.90 billion $168.51 billion
Capital expenditures as % of value of shipments 3.88% 3.07%
Source: Annual Survey of Manufactures, 2008 and 1998 data; analysis by The MPI Group.
Many companies also turn energy into an asset by balancing generated power vs. purchased power and selling excess power back to the grid after accommodating production requirements. For example, BMW pipes methane gas nearly 10 miles from a landfill to its Greer, S.C., plant. Turbine engines convert the gas to electricity and thermal energy. “By recovering the waste heat from the turbines, the 11-megawatt combined heat and power project satisfies more than 60 percent of the facility’s thermal needs, as well as nearly 20 percent of its electricity use. To date, the project has saved the automaker an average of more than $5 million each year in energy costs.”33 An open market for electricity on the grid may require companies to plan for and purchase five-, 10-, or 15-minute blocks of energy use (another form of energy asset). By modeling production and correlating it to energy-consumption requirements, companies can predict whether or not they can reach production targets using less energy. If a manager sees, via predictive modeling, that the facility is likely to generate more energy than required, the procurement department can then sell remaining time blocks or kilowatt hours. Energy-management models can incorporate the changing market value of emissions or efficiency credits, and schedule production to cost-effectively utilize them as well. None of this happens, however, without aggregate WAGES data and the software and hardware that enable management to clearly see what’s happening within a facility as well as out on the markets — or without equipment that quickly reacts to those inputs. Craig Resnick, vice president, consulting, for ARC Advisory Group, told Managing Automation magazine that “manufacturers will be specifying collaborative production systems, consisting of platforms in which the controls-layer domains of process, logic, motion, building automation, and
33 “On-Site Generation: BMW Manufacturing Co.,” Options for Purchasing Green Power, U.S. Department of Energy, EPA Green Power Partnership, World Resources Institute, and Center for Resource Solutions, March 2010.

January 2012
Industrial Energy Management — Market Research Report Rockwell Automation
© 2012 Rockwell Automation 28
power-control systems converge with the information-layer domains of production management and MES systems. Collaborative production systems will become the industrial blade servers that provide full monitoring and control of enterprises, from offices to plant floors, sharing that information with supply chains to procure resources and purchase or sell power at optimal times and prices while providing financial metrics and KPIs to ERP systems to maximize profitability.”34 ARC Advisory Group also studied how plants optimize their purchases of electric power and balance energy-management efforts with internally generated power. ARC reports that when electric costs rise, those with internal resources maximize their use of homegrown energy; others try to reduce costs through contract management and/or by “modify[ing] production schedules to consume power when it is less expensive, a practice called peak shaving.”35 Allen Avery, an ARC analyst, writes that these firms “rely on automation to shift to internal sources as needed. One company [that ARC describes as an energy-management benchmark Leader] has an operations control center that monitors power continuously to choose when to buy power from the outside, generate it for internal use, or sell surplus power. The system is connected to relays that are armed to shut down equipment and switch power sources during periods when external power is more expensive.” Firms with internally generated power, ARC Advisory Group reports, have a variety of options. For example, one chemical company produces as much internal power as possible and sells the excess to the utility (no need to switch between external and internal power).36 Energy markets are beginning to install a technology infrastructure that readily provides external data to organizations, homes, and industry, which allows some companies to aggregate this with their WAGES data and energy-management initiatives. Rockwell Automation reports that its portfolio of sustainable production solutions could help companies save up to $6 billion a year, or about 10% of U.S. industrial electrical energy costs, by capitalizing on smart-grid initiatives with existing technologies.
“The manufacturing sector is responsible for almost a third of U.S. energy consumption, primarily by driving loads with electric motors,” said Sujeet Chand, chief technology officer for Rockwell Automation. “While recent smart grid demonstrations have focused on benefits to homes and commercial buildings, we look forward to working with manufacturers and electric power companies to save energy and reduce greenhouse gas emissions as industrial processes consume less electricity.”
34 Stephanie Neil interview of Craig Resnick, “Deep Dive: Expert Q&A: Where Building and Factory Automation Platforms Meet,” Managing Automation, May 2010. 35 Allen Avery, “Best Practices for Energy Management,” ARC Best Practices, ARC Advisory Group, January 2009. 36 Ibid.

January 2012
Industrial Energy Management — Market Research Report Rockwell Automation
© 2012 Rockwell Automation 29
Added Terry Gebert, vice president and general manager of Rockwell Automation Global Solutions: “Until now, manufacturers had to make decisions without knowing how energy directly affects their production costs and impacts the bottom line. By combining overall equipment effectiveness, a key performance indicator used by many manufacturers, with an energy model to create an energy blueprint — or greenprint — for any production process, we can develop a long-term strategy for smarter energy use.”37 Aggregation and the supply chain Aggregated WAGES data allow companies to anticipate and fulfill increasing customer and market demands for sustainability information and labeling. Customers — both commercial and consumer — want verification that goods and services have been designed, made, and delivered using sustainable practices, including energy management. Today environmental compliance regulations rapidly emerge by industry and country/region (e.g., EU 20-20-20 targets to reduce greenhouse gas emissions38), and customers apply sustainability standards on their suppliers (e.g., Walmart’s Sustainable Product Index, which will eventually turn production information into consumer-available sustainability ratings). Aggregated WAGES data assist companies with compliance reporting and provide market-advantage documentation to customers that demand proof of sustainability efforts (e.g., carbon footprints, water footprints). Advanced application of product-specific energy-consumption data enables a company to track the type of energy the product used. For example, a company that incorporates a renewable energy source into its operations, such as solar power, can capture time data for the product, compare it to energy in use at that time, and then report that the product was made using a specific percentage of renewable energy (that alone can be a powerful marketing advantage). Many companies are concerned about their readiness to meet “green” market pressures from customers and organizations. But savvy organizations recognize that tougher compliance standards and supplier rating systems offer a means to legitimize and publicize their internal energy-management and sustainability efforts. Access to aggregated WAGES data offers them the means to address rating systems and enhance brand and corporate image. Extending aggregation to suppliers Companies today rely on their supply chains for vast amounts of their value creation, and many firms must manage highly complex networks of supplier companies around the world and within multiple tiers. Energy-savvy organizations can take their aggregated WAGES data and use it to
37 “Smart-Grid Solutions Could Save $6 Billion Annually,” The Journal, Rockwell Automation, October 2009. 38 “The EU climate and energy package,” Europa, European Commission, April 2010.

January 2012
Industrial Energy Management — Market Research Report Rockwell Automation
© 2012 Rockwell Automation 30
examine their supply chains, documenting suppliers’ energy-management performances, sharing their best practices, and establishing a greener supplier network while also lowering their own material and component costs. Customers and markets are pressing companies for proof of their energy-management performances, so it’s no surprise that these same firms have established benchmarks for supply-chain partners, examine their sustainability progress, and build energy and environmental impacts into supplier criteria. For example, Johnson Controls, a global diversified technology and industrial company, developed an online sustainability questionnaire to assess suppliers’ human-rights records, working conditions, employee safety, and energy-management practices. The sustainability rating will be used to both evaluate individual suppliers and measure sustainability activity and compliance across the Johnson Controls supply base.39 Supply-chain energy management also forces companies to evaluate their strategies for supplier-network development. Lean organizations have long contended that simply selecting a “lowest-cost” bid for material and components ignores factors that can dramatically affect the “total cost” for material and components. For example, selecting a supplier in a low-cost country can add costs for shipping extended distances; customs and duties; managing the long-distance supplier relationship; heightened testing and evaluation procedures; market impact from inferior quality; and inventory carrying costs to buffer against delays due to shipping distances and supplier reliability. Energy-management practices should be addressed through a similar total-cost lens, assessing those low-cost countries and their impact on sustainability. For example, many popular outsourcing locations still use coal-generated power, creating less-than-enviable carbon footprints. Energy-conscious companies must similarly examine the materials and components they procure, determining if tradeoffs made in the purchasing department are negatively affecting energy consumption. These are challenging energy-management decisions, and without aggregation of energy-management knowledge, it’s impossible to make consistent evaluations: i.e., if a company doesn’t know how a certain material affects energy consumption for a specific product on a given line, how can it seek an alternative requiring less energy?
39 “Sustainability — supplier expectations,” Johnson Controls, www.johnsoncontrols.com.

January 2012
Industrial Energy Management — Market Research Report Rockwell Automation
© 2012 Rockwell Automation 31
6. Going Forward Industrial Energy Management highlights the overwhelming energy trends that are forcing industries to reassess how they view and consume WAGES (water, air, gas, electric, and steam). More important, this Rockwell Automation market research report offers a clear path and guidance — the Rockwell Automation Industrial GreenPrint™ methodology — that helps companies recognize and adjust to potentially damaging energy trends, and leverage existing and newfound capabilities for improved profitability and competitiveness. The efficacy of the Industrial GreenPrint™ methodology comes from its adaptability by companies of all industries, sizes, locations, and current energy-management capabilities. Regardless of where a company is in its energy-management practices, the Industrial GreenPrint™ methodology shows ways to move forward. Where are your energy-management practices today?
Energy Awareness: Do you know how much energy your plant consumes, and how it consumes it? To what extent are existing automation devices and systems used to obtain more granular WAGES data on resource consumption by machines and products?
Energy Efficiency: Are you using energy-consumption data to make proactive behavioral,
control, and equipment improvements? For example, can you forecast energy loads given future production schedules, or incorporate energy-rate projections into production planning?
Energy Optimization: Can you simulate energy consumption for your plants, lines,
machines, and products, creating models that clearly show decision-making to minimize energy consumption, optimize assets, and improve productivity and profitability?
Energy Aggregation: Have you established an exhaustive storehouse of WAGES
information and production output data that can be leveraged enterprisewide, by all departments and functions? For example, does energy management inform product development, supplier selections, capital investments, regulatory reporting, etc.?
Where do you want your energy-management practices to be tomorrow, next year, and in the next decade?

January 2012
Industrial Energy Management — Market Research Report Rockwell Automation
© 2012 Rockwell Automation 32
Rockwell Automation Contacts Mary Burgoon Tel: 414.382.2134 Email: [email protected] Nigel Hitchings Tel: 508.357.8404 Email: [email protected] Rockwell Automation Rockwell Automation, Inc. (NYSE:ROK), the world’s largest company dedicated to industrial automation and information, makes its customers more productive and the world more sustainable. Headquartered in Milwaukee, Wis., Rockwell Automation employs about 21,000 people serving customers in more than 80 countries.