Industrial Development Report 2020
228
Industrializing in the digital age Industrial Development Report 2020
Transcript of Industrial Development Report 2020

Industrial Developm
ent Report 2020 Industrializing in the digital age
Industrializing in the digital age
Industrial Development Report 2020
Industrializing in the digital age
Industrial Development Report 2020

Copyright © 2019 United Nations Industrial Development Organization
The designations employed and the presentation of material in this publication do not imply the expression of any opinion whatsoever on the part of the Secretariat concerning the legal status of any country, territory, city or area, or of its authorities, or concerning the delimitation of its frontiers or boundaries.
Designations such as “developed,” “developing,” “industrialized,” “frontrunner,” “follower,” “latecomer” and “laggard” are intended for statistical convenience and do not necessarily express a judgment about the state reached by a particular country or area in the development process.
The mention of firm names or commercial products does not imply endorsement by UNIDO.
Material in this publication may be freely quoted or reprinted, but acknowledgement is requested, together with a copy of the publication containing the quotation or reprint.
For reference and citation, please use: United Nations Industrial Development Organization, 2019. Industrial Development Report 2020. Industrializing in the digital age. Vienna.
UNIDO ID/449Sales Number: E.20.II.B.49ISBN: 978-92-1-106456-8eISBN: 978-92-1-004602-2

iiiiii
Contents
xii Foreword xiii Acknowledgements xv Technical notes and abbreviations xvi Glossary
1 Overview Industrializing in the digital age 1 Why should we care about new technologies? 2 What are the new technologies shaping the industrial landscape? 4 Who is creating, and who is using ADP technologies? 10 What is needed to engage with ADP technologies? 15 What dividends can ADP technologies deliver? 22 What policy responses can make ADP technologies work for ISID? 27 Notes
Part A Industrializing in the digital age
31 Chapter 1 Advanced digital production technologies and industrial development: A global perspective
31 Linking industrialization to new technologies: Basic concepts 37 The new technologies shaping the industrial landscape 47 Characterizing the global landscape of ADP technologies 55 New windows of opportunity? Catching up, stage-skipping and leapfrogging 60 Manufacturing is still important 62 Notes
65 Chapter 2 The evolving landscape of industrialization under advanced digital production technologies
65 ADP technologies and the structure of manufacturing 75 ADP technologies and the “skills of the future”: Risks of digitalization 82 ADP technologies and inclusive industrialization: Direct, indirect and net effects of the use of
industrial robots 87 Notes
Page

iviv
Co
nt
en
ts
89 Chapter 3 How manufacturing firms can absorb and exploit advanced digital production technologies
90 ADP technologies: What’s in it for firms in developing countries? 94 Field case studies: A qualitative approach 99 A micro-level perspective based on surveys 110 Getting the most out of it: Capabilities for industrializing in the digital age 115 Notes
117 Chapter 4 Responding to advanced digital production technologies 118 Characterizing strategic responses to ADP technologies 121 Basic elements of strategy design and development 126 Fostering capabilities to adopt ADP technologies 136 In sum 139 Notes
Part B Trends in industrial development indicators
143 Chapter 5 Industrial trends 143 Evolution of world manufacturing value added 145 Evolution of world manufacturing exports 148 Evolution of world manufacturing employment 149 Evolution of the world’s manufacturing labour productivity 152 Sectoral analysis of world manufacturing value added
155 Chapter 6 The Competitive Industrial Performance Index 155 The Competitive Industrial Performance Index 155 Main results 160 Results by geographical region and development stage 162 Sustainable Development Goal 9 165 Notes
Annexes 169 A.1 Producing the landscape of production and use of ADP technologies (Chapter 1) 172 A.2 Knowledge-intensive business services and robots (Chapter 2) 174 A.3 Surveys of the adoption of digital production technologies by industrial firms (Chapter 3) 179 A.4 Summary of strategic responses to ADP technologies in 11 countries (Chapter 4) 185 B.1 Rankings on the three dimensions of the Competitive Industrial Performance Index, by
geographical regions 190 B.2 Sustainable Development Goals and the Competitive Industrial Performance Index 194 C.1 Country and economy groups 196 C.2 Classification of manufacturing sectors by technology groups
Page

v
Co
nt
en
ts
197 References
Boxes 40 1.1 Automation and digitalization: From the first to the fourth industrial revolution 42 1.2 Collaborating with the robots 42 1.3 Manufacturing complex metal parts through 3D printing 43 1.4 Using the Internet of Things for remote control of water treatment plants 43 1.5 Improving the accuracy of rubber production through cloud computing and big data
analytics 47 1.6 Improving inclusiveness with new affordable solutions for marginalized groups 59 1.7 Leapfrogging and leadership changes: Examples from the steel industry 61 1.8 Leapfrogging to ADP technologies in steel production 69 2.1 Fostering competitiveness through ADP technologies in South African machinery,
equipment and electronics industry 73 2.2 Entering global manufacturing through the provision of knowledge-intensive services 76 2.3 Skills of the future for manufacturing 119 4.1 Highly industrialized economies differ in their strategic stances for smart manufacturing 124 4.2 Cooperation for a new digitalization strategy for Kazakhstan 125 4.3 Sino-German cooperation for smart manufacturing 128 4.4 Priorities for digitalization in Africa 129 4.5 Digitalization as a prerequisite for smart manufacturing 130 4.6 Nuevo León 4.0: A regional initiative around smart manufacturing in Mexico 131 4.7 Fostering the development and adoption of cloud computing in Zhejiang province 132 4.8 Fostering SME participation in smart manufacturing: The C4i4 Lab in Pune, India 133 4.9 Malaysia’s Industry4WRD Readiness Assessments 135 4.10 Creative spaces can advance and democratize manufacturing development
Figures 2 1 New technologies and inclusive and sustainable industrial development 3 2 Broad technological domains of the fourth industrial revolution 4 3 Production technologies: From the first industrial revolution to the fourth 5 4 Building blocks of ADP technologies 7 5 Four generations of digital production technologies applied to manufacturing 8 6 Adoption of ADP technologies is still limited among developing countries 9 7 Rates of adoption of key ADP technologies differ across industries in Europe 11 8 Engaging with ADP technologies requires increasing industrial capabilities 14 9 Production capabilities are key for the adoption of technological process innovation 15 10 Expected dividends from ADP technologies 16 11 The adoption of ADP technologies is positively associated with productivity 17 12 Economies active in ADP technologies grow faster than the rest, across all income groups
Page

vivi
Co
nt
en
ts
Page
18 13 Manufacturing industries in economies actively engaging with ADP technologies are more integrated with KIBS, at all incomes
18 14 Aggregate impact of the increase in industrial robot use in individual industries on world employment
20 15 ADP technologies have above-average green content 20 16 The majority of firms engaging or ready to engage with ADP technologies agree that these
will lead to environmental improvements 22 17 Female workers are more likely to face a higher computerization risk than men if they are
employed in food, textiles and chemicals 32 1.1 New technologies and ISID: A conceptual framework 34 1.2 The rise of automobiles and personal computers in the United States: Consumption and
production 35 1.3 Economy-wide income creation by new industries: Automobiles and personal computers in
the United States 35 1.4 The global rise of electric vehicles: Projected sales to 2040 36 1.5 Larger investments in manufacturing research and development are associated with higher
production efficiency 36 1.6 From production efficiency to ISID 38 1.7 Broad technological domains of the fourth industrial revolution 39 1.8 Production technologies: From the first industrial revolution to the fourth 41 1.9 Building blocks of ADP technologies 44 1.10 Expected dividends from ADP technologies 45 1.11 Main circular economy processes 48 1.12 Patenting, exporting and importing of ADP technologies: Different roles but similar
concentration of the top 50 economies 49 1.13 Changes at the top with different indicators of patent, export and import activity in ADP
technologies 51 1.14 The production and use of ADP technologies are concentrated in a few frontrunners 52 1.15 Engaging with ADP technologies requires increasing industrial capabilities 53 1.16 Within income groups, economies actively engaging with ADP technologies show much
greater industrial capabilities than the rest 53 1.17 The production of ADP technologies takes off after 2005 54 1.18 Economies active in ADP technologies grow faster than the rest, across all income groups 55 1.19 ADP technologies have above-average green content 56 1.20 Four generations of digital production technologies applied to manufacturing production 57 1.21 Leapfrogging in digital technologies for manufacturing production 66 2.1 Rates of adoption of key ADP technologies differ across industries in Europe 67 2.2 The adoption of key ADP technologies in manufacturing is positively associated with the
share of TDI industries in MVA 67 2.3 Economies actively engaging with ADP technologies tend to have a much larger share of
TDI industries in MVA 68 2.4 Within country income groups, economies actively engaging with ADP technologies also
tend to have a much larger share of TDI industries in MVA

vii
Co
nt
en
ts
Page
69 2.5 The average share of TDI industries increased after 2005, especially for economies actively engaging with ADP technologies
70 2.6 Shifts in the patterns of structural change before and after 2005 for selected industries by country income group
71 2.7 Real MVA growth and its drivers: Employment and productivity 73 2.8 Manufacturing increasingly relies on KIBS across all incomes 74 2.9 Manufacturing industries in economies actively engaging with ADP technologies are more
integrated with KIBS at all country group income levels 74 2.10 KIBS are more integrated with TDI industries than average, especially in developing
countries 77 2.11 Women constitute the largest share of workers in textile and wood industries 78 2.12 Female workers are more likely to face a higher computerization risk than men if they are
employed in food, textiles and chemicals 79 2.13 The risk of computerization declines with formal education for both male and female
workers 80 2.14 Women score lower than men on skills that may protect jobs from loss through
computerization in manufacturing 81 2.15 Women are underrepresented in managerial position in manufacturing 81 2.16 A larger proportion of the female workforce is at high risk of job displacement from
computerization in food, beverages and tobacco 83 2.17 The stock of industrial robots doubled between 2000 and 2014 84 2.18 Aggregate impact of the increase in industrial robot use in individual industries on world
employment 85 2.19 Where were jobs created? Employment growth due to robots, by economy groups,
2000–2014 85 2.20 Who created the jobs? Employment growth due to robots, by economy groups, 2000–2014 85 2.21 Where were the jobs created? Employment growth due to robots, by sector, 2000–2014 85 2.22 Who created the jobs? Employment growth due to robots, by sector, 2000–2014 86 2.23 Computer, electrics and machinery and basic metals are the main creators of jobs due to
automation 100 3.1 Adoption of ADP technologies is still limited among developing countries 101 3.2 Firms in TDI industries tend to adopt more ADP technologies 101 3.3 Larger firms tend to adopt more ADP technologies 102 3.4 Firms participating in GVCs are more likely to adopt ADP technologies 103 3.5 The main obstacles to adopting ADP technologies reflect county-specific challenges 104 3.6 Firms expect a marked increase in adopting ADP technologies in the next 5 to 10 years 104 3.7 Many firms do not yet have plans available or in execution to achieve the highest
technological generations in the next 5 to 10 years 105 3.8 Few firms are ready to leapfrog to ADP technologies 106 3.9 Firms in the forging ahead and catching up categories have a larger share of STEM
employees 106 3.10 Firms in the forging ahead and catching up categories have a higher female share of
employees with STEM qualifications

viiiviii
Co
nt
en
ts
Page
107 3.11 Across sectors and sizes, firms adopting ADP technologies display higher productivity 107 3.12 The adoption of ADP technologies is associated with productivity more strongly than other
firm characteristics are 109 3.13 Flexibility was the main motive of backshoring from emerging economies in 2013–2015 109 3.14 The majority of firms in the forging ahead and catching up categories agree that ADP
technologies will lead to environmental improvements 110 3.15 The majority of firms in the forging ahead and catching up categories expect to increase or
keep the same number of employees as they adopt ADP technologies 110 3.16 The majority of firms in the forging ahead and catching up categories agree that soft skills
are expected to be very important in future hiring 111 3.17 Production capabilities are key for the adoption of technological process innovation 113 3.18 Digital leaders show a better performance in terms of presence in TDI industries, export
and employment generation 119 4.1 Strategic responses reflect differences in manufacturing development across countries 143 5.1 Annual growth rates of world MVA and GDP 144 5.2 Share of MVA in world GDP 144 5.3 Share in world MVA by economy group 145 5.4 Share of the 12 largest manufacturing economies in world MVA 146 5.5 World manufacturing exports growth by economy groups 147 5.6 Manufacturing exports as a share of total exports by economy group 147 5.7 Manufacturing exports as a share of total exports by economy group, with China separated 147 5.8 Exports of medium- and high-technology goods as a share of total manufacturing exports
by economy group 148 5.9 Annual growth rates of world manufacturing employment and world total employment 149 5.10 Share of manufacturing employment in world total employment 149 5.11 Share in world manufacturing employment by economy group 150 5.12 World labour productivity in manufacturing and in the entire economy 151 5.13 Labour productivity in manufacturing relative to U.S. productivity by economy group 151 5.14 Manufacturing labour productivity growth rates by economy group 156 6.1 Dimensions of the CIP Index 161 6.2 Scores and ranks of the top CIP performing economies in 2017 171 A1.1 Characterization of economies: followers and latecomers
Tables 6 1 From laggards to frontrunners in the emerging technological landscape 12 2 Accumulating investment, technology and production capabilities for advanced digital
production 23 3 Areas of policy action to make ADP technologies work for ISID 50 1.1 From laggards to frontrunners in the emerging technological landscape 66 2.1 Typology of industries by digital intensity and technology intensity 80 2.2 Skills categories and corresponding measures in the Skills Towards Employability and
Productivity program

ix
Co
nt
en
ts
Page
92 3.1 Accumulating investment, technology and production capabilities for advanced digital production
95 3.2 Case studies examined the impact of advanced technology on the competitiveness, environmental sustainability and social inclusiveness of developing country firms
111 3.3 Investment and technology and production capabilities 112 3.4 Characteristics of firm categories 114 3.5 Share of firm categories in 15 developing countries 152 5.1 Economy group shares in manufacturing goods at different technology levels 153 5.2 Technology level of goods by economy group 157 6.1 2019 CIP Index 162 6.2 CIP rankings on the three dimensions of industrial competitiveness by geographical region
and industrialization level 170 A1.1 Identifying ADP-related capital goods in trade statistics 171 A1.2 Countries and economies by level of engagement with ADP technologies applied to
manufacturing 175 A3.1 Country samples and industry coverage 176 A3.2 Final sample composition by firm size and industry 176 A3.3 Topic coverage by individual country 177 A3.4 Digital technology generations and business functions 178 A3.5 Firm readiness categories 179 A4.1 Strategic responses to ADP technologies in selected economies, by geographical region 185 B1.1 European economies’ ranking on the three dimensions of industrial competitiveness 186 B1.2 North American economies’ ranking on the three dimensions of industrial competitiveness 186 B1.3 Asia and Pacific economies’ ranking on the three dimensions of industrial competitiveness 188 B1.4 Latin American and Caribbean economies’ ranking on the three dimensions of industrial
competitiveness 189 B1.5 African economies’ ranking on the three dimensions of industrial competitiveness 190 B2.1 Sustainable Development Goal 9 targets included in the CIP Index 194 C1.1 Countries and economies by industrialization level and geographical region 196 C2.1 Definition of medium- and high-technology manufacturing exports 196 C2.2 Technology classification of industrial activities


xixi
Foreword
The emergence and diffu-sion of advanced digital production (ADP) tech-nologies of the fourth industrial revolution are radically altering manu-facturing production, increasingly blurring the boundaries between physi-cal and digital production
systems. Advances in robotics, artificial intelligence, additive manufacturing and data analytics generate significant opportunities to accelerate innovation and increase the value-added content of production in manufacturing industries.
This 2020 Industrial Development Report con-tributes to the debate on the fourth industrial revolu-tion by presenting fresh analytical and empirical evi-dence on the future of industrialization in the context of the present technological paradigm shift.
One frequent claim is that robots will replace fac-tory workers, such that industrialization will not cre-ate the same number of job opportunities as in the past. Another is that advanced countries will back-shore previously outsourced production. A third is that the minimum threshold of skills and capabili-ties to remain competitive in manufacturing will be so high that it will exclude most countries from the next phase of manufacturing production. This report empirically examines the validity of these challenges.
A key finding of this publication is that industri-alization continues to be the main avenue for success-ful development. Industrialization enables countries to build and strengthen the skills and capabilities to compete and succeed within the new technological paradigm. The analysis shows that ADP technologies applied to manufacturing production offer huge poten-tial to advance economic growth and human well-being and to safeguard the environment, contributing to the 2030 Agenda for Sustainable Development.
This concerns, in particular, Sustainable Development Goal 9 — Build resilient infrastructure, promote inclusive and sustainable industrialization and foster innovation — which is central to UNIDO’s mandate. These technologies can increase the efficiency and pro-ductivity of industrial production processes, and there is evidence that it can also help create new industries.
This publication also shows that, although a large number of jobs will be vulnerable to automation as new technologies diffuse across countries and indus-tries, it is also likely to create new industries and new job opportunities in more skilled and knowledge-based sectors. The evidence in this report suggest that, once indirect effects along the value chain are considered, the increase in the stock of robots used in manufacturing at the global level is actually creat-ing employment, not destroying it. Evidence on back-shoring from emerging to industrialized economies due to the adoption of new technologies indicates that this phenomenon is not widespread. Findings show that back-shoring is counterbalanced by offshore pro-duction in developing countries, which creates oppor-tunities for jobs, backward and forward value chain linkages.
The impact of ADP technologies on develop-ing countries will ultimately depend on their policy responses. There is no “one-size-fits-all” policy strat-egy to make the new technologies work for inclusive and sustainable industrial development. Our 2020 report provides some strategic policy directions as the fourth industrial revolution deepens in the com-ing years. Three areas deserve particular attention: (i) developing framework conditions, in particular digital infrastructure, to embrace the new technologies; (ii) fostering demand and leveraging on ongoing initia-tives using ADP technologies; and (iii) strengthening required skills and research capabilities. The report provides several examples of specific policies currently implemented in different countries to address each of these dimensions.
xiixii
For
ew
or
d
A striking finding emerging from the report is the large number of countries that have yet to enter into the era of ongoing technological breakthroughs. Large parts of the world, mostly in least developed countries and other low-income countries, are still far from uti-lizing ADP technologies on a significant level. Firm-level data collected for this report in five developing countries reinforce this understanding by showing that the manufacturing sector in these countries is charac-terized by “technology islands”, where few (if any) digi-tal leaders coexist with a large majority of firms using outdated technologies. Up to 70 percent of the manu-facturing sector in “lagging economies” are still using analog technologies in its manufacturing production.
The lack of diffusion of potentially useful technol-ogies strengthens the call for the further enhancement of the global partnership for sustainable development. Efforts to mobilize and share knowledge, expertise, technology and financial resources to secure the aim of 2030 Agenda for Sustainable Development to leave no one behind must be increased. Low-income coun-tries require appropriate digital infrastructure and skills to take advantage of the fourth industrial revo-lution and to avoid the risk of lagging further behind. This report shows that there are merits for low-income countries to engage in manufacturing production, to
strengthen industrial capabilities and learn how these technologies can be used productively. Sustained, inclusive and sustainable economic growth is essential for prosperity.
I am pleased that this report brings an original dimension to the analysis of new technologies and the fourth industrial revolution, and reaffirms the role of industrialization as a driver of development. Industrial development that is inclusive and sustainable will help build dynamic, sustainable, innovative and people-centred economies — this we must strive for, as the international community progresses towards the achievement of the 2030 Agenda for Sustainable Development.
I thank the UNIDO staff members and interna-tional experts who worked on this report, and I look forward to it serving as a reference document in the international development debate on the fourth industrial revolution.
LI YongDirector General, UNIDO

xiiixiii
Acknowledgements
The Industrial Development Report (IDR) 2020 was prepared under the overall guidance of Li Yong, Director-General of the United Nations Industrial Development Organization (UNIDO). It is the result of two years of intense research efforts, fruitful dis-cussions and close collaboration of an in-house team headed by Cecilia Ugaz, Director for the Department of Policy, Research and Statistics. The team was coor-dinated by Alejandro Lavopa, who played an instru-mental role in the successful completion of the report, and comprised Elisa Calza, Nicola Cantore, Nelson Correa, Smeeta Fokeer, Nobuya Haraguchi, Fernando Santiago Rodríguez and Adnan Seric.
A string of commissioned background papers greatly benefited the drafting of the report, and were submitted by the following experts: Ramiro Albrieu, Caterina Brest López, and Martín Rapetti, Center for the Implementation of Public Policies Promoting Equity and Growth (CIPPEC); Antonio Andreoni, the School of Oriental and African Studies (SOAS) at the University of London; Guendalina Anzolin, University of Urbino; Francesco Bogliacino, National University of Colombia; Cristiano Codagnone, University of Milan and Open University of Catalonia; Bernhard Dachs, Austrian Institute of Technology; Michele Delera, Neil Foster-McGregor, Carlo Pietrobelli, Önder Nomaler, and Bart Verspagen, United Nations University-Maastricht Economic and Social Research Institute on Innovation and Technology (UNU-MERIT); João Carlos Ferraz, David Kupfer, Jorge Nogueira de Paiva Britto and Julia Torracca, Institute of Economics of the Federal University of Rio de Janeiro (IE-UFRJ); Mahdi Ghodsi, Oliver Reiter, Robert Stehrer, and Roman Stöllinger, The Vienna Institute for International Economic Studies (WIIW); Chiharu Ito, Michiko Iizuka, and Izumi Suzuki, National Graduate Institute for Policy Studies (GRIPS); Bart Kemp and Raquel Vázquez, Basque Institute of Competitiveness (Orkestra); Erika Kraemer-Mbula, University of
Johannesburg; Keun Lee, Seoul National University; Amaia Martínez and Cristina Oyón, Basque Business Development Agency (SPRI); Mario Pianta, Roma Tre University; and Alina Sorgner, John Cabot University.
To support the analysis of the report, carefully considered firm-level surveys were designed and implemented in three countries: Ghana, Thailand and Viet Nam. The team is grateful to the follow-ing partner institutions for their meticulous work in collecting the corresponding data: the Council for Scientific and Industrial Research (CSIR)-Science and Technology Policy Research Institute (STEPRI) in Ghana, the Digital Economy Promotion Agency (DEPA) in Thailand, and the National Center for Socio-Economic Information and Forecast (NCIF) in Viet Nam. These surveys were developed following the approach put forward in Brazil by the Brazilian National Confederation of Industry (CNI) and rep-licated in Argentina by the Argentine Industrial Union (UIA) in cooperation with CIPPEC and the Institute for the Integration of Latin America and the Caribbean of the Inter-American Development Bank (INTAL-IDB). We are grateful to these institutions for facilitating access to the microdata of correspond-ing surveys from these two countries.
To complement the survey results, the team also collected case studies on manufacturing firms from other developing countries. Profound appreciation is directed to Ciyong Zou and the UNIDO staff from the field offices who have made the data collection process possible, namely: Manuel Albaladejo, Nadia Aftab, Ralf Bredel, Sooksiri Chamsuk, Stein Hansen, Hanan Hanzaz, Muhammad Hammad Bashir Saeed, Lina Touri, René van Berkel, Rajeev Vijh, and Süleyman Yilmaz. The work was supported by Valeria Cantera, Nurshat Karabashov, Sebastián Pérez, Nidhi Sharma, Hongfei Yue and Azhar Zia-ur-Rehman. We are also thankful to the following institutions which facilitated the collection of data in some of these

xivxiv
AC
kn
ow
led
ge
me
nt
s
countries: the Ministry of Industry and Information Technology from China, the Ministry of International Trade and Industry from Malaysia, the Turkish Industry and Business Association (TUSIAD) and the Chamber of Industries of Uruguay (CIU).
The report greatly benefited from construc-tive comments by members of UNIDO’s Executive Board, namely Fatou Haidara, Hiroshi Kuniyoshi and Philippe Scholtes. Our special thanks also go to John Weiss, Emeritus Professor at the University of Bradford, Jörg Mayer, Senior Economic Affairs Officer at the United Nations Conference on Trade and Development (UNCTAD), and Alistair Nolan, Senior Policy Analyst at the Organisation for Economic Co-operation and Development (OECD), for thoroughly reviewing the draft of the report and significantly improving several of its sections.
Many of the concepts introduced and elabo-rated in the report were presented and discussed at two workshops with international experts at UNIDO headquarters in Vienna in November 2018 and April 2019 and at internal presentations with UNIDO staff during May 2019. During these meetings insightful comments were provided by Sara Amoroso, European Commission– Joint Research Centre; and Mike Gregory, University of
Cambridge; as well as UNIDO staff members Arno Behrens, Kai Bethke, Bernardo Calzadilla, Tsung Ping Chung, Michele Clara, Jacek Cukrowski, Tareq Emtairah, Ayumi Fujino, Dong Guo, Anders Isaksson, Jaehwan Jung, Bettina Schreck, Nilgun Tas, Valentin Todorov, and Shyam Upadhyaya. Additionally, valuable comments to the draft were given by UNIDO staff Weixi Gong, Nan Ji, Olga Memedovic, and Alejandro Rivera.
The authors of the report were backed by a tal-ented team of research assistants and interns at UNIDO including Jürgen Amann, Shengxi Cao, Charles Fang Chin Cheng, Alessandra Celani de Macedo, and Lorenzo Navarini. UNIDO staff mem-bers Angie Belsaguy, Nevena Nenadic, and Iguaraya Saavedra provided extensive administrative sup-port, and Niki Rodousakis provided copy-editing assistance. In the final drafting phase, UNIDO consultant Ascha Lychett Pedersen was instrumen-tal in preparing the report for print. The report was edited and designed by a team at Communications Development Incorporated, led by Bruce Ross-Larson and including Joseph Brinley, Joe Caponio, Meta de Coquereaumont, Mike Crumplar, Debra Naylor (Naylor Design), Christopher Trott and Elaine Wilson.

xvxv
Technical notes and abbreviations
References to dollars ($) are to United States dollars, unless otherwise indicated.
This report classifies countries according to four primary groupings: industrialized economies, emerging indus-trial economies, other developing economies, and least developed countries. The three latter groupings are together referred to as developing and emerging industrial economies. See Annex C.1 for a complete list of countries and economies by region and industrialization level.
The remaining annexes contain more detailed information about methodology and classifications. Annexes A and B provide further methodological details and tables complementary to those in the text of Parts A and B of the report. Annex C contains detailed information on the classifications of economies and sectors used throughout the report.
In-text values in non-$ currencies are generally followed by a $-approximation, which in all cases is based on the average exchange rate for the relevant year.
Components in tables may not sum precisely to totals shown because of rounding.
1IR First industrial revolution2IR Second industrial revolution3IR Third industrial revolution4IR Fourth industrial revolutionAI Artificial intelligenceADP Advanced digital productionBRICS Brazil, Russia, India, China and South AfricaCAD Computer-aided design CAM Computer-aided manufacturingCIM Computer-integrated manufacturingCNC Computerized numerical control CIP Competitive Industrial PerformanceCPS Cyber-physical systemsDIY Do it yourself (movements)DRI Digitalization Readiness IndexDPT Digital Production TechnologiesEPO European Patent OfficeFDI Foreign direct investmentGDP Gross domestic productGVC Global value chainHS Harmonized SystemICIO Inter-Country Input-OutputICT Information and communications
technologyIDR Industrial Development ReportILO International Labour OrganizationIoT Internet of ThingsIPR Intellectual property rights
ISCED International Standard Certification of Education
ISID Inclusive and Sustainable Industrial Development
KIBS Knowledge-intensive business servicesLDC Least developed countriesM2M Machine-to-machineMVA Manufacturing value addedOECD Organisation for Economic Co-operation
and DevelopmentPPP Purchasing power parityRCA Revealed comparative advantageR&D Research and developmentRFID Radio-frequency identificationSDG Sustainable Development GoalSME Small and medium-sized enterpriseSTEM Science, technology, engineering and
mathematicsSTEP Skills Towards Employability and
ProductivityTDI Technology- and digital-intensiveTVET Technical and vocational education and
trainingUN United NationsUNIDO United Nations Industrial Development
OrganizationVA Value addedWIOD World Input-Output Database

xvi
Additive manufacturing: Commonly known as 3D printing, the use of special printers to create three-dimensional physical objects from 3D model data by adding layer upon layer through material extru-sion, directed energy deposition, material jetting, binder jetting, sheet lamination, vat polymeriza-tion and powder bed fusion. Additive manufactur-ing is contrasted with subtractive manufacturing methods, which use moulds or rotating milling cutters to remove material from a solid block of material (Eurostat 2017).
Advanced manufacturing: Manufacturing systems in industrial sectors and industrial production characterized by the technology associated with the fourth industrial revolution, such as digital production technologies, nanotechnology, bio-technology and new and improved materials.
Advanced digital production technologies: Tech-nologies that combine hardware (advanced robots and 3D printers), software (big data analytics, cloud computing and artificial intelligence) and connectivity (the Internet of Things). Advanced digital production technologies are the latest evo-lution of digital technologies applied to produc-tion, a core technological domain associated with the fourth industrial revolution. They give rise to smart production — also referred as the smart fac-tory, or Industry 4.0.
Artificial intelligence: The branch of computer science seeking to simulate the human capacity to reason and make decisions. The term usually refers to such artificial intelligence techniques as machine learning, deep learning, neural networks, fuzzy logic, computer vision, natural language processing and self-organizing maps to provide machines and systems with human-like cognitive capabilities, such as learning, adapting, perceiv-ing and solving problems. Artificial intelligence can be defined as making computers intelligent and capable of mimicking and predicting human
behaviour and solving problems as well as or better than humans.
Big data: Data characterized by unprecedented vol-ume; frequency or speed of being generated, made available and altered; variety of sources, format and complexity, either unstructured or structured; and granularity (OECD 2017, Eurostat 2017). Such data require new forms of processing to enable their use for enhanced decision-making and pro-cess optimization. Big data analytics refers to tech-niques and technologies that allow voluminous machine-readable data to be generated, stored, accessed, processed and analysed to uncover valu-able information — patterns, correlations, trends and preferences — that can help organizations make informed decisions (Schaeffer 2017).
Cloud computing: On-demand network use of a shared pool of configurable computing resources such as networks, servers, storage, applications and services that can be rapidly accessed or released with minimal management effort or service pro-vider interaction. Cloud computing services are used over the internet to access software, comput-ing power, storage capacity and the like, where ubiquitous and convenient services are delivered from the server or the service provider; can be scaled up or down, can be used on demand, and are paid for according to capacity used, or else are pre-paid (Eurostat 2017).
Computer-aided design and manufacturing: Use of computer systems (both hardware and soft-ware applications) to design and draft technical drawings and models and to provide instructions for and control machine tools and equipment to make prototypes, finished products and whole production runs (Mayer 2018). Computer-aided design systems allow building and viewing a design in three-dimensional space, and they facili-tate manufacturing by conveying information on materials, processes, dimensions and tolerances.
Glossary

xvii
glo
ss
Ar
y
Computer-aided design can be used by itself, or it can be integrated with and provide inputs to other computer-aided software such as computer-aided manufacturing, which controls the machine tool that creates or assembles the physical product.
Collaborative robot (cobot): A robot that physically interacts with humans. Designed to learn new tasks, cobots are built with passive compliance fea-tures and integrated sensors to adapt to external forces. Cobots are typically safe, cost-effective, easy to use and suitable for small-scale production and reduced production cycles. They are also portable and easy to configure and reconfigure for different tasks.
Competitive Industrial Performance Index: Com-posite index based on three dimensions — capacity to produce and export manufactured goods, tech-nological deepening and upgrading, and world impact — capturing a country’s ability to produce and export manufactures competitively and to transform structurally (UNIDO 2019b).
Cyber-physical system: Networked system with embedded intelligent sensors, processors and actuators, designed to sense and interact with the physical world and support production in real time, guaranteeing performance in applications and allowing machine-to-machine or product-to-machine communication about on how to proceed.
Digital capability gap: Divide between the leading companies in digital capabilities and the rest. Une-venness in the pace of developing new capabilities reinforces firm heterogeneity, with a large number of low-capability and low-performance actors coex-isting with more advanced ones.
Digitalization Readiness Index: Synthetic index that combines three dimensions from the surveys conducted for Industrial Development Report 2020: the average generation of digital production technologies currently employed by a firm, the gen-eration the firm expects to use in 5 to 10 years and the level of effort the firm is currently making to reach that expected generation. The higher the gen-eration currently used (or expected to be used) and
the higher the level of effort, the higher the value of the index.
Followers: Economies actively engaging in advanced digital production technologies by patenting in the field or trading advanced digital production–related goods, but to less extent than frontrunner economies. The follower group is defined by the average values of patent, export and import activity, once frontrunners are excluded from the sample. It has two subcategories. Followers in production have above-average patenting activity in advanced digital production technologies, or else have above-average export market shares in this field and rela-tive specialization in this type of export. Follow-ers in use have both above-average import market shares in this field and relative specialization in this type of import.
Fourth industrial revolution: The latest wave of technological breakthroughs. The first industrial revolution, between 1760 and 1840, was triggered by the steam engine and featured the mechaniza-tion of simple tasks and the construction of rail-roads. The second, between the late 19th century and the early 20th century, rose with the advent of electricity, the assembly line and mass production. The third, since the 1960s, was driven by the devel-opment of semiconductors and mainframe com-puting, together with the introduction of personal computers and the internet. The fourth industrial revolution is based on the growing convergence between different emerging technology domains, including digital production technologies, nano-technology, biotechnology and new and improved materials.
Frontrunners: Economies leading in the production of advanced digital production technologies. The group is defined as the top 10 economies in the number of cumulative global patent family applica-tions in these technologies. Together, they account for 90 percent of global patent families, 69 percent of total exports of goods associated with these technologies and 46 percent of total imports of these goods.

xviiixviii
glo
ss
Ar
y
Global value chain: A value chain is the full range of activities that firms and workers do to bring a prod-uct from its conception to its end use and beyond, including design, production, marketing, distri-bution and support to the final consumer. When firms are located in different economies, the value chain is considered global.
Inclusive and sustainable industrial development: Long-term industrialization that drives develop-ment. It includes three aspects: creating shared prosperity by offering equal opportunities and an equitable distribution of benefits to all, advancing economic competitiveness, and safeguarding the environment by decoupling the prosperity gener-ated by industrial activities from excessive natural resource use and negative environmental impacts. The Lima Declaration, adopted by UNIDO’s Member States on December 2, 2013, set the foun-dation for this vision.
Internet of Things: The next iteration of the inter-net, where information and data are no longer pre-dominantly generated and processed by humans (as most data created so far have been) but by inter-connected smart objects, embedded in sensors and miniature computers that sense their environment, process data and engage in machine-to-machine communication. Internet of Things relies on interconnections through the internet’s network of devices, machinery and objects, each uniquely addressable based on standard communication protocols (UNIDO 2017d).
Knowledge-intensive business services (KIBS): Services and business operations heavily reliant on knowledge. In the analysis conducted in the Indus-trial Development Report 2020, KIBS are broadly defined as sectors C71RMQ (renting of machinery and equipment), C72ITS (computer and related activities) and C73T74OBZ (R&D and other business activities) from the OECD Inter-Country Input-Output system.
Laggards: Economies showing very little or no engagement with advanced digital production
technologies. Laggards are economies that can-not be classified as frontrunners, followers or latecomers.
Latecomers: Economies with some engagement with advanced digital production technologies in pat-enting such technologies or trading related goods, but less than follower economies. The latecomer group is defined by the average values of patent, export and import activity once frontrunners are excluded from the sample. It has two subcatego-ries. Latecomers in production either have at least one patent family in the advanced digital produc-tion field but fall below the sample average, or have above-average export market shares in this field or relative specialization in this type of exports. Late-comers in use either have above-average import mar-ket shares in this field or relative specialization in this type of imports.
Machine-to-machine: Direct communication or data exchange between machines, or between machines and devices or components. Machine-to-machine communication encompasses two types. One is machine-to-machine wireless communi-cation with no human intervention. The other is machine-to-mobile and mobile-to-machine com-munication between mobile devices and machines. Web-based machine-to-machine communication relies on normalized technologies and standard-ized protocols/formats. The interconnection of more machines able to communicate is known as Internet of Things.
Machine learning: An application of artificial intel-ligence, machine learning systems use general algorithms to figure out on their own how to map inputs to outputs, typically being fed by very large sample datasets (Brynjolfsson, et al. 2017). These systems can improve their performance on a given task over time by amassing experiences and large volumes of data, such as big data.
New technology: The invention and application of new — not previously developed or used — or significantly improved technology, defined as

xix
glo
ss
Ar
y
techniques, tools, goods, methods and processes used to address and solve a technical issue in the accomplishment of a purpose.
Process innovation: Implementation of new or greatly improved production or delivery method, including major change in technique, equipment or software (OECD/Eurostat 2005).
Product innovation: Introduction of goods or ser-vices that are new or significantly improved in their characteristics or intended uses (OECD/Eurostat 2005).
Research and development (R&D): Creative work undertaken systematically to increase the stock of knowledge, including knowledge of humanity, cul-ture and society, and to use this stock of knowledge to devise new applications. The term covers basic research, applied research and experimental devel-opment (OECD 2002).
Robot: A machine, programmed by a computer, capa-ble of carrying out a series of more or less complex actions automatically. Robots can be industrial robots or service robots. An industrial robot is an automatically controlled, reprogrammable and mul-tipurpose manipulator in three or more axes, either fixed in place or mobile, used in industrial applica-tions such as manufacturing processes (welding, painting and cutting) or handling processes (depos-iting, assembling, sorting and packing). A service robot is a machine that has a degree of autonomy and operates complex and dynamic interactions and coordination with persons, objects and other devices (when used, for example, for cleaning, sur-veillance or transportation) (Eurostat 2017).
Smart factory: Plant applying smart manufac-turing. Used in general to refer to the growing
computerization and automation of manufactur-ing plants.
Smart manufacturing: The application of advanced digital production technologies to manufacturing production. The integration of these technologies includes workers, manufactured products, equip-ment and machinery along all stages of production in an intelligent system. The system’s components interact with and control each other, take decisions and implement actions through digital networks of interconnected equipment and sensors, pow-ered by real-time data analytics, machine learning, machine-to-machine communication and other intelligent algorithms (Chukwuekwe et al. 2016).
Technology- and digital-intensive industries: Industries classified as having medium-high or high levels of technology and digital intensity simultaneously, according to the OECD classi-fications for technology intensity (OECD 2011) and digital intensity (Calvino et al. 2018). Sec-tors include computers, electronics, electrical machinery and machinery (International Stand-ard Industrial Classification 26 to 28) and trans-port equipment (International Standard Industrial Classification 29 and 30).
Value added: A measure of output net of intermediate consumption, which includes the value of materials and supplies used in production, fuels and electric-ity consumed, the cost of industrial services such as payments for contract and commission work and repair and maintenance, the compensation of employees, the operating surplus and the consump-tion of fixed capital. Manufacturing valued added (manufacturing net output) is the contribution of the entire manufacturing sector to GDP.


11
Advanced digital production technologies can foster inclusive and sustainable industrial development and the achievements of the SDGsThe emergence and diffusion of advanced digital production (ADP) technologies — artificial intelli-gence, big data analytics, cloud computing, Internet of Things (IoT), advanced robotics and additive manu-facturing, among others — is radically altering the nature of manufacturing production, increasingly blurring the boundaries between physical and digital production systems. Under the right conditions, the adoption of these technologies by developing countries can foster inclusive and sustainable industrial develop-ment (ISID) and the achievement of the Sustainable Development Goals (SDGs).
Only a few economies and firms are creating and adopting ADP technologiesThe creation and diffusion of ADP technologies, however, remains concentrated globally, with only weak development in most emerging economies. The Industrial Development Report (IDR) 2020 finds that 10 economies — the frontrunners — account for 90 per-cent of all global patents and 70 percent of all exports directly associated with these technologies. Another 40 economies — the followers — actively engage in these technologies, though with much more modest inten-sity. The rest of the world either shows very little activ-ity (the latecomers) or fails to take part in the global creation and use of these technologies (the laggards).
But ADP technologies open new opportunities for catching upADP technologies do open new opportunities for catching up, but exploiting them requires a minimum base of industrial capabilities. A clear positive relation-ship exists between the roles of different economies as frontrunners, followers, latecomers and laggards in the creation and use of these technologies and their aver-age industrial capabilities. Greater engagement with
these technologies is associated with higher rates of growth in manufacturing value added (MVA), driven mainly by faster productivity gains. And contrary to common thinking, developing countries actively engaging with ADP technologies also present positive employment growth.
Why should we care about new technologies?
Technologies drive ISID through new products and new processes
New technologies and inclusive and sustainable industrial developmentNew technologies are at the core of successful ISID. They enable the creation of new goods, which leads to the emergence of new industries. And they support an increase in production efficiency, which brings prices down and opens consumption to the mass market — or increases profits, with possible follow-on effects for investment (Figure 1). In the right context, new technologies can also promote environmental sustain-ability and social inclusion.
New industries come from new technologiesNew technologies can lead to product innovations, resulting in the emergence of new industries — and the jobs and incomes associated with them. This supports industrialization and social inclusion. When these innovations are geared to reducing environmental impacts — by introducing green manufacturing — they also promote the environmental sustainability of the industrial process.
Industrial competitiveness ultimately depends on technological upgradingNew technologies can also increase production efficiency, which is key to sustaining and fostering industrial competitiveness and, through this channel,
Overview
Industrializing in the digital age

22
ov
er
vie
w
“New technologies are at the core of successful ISID
expanding manufacturing production. In many cases, the very application of new technologies requires additional inputs and services from other sectors of the economy, thus increasing the multiplier effects of industrial development outside the boundaries of the factory. Greater efficiency is associated with reductions in pollutant emissions and material and energy consumption per unit of production, which can improve the environmental sustainability of the process.
What are the new technologies shaping the industrial landscape?
First came the steam, electricity and computing-driven industrial revolutionsDifferent waves of technological advancements have pushed economic development since the first indus-trial revolution (1IR). The invention of the steam engine, the mechanization of simple tasks and the
construction of railroads triggered the 1IR between 1760 and 1840. The advent of electricity, the assem-bly line and mass production gave rise to the second industrial revolution (2IR) between the late 19th and early 20th century. The development of semiconduc-tors and mainframe computing in the 1960s, together with personal computers and the internet, were the main engines of the third industrial revolution (3IR).
Yet another wave is making its mark on the industrial landscapeRecent technological breakthroughs seem to be push-ing yet another wave, in what is commonly called the fourth industrial revolution (4IR). The concept is based on the growing convergence of different emerg-ing technology domains — digital production tech-nologies, nanotechnologies, biotechnologies and new materials — and their complementarity in production (Figure 2). Advanced manufacturing is the term typi-cally used to denote the adoption of these technologies
Figure 1 New technologies and inclusive and sustainable industrial development
Introduce new goodsinto the market
InclusiveSustainableIndustrialDevelopment
Jobs and incomeopportunities
Increase productionefficiency
Newtechnologies
Emergence of new industries
Environmental goods
Industrialcompetitiveness
Energy and material use
Linkages tosupporting activities
Note: The upper part of the figure shows how new technologies drive inclusive and sustainable industrial development (ISID) by introducing new goods into the market. The lower part shows how new production technologies also contribute to ISID by increasing production efficiency. As industrialization evolves, the innovative potential of countries also increases. This is shown by the straight arrow going from right to left.Source: UNIDO elaboration.

3
ov
er
vie
w
“ADP technologies give rise to smart manufacturing production systems
in manufacturing production. In the particular case of ADP technologies, their application to manufacturing gives rise to smart manufacturing production systems — also known as the smart factory or Industry 4.0. Smart production entails the integration and control of production from sensors and equipment connected in digital networks, as well as the fusion of the real world with the virtual — in so-called cyber-physical systems (CPSs) — with support from artificial intelligence. The shift to smart manufacturing production is expected to leave a long-lasting mark on the industrial landscape.
An evolutionary transition to ADP technologies
Technologies of the fourth industrial revolution arise from traditional industrial productionADP technologies are the last in the evolution of tra-ditional industrial production technologies (Figure 3).
In fact, many of these technologies have evolved and emerged from the same engineering and organiza-tional principles of previous revolutions, suggesting an “evolutionary transition” more than a “revolution-ary disruption.” For instance, automating processes go back to the 1IR, while the adoption of robots goes back at least to the 1960s (Andreoni and Anzolin 2019).
ADP hardware is a mix of old and newADP technologies result from the combination of three main components — hardware, software and connectivity (Figure 4). The hardware components are made of tools, tooling and the complementary equip-ment of modern industrial robots and intelligent automated systems, as well as cobots (robots co-oper-ating with workers in the execution of tasks) and 3D printers for additive manufacturing. This set of hard-ware production technologies is largely similar to its
Figure 2 Broad technological domains of the fourth industrial revolution
NEW MATERIALS
ADVANCED DIGITALPRODUCTION TECHNOLOGIES
NA
NO
TECH
NO
LOG
IES B
IOTECH
NO
LOG
IES
Industrialsector
IDR 2020 will focus on advanced digital production (ADP) technologies applied to manufacturing:
Other sectors/areas of the
economy
ADVANCEDMANUFACTURING
ARTIFICIAL INTELLIGENCE/MACHINE LEARNING
BIG DATA ANALYTICS
ADVANCED ROBOTICS
INDUSTRIAL INTERNET OF THINGS
CLOUD COMPUTING
ADDITIVE MANUFACTURING
SMARTFACTORY
Source: UNIDO elaboration based on OECD (2017), Schwab (2016), UNCTAD (2018), UNESCAP (2018) and UNIDO (2017d).

44
ov
er
vie
w
predecessor in the 3IR. What makes these machines different is their connectivity and their flexibility and functionality in executing productive tasks.
ADP connectivity is a big change from older manufacturingConnectivity in ADP technologies is achieved through the sensors in hardware, made possible by equipping machines and tools with actuators and sensors. Once machines and tools are able to sense the production process and products — their components, material and functional properties — they are also able to collect and transmit data through the industrial IoT. This type of connectivity opens the way for a paradigm shift from centralized to decentralized production.
Connectivity leads to smart networked systemsProduction technologies become fully digital once their connectivity is enhanced by software, allow-ing big data analytics — that is, tools able to process
vast quantities of data in near-real time. Building on computer-aided manufacturing (CAM), computer-integrated manufacturing (CIM) and computer-aided design (CAD) together with the improvements offered by information and communications technol-ogy (ICT) during the 3IR, the software of the 4IR has opened the way for cyber-physical systems. These are smart networked systems with embedded sensors, pro-cessors and actuators, designed to sense and interact with the physical world and support, in real time.
Who is creating, and who is using ADP technologies?
A concentrated global landscape
Industrial revolutions have leading and following economiesHistory’s technological revolutions have divided the world into leading and following economies,
“History’s technological revolutions have divided the world into leading and following economies
Figure 3 Production technologies: From the first industrial revolution to the fourth
PRODUCTION TECHS
1st INDUSTRIAL REV. 2nd INDUSTRIAL REV. 3rd INDUSTRIAL REV.
INDUSTRIAL REVOLUTIONS
COM
PLEX
ITY
AN
D P
ROD
UCT
ION
SYS
TEM
INTE
GR
ATIO
N
4th INDUSTRIAL REV.
Steam and water
Mechanizationand single-task
automation
PRODUCTION TECHS
Electric energy
Mechanical controlsystems for machine
automation
Mass production
PRODUCTION TECHS
Electronics
Information andcommunications
technology
Mechatronics andflexible automation
with robotic arms forautomotive, electronics
Lean production
ADVANCED DIGITALPRODUCTION TECHS
Electric andrenewable energy
Software platforms
Industrial Internet of Things
Big data analytics
Artificial intelligence
Sensors
Industrial robots, cobots
Additive manufacturing
Smart production
Source: Andreoni and Anzolin 2019.

5
ov
er
vie
w
depending on their involvement in creating and using the emerging technologies. In many cases, however, important parts of the world remained completely excluded from the ongoing revolution, entering only after several decades, when the technologies became cheap enough and the capability gap narrowed. A major concern at the onset of a new revolution is the extent to which all countries — especially those still trying to develop basic industrial capabilities — will be integrated into the emerging technological landscape.
The very top economies express the most ADP activityToday’s technological breakthroughs in ADP are again dividing the world between leaders, followers and laggards. One striking feature of the creation and diffusion of ADP technologies is the extreme concen-tration, especially of patenting and exporting activity.
In the distribution of both patenting and exporting, the average is extremely high relative to the median, and only a few economies are above it. So, the top economies (those above the average) explain most of the world activity in each area.
Ten frontrunner economies account for 90 percent of patents and 70 percent of exportsOnly 10 economies show above-average market shares in the global patenting of ADP technologies.1 Ordered by their shares, these economies are the United States, Japan, Germany, China, Taiwan Province of China, France, Switzerland, the United Kingdom, the Republic of Korea and the Netherlands (Table 1). Together, they account for 91 percent of all global pat-ent families. This group leads the rest of the world in creating new technologies within the ADP technol-ogy field. They not only invent the new technologies
“Ten economies account for 91 percent of global patenting in ADP technologies
Figure 4 Building blocks of ADP technologies
Active design &manufacturing
softwareCAM CIM CAD
Information &communications
technologies(ICT)
Cyber-physicalsystems (CPS)
CPS & M2M RFIDCPS with data
analysis
SOFTWARE
HARDWARECONNECTIVITY
Time
Time
Time
Automatedmachinery
Robotic arms(flexible
machinery)
3D printers& industrial
robotsCobots
Fieldbus Ethernet Wireless
Machinery Actuators Sensors
IndustrialInternet
ofThings
Note: CAM is computer-aided manufacturing, CAD is computer-aided design, CIM is computer-integrated manufacturing, M2M is machine to machine, and RFID is radio-frequency identification. CIM links CAD, CAM, industrial robotics, and machine manufacturing through unattended processing workstations.Source: Andreoni and Anzolin 2019.

66
ov
er
vie
w
but also sell (and purchase) in global markets the goods embodying these technologies — they account for almost 70 percent of global exports and 46 percent of global imports. These economies are the frontrun-ners in ADP technologies.
40 economies are following, but with lower valuesOther economies are also engaging in the new tech-nologies, though with lower values. Israel, Italy and Sweden, for instance, show large shares of global pat-ents, whereas Austria and Canada have high values of exports. By the same token, Mexico, Thailand and Turkey have high values of imports. These econo-mies are followers in this technology race. Looking at the average values of patent, exports and imports
indicators once the frontrunners are excluded, the report identifies 40 economies that would fall into this category. These economies explain 8 percent of global patents and almost half of all imports of goods embodying these technologies.
The rest of the world shows low or very low to no activity in this fieldTaken together, only 50 economies (the frontrunners and followers) can be considered as actively engaging with ADP technologies. They are either producing or using these technologies to an extent captured by country statistics. The remaining economies show low (latecomers) or very low to no activity (laggards) in the field.
“Only 50 economies can be considered as actively engaging with ADP technologies
Group Short description Criteria
Frontrunners (10 economies)
Top 10 leaders in the field of ADP technologies
Economies with 100 or more global patent family applications in ADP technologies (average value for all economies with some patent activity in this field)
Econom
ies actively engaging with A
DP
technologies
Followers in production (23 economies)
As innovators Economies actively involved in patenting in the field of ADP technologies
Economies with at least 20 regular patent family applications, or 10 global patent family applications in ADP technologies (average values for all economies with some patent activity, once frontrunners are excluded)
As exporters Economies actively involved in exporting ADP-related goods
Economies relatively specialized in exporting ADP-related goods that sell large volumes in world markets (above the average market share once frontrunners are excluded)
Followers in use (17 economies)
As importers Economies actively involved in importing ADP-related goods
Economies relatively specialized in importing ADP-related goods that purchase large volumes in world markets (above the average market share once frontrunners are excluded)
Latecomers in production (16 economies)
As innovators Economies with some patenting activity in ADP technologies
Economies with at least one regular patent family application in ADP technologies
As exporters Economies with some exporting activity of ADP-related goods
Economies that either show relative specialization in exporting ADP-related goods or sell large volumes in world markets (above the average market share once frontrunners are excluded)
Latecomers in use (13 economies)
As importers Economies with some importing activity of ADP-related goods
Economies that either show relative specialization in importing ADP-related goods or sell large volumes in world markets (above the average market share once frontrunners are excluded)
Laggards (88 economies)
Economies showing no or very low engagement with ADP technologies
All other economies not included in the previous groups
Note: The characterization is for 167 economies that, according to the United Nations Statistical Division, had more than 500,000 inhabitants in 2017. See Annex A.1 for the classification of economies by their level of engagement with ADP technologies.Source: UNIDO elaboration.
Table 1 From laggards to frontrunners in the emerging technological landscape
7
ov
er
vie
w
Within countries, only a handful of firms are fully adopting ADP technologies
The 4IR affects a small portion of the economy in most countriesThe global characterization just presented is con-firmed when looking at the industrial sector of indi-vidual countries. In most countries, different genera-tions of digital technology applied to manufacturing production coexist, and those associated with the 4IR have permeated only a small part of the sector.
Developing countries retrofit 4IR technologies to incomplete 3IR systemsFirms in developing countries still use — often ineffectively — 3IR technologies. Their lack of com-mand of 3IR technologies — basic automation and
ICTs — also makes it difficult for them to fully engage with the opportunities of ADP technologies and the 4IR. The main opportunities for these countries lie, therefore, in the gradual integration of these technolo-gies within existing 3IR production systems, retrofit-ting production plants in areas of the firm where inte-gration is possible (Andreoni and Anzolin, 2019).
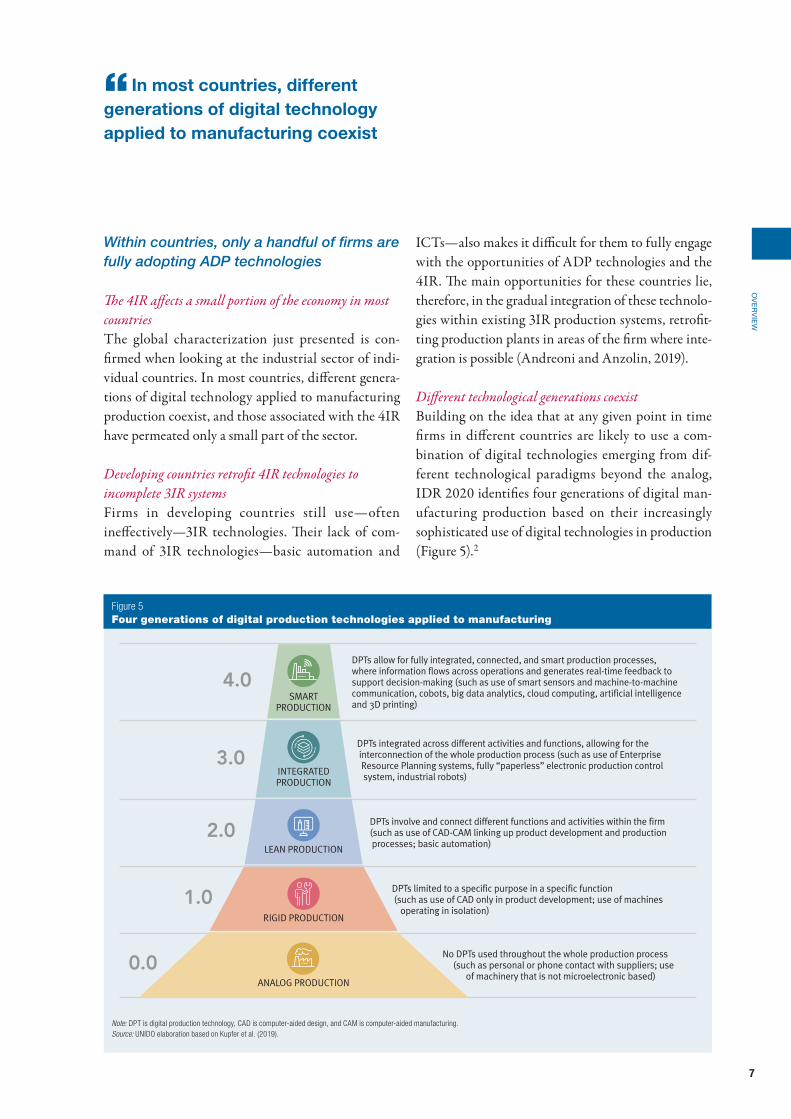
Different technological generations coexistBuilding on the idea that at any given point in time firms in different countries are likely to use a com-bination of digital technologies emerging from dif-ferent technological paradigms beyond the analog, IDR 2020 identifies four generations of digital man-ufacturing production based on their increasingly sophisticated use of digital technologies in production (Figure 5).2
“ In most countries, different generations of digital technology applied to manufacturing coexist
Figure 5 Four generations of digital production technologies applied to manufacturing
SMARTPRODUCTION
4.0
3.0
2.0
1.0
0.0
DPTs allow for fully integrated, connected, and smart production processes, where information flows across operations and generates real-time feedback to support decision-making (such as use of smart sensors and machine-to-machine communication, cobots, big data analytics, cloud computing, artificial intelligence and 3D printing)
DPTs integrated across different activities and functions, allowing for the interconnection of the whole production process (such as use of Enterprise Resource Planning systems, fully “paperless” electronic production control system, industrial robots)
DPTs involve and connect different functions and activities within the firm (such as use of CAD-CAM linking up product development and production processes; basic automation)
DPTs limited to a specific purpose in a specific function (such as use of CAD only in product development; use of machines operating in isolation)
No DPTs used throughout the whole production process (such as personal or phone contact with suppliers; use of machinery that is not microelectronic based)
INTEGRATEDPRODUCTION
LEAN PRODUCTION
RIGID PRODUCTION
ANALOG PRODUCTION
Note: DPT is digital production technology, CAD is computer-aided design, and CAM is computer-aided manufacturing.Source: UNIDO elaboration based on Kupfer et al. (2019).

88
ov
er
vie
w
As many as 70 percent of firms are still in analog productionThe bottom of the pyramid represents an initial stage of production where digital technologies are not used in any area of the firm. This seems to be the reality in least developed countries (LDCs) and low-income economies. Most of the manufacturing sector in countries defined as laggards fall into this category. In Ghana, for instance, almost 70 percent of firms surveyed for this report fall in the analog category. Once firms start adopting digital technologies, four generations are distinguished. The first, rigid produc-tion, is characterized by the use of digital applications for specific purposes only and in isolation from each other. The second, lean production, refers to the semi-flexible automation of production with the aid of digi-tal technology, accompanied by a partial integration across different business areas. The third, integrated production, entails using digital technologies across all business functions. The fourth and final mode is characterized by the use of digital technologies with information feedback to support decision-making.
Moving to the next generation requires big changesGeneration 1.0 and generation 2.0 have been around for as long as numerical control programming systems have existed (late 1950s), though devices such as CAD have evolved exponentially in recent years thanks to parametric engineering. Even if efficiency and quality of processes are substantially improved, evolving from generation 1.0 to generation 2.0 does not require major organizational changes. But evolving from generation 2.0 to generation 3.0 requires substantial changes — to fully integrate organizational functions, with compre-hensive and effective standardization of processes and information systems. Generation 4.0 implies the use of ADP technology-based solutions, such as advanced communications devices, robotization, sensorization, big data and artificial intelligence.
Few firms use the most advanced technologiesEvidence collected for five countries show that only a handful of manufacturing firms are adopting ADP
technologies (Figure 6). Despite large cross-country differences, in all countries surveyed, the diffusion of the highest generations of digital technologies (gen-erations 3.0 and 4.0) is incipient: adopters represent a niche, ranging from 1.5 percent in Ghana to about 30 percent in Brazil. The survey results also show how different generations of technologies coexists within developing countries, creating “technological islands,” where a few firms with advanced technologies are sur-rounded by a majority of firms operating at a much lower technological level.
Leapfrogging into the 4IR depends on country and industry conditionsA key question for countries where most manufac-turing firms lie far below the frontier — concentrated somewhere between analog and generation 1.0 — is how can they move up in the technological ladder. In particular, can these firms skip some generations or
“Only a handful of manufacturing firms are adopting ADP technologies
Figure 6 Adoption of ADP technologies is still limited among developing countries
0
25
50
75
100
BrazilArgentinaThailandViet NamGhana
Shar
e of
firm
s ad
optin
g te
chno
logi
cal g
ener
atio
ns (p
erce
nt)
Generation 0.0 and 1.0 Generation 2.0 Generation 3.0 Generation 4.0
29
37
43
0.4
251753
42
43
2213
10
74
[6]
84
[8]
89
[69]
1.5
Note: Numbers in brackets are generation 0.0 firms. For Argentina and Brazil no information on generation 0.0 is available due to the structure of their survey questionnaires. Countries are ordered according to the shares of firms currently adopting the highest generations of digital technologies (generations 3.0 and 4.0). See Annex A.3 for more detailed information on the surveys.Source: UNIDO elaboration based on data collected by the UNIDO firm-level survey “Adoption of digital production technologies by industrial firms” (for Ghana, Thailand and Viet Nam) and Albrieu et al. (2019) and Kupfer et al. (2019) (for Argentina and Brazil).

9
ov
er
vie
w
directly leapfrog to the most advanced? Differences in capabilities, endowments, organizational charac-teristics and technological efforts, as well as domestic infrastructural and institutional conditions explain why some firms (and countries) succeed in ascending the ladder and others do not.
New technology diffusion is also concentrated by industry and size
The diffusion of ADP technologies is uneven across industriesDifferences in technological intensity and production processes make some manufacturing industries within a country more likely to adopt ADP technologies. Two industries stand out: computer and machinery and transport equipment. These industries show above-average adoption of key ADP technologies (Figure 7). The computer and machinery industry has the highest use of cloud computing and 3D printing technologies, 10–15 percentage points above average, while the trans-port equipment industry is ranked second and is top for the use of industrial robots in manufacturing. As ADP technologies continue their broad-based diffusion, other
industries (even with low technology intensity) might also take the lead in the adoption of these technologies.
Frontrunners and followers tend to specialize in these industriesThe stronger engagement of frontrunners and follow-ers with ADP technologies also stem from the fact that they have a much higher share of technology- and digital-intensive (TDI) industries (comprising com-puter and machinery and transport equipment) in their MVA. These industries gained in importance especially after 2005, the year after which the diffu-sion of ADP technologies took off. Such superior per-formance is strongly driven by productivity growth. However, the story of their development is not about the substitution of the new technologies for labour — it is more about the contribution of these technolo-gies to their competitiveness and expansion, which made the development process inclusive, thanks to the growth of both productivity and employment.
Larger firms adopt more ADP technologiesSize also matters when it comes to ADP technology. Large firms, thanks to — but not only to — the larger
“Some manufacturing industries are more likely to adopt ADP technologies
Figure 7 Rates of adoption of key ADP technologies differ across industries in Europe
a. Cloud computing b. 3D printing c. Industrial robots
Food products,beverages and tobacco
Textiles, wearingapparel and leather
Basic metals andfabricated metal products
Other manufacturing andrepairs of computers
Wood and paperproducts, and printing
Chemicals, refined petroleumand nonmetallic products
Transport equipment
Computers, electronicsand machinery
–10 0 10 20 –10 0 10 20Distance to the average rate of adoption (percentage points)
–10 0 10 20
Note: All values are for 2018 and are aggregates for the 28 countries of the European Union. Rate of adoption is defined as the percentage of firms in an industry using a chosen technology. Due to data availability, chemicals is presented together with refined petroleum and non-metallic products (ISIC codes 19 to 23). The colours of the bars reflect the technology and digital intensity classification of industries. Green = TDI industries (industries that are simultaneously intensive on digitalization and technology). Blue = industries that are intensive on either digitalization or technology but not both. Red = industries that are intensive on neither digitalization nor technology. The bars show the distance from the average rate of adoption in all manufacturing industries, in percentage points.Source: UNIDO elaboration based on Eurostat (2019).
1010
ov
er
vie
w
investments their resources permit, tend to enjoy tech-nological and productive capabilities that make them more likely to adopt the new technologies. Data on the five countries surveyed for this report support this argument since a higher share of larger firms adopt the highest generations of digital production technologies (generations 3.0 and 4.0). In Argentina, for instance, the adoption rate within large firms (more than 100 employees) is 20 percentage points higher than the average rate of adoption. Nonetheless, in some cases (such as Thailand) the penetration of new technolo-gies can also be strong in small firms.
What is needed to engage with ADP technologies?
Engaging requires industrial capabilities at the country level
Developing countries face five broad challengesThe vast majority of developing countries are far from becoming established players in this field because they face specific challenges in engaging with the new tech-nologies. These challenges can be grouped under five broad headings (Andreoni and Anzolin, 2019):• Basic capabilities. The production capabilities
required for absorbing, deploying and diffus-ing ADP technologies along the supply chains are scarce and unevenly distributed. These tech-nologies have also raised the “basic capability threshold,” not because they are entirely new but because they imply the fusion of new and existing technologies into complex integrated technology systems.
• Retrofitting and integration. Companies in devel-oping countries that could make technology investments in this area have already committed resources to older technology, and they need to learn how to retrofit and integrate the new digi-tal production technologies into their existing production plants. Setting up brand new plants is rarer because it requires significant long-term investment and access to markets.
• Digital infrastructure. These technologies demand substantial infrastructure for use in production. Some developing countries face significant chal-lenges in providing affordable and high-quality electricity as well as reliable connectivity. These and other infrastructure bottlenecks might make technology investments by individual firms too risky and financially unviable.
• Digital capability gap. In many developing coun-tries, companies engage with some ADP tech-nologies, but many of these technologies remain contained within the company and, occasionally, a few close suppliers who have the basic production capabilities to use them. Around these 4IR islands, the vast majority of firms still use technologies typical of the 3IR or even 2IR. In this context, it is extremely difficult for the leading companies to link backwards and nurture their supply chains. When this digital capability gap is extreme, the diffusion of ADP technologies remains very limited.
• Access and affordability. These technologies tend to be controlled by a limited number of countries and their leading firms. Developing countries rely dramatically on importing these technolo-gies and in many cases, even when they can mobi-lize the resources to access them, they remain dependent on providers for hardware and software components.
To engage with ADP technologies, developing economies must build industrial capabilitiesTaken together, these challenges point in one direction — the need to build basic industrial production capa-bilities as a prerequisite to entering the 4IR. In fact, the differences in engagement with ADP technologies reflect the global heterogeneity of industrial capabili-ties: frontrunners tend to have larger industrial capa-bilities than followers, followers larger capabilities than latecomers and latecomers larger capabilities than laggards. In each group, a clear distinction can also be made based on production (innovating and exporting), which requires greater industrial capabilities than use.
“To engage with ADP technologies, developing economies must build industrial capabilities

11
ov
er
vie
w
Industrial capabilities distinguish frontrunners and followers from latecomers and laggardsIn 2017, the frontrunners presented an average Competitive Industrial Performance (CIP) Index much higher than all other country groups (Figure 8). UNIDO’s CIP Index reflects the industrial perfor-mance of countries and thus can be a proxy for their underlying industrial capabilities — higher CIP should be associated with stronger industrial capabilities. The followers in production had an average CIP half that of the frontrunners, but higher than that of followers in use. Followers also show larger CIP values than late-comers, who rank higher than laggards. Each category has an average CIP value larger than the previous one, illustrating the stairway of industrial capabilities that countries need to climb in order to engage and upgrade roles in the use and production of ADP technologies.
Industrial capabilities are built in manufacturing firms
Firm capabilities are preconditions for adopting new technologiesThe industrial capabilities of a country ultimately depend on the capabilities of firms. So, the diffusion of ADP technologies depends on firms acquiring the necessary capabilities — executable routines or proce-dures for repeated performance in a specific context, produced by learning in an organization (Cohen et al. 1996). Many different capabilities are needed to engage with ADP technologies, but acquiring them is not an easy or linear process.
Investment, technology and production capabilities are crucial for adopting and using new technologyInvestment and technology capabilities enable a firm to deal with technological change. They include the technological knowledge, resources and skills firms need to adopt and use equipment and technology, expand output and employment and further upgrade their technological competence and business activi-ties. Production capabilities are related to experience, learning by doing and the behaviours of entrepreneurs
related to production. These capabilities represent the first step for firms to acquire the base needed for fur-ther technology improvements.
Capabilities are accumulated graduallyAcquiring capabilities is often a gradual process, as firms and countries first industrialize and acquire basic capabilities, then upgrade towards higher levels of technology. Distinguishing developing country firm capabilities into basic, intermediate and advanced expresses the incremental steps for companies to accu-mulate capabilities over time (Table 2). Companies must go through this process to capture the oppor-tunities offered by ADP technologies and to remain competitive and innovative.
Basic production capabilities remain criticalMastering the basic capabilities — often associated with production — –is critical for effectively deploy-ing new technologies and retaining efficiency. Even
“The industrial capabilities of a country ultimately depend on the capabilities of firms
Figure 8 Engaging with ADP technologies requires increasing industrial capabilities
0.0
0.1
0.2
0.3
0.4
FrontrunnersFollowersin production
Followersin use
Latecomersin production
Latecomersin use
Laggards
Aver
age
Com
petit
ive
Indu
stria
l Per
form
ance
Inde
xFollowers, 0.131
Latecomers, 0.037
Economies activelyengaging with ADPtechnologies
Note: Average Competitive Industrial Performance Index values for 2017. ADP is advanced digital production. See Annex A.1 for the classification of economies by their level of engagement with ADP technologies.Source: UNIDO elaboration based on the Competitive Industrial Performance Index 2019 database (UNIDO 2019c) and dataset by Foster-McGregor et al. (2019) derived from Worldwide Patent Statistical Database 2018 Autumn Edition (EPO 2018).

1212
ov
er
vie
w
the simplest productive activities often require the activation and matching of interdependent clusters of capabilities. The development of these capabilities is related to the existence of an industrial ecosystem in which industrial firms can operate and learn.
Each company has a “unique bundle of capabilities”As different companies face different learning chal-lenges, their pace of developing new capabilities is likely to be uneven (Andreoni and Anzolin 2019). In developing countries in particular, this unevenness reinforces firm heterogeneity, with a large number of
low-capability and low-performance actors coexist-ing with more advanced ones. This divide between the most advanced companies and the rest has been defined as the digital capability gap.
The digital capability gap may harm both advanced and low-capability firmsThe gap’s direct consequence is the creation of the 4IR islands observed in Figure 6 — a few major leading companies engaged with ADP technologies operating as islands in a sea of firms without capabilities and still using outdated technologies. Leading firms may be
“ In developing countries, a large number of low-capability actors coexists with more advanced ones
Table 2 Accumulating investment, technology and production capabilities for advanced digital production
Investment Technology Production
BA
SIC
Simple, routine-based
Feasibility studyBasic market and competitors analysisBasic finance and financial flow management
External sourcing of information (for example from suppliers, industry networking, public information)Basic training and skills upgradingRecruitment of skilled personnel
Plant routine coordinationRoutine engineeringRoutine maintenanceMinor adaptation of production processes and process optimizationBasic product design, prototyping and customizationProduct and process standards compliance, product quality managementQuality managementBasic bookkeepingBasic packaging and logisticsBasic advertisingSupplier monitoringBasic export analysis and some links with foreign buyers
INT
ER
ME
DIA
TE
Adaptive, based on search, experimentation, external cooperation
Seizing market opportunitiesSearch for equipment and machineryProcurement of equipment and machineryContract negotiationCredit negotiation
Seizing technology opportunitiesTechnology transferTechnological collaboration with suppliers/buyers (downstream and upstream)Vertical technology transfer (if in global value chain)Linkages with (foreign) technology institutionsLicensing new technology and softwareAlliances and networks abroadFormal process of staff recruitmentFormalized training, retraining and reskillingSoftware engineering, automation and information and communications technology skills
Routinized process engineeringPreventive maintenanceAdaptation/improvement of externally acquired production technologyIntroduction of externally developed techniquesProcess remodularization and scaling upReorganisation of workforceReverse engineering (product)Product design improvementProduct life-cycle managementQuality certificationProductivity analysisAuditingInventory controlDedicated marketing departmentBasic brandingSupply chain/logistics managementSystematic analysis of foreign markets

13
ov
er
vie
w
harmed by the gap, because they have trouble linking backwards and nurturing their supply chains. Thus, the gap turns a technology upgrading opportunity into a digital industrialization bottleneck.
Engaging in industrial production is key to closing the gapPolicy debates tended to focus mostly on investment and technology capabilities. IDR 2020 shows that production capabilities are also of prime importance. An analysis of the determinants of adopting new
technologies shows that production capabilities are the most important ones (Figure 9). These capabili-ties can be acquired only through past experience in industrial production.
Combined, the investment, technology and production capabilities lead to innovationInvestment and technology capabilities fully disclose their importance when combined with production capability variables. Production capabilities are more important to explain the adoption of technology. This
“The gap turns a technology upgrading opportunity into a digital industrialization bottleneck
Investment Technology Production
AD
VAN
CE
D
Innovative, risky, based on advanced forms of collaboration and R&D
World-class project management capabilitiesRisk managementEquipment design
Research in process and product, R&DFormal training systemContinuous links with R&D institutions and universities, cooperative R&DInnovative links with other firms and market actorsLicensing own technology to othersOpen innovation ecosystem
Process engineeringContinuous process improvementNew process innovationNew product innovationMastering product designAdvanced organizational capacity for innovationWorld-class industrial engineering, supply chain and logisticsInventory managementBrand creation and brand deepeningAdvanced distribution system and coordination with retailers/buyersOwn marketing channels and affiliates abroadForeign acquisition and foreign direct investment
Production system integration capabilities
Seizing technology integration solutionsSeizing organizational integration solutionsData analytics for decision-making and risk management
Integrated product and process R&DAdvanced digital skills developmentInternal/own software platform development
Predictive and real-time maintenanceCyber- physical systems for virtual product/process designTechnological and organizational integrationAgile and smart productionDigital and automated inventory controlReal-time production and supply chain dataFully integrated information systems across all functions (for example, enterprise resource planning)Big data analytics throughout all production stages (product design, production, marketing, logistics…)
SYSTEMIC
Enabling institutional and infrastructure capabilities
Reliable energy supplyReliable connectivityBandwidth connectivity infrastructure (ethernet and wireless)Digital technology institutions infrastructureData ownership policy and software licensing accessibility
Source: UNIDO elaboration based on UNIDO (2002) and Andreoni and Anzolin (2019).
Table 2 (continued) Accumulating investment, technology and production capabilities for advanced digital production

1414
ov
er
vie
w
does not mean that investment and technology vari-ables do not matter. Combined, investment, technol-ogy and production capabilities delivered a premium of higher adoption rates of new processes technologies compared with firms where only one of the two cat-egories of capabilities is present.
Firm participation in global value chains is associated with using ADP technologyFor manufacturing firms in developing and emerging industrial economies, learning about ADP technolo-gies may also depend on their integration in interna-tional trade and production networks. International trade and production networks can be viable chan-nels for knowledge transfer to suppliers downstream in a global value chain (GVC). Evidence from the countries surveyed for this report confirms that par-ticipation in GVCs positively affects the probability
of adopting new technologies.3 This positive correla-tion holds when controlling for other factors likely to shape the adoption of new production technologies, such as size, sector, human capital and R&D and machinery investments. Integration in manufactur-ing GVCs can represent an important opportunity for lagging countries to enter the ongoing technologi-cal race.
Engaging also requires specific skills in the labour force
ADP technologies require “skills of the future”Technological change is not neutral when it comes to the skills demanded. The adoption of ADP technolo-gies requires the development of skills complemen-tary to the new technologies (Rodrik 2018). Three groups of skills (the “skills of the future”) are par-ticularly important for ADP technologies: analytical skills; specific technology-related skills, including science, technology, engineering and math (STEM) — and ICT-related skills; and soft skills. As the jobs created by new technologies are likely to be more demanding of new and technical skills, and analytic and cognitive abilities, the skills of future will pro-vide the best safeguard against the risk of displace-ment by technology.
Firms with higher technological intensity have more STEM professionalsGreater demand for these skills is already reflected in the employment profile of firms with higher tech-nological intensity. The shares of STEM employees are consistently higher among more technologically dynamic firms, which are engaging or ready to engage with ADP technologies. Moreover, these firms also recognize the growing importance of technology-related skills, such as human–machine interaction skills. Soft skills are also projected to become very important in the future. The reason may be that many new technologies require employees to work as well-integrated teams and to learn procedures and systems rapidly.
“Participation in GVCs positively affects the probability of adopting new technologies
Figure 9 Production capabilities are key for the adoption of technological process innovation
0.0
0.1
0.2
0.3
0.4
0.5
Investment and technology,and production capabilities
Productioncapabilities
Investment andtechnology capabilities
Prob
abili
ty o
f ado
ptio
n of
pro
cess
inno
vatio
n
Note: The analysis includes 13 African economies (Democratic Republic of Congo, Ghana, Kenya, Malawi, Namibia, Nigeria, Rwanda, South Sudan, Sudan, the United Republic of Tanzania, Uganda, Zambia and Zimbabwe) and four South Asian economies (Bangladesh, India, Nepal and Pakistan). Only manufacturing firms are considered. The graph depicts coefficients and confidence intervals (at 95 percent) for the average marginal effects of the variables of interest on the probability of adopting a process innovation. A linear probability model was implemented, with bootstrapped standard errors. Country and sector dummies are included.Source: UNIDO elaboration based on Bogliacino and Codagnone (2019) derived from World Bank Enterprise Survey (Innovation Follow-up, 2013–2014).
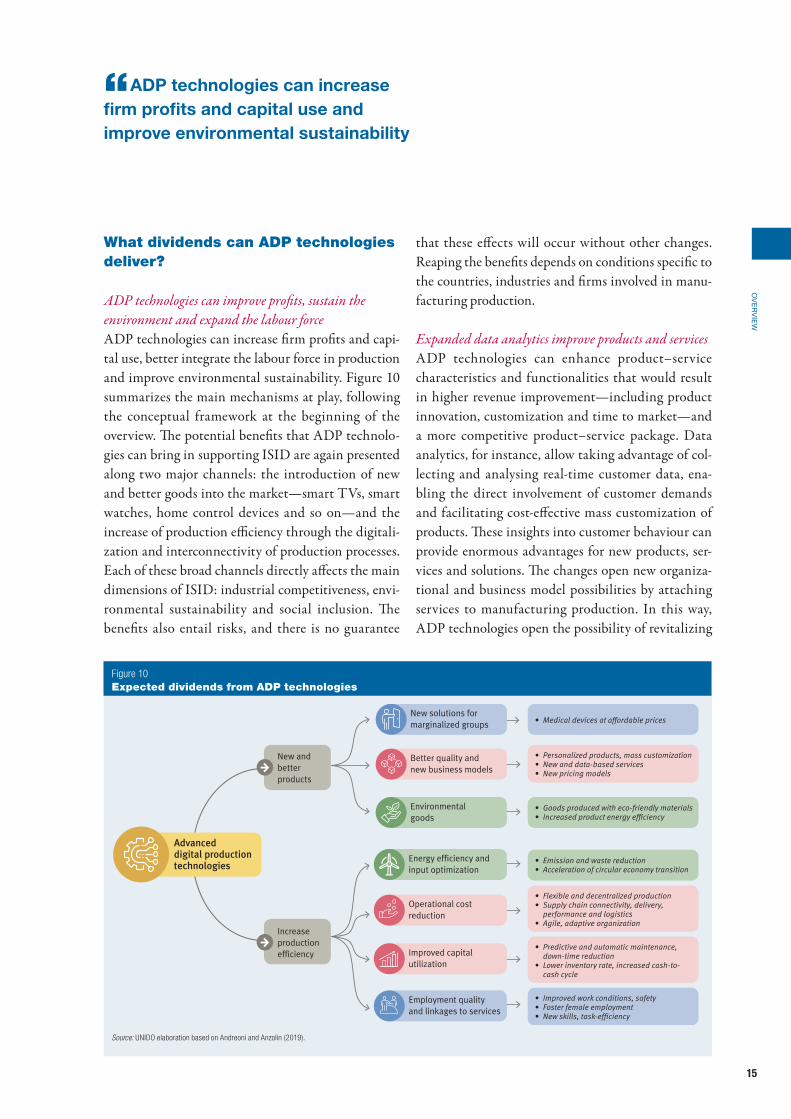
15
ov
er
vie
w
What dividends can ADP technologies deliver?
ADP technologies can improve profits, sustain the environment and expand the labour forceADP technologies can increase firm profits and capi-tal use, better integrate the labour force in production and improve environmental sustainability. Figure 10 summarizes the main mechanisms at play, following the conceptual framework at the beginning of the overview. The potential benefits that ADP technolo-gies can bring in supporting ISID are again presented along two major channels: the introduction of new and better goods into the market — smart TVs, smart watches, home control devices and so on — and the increase of production efficiency through the digitali-zation and interconnectivity of production processes. Each of these broad channels directly affects the main dimensions of ISID: industrial competitiveness, envi-ronmental sustainability and social inclusion. The benefits also entail risks, and there is no guarantee
that these effects will occur without other changes. Reaping the benefits depends on conditions specific to the countries, industries and firms involved in manu-facturing production.
Expanded data analytics improve products and servicesADP technologies can enhance product–service characteristics and functionalities that would result in higher revenue improvement — including product innovation, customization and time to market — and a more competitive product–service package. Data analytics, for instance, allow taking advantage of col-lecting and analysing real-time customer data, ena-bling the direct involvement of customer demands and facilitating cost-effective mass customization of products. These insights into customer behaviour can provide enormous advantages for new products, ser-vices and solutions. The changes open new organiza-tional and business model possibilities by attaching services to manufacturing production. In this way, ADP technologies open the possibility of revitalizing
“ADP technologies can increase firm profits and capital use and improve environmental sustainability
Figure 10 Expected dividends from ADP technologies
New andbetter products
New solutions formarginalized groups • Medical devices at a�ordable prices
• Personalized products, mass customization• New and data-based services• New pricing models
• Improved work conditions, safety• Foster female employment• New skills, task-e�ciency
• Flexible and decentralized production• Supply chain connectivity, delivery,
performance and logistics• Agile, adaptive organization
• Predictive and automatic maintenance, down-time reduction
• Lower inventory rate, increased cash-to-cash cycle
Increase productionefficiency
Better quality andnew business models
Environmental goods
Improved capitalutilization
Energy efficiency and input optimization
Employment qualityand linkages to services
Operational costreduction
• Goods produced with eco-friendly materials• Increased product energy e�ciency
• Emission and waste reduction• Acceleration of circular economy transition
Advanced digital production technologies
Source: UNIDO elaboration based on Andreoni and Anzolin (2019).

1616
ov
er
vie
w
industrialization and boosting economic growth by creating new goods and by blending manufacturing and service activities.
Fostering productivity
Firms adopting advanced technology have higher productivityFirms adopt ADP technologies to become more com-petitive and efficient. An econometric analysis condi-tional on other factors possibly affecting productivity of the countries surveyed for the report investigated whether firms with a higher level of digitalization were, on average, more productive than firms with lower levels (Figure 11). Even when controlling for a firm’s age, investments in research and development and machinery, human capital and GVC participa-tion, the adoption of ADP technology was positively and significantly associated with firm productivity. Technology adoption’s coefficient is large compared with the coefficients of other important significant factors.
Frontrunners and followers lead in manufacturing value added growth due to productivity growthWhat is true for the firms is also true for countries: economies actively engaging with ADP technologies — frontrunners and followers — show much faster growth of manufacturing value added (MVA) than the rest — latecomers and laggards (Figure 12). In low- and lower-middle income and high-income economies, frontrunners and followers have almost twice the growth rate of latecomers and laggards. In upper-middle income economies, the difference is more than 50 percent. Faster growth in MVA can be explained by more dynamic employment crea-tion, faster productivity gains or both. The largest differences are observed in the productivity dynam-ics. Frontrunners and followers are clearly ahead in productivity growth. Interestingly, in develop-ing countries — low- and lower-middle income and upper middle income — frontrunners and followers also show positive growth in employment during
this period. In high-income economies, instead, pro-ductivity growth more than compensated for a net destruction of direct jobs.
Strengthening intersectoral linkages
New technologies foster knowledge-intensive business servicesThe adoption of ADP technologies in manufactur-ing production requires additional support from other sectors of the economy, most notably knowl-edge-intensive services that provide the IT and digi-tal solutions needed to implement smart production. This stronger interaction with services can potentially expand the multiplier effects of manufacturing pro-duction on job creation and poverty alleviation and open new windows of opportunity for countries to enter the manufacturing system.
“Economies actively engaging with ADP technologies show much faster growth than the rest
Figure 11 The adoption of ADP technologies is positively associated with productivity
0.0
0.4
0.8
1.2
1.6
Advanceddigital
productiontechnologies
Foreignownership
Investmentsin R&D andmachinery
Firmsize
Skilledhumancapital
Globalvalue chain
participation
Age
Mar
gina
l effe
ct o
n la
bour
pro
duct
ivity
Note: The graph depicts the coefficients and confidence intervals (at 90 percent) of the variables of interest on labour productivity, obtained implementing regression analysis on the firms surveyed in Ghana, Thailand and Viet Nam. The variable “Advanced digital production technologies” is a binary variable that takes the value of 1 if a firm is using generations 3.0 or 4.0 technologies, 0 otherwise. Country and sector dummies are included. Source: UNIDO elaboration based on Pietrobelli et al. (2019) derived from the data collected by the UNIDO firm-level survey “Adoption of digital production technologies by industrial firms.”

17
ov
er
vie
w
Such services produce innovation and transmit new knowledgeKnowledge-intensive business services (KIBS) have an important role as producers of innovation and as carri-ers of new knowledge in an economy. They are mainly intermediate services (sold to other sectors rather than to final consumers), and through these linkages, they diffuse innovations along the value chain.
Frontrunners and followers tend to rely more on KIBS when producing industrial goodsThe higher the income of the country group, the higher the share of KIBS in the value added generated by man-ufacturing, indicating the importance of knowledge-intensive inputs for the kinds of manufacturing activities undertaken by high-income economies. KIBS are not related just to country income levels. Across all income groups, the integration of KIBS is also larger in econo-mies actively engaging with ADP technologies (Figure 13). As countries move to a higher level of engagement in developing and deploying ADP technologies, KIBS need to play an increasing role in manufacturing.
Creating jobs, not destroying them
Look beyond direct effects (workers displaced) to indirect and net effectsConcerns have been raised on the potential effect that ADP technologies can have in the labour market. But when evaluating the ultimate effect of a new technol-ogy (such as robots) on employment, all channels need to be considered. A sectoral or industry focus makes it difficult to assess the impact of technology on employ-ment in the overall economy. So, it is necessary to ana-lyse the direct and indirect macro effects of new tech-nologies on employment. The indirect effects are based on both domestic and international linkages obtained from intercountry input-output tables.4
The indirect effects can outweigh the direct effectsTo assess the impact of ADP technologies on employ-ment, IDR 2020 finds that increasing the stock of robots in one particular industry has a direct effect on the employment of that industry, but also indi-rect effects on the rest of the value chain (Figure 14).
“As countries deploy ADP technologies, knowledge-intensive business services play an increasing role
Figure 12 Economies active in ADP technologies grow faster than the rest, across all income groups
a. Real MVA growth b. Employment growth c. Productivity growth
Low- andlower-middle
income
Upper-middleincome
Highincome
0 2 4 86Average yearly growth rate (percent)
–2 0 2 4Average yearly growth rate (percent)
–2 0 2 4Average yearly growth rate (percent)
Economies actively engaging with ADP technologies Other economies
Note: ADP is advanced digital production. MVA is manufacturing value added. Each panel shows the average yearly growth rate of the corresponding group and variable between 2005 and 2017. The analysis includes 166 economies (from which 50 are actively engaging with ADP technologies), which are classified according to World Bank’s income group definitions for 2017: 73 low and lower-middle income economies (of which 4 are active); 44 upper-middle income economies (of which 13 are active), and 49 high income economies (of which 33 are active). Productivity is calculated as manufacturing value added in constant $ 2010 per number of workers. See Annex A.1 for the classification of economies by their level of engagement with ADP technologies.Source: UNIDO elaboration based on the Manufacturing Value Added 2019 database (UNIDO 2019g), ILO (2018), and dataset by Foster-McGregor et al. (2019) derived from Worldwide Patent Statistical Database 2018 Autumn Edition (EPO 2018).

1818
ov
er
vie
w
The increase in the use of robots in an industry has indirect effects on employment in customer and sup-plier industries. For example, the industry using more robots might produce intermediate products of better quality, sell at cheaper prices or both for its customer industries, which in turn could increase competitive-ness and hire more workers to expand their businesses. That increase in the use of robots could also have an indirect impact on supplier industries because greater automation and changes in production processes could translate into greater demand for certain mate-rials and components. Such a change in the demand emanating from a robotizing industry could have an impact on the employment of its supplier industries in either a positive or a negative way. At the same time, customers and suppliers can be located in the same economy (thus affecting domestic employment) or other economies (thus affecting foreign employment).
Between 2000 and 2014, the increase in industrial robots in manufacturing led to net job creation globallyOnce all effects are considered, the contribution of annual growth in the stock of industrial robots to employment growth from 2000 to 2014 is positive, though very small. The main positive effects come
“ Increasing the stock of robots in one industry has indirect effects on the rest of the value chain
Figure 14 Aggregate impact of the increase in industrial robot use in individual industries on world employment
CUSTOMERINDUSTRIES
CUSTOMERINDUSTRIES
CUSTOMERINDUSTRIES
TEXTILES CHEMICALS COMPUTERS
SUPPLIERINDUSTRIES
SUPPLIERINDUSTRIES
SUPPLIERINDUSTRIES
Growth in theuse of industrial
robots 2000–2014(annual average)
Aggregateimpact oncustomerindustries
Aggregateimpact onownindustries
Aggregateimpact onsupplierindustries
Source: UNIDO elaboration.
Figure 13 Manufacturing industries in economies actively engaging with ADP technologies are more integrated with KIBS, at all incomes
0
2
4
6
8
10
12
High-income economiesLow- and middle-income economies
All economies
Shar
e of
KIB
S in
val
ue a
dded
gen
erat
ed b
y m
anuf
actu
ring
(per
cent
)
Income group
Economies actively engaging with ADP technologiesOther economies
Note: KIBS is knowledge-intensive business services. ADP is advanced digital production. Average values for the period 2005–2015. Manufacturing value added is in current $. The analysis includes 63 economies, which are classified according to World Bank’s income group definitions for 2005: 30 low and middle income economies (of which 9 are active), and 33 high income economies (of which 24 are active). See Annex A.1 for the classification of economies by their level of engagement with ADP technologies.Source: UNIDO elaboration based on Inter-Country Input-Output (ICIO) Tables (OECD 2016, 2018b).

19
ov
er
vie
w
“ Firms engaging with ADP technologies expect to increase—or at least keep—their employees
from international supplier linkages and domes-tic customer linkages. Domestic supplier linkages, in contrast, show negative effects on employment. Interestingly, most of the jobs were created in emerg-ing economies due to the increase in the stock of robots in industrialized economies.
Firms using robots can generate more jobs than firms not using themThis indicates the importance of taking into consid-eration the possibility for output growth due to robot adoption in addition to its effect on change in the pro-duction process (increasing capital intensity), relative to nonadopting firms. If greater use of robots makes production management easier and increases capital’s income share relative to labour’s without much contrib-uting to the firm’s or industry’s higher competitiveness and output increase, robot adoption is likely to have a negative impact on employment. But if robot adopters are to experience much faster growth than nonadopters — due to increased production scales, intersectoral com-plementarity, redistribution of work in a value chain and relocation of workers within a firm — firms and industries adopting robots are likely to have a higher chance of generating jobs than those avoiding robots.
Technologically dynamic firms anticipate stable (or even greater) employmentThe findings are in line with recent studies using long-term firm level and worker-level data that show that (at least in frontrunner economies, such as Germany) the adoption of robots has not increased the risk of displace-ment for incumbent manufacturing workers (Dauth et al. 2018). This is also confirmed at the micro level in the five countries surveyed for this report: the majority of firms engaging or ready to engage with ADP technol-ogies expect to increase (or at least keep) their employees with the adoption of those technologies.
New technologies can also improve workers’ conditions and involvementADP technologies also affect the social dimension of manufacturing production. They can improve
workers’ conditions in industrial production by intro-ducing new workflows and task allocations, as well as increasing the skill threshold of the workforce. For instance, automation solutions in the automotive sec-tor have offered opportunities for reorganizing pro-duction tasks, moving workers away from those most physically demanding. ADP technologies can also improve working conditions in manufacturing plants. Today’s standard practice entails having workers man-age advanced robots. The increased collaboration between humans and robots (or cobots) will create a blended workforce. Safety and tracking technologies also increase safety and improve working conditions on the shop floor.
Sustaining the environment
ADP technologies tend towards environmentally friendly solutionsADP technologies have above-average green content (Figure 15). This is especially the case for the tech-nologies related to robots, machine learning and CAD-CAM systems and, to less extent, for additive manufacturing technologies. The most important characteristic highlighted by patent reviewers of these technologies is their potential contribution to mitigat-ing greenhouse gas emissions. This is another impor-tant dividend to consider, especially in relation to the ISID framework (see Figure 1).
ADP technologies boost circular economy processesADP technologies are also expected to boost circular economy processes, decoupling natural resource use from the environmental impact of economic growth. This, in turn, supports the achievement of the SDG 6 for energy, SDG 12 for sustainable consumption and production and SDG 13 for climate change. In circu-lar economy processes, resource flows — particularly materials and energy — are narrowed and, to the extent possible, closed. Products are designed to be durable, reusable and recyclable, and materials for new prod-ucts come from old products. Circular economy mod-els also reduce the underuse of products and provide

2020
ov
er
vie
w
resource efficiency benefits. Data from electronic devices, networks and internet-connected equipment can provide companies with insights about how they use their resources and how they could improve the design of their products and services, product life-cycle management or supply chain planning (Rizos et al. 2018).
Technologically dynamic firms are optimistic about environmental improvementsFirm level data confirm this pattern. In Ghana, Thailand and Viet Nam, in all environmental domains — water, energy, materials and waste — the majority of firms already engaging or ready to engage with ADP technologies agree that the use of these technologies would lead to environmental improvements (Figure 16). Efficient use of materials means sustainability, but also savings that can trigger further expenditures
and multiplier effects for firms and generate rebound effects increasing economic activity and thus environ-mental impact.
The dividends are not automatic and entail risks
Developing country firms face supply-chain reorganization and backshoringAn important area of concern regarding ADP tech-nologies is their potential impact on the organization of global production. For firms in developing countries — especially those participating in GVCs — threats from supply chain reorganization, delocalization of production and backshoring are a common fear.
Digitalization could increase oligopoly and power concentrationFirms in developing countries may be harmed by the progressive integration of ADP technologies into
“The use of ADP technologies would lead to environmental improvements
Figure 15 ADP technologies have above-average green content
0
5
10
15
20
25
Additivemanufacturingtechnologies
Robot, machine learningand CAD-CAMtechnologies
ADP technologies
Shar
e of
gre
en p
aten
ts (p
erce
nt)
All technologies, 3.6
Note: ADP is advanced digital production. CAD-CAM is computer-aided design and computer-aided manufacturing. When a patent examiner considers that a patent is contributing to climate change mitigation, a special Y02 tag is attached. This tag makes it possible to identify from all patents the subgroup that refers to green technologies and compare with it the corresponding share of green patents in all patents applied in any technology field (not only ADP technologies) in the past 20 years.Source: UNIDO elaboration based on dataset by Foster-McGregor et al. (2019) derived from Worldwide Patent Statistical Database 2018 Autumn Edition (EPO 2018).
Figure 16 The majority of firms engaging or ready to engage with ADP technologies agree that these will lead to environmental improvements
0
20
40
60
80
100
Savingenergy
Savingmaterials
Minimizingwaste
Savingwater
Shar
e of
firm
s de
clar
ing
that
in 5
to 1
0 ye
ars
ADP
tech
nolo
gies
will
hav
e a
high
or
very
hig
h co
ntrib
utio
n in
impr
ovin
g en
viro
nmen
tal s
usta
inab
ility
(per
cent
)
Note: Data refers to firms surveyed in Ghana, Thailand and Viet Nam and includes only those firms currently engaging or ready to engage with ADP technologies. See Annex A.3 for more detailed information on the surveys.Source: UNIDO elaboration based on data collected by the UNIDO firm-level survey “Adoption of digital production technologies by industrial firms” and Kupfer et al. (2019).

21
ov
er
vie
w
“ADP technologies might induce backshoring, even though it is not frequent
GVCs, since they might face increasing barriers to access. As the increased digital integration of systems through software platforms affects the structure of GVCs, concerns arise about the coordination and gov-ernance mechanisms in fully digitalized supply chains and possibly increasing concentration of power and oligopolistic and monopolistic markets (Andreoni and Anzolin 2019).
Advanced country backshoring could make developing country cheap labour irrelevantFirms in developing countries may also be harmed by the progressive diffusion of ADP technologies in advanced economies. The adoption of these technolo-gies is expected to reduce the relevance of cheap labour as a comparative advantage and increased backshoring towards industrialized economies, taking away some manufacturing activities and reducing job creation (Rodrik 2018). New cheap capital machinery and robots replacing manual work could induce companies to return production to high-income countries close to big consumer markets. This phenomenon could counterbalance previous decades’ extension of GVCs to decentralize production from high-income coun-tries to lower-income countries for activities requiring low skills and low salaries, such as assembly.
Not much backshoring is evidentBeyond hypotheses and anecdotal examples, how-ever, general evidence of backshoring is still scarce, so drawing conclusions on the ultimate impact on developing country employment and designing sound policies to address it is difficult. Empirical work for this report using the 2015 European Manufacturing Survey data of firms from eight European countries (Austria, Croatia, Germany, the Netherlands, Serbia, Slovenia, Spain and Switzerland) analysed the extent and determinants of backshoring.5 Three clear find-ings emerge.• First, backshoring is not as widespread as perceived
in the media and in the policy debate: 5.9 percent of all firms have backshored, while 16.9 percent have offshored.
• Second, labour cost is not the main reason why firms backshore from emerging economies, but it is important in backshoring from other high-income countries. Flexibility in logistics appears to be the main reason for backshoring from emerging economies. This finding is surprising, since in the current debate, the fear of job displacement due to advanced technologies relates to introducing cheap machines or robots that can replace human labour by further reducing production costs.
• Third, backshoring is more frequent for some sectors (chemical industry, machinery, electrical industry or transport equipment — rather than low-technology sectors) and for firms more inten-sively adopting ADP technologies. So, ADP tech-nologies might induce backshoring, even though it is not frequent.
Gender differences are pronounced in the susceptibility of jobs to digitalizationYet another area of concern is gender inequalities. Extended adoption of ADP technologies might increase the gap between men and women in manufac-turing labour markets, especially in developing coun-tries. Female workers in manufacturing are found to be more exposed to the risk of computerization than men are, since the computerization risk they face is on average about 2.9 percent higher than that of their male colleagues (Figure 17). Considering the type of occupation currently preformed, women are more likely to face a higher computerization risk than men if they are employed in food, beverages and tobacco, textiles and leather and chemicals. Interestingly no statistically significant gender differences in comput-erization risk are observed in the computers, electron-ics and vehicles sector.
Why do women tend to face a higher risk of losing jobs due to automation?The gender differences in computerization risk can be explained by, among other reasons, differences in skill endowments. Women in manufacturing on average score significantly lower than male workers

2222
ov
er
vie
w
in all skills that are particularly valuable to operate with ADP technologies and that constitute the broad category “skills of the future.” These skills are sup-posed to thrive in the 4IR and protect workers from destructive digitalization because they are less likely to be replaced by new technologies but, instead, more likely to be complemented by them. Gender gaps are significantly negative in all the “skills of the future.” As a more positive note for female workers, gender gaps in soft skills are less pronounced. Since recent empirical evidence supports the argument social skills are increasingly important, an advantage in these skills can contribute to narrowing gender gaps in the future.
Increasing women’s equitable participation promotes inclusive and sustainable industrial developmentUNIDO recognizes the importance of a compre-hensive debate on the relationship between gender and ADP technologies in manufacturing. Increasing
women’s equitable participation in the industrial workforce and the development of technologies is nec-essary to promote inclusive and sustainable industrial development (UNIDO 2019d).
What policy responses can make ADP technologies work for ISID?
Responses are highly contextualStrategic responses to ADP technologies are mixed across and within countries; they are highly contex-tual, reflecting the extent of industrialization, the penetration of digital infrastructure, the accumula-tion of technological and productive capabilities, the tradition of intervention in economic matters of national governments, and national priorities and capacities to mobilize public-private partnerships. There are no one-size-fits-all solutions, and it is still difficult to identify ready-made models. Generally, responses remain at the trial stage, with distinct
“There are no one-size-fits-all solutions
Figure 17 Female workers are more likely to face a higher computerization risk than men if they are employed in food, textiles and chemicals
50
54
58
62
66
70
Computers, electronics,machinery and
transport equipment
Chemicals andpharmaceutical
products
Wood and paperproducts, and printing
Basic metals andfabricated metal products
Textiles, wearingapparel and leather
Food products,beverages and tobacco
Total manufacturing
Mea
n va
lues
of c
ompu
teriz
atio
n ris
k (p
erce
nt)
FemaleMale
2.3
3.5*–0.7
–8.7**
2.2***
3.9***
3.0
Note: Computerization risk refers to the probability that an occupation will be computerized in the near future. The figure shows the female–male differences in mean values of computerization risk by sector. t-test of differences in means: *** p < 0.000; ** p < 0.05; * p < 0.1. The analysis includes Armenia, Colombia, Georgia, Ghana, Kenya, Lao People’s Democratic Republic, North Macedonia, the Plurinational State of Bolivia, Sri Lanka, Ukraine and Viet Nam. The colours of the bars reflect the technology and digital intensity classification of industries. Green = TDI industries (industries that are simultaneously intensive on digitalization and technology). Blue = industries that are intensive on either digitalization or technology but not both. Red = industries that are intensive on neither digitalization nor technology.Source: UNIDO elaboration based on dataset by Sorgner (2019) derived from the STEP Skills Measurement Program (World Bank 2016).

23
ov
er
vie
w
degrees of articulation in long-term national develop-ment strategies.
And depend on the relative position of economiesResponses also depend on the relative position of econ-omies: frontrunners, followers and latecomers have dif-ferent goals and face different challenges. Frontrunners are already at the frontier when it comes to ADP tech-nologies. Their policy responses are oriented towards sustaining or regaining industrial leadership, and com-bine economic, social and environmental goals. For follower economies, the main aspiration is to close the technology gap with the frontrunners. This implies fostering innovation- driven development, building on the technological and industrial base that is already in place. Many of these economies host advanced manufacturing–ready firms and are even competing in economic activities traditionally reserved for highly industrialized countries. A key challenge is to dissemi-nate throughout the rest of the economy the capabili-ties already in place in the most advanced part of the manufacturing sector (Rodrik 2018). For latecomers and laggards, what’s most important is to set up the basic conditions of infrastructure and capabilities to get ready to absorb the new technologies.
Some general areas for policy action need special attention
Although responses are highly contextual, three areas are very importantEnhancing readiness to adopt and exploit the new technologies requires action on three fronts: develop-ing framework conditions, fostering demand and lev-eraging ongoing initiatives, and strengthening skills and research capabilities (Table 3).
Framework conditions include the institutionalization of multistakeholder approaches to industrial policy formulationAdoption of ADP technologies requires important efforts in developing framework conditions related to regulations and digital infrastructure, the institutional setting for policy formulation and the channels for international collaboration and technology transfer. The institutional setting is particularly important to make ADP technologies work for ISID. New industrial policy formulation, in this context, should stem from close collaboration between private and public sectors, in which learning (identifying constrains), experimen-tation (finding ways of removing these constraints),
“Adoption of ADP technologies requires important efforts in developing framework conditions
Table 3 Areas of policy action to make ADP technologies work for ISID
Broad area Issue to be tackled Specific actions Country examples
Developing framework conditions
Regulations and digital infrastructure
Update and develop regulatory reforms to facilitate a digital economy
• In 2018, Mauritius launched a comprehensive policy framework, Digital Mauritius 2030, to boost economic development. Specific areas of intervention include ICT governance, talent management, a national broadband strategy and stronger protection of intellectual property rights and data, data privacy and cyber-security.
• Over the past 15 years, Viet Nam has enacted a complex governance reform to support the emergence of smart manufacturing. This includes policies, master plans and laws around e-commerce, e-transactions, cyber-security, information technologies, intellectual property, investment in digital infrastructure and introduction of advanced technologies in production and business.
Investment in ICT and broadband infrastructure to foster access to high-speed internet
• In 2016, Chile announced the Strategic Programme Smart Industries 2015–2025 to upgrade ICT infrastructure, to increase speed in national broadband and expand penetration of high-speed internet in the country.
• The national strategy Thailand 4.0, contained in the country’s 20-Year National Strategy (2017–2036) promotes institutional reforms to improve framework conditions, including incentives (corporate tax reductions and R&D subsidies), investments in high-speed internet infrastructure and the establishment of digital parks and development zones.

2424
ov
er
vie
w
Broad area Issue to be tackled Specific actions Country examples
Developing framework conditions
Institutional infrastructure and private sector role
Institutionalize multistakeholder and participatory approaches to industrial policy formulation, including public–private dialogue and shared leadership between different ministries
• In Brazil, the development of the Science and Technology and Innovation Plan for Advanced Manufacturing involved a triple-helix approach (government, private entities and education and research organizations). The Ministry of Science, Technology, Innovation and Communications and the Ministry of Industry, International Trade and Services lead from the government side. Significant knowledge came from a task force consulting private organizations about their perspectives on the challenges and opportunities stemming from smart manufacturing across different Brazilian industries and regions.
• In Mexico, the national strategy Roadmap 2030 built on a collaboration among the Ministry of Economy, ProSoft 3.0 (an official programme to promote the domestic software industry), the Mexican Association of Information Technologies and other private sector organizations.
• In South Africa, the Department of Telecommunications and Postal Services, the Department of Science and Technology and the Department of Trade and Industry led an integrated strategy, in consultation with industry, labour and civil society. In addition, a Presidential Commission on the 4IR was established in 2019 to coordinate work across all involved governmental institutions.
International collaboration and technology transfer
Facilitate connections with international initiatives around the adoption of ADP technologies
• In 2015, China and Germany agreed to promote readiness of their respective economies for ADP technologies in a memorandum of understanding linking Made in China 2025 and Industrie 4.0. The proposed activities consider the promotion of networks of Chinese and German enterprises in smart manufacturing. Collaboration is already bearing fruit through a Sino-German Industrial Park jointly established as a platform to connect Chinese enterprises and German technology.
• In 2018, Nuevo León, Mexico signed a two-year memorandum of understanding with the Basque Country, Spain, to underpin collaboration between their respective ADP technology strategies. The government of Nuevo León recently launched the programme MIND4.0 Monterrey 2019, a start-up accelerator that emulates a similar pilot initiative in the Basque Country (BIND 4.0) matching local manufacturing firms with domestic and foreign innovators and entrepreneurs.
Establish partnerships with foreign organization and MNCs or consulting firms
• Kazakhstan’s new digitalization strategy, Digital Kazakhstan, benefited from collaboration of Germany’s Fraunhofer Institute with the Kazakhstan Ministry of Industry and Infrastructure Development. Activities included a diagnostic study on about 600 domestic companies’ readiness to adopt ADP technologies. Firm with semiautomated production will be supported to progressively transform into digital factories. Pilot companies started implementation in October 2018.
Fostering demand and adoption
Access and affordability of ADP technologies
Develop innovative funding mechanisms and support instruments or expand public funding for ecosystem enablers
• The government of South Africa proposed a Sovereign Innovation Fund to fund high-technology projects on smart manufacturing–related areas. The government pledged a seed investment of 1–1.5 billion rand (around $111 million) for 2019/2020. The fund is part of a strategy to support domestic firms to benefit from technology transfer.
• In 2017, the government of Zhejiang Province, China, launched the Plan for Enterprises Deploying the Cloud, an initiative to promote adoption of and innovation in cloud technologies, particularly among small and medium-sized enterprises. The initiative combines funding through voucher schemes to lower the cost of cloud technology with a complex approach to foster capabilities. As part of the programme more than 1,100 seminars on cloud computing have been organized, covering more than 90,000 industrial firms and 100,000 participants.
“Countries need to foster demand and adoption of new technologies
Table 3 (continued) Areas of policy action to make ADP technologies work for ISID

25
ov
er
vie
w
coordination (placing all relevant stakeholders in the table) and monitoring (assessing the results) should be key guiding principles (Rodrik 2007, 2018).
Fostering demand requires awareness and fundingEven if the framework conditions are in place, coun-tries need to foster the demand and adoption of the
new technologies. This requires concentrated efforts to raise the awareness of firms on the potential use and benefits of these technologies together with the facili-tation of funding for their adoption. Targeted support should also be addressed to actors (for instance, small and medium-sized enterprises, SMEs) that are lagging from a technological perspective.
Broad area Issue to be tackled Specific actions Country examples
Fostering demand and adoption
Awareness regarding use and benefits of ADP technologies
Develop awareness centres and organize international summits, conferences and workshops to expand firms’ knowledge of ADP technologies
• In 2017, the government of India opened four new centres for promoting ADP technologies in Bangalore, New Delhi and Pune. While independent, the centres fall under the purview of the Ministry of Industry, Department of Heavy Industry. Their mandate is to support the implementation of Make-in-India, particularly by enhancing manufacturing competitiveness through a better understanding and broader adoption of ADP technologies by manufacturing small and medium-sized enterprises.
• Since 2015, the government of Viet Nam has organized annual summits or international gatherings to raise awareness, explore and possibly tighten public–private collaboration or demonstrate technologies and solutions available for domestic agents interested in ADP technologies.
Readiness of vulnerable actors, such as small and medium-sized enterprises
Provide targeted support to actors that are technologically lagging behind
• In Spain, the government of the Basque country launched Basque Industry 4.0, which includes pilot activities to assist domestic SMEs in accessing training on ADP technologies associated with manufacturing, and spaces designed for self-diagnosis and fine-tuning for advanced manufacturing.
• In 2019, the government of Malaysia launched Industry4WRD Readiness Assessment, a programme under the national strategy Industry4WRD that helps to determine small and medium-sized enterprises’ readiness to adopt ADP technologies.
Strengthening capabilities
Development of human resources
Enhance international collaboration around skill development and employability
• In Colombia, universities in Valle del Cauca recently agreed to collaborate with the Association of Electronic and Information Technologies (GAIA) of the Basque country. The parties expect to foster digital culture and entrepreneurship among students in Valle del Cauca.
Offer/facilitate direct experience and exposure and learning from the new technologies, including new approaches to technical and vocational education and training (TVET)
• The government of Uruguay, in collaboration with UNIDO and the German industrial control and automation company Festo, has established the Centre of Industrial Automation and Mechatronics (CAIME), a public technology centre to upgrade technical skills and encourage domestic firms to adopt smart manufacturing processes.
• In Malaysia, the Ministry of Human Resources offers a National Dual Training Scheme, inspired by the German Dual Vocational Training Programme, aimed at equipping workers to use ADP technologies.
Development of research capabilities
Expand the scope and number of research institutions
• In Chile, the Office of Economy of the Future launched the project Astrodata, whose objective is to capitalize on the processing potential of astronomical big data and cloud computing, not only for scientific applications and human capital development but also for economic purposes.
• In Kazakhstan, the Ministry of Education and Science will mobilize research capacities at the Industrial Automation Institute (based in the Kazakh National Research Technical University) to carry out applied research and technology transfer connected with technological problems faced by business seeking to use ADP technologies.
Source: UNIDO elaboration.
“Governments can support the strengthening of capabilities through dedicated learning centres
Table 3 (continued) Areas of policy action to make ADP technologies work for ISID
2626
ov
er
vie
w
Capabilities build on new skills and researchUltimately, for firms to be able to adopt the new tech-nologies, the required capabilities in terms of skills and research should be in place. Governments can support the creation and strengthening of these capa-bilities through dedicated learning centres and new approaches to technical and vocational education and trainings that are aligned with the emerging require-ments of firms. Expanding the scope and number of research institutions which are specifically dealing with ADP technologies is also key for the absorption of these technologies and their adaptation to the local environment.
A call for further international collaboration
New windows of opportunity will depend on individual responses and readinessHow much will ongoing breakthroughs in ADP tech-nologies open new windows of opportunity to leap-frog, or to avoid falling farther behind? The extent will depend on individual responses and readiness through active industrial policy, digital literacy, skills and education — and not just wage rates, domestic markets and positions in global value chains (Lee et al. 2019, Mayer 2018).
Remember that it takes commitments and substantial resources to develop capabilitiesPolicy-makers, particularly in developing coun-tries, should remember that it takes commitments and substantial resources to develop the capabilities required to take up new technologies and assimilate any associated productive transformations (Lee 2019, Steinmueller 2001). Taking small but well-informed steps to test technological and policy options, accord-ing to the desired goals, is recommended before com-mitting fully to implementation. There is much room for further research and policy experimentation to learn and exchange policy lessons through enhanced international collaboration.
The international community should support lagging economiesThe results in the report indicate that large parts of the world, mostly LDCs and other low-income countries, are still far from engaging with the new technologies. This calls for immediate action from the international community to support developing countries — especially LDCs — in adopting the ongo-ing technological breakthroughs. Without interna-tional support, low-income countries run the risk of being stymied even more, lagging farther behind and failing to achieve several (if not all) the SDGs. As dis-cussed above, this support should be oriented towards building basic, intermediate and advanced industrial and technological capabilities, together with digital infrastructure.
There is good scope for further international collaborationImportant benefits can come from close collabora-tion among countries at different stages of readiness for the adoption of ADP technologies. The poten-tial for expanding such collaboration is significant. In many national strategies of follower economies, some frontrunner economies are identified as a pre-ferred partner to facilitate technology transfer, human resource development and joint implementation of pilot projects, but also to explore joint business mod-els. Partnerships can also be done with other countries at similar levels of adoption of ADP technologies. Knowledge transfers can take place on a more equal footing and be closer to common realities. For the BRICS, such collaboration is already motivating joint research activities and innovation agendas on big data, ICTs and other ADP technologies and their applica-tions, as well as on ICT infrastructure and connectiv-ity (BRICS Information Centre 2017).
Closer collaboration should be the basis of national strategiesCloser collaboration should be the basis of strategies to address developing countries’ diverging views on
“Without international support, low-income countries run the risk of being stymied even more

27
ov
er
vie
w
Notes1. In this report, global patents are defined as those pat-
ents that are simultaneously applied in at least two of the following patent offices: the European Patent Office, the United States Patent and Trademark Office, the Japan Patent Office and the China National Intellectual Property Administration Office.
2. These generations were first proposed by IEL (2018) and then elaborated further in the UNIDO back-ground paper by Kupfer et al. (2019).
3. For full results see the UNIDO background paper prepared by Pietrobelli et al. (2019).
4. The analysis is based on the UNIDO background paper prepared by Ghodsi et al. (2019) and builds on the existing empirical work on the relation-ship between technological change, employment and industrial growth pioneered by Abeliansky and Prettner (2017), Acemoglu and Restrepo (2018) and Graetz and Michaels (2018).
5 See UNIDO background paper prepared by Dachs and Seric (2019) for the details of the analysis.
the challenges that ADP technologies might bring in their path towards inclusive and sustainable industrial development. Many of these questions are not new, but the issues are becoming more pressing because of their possible implications for digital divides. Consensus on the challenges and opportunities is still largely out of reach, and domestic politics are likely to stall
major international collaborations. That is why inter-national policy coordination and collaboration should continue to buttress efforts to leap forward, enabling organizations and countries to share knowledge and experiences on how to identify and address the oppor-tunities and challenges stemming from the 4IR — and ensure that no one is left behind.


29
Part AIndustrializing in the digital age


3131
Chapter 1
Advanced digital production technologies and industrial development: A global perspective
The absorption of new technologies is a key driver of successful inclusive and sustainable industrial develop-ment (ISID). History shows the links connecting new technologies with the introduction of new goods and processes, the expansion of industries, the creation of job and income opportunities and the advancement of environmental sustainability.
An emerging wave of breakthroughs in digital production technologies — artificial intelligence, big data analytics, cloud computing, Internet of Things (IoT), advanced robotics and additive manufactur-ing, among others — is transforming manufacturing production. In particular, the convergence of automa-tion and advanced digital technologies is expected to lead to the full development of cyber-physical systems (CPSs; the fusion of the real world with the virtual) and the rise of smart manufacturing production. Under the right conditions, the adoption of these advanced digital production (ADP) technologies by developing countries can foster ISID and the achieve-ment of the Sustainable Development Goals (SDGs).
But the creation and diffusion of ADP technolo-gies remain concentrated globally, although some emerging economies are taking tentative steps towards adopting these technologies. Building on trade and patent data, this chapter presents a global characteri-zation of countries’ degree of engagement with ADP technologies. In this characterization, 10 countries — the frontrunners — account for 90 percent of global patents and 70 percent of exports directly associated with these technologies. Another 40 countries — the followers — actively engage in these technologies, though with much more modest intensity. The rest of the world either shows very little activity (the latecom-ers) or fails to take part in the global creation and use of these technologies (the laggards).
ADP technologies open opportunities for catch-ing up, but exploiting them requires a minimum base of industrial capabilities. A clear positive relation-ship exists between the roles of different countries as
frontrunners, followers, latecomers and laggards in cre-ating and using these technologies and the countries’ average set of industrial capabilities. Greater engage-ment with ADP technologies is associated with higher rates of growth in manufacturing value added (MVA), driven mainly by faster productivity gains. Contrary to common belief, economies actively engaging with ADP technologies also reveal positive employment growth.
This chapter presents the overall conceptual frame-work (Figure 1.1) and technology focus and describes the creation and diffusion of ADP technologies. It considers the challenges and opportunities that the new technologies can bring for developing countries on their way towards industrial development. Building on the concepts in this chapter, Chapters 2–4 provide a more focused discussion, looking into the impact of ADP technologies on countries (Chapter 2), firms (Chapter 3) and policies (Chapter 4).
Linking industrialization to new technologies: Basic concepts
New technologies and ISIDNew technologies are at the core of successful ISID. They enable the creation of new goods, which leads to the emergence of new industries. And they sup-port greater production efficiency, which lowers prices and opens consumption to the mass market — or increases profits, with possible follow-on effects for investment. In the right context, new technologies can also promote environmental sustainability and social inclusion.
New industries come from new technologiesNew industries — and the incomes and jobs associated with them — ultimately originate from technological product innovations, which support industrialization and social inclusion (see Figure 1.1). When these inno-vations are geared to reducing environmental impacts — by introducing green manufacturing goods — they
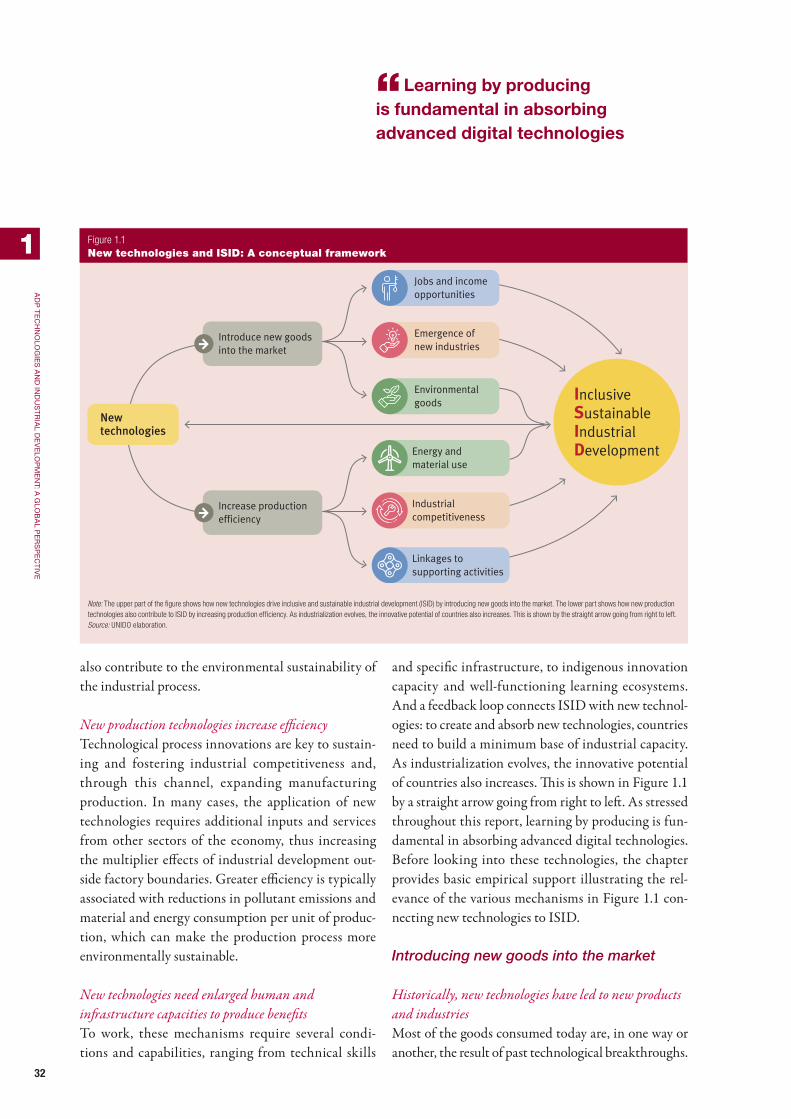
32
1
Ad
P t
eC
hn
olo
gie
s A
nd
ind
us
tr
iAl d
ev
elo
Pm
en
t: A g
lob
Al P
er
sP
eC
tiv
e
“ Learning by producing is fundamental in absorbing advanced digital technologies
also contribute to the environmental sustainability of the industrial process.
New production technologies increase efficiencyTechnological process innovations are key to sustain-ing and fostering industrial competitiveness and, through this channel, expanding manufacturing production. In many cases, the application of new technologies requires additional inputs and services from other sectors of the economy, thus increasing the multiplier effects of industrial development out-side factory boundaries. Greater efficiency is typically associated with reductions in pollutant emissions and material and energy consumption per unit of produc-tion, which can make the production process more environmentally sustainable.
New technologies need enlarged human and infrastructure capacities to produce benefitsTo work, these mechanisms require several condi-tions and capabilities, ranging from technical skills
and specific infrastructure, to indigenous innovation capacity and well-functioning learning ecosystems. And a feedback loop connects ISID with new technol-ogies: to create and absorb new technologies, countries need to build a minimum base of industrial capacity. As industrialization evolves, the innovative potential of countries also increases. This is shown in Figure 1.1 by a straight arrow going from right to left. As stressed throughout this report, learning by producing is fun-damental in absorbing advanced digital technologies. Before looking into these technologies, the chapter provides basic empirical support illustrating the rel-evance of the various mechanisms in Figure 1.1 con-necting new technologies to ISID.
Introducing new goods into the market
Historically, new technologies have led to new products and industriesMost of the goods consumed today are, in one way or another, the result of past technological breakthroughs.
Figure 1.1 New technologies and ISID: A conceptual framework
Introduce new goodsinto the market
InclusiveSustainableIndustrialDevelopment
Jobs and incomeopportunities
Increase productionefficiency
Newtechnologies
Emergence of new industries
Environmental goods
Industrialcompetitiveness
Energy and material use
Linkages tosupporting activities
Note: The upper part of the figure shows how new technologies drive inclusive and sustainable industrial development (ISID) by introducing new goods into the market. The lower part shows how new production technologies also contribute to ISID by increasing production efficiency. As industrialization evolves, the innovative potential of countries also increases. This is shown by the straight arrow going from right to left.Source: UNIDO elaboration.

33
1
Ad
P t
eC
hn
olo
gie
s A
nd
ind
us
tr
iAl d
ev
elo
Pm
en
t: A g
lob
Al P
er
sP
eC
tiv
e
“The emergence of new industries is the result of product innovations
The emergence of new industries is, in fact, the result of product innovations that introduce new goods into the market. From automobiles in the late 19th century to personal computers in the 20th century and to smart devices today, it was a new technological breakthrough (or a combination of emerging technologies) that initi-ated the rise and expansion of industrial production.
Cars from Daimler to the Ford Model TIn 1885, Gottlieb Daimler built the first vehicle pow-ered by an internal combustion engine, effectively inventing the passenger car (Comin and Hobijn 2010). Eight years later, Charles and Frank Duryea founded the first automobile manufacturing company in the United States, the Duryea Motor Wagon Company, followed by Oldsmobile in 1902 and Cadillac in 1903. Cars were then a luxury good that only very rich households could afford. But everything changed when Ford introduced the Model T in 1908, a low-cost, low-quality car affordable to the middle class (Foellmi et al. 2014). Thus was born the automobile industry — one of the pillars of industrialization in the United States in the 20th century.
Personal computers from hobbyist models to the first AppleThe personal computer story is similar. The first comput-ers were introduced in the United States in the 1950s, but they were so expensive and so large that no individ-ual could use them. Then, in the early 1970s, the inven-tion of the microprocessor made possible the produc-tion of the first generation of microcomputers — small enough to fit on a desk and at prices affordable to indi-viduals. But the expertise needed to use them limited their range to a consumer niche of engineers and hobby-ists (Greenwood and Kopecky 2013). This changed radi-cally in 1977 when Apple introduced a microcomputer that was both small and user friendly. Thus was born the personal computer industry, another pillar of industri-alization in the United States during the 20th century.
Inventions spread from the United States to the worldThese product innovations — the automobile and the personal computer — were the drivers of the second
industrial revolution (2IR) and third (3IR). In both cases, their emergence and later expansion to the mass market initially took place in the United States and then diffused to the rest of the world. Some years after their invention, they gave rise to two of today’s most important industries, not only in the United States (Figure 1.2) but also in the world.
80 percent of US households had a car by 1968, and 75 percent had a personal computer by 2010Between 1908 (the Ford Model T) and 1968, the share of households in the United States possessing a car rose from 10 percent to 80 percent. In the same period, the share of transport equipment in total MVA more than doubled, from about 6 percent to 17 percent. The expansion of the market for computers was even more pronounced. In 1977 (the Apple II), only 6 percent of households in the United States reported having a computer. Three decades later, by 2010, 75 percent had one. Between these years, the share of computers and peripheral equipment in MVA more than doubled, from 6 percent to 15 percent.
Cars and computers are now at the heart of US manufacturing value addedToday, these two industries rank near the top of the US manufacturing sector, with the largest shares of MVA after the chemical industry.1 But they are also the backbone of manufacturing in many other coun-tries. As latecomer economies absorb the new tech-nology and close the technology gap with the front-runner, production shifts and new actors take the lead.
New industries boost employment and trigger growthThe new industries (in this case, automobiles and per-sonal computers) constitute a major source of income and employment for the domestic population, due to the direct jobs, profits and wages created not only in that industry, but also in all supporting activities. In addition, the incomes generated, when respent or reinvested, can trigger additional economic growth in what UNIDO’s Industrial Development Report 2018

34
1
Ad
P t
eC
hn
olo
gie
s A
nd
ind
us
tr
iAl d
ev
elo
Pm
en
t: A g
lob
Al P
er
sP
eC
tiv
e
“Product innovations can render industrial development sustainable over time
labelled the “virtuous circle” of industrial develop-ment. This is the key channel through which indus-trialization supports social inclusion, job creation and poverty alleviation. Again, technology is at the core of this process. Using historical data on the automo-bile and personal computer industries in the United States, Figure 1.3 illustrates this process.
The multiplier effect of new jobs is as big as the effect of the jobs themselvesTwo striking features are illustrated by Figure 1.3. First, there is a clear positive trend, pointing to the increasing incomes in the United States created by the emergence and expansion of these industries follow-ing the invention of the automobile and personal com-puter. Second, the multiplier effect on other sectors of the economy tends to be of the same magnitude as the effect in the producing sector. That is, the potential of manufacturing industries to pull up the rest of the economy can more than double the incomes and jobs created, including substantially more of the popula-tion in the production process.
Manufacturing environmental goods boosts sustainabilityThe third channel, presented in the upper part of the conceptual framework (Figure 1.1), indicates that technological product innovations, when geared towards reducing environmental impacts, can also render industrial development sustainable over time. That is, the introduction of environmental goods can contribute much to the sustainability of con-sumption and production patterns. Manufacturing environmental goods are those that bring “a better quality of life” while minimizing the use of natural resources and toxic materials and the emission of waste and pollutants over the life cycle of the good (UNIDO 2017c).
Consider electric vehicles, which could constitute 50 percent of the world automobile market by 2040Electric vehicles are an interesting example of a manu-facturing environmental good. They require no direct fuel combustion and rely on electricity — the most diversified energy carrier — not only boosting energy
Figure 1.2 The rise of automobiles and personal computers in the United States: Consumption and production
Shar
e of
hou
seho
lds
with
an
auto
mob
ile o
r a c
ompu
ter (
perc
ent)
0
20
40
60
80
201020001990198019701960195019401930192019101900189018850
5
10
15
20
Share in manufacturing value added (percent)
Share of computers andperipherals in MVA
(right axis)Share of transportequipment in MVA(right axis)
Households with an automobile(left axis)
Households with a computer(left axis)
Invention of the automobile Invention of the personal computer
Note: MVA is manufacturing value added. The figure portrays the impressive expansion in consuming and producing these goods in the United States after the initial technological inventions. The dashed lines present the share of households consuming each of these goods (left axis), and the solid lines, the share of each industry in total MVA (right axis).Source: UNIDO elaboration based on American Community Survey (U.S. Census Bureau 2018), Comin and Hobijn (2010), Felton (2014), Smits et al. (2009), Structural Analysis (STAN) Database ISIC Rev. 3 and 4 (respectively, OECD 2019a and 2019b), UNIDO (2017c), and US Bureau of Economic Analysis (2019a, 2019b).
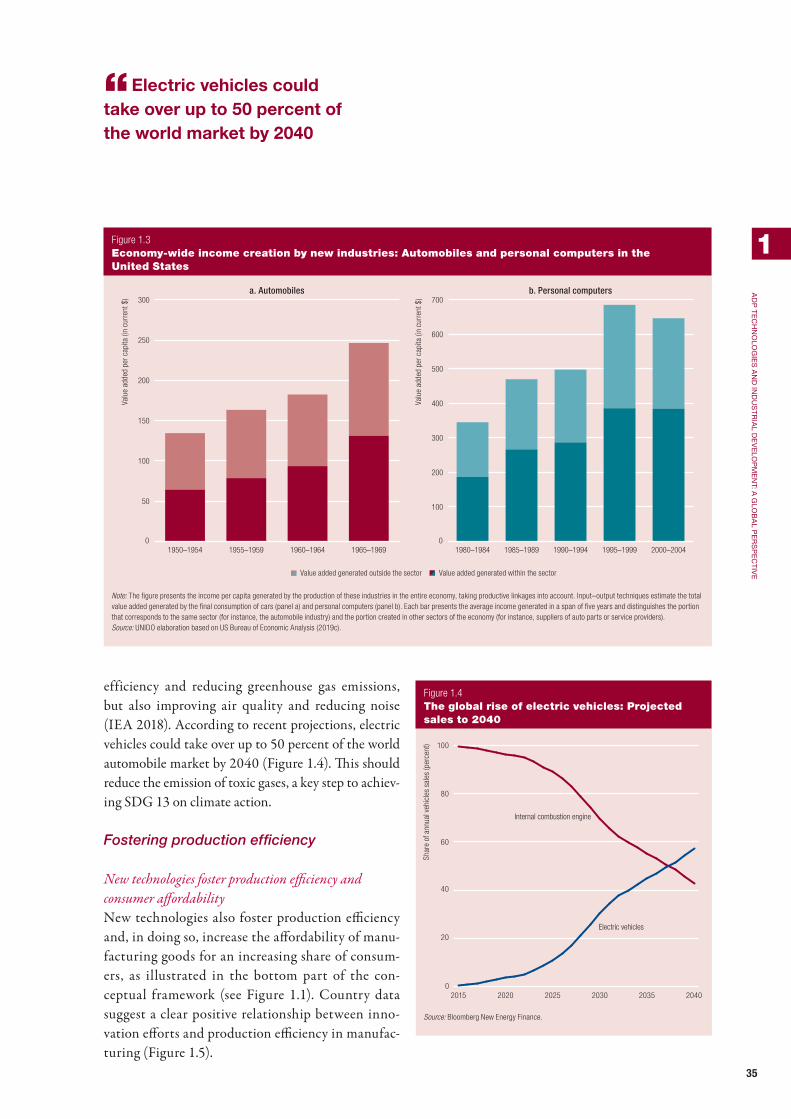
35
1
Ad
P t
eC
hn
olo
gie
s A
nd
ind
us
tr
iAl d
ev
elo
Pm
en
t: A g
lob
Al P
er
sP
eC
tiv
e
“Electric vehicles could take over up to 50 percent of the world market by 2040
efficiency and reducing greenhouse gas emissions, but also improving air quality and reducing noise (IEA 2018). According to recent projections, electric vehicles could take over up to 50 percent of the world automobile market by 2040 (Figure 1.4). This should reduce the emission of toxic gases, a key step to achiev-ing SDG 13 on climate action.
Fostering production efficiency
New technologies foster production efficiency and consumer affordabilityNew technologies also foster production efficiency and, in doing so, increase the affordability of manu-facturing goods for an increasing share of consum-ers, as illustrated in the bottom part of the con-ceptual framework (see Figure 1.1). Country data suggest a clear positive relationship between inno-vation efforts and production efficiency in manufac-turing (Figure 1.5).
Figure 1.3 Economy-wide income creation by new industries: Automobiles and personal computers in the United States
0
50
100
150
200
250
300
1965–19691960–19641955–19591950–19540
100
200
300
400
500
600
700
2000–20041995–19991990–19941985–19891980–1984
Valu
e ad
ded
per c
apita
(in
curr
ent $
)
Valu
e ad
ded
per c
apita
(in
curr
ent $
)
a. Automobiles b. Personal computers
Value added generated outside the sector Value added generated within the sector
Note: The figure presents the income per capita generated by the production of these industries in the entire economy, taking productive linkages into account. Input–output techniques estimate the total value added generated by the final consumption of cars (panel a) and personal computers (panel b). Each bar presents the average income generated in a span of five years and distinguishes the portion that corresponds to the same sector (for instance, the automobile industry) and the portion created in other sectors of the economy (for instance, suppliers of auto parts or service providers).Source: UNIDO elaboration based on US Bureau of Economic Analysis (2019c).
Figure 1.4 The global rise of electric vehicles: Projected sales to 2040
0
20
40
60
80
100
204020352030202520202015
Shar
e of
ann
ual v
ehic
les
sale
s (p
erce
nt)
Internal combustion engine
Electric vehicles
Source: Bloomberg New Energy Finance.

36
1
Ad
P t
eC
hn
olo
gie
s A
nd
ind
us
tr
iAl d
ev
elo
Pm
en
t: A g
lob
Al P
er
sP
eC
tiv
e
“Technology has a powerful influence on industrial performance
Countries that invest more in research and development have higher productivityAs Figure 1.5 shows, countries that invest more in manufacturing research and development (R&D) are closer to the frontier in production efficiency. Considering manufacturing in the United States as
the global technology frontier and labour productivity as the best proxy for production efficiency shows that countries with higher productivity tend to invest more in manufacturing R&D. This point is supported by a vast empirical literature investigating the positive link between technology development and innovation and productivity for countries,2 industries3 and firms.4
Higher efficiency increases competitiveness and reduces environmental impactsAs the conceptual framework indicates, advances in production efficiency resulting from technological change have important implications for ISID through increased competitiveness, new linkages to supporting activities and the reduced environmental impact of manufacturing production (Figure 1.6).
Countries that improve productivity become more competitiveTechnology has a powerful influence on industrial performance through its impact on production effi-ciency, the key to fostering industrial competitive-ness. Panel a in Figure 1.6 provides interesting insights in this respect. It presents the relationship between the changes in relative labour productivity in manu-facturing and the changes in countries’ industrial
Figure 1.5 Larger investments in manufacturing research and development are associated with higher production efficiency
0 3 6 9 12 15
Man
ufac
turin
g re
lativ
e pr
oduc
tivity
(Uni
ted
Stat
es=
1)
R&D investment as a share of MVA (percent)
0.5
1.0
1.5
0.0
Note: MVA is manufacturing value added. R&D is research and development. All values are for 2015 (or closest year). The 34 economies presented in the figure were selected due to the availability of data on R&D expenditures in manufacturing. Manufacturing relative productivity is calculated as the value added per worker (in constant $ 2010) of each economy divided by that of the United States. R&D investments as a share of manufacturing value added are calculated at constant $ 2010.Source: UNIDO elaboration based on the Analytical Business Enterprise R&D database (OECD 2018a), ILO (2018) and the Manufacturing Value Added 2019 database (UNIDO 2019g).
Figure 1.6 From production efficiency to ISID
Chan
ge in
the
Com
petit
ive
Indu
stria
lPe
rfor
man
ce In
dex,
200
0–20
14
a. Higher production efficiency is associatedwith larger industrial competitiveness
Change in manufacturing relativeproductivity (United States = 1)
Kilo
s of
CO
2 per
uni
t of m
anuf
actu
ring
valu
e ad
ded
(con
stan
t $ 2
010)
Relative productivity of manufacturing(United States = 1)
Cont
ribut
ion
of K
IBS
to v
alue
add
edge
nera
ted
by m
anuf
actu
ring
(per
cent
)
Relative productivity of manufacturing(United States = 1)
c. Higher production efficiency is associatedwith lower intensity of environmental impact
b. Fostering production efficiency requires increasingsupport from knowledge intensive business services
–0.2 –0.1 0.0 0.1 0.2 0.3 0.4–0.2
–0.1
0.0
0.1
0.2
0
1
2
3
4
0.0 0.2 0.4 0.6 0.8 1.0 1.2 0.0 0.2 0.4 0.6 0.8 1.0 1.20.0
0.5
1.0
1.5
2.0
Note: KIBS is knowledge-intensive business services. MVA is manufacturing value added. All values are for 2015 in panels a and c and for 2000–2015 in panel b. Panel a includes data for 145 economies, panel b for 57, and panel c for 129. The 57 economies in panel b were selected based on the availability of input–output tables in OECD (2018b). Productivity is calculated as MVA in constant $ 2010 per number of workers.Source: UNIDO elaboration based on ILO (2018), Inter-Country Input-Output (ICIO) tables (OECD 2018b), the Competitive Industrial Performance Index (CIP) 2019 database (UNIDO 2019c) and the Manufacturing Value Added 2019 database (UNIDO 2019g).

37
1
Ad
P t
eC
hn
olo
gie
s A
nd
ind
us
tr
iAl d
ev
elo
Pm
en
t: A g
lob
Al P
er
sP
eC
tiv
e
“ Increasing linkages to services boosts jobs outside manufacturing
competitiveness between 2000 and 2015,5 as captured by UNIDO’s Competitive Industrial Performance (CIP) Index. The CIP Index is a multidimensional index that assesses the industrial competitiveness of countries along three dimensions: productive com-petitiveness, technological competitiveness and export competitiveness (see Chapter 5). As panel a in Figure 1.6 shows, countries that reduced their distance to the global technology frontier the most (positive change in relative labour productivity) increased their indus-trial competitiveness the most (top right quadrant).
Improving productivity requires KIBSImproving production efficiency in manufacturing by absorbing new technologies also requires more sup-port from other parts of the economy, especially today, when new digital technologies are blurring the bound-aries between manufacturing production and services. The corollary of this process is a continuous increase in production linkages between manufacturing and knowledge-intensive business services (KIBS).6 Panel b in Figure 1.6 shows a clear positive relation-ship between manufacturing relative productivity and its reliance on KIBS.7 Manufacturing industries in economies closer to the technology frontier tend to be much more integrated with such services than econo-mies farther from the frontier.
Increasing KIBS helps industry create indirect jobsAn implication of the increase in technology-driven production linkages is that the absorption of new technologies in manufacturing, when supported by other activities, can trigger job creation. Increasing linkages to services (particularly KIBS) boosts the potential of manufacturing industries to create jobs outside manufacturing and thus to support social inclusiveness, particularly for the new digital technol-ogies applied to manufacturing production.
Increasing efficiency promotes environmental sustainabilityPanel c of Figure 1.6 illustrates how increasing produc-tion efficiency also contributes to environmental sus-tainability. In this case, the intensity of carbon dioxide
emissions in manufacturing production is taken as a proxy for environmental damage.8 Economies closer to the technology frontier tend to emit less carbon dioxide per unit of production. These emissions are only one dimension of environmental sustainability, but they provide an intuitive picture of the mechanism at play: new technologies, by increasing the efficiency of industries’ use of material, energy and labour can lead to more environmentally friendly manufacturing.
New technologies are key to ISIDStudying new technologies is key to understand-ing ISID, particularly in periods of major changes in industrial technology. A transformative technologi-cal transition, driven largely by digital technologies, is under way.
The new technologies shaping the industrial landscape
The steam-, electricity- and computing-driven industrial revolutionsDifferent waves of technological advances have pushed economic development since the first indus-trial revolution (1IR).9 The invention of the steam engine, the mechanization of simple tasks and the construction of railroads triggered the 1IR between 1760 and 1840. The advent of electricity, the assem-bly line and mass production gave rise to the second industrial revolution (2IR) between the late 19th and early 20th centuries. The development of semi-conductors and mainframe computing in the 1960s, together with personal computers and the internet, were the main engines of the third industrial revolu-tion (3IR) (Schwab 2016).
Digital production technologies, nanotechnology, biotechnology and new and improved materialsRecent technological breakthroughs seem to be pushing yet another revolutionary wave, in what is commonly called the fourth industrial revolution (4IR). The concept is based on the growing conver-gence of emerging technology domains and their

38
1
Ad
P t
eC
hn
olo
gie
s A
nd
ind
us
tr
iAl d
ev
elo
Pm
en
t: A g
lob
Al P
er
sP
eC
tiv
e
“Smart production results from the application of advanced digital technologies to manufacturing production
complementarity in production. There is not yet a con-sensus on which technologies should be considered part of this revolution, and several competing classi-fications have been advanced. Analysts seem to agree, however, on digital production technologies, nano-technology, biotechnology and new and improved materials as likely to leave a long-lasting mark on the industrial landscape.10
Digital technologies and smart manufacturingMost of the emerging technologies have applica-tions in all sectors of the economy. When applied to industrial production, these technologies give rise to advanced manufacturing systems (Figure 1.7). A key component of these systems is smart production (or smart factory), which results from the application of advanced digital technologies to manufacturing production.
The focus: ADP technologies
Technological advances tend to cluster together and cross-fertilize, so the different domains in Figure 1.7 are actually interconnected. Advances in one technology — for instance, new polymer or compos-ite material — are the result of, and the precondition for, innovation in other technologies, such as additive manufacturing. Leaving these interconnections aside, the main focus of this report is on ADP technologies applied to manufacturing.
Advanced digital production arises from traditional industrial productionProduction technologies have driven production transformation since the 1IR. They encompass a wide range of machine tools and tooling and comple-mentary equipment operating in a coordinated and
Figure 1.7 Broad technological domains of the fourth industrial revolution
NEW MATERIALS
ADVANCED DIGITALPRODUCTION TECHNOLOGIES
NA
NO
TECH
NO
LOG
IES B
IOTECH
NO
LOG
IES
Industrialsector
IDR 2020 will focus on advanced digital production (ADP) technologies applied to manufacturing:
Other sectors/areas of the
economy
ADVANCEDMANUFACTURING
ARTIFICIAL INTELLIGENCE/MACHINE LEARNING
BIG DATA ANALYTICS
ADVANCED ROBOTICS
INDUSTRIAL INTERNET OF THINGS
CLOUD COMPUTING
ADDITIVE MANUFACTURING
SMARTFACTORY
Source: UNIDO elaboration based on OECD (2017), Schwab (2016), UNCTAD (2018), UNESCAP (2018) and UNIDO (2017d).

39
1
Ad
P t
eC
hn
olo
gie
s A
nd
ind
us
tr
iAl d
ev
elo
Pm
en
t: A g
lob
Al P
er
sP
eC
tiv
e
“These technologies evolved from the previous revolutions, suggesting an “evolutionary transition”
synchronized manner to execute tasks to produce goods at the required volume and quality. Production technologies range from simple hand-held tools to highly versatile and complicated equipment with programmable software. ADP technologies are the last in the evolution of traditional industrial pro-duction technologies (Figure 1.8). They result from incremental changes in hardware, software and con-nectivity that have enhanced the possibility of pro-duction system integration and smart production (Andreoni and Anzolin 2019). ADP technologies include the industrial IoT, big data analytics, artifi-cial intelligence and additive manufacturing, among others.
ADP technologies evolve from earlier onesMany of these technologies have evolved and emerged from the engineering and organizational principles of previous revolutions, suggesting an “evolutionary
transition” more than a “revolutionary disruption.” For instance, automating processes go back to the 1IR, while the adoption of robotics goes back to at least the 1960s. And improvements in operational management and system engineering have always relied on data collection, management and analysis (Box 1.1).
Advanced digital production hardware is a mix of old and newADP technologies result from the combination of three main components: hardware, software and con-nectivity (Figure 1.9). The hardware components are the tools, tooling and complementary equipment of modern industrial robots and intelligent automated systems, as well as cobots (robots cooperating with workers in the execution of tasks) and 3D printers for additive manufacturing. This set of hardware produc-tion technologies is largely similar to its predecessor in
Figure 1.8 Production technologies: From the first industrial revolution to the fourth
PRODUCTION TECHS
1st INDUSTRIAL REV. 2nd INDUSTRIAL REV. 3rd INDUSTRIAL REV.
INDUSTRIAL REVOLUTIONS
COM
PLEX
ITY
AN
D P
ROD
UCT
ION
SYS
TEM
INTE
GR
ATIO
N
4th INDUSTRIAL REV.
Steam and water
Mechanizationand single-task
automation
PRODUCTION TECHS
Electric energy
Mechanical controlsystems for machine
automation
Mass production
PRODUCTION TECHS
Electronics
Information andcommunications
technology
Mechatronics andflexible automation
with robotic arms forautomotive, electronics
Lean production
ADVANCED DIGITALPRODUCTION TECHS
Electric andrenewable energy
Software platforms
Industrial Internet of Things
Big data analytics
Artificial intelligence
Sensors
Industrial robots, cobots
Additive manufacturing
Smart production
Source: Andreoni and Anzolin 2019.

40
1
Ad
P t
eC
hn
olo
gie
s A
nd
ind
us
tr
iAl d
ev
elo
Pm
en
t: A g
lob
Al P
er
sP
eC
tiv
e
“Production technologies become fully digital once their connectivity is enhanced by software
the 3IR. What makes these machines different is their connectivity and their flexibility and functionality in executing productive tasks (Boxes 1.2 and 1.3).
Advanced digital production connectivity is one big change from older manufacturingConnectivity in ADP technologies is achieved through sensors in hardware, made possible by equipping machines and tools with actuators and sensors. Once machines and tools are able to sense the production process and products — their components, material and functional properties — they are also able to collect and transmit data through industrial IoT. This type of con-nectivity opens the way for a paradigm shift from cen-tralized to decentralized production (Box 1.4).
The other big change is advanced digital production software for smart networked systemsProduction technologies become fully digital once their connectivity is enhanced by software, allowing big data analytics — that is, tools able to process vast quantities of data in near-real time. Since the first soft-ware such as computer-aided manufacturing (CAM), computer-aided design (CAD) and computer-inte-grated manufacturing (CIM) and the improvements offered by information and communications technol-ogy (ICT) during the 3IR, the software of the 4IR has opened the way for CPSs. These smart networked systems with embedded sensors, processors and actuators are designed to sense and interact with the physical world and support, in real time, guaranteed
despite the dominant idea that robots are a new technol-
ogy, automation dates to the 18th century, when oliver
evans developed the first completely automated flour mill
in 1785. since then, automation has found application in
almost all industries. in the 1950s, machine tools were
automated with the help of numerical control languages,
which evolved in the 1960s into computerized numeri-
cal control that allowed production to rely increasingly
on electronics for automation and robotization. the first
industrial robot was manufactured by unimation and
deployed at general motors Company in 1961.
in 1965, general motors and ibm launched the first
computer-controlled production line, which evolved into
computer-integrated manufacturing, geometric modelling
and computer-aided design (CAd) systems. throughout
the 1970s and 1980s, these new control systems allowed
programming machines to execute increasingly complex
sequences of tasks with increasing precision. the first
microcomputer-controlled robot was commercialized by
Cincinnati milacron in the united states in 1974. since
then, industrial automation has spread to all sectors and
countries, with major impacts on productivity. Automation
has also become more sophisticated and complex. A dis-
tinctive feature of robots in the fourth industrial revolution
(4ir) is their greater intelligence and thus problem-solving
ability and their interconnection with other machines, ena-
bling coordination (both machine to machine and machine
to human) in carrying out common tasks.
the story is similar for the use of data in production.
From taylorism in the 20th century to Japanese lean pro-
duction to the present 4ir, operation management and
system engineering have always been based on data col-
lection and use. during the third industrial revolution (3ir),
the diffusion of measurements, standardization and inter-
face standards and the increasingly sophisticated use of
data have made possible key production improvements
such as the reliance on interchangeable parts and the
development of infra-technologies, including metrology
systems and testing.
the use of sensors can be traced back to the 3ir.
initially used to better monitor machine maintenance and
operations, the data collected by sensors triggered the
development of new intelligent platforms to make better
use of the huge amount of data produced. improvements
in more sophisticated actuators and sensors, and the evo-
lution from industrial ethernet to wireless networks, cre-
ated the basis for the high-speed, precise and continu-
ous production of real-time data. the industrial internet
of things is embedded in these enabling technologies
and augmented by integration with cyber-physical sys-
tems (CPss). CPss are the latest frontier of information-
flow software systems and the latest evolution of software
used for automation tasks in CAd-CAm (computer-aided
manufacturing).
Source: UNIDO elaboration based on Andreoni and Anzolin (2019).
Box 1.1 Automation and digitalization: From the first to the fourth industrial revolution

41
1
Ad
P t
eC
hn
olo
gie
s A
nd
ind
us
tr
iAl d
ev
elo
Pm
en
t: A g
lob
Al P
er
sP
eC
tiv
e
“Cyber-physical systems can create new production ecosystems
performance in applications (Box 1.5; see also Box 1.8 at the end of the chapter).
Advanced software changes the factory, the supply chain and the product life cycleAdvanced software technologies and their connectiv-ity enable new opportunities for manufacturing inte-gration on three levels:• Vertical integration of flexible and reconfigurable
manufacturing systems and their production of data (smart factory).
• Horizontal integration along the supply chain.• Product life-cycle integration of digital end-to-end
engineering activities.CPS software makes it possible to capitalize on
the full integration of all three levels. For instance, software can integrate data collection, analytics and management for the maintenance of equipment and
for stock-level monitoring along the supply chain, enabling machine-to-product-to-machine communi-cation. CPS can thus bridge the virtual and physical worlds to create new production ecosystems where intelligent objects communicate, interact and support an automated self-adjusting process.
The potential benefits of ADP technologies
ADP technologies can improve profits, sustain the environment and expand the labour forceADP technologies can increase firm profits and capital use, improve environmental sustainability and better integrate the labour force in the production process (Andreoni and Anzolin 2019). Figure 1.10 summa-rizes the main mechanisms at play, following the con-ceptual framework at the beginning of the chapter (see Figure 1.1).
Figure 1.9 Building blocks of ADP technologies
Active design &manufacturing
softwareCAM CIM CAD
Information &communications
technologies(ICT)
Cyber-physicalsystems (CPS)
CPS & M2M RFIDCPS with data
analysis
SOFTWARE
HARDWARECONNECTIVITY
Time
Time
Time
Automatedmachinery
Robotic arms(flexible
machinery)
3D printers& industrial
robotsCobots
Fieldbus Ethernet Wireless
Machinery Actuators Sensors
IndustrialInternet
ofThings
Note: CAM is computer-aided manufacturing, CAD is computer-aided design, CIM is computer-integrated manufacturing, M2M is machine to machine, and RFID is radio-frequency identification. CIM links CAD, CAM, industrial robotics, and machine manufacturing through unattended processing workstations.Source: Andreoni and Anzolin 2019.

42
1
Ad
P t
eC
hn
olo
gie
s A
nd
ind
us
tr
iAl d
ev
elo
Pm
en
t: A g
lob
Al P
er
sP
eC
tiv
e
“Cobots are being increasingly adopted in manufacturing firms in advanced and emerging economies
Collaborative robots — cobots — interact physically with
humans in a shared workspace. they are designed to
collaborate with workers to carry out tasks that ensure
greater accuracy and precision in production. one key
advantage is the technical features designed to ensure
that they do not cause harm when a worker comes into
direct contact with them, whether deliberately or by
accident (iFr 2018). these features include lightweight
materials, rounded contours, padding, “skins” (padding
with embedded sensors) and sensors at the robot base
or joints that measure and control force and speed and
ensure that they do not exceed defined thresholds if con-
tact occurs.
Cobots are being increasingly adopted in manufac-
turing firms in advanced and emerging economies. the
indian group mahindra & mahindra ltd. (m&m), a domi-
nant player in the tractor and automobile industry, recently
installed cobots in its engine and vechicle manufactur-
ing plants and today reports large benefits from quality
improvements, cost reduction and increase in safety and
environmental sustainability.
m&m is a market leader in the indian sport utility and
multi-utility vehicle sector, and it is the world’s largest tractor
company by volume. Cobots at m&m support the sealant
and tightening application in assembly lines of ring gears,
which had previously been done manually, thus improving
quality and reducing manufacturing cost. instead of tradi-
tional robots, the company chose cobots as being better
suited to work station space and safety conditions. these
cobots also have cameras that check and record task qual-
ity and allow for real-time monitoring of performance.
the use of cobots, which are designed to work around
humans and collaborate with them, eliminated the need for
safety fencing and increased the safety of work conditions
by reducing the risk that workers would come into direct
skin contact with hazardous materials, such as sealant. At
the same time, they greatly improved the efficiency and
quality of sealant application, reducing hazardous waste.
m&m reports that the adoption of cobots has improved
quality and precision and resulted in large savings in seal-
ant cost per year, increasing productivity by 8.4 percent.
Source: UNIDO elaboration.
Box 1.2 Collaborating with the robots
Additive manufacturing, commonly called 3d printing, is
a manufacturing process that converts a 3d model into
a physical object by assembling successive layers of the
same material. this technology is the opposite of tradi-
tional methods where objects are constructed by succes-
sively cutting and removing material from a solid block.
Aerospace is one industry where additive manufac-
turing is gaining momentum. the French multinational
company thales group recently opened a centre special-
izing in metal additive manufacturing in the midParc Casa-
blanca Free Zone in morocco. thales 3d aims to improve
the region’s competencies in metal 3d printing, and it is
the only centre to do this type of production for all the
group’s subsidiaries throughout 50 countries around the
world.
to start production, thales 3d uses a selective laser
melting process to melt successive layers of metal alloy
powders using a high power-density laser. so far, thales
3d has focused on aluminium and titanium, commonly
used in aviation. Additive manufacturing allows thales to
produce complex metal parts that cannot be produced
with traditional technologies. moreover, 3d printing allows
for easy modelling without the need for complex and
expensive moulds.
Source: UNIDO elaboration.
Box 1.3 Manufacturing complex metal parts through 3D printing

43
1
Ad
P t
eC
hn
olo
gie
s A
nd
ind
us
tr
iAl d
ev
elo
Pm
en
t: A g
lob
Al P
er
sP
eC
tiv
e
“Cloud technology can enable industrial companies to optimize operations and coordinate different business areas
the internet of things (iot) refers to the next iteration of
the internet, in which information and data are no longer
predominantly generated and processed by humans —
which has been the case for most data created so far — but
by a network of interconnected smart objects, embedded
in sensors and miniaturized computers, able to sense their
environment, process data and engage in machine-to-
machine communication (unido 2017d).
the range of iot applications is vast, from everyday
objects like connected watches, cars, refrigerators or
washing machines to specific applications in industrial
production. one area gaining attention is water manage-
ment. Combining iot solutions with other technological
innovations, Avs technology Ag — a medium-size uru-
guayan company — is developing small-scale, remote con-
trolled, chlor-alkali production plants.
Chlorine is a key input for water treatment plants.
because production plants are located far from treatment
plants, chlorine is sorted, handled and transported as a
liquid. there is a high risk of gas leaks, which can seri-
ously harm people and the environment. such risks are
minimized with small-scale plants that can be deployed on
the premises of the water treatment plant. directly injecting
gaseous chlorine into the water stream avoids the need for
manipulation, storage and transportation of chlorine.
the plants, using the latest automation technologies,
are designed to be remotely controlled from uruguay.
smart sensors collect data on temperature, pressure, ph
levels and cell voltage, among other things. the online
analysis of the data enables rapid identification of prob-
lems that are then solved remotely from company head-
quarters, greatly improving the plants’ energy efficiency.
moreover, the performance data collected from each plant
helps the company improve the structural design of new
plants using the feedback obtained from monitoring.
small-scale chlor-alkali water treatment with remote
monitoring is an efficient solution for isolated towns where
access to clean water is not guaranteed. Avs technology
Ag is starting to explore the African market, where this
technological solution could become a game changer for
producing potable water at competitive costs.
Source: UNIDO elaboration.
Box 1.4 Using the Internet of Things for remote control of water treatment plants
Cloud technology is a general term for information shar-
ing, management platform and other application technolo-
gies based on cloud computing. by recording and using
production data together with big data analytics and arti-
ficial intelligence, cloud technology can enable industrial
companies to optimize operations and coordinate differ-
ent business areas, such as management, communication
and r&d.
ZC rubber, a Chinese company located in the hang-
zhou economic and technological development Zone in
Zhejiang Province, and one of the largest tire manufactur-
ers in China, adopted Alibaba’s Cloud et industrial brain
in 2017. using intelligent algorithms and artificial intel-
ligence, this tool helps companies collect, analyse and
model industry knowledge and data. For ZC rubber, it is
helping optimize the production process.
in the past, the production line required manual sorting
of rubber blocks. before the blocks entered the produc-
tion line, workers had to classify the raw material rubber
blocks into a rubber compound according to production
area, processing factory and batch. with the Cloud et
industrial brain, the company can get real-time data based
on process parameters such as the characteristics of the
rubber-discharging time and the monitoring results of the
rubber compound. For example, temperature stability dur-
ing the rubber mixing process was improved, increasing
energy efficiency. supported by artificial intelligence algo-
rithms, the tool analyses each piece of rubber and rapidly
provides the optimal synthesis and parameters, greatly
stabilizing the quality of the rubber compound and reduc-
ing the cost for processing.
in the first six months of adopting this technology, ZC
rubber reports that average production and energy effi-
ciency have increased and that the quality of the rubber
compound has improved. this increase in product qual-
ity and process efficiency led to an increase in the overall
value of sales.
Source: UNIDO elaboration.
Box 1.5 Improving the accuracy of rubber production through cloud computing and big data analytics

44
1
Ad
P t
eC
hn
olo
gie
s A
nd
ind
us
tr
iAl d
ev
elo
Pm
en
t: A g
lob
Al P
er
sP
eC
tiv
e
“ADP technologies offer the possibility of revitalizing industrialization
Better products and increased efficiency advance developmentThe potential benefits that ADP technologies can bring in supporting ISID are again presented along two major channels: the introduction of new and better goods into the market (smart TVs, smart watches, home control devices, and so on) and the increase of production effi-ciency through the digitalization and interconnectivity of production processes. Each of these broad channels directly affects the main dimensions of ISID: industrial competitiveness, environmental sustainability and social inclusion. The benefits also entail risks, and there is no guarantee that these effects will occur without other changes that will obstruct some of these dimensions. As discussed in the next sections, reaping these benefits depends on conditions specific to each country, industry and firm involved in manufacturing production.
Expanded data analytics are key to improving products and servicesThe red boxes reflect the potential impacts on indus-trial competitiveness. ADP technologies can enhance
product–service characteristics and functionalities — including product innovation, customization and time to market. Data analytics, for instance, allow taking advantage of collecting and analysing real-time customer data, enabling the direct involvement of customer demands and facilitating cost-effective mass customization of products. These insights into customer behaviour can provide enormous advantages for new products, services and solutions. The changes open new organizational and business model possi-bilities by attaching services to manufacturing pro-duction. In this way, ADP technologies offer the pos-sibility of revitalizing industrialization and boosting economic growth by creating new goods and by blend-ing manufacturing and service activities.
Data quality and access improve labour productivityADP technologies can also improve production effi-ciency or reduce associated costs. The use of big data analytics, for example, provides real-time insights to improve production efficiency. Data-driven decision-making has led to statistically significant increases in
Figure 1.10 Expected dividends from ADP technologies
New andbetter products
New solutions formarginalized groups • Medical devices at a�ordable prices
• Personalized products, mass customization• New and data-based services• New pricing models
• Improved work conditions, safety• Foster female employment• New skills, task-e�ciency
• Flexible and decentralized production• Supply chain connectivity, delivery,
performance and logistics• Agile, adaptive organization
• Predictive and automatic maintenance, down-time reduction
• Lower inventory rate, increased cash-to-cash cycle
Increase productionefficiency
Better quality andnew business models
Environmental goods
Improved capitalutilization
Energy efficiency and input optimization
Employment qualityand linkages to services
Operational costreduction
• Goods produced with eco-friendly materials• Increased product energy e�ciency
• Emission and waste reduction• Acceleration of circular economy transition
Advanced digital production technologies
Source: UNIDO elaboration based on Andreoni and Anzolin (2019).

45
1
Ad
P t
eC
hn
olo
gie
s A
nd
ind
us
tr
iAl d
ev
elo
Pm
en
t: A g
lob
Al P
er
sP
eC
tiv
e
“Adoption and diffusion of ADP technologies are expected to boost economic growth, job creation and poverty alleviation
productivity (Brynjolfsson and McElheran 2016). And improving data quality and accessibility — presenting data more concisely and consistently across platforms and allowing them to be more easily manipulated — is associated with significant increases in labour produc-tivity (OECD 2017). The use of additive manufactur-ing, in turn, can speed critical stages in scaling up prod-ucts, while reducing the cost of tooling and retooling for new product and process development.
ADP technologies increase the use of fixed assetsIncreasing capital utilization is another channel for ADP technologies to affect competitiveness. This is particularly important for firms operating in develop-ing countries, where capital constraints can be a major barrier for upgrading technology. ADP technologies allow for improving the use of fixed assets, reducing idle times and increasing capacity use. In addition, more flexible robots or 3D printers can reduce investments in multiple automated production lines and the need for investment in tooling and retooling. Predictive main-tenance can also bring benefits (Kaziboni et al. 2019). The combination of networked robots, advanced sen-sors and machine learning allows for immediate self-diagnosis and fault detection, reducing machine down time and providing solutions quickly.
Through productivity gains ADP technologies can support the achievement of SDGs 1, 8 and 9By supporting competitiveness and productivity gains, the adoption and diffusion of ADP technologies are expected to boost economic growth, job creation and poverty alleviation, thus contributing to some of the prime objectives of UN Agenda 2030, as reflected in the SDG 1 on poverty, SDG 8 on decent work and economic growth and SDG 9 on industry, innovation and infrastructure.
ADP technologies also boost circular economy processes, thus contributing to the achievement of SDGs 6, 12 and 13ADP technologies also have potential positive impacts on environmental sustainability which, in turn, can
also bring dividends and improve capital use. These types of technology are expected to boost circular economy processes, decoupling natural resource use from the environmental impact of economic growth. This, in turn, supports the achievement of the SDG 6 for energy, SDG 12 for sustainable consumption and production and SDG 13 for climate change.
The circular economy changes the use of materialsIn circular economy processes, resource f lows — particularly materials and energy — are narrowed and, to the extent possible, closed. Products are designed to be durable, reusable and recyclable, and materials for new products come from old products (UNIDO 2017b). Figure 1.11 summarizes the eight main pro-cesses of the circular economy and classifies them along three broad categories — using fewer primary resources, maintaining the highest value of materials and products and changing utilization patterns.
Advanced digital production connectivity, data and IoT boost the circular economyAll these processes can be accelerated by ADP tech-nologies. For example, the increased connectivity of
Figure 1.11 Main circular economy processes
USE LESS PRIMARY RESOURCES
• Recycling• E�cient use of resources• Utilization of renewable energy sources
CHANGE UTILIZATION PATTERNS
• Product as service• Sharing models• Shi� in consumption patterns
MAINTAIN THE HIGHEST VALUEOF MATERIALS AND PRODUCTS
• Remanufacturing, refurbishment and reuse ofproducts and components
• Product life extension
Source: Rizos et al. 2018.

46
1
Ad
P t
eC
hn
olo
gie
s A
nd
ind
us
tr
iAl d
ev
elo
Pm
en
t: A g
lob
Al P
er
sP
eC
tiv
e
“Collected data may provide a foundation for circular economy business models
people and things through mobile devices has contrib-uted to the proliferation of sharing and product-as-a-service models (Rizos et al. 2018). Through industrial IoT, manufacturers can control and analyse product performance while collecting usage data. In turn, the collected data may provide a foundation for circular economy business models (UNIDO 2017d). Examples include business models where the boundaries between products and services are blurred and manufactur-ers retain ownership and responsibility for operating equipment. Business models geared towards recycling, remanufacturing or parts harvesting can also benefit from the collection of data on use and operations, pro-viding more information on the condition of parts and thus increasing yields and reducing waste.
3D printing saves energyThe application of ADP technologies to manufac-turing processes also opens opportunities for greater energy savings and energy efficiency. Energy savings can arise from optimizing or replacing energy-inten-sive technologies, from introducing new software tools that optimize energy use or from adapting busi-ness processes (UNIDO 2017a). Applying additive manufacturing to the production of parts and proto-types exemplifies the first case. For energy efficiency, introducing these technologies, along with 3D print-ing, may lead to significant energy savings beyond the industrial sector by introducing product inno-vations (see Box 1.3). Consider the increasing use of 3D-printed lightweight aircraft components by some manufacturers to reduce fuel consumption. A recent study assessing the energy and resource impacts of 3D-printed lightweight metallic components in the U.S. aircraft industry finds that 3D-printed com-ponents could replace 9–17 percent of aircraft mass, reducing overall fuel use (Huang et al. 2016).
New technologies can improve working conditions and workers’ involvementADP technologies also affect the social dimension of manufacturing production. They can improve work-ing conditions in industrial production by introducing
new workflows and task allocations. For instance, auto-mation solutions in the automotive sector have offered opportunities for reorganizing production tasks and moving workers away from the most physically demand-ing tasks. ADP technologies can also improve working conditions in manufacturing plants. It is standard prac-tice today for workers to manage advanced robots. The increased collaboration between humans and robots is creating a blended workforce. Safety and working con-ditions on the shop floor are also improved by safety and tracking technologies (see Box 1.2).
ADP technologies can meet some of the consumption needs of marginalized groupsADP technologies can promote social inclusion also by addressing the product needs of marginalized groups. These groups have been largely overlooked by manufacturing systems based on mass and lean pro-duction technologies, whose economic convenience stems from large volumes to lower unit costs. ADP technologies make it possible to design and commer-cialize highly customized products at a lower price, as the diffusion of 3D printing provides a more economi-cal option for low volumes of manufacturing. The production of high-quality medical devices at a more affordable price is a paradigmatic example (Box 1.6).
New technologies need knowledge-intensive servicesThe adoption of ADP technologies in manufacturing production requires additional support from other sec-tors of the economy, most notably knowledge-intensive services that provide the ICT and digital solutions needed to implement smart production. This stronger interaction with services can potentially expand the multiplier effects of manufacturing production on job creation and poverty alleviation discussed previously and open new opportunity for countries to enter the manu-facturing system. Chapter 2 elaborates on this point and presents evidence suggesting that applying these tech-nologies in manufacturing is associated with greater net job creation and increased social inclusiveness.
Taken together, the technologies described here are shaping a new paradigm in manufacturing

47
1
Ad
P t
eC
hn
olo
gie
s A
nd
ind
us
tr
iAl d
ev
elo
Pm
en
t: A g
lob
Al P
er
sP
eC
tiv
e
“Technological revolutions have divided the world into leading and following economies
production and are expected to transform the pro-cesses and outcomes of industrial development. The analysis that follows looks in greater detail at the main
global players that are creating, producing and using these technologies.
Characterizing the global landscape of ADP technologies
Industrial revolutions have leading and following economiesTechnological revolutions have divided the world into leading and following economies, depending on countries’ involvement in creating and using emerging technologies. In many cases, however, important parts of the world have been excluded from the ongoing revolution, entering only after several decades, when the technologies were cheap enough and the capabil-ity gap had narrowed. A major concern at the onset of a new revolution is the extent to which all countries — especially those still trying to develop basic indus-trial capabilities — will be integrated into the emerging technological landscape.
Identifying the leading economies in advanced digital production technologiesThis section characterizes the salient features of the global landscape and the main actors creating and dif-fusing ADP technologies applied to manufacturing. The analysis is limited by the recentness of these tech-nological breakthroughs (many only in the past few years) and by the incomplete availability of data. The focus is on four technologies: industrial robots, CAD-CAM, additive manufacturing and machine learning. These are the core ADP technologies with data on their inventions and trade, the two dimensions used to characterize countries.
Patents, exports and imports characterize the leading economiesPatent and trade data are used to examine the extent to which different economies are engaging in the global creation, production and use of these technologies. Patent data reveal the innovativeness of economies in these technologies. Export data are used to analyse the competitiveness of economies producing goods
Artificial devices to address specific medical needs,
such as prosthetic limbs, have been available for a long
time. however, their cost typically place them out-of-
reach of most people living in developing countries.
thanks to the development and diffusion of 3d printing
technologies, it has become possible to manufacture
medical devices more quickly and at more afford-
able prices in developing countries. kyrgyzstan-based
genesis bionics is an example of how these new tech-
nologies could improve people’s lives anywhere in the
world.
genesis bionics is a start-up company that origi-
nated from an enactus1 project, which involved stu-
dents of the kyrgyz state medical Academy together
with a surgeon specializing in hand surgery and a robot
programmer. the company uses computer-aided
design programs and 3d printing to manufacture cus-
tomized bionic prostheses at affordable prices. the
typical price for a prosthesis falls in a range between
$7,000 and $20,000, while genesis bionics’s prosthe-
ses cost between $1,500 and $2,000. this can make
an enormous difference in kyrgyzstan, where the aver-
age monthly salary was around $250 in 2018.
the increased accessibility of 3d printing technol-
ogy not only reduces the cost of production of such
personalized medical devices, but it also guarantees
their high quality and functionality. Far from being infe-
rior to other, more expensive solutions, genesis bion-
ics’ prostheses have a larger battery capacity, which
can be charged with ordinary power plugs; are lighter,
as they are made of a photopolymer which is very light
and strong; and are environmentally friendly, being
based on sugarcane and corn. genesis bionics also
provides an internally developed virtual reality game to
train the muscles and improve comfort and precision in
the use of the prosthetic hand.
Note1. Enactus is a global experiential learning platform, connecting students, academic and
business leaders. Guided by educators and supported by business leaders, teams of students identify complex issues in their communities, come up with possible potential solutions, and are supported in the development of community-based projects.
Source: UNIDO elaboration.
Box 1.6 Improving inclusiveness with new affordable solutions for marginalized groups

48
1
Ad
P t
eC
hn
olo
gie
s A
nd
ind
us
tr
iAl d
ev
elo
Pm
en
t: A g
lob
Al P
er
sP
eC
tiv
e
“One striking feature is the extreme concentration of patenting and exporting activity
embodying these technologies, while import data is used to analyse the degree to which economies are using these technologies (see Annex A.1). An under-lying assumption of the analysis is that the adoption of these technologies in economies with relatively low patent activity is mainly — if not exclusively — through imports of capital goods embodying these technologies.
Who is doing what?
The top 50 economies in advanced digital productionFigure 1.12 provides an early glimpse into how differ-ent economies are engaging with ADP technologies. It
lists the top 50 economies in the patenting,11 export-ing and importing of these technologies, ordered by their corresponding shares in world totals.
The very top economies explain most of the advanced digital production activityOne striking feature is the extreme concentration, especially of patenting and exporting activity. In both distributions, the average is extremely high, and only a few economies are above it. As a result, the top economies (those above the average) explain most of the world activity in each area — above 90 percent.
Figure 1.12 Patenting, exporting and importing of ADP technologies: Different roles but similar concentration of the top 50 economies
0 10 20 30 40
ZambiaZimbabweArgentina
Bosnia and HerzegovinaViet NamHungary
Islamic Republic of IranPhilippines
EstoniaLithuania
South AfricaUkraine
Bolivarian Republic of VenezuelaRomania
ChileMalaysiaThailandPortugal
Saudi ArabiaBrazil
BulgariaLuxembourg
PolandCzechia
Russian FederationIndia
Hong Kong SAR, ChinaNorway
SingaporeIrelandAustriaFinland
DenmarkAustraliaBelgiumCanada
SpainItaly
IsraelSweden
NetherlandsRepublic of Korea
United KingdomSwitzerland
FranceTaiwan Province of China
ChinaGermany
JapanUnited States
a. Patent activity b. Export activity c. Import activity
World global patents share (percent)0 5 10 15 20
IrelandBangladesh
ColombiaBelarus
IsraelDenmark
LuxembourgEgypt
LithuaniaPhilippines
AlgeriaUnited Arab Emirates
AustraliaArgentina
SwedenSingapore
South AfricaIslamic Republic of Iran
PortugalSlovakiaRomania
Hong Kong SAR, ChinaHungary
Saudi ArabiaMalaysia
NetherlandsSwitzerland
Taiwan Province of ChinaSpain
AustriaBelgiumCzechia
BrazilPoland
CanadaViet NamIndonesia
JapanRepublic of Korea
ThailandFranceTurkey
United KingdomIndiaItaly
Russian FederationMexico
GermanyUnited States
China
World import share (percent)0 5 10 15 20
UkraineBelarus
PhilippinesSouth Africa
IrelandUnited Arab Emirates
New ZealandViet Nam
Russian FederationNorwayBulgariaMexico
PortugalSlovenia
BrazilRomaniaHungaryAustraliaMalaysiaLithuania
CroatiaFinland
DenmarkSingapore
NigeriaLuxembourg
PolandHong Kong SAR, China
IsraelTurkey
SlovakiaIndia
ThailandBelgiumSweden
United KingdomNetherlands
SpainCzechiaCanadaFrance
SwitzerlandRepublic of Korea
United StatesAustria
Taiwan Province of ChinaItaly
ChinaJapan
Germany
World export share (percent)
Above average
88%
Above average
94%
Above average
91%
Frontrunners share: 91% Frontrunners share: 69% Frontrunners share: 46%
Note: Export and import values are in current dollars. Panel a refers to the cumulative number of global patent families in the last 20 years. Global patents are defined as those simultaneously applied for in at least two of the following patent offices: the European Patent Office, the United States Patent and Trademark Office, the Japan Patent Office and/or the China National Intellectual Property Administration Office. Panels b and c refer to the average export and import values of capital goods associated with these technologies for 2014–2016. The figure shows only the shares of the top 50 economies, but the averages are calculated considering all economies with non-zero values in each indicator. The horizontal line in each panel separates the economies above and below the average share.Source: UNIDO elaboration based on dataset by Foster-McGregor et al. (2019) derived from Worldwide Patent Statistical Database 2018 Autumn Edition (EPO 2018) and BACI International Trade Database (Gaulier and Zignago 2010).

49
1
Ad
P t
eC
hn
olo
gie
s A
nd
ind
us
tr
iAl d
ev
elo
Pm
en
t: A g
lob
Al P
er
sP
eC
tiv
e
“Ten frontrunner economies account for 91 percent of patents in ADP technology
Ten frontrunner economies account for 91 percent of patents, 70 percent of exports and 46 percent of imports of new technologiesOf the 50 economies with at least one patent in an ADP technology, only 10 show above average mar-ket shares. In order, these economies are the United States, Japan, Germany, China, Taiwan Province of China, France, Switzerland, the United Kingdom, the Republic of Korea and the Netherlands. Together, they account for 91 percent of all global patent fam-ilies. This group leads the rest of the world in creat-ing new ADP technologies. All the economies in this group also have above average shares in world exports and imports of capital goods associated with these technologies (see panels b and c in Figure 1.12). That is, they not only invent the new technologies but also sell (and purchase) in global markets the goods embodying these technologies. They account for almost 70 percent of global exports and 46 percent of global imports. These economies are defined as the frontrunners in ADP technologies.
Other economies in the top 50, though with lower values, are also engaging in the new technologiesOther economies are also engaging in the new tech-nologies, though with lower values. Israel, Italy and Sweden, for instance, show large shares of global
patents, whereas Austria and Canada have high values of exports. By the same token, Mexico, Thailand and Turkey have high values of imports.
Looking just at global shares may be deceptive: Comparative indices of patents, exports and imports indicate other notable economiesBut looking exclusively at world market shares for trade variables could bias the final results, rewarding large economies and penalizing small ones. By the same token, an exclusive focus on global patents might lose sight of important innovation taking place at the coun-try or regional level. Figure 1.13 illustrates how the ranking of economies in each dimension changes using alternative indicators: for patents, using regular (those not defined as global) instead of global patent families, and for exports and imports, using revealed compara-tive advantage indices instead of world market shares.
How to distinguish followers, latecomers and laggardsTo account for these differences, the strategy used for characterizing economies not defined as frontrunners combines both indicators for each dimension and iden-tifies follower, latecomer and laggard economies. The criteria are based on the average values of the distribu-tions once the frontrunners have been excluded from the sample (see Annex A.1 for the details). Using these
Figure 1.13 Changes at the top with different indicators of patent, export and import activity in ADP technologies
Rank
ing,
glo
bal p
aten
t fam
ilies
a. Patents
Ranking, regular patent families
c. Importsb. Exports
50 40 30 20 10 0
Rank
ing,
wor
ld m
arke
t sha
res
Ranking, revealed comparative advantage
50
40
30
20
10
0
50
40
30
20
10
0
50
40
30
20
10
0
50 40 30 20 10 0
Rank
ing,
wor
ld m
arke
t sha
res
Ranking, revealed comparative advantage
New ZealandIndonesia Mexico
Turkey RwandaPhilippines
Brazil
India
RussianFederation
Latvia Cyprus
Syrian ArabRepublic
Bulgaria
Denmark
Kyrgyzstan
Slovakia
Lebanon
Lithuania
CroatiaLuxembourg
Israel
Finland
Slovenia
UgandaEritreaEl Salvador
Zambia
Malawi
BulgariaSlovenia
Belarus
Côte d’Ivoire
Serbia
Islamic Republic of Iran
Romania
LuxembourgLithuania
Ethiopia
50 40 30 20 10 0
Note: Export and import values are in current $. In each panel, the economies far below the diagonal show a significant improvement in their ranking if the indicator on the horizontal axis is used.Source: UNIDO elaboration based on dataset by Foster-McGregor et al. (2019) derived from Worldwide Patent Statistical Database 2018 Autumn Edition (EPO 2018) and BACI International Trade Database (Gaulier and Zignago 2010).

50
1
Ad
P t
eC
hn
olo
gie
s A
nd
ind
us
tr
iAl d
ev
elo
Pm
en
t: A g
lob
Al P
er
sP
eC
tiv
e
“ Large parts of the world remain excluded from recent technological breakthroughs
averages as thresholds, five additional country groups are identified — followers in production, followers in use, latecomers in production, latecomers in use and laggards — each showing a less intense engagement with ADP technologies than the previous group (Table 1.1).
Frontrunners and followers are actively engaging with ADP technologiesOnly 50 economies (the frontrunners and follow-ers) can be considered as actively engaging with ADP technologies. They are either producing or using these technologies to an extent captured by country statis-tics. The remaining economies show low activity (late-comers) or very low to no activity (laggards) in the field. The world map in Figure 1.14 illustrates two key features of the global landscape for ADP technologies.
Much of the world, especially in Africa, is not engaging with the new technologiesFirst, large parts of the world, especially on the African continent, remain excluded from recent technological breakthroughs. These economies are not producing or importing any significant values of the most represent-ative goods within this technological realm. In fact, about half of all economies included in the analysis can be considered excluded from the current wave of technological change.12
The roles are diverse among economies engaging in new technologiesSecond, even among economies with some activ-ity in ADP technologies, the roles are quite diverse. Latecomers, for instance, have already taken initial
Group Short description Criteria
Frontrunners (10 economies)
Top 10 leaders in the field of ADP technologies
Economies with 100 or more global patent family applications in ADP technologies (average value for all economies with some patent activity in this field)
Econom
ies actively engaging with A
DP
technologies
Followers in production (23 economies)
As innovators Economies actively involved in patenting in the field of ADP technologies
Economies with at least 20 regular patent family applications, or 10 global patent family applications in ADP technologies (average values for all economies with some patent activity, once frontrunners are excluded)
As exporters Economies actively involved in exporting ADP-related goods
Economies relatively specialized in exporting ADP-related goods that sell large volumes in world markets (above the average market share once frontrunners are excluded)
Followers in use (17 economies)
As importers Economies actively involved in importing ADP-related goods
Economies relatively specialized in importing ADP-related goods that purchase large volumes in world markets (above the average market share once frontrunners are excluded)
Latecomers in production (16 economies)
As innovators Economies with some patenting activity in ADP technologies
Economies with at least one regular patent family application in ADP technologies
As exporters Economies with some exporting activity of ADP-related goods
Economies that either show relative specialization in exporting ADP-related goods or sell large volumes in world markets (above the average market share once frontrunners are excluded)
Latecomers in use (13 economies)
As importers Economies with some importing activity of ADP-related goods
Economies that either show relative specialization in importing ADP-related goods or sell large volumes in world markets (above the average market share once frontrunners are excluded)
Laggards (88 economies)
Economies showing no or very low engagement with ADP technologies
All other economies not included in the previous groups
Note: The characterization is for 167 economies that, according to the United Nations Statistical Division, had more than 500,000 inhabitants in 2017. See Annex A.1 for the classification of economies by their level of engagement with ADP technologiesSource: UNIDO elaboration.
Table 1.1 From laggards to frontrunners in the emerging technological landscape
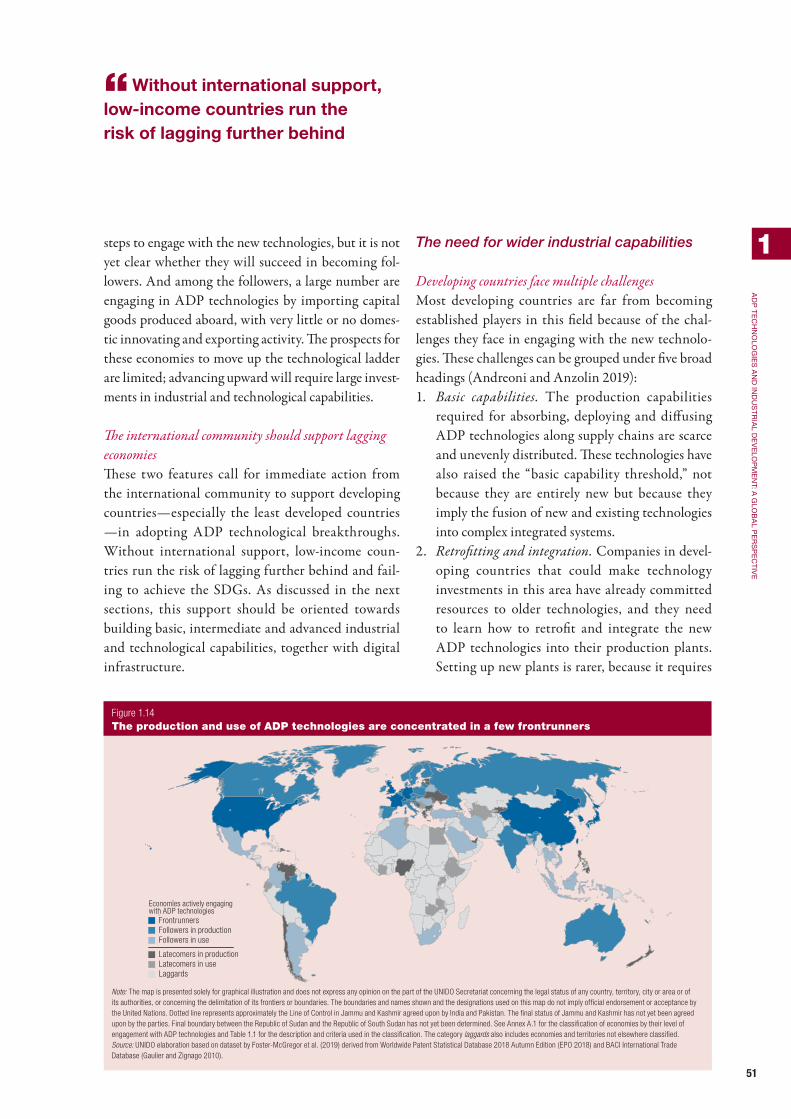
51
1
AD
P t
ec
hn
olo
gie
s A
nD
inD
us
tr
iAl D
ev
elo
Pm
en
t: A g
lob
Al P
er
sP
ec
tiv
e
“Without international support, low-income countries run the risk of lagging further behind
steps to engage with the new technologies, but it is not yet clear whether they will succeed in becoming fol-lowers. And among the followers, a large number are engaging in ADP technologies by importing capital goods produced aboard, with very little or no domes-tic innovating and exporting activity. The prospects for these economies to move up the technological ladder are limited; advancing upward will require large invest-ments in industrial and technological capabilities.
The international community should support lagging economiesThese two features call for immediate action from the international community to support developing countries — especially the least developed countries — in adopting ADP technological breakthroughs. Without international support, low-income coun-tries run the risk of lagging further behind and fail-ing to achieve the SDGs. As discussed in the next sections, this support should be oriented towards building basic, intermediate and advanced industrial and technological capabilities, together with digital infrastructure.
The need for wider industrial capabilities
Developing countries face multiple challengesMost developing countries are far from becoming established players in this field because of the chal-lenges they face in engaging with the new technolo-gies. These challenges can be grouped under five broad headings (Andreoni and Anzolin 2019):1. Basic capabilities. The production capabilities
required for absorbing, deploying and diffusing ADP technologies along supply chains are scarce and unevenly distributed. These technologies have also raised the “basic capability threshold,” not because they are entirely new but because they imply the fusion of new and existing technologies into complex integrated systems.
2. Retrofitting and integration. Companies in devel-oping countries that could make technology investments in this area have already committed resources to older technologies, and they need to learn how to retrofit and integrate the new ADP technologies into their production plants. Setting up new plants is rarer, because it requires
Figure 1.14 The production and use of ADP technologies are concentrated in a few frontrunners
FrontrunnersFollowers in productionFollowers in use
Latecomers in productionLatecomers in useLaggards
Economies actively engagingwith ADP technologies
Note: The map is presented solely for graphical illustration and does not express any opinion on the part of the UNIDO Secretariat concerning the legal status of any country, territory, city or area or of its authorities, or concerning the delimitation of its frontiers or boundaries. The boundaries and names shown and the designations used on this map do not imply official endorsement or acceptance by the United Nations. Dotted line represents approximately the Line of Control in Jammu and Kashmir agreed upon by India and Pakistan. The final status of Jammu and Kashmir has not yet been agreed upon by the parties. Final boundary between the Republic of Sudan and the Republic of South Sudan has not yet been determined. See Annex A.1 for the classification of economies by their level of engagement with ADP technologies and Table 1.1 for the description and criteria used in the classification. The category laggards also includes economies and territories not elsewhere classified.Source: UNIDO elaboration based on dataset by Foster-McGregor et al. (2019) derived from Worldwide Patent Statistical Database 2018 Autumn Edition (EPO 2018) and BACI International Trade Database (Gaulier and Zignago 2010).

52
1
Ad
P t
eC
hn
olo
gie
s A
nd
ind
us
tr
iAl d
ev
elo
Pm
en
t: A g
lob
Al P
er
sP
eC
tiv
e
“The ADP technology landscape reflects the global heterogeneity of industrial capabilities
significant long-term investment and access to markets.
3. Digital infrastructure. ADP technologies demand substantial infrastructure for their use in produc-tion. Some developing countries face significant challenges in providing affordable and high-qual-ity electricity as well as reliable connectivity. These and other infrastructure bottlenecks might make technology investments by individual firms too risky and financially unviable.
4. Digital capability gap. In many developing coun-tries, companies engage with some ADP tech-nologies, but many of these technologies remain contained within the company and occasionally a few close suppliers who have the production capa-bilities to use them. Around these 4IR islands, the vast majority of firms still use technologies typical of 3IR or even 2IR. In this context, it is extremely difficult for a leading company to link backwards and nurture its supply chain. When the digital capability gap is extreme, the diffusion of ADP technologies is extremely limited.
5. Access and affordability. ADP technologies tend to be controlled by a limited number of countries and their leading firms. Developing countries rely heavily on importing these technologies. In many cases, even when firms can mobilize the resources to access them, they remain tied to providers for hardware and software components.
To engage with ADP technologies, developing economies must build industrial capabilitiesTaken together, these challenges point in one direc-tion: the need to build basic industrial production capabilities as a prerequisite for joining the 4IR. The ADP technology landscape reflects the global hetero-geneity of industrial capabilities: frontrunners tend to have larger industrial capabilities than followers, fol-lowers larger capabilities than latecomers and latecom-ers larger capabilities than laggards. In each group, a clear distinction can also be made based on production or use. Production (innovating and exporting) requires greater industrial capabilities than use (Figure 1.16).
Average Competitive Industrial Performance Index scores differentiate laggards, latecomers, followers and leadersThe Competitive Industrial Performance (CIP) Index reflects the industrial performance of countries and thus can be a proxy for their underlying industrial capabilities — higher CIP should be associated with stronger industrial capabilities. In 2017, the average CIP Index was much higher among frontrunners than among all other country groups. The followers in pro-duction had an average CIP Index value half that of the frontrunners, but higher than that of followers in use. Followers also show larger CIP Index values than latecomers, who rank higher than laggards. Each cat-egory has an average CIP Index value larger than the previous one, illustrating the stairway of industrial capabilities that countries need to climb in order to engage and upgrade roles in the use and production of ADP technologies.
Figure 1.15 Engaging with ADP technologies requires increasing industrial capabilities
0.0
0.1
0.2
0.3
0.4
FrontrunnersFollowersin production
Followersin use
Latecomersin production
Latecomersin use
Laggards
Aver
age
Com
petit
ive
Indu
stria
l Per
form
ance
Inde
x
Followers, 0.131
Latecomers, 0.037
Economies activelyengaging with ADPtechnologies
Note: ADP is advanced digital production. All values are average for the year 2017. See Annex A.1 for the classification of economies by their level of engagement with ADP technologies, and Table 1.1 for the description and criteria used in the classification. CIP is Competitive Industrial Performance.Source: UNIDO elaboration based on the Competitive Industrial Performance Index 2019 database (UNIDO 2019c) and dataset by Foster-McGregor et al. (2019) derived from Worldwide Patent Statistical Database 2018 Autumn Edition (EPO 2018) and BACI International Trade Database (Gaulier and Zignago 2010).

53
1
Ad
P t
eC
hn
olo
gie
s A
nd
ind
us
tr
iAl d
ev
elo
Pm
en
t: A g
lob
Al P
er
sP
eC
tiv
e
“Actively engaging in the new technologies requires building strong industrial capabilities
CIP Index values tell more about new technology engagement than country income groupTo some extent, these results reflect the fact that front-runners and followers tend to be richer than the rest. Average CIP values by country income group reveal the same results for economies actively engaging in the new technologies (frontrunners and followers) and the rest within each income group (see Figure 1.16). Within the three income groups (low and lower-middle income, upper-middle income, and high-income), frontrunners and followers have a much higher average CIP: at least five times higher than the corresponding average of late-comers and laggards. In fact, the average CIP values for developing countries (low and lower-middle income and upper-middle income) active in the new technologies are on average larger than the average CIP of high-income economies not yet actively engaged in these technolo-gies. At all incomes, but especially low and lower-middle
income, actively engaging in the new technologies requires building strong industrial capabilities.
Dividends from engaging: Growth, employment and sustainability
Economies engaging with the new technologies have grown fastestEconomies that engaged in these technologies have grown faster in recent years, showing above average productivity gains but also (in most cases) positive manufacturing job creation.13
Digital production technology took off in the 2000sThe technologies embodied in the capital goods ana-lysed for the trade data have been around for a long time, and the data suggest that trade in these goods took off after 2002 (Figure 1.17). For patents, the data allow for a more refined analysis, and the technolo-gies tend to be more recent — those defining today’s
Figure 1.16 Within income groups, economies actively engaging with ADP technologies show much greater industrial capabilities than the rest
0.00
0.05
0.10
0.15
0.20
0.25
High-incomeUpper-middleincome
Low- and lower-middleincome
Aver
age
perf
orm
ance
in th
e Co
mpe
titiv
e In
dust
rial P
erfo
rman
ce In
dex
Economies activelyengaging withADP technologiesOther economies
Note: ADP is advanced digital production. All values are average for the year 2017. The analysis includes 140 economies, of which 50 are actively engaging with advanced digital production (ADP) technologies). By World Bank income group definitions for 2017: 53 are low- and lower-middle income economies (of which 4 are active), 38 are upper-middle income economies (of which 13 are active) and 49 are high-income economies (of which 33 are active). See Annex A.1 for the classification of economies by their level of engagement with ADP technologies.Source: UNIDO elaboration based on the Competitive Industrial Performance Index 2019 database (UNIDO 2019c) and dataset by Foster-McGregor et al. (2019) derived from Worldwide Patent Statistical Database 2018 Autumn Edition (EPO 2018) and BACI International Trade Database (Gaulier and Zignago 2010).
Figure 1.17 The production of ADP technologies takes off after 2005
0
50
100
150
200
250
201620142012201020082006200420022000
Inde
x (2
000
= 1
00) Index (2000 =
100)
Evolution of ADP-related capitalgoods imports (left axis)
0
250
500
750
1,000
1,250ADP technology
takeoff
Evolution of cumulative patent families in ADP technologies (right axis)
2002
2007
Note: ADP is advanced digital production. Import values are in current $. The blue line shows the evolution in the total value of imports related to ADP technologies at the world level for three groups of goods: 3D printers, computer-aided design and computer-aided manufacturing (CAD-CAM) equipment and industrial robots. The green line shows the evolution in the cumulative number of patent families in four ADP technologies: additive manufacturing, CAD-CAM, robotics and machine learning.Source: UNIDO elaboration based on the dataset by Foster-McGregor et al. (2019) derived from Worldwide Patent Statistical Database 2018 Autumn Edition (EPO 2018) and BACI International Trade Database (Gaulier and Zignago 2010).

54
1
Ad
P t
eC
hn
olo
gie
s A
nd
ind
us
tr
iAl d
ev
elo
Pm
en
t: A g
lob
Al P
er
sP
eC
tiv
e
“Average MVA growth is much faster for frontrunners and followers than for latecomers and laggards
frontier in ADP technologies. The evolution of cumu-lative patents also shows a break, with take-off around 2007. Considering trade and patents together, the take-off of these technologies can be set around 2005.
Growth dynamics differ across country income groupsWith 2005 considered the take-off for creating and using these technologies, the dynamics of different country groups in MVA growth, employment creation and productivity gains are examined for 2005–2017. Since growth dynamics are very different across coun-try income groups, the three broad income categories used before (low- and lower-middle income, middle-income and high-income) are analysed separately. For each group, a distinction is made between economies active in ADP technologies (frontrunners and follow-ers) and the rest (latecomers and laggards).
Frontrunners and followers lead in MVA growth because of productivity growthAverage MVA growth is much faster for frontrunners and followers than for latecomers and laggards (panel
a in Figure 1.18). In low- and lower-middle income and high-income economies, MVA growth for frontrun-ners and followers is almost twice that for latecomers and laggards. In upper-middle income economies, the difference is more than 50 percent. Faster growth in MVA can be explained by more dynamic employment creation, faster productivity gains or both (panels b and c). The largest differences are observed in the pro-ductivity dynamics. Frontrunners and followers are clearly ahead in productivity growth. In developing countries (low- and lower-middle income and upper-middle income groups), frontrunners and follow-ers also show positive growth of employment during this period. In high-income economies, productivity growth more than compensates for a net destruction of jobs during the period (a situation not observable in the high-income latecomers or laggards).
ADP technologies tend towards environmentally friendly solutionsPatent activity in ADP technologies also shows a bias towards environmentally friendly solutions. This is
Figure 1.18 Economies active in ADP technologies grow faster than the rest, across all income groups
a. Real MVA growth b. Employment growth c. Productivity growth
Low- andlower-middle
income
Upper-middleincome
Highincome
0 2 4 86Average yearly growth rate (percent)
–2 0 2 4Average yearly growth rate (percent)
–2 0 2 4Average yearly growth rate (percent)
Economies actively engaging with ADP technologies Other economies
Note: ADP is advanced digital production. MVA is manufacturing value added. Each panel shows the average yearly growth rate of the corresponding group and variable between 2005 and 2017. The analysis includes 166 economies (of which 50 are actively engaging with ADP technologies), which are classified according to World Bank’s income group definitions for 2017: 73 low- and lower-middle income economies (of which 4 are active); 44 upper-middle income economies (of which 13 are active) and 49 high-income economies (of which 33 are active). Productivity is calculated as manufacturing value added in constant $ 2010 divided by the number of workers. See Annex A.1 for the classification of economies by their level of engagement with ADP technologies.Source: UNIDO elaboration based on the Manufacturing Value Added 2019 database (UNIDO 2019g), ILO (2018), and dataset by Foster-McGregor et al. (2019) derived from Worldwide Patent Statistical Database 2018 Autumn Edition (EPO 2018) and BACI International Trade Database (Gaulier and Zignago 2010).

55
1
Ad
P t
eC
hn
olo
gie
s A
nd
ind
us
tr
iAl d
ev
elo
Pm
en
t: A g
lob
Al P
er
sP
eC
tiv
e
“ADP technologies have above-average green content
another important dividend to consider, especially in relation to the conceptual framework (see Figure 1.1).
Robots, machine learning and CAD-CAM systems have above-average green contentADP technologies have above-average green con-tent (Figure 1.19). This is the case especially for the technologies related to robots, machine learning and CAD-CAM systems and, less so, for additive manu-facturing technologies. The most important charac-teristic highlighted by patent reviewers of these tech-nologies is their potential contribution to mitigating greenhouse gas emissions.
New windows of opportunity? Catching up, stage-skipping and leapfrogging
ADP technologies are the tip of the iceberg
ADP technologies require industrial and technological capabilitiesBringing important benefits, ADP technologies also require a very strong industrial and technological base. For that reason, their diffusion around the world remains limited.14 They can be regarded as the frontier of the broader realm of digital technologies applied to manufacturing production.
Only a small portion of the economy in most countries has entered the fourth industrial revolutionThe reality for most countries: Different generations of digital technology applied to manufacturing produc-tion coexist, and those associated with the 4IR have permeated only a small part of the economy. A salient feature in developing countries is the high heterogene-ity both between and within industrial sectors. This heterogeneity is even more evident in the adoption of highly sophisticated technologies.
Developing countries fit incomplete third industrial revolution systems with 4IR technologiesIn both developing and advanced economies, the recent applications of ADP technologies coexist with
older generations of digital technologies from previ-ous industrial revolutions. Companies in developing countries still use 3IR technologies, often ineffectively. Their lack of command of 3IR technologies — basic automation and ICTs — also makes it difficult for them to fully engage with the opportunities of ADP tech-nologies and the 4IR. The main opportunities for these countries — and also for advanced ones — lie in the gradual integration of these technologies within exist-ing 3IR production systems, retrofitting production plants in areas of the firm where integration is possible. A key challenge facing developing countries in everyday operations is how to integrate ADP technologies into existing production operations — that is, retrofitting (Andreoni and Anzolin 2019). For example, captur-ing the opportunities offered by additive manufactur-ing in areas such as rapid prototyping (making product design faster and more effective) or tooling (saving on expensive tools or retooling) cannot happen without
Figure 1.19 ADP technologies have above-average green content
0
5
10
15
20
25
Additivemanufacturingtechnologies
Robot, machine learningand CAD-CAMtechnologies
ADP technologies
Shar
e of
gre
en p
aten
ts (p
erce
nt)
All technologies, 3.6
Note: ADP is advanced digital production. CAD-CAM is computer-aided design and computer-aided manufacturing. When patent examiners consider that a patent is contributing to climate change mitigation, they attach a special Y02 tag. This tag makes it possible to identify the subgroup of patents that refer to green technologies and compare it with it the share of green patents in all patents applied in any technology field (not only ADP technologies) in the last 20 years.Source: UNIDO elaboration based on dataset by Foster-McGregor et al. (2019) derived from Worldwide Patent Statistical Database 2018 Autumn Edition (EPO 2018).

56
1
Ad
P t
eC
hn
olo
gie
s A
nd
ind
us
tr
iAl d
ev
elo
Pm
en
t: A g
lob
Al P
er
sP
eC
tiv
e
“ Firms use a combination of digital technologies emerging from different paradigms
an effective restructuring of production operations, technology scaling up and organizational change.
Different technological generations coexistA taxonomy of generations of manufacturing produc-tion, characterized by an increasingly sophisticated approach to the use of digital technologies in produc-tion and directly associated with Figure 1.7, can be created by building on the idea that at any given time firms in different countries are likely to use a combi-nation of digital technologies emerging from different technological paradigms (Figure 1.20; Kupfer et al. 2019). These technologies can then be mapped to the specific business functions in which firms are engaged.
Up to 70 percent of firms are still in analog productionThe bottom of the pyramid, analog production, repre-sents a very initial stage of production that makes no
use of digital production technologies in any area of the firm. This seems to be the reality in the least devel-oped countries and low-income economies. Most of the manufacturing sector in countries defined as lag-gards falls into this category (Chapter 3 give the exam-ple of Ghana, where almost 70 percent of firms sur-veyed for this report are in the analog category). Once firms start adopting digital production technologies, four generations are distinguished, moving upward from analog production. The first category, rigid pro-duction, is characterized by the use of digital applica-tions for specific purposes and in isolation from each other. The second category, lean production, refers to the semi-flexible automation of production with the aid of digital technology, accompanied by partial integration across business areas. The third category, integrated production, entails using digital technolo-gies across all business functions. The fourth and final
Figure 1.20 Four generations of digital production technologies applied to manufacturing production
SMARTPRODUCTION
4.0
3.0
2.0
1.0
0.0
DPTs allow for fully integrated, connected, and smart production processes, where information flows across operations and generates real-time feedback to support decision-making (such as use of smart sensors and machine-to-machine communication, cobots, big data analytics, cloud computing, artificial intelligence and 3D printing)
DPTs integrated across different activities and functions, allowing for the interconnection of the whole production process (such as use of Enterprise Resource Planning systems, fully “paperless” electronic production control system, industrial robots)
DPTs involve and connect different functions and activities within the firm (such as use of CAD-CAM linking up product development and production processes; basic automation)
DPTs limited to a specific purpose in a specific function (such as use of CAD only in product development; use of machines operating in isolation)
No DPTs used throughout the whole production process (such as personal or phone contact with suppliers; use of machinery that is not microelectronic based)
INTEGRATEDPRODUCTION
LEAN PRODUCTION
RIGID PRODUCTION
ANALOG PRODUCTION
Note: DPT is digital production technology. CAD is computer-aided design. CAM is computer-aided manufacturing.Source: UNIDO elaboration based on Kupfer et al. (2019).

57
1
Ad
P t
eC
hn
olo
gie
s A
nd
ind
us
tr
iAl d
ev
elo
Pm
en
t: A g
lob
Al P
er
sP
eC
tiv
e
“ Latecomer economies do not simply follow the technological path of advanced countries
category, smart production, is characterized by the use of digital technologies with information feedback to support decision-making — for example, manag-ing business with big data and support from artificial intelligence.
Generation 1.0 and generation 2.0 of digital pro-duction technologies (see Figure 1.20) have been around for as long as numerical control programming systems have existed (late 1950s), though the evolu-tion of devices such as CAD has been exponential in recent years thanks to parametric design.15 Even if the efficiency and quality of processes are substantially improved, evolving from generation 1.0 to generation 2.0 does not require major organizational changes. But evolving from generation 2.0 to generation 3.0 requires substantial changes — to fully integrate organ-izational functions, with comprehensive and effective standardization of processes and information systems. Generation 4.0 implies the use of advanced commu-nications devices, robotization, sensorization, big data and artificial intelligence. Thus, it can be directly asso-ciated with the inner green triangle of Figure 1.7.
Leapfrogging into the 4IR depends on country and industry conditionsA key question for countries where most manufac-turing firms lie far below the frontier — concentrated somewhere between analog and generation 1.0 — is how can they move up the technology ladder. In par-ticular, can these firms skip some generations of digi-tal production technologies or directly leapfrog to the most advanced? Differences in capabilities, endow-ments, organizational characteristics, technological efforts, and infrastructural and institutional condi-tions explain why some firms (and countries) succeed in climbing the technology ladder and others do not.
Moving towards the frontier
Development by latecomers often includes leapfroggingEconomic development is portrayed by many scholars as a process in which latecomers absorb new technolo-gies and close the technological gap with the world’s
leading economies. One extended view is that late-comers develop by assimilating and adapting forerun-ners’ obsolete technologies. However, latecomer econ-omies do not simply follow the technological path of advanced countries. Sometimes they skip stages or even create their own paths. By so doing, they might be able to leapfrog older vintages of technology, bypass heavy investments in previous technological systems and move directly to the most advanced emerging technology (Lee 2019).
The newest technology’s highest productivity is yet to comeFirms in leading economies today are (on average) using generation 3.0 technologies, the ones yield-ing the highest productivity (Figure 1.21). The older generation technologies (generation 1.0) have been around for a long time and have reached their maxi-mum productivity. The newest generation technolo-gies (generation 4.0) have only recently emerged. For these technologies, average productivity can still be
Figure 1.21 Leapfrogging in digital technologies for manufacturing production
FutureTodayPast
Prod
uctiv
ity
Generation 4.0
Generation 3.0
Generation 2.0
Generation 1.0
Note: The figure illustrates conceptually the time trajectory of different technology generations in terms of their average productivity. The curves indicate the level of productivity (vertical axis) associated with the use of that generation at a specific point in time (horizontal axis). The vertical dotted line indicates the present time. For a firm using Generation 1.0 today, a path-following strategy would entail moving to Generation 2.0, a stage skipping strategy would entail moving to Generation 3.0, and a path creating strategy would entail moving to Generation 4.0.Source: UNIDO elaboration based on Lee (2019).

58
1
Ad
P t
eC
hn
olo
gie
s A
nd
ind
us
tr
iAl d
ev
elo
Pm
en
t: A g
lob
Al P
er
sP
eC
tiv
e
“ In a path-creating strategy, the latecomer adopts the newest generation of technology
below that of generation 3.0 but with the best pros-pects for the years ahead.
A choice between path following, stage skipping and path creatingThe experience of the Republic of Korea and other successful economies in South East Asia suggests three archetypical strategies for firms in latecomer econo-mies to catch up with the frontrunners: adopt the old technologies (path following), move to the tech-nology currently used in the leading countries (stage skipping) or jump directly to the emerging technology (path creating; Lee 2019).
Path following uses older technology at low costThe main advantage of a path-following strategy is that older technologies tend to be readily available at low prices, particularly during business downturns. However, their lower productivity would restrict the chances of being competitive in markets where lead-ing firms are operating. So, latecomer firms should enter a low-end segment of the market while taking advantage of other opportunities, such as lower rela-tive labour costs. This was the strategy followed by the Korean company Pohang Iron and Steel Company (POSCO) when it entered the steel industry in the 1970s (Box 1.7).
Stage skipping enables competition with established producersIn a stage-skipping strategy, the latecomer firm com-petes directly with firms in the leading economies, provided it has the financial resources to purchase up-to-date technology and can find it in the market or can find established firms willing to transfer it. In this case, the latecomer might emerge as a powerful rival to the established producers since the latecomer will not only enjoy the same productivity level but it will benefit from some degree of cost competitiveness due to the lower relative wages that typically characterize latecomer economies. Again in the case of POSCO, it was precisely through a stage-skipping strategy of adopting up-to-date technologies in the late 1990s
that the company managed to forge ahead of the lead-ing company of the time (see Box 1.7).
Path creating has the highest potential but is the riskiest approachIn a path-creating strategy, the latecomer adopts the newest generation of technology. The main advantage of this strategy is that it focuses on the technology with the highest long-term potential (see Figure 1.21). But since the technology is new, this strategy also implies risks because the technology is neither stable nor reliable and has low productivity or high costs in its early stages. It was precisely through a path-creat-ing strategy that Nokia leapfrogged into digital tech-nologies in the mobile phone industry and dethroned Motorola, the world’s leading company, by the mid-1990s. And in the early 2010s, Samsung dethroned Nokia by incorporating a new emerging technology — a mobile operating system that was custom built to support the touch interface that later became a stand-ard feature of smart phones.
Adopting emerging technologies is key to advancingA key question for firms in today’s laggard and late-comer countries is what strategy to take to become followers. An important historical insight is that latecomers do not have to invent new technologies. Instead, their main entry point could be to rapidly adopt emerging technologies or adapt them to local conditions through incremental, follow-on innova-tions with local twists. The experience of some of the most successful manufacturing firms in East Asia sug-gests that learning is not possible without adoption. Samsung and Hyundai Motors in the Republic of Korea started by adopting foreign technology for pro-duction and learned by using it before enhancing pro-ductivity by mastering these technologies (Lee 2019).
Opportunities for latecomers
Latecomers are not constrained by prior investmentsThe world map in Figure 1.14 reveals a pessimis-tic view of the global landscape of ADP technology

59
1
Ad
P t
eC
hn
olo
gie
s A
nd
ind
us
tr
iAl d
ev
elo
Pm
en
t: A g
lob
Al P
er
sP
eC
tiv
e
“ In times of paradigm shifts, new windows of opportunity emerge for latecomers
creation and diffusion. Most the world’s countries are either latecomers or laggards, with no or marginal engagement with new technologies. History shows, however, that latecomers might have some advan-tages when adopting new technologies since they are not constrained by large investments in old technolo-gies. So, in times of paradigm shifts and technological breakthroughs, new windows of opportunity emerge for latecomers to catch up technologically (Lee 2019).
Small start-up firms have advantages in exploiting opportunitiesStart-ups and young small and medium-sized enterprises (SMEs) in developing countries might be better posi-tioned to exploit windows of opportunity than estab-lished firms. These firms are less likely to be complacent about existing technologies or business models. They have no sunk investment in old or exiting technologies and business models and are thus more inclined to switch.
u.s. firms dominated steel production during the first half
of the 20th century. by the 1970s, the u.s. leadership had
eroded, and Japan eventually became the leader in 1980.
Fifteen years later, by the mid-1990s, a company from
the republic of korea, Pohang iron and steel Company
(PosCo) surpassed the top Japanese steel firm, nippon
steel, and became the world leader. As documented in
lee and ki (2017), these changes of leadership are closely
associated with the windows of opportunity opened by
technological breakthroughs in steel production.
the steel industry is slow to innovate, and some of
its process technologies have been used for decades. For
instance, open-hearth furnaces (ohF) had been domi-
nant for five decades when the revolutionary basic oxygen
furnace (boF) was put into commercial operation in the
1950s. Another example is continuous casting, which was
commercialized in the 1960s and maintained its domi-
nance for the next 40 years.
Japan’s forging ahead in the second half of the 20th
century was stimulated by the rapid adoption of boF tech-
nology, which was 10 times faster at refining liquid iron
into crude steel than the then-dominant ohF. however,
when boF was introduced in the 1950s, it had numer-
ous problems, including causing tremendous pollution,
having a narrow scope of applicability in steel produc-
tion and causing the brick lining of furnaces to deterio-
rate. Although boF was expected to eventually stabilize,
no one could anticipate when this would happen and how
much the technology would boost productivity and lower
costs relative to the stable, proven and still incrementally
improving ohF. For firms, especially in the united states,
existing ohF equipment remained economically viable,
and they were very slow to adopt the new technology. in
contrast, Japanese firms moved quickly to adopt boF and
introduced follow-on innovations that solved its two major
problems — slags slopping and exhaust gas emission. this
strengthened the advantage of boF over the old technol-
ogy and promoted its spread. by the 1970s, rapid adop-
tion of the new technology had made Japanese firms more
productive than firms in all major world players, including
the united states.
the republic of korea forged ahead in a different way.
in the 1970s, korea was still a latecomer in the industry,
without significant production. it first adopted a gradual
catch-up, path-following strategy, focusing on low-end
products. PosCo was established as a state-owned
enterprise in 1968 and signed cooperation agreements
with nippon steel Corporation to get guidance on techni-
cal details. PosCo followed the Japanese path and used
technologies that were relatively outdated at the time.
Facing formidable competition in high-end segments
in the 1970s and 1980s, and having weak technological
capability, PosCo found its niche at the low end of the
steel industry, producing such products as hot-rolled coil
and thick plates, rather than high-end products such as
coated steel and alloy steel.
during the second oil crisis, PosCo was able to
move to a fast-follower position by introducing state-of-
the-art technologies at low cost. Purchasing and installing
the latest technologies (such as continuous casting) and
facilities at low cost laid the basis for PosCo’s new cost
advantages. this paved the way for matching and then
surpassing the productivity of nippon steel Corporation
in the late 1990s. during this period, PosCo also moved
from low-end to high-end products, matching nippon
steel Corporation’s share of high-end products.
today, the important breakthroughs that advanced
digital production technologies are bringing to manufac-
turing might open windows of opportunity for other econ-
omies, such as China, to leapfrog and take the lead in the
global steel industry (see box 1.8).
Source: UNIDO elaboration based on Lee and Ki (2017).
Box 1.7 Leapfrogging and leadership changes: Examples from the steel industry

60
1
Ad
P t
eC
hn
olo
gie
s A
nd
ind
us
tr
iAl d
ev
elo
Pm
en
t: A g
lob
Al P
er
sP
eC
tiv
e
“ Leapfrogging into emerging technologies requires policy support
Trying to leapfrog creates risky choicesLeapfrogging into new emerging technologies comes with risks. Opting for an emerging technology is risky because new technologies tend to be more unstable initially, and outcomes are uncertain. In addition, sev-eral competing standards emerge simultaneously, and it is difficult to identify which will become dominant. Investing in the wrong technology would mean fail-ing to gain returns in the long run. When firms from the Republic of Korea considered entering the cell-phone industry, the analog system was still dominant in the United States while the time-division multiple access (TDMA) system was dominant in Europe. Authorities in the Republic of Korea opted for an emerging alternative technology, the digital-based code-division multiple access (CDMA) system, which had higher efficiency in frequency use and higher qual-ity and security in voice transmission. So, despite great uncertainty, the government developed the world’s first CDMA system, a key milestone in the country’s rise as a major world producer of cellphones.
Latecomers need research and development capabilities to leapfrogRisks apart, leapfrogging requires minimum levels of technological and production capability. The first step for a firm in a latecomer economy is to build up to a certain level of capability in production technol-ogy. This typically requires independent R&D efforts to build a solid technological base. But being able to leapfrog also requires access to the global knowledge base — without it, technological catch-up is very hard. Leapfrogging demands a combination of production capability of the latecomer firms and seed technology from the leading countries’ firms.
Adopting ADP technologies requires new public policies and subsidiesLeapfrogging into emerging technologies also requires policy support. Without subsidies or incentives from the government, few firms in developing countries would take the risk of adopting new technologies because of weak demand during the initial entry stage.
So, it would be hard to achieve the required produc-tion volume to compete with established firms from leading economies. Implementing ADP technologies requires new forms of public policy and public–pri-vate partnerships with coordinated support from dif-ferent government agencies and public–private R&D consortiums. Through these consortiums, the govern-ment can support large projects that are difficult for private firms to finance alone. These collaborative enti-ties can also reduce the risks associated with the choice of technology by pooling knowledge from the private sector, universities and public R&D agencies. They can also act as a “technology watch” to interpret and monitor the state of the art of R&D activities around the world and help local producers adopt and absorb these technologies.
Country possibilities depend on industrial structure, domestic firm capabilities and policiesThus, the possible responses of countries to the 4IR and the opportunities these technologies might open depend to a large extent on their industrial struc-ture (Chapter 2), the domestic capabilities of firms (Chapter 3) and the industrial policy to get ready for the new technologies (Chapter 4).
Manufacturing is still important
The diffusion of ADP technologies depends on cost-effectiveness and digital capabilitiesADP technologies are expected to coexist with older generations of digital production technologies for a long time, especially in developing countries. Their diffusion will be determined by several factors, includ-ing how close the technologies are to being the most cost-effective way to produce certain components or products. Especially important is the extent to which firms in developing countries can meet the basic capa-bility threshold and catch up with the world frontier. They need to build a sufficient bundle of capabilities in several functional areas to increase their oppor-tunities to leapfrog closer to the technology frontier (Box 1.8). Without these capabilities, their chances

61
1
Ad
P t
eC
hn
olo
gie
s A
nd
ind
us
tr
iAl d
ev
elo
Pm
en
t: A g
lob
Al P
er
sP
eC
tiv
e
“ Industrialization is fundamental for embarking on a 4IR learning pathway
of leapfrogging will be very limited (Andreoni and Anzolin 2019).
Industrialization is the pathway toward the fourth industrial revolutionAgainst the common claim that industrialization is no longer a viable or feasible path towards development, the analysis in this chapter suggests a very different view. Industrialization and the manufacturing sec-tor are fundamental for embarking on a 4IR learning pathway and capturing its digital dividend, for at least three reasons.
Manufacturing is central to developing productive capabilitiesFirst, manufacturing companies remain the main learning centres of any industrial revolution, espe-cially for the development of digital production
technologies (Andreoni and Anzolin 2019). This is due to the complex nature of manufacturing processes; the widespread adoption of interdependent sets of machines, tools and equipment; and the broad range of specialized skills and R&D required in manufac-turing production. As Chapter 3 shows, manufactur-ing industries are central in developing the basic and intermediate productive capabilities that firms need to efficiently deploy, effectively organize and incremen-tally absorb new technologies.
The 4IR stems from earlier manufacturing technologiesSecond, the 4IR ultimately stems from 3IR technologies — hardware, software and connectivity — and organizational principles. When nonmanufactur-ing sectors capture the digital dividend, it is because 3IR and 4IR technologies are used to manufacture their transformation (Andreoni and Chang 2019).
rapid advances in advanced digital production (AdP)
technologies are creating intelligent plants in the steel
industry, significantly improving production efficiency. the
Chinese baowu steel group — the main actor in China’s
steel production — is taking steps in this direction. the
company has used digital technology for 30 years, but it
still lags behind international leaders, especially in system
operation maintenance, logistics management and inte-
gration of the stages of production.
to address this gap, baowu cooperated with siemens
in 2016 to implement AdP technologies in steel produc-
tion. siemens supported baowu’s upgrading to smart pro-
duction by adopting Comos in several production plants,
an engineering and management software that enables
remote intelligent monitoring, mechanical diagnosis,
fault warning and equipment end-of-service prediction.
baowu expects this technology to boost average daily
output by 15–30 percent and reduce excess warehouse
inventory by half. in some plants, the company already
reports increases in labour efficiency of about 10 per-
cent and overall cost reduction of 20 percent. the appli-
cation of new technologies — artificial intelligence, edge
computing, augmented reality and industrial cloud — are
expected to reduce the factory’s non-conforming product
rates by 28 percent, to increase operational efficiency by
30 percent and to extend equipment effective-operation
time by 35 percent.
Adopting this technology is also creating safer working
environments. by eliminating the safety hazards of manual
operations, intelligent manufacturing has decreased the
risks for steel workers. the integration of controllers and
radio frequency identification technology, for instance, cre-
ated a “smart brain” for the robots operating in the plant,
improved the accuracy and efficiency of refueling opera-
tions and eliminated the safety hazards of manual opera-
tions. lifting molten metal is the most dangerous task for
steel workers. one key output from this collaboration was
the joint development of China’s first fully automated intel-
ligent molten metal crane, in stable operation since 2018.
baowu’s preexisting capabilities and knowledge in
steel production facilitated its technological upgrade of the
production line, as setting up the digital production sys-
tems for steel production required expertise in the basic
parameters used in traditional processes. given its long
experience in the steel industry, baowu could provide sie-
mens more accurate and rich data for setting up the new
digital system. in addition, baowu’s steel workers’ experi-
ence with the previous production line and management
system made it easier to upgrade to new technologies.
Source: UNIDO elaboration.
Box 1.8 Leapfrogging to ADP technologies in steel production

62
1
Ad
P t
eC
hn
olo
gie
s A
nd
ind
us
tr
iAl d
ev
elo
Pm
en
t: A g
lob
Al P
er
sP
eC
tiv
e
“The application of ADP technologies to services has remained in activities that do not deliver structural transformation
Services using ADP technologies do not spur much productionThird, across developing countries, the application of ADP technologies to services has remained concen-trated in activities that do not typically deliver the type of structural transformation countries need. For example, the increasing use of ICT in mobile com-munications and financial transactions, especially in countries like Kenya and Nigeria, has provided
important services to communities. But the use of these technologies in production remains limited. The digital dividend will be higher when ADP tech-nologies are used in production-related services closely linked to manufacturing, such as engineering design services, market analysis, logistics and e-commerce. To establish this symbiotic relationship, a relatively sophisticated manufacturing base must be developed first.
Notes1. According to Industry Economic Accounts Data of
the U.S. Bureau of Economic Analysis (2019b), chemi-cal products were the largest manufacturing sector in the United States in 2017, with 16.2 percent of MVA, followed by transport equipment (14.1 percent) and computer and electronic equipment (12.9 percent).
2. See, for instance, Griffith et al. (2004).3. See, for instance, Griliches (1979, 1988), Guellec and
Van Pottelsberghe de la Potterie (2004), and Pieri et al. (2018).
4. See, for instance, Dosi and Grazzi (2006), O’Mahony and Vecchi (2009), and Parisi et al. (2006).
5. For all figures in this section, relative productivity measures (and their change) are calculated against labour productivity of United States’ manufacturing.
6. The servicification of manufacturing and its implica-tions for innovation and technological change have been long studied in the literature. A recurring conclu-sion is that the increasing fragmentation of production and the organizational complexity of economic systems have strengthened the need for services, both as pro-ductive inputs (Guerrieri and Meliciani 2005, Peneder et al. 2003) and as auxiliary elements in the production of industrial goods (Bryson and Daniels 2010, Francois et al. 2015). KIBS, in particular, have been regarded as important carriers of new knowledge within the econ-omy (Berardino and Onesti 2018, Francois et al. 2015) that can enhance productivity growth and competi-tiveness (Baker 2007, Castaldi 2009, Ciriaci and Palma 2016, Francois and Woerz 2008).
7. KIBS are broadly defined as sectors C71RMQ (Renting of machinery and equipment), C72ITS (Computer and related activities), and C73T74OBZ (R&D and other business activities) from the OECD’s Inter-Country Input-Output Tables (ICIO). The reli-ance of manufacturing on KIBS is estimated using multiregional input–output techniques on the OECD ICIO (see Annex A.2.1).
8. The environmental impact of industry can be captured through a wide range of indicators. Panel c of Figure 1.6 concentrates on carbon dioxide emissions and looks at the intensity of emissions per unit of MVA.
9. This section is based on the background contribution prepared by Andreoni and Anzolin (2019).
10. See, for instance, OECD (2017), Schwab (2016), UNCTAD (2018), UNESCAP (2018), and UNIDO (2017d).
11. Figure 1.12 focuses on global patent families. These are defined as patents simultaneously applied in at least two of the following patent offices: the European Patent Office, the United States Patent and Trademark Office, the Japan Patent Office and/or the China National Intellectual Property Administration Office.
12. Note that 88 of the 167 economies are defined as laggards.
13. It is not possible to attribute causation. Factors beyond technology adoption also contribute to value added and productivity growth. Moreover, fast-growing economies tend to show higher investment rates and

63
1
Ad
P t
eC
hn
olo
gie
s A
nd
ind
us
tr
iAl d
ev
elo
Pm
en
t: A g
lob
Al P
er
sP
eC
tiv
e
embodied technical change, so causation can also run from growth to technology adoption.
14. This section is based on the background contributions prepared by Albrieu et al. (2019), Kupfer et al. (2019), and Lee (2019).
15. Parametric design refers to the creation of 3D geom-etries piece by piece. That is, 2D sketches turned into 3D features, with constraints and relations duly applied to fit the designer’s goal.

6565
Chapter 1 presented the different roles of countries in the emerging landscape of advanced digital produc-tion (ADP) technologies. China and some advanced economies have been dominant in both innovation and exports, while a handful of emerging industrial econo-mies have contributed to both. The remaining econo-mies, especially in Africa, are either ADP users only or have yet to engage in any way with such technolo-gies. This chapter moves from the global perspective of Chapter 1 to a country perspective, looking at the effect of ADP technologies on the structure of manufacturing industries and on social inclusion through employment.
The path of a country’s technological change is determined by industrial sector changesA country’s pace and direction of innovation and tech-nological change are determined by differences in the technological intensity and the speed of technological change in individual industries. Specifically, the hetero-geneity of technological orientations and the impact of ADP technologies on individual industries arise from:• Differences in the sectoral diffusion of technologies
that might affect some industries more than others.• Impacts of the new technologies within sectors,
which would affect productivity and factor intensity.• Impacts of new technologies on intersectoral link-
ages through the provision of supporting activities.For insights about the divergence in country
engagement with ADP technologies, the chapter looks into differences in the underlying sectoral structure and technological orientation of individual industries.1
Changes in industrial structure drive changes in employmentChanges in industrial structure and ways to organ-ize production along supply chains arising from the adoption of ADP technologies affect the inclusiveness potential of industrial development. The effects these changes are likely to have on employment opportuni-ties depend, to a large extent, on the skill and gender
of workers. Besides the direct impact on employ-ment, ADP technologies shape employment potential through backward and forward linkages and income effects. Most studies look only at the direct impact, but for effective policy-making, countries need to con-sider the net employment effects of ADP technology by examining all transmission channels.
ADP technologies and the structure of manufacturing
Some manufacturing industries are more likely than others to adopt new technologiesADP technologies are not found in all industries even in frontrunner economies. Within a country, differ-ences in technological intensity and production pro-cess make some manufacturing industries more likely to adopt new technologies than others. This hetero-geneous advance across industries implies a close rela-tionship between a country’s new technology develop-ment and its industrial structure.
The computer and transport equipment industries are most likely to adopt ADP technologiesFigure 2.1 shows differences in the diffusion of key ADP technologies across industries relative to the average rate of adoption across manufacturing. The computer and machinery industry and the transport equipment industry are most active in using those technologies. The computer and machinery industry has the highest use of cloud computing and 3D print-ing technologies, at 10–15 percentage points above the average for manufacturing, while the transport equip-ment industry is ranked second and tops the use of industrial robots in manufacturing.
The computer and transport equipment industries are technology and digital intensiveTable 2.1 uses two common typologies — the tech-nology and digital intensity of sectors — to classify
Chapter 2
The evolving landscape of industrialization under advanced digital production technologies

66
th
e e
vo
lvin
g l
An
ds
CA
Pe
oF in
du
st
riA
liZA
tio
n u
nd
er
Ad
vA
nC
ed
dig
itAl P
ro
du
Ct
ion
te
Ch
no
log
ies
2
“The productive structure of countries has a key role in determining the diffusion of ADP technologies
industries with the highest rate of adoption of new technologies. The computer and machinery indus-try and the transport equipment industry, with medium-high and high levels of both technology and digital intensity, can be regarded as technol-ogy- and digital-intensive (TDI) industries (bottom right quadrant). Sectors with low and medium-low technology and digital intensity have low rates of adoption of new technologies, except for the use of industrial robots in basic metals and fabricated
metals (upper left quadrant). The other industries fall in between.2
Countries with a higher share of TDI industries adopt more ADP technologiesThe productive structure of countries has a key role in determining the diffusion of ADP technologies (Figure 2.2). Countries with a higher share of TDI industries tend to have higher rates of adoption of key ADP technologies, indicating the importance of
Figure 2.1 Rates of adoption of key ADP technologies differ across industries in Europe
a. Cloud computing b. 3D printing c. Industrial robots
Food products,beverages and tobacco
Textiles, wearingapparel and leather
Basic metals andfabricated metal products
Other manufacturing andrepairs of computers
Wood and paperproducts, and printing
Chemicals, refined petroleumand nonmetallic products
Transport equipment
Computers, electronicsand machinery
–10 0 10 20 –10 0 10 20Distance to the average rate of adoption (percentage points)
–10 0 10 20
Note: All values are for 2018 and are aggregates for the 28 countries of the European Union. Adoption rate is defined as the percentage of firms in an industry using a chosen technology. Due to data availability, chemicals are presented together with refined petroleum and nonmetallic products (ISIC codes 19 to 23). The colours of the bars reflect the technology and digital intensity classification of industries. Green = TDI industries (industries that are simultaneously intensive on digitalization and technology). Blue = industries that are intensive on either digitalization or technology but not both. Red = industries that are intensive on neither digitalization nor technology. The bars show the distance from the average rate of adoption in all manufacturing industries, in percentage points. (See Table 2.1.)Source: UNIDO elaboration based on Eurostat (2019).
Digital intensity
Low and medium-low Medium-high and high
Tech
nolo
gy in
tens
ity
Low
and
m
ediu
m-l
ow
• Food products, beverages and tobacco (ISIC 10t12)• Textiles, wearing apparel and leather (ISIC 13t15)• Coke and refined petroleum products (ISIC 19)• Rubber and plastics products (ISIC 22t23)• Basic metals and fabricated metal products (ISIC 24t25)
• Wood and paper products, and printing (ISIC 16t18)
• Other manufacturing (including furniture) and repairs of computers (ISIC 31t33)
Med
ium
-hig
h an
d hi
gh
• Chemicals and pharmaceutical products (ISIC 20t21) • Computers, electronics and machinery (ISIC 26t28)
• Transport equipment (ISIC 29t30)
Source: UNIDO elaboration based on Calvino et al. (2018) and OECD (2011).
Table 2.1 Typology of industries by digital intensity and technology intensity

67
th
e e
vo
lvin
g l
An
ds
CA
Pe
oF in
du
st
riA
liZA
tio
n u
nd
er
Ad
vA
nC
ed
dig
itAl P
ro
du
Ct
ion
te
Ch
no
log
ies
2
“TDI industries are the main bases for the development, learning and use of the new technologies
developing these industries to promote the diffusion of ADP technologies in countries.
Frontrunners and followers have a larger share of TDI industriesThe share of TDI industries in manufacturing value added (MVA) is related not only to the rate of adop-tion of ADP technologies in advanced economies, but also to the depth of engagement with these technologies around the world. Economies actively engaging with ADP technologies (frontrunners and followers) tend to have a much larger share of TDI industries, on average, than the world average share (Figure 2.3). The oppo-site happens in the latecomer and laggard economies. TDI industries are the main bases for the development, learning and use of the new technologies. Having a larger share of TDI industries enables countries to accu-mulate experience and deepen their engagement with these technologies. Thus, a county’s industrial structure also matters for ADP technological advancement.
The positive relationship also holds within economies of similar incomeResults are similar when the sample is split into country income groups. For each income category, economies more active in these technologies (frontrunners and followers) tend to have an above-average share of TDI
industries and in all cases have a much larger share than latecomer and laggard economies in the same income category (Figure 2.4). These findings confirm that TDI
Figure 2.2 The adoption of key ADP technologies in manufacturing is positively associated with the share of TDI industries in MVA
0 20 40 60 0 20 40 600 20 40 60
Shar
e of
man
ufac
turin
g fir
ms
usin
gco
rres
pond
ing
tech
nolo
gies
(per
cent
)
a. Cloud computing c. Industrial robotsb. 3D printing
Share of TDI industries in real MVA (percent)
0
20
40
60
80
0
5
10
15
20
0
10
20
30
40
Note: TDI is technology- and digital-intensive. MVA is manufacturing value added. All values are for 35 European economies in 2018 in real value added in constant $ 2010. The scatter plots show the average diffusion of each technology in the manufacturing sector against the share of TDI industries in real MVA.Source: UNIDO elaboration based on Eurostat (2019) and the INDSTAT2 ISIC, Rev. 3. database (UNIDO 2019e).
Figure 2.3 Economies actively engaging with ADP technologies tend to have a much larger share of TDI industries in MVA
0.0
0.5
1.0
1.5
2.0
2.5
FrontrunnersFollowersin production
Followersin use
Latecomersin production
Latecomersin use
Laggards
Rela
tive
shar
e of
TD
I ind
ustri
es in
MVA
(1 =
Wor
ld a
vera
ge)
Followers, 1.48
Latecomers, 0.82
Economies activelyengaging with ADPtechnologies
2.32
0.30
Note: ADP is advanced digital production. TDI is technology- and digital-intensive. MVA is manufacturing value added. All values are for 2017 or the closest year and are in current $. The analysis includes 109 economies, 49 of which are actively engaged with ADP technologies. See Annex A.1 for the classification of economies by their level of engagement with ADP technologies.Source: UNIDO elaboration based on Foster-McGregor et al. (2019) dataset derived from Worldwide Patent Statistical Database 2018 Autumn Edition (EPO 2018) and BACI International Trade Database (Gaulier and Zignago 2010) and on the INDSTAT2 ISIC, Rev. 3. database (UNIDO 2019e).

68
th
e e
vo
lvin
g l
An
ds
CA
Pe
oF in
du
st
riA
liZA
tio
n u
nd
er
Ad
vA
nC
ed
dig
itAl P
ro
du
Ct
ion
te
Ch
no
log
ies
2
“TDI industries are crucial for a deeper engagement with the new technologies
industries are crucial for a deeper engagement with the new technologies, moving countries from latecomers to followers and to more established exporters and innova-tors. South Africa, a follower country, is trying to trans-form a TDI industry using ADP technologies (Box 2.1).
Changing patterns of manufacturing development
How does adopting ADP technologies affect industries’ performance?TDI industries have higher rates of adopting ADP technologies and have had a key role in their use, export and innovation. But what about TDI indus-tries’ performance in MVA and employment growth? If adopting the ADP technologies brings a competi-tive premium, recent changes in manufacturing struc-ture should favour TDI industries. ADP technolo-gies took off around 2005 (Chapter 1). So, it is worth investigating how the patterns of structural change evolved before and after the takeoff.
Shares of real MVA
TDI industries’ share in MVA increased after ADP technology takeoffFigure 2.5 shows changes in average shares of each industry (the 10 industries in Table 2.1) before ADP technology takeoff (1991–2004) and after takeoff (2005–2016) for the whole sample (panel a) and for the subsample of economies actively engaging with ADP technologies (panel b). The two TDI industries had the largest increase in their shares of total MVA after takeoff of ADP technologies (shown in green in Figure 2.5). The chemicals and rubber and plastics industries also gained MVA shares. The other six industries either lost shares (most noticeably textiles and refined petro-leum) or remained unchanged (food).
Frontrunners and followers have comparative advantages in TDI industriesEconomies actively engaging with ADP technologies have similar patterns of change in the MVA shares of
manufacturing industries (see panel b in Figure 2.5). What distinguishes these economies from the rest are the high increases in the MVA shares of TDI industries since 2005. Frontrunners and followers possess clear comparative advantages in these industries and thus have been changing their manufacturing structures to favour these industries much faster than other economies.
As countries get richer, TDI industries increase in importanceThe picture changes, however, when country income levels are taken into account. The patterns distinguish between low-technology industries (as illustrated by food and textiles) and TDI industries. Low-technology indus-tries have a negative slope, while TDI industries have a positive slope, reflecting that low-technology industries
Figure 2.4 Within country income groups, economies actively engaging with ADP technologies also tend to have a much larger share of TDI industries in MVA
0.0
0.5
1.0
1.5
2.0
High Upper-middle Low and lower-middle
Rela
tive
shar
e of
TD
I ind
ustri
es in
MVA
(1=
Wor
ld a
vera
ge)
Income group
Economies actively engaging with ADP technologiesOther economies
Note: ADP is advanced digital production. TDI is technology- and digital-intensive. MVA is manufacturing value added. All values are for 2017 or the closest year and are in current $. The analysis includes 109 economies, 49 of which are actively engaged with ADP technologies, classified according to World Bank’s income group definitions for 2017: 31 low and lower-middle income economies (of which 4 are active); 31 upper-middle income economies (of which 13 are active); and 47 high income economies (of which 32 are active). See Annex A.1 for the classification of economies by their level of engagement with ADP technologies.Source: UNIDO elaboration based on dataset by Foster-McGregor et al. (2019) derived from Worldwide Patent Statistical Database 2018 Autumn Edition (EPO 2018) and BACI International Trade Database (Gaulier and Zignago 2010) and on the INDSTAT2 ISIC, Rev. 3. database (UNIDO 2019e).

69
th
e e
vo
lvin
g l
An
ds
CA
Pe
oF in
du
st
riA
liZA
tio
n u
nd
er
Ad
vA
nC
ed
dig
itAl P
ro
du
Ct
ion
te
Ch
no
log
ies
2
“ Firms that have adopted the predictive maintenance system have a competitive edge
south Africa, classified as a follower in the use of
advanced digital production (AdP) technologies, has a
strong industrial base for the machinery, equipment and
electronics industry, a technology- and digital-intensive
industry. with extensive backward linkages through its
value chain, the industry has generated 250,000 jobs,
making it the largest source of formal employment in the
country.
but the industry is becoming less competitive due
to weak production skills and digital infrastructure, poor
access to finance and high energy costs. Firms that have
met such challenges have continuously upgraded their
capabilities and invested in the latest technologies. For
example, firms that have adopted the predictive mainte-
nance and monitoring system — which uses a combination
of sensors, big data, cloud computing, data analytics,
internet of things and artificial intelligence — have a com-
petitive edge. the technology allows leading producers to
reduce costs by preventing unplanned downtime, moni-
toring wear rates, suggesting design improvements and
reducing manufacturing waste. Predictive maintenance
capabilities are important for winning new business and
growing because after-market revenues can be 13–15
times bigger than the initial capital cost and installation.
to enable such capabilities to be diffused to all firms
in the industry, not just the leaders, south Africa needs to
remove constraints, such as high cost and limited band-
width, skill shortages in information technology and data
analysis, weak innovation system, and limited linkages
with and between suppliers, universities and research
centres.
Source: Kaziboni et al. 2019.
Box 2.1 Fostering competitiveness through ADP technologies in South African machinery, equipment and electronics industry
Figure 2.5 The average share of TDI industries increased after 2005, especially for economies actively engaging with ADP technologies
–4 –2 0 2 4
Food products, beveragesand tobacco
Textiles, wearingapparel and leather
Coke and refinedpetroleum products
Rubber and plastics products
Basic metals and fabricatedmetal products
Other manufacturing andrepairs of computers
Wood and paper products,and printing
Chemicals andpharmaceutical products
Transport equipment
Computers, electronicsand machinery
–4 –2 0 2 4
a. All economies b. Economies engaging with ADP technologies
Change in average share in real MVA (percentage points)
Note: ADP is advanced digital production. MVA is manufacturing value added. The figure shows the change in the average share in real MVA in constant $ 2010 between 1990–2004 and 2005–2017. The colours of the bars reflect the technology and digital intensity classification of industries. Green = TDI industries (industries that are simultaneously intensive on digitalization and technology). Blue = industries that are intensive on either digitalization or technology but not both. Red = industries that are intensive on neither digitalization nor technology. Panel b includes only frontrunner and follower economies, as defined in Chapter 1. See Annex A.1 for the classification of economies by their level of engagement with ADP technologies and Table 1.1 for the description and criteria used in the classification.Source: UNIDO elaboration based on the INDSTAT2 ISIC, Rev. 3. database (UNIDO 2019e) with some data gaps filled using UNIDO (2012, 2019f), the World Input-Output Database (Timmer et al. 2015) and Los et al. (2015).

70
th
e e
vo
lvin
g l
An
ds
CA
Pe
oF in
du
st
riA
liZA
tio
n u
nd
er
Ad
vA
nC
ed
dig
itAl P
ro
du
Ct
ion
te
Ch
no
log
ies
2
“ Low-technology industries decline in importance as countries get richer, while TDI industries increase in importance
decline in importance as countries get richer, while TDI industries increase in importance (Figure 2.6).
The importance of TDI industries increased after 2005This pattern was intensified in the most recent period (2005–2017), as low-technology industries (espe-cially textiles and apparel) became less important and TDI industries more important. These changes are especially prominent among upper-middle and high income economies, indicating that both country and time factors affected the importance of TDI industries.
Drivers of real MVA growth: Employment and productivity
TDI industries grew in both employment and productivityTDI industries, the main adopters of ADP technolo-gies, grew faster than other manufacturing industries, as
evidenced by their more rapid growth in MVA (Figure 2.7 panel a). They achieved that growth by increasing both employment and productivity (Figure 2.7 panels b and c). While rapid productivity growth is expected for TDI industries, the simultaneous growth in employ-ment is important for inclusiveness. Before 2005 and the surge in ADP technologies, productivity growth in the transport equipment industry and the computer and machinery industry came at the expense of employment. So, the industries’ MVA expanded at a slower rate than their productivity growth. After 2005, the two indus-tries had fast productivity growth, but MVA expanded even faster, allowing for the simultaneous growth of labour productivity and employment. This expansion of employment made the growth more inclusive. It is likely that adopting ADP technologies helped these TDI industries produce more attractive products than before, resulting in higher demand and more inclusive growth.
Figure 2.6 Shifts in the patterns of structural change before and after 2005 for selected industries by country income group
HighUpper-middleLower-middleLow
Shar
e in
real
MVA
(per
cent
)
Food and beverages
Shar
e in
real
MVA
(per
cent
)
Chemicals and pharmaceuticals
Tranport equipment
Computers and machinery
0
10
20
40
30
0
15
10
5
20
25
0
6
4
2
8
10
0
15
10
5
20
25
HighUpper-middleLower-middleLow
HighUpper-middleLower-middleLow
HighUpper-middleLower-middleLow
1990–2004
Importance increases ascountries get richer…
…and the incrasemagnifies after 2005
1990–2004
1990–2004
1990–2004
2005–2017
HighUpper-middleLower-middleLow
Wood, paper, and printing
0
15
10
5
20
25
1990–2004
2005–2017
2005–2017
2005–2017
2005–2017
HighUpper-middleLower-middleLow
Textiles and apparel
0
10
5
15
1990–2004
Importance declines ascountries get richer…
…and the declinemagnifies after 2005
2005–2017
Note: Real MVA is real manufacturing value added in constant $ 2010. Income levels are low, lower-middle, upper-middle and high, as defined by the World Bank for the year 2005, the mid-point of the complete range considered. The analysis considers average real MVA shares for 86 economies with available data. The colours of the figures reflect the technology and digital intensity classification of industries. Green = TDI industries (industries that are simultaneously intensive on digitalization and technology). Blue = industries that are intensive on either digitalization or technology but not both. Red = industries that are intensive on neither digitalization nor technology.Source: UNIDO elaboration based on the INDSTAT2 ISIC, Rev. 3. database (UNIDO 2019e) with some data gaps filled using UNIDO (2012, 2019f), the World Input-Output Database (Timmer et al. 2015) and Los et al. (2015).

71
th
e e
vo
lvin
g l
An
ds
CA
Pe
oF in
du
st
riA
liZA
tio
n u
nd
er
Ad
vA
nC
ed
dig
itAl P
ro
du
Ct
ion
te
Ch
no
log
ies
2
“TDI industries grew faster than other manufacturing industries
Figure 2.7 Real MVA growth and its drivers: Employment and productivity
Annu
al a
vera
ge g
row
th ra
te (p
erce
nt)
1990–20042005–2017
a. Real MVA
–2
–1
0
1
2
3
4
Annu
al a
vera
ge g
row
th ra
te (p
erce
nt)
b. Employment
–3
2
–2
–1
0
1
4
3
Computers,electronics
and machinery
Transportequipment
Chemicals andpharmaceutical
products
Wood and paperproducts,
and printing
Othermanufacturingand repairs ofcomputers
Basic metals andfabricated
metal products
Rubber andplastics
products
Coke andrefined
petroleumproducts
Textiles,wearing apparel
and leather
Food products,beverages
and tobacco
Annu
al a
vera
ge g
row
th ra
te (p
erce
nt)
c. Labour productivity
–1
0
1
2
4
3
Note: MVA is manufacturing value added. The analysis includes 86 economies. Productivity is calculated as real MVA (in constant $ 2010) per number of workers. The colours of the bars reflect the technology- and digital-intensity classification of industries. Green = TDI industries (industries that are simultaneously intensive on digitalization and technology). Blue = industries that are intensive on either digitalization or technology but not both. Red = industries that are intensive on neither digitalization nor technology.Source: UNIDO elaboration based on the INDSTAT2 ISIC, Rev. 3. database (UNIDO 2019e) with some data gaps filled using UNIDO (2012, 2019f), the World Input-Output Database (Timmer et al. 2015) and Los et al. (2015).

72
th
e e
vo
lvin
g l
An
ds
CA
Pe
oF in
du
st
riA
liZA
tio
n u
nd
er
Ad
vA
nC
ed
dig
itAl P
ro
du
Ct
ion
te
Ch
no
log
ies
2
“Active engagement with ADP technologies requires increasing support from knowledge-intensive services
The takeoff of ADP technologies after 2005 favoured TDI industriesThe evidence in this section demonstrates that the period since the takeoff of ADP technologies was more favourable for manufacturing development in general and TDI industries in particular than the period before that. Higher productivity was an impor-tant contributor to the superior growth since 2005, and expanding employment opportunities made the growth more inclusive.
Blurring boundaries between manufacturing and services
ADP technologies need support from the services sectorChanges in technologies and business opportunities shift production processes. Industrial evolution not only shapes the way things are produced within an industry but also transforms industrial organization — how industries are linked in value chains across sec-tors to produce final manufactured products. Active engagement with ADP technologies requires increas-ing support from knowledge-intensive computer and related services, research and development services and other business services.
KIBS support manufacturingKnowledge-intensive business services (KIBS)3 are important to innovation and as carriers of new knowl-edge in an economy.4 They are mainly intermedi-ate services (sold to other sectors rather than to final consumers), and through these linkages, they diffuse innovations to downstream industries (Berardino and Onesti 2018, Francois et al. 2015). As a result, their use in production helps manufacturing industries gain knowledge and skills (Barney 1991).
The interaction between manufacturing and KIBS improves productivity, competitiveness, and the quality of goodsThrough this role as carriers of knowledge and inno-vation, increased use of KIBS in manufacturing enhances a country’s productivity growth and its
competitiveness (see Chapter 1). Product-embodied technology can improve the quality and competitive-ness of downstream goods (Dietzenbacher and Los 2002). Supporting the emergence of these interactions between manufacturing and services is important for reducing productivity gaps between follower and lead-ing economies. Box 2.2 shows how a firm in a develop-ing country got a foothold in KIBS to provide design services as part of ADP solutions for manufacturing production.
Do economies engaging with ADP technologies have more integrations of KIBS with manufacturing?Examining the integration of KIBS with manufactur-ing before and after 2005 should reveal whether econ-omies engaging more actively with ADP technologies tend to show stronger KIBS integration in manufac-turing and whether there are specific sectoral patterns in these interactions.
Changing trends in integration of KIBS with manufacturing
The contribution of KIBS to the value added generated by manufacturing is higher in rich economiesFigure 2.8 shows the average share of KIBS in the total value added generated by manufacturing indus-tries in the two periods considered (1995–2004 and 2005–2015), by country income groups. The share of KIBS in MVA is higher in higher income coun-try groups, indicating the importance of knowledge-intensive inputs for the kinds of manufacturing activi-ties undertaken by high-income economies.
The contribution of KIBS to manufacturing has increased since 2005KIBS are related not only to country income levels. The weight of KIBS in manufacturing production has also increased across country income groups since 2005, particularly in upper-middle and high income economies. If this trend continues, developing coun-tries cannot simply strive to reach the current produc-tion structure of a higher income country by increasing

73
th
e e
vo
lvin
g l
An
ds
CA
Pe
oF in
du
st
riA
liZA
tio
n u
nd
er
Ad
vA
nC
ed
dig
itAl P
ro
du
Ct
ion
te
Ch
no
log
ies
2
“TDI industries tend to have an above average share of integration with KIBS
the share of KIBS from 4.3 percent to 7.5 percent (the share in upper-middle income economies) and to 9.7 percent (high income economies). They probably need to aim for higher knowledge intensity in produc-tion than in the current advanced economies.
KIBS integration to manufacturing is greater in economies actively engaged in ADP technologiesAcross all country income groups, the integration of KIBS in manufacturing is greater in economies that are actively engaging with ADP technologies (Figure 2.9). As countries move to a higher level of engage-ment in developing and deploying ADP technologies, with greater involvement in TDI industries, KIBS need to play an increasing role in manufacturing.
TDI industries have an above-average share of integration with KIBSSimilar to the trends in TDI and ADP technologies, KIBS integration into manufacturing in recent years indicates that TDI industries tend to have an above-average share of integration with KIBS across all country income groups (Figure 2.10). That implies a
connection between engagement with ADP technolo-gies, the structure of industry and the role of KIBS in manufacturing production.
Aedesign, a diversified engineering company established
in 2002 in Pakistan, provides a wide range of knowledge-
intensive business services to its clients in the manufac-
turing sector. services include concept design, detailed
design, computer-aided design, embedded system design
and electronic circuit design. it offers clients’ flexibility and
access to specialized skills while reducing their develop-
ment time and costs.
From its early days, Aedesign focused on research
and development to serve the manufacturing sector. every
project was considered a learning opportunity to enhance
the skills and capabilities of the engineering team. by pro-
viding a compensation package 10–50 percent above the
rate for equivalent positions in the market, and investing in
training and team building, it assembled a strong team of
65 engineers.
having developed the necessary technological com-
petence and core engineering team by 2010, Aedesign
established a subsidiary in germany, a global frontrunner in
advanced digital production (AdP) technologies, to access
business and learning opportunities unavailable at home.
building on its initial engineering expertise in the automo-
tive industry, Aedesign gradually expanded its business to
meet local needs and offer AdP technology solutions to
Pakistani industries that had a comparative advantage.
For example, in textiles, a major industry in Pakistan,
thread breakage during spinning is common. Current
practices are based on human observation to detect and
then rectify the problem. Aedesign is developing a solu-
tion based on image recognition, which would immedi-
ately identify thread breakage and raise a service request.
with a subsidiary in germany integrated in a global sup-
ply chain of AdP technologies, Aedesign keeps abreast of
new business and technological developments in frontrunner
economies. it is also developing a niche in the home country
where demand for these types of solutions is growing.
Source: UNIDO elaboration.
Box 2.2 Entering global manufacturing through the provision of knowledge-intensive services
Figure 2.8 Manufacturing increasingly relies on KIBS across all incomes
Shar
e of
KIB
S in
val
ue a
dded
gene
rate
d by
man
ufac
turin
g (p
erce
nt)
Highincome
Upper-middleincome
Low and lower-middleincome
1995–2004
Importance of KIBS increasesas countries get richer…
…but also increases across allincome categories after 2005
2005–2015
0
2
4
6
8
10
Income group
Note: KIBS is knowledge-intensive business services. Manufacturing value added is in current $. Multiregional input–output techniques are used to estimate the weight of KIBS in the total value added created by the final demand for manufacturing goods. This analysis includes 63 economies, which are classified according to World Bank income group definitions for 2005, the mid-point of the complete range considered: 30 low and middle income economies (of which 9 are active) and 33 high income economies (of which 24 are active).Source: UNIDO elaboration based on Inter-Country Input-Output (ICIO) Tables (OECD, 2016, 2018b).

74
th
e e
vo
lvin
g l
An
ds
CA
Pe
oF in
du
st
riA
liZA
tio
n u
nd
er
Ad
vA
nC
ed
dig
itAl P
ro
du
Ct
ion
te
Ch
no
log
ies
2
“ Frontrunners and followers have a much higher share of TDI industries in their MVA
Differences in industrial structure at different levels of ADP engagement
In ADP technology frontrunner and follower economies, the share of TDI industries in MVA is highThe superior performance of frontrunners and follow-ers did not come from a larger engagement with ADP technologies than latecomers and laggards at the same manufacturing activities. Rather, frontrunners and followers have a much higher share of TDI industries (computer and machinery industry and transport equipment industry) in their MVA. TDI industries rose more rapidly in importance after the takeoff of ADP technologies in 2005. The rate of the adoption of ADP technologies is much higher in TDI indus-tries than in other manufacturing industries, and their MVA growth is also higher. Such superior performance is strongly driven by productivity growth, in turn pos-sibly stimulated by demand and supply growth.
ADP technologies foster productivity and employment growth that make development inclusiveHowever, the story of TDI industry development is not about the substitution of new technologies for labour. It
Figure 2.9 Manufacturing industries in economies actively engaging with ADP technologies are more integrated with KIBS at all country group income levels
0
2
4
6
8
10
12
High-income economiesLow- and middle-income economies
All economies
Shar
e of
KIB
S in
val
ue a
dded
gen
erat
ed b
y m
anuf
actu
ring
(per
cent
)
Income group
Economies actively engaging with ADP technologiesOther economies
Note: KIBS is knowledge-intensive business services. ADP is advanced digital production. Values are averages for the period 2005–2015. Manufacturing value added is in current $. The analysis includes 63 economies, which are classified according to World Bank income group definitions for 2005: 30 low and middle income economies (of which 9 are active) and 33 high income economies (of which 24 are active). See Annex A.1 for the classification of economies by their level of engagement with ADP technologies.Source: UNIDO elaboration based on Inter-Country Input-Output (ICIO) Tables (OECD, 2016, 2018b).
Figure 2.10 KIBS are more integrated with TDI industries than average, especially in developing countries
a. Low and lower-middle income b. Upper-middle income c. High income
0 2 4
Coke and refinedpetroleum products
Food products, beveragesand tobacco
Other manufacturing andrepairs of computers
Rubber and plastics products
Textiles, wearing appareland leather
Wood and paperproducts, and printing
Basic metals and fabricatedmetal products
Chemicals andpharmaceutical products
Transport equipment
Computers, electronicsand machinery
Distance to average contribution of KIBS to MVA (percentage points)
–4 –2 0 2 4
Coke and refinedpetroleum products
Basic metals and fabricatedmetal products
Textiles, wearing appareland leather
Other manufacturing andrepairs of computers
Rubber and plastics products
Food products, beveragesand tobacco
Transport equipment
Computers, electronicsand machinery
Wood and paperproducts, and printing
Chemicals andpharmaceutical products
–4 –20 2 4
Coke and refinedpetroleum products
Food products, beveragesand tobacco
Textiles, wearing appareland leather
Other manufacturing andrepairs of computers
Basic metals and fabricatedmetal products
Rubber and plastics products
Wood and paperproducts, and printing
Computers, electronicsand machinery
Chemicals andpharmaceutical products
Transport equipment
–4 –2
Note: MVA is manufacturing value added is in current $. KIBS is knowledge-intensive business services. Average values for the period 2005–2015. This analysis includes 63 economies, which are classified according to World Bank’s income group definitions for 2005: 30 low and middle income economies (of which 9 are active), and 33 high income economies (of which 24 are active). The colours of the bars reflect the technology- and digital-intensity classification of industries. Green = TDI industries (industries that are simultaneously intensive on digitalization and technology). Blue = industries that are intensive on either digitalization or technology but not both. Red = industries that are intensive on neither digitalization nor technology.Source: UNIDO elaboration based on Inter-Country Input-Output (ICIO) Tables (OECD, 2016, 2018b).

75
th
e e
vo
lvin
g l
An
ds
CA
Pe
oF in
du
st
riA
liZA
tio
n u
nd
er
Ad
vA
nC
ed
dig
itAl P
ro
du
Ct
ion
te
Ch
no
log
ies
2
“ADP technologies could shift the distribution of value added and employment across sectors
is more about the contribution of ADP technologies to the competitiveness and expansion of these industries, which made the development process inclusive through the growth of both productivity and employment.
Frontrunner and follower economies have a high share of KIBS in manufacturingNot only are the industrial structures (what to produce) different between frontrunners and followers and late-comers and laggards, but their production processes (how to produce) also differ. Frontrunners and follow-ers have a higher level of KIBS inputs — including com-puter and related services and research and development services — into their manufacturing production. That higher contribution of KIBS seems to be a defining fea-ture of frontrunners and followers relative to the rest.
ADP technologies and the “skills of the future”: Risks of digitalization
ADP technologies could change manufacturing, employment, and value added across industries and sectorsWith rapid development and deployment of ADP technologies, the prospects for employment and value added growth have changed in each industry. In the future, ADP technologies could shift not only the relative importance of industries and manufacturing processes but also the distribution of value added and employment across sectors.
Effects of ADP technologies on the labour market are unclearDespite the great potential of ADP technologies for productivity growth and competitiveness, some cau-tion and moderation of expectations are warranted. The main concerns are associated with changes in the labour market and impacts on employment in the manufacturing sector.
Technological advances are increasing machines’ ability to substitute for labourIn the debate on ADP technologies and the future of work, one side focuses on the labour-saving potential
of ADP technologies. This idea is reinforced by the fact that these technologies have improved the per-formance of machines in fields that require nonrou-tine cognitive skills, expanding the set of activities that machines can perform effectively, such as natural language processing or image, video and speech recog-nition. Moreover, advances in the dexterity of robots have allowed them to perform more nonroutine manual tasks (Brynjolfsson and McAfee 2014, Frey and Osborne 2017, Graetz and Michaels 2018). These changes could make it easier to substitute machines for human workers and reshape labour markets.
But technological advances may also create new kinds of occupations and so create employmentThe other side notes that the effect of new technologies may also be transformative by complementing the work of humans, boosting productivity by facilitating the exe-cution of some tasks or by enabling operations and pro-cesses that humans could not perform unaided. There is thus optimism for new job creation through the diffu-sion of ADP technologies, driven by new occupations (software developers, data analysts) and by employment creation through increased industrial linkages.
Analytical, technology-related and soft skills will be needed in jobs created by ADP technologiesWhatever the net employment impact of these dif-ferent forces, what seems clear is that technological change is not neutral with respect to the profile of job skills demanded. Technological change tends to favour skills that are complementary to the new technology (Acemoglu 2002, Rodrik 2018). Even if debate on the set of skills that will be required to perform with ADP technologies is still open, the needed skills are expected to be biased towards three broad categories: analytical, technology-related and soft skills (Kupfer et al. 2019). As the jobs created by ADP technologies are likely to be more demanding of new and technical skills, as well as of analytic and cognitive abilities, mastering the “skills of the future” will provide the best safeguard against displacement by technology. That presents major chal-lenges to workers in developing economies, who must

76
th
e e
vo
lvin
g l
An
ds
CA
Pe
oF in
du
st
riA
liZA
tio
n u
nd
er
Ad
vA
nC
ed
dig
itAl P
ro
du
Ct
ion
te
Ch
no
log
ies
2
“There is still no clear-cut evidence on whether ADP technologies will make some occupations redundant
adapt to these changes in order to take advantage of the opportunities offered by ADP technologies (Box 2.3).
More study is needed on the employment effects of ADP technologies for developing countries and for womenEven with lively policy and academic debates, there is still no clear-cut evidence on whether ADP technolo-gies in manufacturing will really make some occupa-tions redundant or whether, instead, they will change the content of jobs without necessarily replacing human workers. ADP technologies might also create occupations that never existed before. Most studies focus on advanced economies, and so the evidence on the effects on labour markets in developing countries is scarce and less conclusive. Nor has it been possible to assess whether gains or losses will be greater among
women than among men, because the evidence on gender-specific effects on employment is even rarer and limited to advanced economies (Brussevich et al. 2018, Sorgner 2019). Filling this information gap is crucial for developing a policy agenda to increase women’s equitable participation in the industrial workforce and in the development of technologies, which is funda-mental to promoting inclusive and sustainable indus-trial development (ISID) (UNIDO 2019d).
Gender differences in the risk of digitalization
How will ADP technologies affect men and women’s jobs in developing countries?To begin to fill this gap, this section offers evidence from new empirical studies of the potential differential
smart factories represent the latest advance in the appli-
cation of advanced digital production technologies at the
plant level (Chapter 1). in smart factories, workers, prod-
ucts, equipment and machinery are part of an intelligent
system in which components interact, exchange informa-
tion, take decisions and implement actions through digital
networks of sensors powered by real-time data analytics,
machine learning and intelligent algorithms. smart fac-
tories also use augmented and virtual reality to simulate
real-world environments and optimize manufacturing and
maintenance processes before they are carried out. this
overlapping of physical and digital infrastructure — the
cyber-physical system — allows manufacturing operations
to occur faster and more efficiently and to produce a new
generation of smart products of greater value added and
serviceability for customers.
due to the intensive use of data in real-time decision-
making and the increased connectivity, a different set of
skills is needed to operate a smart factory than a tradi-
tional plant. Arçelik, a turkish multinational company with
decades of experience in white goods production, reports
that one of the most important challenges of current digi-
tal transformation is building the right set of skills to work
in a smart factory environment.
Arçelik opened its first smart factory to produce wash-
ing machines in early 2019. As 90 percent of the tasks
require digital competencies, employees need to have a
complex set of technical and digital skills in automation,
coding, data management and analytics, network and
data security, development of intelligent algorithms, inte-
gration of algorithms into physical production processes,
and real-time decision-making based on data. these hard
skills have to be matched with a set of advanced soft skills,
such as problem solving and learning, teamwork, commu-
nication and negotiation. soft skills are important for smart
factory operations because the connectivity among all
parts of the smart system — from suppliers; to customers,
who can customize the products according to their pref-
erences; to final products, which can communicate back
to the manufacturer to improve performance and provide
after-sale assistance — requires workers to coordinate with
different actors, while serving as platform managers.
the move from traditional blue-collar mechanical and
repetitive activities to digital-manager type duties implies
more negotiating and coordinating tasks, and at the same
time frees workers from heavy and hazardous activities. in
this regard, even though Arçelik already has gender poli-
cies in place to employ women in all functions, the reduc-
tion of more physically demanding tasks in smart factories
could open up more opportunities for female workers.
besides looking for already qualified individuals when hir-
ing, Arçelik also provides on-the-job training to reskill staff
in the required set of abilities, also in collaboration with
local higher education institutions.
Source: UNIDO elaboration.
Box 2.3 Skills of the future for manufacturing

77
th
e e
vo
lvin
g l
An
ds
CA
Pe
oF in
du
st
riA
liZA
tio
n u
nd
er
Ad
vA
nC
ed
dig
itAl P
ro
du
Ct
ion
te
Ch
no
log
ies
2
“The risk of computerization varies widely across manufacturing sectors
impact that the adoption of ADP technologies might have on men’s and women’s jobs in the manufacturing sector of developing countries.5
Women concentrate in sectors with low technological intensity and low value addedThe likelihood of the digitalization of jobs and the impact on male and female workers in 11 developing and transitioning economies was analysed based on the Skills Towards Employability and Productivity (STEP) program database.6 The sample has simi-lar numbers of women (52 percent) as men (48 per-cent) in the manufacturing sector, but women’s share (about 68 percent) is larger than men’s in the textiles and leather sector and in the wood, paper and print-ing sector (about 60 percent; Figure 2.11). This is in line with the gender distribution of employment by sector and occupation in the manufacturing sector of most developing economies, where women tend to concentrate in sectors with lower technologi-cal intensity and low value added and where lower labour costs represent a comparative advantage (UNIDO 2019d).
Using workers’ skills and competencies to study the risk of computerizing jobsThe probability of the computerization of jobs was used to measure the risk of digitalization, based on the approach in Frey and Osborne (2017).7 A corrected measure of computerization is obtained for each indi-vidual worker by incorporating information on demo-graphics, skills, education and workplace responsibili-ties from the STEP database. This allows investigating how workers’ skills and competencies are systemati-cally related to the susceptibility of their occupations to digitalization, and how much these relationships differ between women and men.
Risks of computerization vary by sector and genderSeveral findings stand out. First, the risk of comput-erization varies widely across manufacturing sectors (Figure 2.12). The risk of computerization is higher in food and textiles and lower in computers, electron-ics and vehicles. Second, gender differences are pro-nounced: the risk of computerization is on average about 2.9 percent higher for women in manufacturing. Female workers face a higher average computerization
Figure 2.11 Women constitute the largest share of workers in textile and wood industries
Female Male Gender-specific composition of the manufacturing sector (percent)
0 25 50 75 100
Food products, beverages and tobacco
Textiles, wearing apparel, and leather
Wood and paper products, and printing
Chemicals andpharmaceutical products
Basic metals and fabricated metal products
Computers, electronics, machineryand transport equipment
Note: Shares of male and female workers in each subcategory of manufacturing sector were calculated using country-specific sample weights provided in Skills Towards Employability and Productivity (STEP) program surveys. The analysis includes Armenia, Colombia, Georgia, Ghana, Kenya, Lao People’s Democratic Republic, North Macedonia, Sri Lanka, the Plurinational State of Bolivia, Ukraine and Viet Nam.Source: UNIDO elaboration based on dataset by Sorgner (2019) derived from the STEP Skills Measurement Program (World Bank 2016).

78
th
e e
vo
lvin
g l
An
ds
CA
Pe
oF in
du
st
riA
liZA
tio
n u
nd
er
Ad
vA
nC
ed
dig
itAl P
ro
du
Ct
ion
te
Ch
no
log
ies
2
“Women’s computerization risk is about 2–3 percentage points higher at each level of formal education
risk when employed in food, beverages and tobacco, textiles and leather, and chemicals sectors. No statisti-cally significant gender differences in computerization risk are observed in TDI industries — computers, elec-tronics and vehicles.
High-skilled jobs risk computerization less, but at all skill levels, women’s risk is higher than men’sThird, in line with other empirical work (Brussevich et al. 2018, Sorgner et al. 2017), the risk of comput-erization declines with education, as workers in high-skilled jobs face lower probabilities of computerization than workers in low- and medium-skilled jobs (Figure 2.13). Still, women’s computerization risk is about 2–3 percentage points higher at each level of formal education. This finding suggests that the higher job computerization risk of female workers cannot be entirely explained by gender differences in education and that other gaps may be at play.
Jobs requiring analytical and ICT skills are less vulnerable to digitalization but show major gender gapsStrong differences in skill endowments seem to be the main factor behind the differences in computerization probabilities observed in Figure 2.12: in manufactur-ing jobs, women score significantly lower than men, on average, in the skills that are particularly valuable for working with ADP technologies — the “skills of the future,” such as analytical and information and communications technology (ICT) skills (Figure 2.14). While routine manual skills can easily be auto-mated, the “skills of the future” are less vulnerable to digitalization and are more likely to be complemented by than to be replaced by new technologies, shielding workers from potential job destruction from digitali-zation and enabling them to benefit from opportuni-ties the emerge from transformative digitalization and the creation of new tasks. (Table 2.2 describes the skill categories.)
Figure 2.12 Female workers are more likely to face a higher computerization risk than men if they are employed in food, textiles and chemicals
50
54
58
62
66
70
Computers, electronics,machinery and
transport equipment
Chemicals andpharmaceutical
products
Wood and paperproducts, and printing
Basic metals andfabricated metal products
Textiles, wearingapparel and leather
Food products,beverages and tobacco
Total manufacturing
Mea
n va
lues
of c
ompu
teriz
atio
n ris
k (p
erce
nt)
FemaleMale
2.3
3.5*–0.7
–8.7**
2.2***
3.9***
3.0
Note: Computerization risk refers to the probability that an occupation will be computerized in the near future. The figure shows the female–male differences in mean values of computerization risk by sector. t-test of differences in means: *** p < 0.000; ** p < 0.05; * p < 0.1. The analysis includes Armenia, Colombia, Georgia, Ghana, Kenya, Lao People’s Democratic Republic, North Macedonia, the Plurinational State of Bolivia, Sri Lanka, Ukraine and Viet Nam. The colours of the bars reflect the technology and digital intensity classification of industries. Green = TDI industries (industries that are simultaneously intensive on digitalization and technology). Blue = industries that are intensive on either digitalization or technology but not both. Red = industries that are intensive on neither digitalization nor technology.Source: UNIDO elaboration based on dataset by Sorgner (2019) derived from the STEP Skills Measurement Program (World Bank 2016).

79
th
e e
vo
lvin
g l
An
ds
CA
Pe
oF in
du
st
riA
liZA
tio
n u
nd
er
Ad
vA
nC
ed
dig
itAl P
ro
du
Ct
ion
te
Ch
no
log
ies
2
“ Labour markets increasingly reward social skills
Gender gaps are less pronounced in socio-emotional or soft skillsThus, people whose job requires low analytical and ICT skills face a higher risk of their jobs being automated; this risk seems to be, on average, higher for women. To some extent, this higher risk is counterbalanced by the less pronounced gender gaps in soft skills.8 The empiri-cal evidence supports the argument that labour mar-kets increasingly reward social skills and that the share of soft-skill-intensive occupations will grow by the next decade (see Chapter 3). Having an advantage in these skills could thus narrow gender gaps in the future.
Women’s access to high-quality jobs in manufacturing is limitedDifferences in computerization risk may also be affected by the gender allocation of tasks and by gen-der-diverse occupational choices. Employers’ stereo-types and societal gender norms may be limiting
women’s access to good jobs and occupations, particu-larly when high-quality jobs are scarce (UNCTAD 2017). Women are less likely to choose an occupation in science, technology, engineering, or mathematics (STEM) and are underrepresented in managerial posi-tions (Sorgner et al. 2017). In the sample, women hold fewer than 30 percent of managerial positions (Figure 2.15). And even in the same sector and occupation, women tend to conduct more routine, codifiable tasks that require less abstract thinking than their male counterparts, placing women’s jobs at higher risk of loss to computerization than men’s jobs.
More female workers are at high risk of computerizationWhat do these different computerization risks mean for actual employment risk? Using a probability of computerization higher than 70 percent as the thresh-old for high risk of job displacement means that about 30 percent of workers in manufacturing could be severely affected, on average. The share at risk varies by gender and sector, however (Figure 2.16).9 The share of female workers at risk is particularly high in food and beverages (51 percent of female workers), though women do not represent the majority of the workers in this sector. The opposite holds for wood and paper, where, despite constituting 60 percent of the labour force, only 7 percent of female workers face a high risk of displacement by computerization.
The risk of computerization is lowest in TDI industries — for both men and womenThe share of workers strongly affected by the prob-ability of computerization is lowest in computers, elec-tronics, and vehicles for both men (9.2 percent) and women (3.6 percent), suggesting that jobs in these sec-tors rely more on the new skills that are complemen-tary to computerization and thus are less susceptible to displacement. This result confirms the importance of TDI industries for inclusive development. As dis-cussed earlier in the chapter, TDI industries are the main adopters of ADP technologies, and they have managed to simultaneously increase both productivity and employment in recent years.
Figure 2.13 The risk of computerization declines with formal education for both male and female workers
0
20
40
60
80
HighMediumLow
Mea
n va
lues
of c
ompu
teriz
atio
n ris
k (p
erce
nt)
FemaleMale
Note: Computerization risk refers to the probability that an occupation will be computerized in the near future. The figure shows female–male differences in mean values of computerization risk by highest achieved educational level, measured according to the International Standard Classification of Education (ISCED 1997): low (ISCED 1 or less), middle (ISCED 2, 3, 4A, and 4B), and high (ISCED 5 and 6). The analysis includes Armenia, Colombia, Georgia, Ghana, Kenya, Lao People’s Democratic Republic, North Macedonia, Sri Lanka, the Plurinational State of Bolivia, Ukraine and Viet Nam.Source: UNIDO elaboration based on dataset by Sorgner (2019) derived from the Skills Towards Employability and Productivity (STEP) program (World Bank 2016).

80
th
e e
vo
lvin
g l
An
ds
CA
Pe
oF in
du
st
riA
liZA
tio
n u
nd
er
Ad
vA
nC
ed
dig
itAl P
ro
du
Ct
ion
te
Ch
no
log
ies
2
“Jobs in TDI industries are less susceptible to displacement
Computerizing jobs is only likely where it will be profitableThe risk of computerization may not turn into actual job losses, however, which means that the potential adverse employment effects of digitalization and automation in manufacturing may be overestimated (Brussevich et al. 2018, UNCTAD 2017). The risk of computerization
reflects the technical feasibility of job substitution, but for this change to be realized requires the presence of conditions that make such substitutions economically profitable. That may not be the case in manufactur-ing sectors where labour compensation is low, such as textiles and apparel. Even if the jobs rank high on the
Figure 2.14 Women score lower than men on skills that may protect jobs from loss through computerization in manufacturing
–0.8
–0.6
–0.4
–0.2
0.0
0.2
Gen
der d
iffer
ence
in m
ean
valu
es o
f sco
res
asso
ciat
ed to
ski
lls
Deci
sion
mak
ing
Host
ile a
ttrib
utio
n bi
as
Grit
Emot
iona
l sta
bilit
y
Agre
eabl
enes
s
Extra
vers
ion
Cons
cien
tious
ness
Open
ness
Com
pute
r use
com
plex
ity
Com
pute
r use
inte
nsity
Supe
rvis
ing
Pres
entin
g
Inte
rper
sona
l exc
hang
e
Repa
iring
ele
ctro
nic
equi
pmen
t
Drivi
ng v
ehic
les
Auto
nom
y (re
vers
ed)
Oper
atin
g m
achi
nes
Repe
titive
ness
Phys
ical
dem
andi
ng
Lear
ning
Thin
king
Num
erac
y
Writ
ing
Read
ing
InterpersonalNon-routine
manualAnalytical
Information andcommunications
technology Big Five dimensions of personalityOther
socio-emotional skillsRoutine manual
Note: The vertical axis shows the female–male differences in mean values of scores associated with each skill. The variables measuring skills have been standardized to make the scales comparable. The analysis includes Armenia, Colombia, Georgia, Ghana, Kenya, Lao People’s Democratic Republic, North Macedonia, Sri Lanka, the Plurinational State of Bolivia, Ukraine and Viet Nam. See UNIDO background paper prepared by Sorgner (2019) for a detailed description of the classification of the skills measured in the STEP program.Source: UNIDO elaboration based on the background paper prepared by Sorgner (2019) derived from the STEP Skills Measuremnt Program (World Bank 2016).
Skill category STEP measure
Analytical/cognitive Reading, writing, numeracy, thinking for at least 30 minutes to do tasks, learning new things at work
Manual Routine (physical demanding, repetitive tasks, operating machines, autonomy) and non-routine (driving vehicles, repair electronic equipment)
Interpersonal Collaborating with co-workers, contacting clients, making presentations, supervising co-workers
Information and communications technologies
Computer use: intensity and complexity
Soft skills Big Five dimensions of personality (openness to experience, conscientiousness, extraversion, agreeableness and emotional stability) and other socio-emotional skills (grit, hostile attribution bias, decision-making)
Source: UNIDO elaboration based on Sorgner (2019).
Table 2.2 Skills categories and corresponding measures in the Skills Towards Employability and Productivity program

81
th
e e
vo
lvin
g l
An
ds
CA
Pe
oF in
du
st
riA
liZA
tio
n u
nd
er
Ad
vA
nC
ed
dig
itAl P
ro
du
Ct
ion
te
Ch
no
log
ies
2
“The potential adverse employment effects of digitalization may be overestimated
technical feasibility of automating routine tasks, actual computerization is likely to remain limited. Indeed, TDI industries are the most likely to adopt ADP tech-nologies but have the lowest risk of computerization of jobs in the developing economies analysed in this sec-tion. Jobs also adapt to major changes during large tech-nological revolutions by altering the nature and content of tasks in favour of new skills. Thus, computerization can be transformative when new technologies comple-ment human labour without replacing it, creating posi-tive spillovers and new employment opportunities.
Policies to close gender gaps
The overall impact of ADP technologies on inclusiveness will depend on public policiesFostering gender equality and gender empowerment in the changing landscape of work remains impera-tive. The overall impact of ADP technologies on gen-der equality and inclusiveness will ultimately depend on what policies are implemented (UNIDO 2019d).
Encouraging women in the labour force will fail if polices replicate gender segregationA key policy challenge is how to offer women more and better job opportunities in manufacturing. The
Figure 2.15 Women are underrepresented in managerial position in manufacturing
Managers
Professionals
Technicians
Clerical support
Service and sales
Craft and trades work
Plant and machine operators
Female Male Shares of male and female workers by occupation within the manufacturing sector (percent)
0 25 50 75 100
Note: The shares of male and female workers by occupation within the manufacturing sector are weighted using country-specific sample weights provided in Skills Towards Employability and Productivity (STEP) program surveys. The analysis includes Armenia, Colombia, Georgia, Ghana, Kenya, Lao People’s Democratic Republic, North Macedonia, Sri Lanka, the Plurinational State of Bolivia, Ukraine and Viet Nam.Source: UNIDO elaboration based on dataset by Sorgner (2019) derived from the STEP Skills Measurement Program (World Bank 2016).
Figure 2.16 A larger proportion of the female workforce is at high risk of job displacement from computerization in food, beverages and tobacco
0
20
40
60
Shar
e of
wor
kers
faci
ng a
hig
h ris
k (≥
70
perc
ent)
of c
ompu
teriz
atio
n of
thei
r occ
upat
ion
(per
cent
)
Computers,electronics,
machinery andtransport
equipment
Basic metalsand fabricated
metalproducts
Chemicals andpharmaceutical
products
Wood andpaper
products,and printing
Textiles,wearing
apparel andleather
Food products,beverages
and tobacco
FemaleMale
Note: The observations are weighted using country-specific sample weights provided in Skills Towards Employability and Productivity (STEP) program surveys. The analysis includes Armenia, Colombia, Georgia, Ghana, Kenya, Lao People’s Democratic Republic, North Macedonia, Sri Lanka, the Plurinational State of Bolivia, Ukraine and Viet Nam. The colours of the bars reflect the technology and digital intensity classification of industries. Green = TDI industries (industries that are simultaneously intensive on digitalization and technology). Blue = industries that are intensive on either digitalization or technology but not both. Red = industries that are intensive on neither digitalization nor technology.Source: UNIDO elaboration based on dataset by Sorgner (2019) derived from the STEP Skills Measurement Program (World Bank 2016).

82
th
e e
vo
lvin
g l
An
ds
CA
Pe
oF in
du
st
riA
liZA
tio
n u
nd
er
Ad
vA
nC
ed
dig
itAl P
ro
du
Ct
ion
te
Ch
no
log
ies
2
“The impact of ADP technologies on inclusiveness will ultimately depend on policies
gains from encouraging women’s participation in the labour force may be quickly eroded if industrial polices replicate gender segregation in the labour market and women continue to be overrepresented in occupations and tasks at high risk of loss through automation. An industrial strategy is needed that expands wom-en’s economic opportunities as part of the process of industrialization.
Promoting gender equality requires fostering women’s participation in new sectors and occupationsPromoting gender equality within an agenda of ISID requires enabling women to participate more in new sectors and in roles where they are underrepresented and where technological change can complement human skills, as in leadership and managerial positions and in STEM occupations. As stereotypes and societal norms may constrain women’s access to good jobs, pol-icy efforts need to focus on altering those perceptions and encouraging companies to hire women and offer them gender-equal conditions (UNIDO 2019d).
Developing adequate skills for both female and male workers to meet future demandMeeting the challenges of ADP technologies requires modernizing school curricula, including attention to soft skills, and promoting workforce training and life-long learning to reduce skill-mismatches for a chang-ing workplace. Attention to training and reskilling the existing labour force — for both male and female workers — must also be part of the policy debate about the future of work (see Chapter 4).
ADP technologies and inclusive industrialization: Direct, indirect and net effects of the use of industrial robots
How will industrial robots affect the economy directly and indirectly?The previous section focused on the potential direct impact of computerization on the manufacturing sec-tor, providing insights into the sorts of skills that could
be automated in individual manufacturing industries. This section analyses the direct and indirect macro effects of technology — here industrial robots10 — on employment in the overall economy. The indirect effects are based on both domestic and international linkages derived from intercountry input–output tables for both industrialized and emerging industrial economies.11 Growth of value added in one sector can indirectly influence employment in another through backward or forward linkages. Using industrial robots in the manufacturing of computers, electronics and optics, for example, could result in productivity gains that translate into higher quality and less expensive products. In turn, these products are used in many other sectors, including services, which themselves do not use robots. These more efficient intermediate inputs can lead to productivity gains in the using sec-tor that could eventually create new employment.
Growth in the stock of robots in manufacturing
Industrial robots have been operating for nearly two decadesMultipurpose industrial robots are expected to play a primary role in the manufacturing of the future, char-acterized by cyber-physical systems (CPS) and smart production. As seen in Chapter 1, robotics is just one component of the broader set of ADP technolo-gies that is transforming manufacturing. However, industrial robots, having been in operation for nearly two decades in some countries, are the only technol-ogy whose impact on employment can already be assessed. It is too soon to assess the impact of newer technologies — such as artificial intelligence and big data analytics — for a large number of countries and in a comparable way.
By 2014, there were more than 1 million industrial robots, 175,000 in emerging industrial economiesAround half a million industrial robots were installed and used in industrialized economies in 2000. For the stocks of robots in other economies, data from the International Federation of Robotics Database begin

83
th
e e
vo
lvin
g l
An
ds
CA
Pe
oF in
du
st
riA
liZA
tio
n u
nd
er
Ad
vA
nC
ed
dig
itAl P
ro
du
Ct
ion
te
Ch
no
log
ies
2
“ From 2000 to 2014, global investment in industrial robots doubled
with 2005. From 2000 to 2014, global investment in industrial robots doubled, to more than 1 million robots in industrialized economies and 175,000 in emerging industrial economies (Figure 2.17).12 The trend follows the patterns described in Chapter 1 for the growth of ADP technologies, confirming the take-off of ADP technologies around 2005.
Impact on employment
How to find the direct aggregate effect of robotization on employmentThe direct effect that growth in the stock of indus-trial robots in one industry in one country would have on world employment depends on how much the growth in the stock of robots (average annual growth from 2000 to 2014) in a particular industry affected employment in that industry. To calculate the aggre-gate impact, all the direct effects by industry were added across countries (Figure 2.18).
And the indirect effect in customer and supplier industriesThe indirect impacts were also calculated. Increased use of robots in an industry could affect employ-ment in customer and supplier industries. For exam-ple, the industry using more robots might produce
intermediate products of better quality and at cheaper prices for its customer industries, which in turn could increase competitiveness in those industries, enabling them to hire more workers to expand their businesses. The increase in the use of robots could also have an indirect impact on supplier industries if increased automation and changes in production processes translate into higher demand for certain materials and components. That could affect employment in supplier industries. The aggregate indirect effects of growth in the stock of robots is estimated by aggre-gating the impact on customer industries and supplier industries (see Figure 2.18). The impacts are aggre-gated separately for domestic and foreign customer and supplier industries.
Growth in the stocks of robots had a small and positive effect on employment growthThe annual growth in the stocks of robots had a posi-tive but small effect on employment growth from 2000 to 2014 (Figure 2.19). For example, the average direct effect of the growth in the stock of robots across all economies and industries implies employment growth of about 0.14 percent a year. The positive direct effect is reinforced by domestic (0.18 percent) and inter-national (0.06 percent) customer linkages. Supplier
Figure 2.17 The stock of industrial robots doubled between 2000 and 2014
0
250
500
750
1,000
1,250
201420132012201120102009200820072006200520042003200220012000
Stoc
k of
indu
stria
l rob
ots
(thou
sand
s)
Industrialized economiesEmerging industrial economies
Source: Ghodsi et al. (2019) based on International Federation of Robotics Statistical Department, World Robotics (IFR 2017).

84
th
e e
vo
lvin
g l
An
ds
CA
Pe
oF in
du
st
riA
liZA
tio
n u
nd
er
Ad
vA
nC
ed
dig
itAl P
ro
du
Ct
ion
te
Ch
no
log
ies
2
“The annual growth in the stocks of robots had a positive but small effect on employment growth from 2000 to 2014
linkages were mixed, however, with a large negative domestic supplier effect (–0.3 percent) and a positive international supplier effect (0.24 percent). The overall employment effect is thus 0.32 percent a year.13
Employment growth occurred mostly in emerging industrial economies, not industrialized economiesThe majority of job creation due to the world growth of robotics took place in emerging industrial econo-mies, through international customer and supplier linkages (see Figure 2.19). In global value chains, the impact on the employment in international customer and supplier firms due to adoption of robots origi-nated mainly from the growth of the stock of robots in industrialized economies. Those international cus-tomers and suppliers are mostly in emerging industrial economies. However, the net employment impact of the adoption of robots within emerging industrial economies is negligible. The industries that increased the use of robots generated employment in their own industries as well as in their domestic customer indus-tries, but that employment gain was largely offset by the employment loss in domestic supplier industries (Figure 2.20). So for emerging industrial economies aiming at employment creation, the most reliable channel would be to insert their industries into global
value chains as suppliers to foreign industries that are increasing their adoption of robots.
Manufacturing accounts for two-thirds of world employment growth attributable to robotizationThe adoption of robots in the manufacturing sec-tor is the main driver of the economy- wide employ-ment growth due to automation (Figures 2.21 and 2.22). Manufacturing accounts for two-thirds of the 0.32 percent growth in world employment attributa-ble to the adoption of robots (see Figure 2.22). But the employment growth is not entirely in manufacturing (see Figure 2.21). The adoption of robots in the manu-facturing sector had a positive effect on employment in nonrobot services.14 And except for the direct effect, most of the employment created (or lost in the case of domestic supplier linkages) in value chains is due to robotization in the manufacturing sector (see Figure 2.22), even though a large share of jobs were created in non-manufacturing sectors (see Figure 2.21).
The highest contributions to employment from robotization came in computers and machinery and in basic metalsAmong industries, only chemicals and pharmaceu-ticals had a negative impact on the economy-wide employment that resulted from the greater use of
Figure 2.18 Aggregate impact of the increase in industrial robot use in individual industries on world employment
CUSTOMERINDUSTRIES
CUSTOMERINDUSTRIES
CUSTOMERINDUSTRIES
TEXTILES CHEMICALS COMPUTERS
SUPPLIERINDUSTRIES
SUPPLIERINDUSTRIES
SUPPLIERINDUSTRIES
Growth in theuse of industrial
robots 2000–2014(annual average)
Aggregateimpact oncustomerindustries
Aggregateimpact onownindustries
Aggregateimpact onsupplierindustries
Source: UNIDO elaboration.

85
th
e e
vo
lvin
g l
An
ds
CA
Pe
oF in
du
st
riA
liZA
tio
n u
nd
er
Ad
vA
nC
ed
dig
itAl P
ro
du
Ct
ion
te
Ch
no
log
ies
2
“Manufacturing accounts for two-thirds of the growth in world employment attributable to the adoption of robots
Figure 2.19 Where were jobs created? Employment growth due to robots, by economy groups, 2000–2014
Industrialized economiesEmerging economies
-0.4
-0.2
0.0
0.2
0.4
Internationalsupplierlinkages
Domesticsupplierlinkages
Internationalcustomerlinkages
Domesticcustomerlinkages
Directimpact
Total
Empl
oym
ent e
ffect
(per
cent
)
Note: Coefficients are applied to the weighted averages of the growth rates of the stock of robots across economies and industries. Coefficients are from estimations in Ghodsi et al. (2019), Table 6 (model 1).Source: UNIDO elaboration based on dataset by Ghodsi et al. (2019) based on Timmer et al. (2015).
Figure 2.21 Where were the jobs created? Employment growth due to robots, by sector, 2000–2014
PrimaryManufacturingRobot serviceNon-robot service
–0.4
–0.2
0.0
0.2
0.4
Internationalsupplierlinkages
Domesticsupplierlinkages
Internationalcustomerlinkages
Domesticcustomerlinkages
Directimpact
Total
Empl
oym
ent e
ffect
(per
cent
)
Note: Coefficients are applied to the weighted averages of the growth rates of the stock of robots across economies and industries. Coefficients are from estimations in Ghodsi et al. (2019), Table 6 (model 1).Source: UNIDO elaboration based on dataset by Ghodsi et al. (2019) based on Timmer et al. (2015).
Figure 2.20 Who created the jobs? Employment growth due to robots, by economy groups, 2000–2014
Industrialized economiesEmerging economies
-0.4
-0.2
0.0
0.2
0.4
Internationalsupplierlinkages
Domesticsupplierlinkages
Internationalcustomerlinkages
Domesticcustomerlinkages
Directimpact
Total
Empl
oym
ent e
ffect
(per
cent
)
Note: Coefficients are applied to the weighted averages of the growth rates of the stock of robots across economies and industries. Coefficients are from estimations in Ghodsi et al. (2019), Table 6 (model 1).Source: UNIDO elaboration based on dataset by Ghodsi et al. (2019) based on Timmer et al. (2015).
Figure 2.22 Who created the jobs? Employment growth due to robots, by sector, 2000–2014
PrimaryManufacturingRobot serviceNon-robot service
–0.4
–0.2
0.0
0.2
0.4
Internationalsupplierlinkages
Domesticsupplierlinkages
Internationalcustomerlinkages
Domesticcustomerlinkages
Directimpact
Total
Empl
oym
ent e
ffect
(per
cent
)
Note: Coefficients are applied to the weighted averages of the growth rates of the stock of robots across economies and industries. Coefficients are from estimations in Ghodsi et al. (2019), Table 6 (model 1).Source: UNIDO elaboration based on dataset by Ghodsi et al. (2019) based on Timmer et al. (2015).

86
th
e e
vo
lvin
g l
An
ds
CA
Pe
oF in
du
st
riA
liZA
tio
n u
nd
er
Ad
vA
nC
ed
dig
itAl P
ro
du
Ct
ion
te
Ch
no
log
ies
2
“ It is unrealistic to evaluate the impact of robotization on employment based exclusively on technological replacement potential
robots. The positive contributions to employment creation were heavily concentrated in a few industries. In only three industries was the employment contri-bution larger than the average for manufacturing, and the contributions were much higher in the top two industries than in the top third (Figure 2.23). The highest contribution was in the computer and machin-ery industry, through higher employment in interna-tional suppliers in the same value chain. The second highest contribution was in the basic metals industry. Thus, one of the two TDI industries — computers and machinery — is also prominent in job creation through the adoption of robots.
Future effects of robotization may be differentDue to the fairly recent takeoff of robotization and the small number of emerging industrial economies in this analysis, it would be difficult to project future trends based on these empirical results. For example, if the growth in the use of robots to date has been asso-ciated mainly with the production of new products but will be increasingly associated with production process efficiency in the future, the impact of roboti-zation on employment could be less favourable than in
the current analysis. But it is also unrealistic to evalu-ate the impact of robotization on employment based exclusively on technological replacement potential, as earlier studies have done (Frey and Osborne 2017).
A more detailed picture of employment and output effects
In a study of Germany, robotization did not increase workers’ risk of displacementRecent studies using long-term firm-level and worker-level data reveal a more fine-grained picture of the labour market response to robotization and provide a more nuanced and holistic assessment of the impact of robotization. For example, Dauth et al. (2018), based on worker-level evidence in Germany for 1994–2014, show that the adoption of robots has not increased the risk of displacement for incumbent manufacturing workers. Workers seem to have adjusted to the instal-lation of robots by switching jobs within the same firm. As does the analysis in this chapter, Dauth et al. also provide evidence on the complementarity and expansion of economic activity in other industries as an important adjustment mechanism.
Figure 2.23 Computer, electrics and machinery and basic metals are the main creators of jobs due to automation
Chemicals and pharmaceutical products
Wood and paper products, and printing
Other manufacturing and repairs of computers
Textiles, wearing apparel and leather
Rubber and plastics products
Transport equipment
Food products, beverages and tobacco
Coke and refined petroleum products
Basic metals and fabricated metal products
Computers, electronics and machinery
Distance to the manufacturing average effect (percentage points)
–0.04 –0.02 0.00 0.02 0.04 0.06
Note: Coefficients are applied to the weighted averages of the growth rates of the stock of robots across economies and industries. Coefficients are from estimations in Ghodsi et al. (2019), Table 8. The colours of the bars reflect the technology and digital intensity classification of industries. Green = TDI industries (industries that are simultaneously intensive on digitalization and technology). Blue = industries that are intensive on either digitalization or technology but not both. Red = industries that are intensive on neither digitalization nor technology.Source: UNIDO elaboration based on dataset by Ghodsi et al. (2019) based on Timmer et al. (2015).

87
th
e e
vo
lvin
g l
An
ds
CA
Pe
oF in
du
st
riA
liZA
tio
n u
nd
er
Ad
vA
nC
ed
dig
itAl P
ro
du
Ct
ion
te
Ch
no
log
ies
2
“Output growth due to robot adoption needs to be considered in addition to the effect on production processes
In a study of Spain, robotization reduced labour cost share but increased the number of jobsKoch et al. (2019) examined the impact of robot adop-tion on individual firms using a panel dataset of manu-facturing firms in Spain over 1990–2016. They found that robotization led to substantial gains in output while reducing the labour cost share. But because the output gains were much larger than the reduction in the labour cost share, firms that adopted robots gen-erated jobs while firms that did not adopt robots had substantial job losses. The same could be said for other ADP technologies. For example, in the South African machinery and equipment industry, firms that initially cut jobs following the adoption of automation and artificial intelligence reabsorbed employees in differ-ent divisions as their output increased as a result of the adoption of the new technologies (Kaziboni et al. 2019).
So, output growth is another possible effect of robotizationThus the possibility of output growth due to robot adoption needs to be considered in addition to the effect on production processes (increasing capital intensity) relative to nonadoption. If greater use of robots makes production management easier and increases capital’s income share relative to labour’s without boosting firm or industry competitiveness or output by much, robot adoption is likely to have a negative impact on employment. But if robot adopters experience much faster growth than nonadopters — due to increased production scales and intersectoral complementarity, redistribution of work in a value chain and relocation of workers within a firm — firms and industries adopting robots are more likely to gen-erate jobs than are nonadopters.
Notes1. This report looks at the following 10 industries, which
are combinations of subsectors at the ISIC(rev.4)-2 digit level: food products, beverages and tobacco (ISIC 10t12); textiles, wearing apparel, leather (ISIC 13t15); wood and paper products, and printing (ISIC 16t18); coke and refined petroleum products (ISIC 19); chemicals, chemical products and pharmaceuti-cal products (ISIC 20t21); rubber and plastics prod-ucts (ISIC 22t23); basic metals and fabricated metal products (ISIC 24t25); computers, electronics and machinery (ISIC 26t28); motor vehicles and other transport equipment (ISIC 29t30); and furniture, other manufacturing and repairs of computers (ISIC 31t33).
2. The classification of manufacturing industries by tech-nology intensity is based on research and development (R&D) intensity as documented in OECD (2011), while the classification by digital intensity is based on seven dimensions of digital transformation including ICT investment, software investment, ICT intermedi-ate goods, ICT intermediate services, robot use, online sales, and ICT specialists, as discussed in Calvino et al. (2018).
3. Broadly defined as sectors C71RMQ (Renting of machinery and equipment), C72ITS (Computer and related activities), and C73T74OBZ (R&D and other business activities) from the OECD’s Inter-Country Input-Output Tables (ICIO).
4. This has been the focus of a wide body of literature such as in Ciriaci and Palma (2016), Consoli and Elche-Hortelano (2010), den Hortog (2001), Muller and Zenker (2001), Shearmur and Doloreux (2013), and Strambach (2018).
5. This section is based on the UNIDO background paper prepared by Sorgner (2019).
6. The Skills Towards Employability and Productivity (STEP) program (https://microdata.worldbank.org/index.php/catalog/step), designed by the World Bank, implements standardized surveys to gather interna-tionally comparable data on the supply and distribu-tion of skills and the demand for skills of adult popu-lation in the labour market of developing countries. So far, STEP was administered in two waves, 2012 and 2013, in 13 countries: Armenia, Colombia, Georgia, Ghana, Kenya, Lao People’s Democratic Republic, North Macedonia, the Philippines, Sri Lanka, the

88
th
e e
vo
lvin
g l
An
ds
CA
Pe
oF in
du
st
riA
liZA
tio
n u
nd
er
Ad
vA
nC
ed
dig
itAl P
ro
du
Ct
ion
te
Ch
no
log
ies
2 Plurinational State of Bolivia, Ukraine, Viet Nam, and China’s Yunnan province. For data comparability rea-sons, Philippines and China’s Yunnan province were excluded from the sample for the analysis here. For more information on the sample, see Sorgner (2019).
7. The approach measures the risk that an occupation will be completely computerized in the near future. This is done projecting the estimates from Frey and Osborne (2017) into the individual worker characteristics and a broad subset of task characteristics reported in the STEP dataset. See Sorgner (2019) for the details.
8. These results are in line with the analysis by Grundke et al. (2017) based on the OECD’s Survey of Adult Skills (Programme for the International Assessment of Adult Competencies, PIAAC) data, showing that women lag behind men in quantitative and mathematics- related skills, while gender differences are small in soft skills, such as self-organization, man-agement and communication.
9. These results are (qualitatively) in line with similar studies using PIAAC data to analyse the susceptibil-ity of the female workforce to automation in OECD countries. Brussevich et al. (2018) find that 9–10 per-cent of the male and female workforce face higher than 70 percent computerization risk, slightly larger the proportion of the female workforce at risk.
10. Broadly speaking, there are two types of robots (see Glossary): industrial robots, which are used in manu-facturing processes, and service robots, which are used
in other sectors of the economy. This section looks exclusively at industrial robots.
11. Unlike most of the literature, this section looks at both industrialized and emerging industrial econo-mies and includes the effects of international input-output linkages. The analysis of the implications of robots for labour markets is integrated into the frame-work developed by Autor and Salomons (2018). For the econometric model used in the analysis of this section, refer to Ghodsi et al. (2019). The analysis builds on the existing empirical work on the rela-tionship between technological change, employment and industrial growth pioneered by Abeliansky and Prettner (2017), Acemoglu and Restrepo (2018) and Graetz and Michaels (2018).
12. The analysis in this section focuses on the 43 econo-mies included in the World Input-Output Database (WIOD, Timmer et al. 2015). See Annex C.1, at the end of the report, for the full list of economies included.
13. It cannot be ruled out that the result is biased upward because emerging industrial economies included in the WIOD show large growth of robots due to the small number of robots in the first years and thus get rela-tively large weights.
14. The nonrobot service sector includes all service activi-ties except education, construction, veterinary activi-ties, electricity and water supply, scientific research and development, and other professional, scientific and technical activities.

8989
This chapter offers a firm-level view of the debate about the emerging advanced digital production (ADP) technologies. This view is crucial, since ADP technologies are adopted not by countries or sectors, but by firms. The diffusion of ADP technologies and their effective use largely depends on firms’ ability to acquire and develop the necessary capabilities, par-ticularly where they are still scarce, as is often the case in developing and emerging economies.
Qualitative firm-level evidence on the adoption of ADP technologies and its implicationsThis chapter presents a set of firm-level case studies on adopting, absorbing and effectively using ADP technologies in developing and emerging econo-mies. The cases indicate positive impacts for com-petitiveness, the quantity and quality of products, ground-breaking business models and environmen-tal sustainability. To produce these impacts, firms must often overcome such challenges as the lack of qualified personnel and the evolution of roles within the firms. The extent of these technological break-throughs actually permeating the industrial struc-tures typical of an emerging or developing country are not yet clear. They may, instead, increase polari-zation and exacerbate existing productive heteroge-neity. Weak connections between technologically advanced firms and local actors can prevent a broader impact from the new technologies.
Firm-level evidence in Argentina, Brazil, Ghana, Thailand and Viet NamThis chapter also presents and discusses new quan-titative evidence on ADP technologies collected by UNIDO through original firm-level surveys in five countries — Argentina, Brazil, Ghana, Thailand and Viet Nam. The data show that a small percentage of firms adopt the most advanced production technolo-gies and that their diffusion is still far from a mass phe-nomenon. When other firms’ expected technological
trajectory is considered, only a minority are engaging or getting ready to engage with ADP technologies and can thus be categorized as forging ahead or catching up. Strong technological and production capabilities and participation in global value chains (GVCs) facili-tate the uptake of new technologies.
Impacts on revenue and productivity — and moreWhen ADP technologies are in place, revenues and productivity are expected to increase. But the current policy debate warns of possible negative impacts on employment. In the UNIDO firm-level data, however, the majority of technologically advanced firms foresee the impact on employment to be neutral or positive. The fear of job displacement from new technologies is thus counterbalanced by the creation of new jobs related to new skills and the use of new machines. This is in line with the positive effects on employment expected from the diffusion of robots discussed in Chapter 2.
ADP technologies increase demand for technology- related and science, technology, engineering and math-ematics (STEM) skills and maintain demand for soft skills. These features may increase the risk of displace-ment of female workers, who tend to have gaps in these skills compared with male workers (Chapter 2). Yet, the surveys collected for the Industrial Development Report (IDR) 2020 suggest that firm-level adoption of ADP technologies create more employment opportu-nities for women with STEM skills.
The diffusion of ADP technologies may also trig-ger the adoption of more sustainable practices for materials, waste and energy. Improved productivity could lower prices and increase demand, needing to be counterbalanced by more efficient use of inputs in production.
Backshoring is not widespreadIs backshoring — shifting production to industri-alized countries from developing ones — a major
Chapter 3
How manufacturing firms can absorb and exploit advanced digital production technologies

90
ho
w m
An
uFA
Ct
ur
ing
Fir
ms
CA
n A
bs
or
b A
nd
ex
Plo
it Ad
vA
nC
ed
dig
itAl P
ro
du
Ct
ion
te
Ch
no
log
ies
3
“Evidence is still scarce about the implications for manufacturing firms of ADP technologies
threat? This report finds that it is quite rare and is still counterbalanced by firms’ offshore production in developing countries, creating further opportuni-ties for jobs and backward and forward value chain linkages.
Getting the most out of it by building on production capabilitiesThis chapter shows that firms’ introduction of tech-nological innovation, such as process innovations, is strongly related to industrialization or production capabilities derived from experience and learning by doing. These provide the main point of entry for adopting new technologies in emerging country firms and appear to be more important than technological and investment capabilities. Together, investment and technological and production capabilities deliver a higher adoption rate of new technologies than any of them taken separately.
Digitalization as necessary conditionDigitalization is another essential precondition for engaging with ADP technologies. If basic infra-structure such as electricity, internet connection and use of email is not in place, firms cannot adopt, absorb or use digital technologies. This chapter points out that only a small percentage of enter-prises are digital leaders that can combine solid technological capabilities — including research and development (R&D) expenditure and the ability to introduce new products — with automation, new processes and all forms of digital communication. A larger group of firms in emerging and develop-ing countries can perform some of these activi-ties and could fruitfully take steps towards more advanced digital technologies. These firms appear to have a higher propensity to export and to gener-ate employment.
Production capabilities are key for industrial and innovation policiesOverall this chapter emphasizes that new opportuni-ties from engaging with ADP technologies may come
from an increasing role for soft skills, whose impor-tance within the set of “skills of future” is found to be growing, and from the combination of production capabilities, which normally belong to the industrial policy sphere, with technology and investment capa-bilities, which traditionally occupy the technology policy debate. Recognizing the importance of produc-tion technologies widens the perimeter of the policy space facilitating technology adoption, but at the cost of greater complexity due to the higher sophistication of the new technologies.
ADP technologies: What’s in it for firms in developing countries?
Big hype, little evidence
ADP technologies are at the centre of global debatesADP technologies increasingly attract attention as a source of revenues and a field of competitive-ness for firms. Thanks to their expected firm-level impacts (see Figure 1.10 in Chapter 1), new tech-nologies have become a major topic of policy debates in advanced economies, both because they can boost firms’ long-term productivity and because economic sluggishness makes it urgent to find new sources of growth (OECD 2017). They have also started to occupy the centre of the policy debate in develop-ing and emerging countries as the new frontier of competitiveness. Although the academic and policy debate on the latest digital production technolo-gies has been growing impressively, its insights are mostly anecdotal and often inconclusive, not yet jus-tified by systematic and sound assessments based on solid data. Evidence is still scarce about the micro-level implications for manufacturing firms of ADP technologies, especially in developing and emerging countries.
Most firm-level data come from international consulting firmsMost currently available firm-level information on the diffusion and impact of ADP technologies comes

91
ho
w m
An
uFA
Ct
ur
ing
Fir
ms
CA
n A
bs
or
b A
nd
ex
Plo
it Ad
vA
nC
ed
dig
itAl P
ro
du
Ct
ion
te
Ch
no
log
ies
3
“ Lack of capabilities is a major obstacle to technological upgrading
from executive surveys carried out by international consulting firms (Abood et al. 2017; Deloitte, 2018; McKinsey Global Institute 2017; PwC 2016, 2018). These analyses help by assessing the diffusion of spe-cific technical solutions and their perceived benefits, and they often propose ways to evaluate enterprise readiness to incorporate such technologies. But they have limited representativeness and tend to focus exclusively on large enterprises in advanced econo-mies. Other sources of firm-level evidence on new pro-duction technologies are scarce, mostly due to the lack of micro-level data collection. Recently some specific surveys have been implemented (such as the European Manufacturing Survey — EMS — and the Community survey on ICT usage and e-commerce in enterprises by Eurostat); yet, these consider only European coun-tries, and information about developing country firms and advanced production technologies remains very limited.
Diffusion of ADP technologies is still limited, according to the scarce evidence availableEven in the available firm-level data from advanced economies, the diffusion of ADP technologies appears to be still too limited for sound assessments. Despite sensationalistic announcements of an ongoing dis-ruptive revolution, only a few companies are actually engaging with new digital production technologies. Studies on technologies associated with the fourth industrial revolution (4IR) among small and medium-sized enterprises (SMEs) in Germany and the Republic of Korea suggest that only around 18–20 percent of companies have engaged with them and are familiar with the concept (Sommer 2015). In Europe, only 6 percent of information and communications tech-nology (ICT) and professional services companies are making strategic and intense use of data, and fewer than 1 percent of employed personnel are data spe-cialists (EPSC 2017). It is thus not surprising that firm-level evidence on the impact on productivity and employment of ADP technologies is still scarce and inconclusive, particularly in developing and emerging economies.
Getting ready for ADP technologies
How can developing country firms engage with advanced technologies?The discussion about developing countries and ADP technologies has mostly focused on issues related to the adoption of new technologies by actors in advanced economies, such as backshoring or changes in the structure of GVCs. Less discussion has covered how developing country manufacturing firms can adopt and effectively exploit ADP technologies.1
Firm capabilities are preconditions of adopting and effectively using new technologiesLack of capabilities is a major obstacle to technologi-cal upgrading for firms in developing countries. In the latest technological wave, the diffusion of ADP technologies requires firms to acquire the necessary capabilities — executable routines or procedures for repeated performance in a specific context, produced by learning in an organization (Cohen et al. 1996). Since new production technologies build on and coex-ist with more mature ones, firms need to develop a broad array of conventional and new capabilities to adopt the new technologies and embed them effec-tively in existing production organizations (Bogliacino and Codagnone 2019).
Firm capabilities are diverseThree broad sets of capabilities stand out: invest-ment, technological and production capabilities. Investment and technological capabilities enable a firm to deal with technological change. They include the resources, skills and technological knowledge needed by firms to adopt and use equipment and technology, expand output and employment and further upgrade their technological competence and business activities. Production capabilities are related to production experience, learning by doing and behavioural and entrepreneurial factors. Given the complex, interconnected and flexible nature of ADP technologies, production capabilities are becoming increasingly important. They represent the first step

92
ho
w m
An
uFA
Ct
ur
ing
Fir
ms
CA
n A
bs
or
b A
nd
ex
Plo
it Ad
vA
nC
ed
dig
itAl P
ro
du
Ct
ion
te
Ch
no
log
ies
3
“Acquisition and development of capabilities are often complex and gradual
to acquire the base needed for further technology improvements.
Firm capabilities are accumulated graduallyBut the acquisition and development of capabilities is not easy or linear. Acquiring them is often complex and gradual. Distinguishing firm capabilities into basic, intermediate and advanced conveys the incre-mental steps whereby companies accumulate capabili-ties over time (Table 3.1).
Capabilities as a roadmap for cumulative learningFirms and countries first industrialize and acquire basic capabilities, then upgrade towards higher levels of technology. Mastering the basic capabilities — mostly associated with production — is critical for effectively deploying new technologies and retaining efficiency as well as for further developing firm capabilities. This means that a company would find it extremely diffi-cult to develop capabilities in advanced robotics if it were still struggling to arrange its production flow and
Table 3.1 Accumulating investment, technology and production capabilities for advanced digital production
Investment Technology Production
BA
SIC
Simple, routine-based
Feasibility studyBasic market and competitors analysisBasic finance and financial flow management
External sourcing of information (for example from suppliers, industry networking, public information)Basic training and skills upgradingRecruitment of skilled personnel
Plant routine coordinationRoutine engineeringRoutine maintenanceMinor adaptation of production processes and process optimizationBasic product design, prototyping and customizationProduct and process standards compliance, product quality managementQuality managementBasic bookkeepingBasic packaging and logisticsBasic advertisingSupplier monitoringBasic export analysis and some links with foreign buyers
INT
ER
ME
DIA
TE
Adaptive, based on search, experimentation, external cooperation
Seizing market opportunitiesSearch for equipment and machineryProcurement of equipment and machineryContract negotiationCredit negotiation
Seizing technology opportunitiesTechnology transferTechnological collaboration with suppliers/buyers (downstream and upstream)Vertical technology transfer (if in global value chain)Linkages with (foreign) technology institutionsLicensing new technology and softwareAlliances and networks abroadFormal process of staff recruitmentFormalized training, retraining and reskillingSoftware engineering, automation and information and communications technology skills
Routinized process engineeringPreventive maintenanceAdaptation/improvement of externally acquired production technologyIntroduction of externally developed techniquesProcess remodularization and scaling upReorganisation of workforceReverse engineering (product)Product design improvementProduct life-cycle managementQuality certificationProductivity analysisAuditingInventory controlDedicated marketing departmentBasic brandingSupply chain/logistics managementSystematic analysis of foreign markets
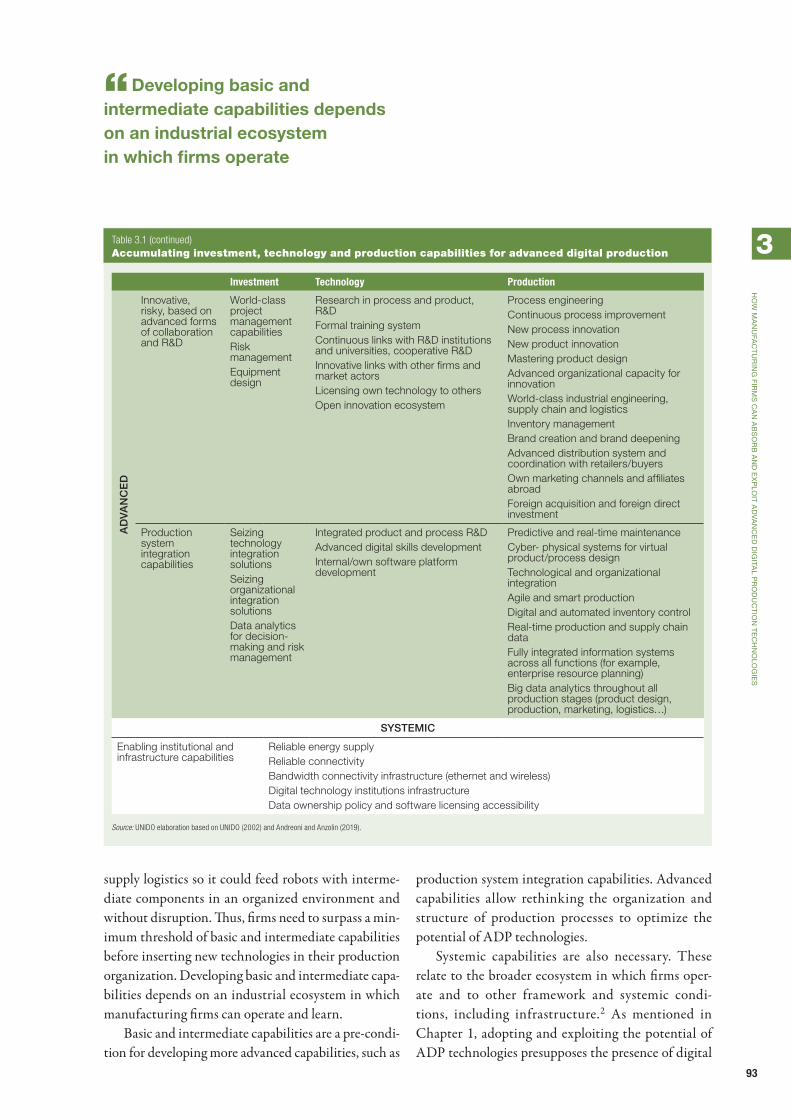
93
ho
w m
An
uFA
Ct
ur
ing
Fir
ms
CA
n A
bs
or
b A
nd
ex
Plo
it Ad
vA
nC
ed
dig
itAl P
ro
du
Ct
ion
te
Ch
no
log
ies
3
“Developing basic and intermediate capabilities depends on an industrial ecosystem in which firms operate
supply logistics so it could feed robots with interme-diate components in an organized environment and without disruption. Thus, firms need to surpass a min-imum threshold of basic and intermediate capabilities before inserting new technologies in their production organization. Developing basic and intermediate capa-bilities depends on an industrial ecosystem in which manufacturing firms can operate and learn.
Basic and intermediate capabilities are a pre-condi-tion for developing more advanced capabilities, such as
production system integration capabilities. Advanced capabilities allow rethinking the organization and structure of production processes to optimize the potential of ADP technologies.
Systemic capabilities are also necessary. These relate to the broader ecosystem in which firms oper-ate and to other framework and systemic condi-tions, including infrastructure.2 As mentioned in Chapter 1, adopting and exploiting the potential of ADP technologies presupposes the presence of digital
Investment Technology Production
AD
VAN
CE
D
Innovative, risky, based on advanced forms of collaboration and R&D
World-class project management capabilitiesRisk managementEquipment design
Research in process and product, R&DFormal training systemContinuous links with R&D institutions and universities, cooperative R&DInnovative links with other firms and market actorsLicensing own technology to othersOpen innovation ecosystem
Process engineeringContinuous process improvementNew process innovationNew product innovationMastering product designAdvanced organizational capacity for innovationWorld-class industrial engineering, supply chain and logisticsInventory managementBrand creation and brand deepeningAdvanced distribution system and coordination with retailers/buyersOwn marketing channels and affiliates abroadForeign acquisition and foreign direct investment
Production system integration capabilities
Seizing technology integration solutionsSeizing organizational integration solutionsData analytics for decision-making and risk management
Integrated product and process R&DAdvanced digital skills developmentInternal/own software platform development
Predictive and real-time maintenanceCyber- physical systems for virtual product/process designTechnological and organizational integrationAgile and smart productionDigital and automated inventory controlReal-time production and supply chain dataFully integrated information systems across all functions (for example, enterprise resource planning)Big data analytics throughout all production stages (product design, production, marketing, logistics…)
SYSTEMIC
Enabling institutional and infrastructure capabilities
Reliable energy supplyReliable connectivityBandwidth connectivity infrastructure (ethernet and wireless)Digital technology institutions infrastructureData ownership policy and software licensing accessibility
Source: UNIDO elaboration based on UNIDO (2002) and Andreoni and Anzolin (2019).
Table 3.1 (continued) Accumulating investment, technology and production capabilities for advanced digital production

94
ho
w m
An
uFA
Ct
ur
ing
Fir
ms
CA
n A
bs
or
b A
nd
ex
Plo
it Ad
vA
nC
ed
dig
itAl P
ro
du
Ct
ion
te
Ch
no
log
ies
3
“ Inadequate digital infrastructure can inhibit the adoption of digital industrialization
infrastructure. Inadequate digital infrastructure can inhibit the adoption of digital industrialization and thus offset any potential gains from it. For example, the lack of high-speed data access was one of the main obstacles to the diffusion of predictive maintenance technologies in the machinery and equipment sector in South Africa (see Box 2.1 in Chapter 2).
Each company is a unique bundle of capabilitiesEach company is a unique bundle of capabilities (Andreoni and Anzolin 2019). As different companies face different learning challenges, their pace of devel-oping new capabilities is likely to be uneven. In devel-oping countries, this reinforces firm heterogeneity, leading to a large number of low-capability and low-performance actors coexisting with more advanced ones. In developing countries, not only do firms face the divide separating them from firms in advanced economies operating close to the digital frontier, but a wide country-level divide — the digital capability gap — is present between the most digitally and techno-logically advanced companies and the rest.
The digital capability gap may harm advanced as well as low-capability firmsThe gap’s direct consequence is the generation of 4IR islands — that is, a few major leading companies engag-ing with some ADP technologies operating as islands in a sea of firms with scarce capabilities that still use older production technologies. Advanced companies may be harmed by this gap, because they may have trouble linking backwards to local actors and thus nurturing their supply chains. So, the digital capabil-ity gap impedes the diffusion of ADP technologies, turning a technology upgrading opportunity into a digital industrialization bottleneck. Smaller compa-nies may find their own way to compete outside the technology leverage, but they may also play a role in the adoption of ADP technologies. A key challenge for developing economies is to disseminate through-out the rest of the economy the capabilities already in place in the most advanced part of the manufacturing sector (Rodrik 2018).
Field case studies: A qualitative approach
This section documents the experience of some tech-nologically advanced firms in developing countries. The cases were collected in 2019 across eight devel-oping and emerging industrial economies.3 For each firm, the analysis explores different impact dimen-sions related to the framework presented in Chapter 1 (Table 3.2). The analysis also investigates the micro mechanisms of technology upgrading, describing why and how firms adopt and absorb advanced production technologies and what factors facilitate or challenge the diffusion of these technologies.
Exploiting the potential of ADP technologies
Enhanced efficiency and flexibility boost competitivenessThe firms interviewed reported improved efficiency, output and sales revenues as a result of reduced opera-tional costs, optimized use of inputs and lower inven-tories. Thanks to a new production line updated by Siemens’s intelligent software, China Baowu Steel Group Corporation (commonly known as Baowu) increased its average daily output by 15–30 percent and reduced excess inventory in the warehouse by half, improving labour efficiency by 10 percent while reduc-ing costs by 20 percent. Also in China, the new Haier air conditioning smart factory, which required invest-ing in equipment interconnections and digital systems approximately 1.2 times those of a conventional factory, had a 60 percent improvement of operational efficiency.
Improved competitiveness is more than an enhanced efficiency story: It’s also about quality…New technologies improved precision and reduced errors at almost all interviewed firms. They allowed firms to operate with higher quality in processes and products, and to eventually expand into new or higher-end markets. Baowu expects the adoption of Alibaba Cloud ET Industrial Brain, powered by artificial intel-ligence, edge computing and augmented reality, to reduce the factory’s nonconforming product rate by

95
ho
w m
An
uFA
Ct
ur
ing
Fir
ms
CA
n A
bs
or
b A
nd
ex
Plo
it Ad
vA
nC
ed
dig
itAl P
ro
du
Ct
ion
te
Ch
no
log
ies
3
“New technologies improved precision and reduced errors at almost all interviewed firms
Tabl
e 3.
2 C
ase
stu
die
s exa
min
ed t
he im
pact
of
ad
vanced t
echnolo
gy
on t
he c
om
peti
tive
ness, envi
ronm
enta
l su
sta
inabilit
y and s
ocia
l in
clu
siv
eness
of
deve
lopin
g c
ountr
y fi
rms
AEDe
sign
Paki
stan
Engi
neer
ing
serv
ices
Arçe
likTu
rkey
Was
hing
m
achi
nes
AVS
Tech
nolo
gy
AGUr
ugua
yCh
lorin
e pl
ants
Chin
a Ba
owu
Stee
l Gro
up
Corp
orat
ion
Chin
aSt
eel
Gene
sis
Bion
ics
Kyrg
yzst
anBi
onic
pr
osth
eses
Haie
rCh
ina
Air
cond
ition
ing
syst
ems
Mah
indr
a &
M
ahin
dra
Indi
aAu
tom
otiv
e
New
-Tek
Kyrg
yzst
anSo
lar p
anel
s
Pena
ng
Auto
mat
ion
Clus
ter
Mal
aysi
aM
etal
co
mpo
nent
s
Thal
es 3
DM
oroc
coCo
mpo
nent
s fo
r ae
rosp
ace
sect
or
ZC R
ubbe
rCh
ina
Rubb
er
and
tires
New and better products
New
so
lutio
ns fo
r m
argi
naliz
ed
grou
ps
• M
edic
al d
evic
es a
t affo
rdab
le
pric
es
Bet
ter
qual
ity
and
new
bu
sine
ss
mod
els
• P
erso
naliz
ed p
rodu
cts,
mas
s cu
stom
izat
ion
• N
ew a
nd d
ata-
base
d se
rvic
es•
New
pric
ing
mod
els
Env
ironm
enta
l go
ods
• G
oods
pro
duce
d w
ith e
co-
frie
ndly
mat
eria
ls•
Incr
ease
d pr
oduc
t ene
rgy
effic
ienc
y
Increased production efficiency
Ene
rgy
effic
ienc
y an
d in
put
optim
izat
ion
• E
mis
sion
and
was
te
redu
ctio
n•
Acc
eler
atio
n of
circ
ular
ec
onom
y tr
ansi
tion
Ope
ratio
nal
cost
re
duct
ion
• Fl
exib
le a
nd d
ecen
tral
ized
pr
oduc
tion
• S
uppl
y ch
ain
conn
ectiv
ity,
deliv
ery
perf
orm
ance
and
lo
gist
ics
• A
gile
, ada
ptiv
e or
gani
zatio
n
Impr
oved
ca
pita
l ut
ilizat
ion
• P
rodu
ctiv
e an
d au
tom
atic
m
aint
enan
ce, d
ownt
ime
redu
ctio
n•
Low
er in
vent
ory
rate
, in
crea
sed
cash
-to-
cash
cyc
le
Em
ploy
men
t qu
ality
and
lin
kage
s to
se
rvic
es
• Im
prov
ed w
ork
cond
ition
s,
safe
ty•
Fost
er fe
mal
e em
ploy
men
t•
New
ski
lls, t
ask
effic
ienc
y
Affecting adoption
Ena
bler
s•
Ext
erna
l kno
wle
dge
• P
re-e
xist
ing
indu
stria
l and
pr
oduc
tion
capa
bilit
ies
Cha
lleng
es•
Lack
of q
ualifi
ed p
erso
nnel
• C
hang
ing
inte
rnal
cul
ture
Note
: The
circ
les
iden
tify
the
topi
cs c
over
ed in
eac
h ca
se s
tudy
.So
urce
: UN
IDO
elab
orat
ion
base
d on
Cal
za a
nd F
okee
r (20
19).
96
ho
w m
An
uFA
Ct
ur
ing
Fir
ms
CA
n A
bs
or
b A
nd
ex
Plo
it Ad
vA
nC
ed
dig
itAl P
ro
du
Ct
ion
te
Ch
no
log
ies
3
“New production technologies can generate positive environmental spillovers by reducing hazardous and polluting processes
28 percent. At the Kyrgyz New-Tek plant, which pro-duces solar panels employing an innovative fully auto-mated production line, industrial robots controlled by sensors via a general production control program minimize inaccuracies and errors. This high-precision production is reflected in the superior quality and competitive price of solar panels, which obtained the quality certifications required to sell to the markets of the European Union and the United States.
…and sustainabilityEnvironmental sustainability is associated with ADP technologies for three main reasons: improved energy efficiency, sustainable materials, and reduced waste and pollution. First, companies experience energy efficiency gains, especially in heavy industries. Baowu increased its energy efficiency by 5 percent, while ZC Rubber’s energy efficiency improved by more than 10 percent. Second, additive manufacturing achieves more efficient and sustainable use of materials than subtractive pro-duction processes by consuming less energy and mini-mizing waste (OECD 2017). So far, 3D printers often employ metals or plastic, but efforts are increasing to develop new environmentally friendly materials, such as the PLA-plastic based on sugarcane and corn used by the Kyrgyzstan-based Genesis Bionics for 3D-printed bionic prostheses. Finally, new production technolo-gies can generate positive environmental spillovers by reducing hazardous and polluting processes. The smart modular plants for producing chlor-alkali directly at water treatment plants developed by Uruguayan AVS Technology AG eliminate the need to store or trans-port chlorine in liquefied gas form, whose leakages could harm both human health and the environment.
New products and new business and organizational models emerge from ADP technologyNew production technologies go beyond improv-ing processes. They also entail new products and new business and organizational models. Some changes are already visible, mostly in new business models and “servification” — that is, manufacturers offering services, often attached to products. Technologies
“have never transformed industries on their own” but they need business models promoting transformation through agile organization, a collaborative ecosystem and more customization (Kavadiaset al. 2016).
ADP technologies shape factories and manufacturing processes as well as productsThe experiences of the smart washing machine pro-duced by Arçelick and the smart air conditioning sys-tem produced by Haier are prototypical. Products are made in smart factories through industrial platforms that connect the entire supply chain in real time, from suppliers to final users, who customize the product according to their needs and tastes. This enhanced supplier–producer–user interaction has two implica-tions. It changes the business model from “manufac-turer designing” to “customers designing,” allowing user-led innovation into production. And it changes the nature of the product from analogue to digital and smart: smart products transmit data back to manu-facturers, who analyse them to improve processes and to develop after-sales services attached to the physical product and increasing its value.
3D printing makes complex products without costly toolingAdditive manufacturing provides another example of how ADP technologies can bring new products into the market. 3D printing, together with computer-aided design (CAD) programs, allows the realization of products that conventional manufacturing could not produce because of their complex internal struc-ture or the need to first produce a complicated and expensive mould. 3D printing technology enables the production of complex parts without costly tool-ing, eliminates the design-for-manufacturability con-straints of conventional subtractive manufacturing processes and allows customized products, ranging from the prosthetic hands made by Genesis Bionics to the metal components made by Thales 3D.
ADP technologies reshape skills, work conditions and rolesNew technologies lead to a profound redefinition of workers’ skills and roles throughout production. As

97
ho
w m
An
uFA
Ct
ur
ing
Fir
ms
CA
n A
bs
or
b A
nd
ex
Plo
it Ad
vA
nC
ed
dig
itAl P
ro
du
Ct
ion
te
Ch
no
log
ies
3
“Pre-existing industrial and production capabilities are crucial to absorbing and using ADP technologies
digitalization permeates all stages and tools, work-ers need a deep knowledge of digital technologies and digital skills to understand and integrate new technologies into their tasks. On top of the hard skills needed for automation, coding, data analytics and data-driven decision-making, workers increas-ingly need soft skills, such as the ability to learn and communicate.
In addition, some firms are changing roles more radically: production workers increasingly operate as platform managers, coordinating customers’ requests and interacting with suppliers, instead of performing traditional mechanical repetitive tasks. The new roles also require negotiation and coordinating skills. This evolution has been described especially by firms imple-menting fully smart factories for customized smart goods, operating with digital industrial platforms, such as Haier, Arçelik and Mahindra & Mahindra Ltd. (M&M).
Automation removes workers from backbreaking and hazardous tasksDigital operating systems and automation technolo-gies are also expected to move workers away from the most physically demanding and hazardous tasks. Some firms interviewed — such as Baowu, M&M and New-Tek — highlighted this. They also identified this removal of physical job requirements as potentially helpful to expanding female employment in tradition-ally male-dominated manufacturing tasks.
Adopting and absorbing ADP technologies
The main challenge is humans, not robotsFor most firms interviewed, the lack of qualified per-sonnel is the main challenge to adopting and using ADP technologies, greatly limiting the speed of transformation. Since higher education institutions are scarce and often do not offer adequate programs, New-Tek and Thales 3D arranged training abroad with foreign partners and developed internal training programmes. The lack of talent is particularly serious
among women, since fewer of them pursue careers in digital technologies, engineering and mechanics.
Absorbing new roles and routines is difficultChanging a firm’s culture is another major challenge. Both Haier and ZC Rubber emphasized how difficult overcoming the inertia of consolidated routines and deeply rooted thinking modes is, as well as adjusting the organization to new roles and requirements. So, even if adopting new equipment may not present a big challenge — even financially — absorbing complex and rapidly evolving technologies into production pro-cesses remains a difficult task, even for firms already familiar with digital technologies.
The adoption of advanced digital production technologies is not binary — it has shadesThe adoption of new technologies is usually modelled as if firms face a yes-or-no choice. Yet adoption seems to have shades: firms do not fully adopt or fully reject a technology — they tend to incorporate one gradually, starting with only some functions. The case studies showed that, even if automated and interconnected production lines were installed, other business func-tions remained at a less advanced technological level. For example, purchase orders were forwarded by email, product design relied on unconnected 3D mod-elling programs, or customer relations were updated manually in spreadsheets.
Previous industrial and production experience helps in setting up smart factoriesThe case studies shows that pre-existing industrial and production capabilities are crucial to how manu-facturing firms in a developing country adopt, absorb and use ADP technologies. The production experi-ence of Baowu and ZC Rubber was fundamental in providing accurate and rich information for fine-tuning and adjusting system parameters during tech-nology upgrading. The organizational competences developed in decades of white goods production by Arçelik and Haier were crucial for setting up new smart factories. These results confirm the importance

98
ho
w m
An
uFA
Ct
ur
ing
Fir
ms
CA
n A
bs
or
b A
nd
ex
Plo
it Ad
vA
nC
ed
dig
itAl P
ro
du
Ct
ion
te
Ch
no
log
ies
3
“ Firms tend to access new technologies mostly through an external source
of the industrial base and industrial capabilities dis-cussed in Chapter 1.
Adopting new technologies is a stepping stone to technological learningFirms tend to access new technologies mostly through an external source — a university (Genesis Bionics), a foreign partner making a direct invest-ment (New-Tek), a foreign digital leader (Baowu through Siemens) or a domestic one (ZC Rubber through Alibaba ET Industrial Brain) — in a coop-eration agreement, often supported by the govern-ment. Even if technologies are mostly imported or developed outside the firm, adopting them represents a valuable opportunity for technological learning. Indeed, all cases include some degree of endogenous innovation. So, firms do not just replicate new tech-nologies, they also adapt them to specific processes and conditions, eventually leading to newpatents and new machinery, as shown by the new steel melt-ing crane developed by Baowu and Siemens; new software and programs, such as the COSMOPlat platform developed by Haier; and the electromyo-graphy method developed by Genesis Bionics. Such “follow-on or incremental innovations” (Lee and Ki 2017) support the argument in Chapter 1 that adopting external technology with a local twist is a stepping stone for learning and mastering advanced technologies, and for developing domestic techno-logical capabilities (Lee 2019).
Only a few isolated firms use ADP technologiesThe few companies adopting ADP technologies may find it difficult to generate linkages with surrounding firms due to the large digital capability gap that sepa-rates them form the rest of the manufacturing sector (Andreoni 2019). The case studies seem to confirm the existence of 4IR islands, since the interviewed firms represent exceptions, not average manufactur-ing firms, in using advanced production technologies. Most said they rely on qualified foreign suppliers that can match their technological level and their speed and quality requirements.
Yet, technologically advanced firms can develop ties with local actorsYet, these technologically advanced firms still gener-ate ties with local market and nonmarket actors. Some actively engage with local industry associations and universities, leading to joint training, student intern-ships and joint scientific and technical research, as in the case of Thales 3D in Morocco. For New-Tek in Kyrgyzstan, local ties went as far as sharing facili-ties and laboratories for testing. Some firms even developed linkages with the local industrial ecosys-tem, which provides inputs and postproduction sup-port. This suggests that even the most technologically advanced firms may need the support of actors using older technologies. For example, Thales 3D relies on actors using conventional technologies to finalize its high-quality products (Calza and Fokeer 2019). And in the Penang Automation Cluster in Malaysia, large technological companies use local firms still employ-ing previous-generation production technologies for some simpler tasks. Thus, even 4IR islands may engage in some local linkages; yet, it remains unclear to what extent this can contribute to effective technology transfer to local firms.
Firms vary in hiring trends, government support, foreign ownership and location decisionsSome other relevant issues seem to be firm-specific, with few common traits. The magnitude and direction of the changes in employment is not homogenous: the case studies display scenarios ranging from the replacement of heavy jobs by automated machinery to the increase in workers with digital skills. The role of government also differs: in some cases, it has explicitly supported the transfer and adoption of new technolo-gies, while in other cases, it has offered no support. Finally, some of the firms interviewed are partially or totally foreign-owned, and their reasons to operate in a developing country are heterogeneous: location in a Free Economic Zone (such as New-Tek in Kyrgyzstan and AVS Technology AG in Uruguay) or an industrial park (such as Baowu and Haier in the Sino-German Ecopark of Qingdao), and nearness to final customers

99
ho
w m
An
uFA
Ct
ur
ing
Fir
ms
CA
n A
bs
or
b A
nd
ex
Plo
it Ad
vA
nC
ed
dig
itAl P
ro
du
Ct
ion
te
Ch
no
log
ies
3
“ Various generations of production technologies tend to be used at the same time
(Arçelik in Turkey and Thales 3D in Morocco) seem to be the most frequent. None of these firms referred to lower labour costs as a major factor, emphasizing instead the industrial ecosystems, qualified talent or geographical proximity to target markets.
A micro-level perspective based on surveys
More data are needed on ADP technologies in developing and emerging economiesEmpirical evidence on the diffusion and impact of ADP technologies among firms in developing and emerging countries is scarce. How diffused are the technologies in those economies? What are the impli-cations for firms employing the technologies? How to characterize digital companies as “advanced” or “lagging behind”? As these questions become more urgent, direct surveys and other empirical work on firms are becoming necessary.
Surveys provide new evidence on technology adoption and its effectsThis chapter contributes evidence based on firm-level surveys between 2017 and 2019 in Argentina, Brazil, Ghana, Thailand and Viet Nam. The surveys had a twofold aim: they investigated the patterns of adop-tion of digital production technologies in develop-ing and emerging economies, and they explored the technologies’ firm-level implications for productivity, employment and skills, location of production and environmental sustainability.
UNIDO surveys
Various generations of production technologies are used at the same timeHeterogeneity is characteristic of the productive structure in developing and emerging economies.4 In the countries covered by the surveys, many levels of capabilities and competences are likely to coexist in the productive structure of each country, between and within sectors and even within firms. This means that
manufacturers employ different production technolo-gies. On one side there are companies producing goods and services through more traditional processes with-out using digital technologies. At the other extreme there are companies that include digitalization as an essential part of business strategy.
The concept of firm heterogeneity lies at the core of the UNIDO surveys. It inspired the structure of the surveys, whose original feature is to investigate a range of possible technological levels or generations within each country’s productive structure. The approach dif-fers from existing micro-level surveys — such as EMS, Eurostat and executive surveys carried out by interna-tional consulting firms. They tend to cover individual ADP technologies while disregarding digital solutions that have been around for a long time yet but may still be relevant to firm-level performance.
The surveys conducted for this report acknowl-edge that various generations of production technolo-gies tend to be used at the same time, particularly in emerging or developing economies. The surveys pur-sued a broader path in questioning firms about their engagement with digital production technologies. All surveys used a common a framework based on differ-ent technological generations that go from simple and analogue ones (generation 0.0) to the most cutting-edge digital production technologies associated with smart production (generation 4.0) (see Figure 1.20 in Chapter 1).5 This aims to capture the evolutionary logic of incorporating digital technologies in heteroge-neous industrial environments.
Diffusing and adopting ADP technologies
Brazil and Argentina have the largest shares of firms using more advanced technologiesAmong the five countries considered, Brazil and Argentina have the largest shares of firms using ADP technologies. The other three countries display a lower level of adoption, with differences: Thailand and Viet Nam have a larger share of firms adopting the highest generations of digital technologies (generation 3.0 and 4.0) than Ghana, as well as a larger share of firms using

100
ho
w m
An
uFA
Ct
ur
ing
Fir
ms
CA
n A
bs
or
b A
nd
ex
Plo
it Ad
vA
nC
ed
dig
itAl P
ro
du
Ct
ion
te
Ch
no
log
ies
3
“Data confirm heterogeneity across countries as well as within them
generation 2.0 (Figure 3.1). Ghana has a rather different pattern6: not only is the aggregate share of generation 0.0 and 1.0 larger, analogue technologies (generation 0.0) are diffused more widely, with only 11.5 percent of firms using technologies of generation 2.0 and above.
Few firms in any country use the most advanced technologiesDespite large cross-country differences, in every coun-try, the diffusion of higher generations of digital tech-nologies (3.0 and 4.0) is incipient: adopters represent a niche, ranging from 1.5 percent in Ghana to about 30 percent in Brazil. These rates are in line with those in advanced countries, where ADP technologies are not yet diffused on a massive scale, either.
A country’s economic structure influences firm behaviourThe differences across countries show how the diffu-sion of ADP technologies is context-specific. So, the specific features of different countries are important to take into account. Their industries have different geographical locations. The role of their manufactur-ing firms in GVCs is different. And economic sectors have a different relative importance in their indus-trial matrix. This diversity supports the coexistence of many patterns of specialization across these different countries.
Country technology classifications are supported by firm-level evidenceThe results confirm the country-level classification presented in the global characterization in Chapter 1, where Brazil (classified as a follower in produc-tion) was the most advanced of the five, followed by Argentina, Thailand and Viet Nam (followers in use) and finally by Ghana (a laggard). The firm-level data provide a consistent and similar picture of cross-country specialization differences.
Different generations of digital technologies coexist within one countryThe data confirm heterogeneity across countries as well as within them. Different generations of
production technologies coexist within one country. This is not surprising, given the heterogeneity typical of the productive structure of developing and emerg-ing economies. Firm-level data are consistent with the presence of 4IR islands, where a few firms with ADP technologies are surrounded by a majority of firms that operate at a lower technological level.
Which characteristics influence the adoption of ADP technologies?
Advanced technologies are more diffused in TDI industriesThe share of firms using the highest generations of dig-ital technologies (3.0 and 4.0) is larger in technology- and digital-intensive (TDI) industries (Figure 3.2).7 This result confirms the sectoral analysis in Chapter 2 (see Figure 2.1) showing how the adoption of new technologies is more widespread in TDI industries.8
Figure 3.1 Adoption of ADP technologies is still limited among developing countries
0
25
50
75
100
BrazilArgentinaThailandViet NamGhana
Shar
e of
firm
s ad
optin
g te
chno
logi
cal g
ener
atio
ns (p
erce
nt)
Generation 0.0 and 1.0 Generation 2.0 Generation 3.0 Generation 4.0
29
37
43
0.4
251753
42
43
2213
10
74
[6]
84
[8]
89
[69]
1.5
Note: Numbers in brackets are generation 0.0 firms. For Argentina and Brazil, no information on generation 0.0 is available due to the structure of their survey questionnaires. Countries are ordered according to the shares of firms currently adopting the highest generations of digital technologies (generations 3.0 and 4.0). See Annex A.3 for more detailed information on sample composition and the methodology of the UNIDO survey, including the definition of technological generations applied in the survey questionnaires.Source: UNIDO elaboration based on data collected by the UNIDO firm-level survey “Adoption of digital production technologies by industrial firms” (for Ghana, Thailand and Viet Nam) and Albrieu et al. (2019) and Kupfer et al. (2019) (for Argentina and Brazil).

101
ho
w m
An
uFA
Ct
ur
ing
Fir
ms
CA
n A
bs
or
b A
nd
ex
Plo
it Ad
vA
nC
ed
dig
itAl P
ro
du
Ct
ion
te
Ch
no
log
ies
3
“ Large firms enjoy technological and productive capabilities that make them more likely to adopt new technologies
However, ADP technologies also exist in other indus-tries. In Thailand, for example, the share of firms using the highest technological generations is similar across different industry groups. Other sectors with lower technology intensity — which tend to be particularly important for low- and lower-middle income countries — could serve as fields for trials of new production technologies.
Larger firms adopt more advanced technologiesSize is another important factor for adopting new technologies. Large firms, thanks to — but not only to — the larger investments their resources permit, tend to enjoy technological and productive capabilities that make them more likely to adopt new technolo-gies. Data on the five countries studied seem to sup-port this argument since a higher share of larger firms
adopt the highest generations of digital technologies (3.0 and 4.0) (Figure 3.3).9 But countries are differ-ent: while this pattern is confirmed in Ghana and Viet Nam, and extremely clear in Argentina, the pattern is different in Thailand, where the share of users of generation 3.0 and 4.0 is the same or somewhat lower among large firms.10 This might suggest that small firms in Thailand do not face systematically higher barriers to adoption than larger firms.
Firm participation in global value chains is associated with advanced technologiesManufacturing firms in developing and emerging industrial economies may depend on their integration in international trade and production networks for learning about new production technologies (Zanello et al. 2016). International trade and production
Figure 3.2 Firms in TDI industries tend to adopt more ADP technologies
Viet Nam
Thailand
Brazil
Argentina
Distance to the average share of firms adoptinggenerations 3.0 and 4.0 (percentage points)
TDI industriesOther industries
–10 –5 0 5 10 15
Note: TDI is technology- and digital-intensive. Ghana is excluded from the comparison because the Ghanaian sample does not include TDI industries. TDI industries include automotive and auto parts, and electronics. Other industries include food and beverages; textiles, leather and footwear; plastic and rubber; metal products; and wood and furniture. See Annex A.3 for more detailed information on sample composition and the methodology of the UNIDO survey, including the definition of technological generations applied in the survey questionnaires.Source: UNIDO elaboration based on data collected by the UNIDO firm-level survey “Adoption of digital production technologies by industrial firms” (for Thailand and Viet Nam) and Albrieu et al. (2019) and Kupfer et al. (2019) (for Argentina and Brazil).
Figure 3.3 Larger firms tend to adopt more ADP technologies
Viet Nam
Thailand
Ghana
Argentina
Distance to the average share of firms adoptinggenerations 3.0 and 4.0 (percentage points)
–10 –5 0 5 10 15 20 25
Large firms (100 or more employees)Small firms (fewer than 100 employees)
Note: Brazil is excluded from the comparison because the Brazilian sample does not include small firms. See Annex A.3 for more detailed information on sample composition and the methodology of the UNIDO survey, including the definition of technological generations applied in the survey questionnaires.Source: UNIDO elaboration based on data collected by the UNIDO firm-level survey “Adoption of digital production technologies by industrial firms” (for Ghana, Thailand and Viet Nam) and Albrieu et al. (2019) and Kupfer et al. (2019) (for Argentina).

102
ho
w m
An
uFA
Ct
ur
ing
Fir
ms
CA
n A
bs
or
b A
nd
ex
Plo
it Ad
vA
nC
ed
dig
itAl P
ro
du
Ct
ion
te
Ch
no
log
ies
3
“Participation in GVCs positively affects the probability of adopting advanced technologies
networks may offer viable channels for knowledge transfer to suppliers downstream in a GVC (World Bank 2017).
Data collected for this report also allow investigat-ing the relationship between participating in GVCs and adopting new technologies in Ghana, Thailand and Viet Nam.11 An econometric analysis of these data looked into the determinants of ADP technol-ogy adoption and found that participation in GVCs positively affects the probability of adopting most advanced technologies.12 This positive correlation holds when controlling for other factors likely to shape the adoption of new production technologies, such as size, sector, human capital and R&D and machinery investments (Figure 3.4). This finding supports the argument that integration within manufacturing GVCs can represent an opportunity for technological upgrading.
The lack of funds, infrastructure and human resources are the main obstacles to advanced technology adoptionWhy is adoption of ADP technologies still so low? The main barriers and limitations acknowledged by the firms surveyed generally included lack of funds (Figure 3.5). Half of firms in Ghana identified lack of funds as the main obstacle: this is not surprising given the limited access to credit in low- and middle-income countries. Firms in both Thailand and Viet Nam highlighted the lack of adequate human resources as a major obstacle: with more advanced industrial devel-opment, this result supports the argument that these countries need to reskill their labour force to foster the diffusion of new technologies. In Thailand, which has the highest rate of adoption of the most advanced generations of digital technologies (3.0 and 4.0) of the three countries, lack of awareness and time to recover investments are also important obstacles.
Small firms identify lack of funds as an obstacleObstacles cited by small and large firms differ. In Ghana and Viet Nam, a larger share of small firms identified the lack of funds as the main obstacle to adoption — almost 60 percent in Ghana and about
35 percent in Viet Nam. This is in line with small firms typically being more resource-constrained than larger ones.
A dynamic approach to firm digital readiness
Expected technology adoption and efforts matterThe concept of a technological generation requires a time-related dynamic approach, covering not just which generation of technology a firm is actually using but, given the rapid process of change, what generation it foresees using. Moreover, although the progression from generation 1.0 to generation 2.0 does not require major organizational changes, a projected progression to generation 3.0 or 4.0 is not simple and linear but requires substantial changes in competences, produc-tion and organization. Even simpler digital solutions
Figure 3.4 Firms participating in GVCs are more likely to adopt ADP technologies
–0.04
–0.02
0.00
0.02
0.04
Foreignownership
Investmentsin R&D andmachinery
Firmsize
Skilledhumancapital
Globalvalue chain
participation
Age
Aver
age
mar
gina
l effe
ct o
n ad
optin
g AD
P te
chno
logi
es 0.06
Note: The graph depicts coefficients and confidence intervals (at 95 percent) for the average marginal effects of the variables of interest on the probability of belonging to the group of firms characterized by the highest generations of digital technologies (generations 3.0 and 4.0), rather than belonging to the other groups of firms (generations 1.0 and 2.0). An ordered probit model was implemented on firms surveyed in Ghana, Thailand and Viet Nam. Country and sector dummies are included.Source: UNIDO elaboration based on Pietrobelli et al. (2019) derived from the data collected by the UNIDO firm-level surveys “Adoption of digital production technologies by industrial firms.”

103
ho
w m
An
uFA
Ct
ur
ing
Fir
ms
CA
n A
bs
or
b A
nd
ex
Plo
it Ad
vA
nC
ed
dig
itAl P
ro
du
Ct
ion
te
Ch
no
log
ies
3
“Progression to generation 3.0 or 4.0 requires substantial changes in competences, production and organization
require changes in competences from analogue ones, demanding explicit learning efforts to upgrade firm capabilities. Thus, to assess firms’ readiness for adopt-ing further ADP technologies, the surveys for this report captured information on the technological gen-erations a firm expects to use in the next 5–10 years and the firm’s efforts to mobilize towards those levels.
The majority of firms in Argentina and Brazil expect to use advanced technologies in 5–10 yearsIn all countries, the share of firms that expect to use the highest generations of digital technologies (gen-erations 3.0 and 4.0) in the next 5 to 10 years increases dramatically (Figure 3.6). The highest projections are in Brazil, where 44.8 percent of firms expect to be at generation 4.0 and 33.5 percent at generation 3.0. In Argentina, 25 percent of firms expect to reach genera-tion 4.0 (compared with only 2.9 percent at present — see Figure 3.1), and more than 40 percent to reach generation 3.0. A similar if less pronounced pattern emerges in Thailand and Viet Nam: 17 percent of firms in Thailand and 24 percent of firms in Viet Nam expect to reach generation 4.0. While in Thailand and
Viet Nam, an increased share of users of generation 2.0 technologies replaces those currently using gen-eration 1.0, in the Latin American countries, the share of generation 2.0 users decreases in favour of a larger share using higher technological generations (3.0 and 4.0). Ghana turns out quite different: 32 percent of firms expect to be at the most advanced generation 4.0 in 5–10 years. This proportion appears very large com-pared with the current 0 percent of firms at generation 4.0 in Ghana and also compared with the expected level of adoption of generation 4.0 in both Thailand and Viet Nam.
Are firms taking steps to upgrade technology?The expected increase in ADP technologies appears to be good news. But since such expectations require developing adequate capabilities, they require concrete actions. Are firms actually making efforts to prepare themselves for the future, such as planning and imple-menting actions to achieve the projected goals? How ready are firms to adopt and absorb the latest produc-tion technologies and to reach the projected genera-tion of digital technologies?
Figure 3.5 The main obstacles to adopting ADP technologies reflect county-specific challenges
Ghana Viet Nam Thailand
Low competition in the market
Lack of infrastructure
Stringent regulations
Lack of capital/funds
Lack of human resources
Lack of digital culture
Lack of awareness
Long time to recover investments
Difficult to estimate benefits
Share of firms reporting as main obstacle (percent)
0 20 40 60 0 20 40 600 20 40 60
Small firms(fewer than 100 employees)
Large firms(100 or more employees)
All firms
Note: For Argentina and Brazil no information is available on the main obstacles to the adoption of ADP technologies, due to the structure of their survey questionnaires. For each category, the figure shows the share of firms reporting it as the main obstacle to adopting ADP technologies (multiple answers not allowed). See Annex A.3 for more detailed information on sample composition and the methodology of the UNIDO survey.Source: UNIDO elaboration based on data collected by the UNIDO firm-level surveys “Adoption of digital production technologies by industrial firms.”

104
ho
w m
An
uFA
Ct
ur
ing
Fir
ms
CA
n A
bs
or
b A
nd
ex
Plo
it Ad
vA
nC
ed
dig
itAl P
ro
du
Ct
ion
te
Ch
no
log
ies
3
“A small proportion of firms are ready to leapfrog to the most advanced digital production technologies
The picture is mixed of firms’ steps to upgrade technologyCrossing the information about firms expecting to adopt the highest technological generations (genera-tion 3.0 and 4.0) with the information about plans to achieve them produces a mixed picture (Figure 3.7). In Ghana, the projected technological level is not matched by plans or by actions. In Thailand and Argentina, similarly, most firms currently do not have plans or actions being executed. In Viet Nam, how-ever, three quarters of firms expecting to use genera-tions 3.0 or 4.0 have plans or are already implementing them. Brazil falls in between, with most firms having plans available or in execution.
Firms can be classified according to their digital readinessThe UNIDO Digitalization Readiness Index (DRI) was developed to estimate firm readiness for ADP technologies.13 It summarizes how well a firm is
equipped to face the challenges associated with digi-talization and measures the firm’s technological dyna-mism. Inspired by Abramovitz (1986), the index assesses three categories of digital readiness. The most dynamic firms, classified as forging ahead, are currently endowed with the ADP technologies (generation 4.0) or are ready to leapfrog to them and have solid action plans in place. Catching up firms are in between: they intend to evolve from a low to a more advanced digi-tal production technology, but their efforts are at an infant stage. Lagging behind firms currently adopt less advanced production technologies, have no plans of advancement or have plans not backed by concrete actions.
Few firms expect to leapfrogOnly a small proportion of firms are ready to leapfrog to the most advanced digital production technologies. Just
Figure 3.6 Firms expect a marked increase in adopting ADP technologies in the next 5 to 10 years
0
25
50
75
100
BrazilArgentinaThailandViet NamGhana
Shar
e of
firm
s pr
ojec
ting
to a
dopt
tech
nolo
gica
l gen
erat
ions
(per
cent
)
Generation 1.0 Generation 2.0 Generation 3.0 Generation 4.0
25
14
42
20
24
14
18
44
17
23
27
32
32
32
15
20
45
7
34
15
Note: Countries are ordered according to the shares of firms currently adopting the highest generations of digital technologies (generations 3.0 and 4.0). See Annex A.3 for more detailed information on sample composition and the methodology of the UNIDO survey, including the definition of technological generations applied in the survey questionnaires.Source: UNIDO elaboration based on data collected by the UNIDO firm-level survey “Adoption of digital production technologies by industrial firms” (for Ghana, Thailand and Viet Nam) and Albrieu et al. (2019) and Kupfer et al. (2019) (for Argentina and Brazil).
Figure 3.7 Many firms do not yet have plans available or in execution to achieve the highest technological generations in the next 5 to 10 years
0
25
50
75
100
Viet NamBrazilArgentinaThailandGhana
Shar
e of
firm
s re
port
ing
actio
ns (p
erce
nt)
No action Initial studies Plan available but not implemented Plan in execution
65231374
22
36
29
38
20
2
13
4543
67
12
28
13
139
Note: Data include only firms that expect to achieve technological generations 3.0 or 4.0 in the next 5 to 10 years. Countries are ordered according to the shares of firms having plans in execution. See Annex A.3 for more detailed information on sample composition and the methodology of the UNIDO survey, including the definition of technological generations applied in the survey questionnaires.Source: UNIDO elaboration based on data collected by the UNIDO firm-level survey “Adoption of digital production technologies by industrial firms” (for Ghana, Thailand and Viet Nam) and Albrieu et al. (2019) and Kupfer et al. (2019) (for Argentina and Brazil).

105
ho
w m
An
uFA
Ct
ur
ing
Fir
ms
CA
n A
bs
or
b A
nd
ex
Plo
it Ad
vA
nC
ed
dig
itAl P
ro
du
Ct
ion
te
Ch
no
log
ies
3
“More technologically dynamic firms have higher capabilities
7.3 percent can be classified as forging ahead, 38.8 per-cent as catching up and 63.9 percent as lagging behind.
Each country has a unique digital readiness profile, and the differences among them are considerable (Figure 3.8). In Argentina, Ghana, Thailand and Viet Nam, the majority of firms belong to the lagging behind category. In Argentina and Viet Nam, the proportion of forging ahead firms is larger than in Ghana and Thailand. In Viet Nam, the share of catching up firms is larger than in Ghana and Thailand due to concrete plans for adopting more advanced technologies (see Figure 3.7). In Brazil, forging ahead and catching up firms represent the large majority, confirming that country’s faster introduction of ADP technologies (see Figure 3.1).
Digital readiness and human capitalThe more complex a digital solution, the more com-plex the capabilities required. Since the categories of
digital readiness mirror the sophistication of firms’ capabilities, they are expected to mirror firms’ human capital composition.
Firms with higher technological intensity and larger firms have more STEM professionalsMore technologically dynamic firms have higher capa-bilities. This is reflected in a larger share of STEM professionals14 among firms in the forging ahead and catching up categories. The shares of STEM employees are systematically higher for these firms, regardless of country, size or sector (Figure 3.9).
Moreover, in all the countries considered, large firms on average have a higher share of STEM employ-ees, consistent with their greater resources and higher capacity to recruit labour with more advanced and more specific qualifications. Since the need for employ-ees with STEM qualifications can vary depending on
Figure 3.8 Few firms are ready to leapfrog to ADP technologies
0 20 40 60 80 100
Laggingbehind
Catching up
Forgingahead
0 20 40 60 80 100 0 20 40 60 80 100
Share of firms by readiness category (percent)
Argentina
Thailand
Brazil Ghana
Viet Nam
0 20 40 60 80 100
Laggingbehind
Catching up
Forgingahead
0 20 40 60 80 100
Share of firms by readiness category (percent)
Note: The figure presents the distribution of firms in three readiness categories (forging ahead, catching up, lagging behind) according to their score in the UNIDO Digitalization Readiness Index (DRI). See Annex A.3 for more detailed information on sample composition and the methodology of the UNIDO survey.Source: UNIDO elaboration based on data collected by the UNIDO firm-level survey “Adoption of digital production technologies by industrial firms” (for Ghana, Thailand and Viet Nam) and Albrieu et al. (2019) and Kupfer et al. (2019) (for Argentina and Brazil).

106
ho
w m
An
uFA
Ct
ur
ing
Fir
ms
CA
n A
bs
or
b A
nd
ex
Plo
it Ad
vA
nC
ed
dig
itAl P
ro
du
Ct
ion
te
Ch
no
log
ies
3
“ Forging ahead and catching up firms may create more opportunities for female STEM professionals
the firm’s main activity, firms operating in TDI indus-tries display higher shares of STEM employees.
Increasing women’s equitable participation is necessary to promote inclusive and sustainable industrial developmentUNIDO recognizes the importance of a comprehen-sive debate on the relationship between gender and advanced production technologies in manufacturing. As discussed in Chapter 2, increasing women’s equi-table participation in the industrial workforce is nec-essary to promote inclusive and sustainable industrial development (ISID, UNIDO 2019d). With evidence from developing countries particularly scarce, the survey data collected for this report provide new and original inputs for a more evidence-based discussion.
Some general patterns of female employment emerge (Figure 3.10).15 The share of female employ-ees tends to be on average lower in forging ahead and catching up firms. Although this result may confirm the gender segregation of the labour market, where female workers are less likely to be hired by the most technologically dynamic firms, those firms tend to employ a larger share of female employees with STEM qualifications. Thus, firms that are classified as forging ahead and catching up may create more opportunities for female STEM professionals by offering better jobs for more qualified women.
Implications of ADP technologies
Productivity
Firms adopting advanced technologies have higher productivityFirms adopt new technologies mostly due to expected gains in competitiveness and efficiency (see Chapter 1). The UNIDO survey data confirm that firms adopting advanced technologies enjoy a higher level of produc-tivity (Figure 3.11). This result holds across countries, and controlling for firm size and sector: large firms and firms belonging to TDI sectors using the high-est generations of digital production technologies (3.0 and 4.0) enjoy a higher level of productivity, but so do
Figure 3.9 Firms in the forging ahead and catching up categories have a larger share of STEM employees
0.6
0.8
1.0
1.2
1.4
1.6
Non-STEMSTEM
Rela
tive
shar
e of
em
ploy
ees
by c
ateg
ory
(cou
ntry
ave
rage
= 1
)
Forging ahead and catching up firmsOther firms
Note: STEM is science, technology, engineering and mathematics. Data refer to firms surveyed in Ghana, Thailand and Viet Nam. See Annex A.3 for more detailed information on sample composition and the methodology of the UNIDO survey.Source: UNIDO elaboration based on data collected by the UNIDO firm-level surveys “Adoption of digital production technologies by industrial firms.”
Figure 3.10 Firms in the forging ahead and catching up categories have a higher female share of employees with STEM qualifications
0.6
0.7
0.8
0.9
1.0
1.1
1.2
Female shareof non-STEM employees
Female shareof STEM employees
Female shareof employees
Forging ahead and catching up firmsOther firms
Rela
tive
fem
ale
shar
e of
em
ploy
ees
by c
ateg
ory
(cou
ntry
ave
rage
= 1
)
Note: STEM is science, technology, engineering and mathematics. Data refer to firms surveyed in Ghana, Thailand and Viet Nam. See Annex A.3 for more detailed information on sample composition and the methodology of the UNIDO survey.Source: UNIDO elaboration based on data collected by the UNIDO firm-level surveys “Adoption of digital production technologies by industrial firms.”

107
ho
w m
An
uFA
Ct
ur
ing
Fir
ms
CA
n A
bs
or
b A
nd
ex
Plo
it Ad
vA
nC
ed
dig
itAl P
ro
du
Ct
ion
te
Ch
no
log
ies
3
“Adoption of ADP technologies was positively and significantly associated with firm productivity
small firms and those belonging to other sectors when they adopt these technologies. The positive firm-level relationship confirms what was found at the aggregate level, where a higher diffusion of ADP technologies is associated with better country-level economic perfor-mance (see Figure 1.18 in Chapter 1).
The technology–productivity relation holds regardless of human capital and GVC participationA further econometric analysis investigated whether firms with a higher level of digitalization in production were, on average, more productive when controlling for other factors. The intensity of adoption of ADP technologies was positively and significantly associ-ated with firm productivity, even when controlling for a firm’s age, investments in R&D and machinery, human capital and GVC participation. Technology adoption’s coefficient is large compared with the coef-ficients of other significant factors (Figure 3.12).16
Organization of global production
ADP may also increase asymmetries between actors in developed and developing countriesDespite the hype about their potential, advanced industrial technologies should arouse caution and calls for moderation (European Commission 2016, OECD 2017). In Chapters 1 and 2, changes in the labour markets, barriers to access to the technolo-gies and an eventual increased market concentration were identified as the main drawbacks. For firms par-ticipating in GVCs, threats from supply chain reor-ganization, delocalization of production and back-shoring must be added. As argued by Mayer (2018), digitalization may be ambivalent if it increases asym-metries between actors in developed and developing countries.
Figure 3.11 Across sectors and sizes, firms adopting ADP technologies display higher productivity
0.6
0.8
1.0
1.2
1.4
Large firms(100 or moreemployees)
Small firms(fewer than 100
employees)
TDI industriesOther industries
Rela
tive
prod
uctiv
ity (c
ount
ry-g
roup
ave
rage
= 1
)
Generation 0.0, 1.0 and 2.0Generation 3.0 and 4.0
Note: TDI is technology- and digital-intensive. Data refer to firms surveyed in Ghana, Thailand and Viet Nam. The figure shows the difference in average productivity level for all firms in the country and by industry and firm size. TDI industries include automotive and auto parts, and electronics. Other sectors include food and beverages; textile, leather and footwear; plastic and rubber; metal products; and wood and furniture. See Annex A.3 for more detailed information on sample composition and the methodology of the UNIDO survey, including the definition of technological generations applied in the survey questionnaires.Source: UNIDO elaboration based on data collected by the UNIDO firm-level surveys “Adoption of digital production technologies by industrial firms.”
Figure 3.12 The adoption of ADP technologies is associated with productivity more strongly than other firm characteristics are
0.0
0.4
0.8
1.2
1.6
Advanceddigital
productiontechnologies
Foreignownership
Investmentsin R&D andmachinery
Firmsize
Skilledhumancapital
Globalvalue chain
participation
Age
Mar
gina
l effe
ct o
n la
bour
pro
duct
ivity
Note: The graph depicts the coefficients, with confidence intervals (at 90 percent), of the variables of interest with labour productivity, obtained through regression analysis on the firms surveyed in Ghana, Thailand and Viet Nam. The variable “Advanced digital production technologies” is a binary variable that takes the value of 1 if a firm is using generation 3.0 or 4.0 technologies, 0 otherwise. Country and sector dummies are included.Source: UNIDO elaboration based on Pietrobelli et al. (2019), derived from the data collected by the UNIDO firm-level surveys “Adoption of digital production technologies by industrial firms.”

108
ho
w m
An
uFA
Ct
ur
ing
Fir
ms
CA
n A
bs
or
b A
nd
ex
Plo
it Ad
vA
nC
ed
dig
itAl P
ro
du
Ct
ion
te
Ch
no
log
ies
3
“ Firms in developing countries may be harmed by the progressive diffusion of ADP technologies in advanced economies
Digitalization could increase oligopoly and power concentration in GVCsFirms in developing countries may be harmed by the progressive integration of ADP technologies into GVCs if they increase barriers to access. As the increased digi-tal integration of systems through software platforms affects the structure of GVCs, concerns arise about coordination and governance mechanisms, possibly increased concentration of power and more oligopolis-tic and monopolistic market settings in fully digitalized supply chains (Andreoni and Anzolin 2019).
ADP technologies could foster backshoringFirms in developing countries may also be harmed by the progressive diffusion of ADP technologies in advanced economies. For advanced countries, the ear-lier drawbacks of lost manufacturing jobs could be softened by the expectations that ADP technologies may bring production back (backshoring or reshoring) and reboost manufacturing production. New cheap capital machinery and robots replacing manual work could induce companies to return production to high-income countries close to big consumer markets. This phenomenon could counterbalance previous decades’ extension of GVCs to decentralize production from high-income countries to lower-income countries for activities requiring low skills and low salaries, such as assembly. For developing countries, the lost relevance of cheap labour as a comparative advantage and the increased backshoring to industrialized countries could take away manufacturing and reduce employ-ment creation (Rodrik 2018).
Not much backshoring is evidentBeyond hypotheses and anecdotal examples, general evidence of actual backshoring is still scarce, so draw-ing conclusions on the ultimate impact on developing country employment and designing sound policies to address it is difficult. Empirical work using European Manufacturing Survey data (EMS 2015) of firms for eight European countries (Austria, Croatia, Germany, the Netherlands, Serbia, Slovenia, Spain and Switzerland) analyses the extent and determinants
of backshoring.17 The sample is composed of about 2,500 firms of different sizes. Three findings clearly emerge. First, backshoring is not as widespread as per-ceived in the media and in the policy debate: 5.9 per-cent of all firms have backshored, while 16.9 percent have offshored. Second, labour cost is not the main reason firms backshore from emerging economies, but it is important in backshoring from other high-income countries (Figure 3.13). Flexibility in logistics appears to be the main reason for backshoring from emerging economies. This finding is surprising, since in the current debate, the fear of job displacement due to advanced technologies relates to introducing cheap machines or robots that can replace human labour by further reducing production costs. Third, backshoring is more frequent for certain sectors (chemical industry, machinery, electrical industry or transport equipment — rather than low-technology sectors) and for firms more intensively adopting advanced digital technolo-gies. So, adopting ADP technologies might prompt backshoring, though not frequently.
Environmental sustainabilityTechnological change may benefit the environment. A previous edition of the UNIDO IDR showed that high-income countries tended to be more environ-ment-friendly than low-income countries in energy intensity (UNIDO 2011) and possess more environ-ment-friendly technology.
Technologically dynamic firms are optimistic about environmental improvementsIn Ghana, Thailand and Viet Nam, in all environmen-tal domains — water, energy, materials and waste — the majority of firms in the forging ahead and catching up categories agree that ADP technologies can lead to environmental improvements leading to efficiency and productivity gains (Figure 3.14). Waste management is complex, with different approaches from the least to the most environment-friendly represented by waste mini-misation18. The IDR 2018 pointed out that efficiency and productivity increases could bring reduced prices and increased demand (UNIDO 2017c). Efficient use of

109
ho
w m
An
uFA
Ct
ur
ing
Fir
ms
CA
n A
bs
or
b A
nd
ex
Plo
it Ad
vA
nC
ed
dig
itAl P
ro
du
Ct
ion
te
Ch
no
log
ies
3
“Adopting ADP technologies might prompt backshoring, though not frequently
materials means sustainability, but also savings that can trigger further expenditures and multiplier effects for firms and generate rebound effects, increasing economic activity and thus environmental impact.
Employment and skillsThe impact of ADP technologies on employment tends to be controversial (Chapters 1 and 2). Whereas the policy debate stresses the risk of displacing labour with digital technologies, this report emphasizes the mechanisms by which new technologies can boost employment rather than reducing it. The report offers innovative insights on the possible complementarity of ADP technologies and labour — for instance, the introduction of robots can stimulate forward and backward linkages (Chapter 2).
Technologically dynamic firms anticipate stable employmentThe survey data collected show that firms in the forg-ing ahead and catching up categories expect to keep the same level of employment or even increase it as a consequence of ADP technology (Figure 3.15). This holds in all the business functions of firms in
Figure 3.13 Flexibility was the main motive of backshoring from emerging economies in 2013–2015
Labour cost
Lack of infrastructure
Loss of know-how
Vicinity to R&D at home
Lack of qualified personnel
Coordination costs
Unemployed capacity at home
Transport cost
Quality
Flexibility in logistics
Emerging economiesHigh-income economies
Share firms reporting as motives of backshoring (percent)
0 25 50 75 100
Note: The survey, conducted in 2013–2015, included 2,448 European firms with at least 20 employees from Austria, Croatia, Germany, the Netherlands, Serbia, Slovenia, Spain and Switzerland. Only firms engaged in backshoring are considered. Multiple answers are allowed.Source: Dachs and Seric (2019), based on the European Manufacturing Survey (EMS 2015).
Figure 3.14 The majority of firms in the forging ahead and catching up categories agree that ADP technologies will lead to environmental improvements
0
20
40
60
80
100
Saving energySaving materialsMinimizing wasteSaving water
Shar
e of
firm
s de
clar
ing
that
in 5
to 1
0 ye
ars
ADP
tech
nolo
gies
will
hav
e a
high
or v
ery
high
con
tribu
tion
in im
prov
ing
envi
ronm
enta
l sus
tain
abili
ty (p
erce
nt)
Note: Data refer to firms surveyed in Ghana, Thailand and Viet Nam and include only firms classified as forging ahead and catching up. See Annex A.3 for more detailed information on sample composition and the methodology of the UNIDO survey.Source: UNIDO elaboration based on data collected by the UNIDO firm-level surveys “Adoption of digital production technologies by industrial firms” and Kupfer et al. (2019).

110
ho
w m
An
uFA
Ct
ur
ing
Fir
ms
CA
n A
bs
or
b A
nd
ex
Plo
it Ad
vA
nC
ed
dig
itAl P
ro
du
Ct
ion
te
Ch
no
log
ies
3
“Soft skills are projected to become very important, according to almost all technologically dynamic firms
Argentina, Ghana, Thailand and Viet Nam. The find-ings also robust across countries and firm size.
Technologically dynamic firms emphasize skills related to STEM, human–machine interaction and soft skillsBut ADP technologies are also changing the nature of employment. The survey data collected show that the job market increasingly emphasizes STEM-related skills and human–machine interaction. Skills required for routine activities will be less relevant than other skills. Surprisingly, soft skills are projected to become very important according to almost all technologically dynamic firms (Figure 3.16). The reason may be that many new technologies promise to require employees to work as well-integrated teams and to learn proce-dures and systems rapidly. As seen in Chapter 2, the
gender gap in soft skills is smaller than the gap in ana-lytical skills. Thus, women could take this job market trend favouring soft skills as an opportunity, aligning with men on soft skills more easily than on STEM or other analytical skills.
Getting the most out of it: Capabilities for industrializing in the digital age
Building production capabilities through industrial experience
Production capabilities represent firm manufacturing learningAs discussed at the beginning of this chapter, capa-bilities can broadly be divided into investment and
Figure 3.15 The majority of firms in the forging ahead and catching up categories expect to increase or keep the same number of employees as they adopt ADP technologies
Production process
Relationship with suppliers
Customer service
General business andmanagement operations
Product development
All business functions
Expected to decrease Expected to increase No expected change
Distribution of firms by expected impact on thenumber of employees in 5 to 10 years (percent)
0 20 40 60 80 100
Note: Data refer to firms surveyed in Argentina, Ghana, Thailand and Viet Nam and include only firms classified as forging ahead and catching up. See Annex A.3 for more detailed information on sample composition and the methodology of the UNIDO survey.Source: UNIDO elaboration based on data collected by the UNIDO firm-level survey “Adoption of digital production technologies by industrial firms” (for Ghana, Thailand and Viet Nam) and Albrieu et al. (2019) and Kupfer et al. (2019) (for Argentina).
Figure 3.16 The majority of firms in the forging ahead and catching up categories agree that soft skills are expected to be very important in future hiring
Skills for manual andrepetitive tasks
Skills related to STEM
Skills related to human–machine interaction
Soft skills
Future importance Current importance
Share of firms declaring that specific skills will have a high or very highimportance on the decision of hiring an employee (percent)
0 20 40 60 80 100
Note: STEM is science, technology, engineering and mathematics. Data refer to firms surveyed in Argentina, Ghana, Thailand and Viet Nam and include only firms classified as forging ahead and catching up. See Annex A.3 for more detailed information on sample composition and the methodology of the UNIDO survey.Source: UNIDO elaboration based on data collected by the UNIDO firm-level survey “Adoption of digital production technologies by industrial firms” (for Ghana, Thailand and Viet Nam) and Albrieu et al. (2019) and Kupfer et al. (2019) (for Argentina).

111
ho
w m
An
uFA
Ct
ur
ing
Fir
ms
CA
n A
bs
or
b A
nd
ex
Plo
it Ad
vA
nC
ed
dig
itAl P
ro
du
Ct
ion
te
Ch
no
log
ies
3
“Production capabilities increase innovation performance
technology capabilities (for skills, R&D, capital expenditures and national innovation systems) and production capabilities (expectations and behav-ioural factors) (Table 3.3). The production capa-bilities represent learning from repeated operations within the firm, and they are correlated with past success, experience and managerial skills and behav-ioural factors. Variables representing previous success (patents, exports) capture the accumulated learning. Managerial experience and behavioural intentions explain the adoption of technology because they proxy the soft skills needed to implement change in organizations and production. Production capabili-ties are thus intrinsically related to introducing and developing industrial processes with technological content.
The policy debate should focus on production capabilitiesThe policy debate so far has focused mostly on invest-ment and technology capabilities. Although those capabilities are relevant for ADP technologies uptake, this report shows that policy should pay more atten-tion to production-related aspects and associated pro-duction capabilities. An analysis of 13 African coun-tries and four South Asia countries19 using the World Bank Enterprise Survey concluded that production capabilities are the most important determinant in adopting new technological process innovations (Figure 3.17).20
Combined, investment and technology and production capabilities lead to innovationThis does not mean that investment and technol-ogy variables did not matter in the analysis. While production capabilities are always important for adopting technological process innovations, invest-ment and technology capabilities fully disclose their importance when combined with production capa-bility variables. Firms where both investment and technology, and production variables were opera-tional had a higher probability of adopting new pro-cesses than firms where only one kind of variable was active.
Production capabilities explain the importance of earlier industrial experience to innovationThe importance of production capabilities is some-what surprising, given the attention the literature has traditionally dedicated to technology variables in explaining technological change. This finding has implications for other findings of this report (see
Investment and technology capabilities Production capabilities
Acquired through market or other institutions — for example, human capital, R&D expenditure, information received through markets or other institutions of the national system of innovation
Produced by learning inside the firm and correlated with past success (exports, past innovations), experience and managerial skills and behavioural factors (intention to innovate, expectations)
Source: Bogliacino and Codagnone 2019.
Table 3.3 Investment and technology and production capabilities
Figure 3.17 Production capabilities are key for the adoption of technological process innovation
0.0
0.1
0.2
0.3
0.4
0.5
Investment and technology,and production capabilities
Productioncapabilities
Investment andtechnology capabilities
Prob
abili
ty o
f ado
ptio
n of
pro
cess
inno
vatio
n
Note: The analysis includes 13 African economies (Democratic Republic of Congo, Ghana, Kenya, Malawi, Namibia, Nigeria, Rwanda, South Sudan, Sudan, Tanzania, Uganda, Zambia and Zimbabwe) and 4 South Asian economies (Bangladesh, India, Nepal and Pakistan). Only manufacturing firms are included. The graph depicts coefficients and confidence intervals (at 95 percent) for the average marginal effects of the variables of interest on the probability of adopting a process innovation. A linear probability model was implemented, with bootstrapped standard errors. Country and sector dummies are included.Source: UNIDO elaboration based on Bogliacino and Codagnone (2019) derived from the World Bank Enterprise Survey (Innovation Follow-up, 2013–2014).

112
ho
w m
An
uFA
Ct
ur
ing
Fir
ms
CA
n A
bs
or
b A
nd
ex
Plo
it Ad
vA
nC
ed
dig
itAl P
ro
du
Ct
ion
te
Ch
no
log
ies
3
“Production capabilities have to be built up before moving into high innovation activities
Chapter 1) and supports the idea of industrialization as an engine of growth. If production capabilities are intrinsically related to introducing and developing industrial processes with technological content and to consequent technological and production learning, technology is an opportunity found where industriali-zation has already happened.
Production capabilities help firms both with and without human capital and R&DThe message is twofold. Production capabilities are key: experience, previous success and the accumulated knowledge base are crucial to generating the ena-bling conditions to innovate and adopt new produc-tion technologies. Moreover, both for firms that lack investment in human capital and R&D, and those that have it, production capabilities increase innova-tion performance. Thus, despite being critical, tech-nological integration in itself may not be sufficient to deliver the productivity gains from ADP technologies. The problem many companies in developing countries face is that deploying integrated technologies requires advanced capabilities for production and organization. In line with the approach of the capability roadmap presented in Table 3.1, production capabilities have to be built up before moving into learning processes and high innovation activities. But emerging countries appear to be following a well-established technology-first trajectory, suggesting that the technological gap is likely to persist.
Digitalization and innovation
Digitalization and innovation enable the adoption of ADP technologyDo firms in developing countries have a comprehen-sive set of investment, technology and production capabilities enabling them to adopt ADP technology? This section focuses on digitalization and innovation using data from the World Bank Enterprise Surveys on 11 African countries and four South Asian coun-tries.21 It distinguishes firms with different degrees of capabilities, differentiating their ability to move
towards industrial digitalization. The analysis helps identify the current capabilities of developing country firms, their position in the hierarchy of technologi-cal competences, the extent of their digital activities and their potential for becoming full players in ADP technologies.
Highly innovative firms may be candidates for the uptake of ADP technologiesFour categories of firms — digital leading firms, highly innovative firms, product innovation firms and nonin-novating firms — can be distinguished (Table 3.4). Digital leading firms are characterized by strict digi-tal criteria and innovation activities, reflected in the presence of product innovation, process innovation, automation and R&D expenditures. These activities show the presence of the investment, technology and production capabilities discussed above. Given their capabilities, these firms may be in a position to adopt advanced production technologies. Highly innovative firms are characterized by innovation activities such as product and process innovation, R&D investment and some dimensions of digitalization. Highly innovative
Firm categories Characteristics
Digital leaders Product innovationProcess innovationAutomationR&D expendituresDigital characteristics: (1) presence of employees using computers, (2) purchase or in-house development of software, (3) presence of employees working on information technology, (4) use of computer consultants, (5) use of internet for all business activities
Highly innovative
Product innovationProcess innovationAutomationR&D expenditures
Product innovators
Product innovation
Noninnovators
Source: Pianta 2019.
Table 3.4 Characteristics of firm categories

113
ho
w m
An
uFA
Ct
ur
ing
Fir
ms
CA
n A
bs
or
b A
nd
ex
Plo
it Ad
vA
nC
ed
dig
itAl P
ro
du
Ct
ion
te
Ch
no
log
ies
3
“Digital firms are a niche in developing countries
firms may also be good candidates to adopt new tech-nologies, since they display the technology capabilities needed to prepare to use more advanced technologies.
Digital firms are a niche in developing countriesThe group of digital leaders is not large in the con-sidered sample countries. But in digital leader firms, there is a strong relation between capabilities and performance.
Digital leaders in India generate high exports and sustain employmentThe experience of India — a country actively engaging with ADP technologies (see Chapter 1) — can dem-onstrate the relationship between digitalization and various performance measures (Figure 3.18). The digi-tal leading firms and the highly innovative firms are better represented in the TDI industries and have the highest share of exporting firms and highest level of exports per capita. More innovation and digital activi-ties are associated with higher employment generation, while less innovative firms consistently are less pre-sent in digital industries and create less employment. Innovation and digitalization are not necessarily asso-ciated with lower employment: the majority of digital leading and highly innovative firms are experiencing
an increase of skilled employment. And the digi-tal leading firms are also experiencing an increase of unskilled employment. Even so, technological change could be negatively affecting employment, if that neg-ative effect were being counterbalanced by demand effects increasing production and thus employment demand.
Firms’ classification mirrors their technological and production hierarchyThe classification of firm categories appears to solidly represent the technological and production hierarchy of firms (Table 3.5), showing how they have taken a first step. The results of the analysis reinforce the need for a mix of production and investment and technol-ogy capabilities in order to upgrade.
Some top industrial firms are becoming top digital firmsDigital leading firms, the élite of technological play-ers, comprise between 0.1 percent and 3.0 percent of firms in considered countries (see Table 3.5). Thus only a few firms in each country fall in this group. Some firms in the emerging and developing countries are now moving from being top performers in indus-trial production capabilities to entering the club of top firms in technological and digital capabilities. A
Figure 3.18 Digital leaders show a better performance in terms of presence in TDI industries, export and employment generation
Shar
e of
firm
s in
crea
sing
num
ber o
f ski
lled
wor
kers
as a
con
sequ
ence
of p
rodu
ct in
nova
tion
(per
cent
)
a. Digitalization and skilled employment b. Export orientation
Expo
rt pe
r em
ploy
ee (t
hous
and
rupe
es)
Share of firms in TDI industries (percent) Share of exporting firms (percent)
Product innovators
Highly innovativeDigital leaders
Product innovators
Non-innovators
Digital leadersHighly innovative
0
200
400
600
800
0.0 0.1 0.2 0.3 0.40.0 0.1 0.2 0.30.0
0.2
0.4
0.6
Note: TDI is technology- and digital-intensive. Data include only manufacturing firms in India. TDI industries include machinery, electronics and information and technology services.Source: Pianta (2019) based on World Bank Enterprise Survey (Innovation Follow-up, 2013–2014).

114
ho
w m
An
uFA
Ct
ur
ing
Fir
ms
CA
n A
bs
or
b A
nd
ex
Plo
it Ad
vA
nC
ed
dig
itAl P
ro
du
Ct
ion
te
Ch
no
log
ies
3
“Manufacturing tends to be the key sector for innovation
rigorous selection for that club, however, appears to require not just strong efforts by individual firms but also a national system able to support the technologi-cal upgrading of enterprises, including a large country size, a diversified industrial base with strong manufac-turing capabilities, well-functioning institutions and educational and public policy systems.
16 percent of firms in India and Bangladesh are classified as highly innovativeHighly innovative firms appear to be a relevant share of firms in several developing countries: 17 percent in India, 16 percent in Bangladesh, 11 percent in Kenya and 10 percent in Nigeria. And some African countries have fairly high shares. Product innovators range between 50 percent in India to 46 percent in Bangladesh, 33 percent Kenya, 27 percent in Nigeria and 23 percent in Pakistan, while high shares are also found in some African countries. Noninnovators range from 83 percent in Nepal to 31 percent in India. Overall, the potentially highly performing firms char-acterized by strong capabilities — the digital leaders and highly innovative firms — is a minority.
The manufacturing sector has the lion’s share of technologically advanced firmsManufacturing tends to be the key sector for innova-tion, though the analysis also includes service indus-tries. In India, 88 percent of all firms belonging to the digital leaders group are in the manufacturing sector, in Nigeria, 75 percent and in Kenya, 50 per-cent. In India 94 percent of highly innovative firms are in manufacturing, in Pakistan, 92 percent and in Kenya, 58 percent. This result is hardly surprising: as the IDR 2016 showed, the manufacturing sector normally has higher levels of R&D and innovation expenditures. This has traditionally been considered a key explanation in the academic and policy debate of manufacturing’s prominence as an engine of economic growth (Kaldor 1961).
Mostly — but not only — large firmsDigital leaders are not necessarily large firms. Large firms are conspicuously associated with frontier tech-nology because they can afford high levels of R&D expenditures, have more experience and can more easily form partnerships or prompt government
Country Digital leaders Highly innovative Product innovators Noninnovators
Bangladesh 0.70 15.91 46.32 37.08
Congo, Dem. Republic of 0.55 10.38 30.60 58.47
Ghana 0.35 7.80 18.79 73.05
India 1.69 16.81 50.33 31.17
Kenya 0.71 11.39 33.45 54.45
Malawi 2.99 20.90 35.82 40.30
Namibia 0.00 15.87 31.75 52.38
Nepal 0.43 2.13 14.47 82.98
Nigeria 0.75 9.95 27.36 61.94
Pakistan 0.00 2.07 22.63 75.30
South Sudan 1.22 6.10 63.41 29.27
Sudan 1.06 5.32 32.98 60.64
Tanzania, United Republic of 0.00 0.74 17.65 81.62
Uganda 2.88 9.13 44.71 43.27
Zambia 0.00 15.30 45.15 39.55
Note: Only manufacturing firms are included.Source: Pianta 2019.
Table 3.5 Share of firm categories in 15 developing countries
115
ho
w m
An
uFA
Ct
ur
ing
Fir
ms
CA
n A
bs
or
b A
nd
ex
Plo
it Ad
vA
nC
ed
dig
itAl P
ro
du
Ct
ion
te
Ch
no
log
ies
3
“Smaller firms can share in new technology adoption if they find digital niches connected to expanding markets and GVCs
interventions. Large firms are also important for innovation in developing countries, where the eco-nomic structure tends to be more polarized than in advanced economies (Pianta 2019). In India, 60 per-cent of digital leaders are large enterprises with more than 100 employees, according to World Bank Enterprise Survey results. Such results are consistent
with those reported above highlighting the leading role of large firms in ADP adoption. But in all coun-tries, a few SMEs occupy niches of digital success. So, smaller firms can share in new technology adop-tion if they find digital niches connected to expand-ing product markets and GVCs guided by dynamic large firms.
Notes1. This section is based on Andreoni and Anzolin
(2019).2. Systemic capabilities (or social capabilities) include a
broad range of context-specific factors, such as regula-tions and institutions, a financial system, knowledge creation and education networks and infrastructure (Abramovitz 1986).
3. The case studies are presented in Calza and Fokeer (2019). See Chapters 1 and 2 of this report for Boxes with more details on specific firms.
4. This section is based on Albrieu et al. (2019) and Kupfer et al. (2019). See Annex A.3 for details of sur-veys and their methodology.
5. The questionnaire used is based on the one applied in Brazil in 2017 by the National Confederation of Industry (CNI) and replicated in Argentina in 2018 by Inter-American Development Bank Institute for the Integration of Latin America and the Caribbean (BID-INTAL) in cooperation with Centre for the Implementation of Public Policies Promoting Equity and Growth (CIPPEC) and the Argentine Industrial Union (UIA). More information on the definition of generations of digital technologies used in the survey questionnaires are reported in Annex A.3.
6. For Argentina and Brazil, no information on gen-eration 0.0 are available, due to the slightly differ-ent structure of the survey questionnaire. It is to be expected that the share of firms using only analogue technologies should be lower, given the average diffu-sion of higher technological generations.
7. Ghana is excluded from the comparison because the Ghanaian sample does not include any firm in TDI industries.
8. Moreover, interindustry differences are present across all technological generations, and not only in the most advanced ones. In other sectors in all considered coun-tries, a higher share of firms use generation 1.0.
9. Since the Brazilian sample includes only large firms with 100 or more employees, Brazil is excluded from the comparison.
10. The share of small firms using generation 1.0 is much larger than the share of large firms. But in Ghana, Thailand and Viet Nam, large firms tend to use genera-tion 2.0 technology more.
11. Information on GVC participation was collected only in Ghana, Viet Nam and Thailand. More details on topic coverage of individual country surveys are reported in Annex A.3.
12. For full results, see Pietrobelli et al. (2019).13. The methodology of the Digitalization Readiness
Index (DRI) is explained in Annex A.3.14. The survey conducted for this report asked firms
about the number of employees with university or college degrees who are poly-scientific professionals, as in natural sciences, physics, engineering or biologi-cal sciences. For simplicity, these employees are called STEM employees.
15. These figures on female employment confirm the larger female participation of women in formal labour markets in Thailand and Viet Nam: in surveyed firms around 50 percent of employees are women. However, female participation varies largely across countries: in Ghana it is around 30 percent. The lower share in Ghana may reflect the widespread informality of the economy, which would tend to draw most female workers into informal occupations.

116
ho
w m
An
uFA
Ct
ur
ing
Fir
ms
CA
n A
bs
or
b A
nd
ex
Plo
it Ad
vA
nC
ed
dig
itAl P
ro
du
Ct
ion
te
Ch
no
log
ies
3 16. Caution in interpreting this result is, however, neces-sary, as the coefficient of the variable “Advanced digital production technologies” is significant at 10 percent.
17. See Dachs and Seric (2019) for the details of this analysis.18. According to OECD (2000) waste minimization is
“Preventing and/or reducing the generation of waste at the source; improving the quality of waste generated, such as reducing the hazard, and encouraging re-use, recycling, and recovery.”
19. The Democratic Republic of Congo, Ghana, Kenya, Malawi, Namibia, Nigeria, Rwanda, Sierra Leone, South Sudan, Sudan, the United Republic of Tanzania, Uganda, Zambia and Zimbabwe in Africa and Bangladesh, India, Nepal and Pakistan in South Asia.
20. See Bogliacino and Codagnone (2019) for details about this empirical analysis.
21. This section is based on Pianta (2019).

117117
Few economies possess the required foundation of technological and manufacturing capabilitiesAs the ongoing technological and productive transfor-mations commonly associated with the fourth indus-trial revolution (4IR) continue to unfold, often in uncertain directions, few economies, particularly devel-oping ones, possess the required foundation of techno-logical and manufacturing capabilities to even attempt to lead the development of advanced digital production (ADP) technologies and smart manufacturing produc-tion. Differences in capabilities across countries, sectors and firms suggest that the individual ability to respond to challenges, and to capitalize on emerging opportu-nities, is uncertain — and a concern for countries where minimum conditions for industrialization are yet to take root. The systemic nature of the recent innovation dynamics — and of the impacts that can be associated with each of the technologies, or with combinations of them — will continue to challenge policy-makers, busi-nesses and academics for many years to come.
A capability-building approach helps to understand strategic responsesIn line with the general thrust of this report, this chap-ter adopts a capability-building approach to understand how strategic responses address distinct but intercon-nected policy areas — from manufacturing through innovation and education, to infrastructure and even international collaboration. The assumption is that dif-ferent countries respond differently, according to their accumulated capabilities, exposure and experience with manufacturing (UNIDO 2002, 2005, 2015). While the chapter focuses on developing countries, it draws selectively from industrialized countries’ experiences to contrast them with developing countries’.
National strategy documents signal efforts to build readinessCoordinated strategic responses are essential to identify and tackle opportunities that stem from
ADP technologies (Lee et al. 2019). National strat-egy documents signal, at least on paper, efforts to build readiness for the ongoing technological and productive transformations. The documents can provide a frame of reference in time and space — whether for a country, region, industry or firm — for actions to foster the momentum and effective implementation of smart manufacturing solutions and tools. Building on evidence from strategic docu-ments, roadmaps and white papers, this chapter dis-tils some general policy lessons that countries should take into account to make ADP technologies work for inclusive and sustainable industrial development (ISID).
Be wary of one-size-fits all solutionsA key message for policy-makers: Be wary of one-size-fits-all solutions. Despite the diversity of approaches to smart manufacturing in both developed and devel-oping countries, it is still difficult to identify ready-made models. Generally, responses remain at the trial stage, with distinct degrees of articulation in long-term national development strategies. And system-atic evaluations to inform recommendations are still pending.
Remember that it takes commitment and substantial resources to develop capabilitiesPolicy-makers, particularly in developing coun-tries, should remember that it takes commitment and substantial resources to develop the capabilities required to take up new technologies and assimilate any associated productive transformations (Lee 2019, Steinmueller 2001). Taking small but well-informed steps to test technological and policy options, accord-ing to the desired goals, is recommended before com-mitting fully to implementation. There is much room for further research and policy experimentation to learn and exchange policy lessons through enhanced international collaboration.
Chapter 4
Responding to advanced digital production technologies
118
re
sP
on
din
g to
Ad
vA
nC
ed
dig
itAl P
ro
du
Ct
ion
te
Ch
no
log
ies
4
“Different countries respond differently, according to their accumulated capabilities and exposure and experience with manufacturing
Characterizing strategic responses to ADP technologies
Trends underpinning the 4IR are expected to deepenSince the trends underpinning the 4IR are expected to deepen in coming years, countries at different stages of development are waiting to pursue them as they launch their roadmaps or full-fledged 4IR-inspired development strategies. Given this state of flux, it seems pertinent to review and discuss the trails fol-lowed and the decisions made by early adopters, while providing some useful leads to those policy-makers still grappling with questions about how to initiate their march towards 4IR.
Multistakeholder and participatory approaches are keyThe discussion aims to provide a minimum of guid-ance to those responsible for developing strategic responses to the challenges of ADP technologies applied to manufacturing — smart manufacturing production — with emphasis on elements of design, strategy formulation and implementation. What drives the preparation of such strategies? And how have they come into being? A key insight here is the greater importance of multi-stakeholder and partici-patory approaches. The evidence suggests diverse con-crete measures and tools deployed when implementing national strategies, and the approaches to follow and assess progress are equally diverse.
International collaboration and policy coordination can support developing countriesThe review of national strategies informs initiatives to support capability building of firms — particularly small and medium-sized enterprises (SMEs) — and particularly people. And in the spirit of United Nations Sustainable Development Goal (SDG) 17 “Partnerships for the goals,” the chapter illustrates how international collaboration and policy coordi-nation can support developing countries’ continued quest for industrialization in the new era of smart manufacturing.
National strategies reflect the extent of industrialization and capability accumulation…
Strategic responses to smart manufacturing are mixedStrategic responses to smart manufacturing are mixed across and within countries; they are highly contex-tual, reflecting the extent of industrialization, the pen-etration of digital infrastructure, the accumulation of technological and productive capabilities, the tradition of intervention in economic matters of national gov-ernments and the national priorities and capacities to mobilize public-private partnerships. The possibility for mixed strategies within a single country results in a complex policy space characterized by “twin policy problems” along a continuum: At one end are policies to sustain global manufacturing leadership — and at the other are interventions to cope with risks or, at best, create conditions for followers and latecomer agents to adapt and catch up (Figure 4.1). (See Annex A.4 for summaries of 11 countries’ plans and strategies.)
Frontrunners strive to forge aheadStrategic responses reflect differences in the size of the economy and domestic markets, the strength of domestic manufacturing, the adoption of industrial automation and the means to achieving intended objectives. For frontrunners (see Chapter 1), policies to sustain or regain industrial leadership (Santiago 2018, Santiago and Horst 2018) and to pursue eco-nomic, social and environmental goals are common (Digital Transformation Monitor 2017, Liao et al. 2018). These countries generally intend to use ADP technologies and related concepts as drivers of eco-nomic transformation and to remain at the frontier of technological and industrial capabilities (Box 4.1).1
China quickly joined the frontrunnersWhereas highly industrialized economies tend to dominate the frontrunner category, China — a recent graduate to middle-income status — is an exception. It joined the frontrunner group rapidly, steadily

119
re
sP
on
din
g to
Ad
vA
nC
ed
dig
itAl P
ro
du
Ct
ion
te
Ch
no
log
ies
4
“ Followers aspire to foster innovation-driven development
changing its approach to industrial development from catching up to capitalizing on its increased ability to (re)produce new advanced technologies, add value and enhance technological content, superseding the tradi-tional cost advantage strategy (Li 2018). China seeks to upgrade within value chains, while exploring new development paths building on decades of systematic
and sustained accumulation of technological and pro-ductive capabilities.
Several middle-income economies are followersSeveral middle income economies are followers, mainly users of ADP technologies. These economies aspire to foster innovation-driven development, away
Figure 4.1 Strategic responses reflect differences in manufacturing development across countries
FOLLOWERSChanging framework conditions to leapfrog and catch up• Copying and adapting to changing technological
and market dynamics• Upgrading and modernizing through new
technology absorption and use• Deepening digitalization• Building on participatory policy-making to improve
the functioning of innovation systems
LATECOMERS AND LAGGARDSBracing to avoid falling further behind?• Copying and adapting to changing technological and
market dynamics • Finding new pathways towards industrialization• Fostering digitalization• Improving business environment and framework
conditions for industrialization
FRONTRUNNERSStriving for sustained industrial leadership• Fostering innovation in frontier technologies• New market creation: production
technologies/platform technologies• Supporting pilots and testbeds to assess
performance of new technologies relative to vintage technologies
Source: UNIDO elaboration.
A pioneer in adopting advanced digital production (AdP)
technologies — under the label industry 4.0 — as a policy-
guiding concept, germany is building on its cumulated
technological and industrial capabilities to tackle chal-
lenges associated with rising labour and energy costs,
infrastructure-modernizing demands and skill shortages
(Pfeiffer 2017). in addition to becoming a lead producer
of AdP solutions and technologies, it hosts several major
players in the field. the country’s strategy has been char-
acterized as simultaneously defensive, to maintain home-
based production and increase flexibility to respond to
crises in international markets — and offensive, to retain
skills and know-how to support an export-led model
(blanchet et al. 2016).
Confronted with an aging and declining industrial
base, France pursues resurgence through enhanced digi-
talization and virtualization. it also promotes a growing
start-up ecosystem to renew the domestic manufacturing
base and reposition itself as industry leader, subject to its
ability to offset labour costs and related social constraints
(blanchet et al. 2016).
Source: UNIDO elaboration.
Box 4.1 Highly industrialized economies differ in their strategic stances for smart manufacturing

120
re
sP
on
din
g to
Ad
vA
nC
ed
dig
itAl P
ro
du
Ct
ion
te
Ch
no
log
ies
4
“Strategies for smart manufacturing could benefit from clearer pathways towards explicit desired outcomes
from commodities and traditional industrial prod-ucts and increasingly moving into higher value added sectors. Several, such as Brazil and India, host smart manufacturing– ready firms (Chapter 3) and are even competing in economic activities traditionally reserved for highly industrialized economies (Daudt and Willcox 2016, IfM-UNIDO 2017). But most lower- and middle-income countries are either late-comers or lagging behind in their strategic positioning towards ADP technologies.
Country strategies could benefit from better articulation of the milestones, resources and pathwaysAs discussed here, country strategies for smart manu-facturing could benefit from better articulation of the milestones, resources and pathways towards explicit desired outcomes. Otherwise, latecomers and laggards will still struggle with developing national policies around information and communications technolo-gies (ICT) to improve framework conditions for digi-talization and related infrastructure.
…and blend different policy realms
Strategies towards ADP technologies take diverse formsStrategies towards ADP technologies applied to man-ufacturing, found throughout the world, take diverse forms: industrial policies or science, technology and innovation plans, digitalization strategies or national digital agendas, and standalone documents bearing terms such as Industry 4.0, advanced manufacturing, smart manufacturing or specific ADP technologies. Alternatively, countries expand and leverage already existing industrial development plans or innovation strategies. Colombia, for example, included Industry 4.0 in preparing the National Development Plan, as part of a national pact for a digital society and the 4IR (Colombia, DNP 2018).
Among developing country strategies, the most advanced and ambitious is Made in China 2025Among developing country strategies, by far the most advanced and ambitious is Made in China 2025,
which the Chinese government adopted in 2015 (State Council of the People’s Republic of China 2015). Made in China 2025 is a comprehensive initiative to upgrade China’s manufacturing industry from a manufactur-ing giant into a world manufacturing power. The strat-egy seeks to close the gaps with developed countries in innovation, efficiency in resource use, industrial struc-ture, digitalization and product quality.
The next tier of countries includes followers in production and useThe next tier of countries includes followers in pro-duction such as Brazil, which adopted the Science and Technology and Innovation Plan for Advanced Manufacturing (Brazil, MCTIC 2017). The tier also includes followers in use. In Thailand, for instance, the basic elements of the national strategy, Thailand 4.0, are in the 20-Year National Strategy 2017–2036 and the 12th National Economic and Social Development Plan 2017–2021 (Baxter 2017; Thailand, Government Public Relations Department 2016). In South Africa, the Industrial Policy Action Plan (IPAP) 2017/18–2019/20 features a chapter on enhancing the country’s readiness for Industry 4.0 (South Africa, DTI 2017), while the latest White Paper for Science, Technology and Innovation proposes a strategy to leverage sci-ence, technology and innovation to assist South Africa tackle the 4IR (South Africa, DST 2018). Similarly, Malaysia’s National Policy on Industry 4.0 (Industry4wrd) seeks to boost the country’s indus-trial performance and endorses efforts to achieve the SDGs (Malaysia, MITI 2018). Chile, despite being a latecomer to ADP technologies, is one of the first to adopt a strategy for it. The Strategic Programme Smart Industries (PEII) 2015–2025, announced in 2016, introduces a vertical approach looking into problems, needs and possible solutions for individual industrial sectors (Chile, CORFO 2016).
Other countries have a roadmap or general guidelinesOther countries have a roadmap or general guide-lines for developing national strategies either in place or nearing completion. Mexico adopted in 2016 a

121
re
sP
on
din
g to
Ad
vA
nC
ed
dig
itAl P
ro
du
Ct
ion
te
Ch
no
log
ies
4
“Participatory approaches are recommended for strategy development
roadmap towards the adoption of Industry 4.0 strate-gies and technologies to increase domestic value addi-tion in manufacturing (Mexico, Ministry of Economy 2016). Kazakhstan, in the new development strategy Kazakhstan 2050, expects the technological revolu-tion to help meet the country’s aspiration of achieving economic performance at a level similar to the world’s top 30 countries (Nazarbayev 2018).
India, an advanced follower, is leveraging efforts already in placeThrough the Make in India initiative, the government seeks to combine industry and Internet of Things (IoT) technologies, and its Smart Cities Mission should help build 100 smart cities across the country (Make in India 2017). Through the Digital India programme, the gov-ernment intends to promote manufacturing and the use of ICT infrastructure (Roland Berger GMBH 2016).
The model is to bind manufacturing to broader national development aspirations and plansWhatever the form of national response, the ideal situation is for country strategies surrounding smart manufacturing to bind manufacturing to broader national development aspirations and plans. Whether an industrial development plan or a science, technol-ogy and innovation development plan, what matters for such a document is to focus the collective aspira-tions and commitment around the future of manufac-turing and its contribution to national development.
Basic elements of strategy design and development
Build on multistakeholder, participatory processes
They help to gather different perspectives and build common understandings…Through multistakeholder, participatory processes, policy-makers can foster shared visions of strate-gic goals, identify tested policy tools for scaling up, inform the design of policy incentives or uncover
gaps between different types of firms (Rodrik 2018). Several developing countries still lack a formal strat-egy and are engaged in consultations and other par-ticipatory policy-making processes with a view to developing roadmaps or national strategies through the work of special task forces or working or consulta-tive groups (Santiago 2018). In Turkey, for instance, under the overall leadership of the Higher Council of Science and Technology (BTYK), the Scientific and Technological Research Council (TÜBİTAK) coordinated the Smart Manufacturing Systems Technology Roadmap, which builds on digitalization and interaction within the scope of ADP technologies and factories of the future. Through a comprehensive participatory process, including firm-based surveys, it was possible to define three technology groups — digitalization, connectivity and future factories — with 10 technology-based strategic targets and 29 critical products, research and development (R&D) projects and priority sectoral applications (Tansan et al. 2016; Turkey, TÜBİTAK 2019). Similar consultative pro-cesses to inform the development of national strate-gies can be identified in Argentina, Brazil, China and other emerging industrial economies (Santiago 2018, State Council of the People’s Republic of China 2015).
…and to mobilize knowledge and experiences from multiple stakeholdersParticipatory approaches are recommended for strat-egy development because collaboration among mul-tiple agents can detect emerging changes even at an early stage (Planes-Satorra and Paunov 2019). When combined with policy tools such as strategic fore-sight and market intelligence services, participatory processes can help policy-makers anticipate oppor-tunities, threats or vulnerabilities early on (UNIDO 2017c). Given the rapid pace of ADP technologies, collaborative multistakeholder approaches can iden-tify where supporting capacity development is needed and help domestic firms identify or anticipate changes in demand and in the structure and dynamics of value chains. Participatory approaches in follower and even latecomer countries are consistent with the experience
122
re
sP
on
din
g to
Ad
vA
nC
ed
dig
itAl P
ro
du
Ct
ion
te
Ch
no
log
ies
4
“ADP technologies require a comprehensive government response with central coordination from the highest levels
of several frontrunner economies where the preferred approach remains to use working groups, stake-holder consultations and calls for proposal (Digital Transformation Monitor 2017).
In Brazil, consultations were based on a triple-helix approachIn Brazil, the development of the Science and Technology and Innovation Plan for Advanced Manufacturing involved the Ministry of Science, Technology, Innovation and Communications (MCTIC), and the Ministry of Industry, International Trade and Services (MDIC) (Brazil, MCTIC 2017; Portal Brasil 2017). Consultations were based on a tri-ple-helix approach to the promotion of productive and scientific and technological activities with participa-tion of government, private entities and education and research organizations. Significant knowledge came from a task force consulting private organizations on their perspectives around the challenges and opportu-nities stemming from smart manufacturing across dif-ferent Brazilian industries and regions (Brazil, MDIC-MCTIC 2016). And the National Confederation of Industry (IEL 2018) documented issues of supply and demand expected to influence the adoption of smart manufacturing in the country.
Chile built on previous learning to foster digitalizationSimilarly, elaboration of PEII 2015–2025 in Chile built on previous learning from initiatives to foster digitalization in the construction sector through the Building Information Modelling initiative — part of the Strategic Programme for Sustainable Construction (Programa Estratégico de Construcción Sustentable — PECS), which included a task force to identify challenges and opportunities associated with the sector’s digital modernization.
Collective thinking underpins the elaboration of roadmaps or national strategiesCollective thinking underpinning the elaboration of roadmaps or national strategies often informs propos-als for additional diagnostic studies targeting strategic
sectors or individual technologies, while governments aim to leverage ongoing initiatives and pilot projects. Expected outputs from these exercises include sectoral or technological white papers and proposals for creat-ing clusters of firms specialized in a particular tech-nology or set of technologies linked to the future of manufacturing.
The planning of strategic responses can also build on independent diagnostic studies carried out or spon-sored by the private sector. In Turkey, in-depth studies cover automobiles, white goods, textiles, chemicals, machinery and food and beverages (Tansan et al. 2016). And for India’s automotive sector, a private entity has conducted specialized studies on the readi-ness for smart manufacturing (Grant Thornton 2017).
Address complexity through a comprehensive government approach
Smart manufacturing requires comprehensive responses with central coordinationThe comprehensiveness and across-the-board nature of ADP technologies require a comprehensive gov-ernment response with central coordination from the highest levels of government (Lee et al. 2019). Such high-level involvement is particularly evident in Asian economies with a strong tradition of active industrial policies. But it is not negligible in other contexts where industrial policy has been a difficult topic.
Leadership in developing and implementing national strategies is generally sharedThe experience of follower countries confirms that leadership in developing and implementing national strategies is generally shared between ministries of industry and ministries for science, technology and innovation (Santiago 2018). In South Africa, the Department of Telecommunications and Postal Services (DTPS), the Department of Science and Technology (DST) and the Department of Trade and Industry (DTI) were selected by government to lead and develop an integrated strategy and policy in consultation with industry, labour and civil society

123
re
sP
on
din
g to
Ad
vA
nC
ed
dig
itAl P
ro
du
Ct
ion
te
Ch
no
log
ies
4
“To drive ADP technologies, the private sector can become a strategic industrial development partner
(Kraemer-Mbula 2019). Collaboration between DTI and DST facilitated the development of policy and technological scenarios for the future of manufactur-ing, and the corresponding responses required by the country (South Africa, DTI 2017). To coordinate work across government, South Africa established a Presidential Commission on the Fourth Industrial Revolution in 2019, with 30 members from different sectors of society and chaired by the country’s presi-dent (Kraemer-Mbula 2019). The commission will identify relevant policies, strategies and action plans to position South Africa as a competitive global player in smart manufacturing (South Africa, The Presidency 2019). Similar forms of organization and coordination of actions for the 4IR are expected in Colombia, for example (Colombia, DNP 2018).
An additional tier reflects sectoral perspectivesAn additional tier of relevant government entities introduces perspectives to national strategies from the higher education, health, mining, labour and ICT sectors. In 2017, Viet Nam issued a special directive allocating roles and responsibilities to different agents with a view to fast-forwarding the adoption of ADP technologies in manufacturing in the period up to 2045 (Nguyễn Xuân Phúc 2017; Viet Nam, Central Economic Commission 2018). Government and collab-orating representatives consider manufacturing, educa-tion and science and technology institutions as the core drivers of digitalization and eventually smart manufac-turing in the country (Viet Nam, Central Economic Commission 2018). In Latin America, Chile’s PEII 2015–2025 has made explicit the government entities, programmes and initiatives with potential and interest to build synergies (Chile, CORFO 2016).
Foster strategic partnerships with domestic and external agents…
The private sector provides more than investmentTo drive ADP technologies and smart manufactur-ing in most countries, the private sector can become a strategic industrial development partner, beyond
providing financial resources and creating new busi-ness ventures. Through innovation, the search for new business models, initiatives to raise awareness or sponsoring or directly conducting sectoral diagnostics, the private sector informs policy-making and policy implementation for building industrial development capabilities (Santiago 2018, Santiago and Horst 2018).
Direct and active private sector involvement is essentialFostering direct and active private sector involvement is essential for countries at the early stages of develop-ing strategy. This encouragement bolsters consultative groups and other governance mechanisms respon-sible for the design, monitoring and coordination of working groups or other implementation mecha-nisms. Chile and Mexico have structured private sector participation in planning. In Chile, CORFO (Corporación de Fomento de la Producción), the national economic development agency, is respon-sible for implementing the PEII 2015–2025. But a Directive Council comprising representatives from public and private sector organizations will oversee implementation (Chile, CORFO 2016). Mexico’s roadmap was drafted through a collaboration between the Ministry of Economy, ProSoft 3.0 (an official pro-gramme for the promotion of the domestic software industry), the Mexican Association of Information Technologies and other private sector organizations.
Private sector associations raise awarenessPrivate sector associations raise awareness through public events, conferences, workshops and by spon-soring or conducting sectoral diagnostics. The Confederation for Indian Industry prepared India’s Readiness for Industry 4.0, with a focus on domestic automotive sector (Grant Thornton 2017). Similarly, in Colombia, collaboration between the Chamber of Industry and the Ministry of Information and Communication Technologies led to the establish-ment of an Observatory for the Digital Economy, which conducted the first survey of the digitaliza-tion of the Colombian economy in 2017 (Colombia, MinTIC-CCB 2018).

124
re
sP
on
din
g to
Ad
vA
nC
ed
dig
itAl P
ro
du
Ct
ion
te
Ch
no
log
ies
4
“ Innovation with ADP technologies seems to require new forms of public policy and public–private partnerships
Accelerating learning curves by leveraging international collaborationForeign partners in planning include multinational ICT firms and consulting firms. Collaboration with these foreign organizations can help countries leapfrog by leveraging know-how and experience. Partnerships with large multinational ICT firms or consulting firms help in carrying out studies on the state of specific smart manufacturing technologies — or in piloting novel business models and initiatives. The partnership between Microsoft and Fundación Chile supported a study on the state of cloud computing in the coun-try (Fundación Chile and Microsoft 2016). The find-ings indicated that penetration of these technologies among Chilean firms remained low, with barriers to adoption from high upfront investment costs or tariff rates, and from low awareness and understanding of senior private sector executives of the risks associated with the novel technologies.
Followers and latecomers are pursuing collaboration with frontrunnersFollower and latecomer countries are pursuing col-laboration with organizations from frontrunner economies, and the potential to expand this strategy looks significant. German organizations are frequent partners of choice in developing countries (Santiago 2018). Partnerships frequently involve the German and the host country’s chambers of commerce, special-ized research institutes or large multinational firms with recognized leadership in advanced technologies and related services — such as Siemens, the Fraunhofer Institute, and acatech (the German Academy of Science and Engineering). Activities include mapping the digitalization of domestic industries and identify-ing promising sectors (Box 4.2), setting up technol-ogy transfer offices to help the host country become a regional provider of ADP technologies and related ser-vices (Malaysia, Mexico) and broad collaboration on science, technology and innovation (Brazil). Several other activities foster technology transfer, human resource development, joint implementation of pilot projects and targeted SME support for automation
and data management tools and business models (Argentina, Egypt, Thailand) (Santiago 2018). The Sino-German collaboration on manufacturing shows how countries at different stages of development can support development of their respective national strat-egies (Box 4.3).
…but be ready to address trade-offs
Distributed leadership requires enhanced ownership and coordinationInnovation with ADP technologies seems to require new forms of public policy and public–private part-nerships (Lee 2019). Single ministries may not have all the resources needed to address challenges and capture opportunities. Shared leadership requires enhanced coordination across government organizations and
kazakhstan’s new digitalization strategy, digital
kazakhstan, benefited from the collaboration of ger-
many’s Fraunhofer institute with the kazakhstan minis-
try of industry and infrastructure development (miid).
Activities included a diagnostic study on the readiness
of about 600 domestic companies to adopt smart
manufacturing. mining firms appeared to be better pre-
pared technologically because of their higher exposure
to international competition (kazakhstan, miid 2018).
enterprises in textiles, food and other sectors are pilot-
ing model digital factories and, on the basis of results,
plan to popularize digital technologies, demonstrate
the effects of digitalization, identify barriers to digitali-
zation and develop advanced support tools (kazakh-
stan, miid 2018).
A technological audit, using the Fraunhofer insti-
tute’s methodology, plans for local companies to
digitalize production processes, business models,
equipment maintenance, supply chains, customer
interactions, training and other relevant areas. enter-
prises with semi-automated production are to progres-
sively transform into digital factories, thus optimizing
production processes. Pilot companies started imple-
menting these activities in october 2018.
Source: UNIDO elaboration
Box 4.2 Cooperation for a new digitalization strategy for Kazakhstan

125
re
sP
on
din
g to
Ad
vA
nC
ed
dig
itAl P
ro
du
Ct
ion
te
Ch
no
log
ies
4
“ Indicators can help monitor and evaluate progress promoting and adopting ADP technologies, but there is no single way to do so
between government and private and academic organ-izations. Consultation and timely collective responses are needed from multiple ministries, with buy-in and coordination from the highest level of government.
Fostering formal mechanisms and platforms modelled on the Industry 4.0 platformsSeveral follower countries are fostering formal mech-anisms and platforms modelled on the Industry 4.0 platforms found in different developed, mostly European, countries (European Commission 2019, Planes-Satorra and Paunov 2019). An example is South Africa’s high-level national collaborative plat-form proposed in the draft white paper on science, technology and innovation (South Africa, DST 2018). The platform advises how to respond to the opportu-nities and risks in smart manufacturing, including identifying and supporting priority science, technol-ogy and innovation programmes.
Viet Nam is developing a national response with the Prime Minister’s direct involvementViet Nam is developing a national response for smart manufacturing with the Prime Minister’s direct involvement in diverse awareness-raising activities and consultations with international experts. The approach includes summits and international gatherings to raise awareness, explore and possibly tighten public–pri-vate collaboration, and showcase technologies and
solutions available to domestic agents interested in smart manufacturing. A first meeting in 2016 con-veyed a basic understanding of ADP technologies, the second meeting looked at adoption in agriculture, industry and services and the third, in 2018, was more explicit on how to implement the 4IR in the country.2
Similar top-down approaches can be found in ChileSimilar top-down approaches can be found in Chile, where a recently created Bureau for the Economy of the Future, under the Ministry of Economy, Development and Tourism, is directed to insert the country in the 4IR through the analysis, coordination and definition of pertinent public policies. The bureau is also coordinating strategic projects to leverage exist-ing scientific and technological infrastructure and other related activities in the country (Chile, Ministry of Foreign Affairs 2019).
Broad indicators can help monitor and evaluate progressBroad indicators can help monitor and evaluate pro-gress promoting and adopting ADP technologies, but there is no single way to do so. Aggregate data useful for monitoring industrialization in general may miss the full complexity of smart manufactur-ing. Generally, monitoring and evaluation can be improved through more concrete benchmarks, indi-cators, baselines and criteria for success or failure
in 2015, China and germany agreed to jointly promote the
readiness of their respective economies for smart manu-
facturing by linking made in China 2025 and industrie 4.0
through a memorandum of understanding signed by the
China ministry of industry and information technology
(miit) and the german ministry of economy and energy.
standing out among the proposed activities is the pro-
motion of networks between Chinese and german enter-
prises in smart manufacturing.
Collaboration is already bearing fruit through a jointly
established sino-german industrial Park as a platform to
connect Chinese enterprises and german technology.
in 2016, miit selected pilot demonstration projects in
accord with the sino-german smart manufacturing cooper-
ation arrangement, with Chinese firms applying according
to their own development strategy. sino-german experts
evaluated projects and confirmed the first batch of 14
pilot demonstration projects, for example, the industry 4.0
exploration for the iron and steel industry between China
baowu steel group Corporation and siemens. in 2016
baowu steel and siemens signed a strategic agreement,
Joint exploration Program of industry 4.0, with the endorse-
ments of both governments (baosteel Co., ltd. 2016).
Source: UNIDO elaboration
Box 4.3 Sino-German cooperation for smart manufacturing

126
re
sP
on
din
g to
Ad
vA
nC
ed
dig
itAl P
ro
du
Ct
ion
te
Ch
no
log
ies
4
“Challenges imply choices about specialization in smart manufacturing — in either the use or the production of novel technologies
(Liao et al. 2018, Santiago 2018). Followers such as India and Malaysia have defined broad macro-level indicators linked to overall industrialization strate-gies, foreign direct investment (FDI) flows, produc-tivity growth, innovation capacities or high-skilled employment (Santiago 2018). For example, India’s National Policy for Advanced Manufacturing expects to assist in increasing the share of manufacturing in gross domestic product (GDP) from 16 percent in 2016 to 25 percent in 2025 (Grant Thornton 2017). The difficulty is in the linking promotion of smart manufacturing to performance at such an aggregate level.
The size of specific markets can be benchmarksThe size of specific markets can be benchmarks, as can competitiveness indices. Several countries propose assessing the expected value of domestic markets for specific technologies and applications and to derive more granular performance indicators, which are often but not always consistent with specific programmes or interventions. For instance, the government of Mexico has targeted its market for IoT services at about $8 bil-lion by 2022 (Mexico, Ministry of Economy 2016) but provides no information on how to get there. Also common as benchmarks are international indexes on competitiveness and related performance indicators. Kazakhstan seeks to emulate the economic perfor-mance of the top 30 countries by 2050 (Kazakhstan 2019), while Malaysia targets strengthening its inno-vation capacity and capability to climb from 35th to the top 30 in the World Intellectual Property Organization’s Global Innovation Index by 2025 (Malaysia, MITI 2018).
Investments and innovation performance as benchmarksAlso identified are intentions to evaluate investments leveraged through national smart manufacturing strategies, or improvements in innovation perfor-mance. Chile’s PEII 2015–2015 includes intermedi-ate targets for 2015–2017 (short term), 2018–2020 (medium term) and 2020–2025 (long term), coupled with estimates of the investments required for each
period and their possible sources (Chile, CORFO 2016). Emphasis seems to be on creating framework conditions through digitalization, identifying stra-tegic sectors and working with the private sector in implementation. In China, by contrast, perhaps because of its more advanced situation in relation to the 4IR, Made in China 2025 focuses more on industrial and innovation performance, including indicators on R&D inputs (expenditure intensity) and outputs (patents per revenue), labour productiv-ity, penetration of ICT infrastructure or ICT appli-cations and contributions to environmental sustain-ability through CO2 emissions, water consumption and solid waste rates (State Council of the People’s Republic of China 2015). The performance targets specify improvements by 2020 and 2025 relative to a 2015 baseline.
Fostering capabilities to adopt ADP technologies
Address at least one and preferably more than one of four challengesA country’s ability to capture value from ADP tech-nologies is contingent on addressing at least one and preferably more than one of four challenges:• Adopting smart manufacturing systems to capital-
ize on efficiency gains, flexibility, speed/respon-siveness, precision and customization.
• Becoming a manufacturer and supplier of key ADP technologies.
• Positioning the country as a provider of specialized ADP services.
• Building key enabling infrastructures to under-pin the expansion of smart manufacturing (IfM- UNIDO 2017).These challenges imply choices about an economic
agent’s specialization in smart manufacturing — in either the use or the production of novel technologies. The choice implies different stages of capability accu-mulation across sectors, technologies or applications. But determining the extent of expected success is com-plex and uncertain (Steinmueller 2001).

127
re
sP
on
din
g to
Ad
vA
nC
ed
dig
itAl P
ro
du
Ct
ion
te
Ch
no
log
ies
4
“Digitalization and access to broadband internet are persistent constraints for smart manufacturing
Enhance readiness for smart manufacturing with interventions, dedicated programmes and incentivesThree main types of issues can be derived for strategic policies to enhance readiness for ADP technologies (IfM-UNIDO 2017):• Developing framework conditions — including but
not limited to infrastructure — at different levels. The range of possible interventions is broad, includ-ing regulatory reforms, facilitating convergence and synergies across policy realms, conducting studies on specific digital and nondigital activities or individual technologies in the smart manufac-turing suite, and creating digital parks, often linked to FDI promotion or facilitating connections with international initiatives for digitalization and smart manufacturing (Brazil, MCTIC 2017).
• Introducing dedicated programmes, facilities and incentives to raise awareness and stimulate the interest of domestic agents. Suggested initiatives involve partnerships between academic organi-zations, domestic and foreign firms and others, including novel R&D support schemes and tech-nology transfers for smart manufacturing.
• Building capacity, particularly to enable adjust-ments in labour markets — from strengthening sci-ence, technology, engineering and mathematics (STEM) education at various levels, to developing specialized programmes with private sector collabo-ration, to enhancing vocational training and higher education programmes for smart manufacturing.
Focus on framework conditions
Digitalization is a prerequisite for firms and countries seeking smart manufacturingRegardless of a country’s industrialization, digitali-zation and access to broadband internet are persis-tent constraints for smart manufacturing (Banga and Willem te Velde 2018a; Colombia, DNP 2018; European Commission 2017a). For frontrunners such as the United States, improving digital adoption, par-ticularly among SMEs, is recommended to boost pro-ductivity (McKinsey & Co 2017; see Box 4.1). The
European Commission recognizes the need to close the gap between top digital players and lower-perform-ing countries and to invest substantial resources to tap into emerging digital opportunities. It has pledged to mobilize some €50 billion in public and private invest-ment to support the Digitizing European Industry strategy through 2020 (European Commission 2017).
Update regulations, open the ICT sector to investment and foster broadband infrastructureLatecomer and follower countries also struggle to improve framework conditions for digitalization through national ICT policies or digitalization strate-gies that stress building digital capabilities (Box 4.4). Among recommended actions are updating regulations or deregulating and opening the ICT sector to invest-ment (including to foreign investors) and fostering broadband infrastructure to enhance access to high-speed internet and develop big data applications,3 IoT, visualizations and related technologies. These actions coincide with those identified as basic elements of any sound digital industrialization policy (Sing 2017).
Enhanced digitalization improves the business environment and broadens people’s internet accessEnhanced digitalization is necessary to improve innova-tion performance and enrich the business environment (Chile, Ministry of Foreign Affairs 2019; Peru, MEF 2018), preparing economic agents to adopt ADP tech-nologies while bridging inequalities in access to inter-net and related digital services among broader popula-tion segments (Peru, MTI 2019). Currently, several countries are aiming to update existing frameworks to allow industrial digitalization and foster smart manu-facturing as a driver of industrialization (Box 4.5). But in many countries, firms’ use of digitalization in day-to-day operations remains modest (Chapter 3).
Search for sectoral advantages to promote in national strategiesIn many countries, policy-makers are looking for exemplary experiences to inform smart manufacturing policies. National strategies in follower countries tend

128
re
sP
on
din
g to
Ad
vA
nC
ed
dig
itAl P
ro
du
Ct
ion
te
Ch
no
log
ies
4
“Strategies tend to be fairly open about the choice of either the technologies or the priority sectors to develop advanced applications
to be fairly open about the choice of either the tech-nologies or the priority sectors to develop advanced applications for (Digital Transformation Monitor 2017, Santiago 2018), so manufacturing areas may not always be explicitly identified (Liao et al. 2018). Through a mix of comparative advantage–compliant and comparative advantage–defiant approaches, pol-icy-makers are searching for windows of opportunity in a heterogeneous set of industries and technological applications. Agriculture and the aerospace industry feature prominently in national strategies, perhaps ref lecting the dual economic structures of several developing countries. Digital technologies, automa-tion and robotics suggest efforts in new sectors, while mining, electronics, automotive or chemicals suggest attempts to build on existing comparative advantages.
Follower economies target sectors where smart manufacturing already existsFollowers tend to target sectors where smart manu-facturing already exists — aerospace, automobiles and pharmaceuticals — or where it has potential to enter in full force once the framework conditions are
improved. Those sectors, or firms in those sectors, are examples to be emulated or scaled up (Malaysia, MITI 2018; Mexico, Ministry of Economy 2016).
A distinction between sunset and sunrise industriesOften, a distinction is made between sunset and sunrise industries, sometimes under different names. Building on the 11th Malaysia Plan, Malaysia, MITI (2018) dis-tinguishes catalytic and high growth potential industries (electrical and electronics, machinery and equipment, chemicals, aerospace and medical devices) “as game changers for the manufacturing sector” from other more mature high growth sectors (automotive, textiles, trans-port and pharmaceuticals). Thailand has identified 10 strategic industries in two development strategies:• Reforming existing industrial sectors (the “First
S-Curve”): food, automotives, electronics, affluent tourism and medical tourism and agriculture and biotechnology.
• Scaling up future growth engines (the “New S-Curve”): digital industry, medical services, auto-mation and robotics, aviation and logistics and biofuels and biochemical (Board of Investment
African countries face serious risks of a growing digital
divide and difficulties in benefitting from the rapid uptake
of new digital technologies and falling labour costs (banga
and willem te velde 2018a). but they should expect to
profit from a longer transition and adjustment than more
advanced countries have had. manufacturing remains a
valid and feasible development path if countries continue to
invest in industrial capabilities with a two-prong approach:
• Focus on upgrading capabilities in less-automated
sectors — food and beverages, garments and paper
— to capture windows of opportunity for increased
local production and regional trade, moving progres-
sively into higher value added activities.
• enhance readiness for the more digital future through
improved access to broadband and developing tech-
nical skills and technology hubs.
Policies should address frameworks for increased
digitalization and investment, including better and more
affordable access to internet and other information and
communications technologies (iCt) and iCt infrastructure
and participation in global value chains. governments
may turn to educational institutions and local and com-
munity centres to provide free or subsidized access to the
internet.
Public funding should be expanded for ecosystem ena-
blers such as technological and innovation hubs already
present in the continent, and for manufacturing and ser-
vice start-ups. And taxes and incentives should help in
bridging rural–urban digital divides and increase access to
digital technologies. Creating a regional register for digital-
related trademarks, and promoting regional and continen-
tal e-commerce and trade in digital products and services,
should foster innovation and build firm-level capabilities.
Public–private collaboration should contribute to
investments in education and complementary skills through
revising and reorienting the curriculum around science,
technology, engineering and mathematics and providing
better technical and vocational education and training.
Source: UNIDO elaboration based on Banga and Willem te Velde (2018b).
Box 4.4 Priorities for digitalization in Africa

129
re
sP
on
din
g to
Ad
vA
nC
ed
dig
itAl P
ro
du
Ct
ion
te
Ch
no
log
ies
4
“Both frontrunner and follower economies pursue smart manufacturing as part of regional development strategies
2017; Thailand, Government Public Relations Department 2016).South Africa, recognizing trends towards servici-
zation, targets knowledge-intensive design and health services and manufacturing-related services. Priorities include such cross-cutting or generic technologies as bio-technology and such digital technologies as robotics, 3D printing and the IoT (South Africa, CSIR-DST 2016).
Capitalize on smart manufacturing as an emerging approach to regional developmentBoth frontrunner and follower economies pursue smart manufacturing as part of regional development strategies. In Europe, such strategies are frequently
linked to smart specialization initiatives under the framework of the European Commission’s cur-rent approach to innovation policy, which seeks to capture regional productive specialization, includ-ing ICT clusters and other strategic sectors (Digital Transformation Monitor 2017; Spain, Ministry of Industry, Trade and Tourism 2019). The Basque Country’s smart manufacturing strategy, Basque Industry 4.0, builds on more than 30 years of expe-rience promoting industrial development through clusters, and an extensive capability base for innova-tion and manufacturing production technologies. Digitalization constitutes a challenge for future development of local industry (Kamp et al. 2019). So
Kazakhstankazakhstan, through its kazakhstan 2050 national strategy,
seeks to foster technological upgrading of basic industries
until 2025, including elements of advanced digital produc-
tion technologies to enhance industrial competitiveness
(nazarbayev 2018). the ministry of industry and infrastruc-
ture development and the ministry of information and Com-
munications are working on a draft programme of digital
kazakhstan, an umbrella for digitalization initiatives, includ-
ing measures targeting a transition to smart manufacturing.
the draft programme considers attracting foreign partners
for research and development (r&d), emphasizing manu-
facturing and mining. similar efforts at enhancing digitaliza-
tion in Central Asia can be found in kyrgyzstan, including
setting up new government organizations to design and
implement digitalization strategies (osmonova 2016).
Mauritiusdigital mauritius 2030 strategic Plan is the latest incar-
nation of the country’s development plan for economic
digitalization (kraemer-mbula 2019). led by the ministry
of technology, Communication and innovation (mtCi), this
policy framework builds on the successful implementation
of the previous plans, smart mauritius and vision 2030.
the country’s e-government projects have improved the
efficiency of government-to-government, government-
to-business and government-to-citizen transactions and
reduced associated costs (mauritius, mtCi 2018).
vision 2030 is moulded around future technologies,
with a view to boosting the country’s readiness for the 4ir.
it sets phases of digital transformation over the next dec-
ade and plans the continuous development of the infor-
mation and communications technology (iCt) sector as
the pillar of competitiveness and growth, which in 2018
contributed 5.6 percent of gdP, employed around 23,000
people, and saw iCt export growth of around 4.4 percent
(mauritius, mtCi 2018).
digital mauritius 2030 strategic Plan focuses on
developing an enabling environment for digital implemen-
tation. specific areas of intervention include iCt govern-
ance, talent management and the national broadband
strategy, Protection of intellectual rights, data Protection
and data Privacy issues and Cyber security. the goal is to
provide a stable and transparent ecosystem for economic
growth in the 4ir (mauritius, mtCi 2018).
Viet Namover the past 15 years, viet nam has adopted sev-
eral policies, master plans and a host of laws around
information technologies, intellectual property rights,
e-transactions, and cyber-security — to foster invest-
ment in infrastructure, adopt multimedia, and promote
e-commerce and advanced technologies in produc-
tion and business (Cameron et al. 2018). the result is
a complex governance structure sustaining a sectoral
system of innovation around the digital economy, which
is expected to provide a solid basis for smart manufac-
turing (Cameron et al. 2018; viet nam, Central economic
Commission 2018).
Source: UNIDO elaboration.
Box 4.5 Digitalization as a prerequisite for smart manufacturing

130
re
sP
on
din
g to
Ad
vA
nC
ed
dig
itAl P
ro
du
Ct
ion
te
Ch
no
log
ies
4
“Through funding for innovation, digitalization and pilot initiatives, governments can steer resources towards the development of ADP technologies
Basque Industry 4.0 includes pilot activities to assist domestic SMEs in training for the technologies asso-ciated with smart manufacturing and digitalization. The strategy also sponsors firms interested in conduct-ing self-diagnosis and fine-tuning for smart manufac-turing (Basque Industry 4.0 2017).
Mexico and Viet Nam support regional initiatives that match national targetsAmong follower economies, Mexico and Viet Nam have recognized and explicitly pledged support to regional initiatives with different degrees of align-ment with central government initiatives and national development targets (Box 4.6). Regional or provincial government strategies may supplement the compre-hensive government approach discussed earlier.
Fostering smart manufacturing readiness to promote ADP technologies
Is there a case for mission-oriented interventions?Through dedicated funding for innovation, digitali-zation and pilot initiatives on specific technologies, applications or business ventures, governments can steer resources, capabilities and incentives towards
the development of ADP technologies. South Africa’s Industrial Policy Action Plan 2017/18–2019/20 pro-poses a Sovereign Innovation Fund to provide funding certainty for high-technology projects, particularly in smart manufacturing-related areas (South Africa, DTI 2016). The government pledged a seed invest-ment of 1–1.5 billion rand (about $111 million) in 2019/2020 for the adoption of locally developed tech-nologies (Santiago 2018). The fund is part of a strat-egy to help domestic firms benefit from technology transfer, diffusion and acquisition, including through global original equipment manufacturers in key value chains.
China’s Zhejiang province promotes the adoption of cloud technologiesAn exemplary initiative to promote adoption of ADP technologies was launched in China’s Zhejiang prov-ince. It combines funding with a complex approach to foster supply-push and demand-pull interventions and an ambitious capacity-building programme around cloud computing technologies and applications. The emerging evidence suggests that the programme is con-tributing to a rapid uptake of cloud computing tech-nologies and their commercial applications (Box 4.7).
in may 2017, the provincial government of nuevo león,
mexico, announced nuevo león 4.0, which aims to support
the modernization of production systems and the introduc-
tion of new models for business and smart manufactur-
ing (mexico, gobierno nuevo león 2017). the strategy — a
five-helix collaboration of academia, industry, government,
entrepreneurs and investors — will promote digital transfor-
mation of the local ecosystem. in addition to contributing to
the strategy’s governance mechanisms, these stakehold-
ers will be organized in distinct action groups around such
areas as ethics, public policy, technological infrastructure,
and communication architecture. the goal is to make the
province a benchmark smart economy in the Americas on
a course towards 2025 (nl4.0 2019). A two-year memo-
randum of understanding was signed with basque industry
4.0 in 2018 to govern cooperation between two of the most
industrialized regions in their respective countries.
ongoing initiatives under the nuevo león 4.0 include:
• developing research and development infrastructure
for specific technologies — for example machine-to-
machine communication and machine learning.
• Collaborating with mexico’s federal science and tech-
nology and innovation authorities to leverage dedi-
cated funding.
• launching special awards to recognize manufacturing
and service firms already developing and implement-
ing smart solutions.
• redesigning engineering programmes and launching
education programmes to meet the technological and
industrial requirements of smart manufacturing (nl4.0
2019).
Source: UNIDO elaboration.
Box 4.6 Nuevo León 4.0: A regional initiative around smart manufacturing in Mexico

131
re
sP
on
din
g to
Ad
vA
nC
ed
dig
itAl P
ro
du
Ct
ion
te
Ch
no
log
ies
4
“Policy interventions need to align with the requirements of firms with distinct degrees of readiness and openness to ADP technologies
Automation and digitalization are foundational technologiesAutomation and digitalization constitute founda-tional technologies to enhance readiness for smart manufacturing. In Kazakhstan, the Ministry of Education and Science has an Industrial Automation Institute based in the Kazakh National Research Technical University. In collaboration with domestic universities and research institutes, the institute will carry out applied research and technology transfer, addressing the technological problems faced by busi-ness seeking to adopt smart manufacturing (Liter.KZ 2018).
Cater to different types of firmsPolicy interventions need to align with the require-ments of firms with distinct degrees of readiness and openness to ADP technologies. Globalized, highly competitive and productive sectors, often compris-ing large firms ready to adopt these technologies, co-exist with a huge segment of firms, mainly domestic SMEs using outdated production models, with lim-ited incentives to undertake innovation and techno-logical upgrading. Firms that operate in traditionally nondigital markets differ from those with completely digital business models, particularly services on digi-tal platforms (Colombia, DNP 2018). This brings to
in April 2017, the local government of the Zhejiang prov-
ince launched an action plan, enterprises deploying the
Cloud, to raise the awareness of manufacturing compa-
nies about cloud technology and its applications. the
initial target was to assist 100,000 firms to adopt cloud
technology over 2018–2020.
Governance: A coordinated mechanism, including provin-
cial, city and county governments, organizes and mobi-
lizes public awareness activities. each city in the prov-
ince has plans to identify and allocate concrete tasks to
villages and towns. local governments have developed a
cloud strategy for distinct industries and firms.
Capacity building: in 2017, local governments organized
more than 1,100 seminars for cloud training, covering
more than 90,000 firms and 100,000 participants. each
industrial firm, regardless of size or type, can attend semi-
nars intended to enhance its willingness and practical
ability to use cloud technologies. For small and medium-
sized enterprises (smes), the first step is to secure basic
cloud computing applications, but the complexity of the
applications increases with the size and technological
upgrading of firms. the provincial government has pooled
funds to support promotion and training in cloud technol-
ogy. it regularly organizes case studies to help companies
learn from good practices.
Supply-driven interventions: Priority applications include
upgrading management, r&d and innovation, reduc-
ing costs and increasing revenue. Content is classified
in distinct categories — agriculture, manufacturing and
services — and for items such as database, storage, net-
work security, it development and office training. the
provincial government works closely with cloud service
providers, system integrators and third-party organiza-
tions to establish an information communication platform
for enterprises.
Firms can mobilize cloud applications according to their
development requirements. in parallel, the city govern-
ment established a cloud service platform to coordinate
cloud service providers, cloud technology design devel-
opers, software and hardware developers, system integra-
tors and industry associations to assess an enterprise’s
application and formulate plans for detailed cloud trans-
formation projects. to meet firms’ needs, the province has
incubated 12 industrial cloud application platforms in tex-
tiles, commerce, finance and intelligent customer service.
Demand-driven interventions: the Zhejiang government
has introduced diverse financial support methods to
facilitate adoption of new technologies or foster innova-
tion, particularly among smes. voucher schemes lower
the cost of cloud technology, and firms can redeem those
vouchers with cloud platform service providers. on the
basis of technical evaluation, the government selects cer-
tain firms to benefit from subsidies for significant pilot or
demonstration projects.
Results: in about a year of operation, up to the third quar-
ter of 2018, more than 218,000 firms in Zhejiang deployed
the cloud, bringing the total number of adopters in the
province to around 268,000.
Source: UNIDO elaboration.
Box 4.7 Fostering the development and adoption of cloud computing in Zhejiang province

132
re
sP
on
din
g to
Ad
vA
nC
ed
dig
itAl P
ro
du
Ct
ion
te
Ch
no
log
ies
4
“Of particular concern is identifying the readiness, opportunities and bottlenecks for SME participation in the new technologies
mind debates around the capabilities required to suc-cessfully move a firm from manufacturing to services (Sousa and Silveira 2017).
Public research infrastructure should showcase practical applicationsIn India, policy-makers intend public research infra-structure to contribute to Make in India by showcas-ing practical applications of ADP technologies, in order to raise awareness and demystify the concept through capacity building tailored to the needs of firms (Box 4.8). Centres are located to match local manufacturing specialization and the competences of firms.
Develop diagnostics, toolkits and tailor-made blueprints to assess readinessDiagnostics, toolkits and tailor-made blueprints have to be developed to assess readiness for ADP technolo-gies and to produce industry or country profiles show-casing the potential benefits of such technologies (Deloitte 2016, PwC 2016, World Economic Forum 2017). Of particular concern is identifying the readi-ness, opportunities and bottlenecks for SME participa-tion in the new technologies, for example, through the Industry4WRD Readiness Assessment managed by Malaysia’s Productivity Corporation platform (Box 4.9).
Frontrunner and follower economies foster collaboration and the cross-fertilization of ideasTo link firms of different sizes and technological capabilities, both frontrunner and follower econo-mies foster collaboration and the cross-fertilization of ideas. In Mexico, MIND4.0 Monterrey 2019, recently launched as part of Nuevo León 4.0 (NL4.0 2019), is a start-up accelerator that emulates a similar pilot ini-tiative in the Basque Country, BIND 4.0. It matches local manufacturing firms with domestic and foreign innovators and entrepreneurs — for the former to access solutions and talent and the latter to participate in mentoring and other business development support.
BIND 4.0 supports start-up development and growth in the Basque ecosystemThe BIND 4.0 programme, introduced in 2016 in the Basque Country, is the first international public–pri-vate initiative to function as start-up accelerator spe-cialized in Industry 4.0 solutions to support start-up development and growth in the Basque ecosystem (Basque Industry 4.0 2017, SPRI 2019). It mobilizes local Basque Country firms — in healthcare, energy, agro-food and manufacturing — to function as cata-lysts by establishing contact with innovative entrepre-neurs, either domestic or foreign. The entrepreneurs can expect to contract out with a catalyst company for
with the aim of supporting the implementation of make
in india, in 2017 four new centres for industry 4.0 opened
in bangalore, new delhi and Pune. while independent,
they fall under the purview of sAmArth udyog (smart
& Advanced manufacturing & rapid transformation hub)
program by ministry of heavy industries & Public enter-
prises, the department of heavy industry. their general
mission is to enhance manufacturing competitiveness
through a better understanding and broader adoption of
industry 4.0 technologies, particularly among manufac-
turing smes. A triple-helix approach — academia, industry
and government — guides their operation.
the C4i4 lab in Pune received a public grant of $2 mil-
lion and raised an additional $700,000 in private funding.
it focuses on supporting local smes, starting with diag-
nostic studies to determine their main challenges around
smart manufacturing. with low awareness a main barrier,
the lab supports workshops and demonstrations of smart
manufacturing applications — and pilots for adopting sme-
tailored solutions. Partnerships with local providers make
it easier to consolidate demands from multiple smes, thus
reducing the cost for solution providers.
An interview with the director of C4i4 lab suggests that
drivers of success include nurturing close relationships with
the industry Associations, fostering interaction with higher
education institutions both for training and skill develop-
ment and involving college graduates in diverse activities.
Source: UNIDO elaboration.
Box 4.8 Fostering SME participation in smart manufacturing: The C4i4 Lab in Pune, India

133
re
sP
on
din
g to
Ad
vA
nC
ed
dig
itAl P
ro
du
Ct
ion
te
Ch
no
log
ies
4
“ Few strategies address smart manufacturing employment
up to €150,000. Basque firms, in turn, can enhance their internationalization strategies and access talent, suppliers and solutions to specific challenges. In 2018 alone, the programme received 524 applications from firms in 64 countries, as local catalyst firms totalled 40, up from 15 in 2016.
Invest heavily in human resource and research capabilities
Capacity gaps exist between generations and between women and menChapter 2 in this report argued that the implications for employment that can be associated with adopting ADP technologies are subject to debate. The skills needed for the future will change, and this may bring
adverse consequences for certain groups. Low-skilled workers, and women in particular, would more likely be hurt by automation and digitalization. A genera-tion gap may also occur and widen since youngsters, more exposed and open to new technologies, may have an advantage.
Technology is not the only factor influencing employmentTechnology is far from being the only factor influenc-ing employment. Long-term structural changes in demography, labour relations and policy dynamics, as well as a redistribution of manufacturing activities and value chains, will also determine future global employment dynamics (Lee et al. 2019).
Limited technological experience creates ongoing problems in demands for skillsIn building capabilities, limited technological experi-ence challenges human capital development initiatives. Demands for employment and skills show the cumu-lative nature of manufacturing expertise and capabili-ties and the disadvantages of inadequate investment in human capital (Kraemer-Mbula 2019). Policy-makers should learn from pilot initiatives elsewhere, including those offering opportunities to enhance international collaboration and knowledge sharing.
Few strategies address smart manufacturing employmentNotwithstanding concerns about employment, few strategies address smart manufacturing employment. Attention seldom goes beyond problem statements. South Africa’s IPAP 2017/18–2019/20 is among the few national strategies to explicitly consider priority sectors that can help offset negative impacts on manufactur-ing employment (South Africa, DTI 2016). But specific actions to identify and promote such sectors are still unclear — and will be a task for the high-level national collaborative platform (South Africa, DST 2018).
So, explore the potential of technical and vocational education and trainingThe skilling, reskilling and upskilling for ADP technology requires new approaches to technical
the industry4wrd readiness Assessment under the
industry4wrd initiative determines smes’ readiness
and identifies gaps and areas to improve their pros-
pects for adopting smart manufacturing technologies.
it will focus on three “shifting factors” — people, pro-
cess and technology — to identify gaps and raise the
technological capabilities of 500 smes from 2019 to
2021 (allocating 210 million ringgit).
the assessment uses a predetermined set of indi-
cators to understand present capabilities and gaps,
and to enable firms to prepare feasible strategies and
plans towards industry 4.0. it should help firms to:
• determine their state of readiness to adopt smart
manufacturing technologies.
• identify the gaps and areas of improvement for
smart manufacturing adoption and opportunities
for productivity improvements and growth.
• develop feasible strategies and plans to imple-
ment projects incorporating new technology.
A novel feature of the assessment is a module tai-
lored for manufacturing-related services.
A first call received around 300 applications for
firms by march 2019, and the government aims to con-
duct more intensive awareness activities, especially in
smaller cities.
Source: UNIDO elaboration.
Box 4.9 Malaysia’s Industry4WRD Readiness Assessments

134
re
sP
on
din
g to
Ad
vA
nC
ed
dig
itAl P
ro
du
Ct
ion
te
Ch
no
log
ies
4
“The DIY movements can assist governments in targeting small players, helping them acquire capabilities and generate employment
and vocational education and training. The Basque Country is experimenting with new approaches to training, upskilling and career reorientation accord-ing to emerging requirements of firms and the alloca-tion of roles and responsibilities among agents with a stake in Basque Industry 4.0. Cluster organizations lead in implementing human resource development strategies, building on existing training models with upgraded teaching facilities and learning environ-ments and testing new delivery methods. For instance, the Association of Electronic and Information Technologies (GAIA) runs pilot programmes, some in collaboration with the Department of Employment, Social Inclusion and Equality of the Provincial Council of Bizkaia, to undertake professional retrain-ing in ICT fields with high demand for employment, targeting youth (GAIA 2019).
Incorporating new professionals in ICTThe GORAKA Training and Employment Plan for the Incorporation of New Professionals to the ICT sector supports companies, training centres and can-didates (Kaltzada 2017). It uses gaming techniques to underpin selection and training, accompanied by support services for mobility, scholarships, knowledge management and digital labs.
A Basque Country–Colombia collaborationGAIA recently entered an agreement to collaborate with universities in Valle del Cauca, Colombia, to fos-ter digital culture and entrepreneurship among local students. It expects to nurture a win–win scenario, creating a digital cluster benefits Colombian localities while providing a richer ecosystem for Basque com-panies to reach out to partners and solution provid-ers and, more importantly, to supplement the limited human resources available in the Basque Country.
Stimulate training and development to foster specific economic activitiesIn Malaysia, the Ministry of Human Resources offers a National Dual Training System equipping workers to use smart manufacturing technologies. Adopted
in 2014 as a two-track vocational training scheme following the model of the German Dual Vocational Training Programme, this was the first of its kind in the suite of Malaysia’s training programmes. The Penang state government is tapping into the pro-gramme to support skill development for the new Penang Automation Cluster launched in 2016, expected to become operational by the end of 2019. The cluster will support local electrical and electron-ics companies in becoming regional and global play-ers, creating around 500 skilled jobs. The Penang State government has invested around 6 million ringgit.
Expose people to learning using new technologiesDirect experience and exposure and learning from the new technologies may be possible through the “do it yourself ” (DIY) movements, which are spread-ing widely in several latecomer and follower countries (Box 4.10).
Do-it-yourself movements foster problem solving and peer-to-peer learningThe DIY movements can assist governments in tar-geting small players, helping them satisfy their needs, acquire capabilities and generate employment by rais-ing awareness of new technology (Iizuka et al. 2019). They can also foster new forms of entrepreneurship and innovation and promote building capacity to use those technologies — including more general capaci-ties gained through STEM education among youth. So far, however, industrial policy has mostly neglected DIY in addressing the challenges posed by smart manufacturing. So, the links between DIY and manu-facturing remain slim, particularly for smart manufac-turing. To generate greater impact, DIY would need to be embedded in larger ecosystems, including in edu-cation, as part of a broader industrial policy and for longer timespans. A few of the more progressive devel-oping countries are already using DIY in that way, embedding DIY networks in initiatives around train-ing and entrepreneurship, and using them effectively as a tool to foster innovation, including by consumers (Halbinger 2018).

135
re
sP
on
din
g to
Ad
vA
nC
ed
dig
itAl P
ro
du
Ct
ion
te
Ch
no
log
ies
4
“ Follower economies are adopting research agendas to foster domestic capabilities to absorb ADP technologies
Initiatives to facilitate exposure and training are already in placeInitiatives to facilitate exposure and training in foun-dational technologies such as automation are already in place. In Uruguay, the government established, in collaboration with UNIDO and the German indus-trial control and automation company Festo, the Centre for Industrial Automation and Mechatronics (CAIME) as a public technology centre to upgrade technical skills and encourage domestic firms to adopt smart manufacturing processes. CAIME shows that boosting technological capabilities in smart manu-facturing is a gradual process that requires constantly matching a firm’s evolving needs (demand) and the country’s technical human resource pool (supply). The modular nature of CAIME’s laboratories and technol-ogies allows for a cost-efficient adjustment of training modules and equipment based on changing techno-logical trends and demands for specific skills.
Public research infrastructure enhances readinessFollower economies are adopting research agen-das to foster domestic capabilities to absorb, use
and eventually develop ADP technologies. In Turkey, the Scientific and Technological Research Council (TÜBİTAK)’s 2016 and 2017 national call for research proposals focused on ADP tech-nologies, including IoT (Erdil and Ertekin 2017). In Colombia, Colciencias — the Administrative Department for Science, Technology and Innovation — and the Tax Benefits Council amended the docu-ments governing the types of projects that can receive support (Colombia, DNP 2018). Colciencias now gives higher scores to projects by companies in areas related to ADP technologies. And it is adding a new category for “the use, production, integration and appropriation of information and communications technologies, digital transformation and Industry 4.0” to be incorporated into science, technology and innovation programs and projects (Colombia, DNP 2018, p. 182).
Research agendas should capitalize on comparative advantages in specific fieldsNovel research agendas also take advantage of com-parative advantages in specific research fields. Chile
various forms of creative spaces since the early 2000s,
generically referred to as modern “do it yourself” (diy)
movements — such as fab labs, hackerspaces, maker-
spaces, tech/innovation hubs and creative spaces — are
innovative attempts at bridging gaps left by markets and
states in providing education, building capacity and fur-
nishing smart manufacturing infrastructure.
Although different, diy movements generally offer
access to digital technologies that facilitate sharing
knowledge and diffusing creative ideas among com-
munities. they offer common spaces — physical or cyber
— where individuals can collectively create or tinker with
existing products to suit their needs with digital equipment
and hard tools. the movements often offer possibilities for
networking with possible investors, lenders, customers
and business partners.
the movements’ core functions are education, learn-
ing, problem solving and fostering entrepreneurship,
including peer-to-peer learning. they are commonly
included among innovation policy tools to strengthen digi-
tal ecosystems around start-ups in advanced economies
(Planes-satorra and Paunov 2019). they can also foster
university involvement, because many dyi facilities in
developing countries are located within higher education
organizations, which, in turn, provide equipment and train-
ers. the facilities train people in using digital equipment
and tools to make prototypes as part of projects. stu-
dents gain experience with advanced digital equipment
to increase their employability but also to venture into the
market as entrepreneurs.
diy movements usually search for solutions to
development challenges at the individual or commu-
nity level. but they could offer new avenues for general
public engagement in manufacturing, opening spaces
for inclusive and sustainable patterns of manufacturing
development.
Source: UNIDO elaboration based on Iizuka et al. (2019).
Box 4.10 Creative spaces can advance and democratize manufacturing development

136
re
sP
on
din
g to
Ad
vA
nC
ed
dig
itAl P
ro
du
Ct
ion
te
Ch
no
log
ies
4
“Objective, evidence-based debates are needed to inform decision-making for designing and implementing national strategies for smart manufacturing
expects to host about 70 percent of the world’s radio astronomy capacities by 2020 (Chile, Ministry of Foreign Affairs 2019). The Office of Economy of the Future, in project Astrodata¸ will capitalize on the opportunity to process astronomical big data, not only for scientific applications and human capital develop-ment, but for economic purposes.
Follower countries are exploring ways to reorient research infrastructureFollower countries are exploring ways to reorient existing research infrastructure, or create new facili-ties, particularly public or semipublic research centres specialized in ADP technologies. South Africa has proposed new research institutions linked to smart manufacturing and enhancing support and incuba-tion for emerging industries (Kraemer-Mbula 2019). Saudi Arabia’s National Industrial Strategy, now under development, is considering creating a network of public research centres to help firms improve pro-ductivity by adopting ADP technologies (Kingdom of Saudi Arabia 2018).
In sum
The arrival of ADP reinforces the pertinence of evidence-based strategies and policies
Evidence is needed to balance short-term concerns with longer-term development opportunitiesThis is not the first time the world has experienced uncertainty and anxiety due to rapid technological change (Mokyr et al. 2015). People tend to overem-phasize short-term concerns about possible losses in employment, human welfare and the sustainability of technological change — and to underestimate the possible long-term consequences of change, such as the emergence of new industries and innovations lead-ing to new, welfare-enhancing products and services. Thus, while policy initiatives are needed to cope with short-term adjustments in labour and other mar-kets, policy-makers should also foster the building of
capabilities to tap promising opportunities and to cap-ture benefits stemming from long-term economic and social transformations. So, to inform decision-making for designing and implementing national strategies for smart manufacturing, objective, evidence-based debates are needed.
Endorse multistakeholder, participatory processesResponses to smart manufacturing are best conceived as engaging multiple stakeholders, as documented in the literature (Santiago 2018). This is consistent with the principles of the new industrial policy, which stress multistakeholder participatory processes and public–private dialogues contributing to policy design and implementation (Rodrik 2007, 2018). This chapter, finding that several countries it reviews have participa-tory processes for preparing national smart manufac-turing strategies, supports that approach.
But be mindful of the challenges implied by “multiple helix” approaches to policy makingCountry responses often build around “multiple helix” approaches with academic, government, pri-vate sector and other organizations contributing to policy design and implementation. The organization and governance of such multistakeholder processes is complex and often challenges the possibility of ensur-ing that decisions follow an agreed roadmap, respect defined roles and responsibilities and are binding. Enhanced policy coordination mechanisms at mul-tiple levels are needed to bring about expected com-mitments from multiple stakeholders during policy implementation. Gaps may become major constraints keeping developing countries from benefitting from the 4IR. Further research should review ongoing initiatives to organize, govern and sustain participa-tory processes and suggest new institutional frame-works and capabilities for policy-making, design and implementation to accomplish such strategies. The lessons that emerge may contribute greatly to policies addressing traditional disconnects and poor interac-tivity in innovation systems, particularly in follower and laggard countries.

137
re
sP
on
din
g to
Ad
vA
nC
ed
dig
itAl P
ro
du
Ct
ion
te
Ch
no
log
ies
4
“The overarching pledge to leave no one behind in the 2030 Agenda for Sustainable Development calls for technological solutions to local problems accessible to all
Responses to ADP reinforce the importance of capability building
Countries at distinct stages of development require different responsesCountries at distinct stages of development require different responses according to their accumulated capabilities, manufacturing experience and stance towards global manufacturing in general and smart manufacturing in particular. The future of manu-facturing entails deep learning and unlearning, cre-ating new capabilities and reorienting old ones and helping people unable to adapt to the new trends to move towards alternative income-generating activities. There is no easy short cut.
Capabilities influence readiness for identifying opportunitiesThe extent to which countries can turn the emergence of ADP technologies into opportunities to leapfrog or to avoid the risks of falling further behind will depend on individual country responses and readi-ness through active industrial policy, digital literacy, skills and education — and not just wage rates, domes-tic markets and positions in GVCs. Moreover, as the experience of different countries leading the adoption of ADP shows, there is scope to turn environmental concerns into an additional impulse for industrializa-tion and growth.
…and are at the basis of catching up and forging aheadEvolving technologies require changes in capabilities, organizational structures, prospects for market entry and exit, power structures, incentives for investment, conditions for technological learning and knowledge transfer. Domestic capabilities to adopt, adapt and master external knowledge and to gradually develop new technologies are critical to countries using the opportunities offered by new technology. Dynamic countries are either pushing for sustained leadership or assuming follower positions and seeking to skip entry barriers or escape development traps. For the larg-est group — laggards and even some latecomers — the
ongoing technological revolution risks deepening and widening development gaps unless those countries decisively act to bridge technological and productive gaps. Development gaps may deepen and widen unless decisive efforts to bridge technological and productive capability gaps occur in both firms and countries. The overarching pledge to leave no one behind in the 2030 Agenda for Sustainable Development calls for techno-logical solutions to local problems accessible to all.
Identifying capability gaps calls for systematic searching and learning
What works and in which contexts?The diffusion of ADP technologies implies trial-and-error processes and great institutional variety. Flexibility and experiences of success and failure con-tribute meaningfully to informing policy (Freeman 1995). Informed choices about the desirable future of manufacturing-driven development require firms and governments to build on their strengths, recognize capability gaps and take risks to experiment and learn about what works and in which context. Even in front-runner economies, strategic responses remain at initial stages of implementation. Because role models are yet to emerge, policy-makers require information to shape evidence-based industrial strategies that can boost the performance of domestic agents. The complexity and systemic nature of ongoing transformations calls for enhanced policy intelligence and improved under-standing of the specific barriers and drivers of change in particular sectors and technology domains (Planes-Satorra and Paunov 2019).
Learning needs structureNational strategies have to specify objectives, measura-ble milestones and consistent indicators subject to rig-orous monitoring and evaluation. The need for clear assessment underscores the importance for learning of ongoing pilot projects carried out by diverse organiza-tions domestically and abroad. And in follower coun-tries, national strategies or roadmaps could improve by better identifying investment requirements (and

138
re
sP
on
din
g to
Ad
vA
nC
ed
dig
itAl P
ro
du
Ct
ion
te
Ch
no
log
ies
4
“Mobilizing technical centres to foster academia–industry interaction is a frequently used policy tool for knowledge sharing and awareness raising around ADPs
possible funding sources) for subsequent implemen-tation phases. The systematic use of methodologies to benchmark performance, to carry out foresight and prospective exercises are advisable, particularly because of the multistakeholder, participatory nature of setting strategy around ADP.
Policy should improve understanding of ADP technologies and the conditions for their development, adoption and dissemination
Policy should assist economic agents in addressing expected challengesNew policy approaches should assist economic agents in addressing expected challenges, while maximizing potential benefits and minimizing risks. Horizontal interventions in education, employment and infra-structure should align with technological and produc-tive transformations and the acquisition of new skills to access, use and master new technologies. The pos-sibilities of winning and losing and the need for new safety nets and containment mechanisms create a par-ticularly sensitive area in current development frame-works (Clifford 2018, Hiilamo 2019, White 2016).
Tools for assessing technologies and their possible contribution to business developmentNational strategies for smart manufacturing tend to be open about the technologies to be chosen and the sectors prioritized to spearhead the country’s entry into the 4IR. Generally, the recommendation for countries aspiring to break into new markets for industrial goods is to actively support firms embed-ding “digital” in their plans. However, this should build on objective evidence. Dissemination of ADP technologies may not make sense economically for many laggard, latecomer and even follower least devel-oped economies, at least in the short term, because of their current high factor prices and low capabilities. Adopting ADP technologies depends on their cost-effectiveness compared with existing technologies and productive processes, and on the adopter crossing
minimum digital capability thresholds in several func-tional areas (Andreoni and Anzolin 2019). Barriers to adopting the technologies result from unawareness of how they work, what they can do, and the difficulty of comparing their benefits with those of compet-ing, existing technologies or comparing the expected return with the perceived high upfront investment required. As documented in this report, mobilizing existing or new technical centres to foster academia–industry interaction is a frequently used policy tool among others for knowledge sharing and awareness raising around ADPs.
Both innovation and industrial policies are needed to advance ADP technologiesManufacturing remains the locus of learning and innovation in any industrial revolution — even non-manufacturing activities, which are gaining promi-nence, are often connected with manufacturing (Andreoni and Anzolin 2019). Innovation policies can foster the ability to respond to demands for new design and product development. But complementary industrial policies are needed to affect the incentives and shape the capabilities of designers and producers to meet customized demands. Both innovation and industrial policies can be adapted to the challenges of an increasing digital world (Mayer 2018). Not sur-prisingly, leadership in developing national strategies tends to be vested with organizations responsible for industry and/or science, technology and innovation.
A pledge to further international collaboration
Further international collaboration is neededThis chapter documented the value of close collabora-tion among countries at different stages of readiness and adoption of smart manufacturing. The poten-tial for expanding such collaboration is large. Most national strategies of follower countries reviewed for this report identify some frontrunner economy — such as Germany — as a preferred partner to facilitate tech-nology transfer, human resources development and

139
re
sP
on
din
g to
Ad
vA
nC
ed
dig
itAl P
ro
du
Ct
ion
te
Ch
no
log
ies
4
“ International policy coordination and collaboration should continue to buttress efforts to leap forward
joint implementation of pilot projects, and also to explore joint business models. But several other econo-mies are available to partner with and to learn from.
Latecomer, laggard and even follower countries may wish to diversify partnershipsLatecomer, laggard and even follower countries may wish to diversify partnerships, including with other countries at similar levels of adoption of ADP technolo-gies. Knowledge transfer can take place on a more equal footing and be closer to common realities. For instance, in the BRICS (Brazil, Russian Federation, India, China and South Africa), such collaboration is already moti-vating joint research and innovation on big data, ICT and other smart manufacturing technologies and their applications, and on ICT infrastructure and connectiv-ity (BRICS Information Centre 2017).
Boost the ability to address global development challengesHopes are rising for rapidly evolving science, tech-nology and innovation to help achieve several SDGs. ADP technologies are expected to boost the ability to address global development challenges and pro-vide global public goods of economic progress, health, energy and the environment, and to expand access to such goods to otherwise deprived or excluded seg-ments of the population (de Sousa Jabbour et al. 2018, UNCTAD 2018, UNIDO 2017c). But few
national strategies make explicit the intention to con-tribute to achieving global development objectives. And although South Africa and Malaysia’s strategies include declarations about such goals, their operation-alization is pending.
Closer collaboration should be the basis of strategiesCloser collaboration should underlie strategies to address developing countries’ diverging views on the challenges of ADP technologies for their progress towards inclusive and sustainable development. For example, cooperation is needed on the nature and direction of any reform to existing, or required new, regulatory and institutional frameworks to deal with issues around data, data privacy and security, and to ensure adequacy and fairness in the access to ADP technologies and the goods and services associated with them. While many of the questions are not new, the issues are becoming more pressing because of their possible implications for digital divides. Consensus on challenges and opportunities is still largely out of reach, and domestic politics are likely to stall major international collaborations. That is why interna-tional policy coordination and collaboration should continue to buttress efforts to leap forward, enabling organizations and countries to share knowledge and experiences on how to identify and address the oppor-tunities and challenges stemming from the 4IR — and ensure that no one is left behind.
Notes1. The extensive review of developed economies, which
generally fall in the frontrunner category, is out-side the scope of this chapter. The interested reader may refer to McKinsey & Co (2017) for the United States, European Commission (2017) for various European economies, and Santiago and Horst (2018) for Germany.
2. Industry 4.0 Summit and Expo 2018 under the theme of “Vision and Development Strategy in the Fourth Industrial Revolution,” July 12–13, 2018, Hanoi.
3. Sing (2017) glimpses at the complexity of public data infrastructure requirements and highlights horizon-tal technologies that allow general digital transac-tions, data architectures that protect personal privacy while enabling the collection and use of economic and social data, and core sectoral databases containing, and providing access to, digital intelligence of a given sector. These infrastructures should allow capturing value from data, and using data to govern economic activities.


141
Part BTrends in industrial development indicators


143143
This chapter studies the development of the world’s industrial activities. It examines the evolution of manu-facturing value added (MVA), the place of international trade in industrial growth, world employment trends in industry and their implications for labour productivity. Finally, the chapter presents a sectoral analysis focused on the evolution of high-technology sectors.
Evolution of world manufacturing value addedThe average growth rate of world MVA for 1991–2018, 3.13 percent, was slightly higher than the growth rate of gross domestic product (GDP), 2.80 percent (Figure 5.1). The difference suggests that the manufacturing sector was a growth engine for the world economy during that period.
The high growth of MVA compared with GDP has expanded manufacturing’s contribution to the world economy, as indicated by the increasing share of MVA in world GDP, starting at 15.2 percent in 1990 and
reaching 16.4 percent in 2018 (Figure 5.2). That share has not been exempt from ups and downs directly related to the business cycles exhibited in Figure 5.1.
Figure 5.1 suggests that MVA is more volatile than GDP. When the GDP growth rates were rising, MVA growth rates were rising even higher, and when GDP growth rates were declining, MVA growth rates were declining even lower. The volatility of MVA growth results from the difficulties many countries face in sus-taining long periods of industrial expansion.
Long-term economic growth was unstable over 1990–2018. The period is divided by three economic crises — during the early 1990s, 2001 and 2009 — each followed by a short-lived episode of recovery and growth. Since the 2009 economic crisis — the so-called global financial crisis, followed shortly by the European debt crisis — the world economy has regis-tered consistent growth, on average.
The post-2009 growth years have been favour-able for world manufacturing, despite a tumultuous
Chapter 5
Industrial trends
Figure 5.1 Annual growth rates of world MVA and GDP
Annu
al g
row
th ra
te (p
erce
nt)
-10
-5
0
5
10
2018201520102005200019951991
Average growth rate of MVA, 1991–2018
Annual growth of GDP
Annual growth of MVA
Average growth rate of GDP, 1991–2018
Note: GDP is gross domestic product. MVA is manufacturing value added. All values are in constant $ 2010.Source: UNIDO elaboration based on the Manufacturing Value Added database 2019 (UNIDO 2019g).

144
ind
us
tr
iAl t
re
nd
s
5
“Chinese manufacturing increased its share in world MVA from 3 percent in 1990 to 25 percent in 2018
2015–2016 characterized by high uncertainty in world markets, particularly in Europe because of the 2015 Greek debt crisis, the Brexit referendum and the after-math of the refugee crisis. The world economy showed solid growth in the manufacturing sector, higher than the long-term MVA average (see Figure 5.1).
That trajectory mostly reflects the performance of the industrialized economies and China, which represent around 80 percent of world manufacturing production (Figure 5.3). Despite the stability of that combined share over time, the relative shares of the industrialized economies and China have changed considerably. The remarkable dynamism of the Chinese manufacturing sector increased its share in world MVA from 3 percent in 1990 to 25 percent in 2018. Conversely, the industrialized economies’ share decreased from 79 percent to 55 percent during that time.
The other roughly 20 percent over 1990–2018 was jointly contributed by the developing and emerging industrial economies excluding China and the least developed countries (LDCs). But the LDCs contrib-uted just a fraction of a percentage point, highlight-ing their marginalization in world manufacturing
production and their low capability to integrate them-selves into global production networks.
Production became increasingly concentrated from 1990 to 2018 as the 12 leading manufactur-ing economies’ combined share of world MVA went from 71 percent to 74 percent (Figure 5.4). In 2018, only three countries — China, Japan and the United
Figure 5.2 Share of MVA in world GDP
13
14
15
16
17
20182017201620152014201320122011201020092008200720062005200420032002200120001999199819971996199519941993199219911990
Shar
e of
MVA
in w
orld
GD
P (p
erce
nt)
Note: GDP is gross domestic product. MVA is manufacturing value added. All values are in constant $ 2010.Source: UNIDO elaboration based on the Manufacturing Value Added database 2019 (UNIDO 2019g).
Figure 5.3 Share in world MVA by economy group
Shar
e in
wor
ld M
VA (p
erce
nt)
Least developedcountries
Industrializedeconomies
Developing and emergingindustrial economies(excl. China)
China
20182015201020052000199519900
20
40
60
80
100
Note: MVA is manufacturing value added. All values are in constant $ 2010. Industrialization level classification is based on Annex C.1.Source: UNIDO elaboration based on the Manufacturing Value Added database 2019 (UNIDO 2019g).

145
ind
us
tr
iAl t
re
nd
s
5
“Enhancing export performance requires expanding manufacturing exports
States — generated half of world manufacturing production.
The increase in China’s share of world MVA stands out against the background of several developed econ-omies performance that could not keep up. Brazil, France, Germany, Italy, Japan, Russian Federation, the United Kingdom and the United States all lost shares.
Only four of the 12 manufacturing leaders increased their share of world MVA: China, India, Indonesia and the Republic of Korea — all Asian coun-tries. Figure 5.4 thus depicts the successful industriali-zation of Asian economies over the past three decades.
Evolution of world manufacturing exportsInternational trade has been key to economic expan-sion in many countries. Access to the world market allows international winners to multiply their pro-duction and profits, far beyond the possibilities their domestic economies can offer.
The past 50 years’ trade increase is well docu-mented in the economic literature. In the con-text of globalization, enhancing a country’s export
performance has become necessary to improving its economic performance. In general, enhancing export performance requires expanding manufacturing exports, since around 80 percent of world exports are manufactured.
Manufacturing exports growth is thus tightly linked to manufacturing growth and economic growth. The pattern of world manufacturing exports growth closely resembles the patterns of MVA and GDP growth (Figure 5.5). All three — manufacturing exports, MVA and GDP — suffered clear declines in growth in the early 1990s, 2001 and 2009. Yet, the patterns diverged in 2015, when exports dropped while MVA and GDP grew solidly.
The 2015 decline in manufacturing exports coin-cided with instability in industrialized economies — particularly in the European Union as a consequence of the 2015 Greek debt crisis — and high commodity prices, which reduced the relative price of manufac-tured goods compared with primary goods.
Figure 5.5 highlights the great similarity of man-ufacturing exports growth across all the economy groups, that is, the correlation of the manufacturing
Figure 5.4 Share of the 12 largest manufacturing economies in world MVA
United Kingdom
Russian Federation
Indonesia
Brazil
France
Italy
Republic of Korea
India
Germany
Japan
United States
China
Share in world MVA (percent)
1990200020102018
0 5 10 15 20 25
Note: MVA is manufacturing value added. All values are in constant $ 2010.Source: UNIDO elaboration based on the Manufacturing Value Added database 2019 (UNIDO 2019g).
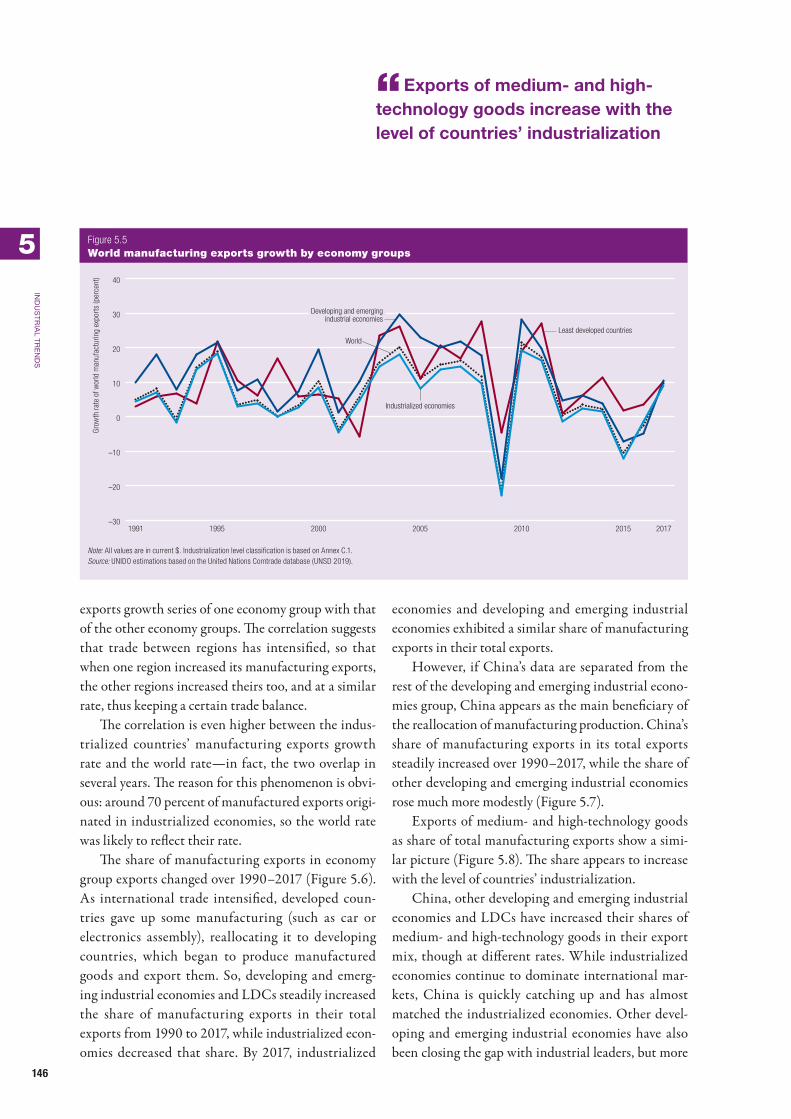
146
ind
us
tr
iAl t
re
nd
s
5
“Exports of medium- and high-technology goods increase with the level of countries’ industrialization
exports growth series of one economy group with that of the other economy groups. The correlation suggests that trade between regions has intensified, so that when one region increased its manufacturing exports, the other regions increased theirs too, and at a similar rate, thus keeping a certain trade balance.
The correlation is even higher between the indus-trialized countries’ manufacturing exports growth rate and the world rate — in fact, the two overlap in several years. The reason for this phenomenon is obvi-ous: around 70 percent of manufactured exports origi-nated in industrialized economies, so the world rate was likely to reflect their rate.
The share of manufacturing exports in economy group exports changed over 1990–2017 (Figure 5.6). As international trade intensified, developed coun-tries gave up some manufacturing (such as car or electronics assembly), reallocating it to developing countries, which began to produce manufactured goods and export them. So, developing and emerg-ing industrial economies and LDCs steadily increased the share of manufacturing exports in their total exports from 1990 to 2017, while industrialized econ-omies decreased that share. By 2017, industrialized
economies and developing and emerging industrial economies exhibited a similar share of manufacturing exports in their total exports.
However, if China’s data are separated from the rest of the developing and emerging industrial econo-mies group, China appears as the main beneficiary of the reallocation of manufacturing production. China’s share of manufacturing exports in its total exports steadily increased over 1990–2017, while the share of other developing and emerging industrial economies rose much more modestly (Figure 5.7).
Exports of medium- and high-technology goods as share of total manufacturing exports show a simi-lar picture (Figure 5.8). The share appears to increase with the level of countries’ industrialization.
China, other developing and emerging industrial economies and LDCs have increased their shares of medium- and high-technology goods in their export mix, though at different rates. While industrialized economies continue to dominate international mar-kets, China is quickly catching up and has almost matched the industrialized economies. Other devel-oping and emerging industrial economies have also been closing the gap with industrial leaders, but more
Figure 5.5 World manufacturing exports growth by economy groups
Gro
wth
rate
of w
orld
man
ufac
turin
g ex
port
s (p
erce
nt)
–30
–20
–10
0
10
20
30
40
2017201520102005200019951991
Industrialized economies
Least developed countriesWorld
Developing and emergingindustrial economies
Note: All values are in current $. Industrialization level classification is based on Annex C.1.Source: UNIDO estimations based on the United Nations Comtrade database (UNSD 2019).
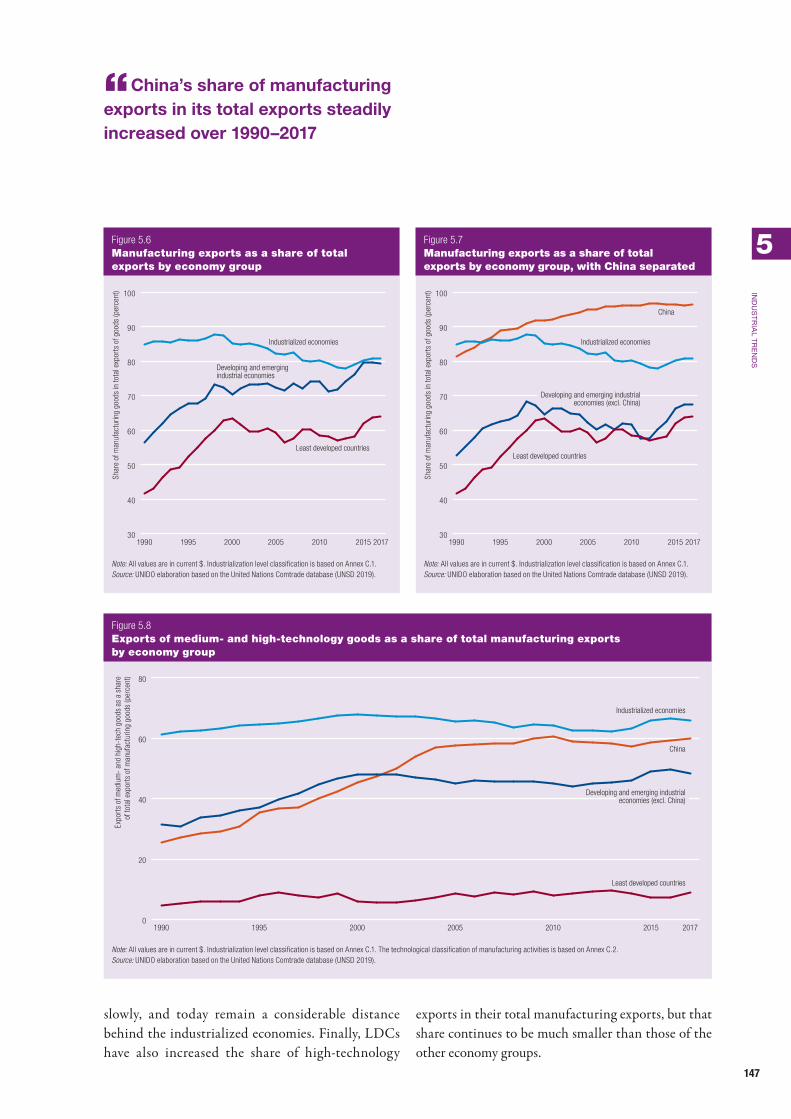
147
ind
us
tr
iAl t
re
nd
s
5
“China’s share of manufacturing exports in its total exports steadily increased over 1990–2017
slowly, and today remain a considerable distance behind the industrialized economies. Finally, LDCs have also increased the share of high-technology
exports in their total manufacturing exports, but that share continues to be much smaller than those of the other economy groups.
Figure 5.6 Manufacturing exports as a share of total exports by economy group
Shar
e of
man
ufac
turin
g go
ods
in to
tal e
xpor
ts o
f goo
ds (p
erce
nt)
Industrialized economies
Least developed countries
Developing and emergingindustrial economies
30
40
50
60
70
80
90
100
2017201520102005200019951990
Note: All values are in current $. Industrialization level classification is based on Annex C.1.Source: UNIDO elaboration based on the United Nations Comtrade database (UNSD 2019).
Figure 5.7 Manufacturing exports as a share of total exports by economy group, with China separated
Shar
e of
man
ufac
turin
g go
ods
in to
tal e
xpor
ts o
f goo
ds (p
erce
nt)
China
Industrialized economies
Least developed countries
30
40
50
60
70
80
90
100
2017201520102005200019951990
Developing and emerging industrialeconomies (excl. China)
Note: All values are in current $. Industrialization level classification is based on Annex C.1.Source: UNIDO elaboration based on the United Nations Comtrade database (UNSD 2019).
Figure 5.8 Exports of medium- and high-technology goods as a share of total manufacturing exports by economy group
Expo
rts
of m
ediu
m-
and
high
-tec
h go
ods
as a
sha
reof
tota
l exp
orts
of m
anuf
actu
ring
good
s (p
erce
nt)
0
20
40
60
80
2017201520102005200019951990
Industrialized economies
China
Least developed countries
Developing and emerging industrialeconomies (excl. China)
Note: All values are in current $. Industrialization level classification is based on Annex C.1. The technological classification of manufacturing activities is based on Annex C.2.Source: UNIDO elaboration based on the United Nations Comtrade database (UNSD 2019).

148
ind
us
tr
iAl t
re
nd
s
5
“Manufacturing sector employment increased 0.9 percent a year on average from 1992 to 2018
Evolution of world manufacturing employmentIncreased manufacturing production has generally been accompanied by increased labour demand. So, manufacturing sector employment also increased — around 0.9 percent a year on average from 1992 to 2018 (Figure 5.9). Its growth has been volatile, though positive on average. The fluctuation seems to relate directly to world MVA: employment growth has declined whenever MVA growth rate has declined.
But the relationship seems to have weakened between MVA and manufacturing employment in recent years. While world MVA growth was fairly stable around its average from 2011 to 2018, growth in world manufacturing employment slowed, turn-ing negative in 2018. The 2018 employment growth rate was the second-worst of the 1992–2018 period, −0.7 percent, surpassed only by the −1.4 percent rate during the 2009 economic crisis.
The conjunction of a fall of manufacturing employment growth with solid MVA growth means an increase in labour productivity in manufactur-ing, probably related to the rapid absorption of new
technologies (see next section). When this pro-ductivity increase is higher than in other sectors of the economy and it occurs simultaneously with an increase in the MVA share in GDP, it implies a decline in the share of manufacturing in total employment, as observed in Figure 5.10. Indeed, the highest share was reached at the beginning of the period (16.1 per-cent), and then it gradually declined to its lowest value, 14.2 percent, in 2018.
The declining share of manufacturing in world total employment cannot be fully understood with-out examining whether manufacturing employment was created in economy groups where manufacturing production was increasing. Figure 5.3 suggested that over 1990–2018, the economy groups’ shares in world MVA were stable and that while LDCs and develop-ing and emerging industrial economies (excluding China) held steady at around 20 percent of world MVA, China and the industrialized economies jointly held a roughly constant share of 80 percent. The most notable change was China’s increasing share, which went from 3 percent to 25 percent, while the industri-alized economies’ share decreased from 79 percent to 55 percent.
Figure 5.9 Annual growth rates of world manufacturing employment and world total employment
Annu
al g
row
th ra
te (p
erce
nt)
–2
–1
0
1
2
3
2018201520102005200019951992
World manufacturing employment
World employment
Average annual worldmanufacturing employment
growth rate (0.9%)
Average annual world employmentgrowth rate (1.4%)
Source: UNIDO elaboration based on ILO (2018).

149
ind
us
tr
iAl t
re
nd
s
5
“Most manufacturing employment growth occurred in developing and emerging industrial economies
But most manufacturing employment growth occurred in developing and emerging industrial econ-omies (excluding China) — in contrast to their stable share of world MVA. They increased their share in world manufacturing employment from 33.1 percent in 1991 to 40.0 percent in 2018 (Figure 5.11). China’s share increased from 33.6 percent to 36.4 percent and LDCs’ share from 3.1 percent to 6.1 percent. The industrialized economies share dropped from 30.2 percent to 17.5 percent.
The declining employment share in industrialized economies is not surprising, since their share of world MVA also fell. But a disproportionate increase in share of world employment took place in developing and emerging industrial economies (excluding China), whose share of world MVA was roughly constant. Conversely, China, which unquestionably thrived in its share of world MVA, increased its share of world employment only moderately, like the LDCs.
The differences across the economy groups between the world MVA share and world employment share trends suggest that the economy groups followed different paths in adopting technology and increasing labour productivity.
Evolution of the world’s manufacturing labour productivityChanges in MVA per worker — that is, in manufactur-ing labour productivity — result from changes in MVA and manufacturing employment. When value added expands faster than employment, labour productiv-ity rises. By contrast, when value added drops and employment increases, labour productivity declines.
Figure 5.10 Share of manufacturing employment in world total employment
13
14
15
16
17
2018201720162015201420132012201120102009200820072006200520042003200220012000199919981997199619951994199319921991
Shar
e of
man
ufac
turin
g em
ploy
men
t in
wor
ld to
tal e
mpl
oym
ent (
perc
ent)
Source: UNIDO elaboration based on ILO (2018).
Figure 5.11 Share in world manufacturing employment by economy group
Shar
e in
wor
ld m
anuf
actu
ring
empl
oym
ent (
perc
ent)
Least developedcountries
Industrializedeconomies
Developing and emergingindustrial economies(excl. China)
China
20182015201020052000199519910
20
40
60
80
100
Note: Industrialization level classification is based on Annex C.1.Source: UNIDO elaboration based on ILO (2018).

150
ind
us
tr
iAl t
re
nd
s
5
“During 1991–2018, labour productivity in the manufacturing sector grew faster than in the total economy
The preceding discussion showed that during 1991–2018, the world manufacturing value added grew faster than the total economy (see Figure 5.1). But world manufacturing employment grew slower than total world employment (see Figure 5.9). So, labour productivity in the manufacturing sector grew faster than in the total economy (Figure 5.12).
World productivity in manufacturing grew faster — 83 percent — than world productivity overall — 48 percent — over 1991–2018. Productivity often indicates innovation and technical change, so manufacturing’s higher productivity attests to man-ufacturing’s function as the catalyst for innovation and technological change and its status as the eco-nomic sector where most innovations are created and introduced.
Innovation differs greatly across countries. Although a few countries push the technological fron-tier forward with innovations, the vast majority focus on copying and adapting technologies to their own needs. Given the strong relationship between inno-vation and productivity, does productivity show the same disparity as innovation across countries?
The group of industrialized economies was the closest to the technological frontier in manufactur-ing labour productivity, using the United States as a proxy for the frontier (Figure 5.13). That group’s gap with the United States grew slightly from 1991 to 2018, as its productivity sank from 80.1 percent of U.S. productivity to 73.8 percent. The developing and emerging industrial economies productivity fell from 16.2 percent of U.S. productivity to 11.3 percent, and the LDCs’ productivity fell from 4.7 percent of U.S. productivity to 2.9 percent.
World manufacturing labour productivity grew around 2.3 percent a year over 1992–2018. Industrialized economies’ growth averaged around 3 percent a year, despite their reduced share of world MVA, higher than the world average and slightly higher than the 2 percent growth of developing and emerging industrial economies. LDCs reported the lowest productivity growth, 1.5 percent a year on average.
China’s manufacturing labour productivity growth rates were considerably higher than the world average and other economy group rates from 1992
Figure 5.12 World labour productivity in manufacturing and in the entire economy
0
50
100
150
200
2018201720162015201420132012201120102009200820072006200520042003200220012000199919981997199619951994199319921991
Labo
ur p
rodu
ctiv
ity (1
991
= 1
00)
Entire economyManufacturing
Note: Labour productivity is calculated as the value added per worker (in constant $ 2010).Source: UNIDO elaboration based on the Manufacturing Value Added database 2019 (UNIDO 2019g) and ILO (2018).

151
ind
us
tr
iAl t
re
nd
s
5
“Manufacturing’s higher productivity attests to its status as the economic sector where most innovations are created and introduced
to 2018, averaging 9.5 percent a year within a range of 5 percent to 16 percent (Figure 5.14). China’s rate slowed moderately towards the end of the period,
coinciding with improved wages and living conditions in the country. Even at its lowest level, Chinese pro-ductivity growth was higher than the world average.
The differences in productivity growth across economy groups — which result from employment and MVA trends — seem to depict a clear division. Industrialized economies, with state-of-the-art tech-nology in their productive units, have given away their labour-intensive operations to other countries while keeping the more knowledge-intensive ones. The industrialized economies are already highly produc-tive and are the fastest to adopt the technology they produce, pushing the technological frontier even fur-ther and removing themselves far from the rest of the world.
The developing and emerging industrial econo-mies, with most productive units presenting different degrees of technological backwardness, still use low wages as an advantageous entry point for their inte-gration into the global markets. The developing and emerging industrial economies adopt new technolo-gies after some delay, and their productivity typically grows slightly slower than that of the industrialized economies.
Figure 5.13 Labour productivity in manufacturing relative to U.S. productivity by economy group
2018201520102005200019951991
Rela
tive
labo
ur p
rodu
ctiv
ity in
man
ufac
turin
g (p
erce
nt, U
nite
d St
ates
= 1
00)
Industrialized economies
World
Least developed countries
0
20
40
60
80
100
Developing and emerging industrial economies
Note: Labour productivity is calculated as the value added per worker (in constant $ 2010). Industrialization level classification is based on Annex C.1.Source: UNIDO elaboration based on the Manufacturing Value Added database 2019 (UNIDO 2019g) and ILO (2018).
Figure 5.14 Manufacturing labour productivity growth rates by economy group
–10
–5
0
5
10
15
20
201820172016201520142013201220112010200920082007200620052004200320022001200019991998199719961995199419931992
Gro
wth
rate
of m
anuf
actu
ring
labo
ur p
rodu
ctiv
ity (p
erce
nt)
World
China
Least developed countries
Industrializedeconomies
Developing and emergingindustrial economies (excl. China)
Note: Labour productivity is calculated as the value added per worker (in constant $ 2010). Industrialization level classification is based on Annex C.1.Source: UNIDO elaboration based on the Manufacturing Value Added database 2019 (UNIDO 2019g) and ILO (2018).

152
ind
us
tr
iAl t
re
nd
s
5
“Structural change towards technology-intensive sectors promotes the development of innovative activities
Growth in labour productivity, though serving as a proxy for innovation, does not provide all the infor-mation needed to evaluate the technological and pro-ductive capabilities of a country or group of countries. That is because technological and productive capa-bilities are linked to structural change, with different manufacturing sectors differing in their contribution to innovation and growth.
Sectoral analysis of world manufacturing value addedSectoral analysis is needed because sectors do not con-tribute evenly to the expansion of technological and productive capabilities. A country’s specialization in low-tech sectors may hinder the growth of its tech-nological capabilities, prevent sustainable economic growth and permanently reduce long-run welfare (UNIDO 2013, 2015). By contrast, structural change towards technology-intensive sectors will increase
local demand for technical knowledge and engineer-ing services, promote the development of innovative activities and spread their positive externalities across the whole productive system.
In other words, specialization in producing goods with a low-knowledge, low-technology content reduces the creation and dissemination of local knowledge at a sectoral, national and regional level. Specialization in producing knowledge-intensive, high-technology goods produces synergies in the economic system and increase overall productivity. Specialization pat-terns thus shape further economic characteristics and account for phases of relative technological success and failure. Structural change that moves resources towards knowledge-intensive, high-technology goods will be positive, while countries persistently specializ-ing in low-tech sectors can be expected to have com-paratively limited technological and production capa-bilities (Cimoli and Correa 2005).
2005 2010 2015 2016 2017
Low-technology
Industrialized economies 67.5 59.1 53.0 52.6 51.8
Developing and emerging industrial economies (excluding China) 24.5 26.3 26.8 26.6 26.6
Least developed countries 0.6 0.9 1.3 1.3 1.4
China 7.4 13.7 19.0 19.5 20.2
Total 100.0 100.0 100.0 100.0 100.0
Medium-low-technology
Industrialized economies 68.4 59.3 53.5 52.9 52.8
Developing and emerging industrial economies (excluding China) 22.7 24.1 23.2 23.1 23.1
Least developed countries 0.2 0.3 0.4 0.4 0.4
China 8.6 16.3 22.9 23.6 23.7
Total 100.0 100.0 100.0 100.0 100.0
Medium-high- and high-technology
Industrialized economies 78.7 70.7 65.3 64.1 63.2
Developing and emerging industrial economies (excluding China) 14.3 15.8 15.4 15.3 15.3
Least developed countries 0.1 0.1 0.1 0.1 0.1
China 7.0 13.5 19.2 20.5 21.4
Total 100.0 100.0 100.0 100.0 100.0
Note: Each value represents the percentage share of an economy group in the global manufacturing value added (MVA) of the sectors corresponding to a specific technology level. See Annex C.1 for the economy group classification and Annex C.2 for the technological classification of manufacturing activities. MVA is in constant $ 2010.Source: UNIDO estimation based on UNIDO (2019f).
Table 5.1 Economy group shares in manufacturing goods at different technology levels

153
ind
us
tr
iAl t
re
nd
s
5
“Accelerated technical change has changed the structure of goods being produced
Industrialized economies dominated the produc-tion of medium-high-tech and high-tech goods from 2005 to 2017, even while their share in world MVA decreased from 78.7 percent to 63.2 percent (Table 5.1; see Figure 5.3). At all technology levels of goods — low, medium and high — industrialized economies led in the concentration of MVA and experienced a decrease over the period. Similarly, at all technology levels of goods, China increased its share of world MVA at the expense of the industrialized economies. Developing and emerging industrial economies had a stable share that increased slightly. LDCs expanded their share, but only in low- and medium-low-tech-nology goods. In sum, economy group shares in world MVA were fairly stable across the technology levels of goods.
Accelerated technical change has changed the structure of goods being produced. World manufac-turing is producing more sophisticated goods, char-acterized by higher knowledge content and requiring more advanced and complex production techniques. The share of medium-high- and high-technology goods in world MVA increased from 42.2 percent in 2005 to 45.6 percent in 2017 (Table 5.2). The share of low-technology goods in world MVA fell from 30.7 percent to 28.6 percent, and the share of medium-low-technol-ogy goods from 27.1 percent to 25.8 percent. Similar changes took place in all economy groups except LDCs, which slightly increased their share of low-technology products in MVA, highlighting the technological fra-gilities of these economies as their technological gap with the rest of the manufacturing world expanded.
2005 2010 2015 2016 2017
Industrialized economies
Low-technology 28.6 27.4 26.2 26.3 25.9
Medium-low-technology 25.6 24.3 23.9 23.9 23.8
Medium-high- and high-technology 45.9 48.3 49.9 49.8 50.3
Total 100.0 100.0 100.0 100.0 100.0
Developing and emerging industrial economies
Low-technology 35.9 33.6 32.4 32.0 31.7
Medium-low-technology 31.1 30.0 29.6 29.3 28.7
Medium-high- and high-technology 33.0 36.3 37.9 38.6 39.6
Total 100.0 100.0 100.0 100.0 100.0
Least developed countries
Low-technology 70.1 70.4 70.9 70.7 70.8
Medium-low-technology 21.6 20.5 19.7 18.9 19.2
Medium-high- and high-technology 8.3 9.1 9.4 10.4 10.0
Total 100.0 100.0 100.0 100.0 100.0
World
Low-technology 30.7 29.8 29.0 28.9 28.6
Medium-low technology 27.1 26.3 26.2 26.1 25.8
Medium-high- and high-technology 42.2 43.9 44.8 44.9 45.6
Total 100.0 100.0 100.0 100.0 100.0
Note: Each value represents the percentage share of a specific technology level in the total manufacturing value added (MVA) of an economy group. See Annex C.1 for the economy group classification and Annex C.2 for the technological classification of manufacturing activities. MVA is in constant $ 2010.Source: UNIDO estimation based on UNIDO (2019f).
Table 5.2 Technology level of goods by economy group


155155
Chapter 6
The Competitive Industrial Performance Index
The Competitive Industrial Performance IndexIndustrial competitiveness is key to inclusive and sus-tainable industrial development (ISID). It shapes sec-toral specialization and consequent structural change. It thus also determines the contribution of industry to overall prosperity and long-run sustainable growth.
UNIDO assesses and benchmarks industrial competitiveness through its Competitive Industrial Performance (CIP) Index. This index measures how much a country’s manufacturing sector contributes to development — how well industries produce goods, sell them on domestic and foreign markets and thus con-tribute to structural change (UNIDO 2019b).
The CIP Index covers three main dimensions. The higher the score on any dimension, the higher the country’s industrial competitiveness and its CIP Index (Figure 6.1):• Capacity to produce and export manufactured goods.
This dimension provides a comparable measure of a country’s manufacturing production for either local or foreign consumption. It is assessed by (1) manufacturing value added (MVA) per capita and (2) manufacturing exports per capita
• Technological deepening and upgrading. This dimension assesses the types of goods a country’s manufacturing sector produces. Because technol-ogy-intensive goods create technological spillovers and reduce vulnerability to price shocks, produc-ing them and, further, exporting them is rated as having higher expected benefits than producing lower-tech goods. This dimension is taken into account by (1) industrialization intensity, which captures the role and technological complexity of a country’s production and (2) export quality, which captures the technological complexity of the export bundle.
• World impact. The more a country participates in global markets, the higher its ability to benefit from agglomeration and scope and scale effects,
perhaps attracting shared infrastructure invest-ments and expanding trade agreement negotiating power. The world impact dimension is measured by the country’s impact on (1) world MVA and (2) world manufacturing exports.The CIP Index can assess a country’s industrial
performance across the three dimensions and bench-mark it against the country’s direct competitors or regional neighbours. By highlighting areas in which other countries achieve higher CIP scores, the index can guide policies for future development. Or by ana-lysing the manufacturing sectors of countries that per-form poorly, it can highlight inefficiencies in allocat-ing factors of production, such as labour and capital.
The CIP Index offers an intuitive starting point for more detailed analyses to identify inefficiencies. It thus helps a country pursue widespread productivity growth and structural change by highlighting targets determined by a country’s circumstances. Since struc-tural change is long term, changes in the country’s CIP Index are likely to follow the implementation of policies to increase competitiveness by several years.
Identifying a country’s competitors leads to draw-ing policy implications. This chapter, after presenting the main CIP results, examines them by geographi-cal region and by stage of industrialization. Although the competitors should be identified one by one based on such factors as geographical distance, the type of good produced, the availability of production fac-tors and whether competition is actual or potential, such analysis goes beyond the scope of the chapter. It concludes by relating the CIP Index and Sustainable Development Goal (SDG) 9: “Build resilient infra-structure, promote inclusive and sustainable industri-alization and foster innovation.”
Main resultsTable 6.1 ranks economies by their composite score on the 2019 CIP Index, using 2017 data — the lat-est available. The table groups economies into index

156
th
e C
om
Pe
tit
ive
ind
us
tr
iAl P
er
For
mA
nC
e in
de
x
6
“ Industrial competitiveness is key to inclusive and sustainable industrial development
quintiles — top, upper middle, middle, lower mid-dle and bottom.1 It depicts each economy’s stage of development — least developed countries (LDCs), other developing economies, emerging industrial economies and industrialized economies. The stage of development and competitiveness are cor-related. The top quintile of the CIP Index consists almost entirely of industrialized economies, while the majority of LDCs are concentrated in the bot-tom quintile. There are some exceptions, however. For example, the Philippines and Viet Nam are both classified as other developing economies, yet they perform better on the CIP Index than several industrialized economies and emerging industrial
economies and are ranked in the upper middle quin-tile of the CIP.
Figure 6.2 presents the scores and ranks of the top performing economies in the 2019 CIP Index. Germany achieved the highest composite score and thus ranks first — as it has for all years but one since 1990. Ranking second through fifth are Japan, China (surging from 22nd in 2000), the Republic of Korea and the United States. Figure 6.2 also shows the econ-omies setting the competitiveness benchmarks in five geographic regions and four development groups.
Although the CIP Index can range up to 1, the highest score — Germany’s — is only 0.5. This reflects the fact that no country leads on all CIP dimensions.
Figure 6.1 Dimensions of the CIP Index
1st DIMENSIONCapacity to produce and
export manufactures
3rd DIMENSIONWorld impact
2nd DIMENSIONTechnologicaldeepening and
upgrading
CompetitiveIndustrial
Performance(CIP)
Manufacturingexports per capita
Manufacturingvalue added per capita
Industrializationintensity
Country-specificimpact on worldmanufacturing
exports
Export qualityCountry-specific impacton world manufacturing
value added
Source: UNIDO (2017c).

157
th
e C
om
Pe
tit
ive
ind
us
tr
iAl P
er
For
mA
nC
e in
de
x
6
“The top quintile of the CIP Index consists almost entirely of industrialized economies; Germany, with the highest composite score, ranks first
■ Industrialized economies ■ Emerging industrial economies ■ Other developing economies ■ Least developed countries
Quintile Rank 2017 Country Score 2017 Rank 2015Change in rank,
2015–2017
Top quintile
1 Germany 0.5146 1
2 Japan 0.4043 2
3 China 0.3687 3
4 Republic of Korea 0.3646 5 ▲
5 United States of America 0.3551 4 ▼
6 Ireland 0.3237 7 ▲
7 Switzerland 0.3119 6 ▼
8 Belgium 0.2716 8
9 Italy 0.2690 9
10 Netherlands 0.2687 11 ▲
11 France 0.2605 10 ▼
12 Singapore 0.2563 12
13 Taiwan Province of China 0.2394 13
14 Austria 0.2242 14
15 Czech Republic 0.2153 18 ▲
16 Sweden 0.2076 17 ▲
17 United Kingdom 0.2070 15 ▼
18 Canada 0.2038 16 ▼
19 Spain 0.2009 19
20 Denmark 0.1754 21 ▲
21 Malaysia 0.1664 22 ▲
22 Mexico 0.1662 20 ▼
23 Poland 0.1649 23
24 Slovakia 0.1589 25 ▲
25 Finland 0.1481 26 ▲
26 Hungary 0.1459 27 ▲
27 Thailand 0.1458 24 ▼
28 Turkey 0.1343 28
29 Israel 0.1243 29
30 Australia 0.1152 30
Upper middle quintile
31 Russian Federation 0.1086 31
32 Romania 0.1084 33 ▲
33 Slovenia 0.1066 35 ▲
34 Portugal 0.1020 34
35 Brazil 0.0975 36 ▲
36 Norway 0.0970 32 ▼
37 Saudi Arabia 0.0951 37
38 Indonesia 0.0892 38
39 India 0.0844 39
(continued)
Table 6.1 2019 CIP Index

158
th
e C
om
Pe
tit
ive
ind
us
tr
iAl P
er
For
mA
nC
e in
de
x
6
“Ranking second through fifth are Japan, China, the Republic of Korea and the United States
Quintile Rank 2017 Country Score 2017 Rank 2015Change in rank,
2015–2017
Upper middle quintile
40 Lithuania 0.0830 40
41 Philippines 0.0728 43 ▲
42 United Arab Emirates 0.0720 41 ▼
43 Viet Nam 0.0713 46 ▲
44 Luxembourg 0.0691 42 ▼
45 South Africa 0.0680 44 ▼
46 Belarus 0.0669 45 ▼
47 New Zealand 0.0644 48 ▲
48 Estonia 0.0633 49 ▲
49 Islamic Republic of Iran 0.0616 53 ▲
50 Greece 0.0608 52 ▲
51 Argentina 0.0606 47 ▼
52 Chile 0.0602 51 ▼
53 Qatar 0.0578 50 ▼
54 Croatia 0.0550 56 ▲
55 Bulgaria 0.0541 58 ▲
56 Bahrain 0.0494 55 ▼
57 Latvia 0.0473 59 ▲
58 Trinidad and Tobago 0.0465 57 ▼
59 Kuwait 0.0444 54 ▼
60 Peru 0.0431 61 ▲
Middle quintile
61 Morocco 0.0425 60 ▼
62 Serbia 0.0411 65 ▲
63 Tunisia 0.0396 62 ▼
64 Malta 0.0385 66 ▲
65 Costa Rica 0.0382 67 ▲
66 Kazakhstan 0.0375 68 ▲
67 Ukraine 0.0373 69 ▲
68 Oman 0.0363 63 ▼
69 Bolivarian Republic of Venezuela 0.0354 64 ▼
70 Colombia 0.0352 70
71 Egypt 0.0338 72 ▲
72 Bangladesh 0.0336 73 ▲
73 Iceland 0.0313 71 ▼
74 North Macedonia 0.0299 79 ▲
75 El Salvador 0.0295 76 ▲
76 Guatemala 0.0294 75 ▼
77 Sri Lanka 0.0290 78 ▲
78 Panama 0.0285 74 ▼
79 Uruguay 0.0273 77 ▼
80 Bosnia and Herzegovina 0.0264 82 ▲
(continued)
Table 6.1 (continued) 2019 CIP Index

159
th
e C
om
Pe
tit
ive
ind
us
tr
iAl P
er
For
mA
nC
e in
de
x
6
“Asia and Pacific includes three of the top four countries on the CIP ranking
Quintile Rank 2017 Country Score 2017 Rank 2015Change in rank,
2015–2017
Middle quintile
81 Eswatini 0.0256 81
82 Jordan 0.0250 80 ▼
83 Pakistan 0.0240 83
84 Lebanon 0.0226 91 ▲
85 Brunei Darussalam 0.0220 87 ▲
86 Mauritius 0.0214 88 ▲
87 Hong Kong SAR, China 0.0207 85 ▼
88 Botswana 0.0205 86 ▼
89 Cambodia 0.0203 90 ▲
90 Myanmar 0.0202 97 ▲
Lower middle quintile
91 Ecuador 0.0193 89 ▼
92 Cyprus 0.0165 95 ▲
93 Honduras 0.0158 93
94 Georgia 0.0154 96 ▲
95 Algeria 0.0153 94 ▼
96 Côte d’Ivoire 0.0149 101 ▲
97 Namibia 0.0146 92 ▼
98 Paraguay 0.0138 98
99 Armenia 0.0133 104 ▲
100 Plurinational State of Bolivia 0.0130 99 ▼
101 Jamaica 0.0119 100 ▼
102 Nigeria 0.0114 84 ▼
103 Lao People’s Democratic Rep 0.0110 105 ▲
104 Congo 0.0105 114 ▲
105 Suriname 0.0100 106 ▲
106 Republic of Moldova 0.0098 111 ▲
107 Mongolia 0.0097 102 ▼
108 Barbados 0.0097 108
109 Albania 0.0096 109
110 Senegal 0.0093 113 ▲
111 State of Palestine 0.0093 110 ▼
112 Kenya 0.0093 107 ▼
113 Gabon 0.0092 112 ▼
114 Fiji 0.0092 116 ▲
115 Azerbaijan 0.0090 103 ▼
116 Syrian Arab Republic 0.0087 115 ▼
117 Cameroon 0.0083 117
118 Kyrgyzstan 0.0075 121 ▲
119 Bahamas 0.0072 120 ▲
120 Montenegro 0.0067 124 ▲
(continued)
Table 6.1 (continued) 2019 CIP Index

160
th
e C
om
Pe
tit
ive
ind
us
tr
iAl P
er
For
mA
nC
e in
de
x
6
“The CIP dimensions are path-dependent, so a country must make a continuous effort to move up in the rankings
CIP scores are distributed very unequally across the dimensions, and few economies achieve high scores.
Results by geographical region and development stageAlthough the overall CIP ranking provides a quick indication of a country’s industrial competitiveness compared with other countries, it tells nothing more
about the strengths and weaknesses of the country’s industrial system. Detailed analysis of a country’s per-formance on the three CIP dimensions is necessary to get a deeper understanding.
In general, the CIP dimensions are path-depend-ent, so a country must make a continuous effort to expand its industrial capabilities and move up in the rankings, which reflect its success or failure in
Quintile Rank 2017 Country Score 2017 Rank 2015Change in rank,
2015–2017
Bottom quintile
121 Zambia 0.0066 118 ▼
122 Papua New Guinea 0.0061 123 ▲
123 Ghana 0.0058 122 ▼
124 Zimbabwe 0.0054 125 ▲
125 Belize 0.0053 127 ▲
126 Madagascar 0.0052 126
127 United Republic of Tanzania 0.0047 119 ▼
128 Central African Republic 0.0046 131 ▲
129 Tajikistan 0.0041 130 ▲
130 Uganda 0.0041 128 ▼
131 Angola 0.0036 133 ▲
132 Nepal 0.0036 132
133 Mozambique 0.0035 129 ▼
134 Saint Lucia 0.0031 136 ▲
135 Cabo Verde 0.0031 138 ▲
136 Bermuda 0.0029 139 ▲
137 Haiti 0.0028 135 ▼
138 Malawi 0.0023 134 ▼
139 Rwanda 0.0022 141 ▲
140 Yemen 0.0017 140
141 Ethiopia 0.0016 148 ▲
142 Maldives 0.0016 144 ▲
143 Afghanistan 0.0012 143
144 Niger 0.0009 137 ▼
145 Macao SAR, China 0.0008 145
146 Iraq 0.0006 142 ▼
147 Gambia 0.0004 146 ▼
148 Burundi 0.0000 147 ▼
149 Eritrea 0.0000 149
150 Tonga 0.0000 150
Source: UNIDO elaboration based on the Competitive Industrial Performance Index 2019 database (UNIDO 2019c).
Table 6.1 (continued) 2019 CIP Index

161
th
e C
om
Pe
tit
ive
ind
us
tr
iAl P
er
For
mA
nC
e in
de
x
6
“Changes in yearly observations may provide policymakers timely insights into the effectiveness of current strategies
expanding competitiveness in comparison with other countries. The development of each dimension can take several years, so major movements seldom occur quickly. But small changes in yearly observations may provide policy-makers with timely insights into the direction of change and the effectiveness of current industrial strategies.
Europe is the leading region on all three CIP dimensions (Table 6.2).2 Europe excels on capac-ity to produce and export manufactures. In 2017, European countries ranked 37th on average on this CIP dimension, while North American countries, the immediate followers, ranked 49th. But the differ-ence is much smaller on the world impact dimension, where European countries rank 52nd on average, and North American countries rank 54th. In other words, while European countries produce and export consid-erably more manufactured goods per capita than their North American counterparts, they participate simi-larly in world markets, with high integration.
Latin America and Asia and Pacific follow Europe and North America at some distance. Latin America and Asia and Pacific are similar to each other in com-petitiveness, Latin America doing slightly better on
the first dimension, and Asia and Pacific on the sec-ond and third dimensions. The largest difference is the diversity of the groups of economies that make up each region. Asia and Pacific is the most diverse. It includes three of the top four countries on the CIP ranking (China, Japan and the Republic of Korea) and the top-ranking country on both the second dimension (Republic of Korea) and the third dimen-sion (China). But the region also contains many countries in the bottom quintile, including the very last: Tonga.
With such diversity, the Asia and Pacific average does not present a clear picture. The region has two poles of industrial competitiveness. One pole includes top industrial economies that can compete with any others. But the other pole includes economies at an early stage in their industrial development.
The African region ranks last because its indus-trial leaders — Egypt, Morocco, South Africa and Tunisia — cannot pull the rest of the region along. It has the highest presence of economies belonging to the bottom quintile of the CIP ranking, which overlap with the countries at the lowest level of development — the LDCs.
Figure 6.2 Scores and ranks of the top CIP performing economies in 2017
Bangladesh
Philippines
Poland
Switzerland
South Africa
Mexico
Canada
Singapore
Ireland
United States
Republic of Korea
China
Japan
Germany
CIP Index score
Top
5
0.0 0.1 0.2 0.3 0.4 0.5 0.6
Regi
onal
lead
ers
Deve
lopm
ent
lead
ers
Least developed countries
Other developing economies
Emerging industrial economies
Industrialized economies
Africa
Latin America
North America
Asia and Pacific
Europe
72
41
23
7
45
22
18
12
6
5
4
3
2
Rank 1
Note: CIP is Competitive Industrial Performance. “Regional leaders” and “development leaders” are runners-up if the top country in the region or development stage already appears among the top 5. See Annex C.1 for the economy group classification.Source: UNIDO elaboration based on the Competitive Industrial Performance Index 2019 database (UNIDO 2019c).

162
th
e C
om
Pe
tit
ive
ind
us
tr
iAl P
er
For
mA
nC
e in
de
x
6
“The level of industrialization is central to SDG 9
At each development stage, the ranking of the economy groups is fairly clear and unsurprising. There are exceptions — countries that perform unexpectedly well (or badly) for the group they belong to — but as exceptions they only confirm that, on average, indus-trialized economies are more competitive than emerg-ing industrial economies, which are in turn more competitive than other developing economies and the LDCs.
The emerging industrial economies seem much closer to the industrialized economies than to the other developing countries. The difference in proxim-ity is partly due to China’s traditional classification as an emerging industrial economy, which this report’s country classification observes. But even when China is taken out of the emerging industrial economies group, most of the difference remains, suggesting a sys-temic difference in industrial competitiveness between the emerging industrial economies and the other developing economies. While most emerging indus-trial economies are in the upper middle quintile of competitiveness and some (China, Mexico, Thailand
and Turkey) compete with industrialized economies for positions in the top quintile, the other developing economies are distributed around the lower middle quintile and none reaches into the top quintile.
Sustainable Development Goal 9SDG 9 aims to “build resilient infrastructure, pro-mote inclusive and sustainable industrialization and foster innovation.” SDG 9 includes eight targets, and 13 indicators to measure those targets. Among the targets, six link directly to UNIDO’s mandate as they cover the economic, social and environmental dimen-sions of ISID. Three of the indicators are part of the construction of the CIP Index.
SDG 9.2.1 Manufacturing value added as a proportion of GDP and MVA per capitaThe level of industrialization is central to SDG 9. It is often measured as MVA per capita and as the share of MVA in gross domestic product (GDP). Taken together, these indicators reflect countries’ manufactur-ing capabilities. SDG target 9.2 aims to “significantly
Economy groups
Capacity to produce and export
manufactures (1st dimension)
Technological deepening and
upgrading (2nd dimension)
World impact (3rd dimension) Overall rank
2015 2017 2015 2017 2015 2017 2015 2017
Geographical regions (averages)
Europe 38 37 42 42 53 52 43 42
North America 50 49 51 52 54 54 53 53
Asia and Pacific 81 81 80 80 74 73 76 76
Latin America 79 80 86 84 84 84 83 83
Africa 116 116 106 107 103 104 112 113
Development stages (averages)
Industrialized economies 27 27 42 42 43 43 34 34
Emerging industrial economies 63 62 60 60 54 53 56 55
Other developing economies 101 101 101 99 101 101 103 103
Least developed countries 135 134 110 112 116 117 126 127
Note: CIP is Competitive Industrial Performance. See Annex B.1 for the country-level rankings on the three CIP dimensions. See Annex C.1 for the economy group classification.Source: UNIDO elaboration based on the Competitive Industrial Performance Index 2019 database (UNIDO 2019c).
Table 6.2 CIP rankings on the three dimensions of industrial competitiveness by geographical region and industrialization level
163
th
e C
om
Pe
tit
ive
ind
us
tr
iAl P
er
For
mA
nC
e in
de
x
6
“Micro, small and medium-sized enterprises are the major sources of employment in developing economies
increase” the level of industrialization in developing countries. The target for LDCs is even more ambitious, to double the share of manufacturing in GDP.
The capacity to produce manufactured goods is also a key aspect of industrial competitiveness, and so MVA per capita is included in the first dimension of the CIP Index and MVA as a share of GDP in the sec-ond dimensions (see Annex B.2).
SDG 9.2.2 Manufacturing employment as a proportion of total employmentManufacturing employment as a share of total employment is a good indicator of structural change in an economy as a country moves from labour-inten-sive production to capital-intensive production.3 It also reflects the share of the population that directly benefits from the country’s industrial sector.
This indicator is not included in the CIP Index for reasons that go beyond data availability in develop-ing countries. Manufacturing employment as a pro-portion of total employment provides an ambiguous signal regarding the industrial competitiveness of an economy. An increase might look positive because it indicates that a higher share of people is benefitting from the industrial sector. But it might also indicate that the economy is specializing in labour-intensive sectors — featuring low salaries for low-priced and unskilled labour and limited creation of valued added — and thus failing to maximize long-term productive capabilities. Conversely, a reduction of manufactur-ing employment as a proportion of total employment might indicate that the economy is moving from labour-intensive towards knowledge-intensive sec-tors, adding more value to products and moving up the technological ladder while incorporating labour-saving technologies that increase industrial competitiveness.
Moving up the technological ladder — a pattern of structural change and sectoral specialization — takes place in some countries. But incorporating labour-saving technologies is global, as the world’s MVA continues to rise at the same time that manufacturing employment falls (see Chapter 5).
SDG 9.3.1 Proportion of small-scale industries in total industry value addedMicro, small and medium-sized enterprises are the major sources of employment in developing and emerging economies and therefore fundamental to providing incomes and alleviating poverty. Small-scale industries can easily participate in local markets, do not require huge investments or advanced technol-ogy and build on local know-how to respond flexibly to changing market conditions.
Yet, increasing the proportion of small-scale indus-tries in an economy can be detrimental. They often have low productivity and offer low wages due to inter-nal inefficiencies and an unsupportive business envi-ronment. On average, they are much less competitive than their bigger counterparts.
So, effective policies and an effective regulatory environment will support small-scale industries in accessing finance, interacting with suppliers and cus-tomers and reaching global markets. This will allow them to drive innovation in specific niches that directly benefit the population.
SDG 9.3.2 Proportion of small-scale industries with a loan or line of creditSmall-scale industries often lack access to finance to realize their potential, despite the comparatively small capital they need. The country may lack financial infra-structure. And banks are unlikely to provide credit for individuals who lack collateral, financial literacy and even bank accounts — factors that cumulatively make small-scale industries more likely to default on their debt. So, these firms often have access only to informal credit, which can be considerably more expensive than that offered in the formal banking sector.
Policies can support small-scale firms’ accessing to credit by reducing the risk of offering it. To share the risk, governments could offer financial backing to replace the collateral banks would otherwise require. And they can provide the infrastructure and skills necessary to ensure credit access to women. Credit access encourages entrepreneurship and innovation to exploit market opportunities. It can thus increase

164
th
e C
om
Pe
tit
ive
ind
us
tr
iAl P
er
For
mA
nC
e in
de
x
6
“Sustainable industrialization requires global cooperation and integration
small-scale firms’ competitiveness and enable them to integrate into local and global value chains.
SDG 9.4.1 Carbon dioxide emissions per unit of value addedAround one-third of global carbon dioxide (CO2) emissions are attributed to the manufacturing sector. Industrial development must, therefore, adapt to inte-grate environmental targets by adopting more efficient technologies and upgrading infrastructure to limit greenhouse gas emissions. SDG 9.4.1 highlights the need to reduce emission intensity, measured as CO2 emissions per unit of MVA.
Preservation of natural systems is imperative for every country’s welfare and must therefore be inte-grated into any development strategy. For this reason, the 2018 edition of the CIP report tried to incorporate environmental damage from industrial production with an adjusted CIP Index, in which the adoption of the most efficient technologies, the production of less emissions-intensive goods and investments in pollu-tion abatement positively affect a country’s evaluated level of competitiveness.
Preserving the environment goes beyond the impact of any single country’s environmental actions on its industrial competitiveness. It requires coop-eration every country should contribute to, since its
success (or failure) will have a global impact — so, sus-tainable industrialization requires global cooperation and integration. Global policies supporting environ-mentally sustainable manufacturing should promote economic growth and social inclusion, but not at envi-ronmental cost (UNIDO 2019b).
SDG 9.b.1 Proportion of medium- and high-tech industry value added in total value addedSDG 9.b.1 assesses the technological deepening of a country’s industrial sector based on the share of medium- and high-technology industry value added in total value added. This indicator is captured in the second dimension of the CIP Index (see Annex B.2 — the indicator is calculated from the table’s first and third columns).
This indicator is key to evaluating competitive-ness as reflected in a country’s capability to innovate and absorb new technologies, which is pivotal to long-term economic development and welfare. The share of medium- and high-technology industry in total pro-duction is highly correlated with levels of productivity and value added. That kind of industry is often linked with creating products with high knowledge content, which further increases the potential for knowledge spillovers across industries, thus increasing the pro-ductivity of the entire economy.
165
th
e C
om
Pe
tit
ive
ind
us
tr
iAl P
er
For
mA
nC
e in
de
x
6Notes1. More detailed results of the CIP Index can be found in
the Competitive Industrial Performance Report 2018 (UNIDO 2019b).
2. The distance between Europe and the other economy groups is considerable, but it also varies across dimen-sions. This existing heterogeneity in the CIP dimen-sions seems to fall short when comparing it with the existing differences of economies in the same region. For instance, without Bermuda, North America will be placed in the first position of the economy groups ranking, as United States and Canada jointly present a higher level of industrial competitiveness than their European counterparts.
3. The direction of the structural change moving from or towards capital-intensive modes of produc-tion depends on a country’s trade openness and
comparative advantages. Openness to trade and par-ticipation in global value chains lead to specialized production of specific goods that a country has a com-parative advantage in. This stimulates competitive-ness and increases net welfare. But the effects are not homogeneous across countries or across the labour force. Countries specializing in labour-intensive goods are expected to present higher employment rates in manufacturing than countries specializing in capital-intensive goods. And the sectoral specialization is not the only influence on employment. Foreign competi-tion forces workers in uncompetitive industries to relocate to high-productivity sectors. Their ability to do so depends on whether they have the specific skills needed for a different sector or can acquire them. So, there may be losers, even in highly competitive economies.


167
Annexes


169169
Annex A.1
Producing the landscape of production and use of ADP technologies (Chapter 1)
The landscape presented in Chapter 1 is based on a com-bination of two sources that provide reliable and com-parable data for all economies of the world: patent and trade data. Patent data are used to evaluate the innova-tiveness of economies in advanced digital production (ADP) technologies. Export data are used to analyse the competitiveness of economies producing capital goods related to these technologies, while import data are used to analyse the degree to which economies are using the technologies. This appendix explains the details of the procedures used to identify the relevant universe of patents and tradable goods (Section 1) and the criteria used to identify different groups of economies based on these variables (Section 2).
Measuring the creation and diffusion of ADP technologies using patent and trade dataThe goal is to capture in the same characterization the creation and diffusion of the core ADP technologies described in Chapter 1. Creation entails the invention of these technologies, while diffusion refers to their use in production. For countries that are not creating the technologies, their use is typically confined to the purchase of capital goods that embody them (such as industrial robots and 3D printers). Creation can thus take two forms: the invention of the technology and the production of capital goods embodying it. Patent data can capture the former, while trade data can cap-ture the latter. Exports of these goods would indicate production capabilities, while imports of them would indicate a certain degree of using them.
Keeping this goal in mind, Foster-McGregor et al. (2019) put forward a methodology to identify ADP patents and internationally traded goods. The focus is on four technologies: computer-aided design and computer-aided manufacturing (CAD-CAM), robot-ics, machine learning and additive manufacturing. As a first step, they identify patents that can be associated with those technologies, building on the classification
scheme provided by the Derwent Innovation Index of Clarivate Analytics. For the first three technolo-gies they focus on the class code T06, “Process and Machine Control,” extracting only patents within this code that are also related to either digital data exchange or machine learning, and applied to manu-facturing production. For additive manufacturing, they focus instead on the international patent clas-sification code B33Y, which specifically identifies 3D printing– related inventions. Their analysis identi-fies a total of about 45,000 patent family applications related to these fields. From this total, about 7,000 are regarded as high-quality/value patents or “global pat-ents,” since they were simultaneously filed in at least two of the four major patent offices in this technol-ogy field: the European Patent Office, the United States Patent and Trademark Office, the Japan Patent Office and the China National Intellectual Property Administration Office. The remaining 38,000 patent families are generically labelled as “regular patents.”
The second step of their analysis looks into trade statistics and identifies goods that can be associated with three technologies: CAD-CAM, robotics and additive manufacturing. The other key ADP technol-ogies (such as big data, cloud computing and machine learning) are not considered since software is the most important part of these technologies and is hard to find in the trade classification. Table A1.1 below pre-sents the Harmonized System (HS) codes included in the analysis to identify the closest goods that can be associated with the three technologies covered.
A warning: the imperfect overlap between these technologies and the HS codes inevitably means that earlier vintages of technology (such as third industrial revolution technologies) are included in the classi-fication. Despite this, the data should provide good insights into the production and use of advanced tech-nologies in these domains and identify countries with the capabilities to use (and potentially benefit) from such technologies.

170
An
ne
x A
.1
A
Constructing the groups of economiesThe characterization in Chapter 1 distinguished four broad groups of economies (frontrunners, followers, latecomers and laggards) and, within two of them, producers and users. The final result are the six groups in Chapter 1.
Frontrunners are economies with above-average numbers of global patent family applications.1 Due to the high concentration in the distribution of this type of patent, only 10 economies show above-average val-ues. They also present above-average market shares in the export and import of goods associated with ADP technologies.
All other categories are defined by looking simul-taneously at the distributions of six variables: applica-tions by patent family (considering both regular2 and global families), world market shares in trade (both exports and imports) and revealed comparative advan-tages in trade (for exports and imports). For each vari-able, countries are compared with the world average after frontrunners are excluded from the analysis.
For innovation, we consider as followers all economies that show an above-average number of
applications of global or of regular patent families. After the frontrunners are excluded, these average val-ues are 10 and 20, respectively. Countries below the average but still having non-zero patent activity are considered latecomers as innovators.
For export and import activity, we consider as fol-lowers economies that not only present above-average market shares but also a relative specialization in the trade of these capital goods (a revealed comparative advantage above 1). The corresponding world mar-ket average shares are 0.18 percent for exports and 0.29 percent for imports. Latecomers, in turn, are economies that present either above-average market shares or relative specialization in the trade of these goods, but not both simultaneously.
All other economies are laggards. Figure A1.1 pre-sents the results of this characterization. Each panel shows the economies with some activity in the cor-responding dimension (patents, exports or imports) that have not been categorized as frontrunners. They also present the average values of each dimension and identify the economies that fall in each of the six groups.
Technology Harmonized System codes included
Additive manufacturing
847710 (Injection-moulding machines)847720 (Extruders)847730 (Blow moulding machines)847740 (Vacuum moulding machines and other thermoforming machines)847751 (Other machinery for moulding or otherwise forming: For moulding or retreading pneumatic tires
or for moulding or otherwise forming inner tubes)847759 (Other machinery for moulding or otherwise forming) and847790 (Parts)
CAD-CAM 845811 (Horizontal lathes: Numerically controlled)845819 (Other lathes: Numerically controlled)845921 (Other drilling machines: Numerically controlled)845931 (Other boring-milling machines: Numerically controlled)845951 (Milling machines, knee-type: Numerically controlled)845961 (Other milling machines: Numerically controlled)846011 (Flat-surface grinding machines, in which the positioning in any one axis can be set up to an
accuracy of at least 0.01 mm: Numerically controlled)846021 (Other grinding machines, in which the positioning in any one axis can be set up to an accuracy
of at least 0.01 mm: Numerically controlled)846031 (Sharpening (tool or cutter grinding) machines: Numerically controlled)846221 (Bending, folding, straightening or flattening machines (including presses): Numerically controlled)846231 (Shearing machines (including presses), other than combined punching and shearing machines:
Numerically controlled)846241 (Punching or notching machines (including presses), including combined punching and shearing
machines: Numerically controlled)
Robotics 847950 (Industrial robots, not elsewhere specified or included)
Source: Foster-McGregor et al. 2019.
Table A1.1 Identifying ADP-related capital goods in trade statistics
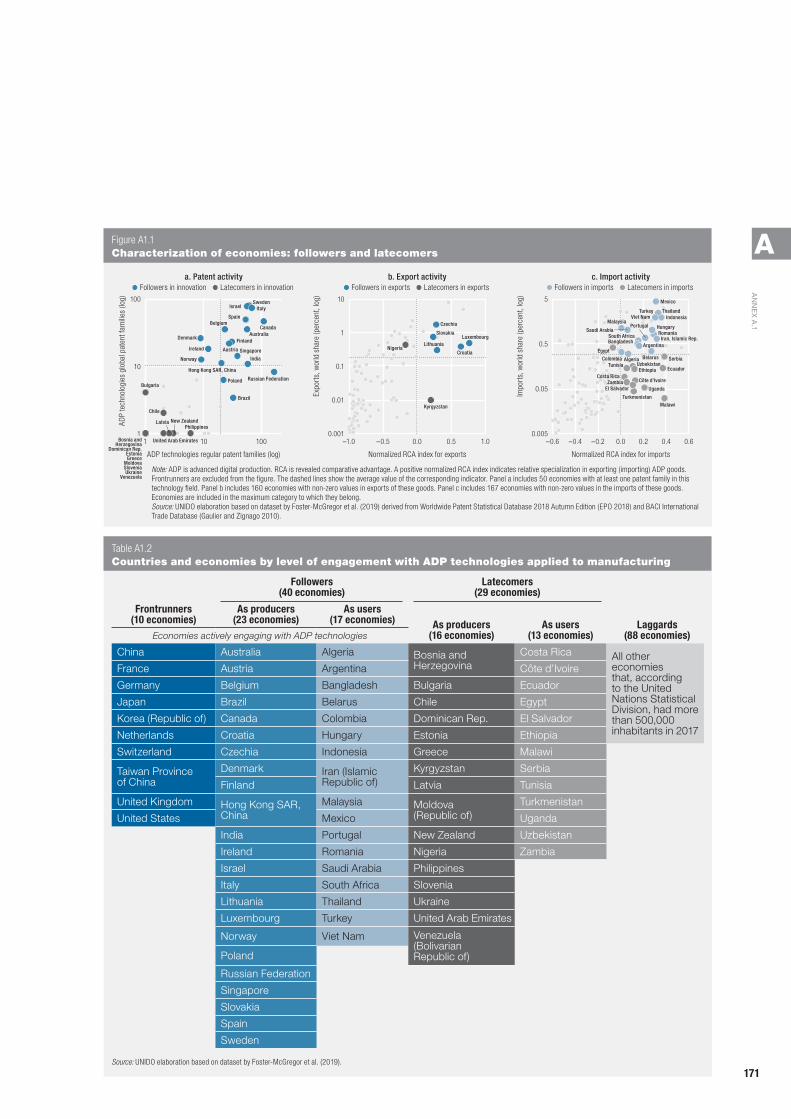
171
An
ne
x A
.1
AFigure A1.1 Characterization of economies: followers and latecomers
ADP
tech
nolo
gies
glo
bal p
aten
t fam
ilies
(log
)
a. Patent activity
ADP technologies regular patent families (log)
1001011
100
10
Expo
rts,
wor
ld s
hare
(per
cent
, log
)
b. Export activity
Normalized RCA index for exports
1.00.5–1.0 –0.5 0.0 0.60.2 0.4–0.6 –0.4 –0.2 0.00.001
10
1
0.1
0.01
0.005
5
0.5
0.05
Impo
rts,
wor
ld s
hare
(per
cent
, log
)
c. Import activity
Normalized RCA index for imports
Followers in innovation Latecomers in innovation Followers in exports Latecomers in exports Followers in imports Latecomers in imports
Kyrgyzstan
Nigeria
Costa Rica
Saudi ArabiaPortugal
Malaysia
Romania
Thailand
Czechia
LuxembourgLithuania
Slovakia
Croatia
Bulgaria
Chile
PhilippinesNew ZealandLatvia
Bosnia andHerzegovina
Dominican Rep.EstoniaGreece
MoldovaSloveniaUkraine
Venezuela
United Arab Emirates
SwedenIsrael Italy
Canada
Spain
Australia
Belgium
Russian Federation
Finland
Austria
Denmark
Singapore
India
Ireland
Hong Kong SAR, China
Norway
Poland
Brazil
South Africa
Mexico
Hungary
TurkeyViet Nam Indonesia
Iran, Islamic Rep.
Belarus
Argentina
Algeria
Bangladesh
Colombia
Côte d’Ivoire
Ecuador
Egypt
El Salvador
Ethiopia
Malawi
SerbiaTunisia
Turkmenistan
Uganda
Uzbekistan
Zambia
Note: ADP is advanced digital production. RCA is revealed comparative advantage. A positive normalized RCA index indicates relative specialization in exporting (importing) ADP goods. Frontrunners are excluded from the figure. The dashed lines show the average value of the corresponding indicator. Panel a includes 50 economies with at least one patent family in this technology field. Panel b includes 160 economies with non-zero values in exports of these goods. Panel c includes 167 economies with non-zero values in the imports of these goods. Economies are included in the maximum category to which they belong.Source: UNIDO elaboration based on dataset by Foster-McGregor et al. (2019) derived from Worldwide Patent Statistical Database 2018 Autumn Edition (EPO 2018) and BACI International Trade Database (Gaulier and Zignago 2010).
Table A1.2 Countries and economies by level of engagement with ADP technologies applied to manufacturing
Frontrunners (10 economies)
Followers (40 economies)
Latecomers (29 economies)
Laggards (88 economies)
As producers (23 economies)
As users (17 economies) As producers
(16 economies)As users
(13 economies)Economies actively engaging with ADP technologies
China Australia Algeria Bosnia and Herzegovina
Costa Rica All other economies that, according to the United Nations Statistical Division, had more than 500,000 inhabitants in 2017
France Austria Argentina Côte d’Ivoire
Germany Belgium Bangladesh Bulgaria Ecuador
Japan Brazil Belarus Chile Egypt
Korea (Republic of) Canada Colombia Dominican Rep. El Salvador
Netherlands Croatia Hungary Estonia Ethiopia
Switzerland Czechia Indonesia Greece Malawi
Taiwan Province of China
Denmark Iran (Islamic Republic of)
Kyrgyzstan Serbia
Finland Latvia Tunisia
United Kingdom Hong Kong SAR, China
Malaysia Moldova (Republic of)
Turkmenistan
United States Mexico Uganda
India Portugal New Zealand Uzbekistan
Ireland Romania Nigeria Zambia
Israel Saudi Arabia Philippines
Italy South Africa Slovenia
Lithuania Thailand Ukraine
Luxembourg Turkey United Arab Emirates
Norway Viet Nam Venezuela (Bolivarian Republic of)Poland
Russian Federation
Singapore
Slovakia
Spain
Sweden
Source: UNIDO elaboration based on dataset by Foster-McGregor et al. (2019).

172
Annex A.2
Knowledge-intensive business services and robots (Chapter 2)
Measuring knowledge-intensive business servicesGrowing intersectoral linkages between manufac-turing and services have contributed to the “blurring of traditional sectoral boundaries” (Berardino and Onesti 2018) in which the role of each sector in the production of goods is increasingly difficult to disen-tangle. Measuring how services, particularly knowl-edge-intensive ones, contribute to the production of manufactured goods is not easy. It requires the use of specific indicators capable of isolating their contribu-tion. An approach used extensively in the literature relies on the use of input–output-based measures to identify and quantify the intersectoral linkages between manufacturing and services.
That strategy is based on the subsystem approach. Building on the seminal contributions of Sraffa (1960) and Pasinetti (1973), the subsystem approach seeks to divide the economy into independent, vertically integrated production systems with no exchanges among each other. A subsystem is an autonomous part of the economy that includes all factors that directly and indirectly contribute to satisfying the final demand in manufacturing or services. Each subsystem represents all the domestic activities to satisfy the final demand for a particular product (Ciriaci and Palma 2016, Montresor and Marzetti 2011).
The contribution of a given knowledge-intensive business service (KIBS) industry to the final output of one specific subsystem (for instance, the manufac-turing subsystem) can then be measured as its share in the total value added generated by the subsystem. This vertical representation of a subsystem contrasts with the horizontal representation of the production structure, typically used in national account statistics, for instance by measuring the relative size of a sector by its share in GDP or aggregate employment, regard-less of the intersectoral linkages that connect different production systems.
The difference between the horizontal and verti-cal representations of a sector can be illustrated by the employment figures in manufacturing and services. Take employees in business service activities that sup-port the research and development (R&D) activity of manufacturers of electronic equipment. Although these workers are formally employed in a service sec-tor, their labour input supports the electronic equip-ment industry and is ultimately embodied in the pro-duction of final manufactured goods. In a subsystem approach, these workers are computed as part of the electronic equipment subsystems.
Based on this logic, the methodology to estimate the contribution of KIBS to manufacturing simply makes use of multiregional input–output techniques to estimate the final contribution of this sector to the total value added generated by the production of final manufactured goods in one specific country. The use of multiregional input–output tables also allows for capturing the portion of KIBS outsourced from abroad.3
Data for the assessment of the employment impact of industrial robotsThe econometric model to estimate the impact of the increased stock of industrial robots on employment draws on two major data sources: the 2016 version of the World Input-Output Database (WIOD, Timmer et al. 2015)4 and the database on industrial multi-purpose robots from the International Federation of Robotics (IFR 2017).5
WIOD covers 43 economies and the rest of the world with a detailed industry structure compris-ing 56 industries.6 The period covered is 2000–2014. The IFR industrial robots database provides data on industrial robots by industry for all major economies. The term industrial robot follows the definition of the International Organization for Standardization: an “automatically controlled, reprogrammable mul-tipurpose manipulator programmable in three or

173
An
ne
x A
.2
Amore axes” (IFR 2018, p. 29). The two key variables reported in the database are the number of robots newly installed in a year and the operational stock
of robots — the number of robots currently deployed (IFR 2018, p. 28). The econometric model uses the second variable.7

174
Annex A.3
Surveys of the adoption of digital production technologies by industrial firms (Chapter 3)
In 2017, a firm-level survey among Brazilian manu-facturing firms identified their current and expected technological level through detailed questions about the technologies the firm employed in different busi-ness function. Following the Brazilian data collection exercise, a similar survey was conducted in Argentina in 2018. To expand the coverage of these surveys and provide a more global picture, UNIDO promoted similar firm-level surveys in Ghana, Thailand and Viet Nam in 2019.
Differences and similarities across the surveys are present in the sample composition — that is, sectoral coverage, size of interviewed firms, and final sample size (Table A3.1 and Table A3.2). The UNIDO survey ques-tionnaire also presents some differences from the ques-tionnaires used in Argentina and Brazil (Table A3.3).8
Sample and coverageThe Brazilian survey was an initiative of the Brazilian National Confederation of Industry (CNI) imple-mented by the Euvaldo Lodi Institute (IEL) and tech-nically executed by the Federal University of Rio de Janeiro and State University of Campinas (Unicamp). Conducted between May and October 2017, it cov-ered 711 firms (Table 3.6) that had a minimum of 100 employees operating in the following sectors: agroindustry (food products, beverages and tobacco), automobile (motor vehicles and auto parts), basic met-als (iron, steel, pulp, cement), capital goods (electrical machinery, machinery and equipment), chemicals (petrochemicals, rubber and plastic products), con-sumer goods (textiles, garments, footwear, durable goods) and information and communications technol-ogy (office and computing machinery, communication instruments) and other sectors. The sample was strati-fied by sector and size.
The Argentine survey was an initiative of the Institute for the Integration of Latin America and the Caribbean (INTAL-IADB) in cooperation with the Center for the Implementation of Public Policies
Promoting Equity and Growth (CIPPEC) and the Argentinean Industrial Union (UIA). Conducted in the second half of 2018, it covered 293 firms operat-ing in six sectors of manufacturing industry: processed foods products, steel, light vehicles and parts and acces-sories, textile, agricultural machinery and biopharma-ceuticals. The sample was stratified by sector and size.
The Ghanaian survey, a UNIDO initiative, was conducted in the first half of 2019 in collabora-tion with the Council for Scientific and Industrial Research (CSIR)-Science and Technology Policy Research Institute (STEPRI). The targeted sample was 200 firms in the main economic areas of the country, in the regions of Greater Accra and Ashanti. The tar-geted firms were operating in five selected industrial activities (see Table A3.1). The sample was stratified by region, sector and size.9
The Thai survey, a UNIDO initiative, was con-ducted in the first half of 2019 with the financial and technical support of the Digital Economy Promotion Agency, Ministry of Digital Economy and Society. The targeted sample was 200 firms located in the Eastern Economic Corridor. The targeted firms were operating in four selected industrial activities (see Table A3.1). The sample was stratified by region, sector and size.10
The Vietnamese survey, a UNIDO initiative, was conducted in the first half of 2019 in collaboration with the National Center for Economic Forecast and Information. The targeted sample was 250 firms in the main economic areas of the country, the regions around Hanoi and Ho Chi Minh City. The targeted firms were operating in four selected industrial activi-ties (see Table A3.1). The sample was stratified by region, sector and size.
The methodology known as proportional proba-bilistic sampling was used to identify the sample frame. Once the sample frame was defined, firms were chosen randomly from data banks on industrial firms in each country (such as business registries). The ques-tionnaire was answered either by telephone followed

175
An
ne
x A
.3
A
by internet data collection (in Argentina and Brazil) or in face-to-face interviews by trained enumerators (in Ghana, Thailand and Viet Nam).
Since each country survey has unique sector and size specifications, some methodological steps were taken to build a dataset with comparable data that would allow for intercountry analysis. Firms from each original country database were organized accord-ing to common sectoral and size classifications. Then, after the identification of incongruences and the standardization of samples by country, the informa-tion was filtered to maintain respondents only in common sectors of activities. A final database of 1,157 firms was obtained (Table A3.2).
For covered topics (Table A3.3), the Brazilian sur-vey focused mostly on the current and expected use of digital production technologies, with a set of detailed and specific questions about digital technology
generations. All surveys included the same set of ques-tions on digital technologies, which represent the core of the survey as well as the main “common denomina-tor” across surveys. The Argentine survey extended the original scope of the Brazilian survey to include the possible implications for employment levels and skills. The UNIDO surveys in Ghana, Thailand and Viet Nam involved an even more complete set of topics, such as location of production and energy and sustain-ability. The UNIDO surveys also collected general firm characteristics (such as revenues from sales, num-ber of employees and type of employees).
Two dimensions of heterogeneity: Technological generations and business functionsTo adequately account for heterogeneity and for the coexistence of different production technologies, the
Table A3.1 Country samples and industry coverage
Argentina Brazil Ghana Thailand Viet Nam
Sample size 297 711 197 200 261
Sectors
Food and beverages
Textile and apparel
Electronics
Automotive
Metals
Plastic and rubber
Wood and furniture
Firm size (number of employees)
Minimum firm size — 100 20 20 20
Types of firms included
0–19
20–49
50–99
100+
Source: UNIDO elaboration based on data collected by the UNIDO firm-level surveys “Adoption of digital production technologies by industrial firms” and on Albrieu et al. (2019) and Kupfer et al. (2019).

176
An
ne
x A
.3
A
surveys in all five countries used a common method-ology, grounded on two specifications. The first speci-fication regards the coexistence of various generations of digital technologies within the same productive structures. All surveys followed a framework based on different digital technological generations, going from simple and analog ones (generation 0.0) to the most cutting-edge advanced digital production technologies (generation 4.0), as defined in Chapter 1 (see Figure 1.20). The second specification is related to the coex-istence of different production technologies across dif-ferent organizational functions even within the same firm. Five business functions were thus specified: sup-plier relations, product development, production man-agement, customer relations and business management.
By putting together these two specifications, a styli-zation of different generations of digital technologies
by business functions was obtained (Table A3.4). This implies that, when asked about the most used techno-logical generation, firms were not given a binary option (such as adopting or not adopting a specific advanced digital technology) but, instead, different alternatives ordered according to the degree of digital sophistica-tion, each specifying different technical solutions.
Measures for adoption of technological generations and readinessThe information on the technological generations adopted in each business functions can be used to assign a level of digital development to each firm. Although the availability of various answers (current and expected generations, and actions in five business functions) can provide a more consistent result than having to rely on only one observation, the disaggre-gation in different business functions poses a meth-odological challenge: how to assign to each firm a unique value representing its (current and expected) technological level, as well as the nature of mobiliza-tion efforts currently being executed? For this pur-pose, three firm-unique indicators were developed: currently adopted technological generation (Firmc); technological generation expected to be adopted in 5 to 10 years (Firme); and the stage of execution of plans and actions to reach the projected generation (Firma). These three aggregate indexes serve as the basis for
Table A3.2 Final sample composition by firm size and industry
Country Size
Sector
TotalTDI
industriesOther
sectors
Argentina
Large 22 16 38
Small 58 75 133
Total 80 91 171
Brazil
Large 193 135 328
Small — — —
Total 193 135 328
Ghana
Large — 59 59
Small — 138 138
Total — 197 197
Thailand
Large 69 36 105
Small 45 50 95
Total 114 86 200
Viet Nam
Large 73 84 157
Small 49 55 104
Total 122 139 261
Total 509 649 1,157
Note: Large firms have 100 or more employees. Small firms have fewer than 100 employees. TDI is technology- and digital-intensive. TDI industries include automotive and auto parts and electronics. Other sectors include food and beverages; textiles, leather and footwear; plastic and rubber; metal products; wood products; and furniture.Source: UNIDO elaboration based on data collected by the UNIDO firm-level surveys “Adoption of digital production technologies by industrial firms” and on Kupfer et al. (2019).
Table A3.3 Topic coverage by individual country
Topics Argentina Brazil Ghana ThailandViet Nam
Current and expected use of digital production technologies
Employment and skills
Location of production and trade
Energy and sustainability
Source: UNIDO elaboration based on data collected by the UNIDO firm-level surveys “Adoption of digital production technologies by industrial firms.”

177
An
ne
x A
.3
A
development of a fourth indicator: the UNIDO Digitalization Readiness Index (DRI).11
Currently adopted (Firmc ) and expected (Firme ) technological generationFirst, for each of the five business functions fi, the firm indicates the current and expected technological generation. Depending on its answers, for each busi-ness function the firm is assigned a score between 0 (for generation 0.0) to 4 (for generation 4.0) for cur-rent and expected technological generation. Second, the smallest value of fi is disregarded, assuming that even a technologically advanced firm may not need to adopt the most advanced technologies in all five busi-ness functions (for instance, firms operating on a sub-contracting basis may not need an integrated and fully automated customer relationship). Third, for each
firm an aggregate score — Sumc (for current technol-ogy generation) or Sume (for expected) — is obtained by summing up the scores of the four remaining fi (same procedure for Sume):
(1) Sumc = Σ fi _c – min{ fi _c }, where 4 ≤ Sumc ≤ 164
i=1
Fourth, to proxy for the technological generation associated to the firm, an aggregate index (Firmc or Firme = 0,1,2,3,4) is identified according to where the firm’s score falls within a range of limit values defined as follows (same procedure for Firme):
0 = generation 0.0 if 0 ≤ Sumc < 41 = generation 1.0 if 4 ≤ Sumc ≤ 62 = generation 2.0 if 7 ≤ Sumc ≤ 93 = generation 3.0 if 10 ≤ Sumc ≤ 124 = generation 4.0 if 0 ≤ Sumc ≤ 16
(2) Firmc =
Table A3.4 Digital technology generations and business functions
Generation of digital technologies
Business function
Supplier relationship
Product development
Production management Client relationship
Business management
G 4.0 Fourth generation: smart production
Real time web-based relation
Virtual development systems (such as virtual manufacturing)
Machine-to-machine system, cobots, augmented reality, additive manufacturing
Client relationship based online monitoring product use (such as artificial intelligence in customer services)
Business management supported by big data analytics
G 3.0 Third generation: integrated production
Digital system for processing orders, stocks and payments
Integrated data product system (such as product data management and/or product lifecycle management)
Computerized process execution system
Internet based support for sales and after services (such as mobile app, customer data analytics)
Integrated platform to support decision making (such as advanced enterprise resource planning)
G 2.0 Second generation: lean production
Automated electronic transmission of orders (such as email)
Computer-aided design and computer-integrated manufacturing, computer-aided engineering, computer-aided process planning
Partially or fully integrated computer-aided manufacturing
Automated devices to support sales (such as customer relationship management)
Enterprise resource management in few areas (such as enterprise resource planning)
G 1.0 First generation: rigid production
Manual electronic transmission of orders (such as email)
Stand-alone computer aided design
Stand-alone automation
Electronic contact (such as spreadsheet registry, email)
Information systems by area/department
G 0.0 Zero generation: analog production
Manual transmission of orders (such as personal contact, telephone)
Manual generation of designs (such as 2D/3D drawings in 2D space)
Non-micro-electronic based machinery
Manual handling of contacts (such as personal contact, telephone)
No software support to business management
Note: The technical solutions identified in correspondence of each technological generation and each business function have been specified with the support of specialized engineers (IEL 2018). Generation 0.0 was included only in the survey questionnaires collected in Ghana, Thailand and Viet Nam.Source: UNIDO elaboration based on Indústria 2027 Survey (IEL 2018) and on Kupfer et al. (2019).

178
An
ne
x A
.3
A The results in Chapter 3 correspond to the number of firms falling in each category as a share of the total number of firms in the considered sample.
Plans and actions to reach the projected generation (Firma )A similar four-step procedure was applied for the aggregate mobilization effort index (Firma). For each business function fi, the firm indicates whether it is already taking actions to reach the future technologi-cal generation, choosing among four possible types of actions — no action, ongoing initial studies, plan already formalized but not yet implemented, and plan formalized and already in execution. Depending on its answers, the firm is assigned a score between 1 (for no actions) and 4 (for plans in execution). Once the smallest value has been disregarded, each firm obtains an aggregate score (Suma) depending on the sum of the scores in the four remaining fi. The aggregate index (Firma = 1,2,3,4) to proxy for each firm’s efforts is identified according to where the firm’s score falls within a range of limit values:
1 = no action if 4 ≤ Suma ≤ 62 = initial studies if 7 ≤ Suma ≤ 93 = plan available but not yet implemented if 10 ≤ Suma ≤ 124 = plan in execution if 13 ≤ Suma ≤ 16
(3) Firma =
UNIDO digitalization readiness indexThe UNIDO Digitalization Readiness Index (DRI) is meant to proxy the readiness of the firm to adopt more advanced production technologies. It is obtained combining the three aggregate indices —Firmc , Firme and Firma — in such a way that the expectations about future technology generation are “grounded” using the information about the type of actions the firm is currently undertaking, these being an indication of the likelihood of reaching the expected technology generation.
The DRI is obtained as:
(4) DRI = Firmc + (Firme – Firmc ) * α
where α is a parameter whose value is defined as:
0 if Firma = 1 (no action)0.33 if Firma = 2 (initial studies)0.66 if Firma = 3 (plan available but not yet implemented)1 if Firma = 1 (plan in execution)
(5) α =
Based on their DRI, firms are classified in three readiness categories, as follows:
1 = lagging behind if DRI ≤ 22 = catching up if 2 < DRI < 43 = forging ahead if 4 ≤ DRI
(6) Firm readiness category =
Table A3.5 summarizes the results and the rela-tionship between the three aggregate indices —Firmc , Firme and Firma — and the readiness categories.
Table A3.5 Firm readiness categories
Firmc Firme
Firma
1 2 3 4
0 or 1
0 or 1 1 1 1 1
2 1 1 1 1
3 1 1 2 2
4 1 1 2 2
2
2 1 1 1 1
3 1 1 2 2
4 1 1 2 3
33 2 2 2 2
4 2 2 3 3
4 4 3 3 3 3
Note: A firm is not allowed to advance three generations even if there are plans in execution (for example, a firm that is currently in generation 1.0 and is expecting to be in generation 4.0 in 5 to 10 years). In this case, the firm is assigned Firme = Firmc. A firm is excluded if the expected technology generation in future is lower than current one.Source: Kupfer et al. 2019.

179179
Annex A.4
Summary of strategic responses to ADP technologies in 11 countries (Chapter 4)
Stra
tegy
nam
eTi
mel
ine
Resp
onsi
ble
agen
cySt
rate
gic
obje
ctiv
esSt
rate
gic
sect
ors
Polic
y in
stru
men
tsPe
rfor
man
ce in
dica
tors
Latin
Am
eric
a an
d t
he C
arib
bea
n
Arg
entin
aW
orki
ng g
roup
/m
echa
nism
set
up
to d
evel
op a
st
rate
gy
N/A
Min
istr
y of
Sci
ence
, Te
chno
logy
and
Pro
-d
uctiv
e In
nova
tion,
N
atio
nal I
nstit
ute
of
Ind
ustr
ial T
echn
olog
y
N/A
Dia
gnos
tic s
tud
ies
ongo
ing
or to
be
carr
ied
out i
n:•
Bio
tech
nolo
gy•
Fran
chis
ing
• S
oftw
are
• E
lect
ric v
ehic
les
• Te
xtile
s•
Hea
lth te
chno
logi
es•
Com
put
ers
• A
eron
autic
s an
d ae
rosp
ace
• S
hoes
• R
obot
ics
• 3D
prin
ting
N/A
N/A
Bra
zil
Pla
no d
e C
T&I
para
Man
ufat
ura
Ava
nçad
a no
B
rasi
l
N/A
Min
istr
y of
Sci
-en
ce, T
echn
olog
y,
Inno
vatio
n an
d C
omm
unic
atio
n
Pro
vid
e B
razi
lian
firm
s w
ith c
ond
ition
s to
acc
ess
and
adop
t sm
art m
anuf
actu
ring
ecos
yste
ms,
with
sup
-p
ort f
rom
sci
ence
, tec
h-no
logy
and
inno
vatio
n.
Ulti
mat
ely,
this
sho
uld
assi
st th
e d
evel
op-
men
t of s
trat
egic
val
ue
chai
ns, a
nd p
rom
is-
ing
econ
omic
sec
tors
ca
pab
le o
f ad
dre
ssin
g lo
cal d
eman
ds.
• A
eros
pace
and
d
efen
ce•
Agr
icul
ture
• H
ealth
-rel
ated
in
dus
trie
s•
Bas
ic c
hem
ical
s•
Bio
div
ersi
ty-b
ased
in
dus
trie
s•
Dig
ital i
ndus
trie
s•
Pet
role
um a
nd g
as•
Ren
ewab
le e
nerg
ies
From
Inno
vatio
n La
w
(Law
no.
13.
243
/ 20
16),
seve
ral p
ossi
ble
inst
ru-
men
ts a
re c
onsi
der
ed:
• D
irect
sub
sid
ies
• D
irect
cap
ital
inje
ctio
n/st
rate
gic
part
ners
hips
• Te
chno
logy
vou
cher
s•
Str
ateg
ic p
rocu
re-
men
t, no
tab
ly o
f sp
ecifi
c te
chno
logi
es•
Tax
bre
aks
• G
rant
s an
d sc
hola
rshi
ps•
Inve
stm
ent f
und
s•
Fina
ncia
l sec
uriti
es,
eith
er e
ncou
rage
d or
not
• In
vest
men
t in
rese
arch
and
dev
el-
opm
ent w
ithin
pub
lic
serv
ice
conc
essi
ons
or s
ecto
ral c
ontr
acts
Doc
umen
t pro
vid
es
subs
tant
ive
evid
ence
of
sci
entifi
c an
d te
ch-
nolo
gica
l pro
duc
tion
in
Bra
zil a
nd o
f tec
hnol
og-
ical
ad
optio
n by
firm
s.
Tabl
e A4
.1
Str
ate
gic
respon
ses
to A
DP
technolo
gie
s in
sele
cte
d e
conom
ies,
by
geogra
phic
al re
gio
n

180
An
ne
x A
.4
A
Stra
tegy
nam
eTi
mel
ine
Resp
onsi
ble
agen
cySt
rate
gic
obje
ctiv
esSt
rate
gic
sect
ors
Polic
y in
stru
men
tsPe
rfor
man
ce in
dica
tors
Chi
leS
trat
egic
Pro
-gr
amm
e S
mar
t In
dus
trie
s (P
EII)
20
15–2
025
2015
–201
7 (s
hort
-ter
m),
2018
–202
0 (m
ediu
m-t
erm
) an
d 20
20–2
025
(long
-ter
m)
Chi
lean
Eco
nom
ic
Dev
elop
men
t Age
ncy
(CO
RFO
)
• D
evel
op a
n en
ablin
g d
igita
l eco
syst
em to
un
der
pin
ind
ustr
ial
tran
sfor
mat
ion
• Fa
cilit
ate
coor
di-
natio
n b
etw
een
ind
ustr
ial s
upp
ly a
nd
dem
and
• D
evel
op a
mec
ha-
nism
to id
entif
y an
d se
lect
prio
rity
sect
ors
• C
ontr
ibut
e to
pro
-d
uctiv
ity a
nd v
alue
ad
diti
on in
dom
estic
in
dus
try
• M
inin
g (p
artic
ular
ly
cop
per
)•
Agr
icul
ture
and
food
• S
mar
t citi
es•
Oth
er s
ecto
rs to
b
e id
entifi
ed in
the
futu
re
Pub
lic–p
rivat
e pa
rtne
rshi
ps•
Incr
ease
d av
aila
ble
sp
eed
for
natio
nal
bro
adba
nd•
Pen
etra
tion
of h
igh-
spee
d in
tern
et•
Red
uced
defi
cit o
f hu
man
res
ourc
es
in IC
Ts•
Priv
ate
sect
or
part
icip
atio
n in
PE
II im
ple
men
tatio
n•
Num
ber
of i
ndus
trie
s in
volv
ed in
the
pro
gram
me
• In
tero
per
abili
ty in
m
inin
g•
Inte
rop
erab
ility
and
in
trod
uctio
n of
sen
-so
r te
chno
logi
es in
ag
ricul
ture
• U
rban
are
as w
ith
smar
t city
–ena
blin
g in
fras
truc
ture
Mex
ico
Roa
dm
ap20
30M
inis
try
of E
cono
my
• In
crea
se th
e va
lue
cont
ent o
f Mex
ican
m
anuf
actu
red
exp
orts
• E
nhan
ce in
dus
try–
acad
emia
col
lab
ora-
tion
as th
e ba
sis
for
inno
vatio
n•
Bec
ome
a d
ynam
ic
mar
ket f
or Io
T w
ithin
a
dec
ade
of a
dop
tion
of th
e ro
adm
ap
Aut
omot
ive,
aer
ospa
ce
and
chem
ical
s as
cas
e st
udie
s of
the
coun
try’
s m
anuf
actu
ring
para
-d
igm
s. O
ther
sec
tors
w
ill b
e d
esig
ned
base
d on
find
ings
from
oth
er
them
atic
roa
dm
aps
• P
ilot p
rogr
amm
es•
Boo
st d
igiti
zatio
n an
d ac
cess
to in
ter-
net s
ervi
ces
in th
e co
untr
y
• In
201
9 an
d 20
21,
two
regi
onal
clu
ster
s sh
ould
be
set i
n pl
ace
with
a m
anda
te
to d
evel
op In
dust
ry
4.0
hype
r-fle
xibl
e m
anuf
actu
ring
oper
-at
ing
syst
ems,
whi
ch
will
be th
e pl
atfo
rm
for s
yste
ms
inte
gra-
tion
and
appl
icat
ion
deve
lopm
ent
• B
y 20
22, t
he v
alue
of
the
dom
estic
m
arke
t for
IoT
shou
ld
amou
nt to
abo
ut
$8 b
illion
Tabl
e A4
.1 (c
ontin
ued)
S
trate
gic
respon
ses
to A
DP
technolo
gie
s in
sele
cte
d e
conom
ies,
by
geogra
phic
al re
gio
n

181
An
ne
x A
.4
A
Stra
tegy
nam
eTi
mel
ine
Resp
onsi
ble
agen
cySt
rate
gic
obje
ctiv
esSt
rate
gic
sect
ors
Polic
y in
stru
men
tsPe
rfor
man
ce in
dica
tors
Asi
a an
d P
acifi
c
Chi
naM
ade
in C
hina
20
2520
25, w
ith m
ile-
ston
es fo
r 20
20M
inis
try
of In
dus
try
and
Info
rmat
ion
Tech
nolo
gy (M
IIT)
is th
e le
ad a
genc
y,
but
res
pon
sib
ilitie
s fo
r im
ple
men
tatio
n ar
e sh
ared
by
othe
r ag
enci
es a
t diff
eren
t le
vels
To fa
cilit
ate
the
coun
-tr
y’s
evol
utio
n fr
om a
la
rge
man
ufac
turin
g co
untr
y to
a “
man
ufac
-tu
ring
pow
er”
stro
ng
in in
nova
tion
and
man
ufac
turin
g
• H
igh-
grad
e co
m-
put
er n
umer
ical
co
ntro
l mac
hine
to
ols
and
rob
ots
• A
eros
pace
eq
uip
-m
ent,
mar
ine
engi
-ne
erin
g eq
uip
men
t, hi
gh-t
ech
ship
s•
Ad
vanc
ed r
ail t
rans
it eq
uip
men
t•
Ene
rgy-
savi
ng a
nd
new
ene
rgy
vehi
cles
• E
lect
ric p
ower
eq
uip
men
t•
Agr
icul
tura
l mac
hin-
ery
and
equi
pm
ent
• N
ew m
ater
ial
• B
iom
edic
ine
and
high
per
form
ance
m
edic
al d
evic
es
• P
ublic
–priv
ate
part
ners
hip
• Va
lue
add
ed ta
x re
form
to ta
ke R
&D
in
to d
educ
tion
• P
erfe
ctin
g th
e m
ulti-
leve
l tal
ent t
rain
ing
syst
em
• R
&D
/rev
enue
• P
aten
ts/r
even
ue•
Com
petit
iven
ess
Inde
x*•
Valu
e ad
ded
ratio
in
crea
se•
Labo
ur p
rodu
ctiv
ity
grow
th ra
te•
Bro
adba
nd p
enet
ra-
tion
rate
• D
igita
l R&
D a
nd
desi
gn to
ols
pene
tra-
tion
rate
• C
ompu
ter n
umer
i-ca
l con
trol
of k
ey
proc
esse
s•
Red
uctio
n in
ene
rgy
cons
umpt
ion
per M
VA•
Red
uctio
n in
CO
2 em
issi
on p
er M
VA•
Red
uctio
n in
wat
er
cons
umpt
ion
per M
VA•
Indu
stria
l sol
id w
aste
co
mpr
ehen
sive
use
ra
te
Mal
aysi
aIn
dus
try4
wrd
2025
Min
istr
y of
Inte
r-na
tiona
l Tra
de
and
Inve
stm
ent
• A
ttra
ct s
take
hold
ers
to s
mar
t man
ufac
tur-
ing
tech
nolo
gies
and
p
roce
sses
. Inc
reas
e M
alay
sia’
s at
trac
tive-
ness
as
a p
refe
rred
m
anuf
actu
ring
loca
tion
• C
reat
e th
e rig
ht
ecos
yste
m fo
r sm
art
man
ufac
turin
g in
lin
e w
ith e
xist
ing
and
futu
re d
evel
opm
ent
initi
ativ
es•
Tran
sfor
m d
omes
tic
ind
ustr
y ca
pab
ilitie
s
• E
lect
rical
and
el
ectr
onic
s•
Mac
hine
ry a
nd
equi
pm
ent
• C
hem
ical
s, a
ero-
spac
e an
d m
edic
al
dev
ices
• A
utom
otiv
e•
Text
iles
• Tr
ansp
ort
• P
harm
aceu
tical
s•
Met
al•
Food
pro
cess
ing
• S
ervi
ces
• Fu
ndin
g an
d ou
t-co
me-
base
d in
cen-
tives
(tax
ince
ntiv
es)
• E
nabl
ing
ecos
yste
m
and
digi
tal i
nfra
-st
ruct
ure
(dig
ital
conn
ectiv
ity b
etw
een
diffe
rent
sta
keho
lder
s,
nota
bly
gove
rnm
ent,
firm
s an
d ed
ucat
ion
orga
niza
tions
)•
Reg
ulat
ory
fram
e-w
orks
(cre
atin
g a
dedi
cate
d sm
art m
an-
ufac
turin
g pl
atfo
rm,
seve
ral i
ssue
s ar
ound
da
ta g
ener
atio
n, s
tor-
age
and
use)
• D
edic
ated
trai
ning
and
up
skilli
ng p
rogr
amm
es•
Acc
ess
to s
mar
t te
chno
logi
es a
nd
stan
dard
s (th
roug
h pu
blic
–priv
ate
part
ners
hips
)
• In
crea
se b
y 30
per
-ce
nt p
rod
uctiv
ity p
er
per
son,
from
ab
out
$25,
000
• In
crea
se th
e ab
so-
lute
con
trib
utio
n of
m
anuf
actu
ring
to th
e na
tiona
l eco
nom
y fr
om a
bou
t $60
.7 b
il-lio
n to
$93
.7 b
illio
n•
Clim
b fr
om 3
5th
pla
ce to
the
top
30 in
th
e G
loba
l Inn
ovat
ion
Ind
ex r
anki
ng•
Aug
men
t fro
m
18 p
erce
nt to
35
per
-ce
nt th
e sh
are
of
high
-ski
lled
wor
kers
in
man
ufac
turin
g
Tabl
e A4
.1 (c
ontin
ued)
S
trate
gic
respon
ses
to A
DP
technolo
gie
s in
sele
cte
d e
conom
ies,
by
geogra
phic
al re
gio
n

182
An
ne
x A
.4
A
Stra
tegy
nam
eTi
mel
ine
Resp
onsi
ble
agen
cySt
rate
gic
obje
ctiv
esSt
rate
gic
sect
ors
Polic
y in
stru
men
tsPe
rfor
man
ce in
dica
tors
Thai
land
Thai
land
4.0
20-Y
ear
Nat
iona
l S
trat
egy
(201
7–20
36)
12th
Nat
iona
l E
cono
mic
and
S
ocia
l Dev
el-
opm
ent P
lan
(201
7–20
21)
2017
–203
6M
inis
try
of In
dus
try
• H
elp
Thai
land
ove
r-co
me
mid
dle
-inco
me
trap
• R
educ
e d
ispa
ritie
s an
d im
bala
nced
d
evel
opm
ent
• P
rom
ote
a sc
ienc
e,
tech
nolo
gy a
nd
inno
vatio
n–d
riven
ec
onom
y
• Fi
ve e
xist
ing
and
five
emer
ging
str
ate-
gic
sect
ors
to b
e id
entifi
ed
• D
igita
l par
ks, d
evel
-op
men
t zon
es•
Lear
ning
cen
tres
• In
tern
atio
nal c
olla
bo-
ratio
n m
echa
nism
s•
Inve
stm
ent i
n hi
gh-s
pee
d in
tern
et
infr
astr
uctu
re•
Inst
itutio
nal r
efor
ms
to c
reat
e fr
ame-
wor
k co
nditi
ons
for
dev
elop
men
t of k
ey
sect
ors,
incl
udin
g sp
ecifi
c in
cent
ives
(c
orp
orat
e ta
x re
duc
-tio
ns, R
&D
sub
sid
ies)
• To
be
det
erm
ined
Vie
t Nam
Dire
ctio
ns o
n fo
rmul
atin
g th
e na
tiona
l ind
ustr
ial
dev
elop
men
t p
olic
y un
til 2
030
with
a v
isio
n to
war
ds
2045
2025
with
mile
-st
ones
for
2020
Min
istr
y of
Sci
ence
an
d Te
chno
logy
(M
OS
T) i
s th
e le
ad a
genc
y, b
ut
resp
onsi
bili
ties
wer
e d
istr
ibut
ed a
cros
s d
iffer
ent a
genc
ies
at
diff
eren
t gov
ernm
ent
leve
ls
• S
tren
gthe
ning
the
coun
try’
s ca
paci
ty
to a
dd
ress
sm
art
pro
duc
tion
• B
road
ly d
efine
d as
IC
Ts, e
duc
atio
n,
scie
nce
and
tech
nol-
ogy,
but
als
o se
ctor
s in
fisc
al a
nd fo
reig
n tr
ade
• To
be
det
erm
ined
• To
be
det
erm
ined
Afr
ica
Sou
th
Afr
ica
Ind
ustr
ial P
olic
y A
ctio
n P
lan
2017
/18
–201
9/20
Dep
end
ing
on
initi
ativ
eD
epar
tmen
t of T
rad
e an
d In
dus
try,
Dep
art-
men
t of S
cien
ce a
nd
Tech
nolo
gy
• E
nhan
ce p
olic
y co
ord
inat
ion
• R
efor
m in
stitu
tiona
l en
viro
nmen
t to
boo
st
R&
D, i
nnov
atio
n an
d co
mm
erci
aliz
a-tio
n of
dom
estic
te
chno
logi
es•
Enh
ance
dig
italiz
a-tio
n of
the
econ
omy
• B
road
ly d
efine
d•
Inte
r-ag
ency
col
lab
o-ra
tive
initi
ativ
es•
Dev
elop
men
t of
sce
nario
s fo
r d
evel
opm
ent o
f sm
art m
anuf
actu
ring
and
req
uire
d p
olic
y re
spon
ses
• S
pec
ific
fund
ing
for
smar
t man
ufac
tur-
ing
–rel
ated
act
iviti
es•
Initi
ativ
es to
pro
mot
e up
take
and
diff
usio
n of
dom
estic
-gen
er-
ated
tech
nolo
gies
• Ta
rget
s fo
r go
vern
men
t see
d in
vest
men
t•
Num
ber
of i
ni-
tiativ
es to
pro
tect
em
plo
ymen
t
Tabl
e A4
.1 (c
ontin
ued)
S
trate
gic
respon
ses
to A
DP
technolo
gie
s in
sele
cte
d e
conom
ies,
by
geogra
phic
al re
gio
n

183
An
ne
x A
.4
A
Stra
tegy
nam
eTi
mel
ine
Resp
onsi
ble
agen
cySt
rate
gic
obje
ctiv
esSt
rate
gic
sect
ors
Polic
y in
stru
men
tsPe
rfor
man
ce in
dica
tors
Eur
op
e
Turk
eyS
mar
t Man
ufac
-tu
ring
Sys
tem
s Te
chno
logy
R
oad
map
N/A
Hig
her
Cou
ncil
of
Sci
ence
& T
echn
ol-
ogy,
the
Sci
entifi
c an
d Te
chno
logi
cal
Res
earc
h C
ounc
il of
Tu
rkey
To b
e d
eter
min
ed•
Dig
italiz
atio
n:
emp
hasi
s on
big
d
ata
and
clou
d co
m-
put
ing,
virt
ualiz
atio
n an
d cy
ber
-sec
urity
• C
onne
ctiv
ity:
emp
hasi
s on
IoT
and
sens
or te
chno
logi
es•
Futu
re fa
ctor
ies:
ad
diti
ve m
anuf
ac-
turin
g, a
dva
nced
ro
bot
ic s
yste
ms
and
auto
mat
ion
and
cont
rol s
yste
ms
• To
be
det
erm
ined
• To
be
det
erm
ined
Mid
dle
Eas
t
Sau
di
Ara
bia
Nat
iona
l Tra
nsfo
r-m
atio
n P
rogr
am.
Del
iver
y P
lan
2018
–202
0 V
isio
n 20
30 —
Ind
ustr
y 4.
0
2030
N/A
• In
crea
sing
com
pet
i-tiv
enes
s of
ind
ustr
ies
with
in s
ecto
rs o
f the
N
atio
nal I
ndus
tria
l D
evel
opm
ent a
nd
Logi
stic
s P
rogr
am•
Exp
and
exis
ting
valu
e ch
ains
and
d
evel
op n
ew o
nes
• M
itiga
te im
pact
of
refo
rms
in e
nerg
y,
natu
ral g
as a
nd
lab
our
mar
kets
• D
evel
op e
nviro
n-m
enta
l sys
tem
for
smar
t man
ufac
turin
g te
chno
logi
es•
Cre
ate
new
hig
h-sk
ill jo
bs to
att
ract
na
tiona
l lab
our
forc
e
• C
hem
ical
s an
d p
harm
aceu
tical
s•
Bas
ic m
ater
ials
• Fo
od a
nd b
ever
age
• Te
xtile
s•
Ad
vanc
ed in
dus
trie
s•
Bas
ic in
dus
trie
s/m
ater
ials
• E
stab
lishm
ent o
f ca
paci
ty-b
uild
ing
cent
res
for
pilo
t te
stin
g, d
emon
stra
t-in
g te
chno
logi
es,
trai
ning
and
cap
acity
d
evel
opm
ent
• Im
pro
vem
ents
in
annu
al o
per
atin
g in
com
e of
exi
stin
g as
sets
of fi
rms
end
orsi
ng s
mar
t m
anuf
actu
ring
• To
tal r
equi
red
tech
-no
logi
cal c
ost
* Com
preh
ensi
ve in
dex
cons
istin
g of
12
indi
cato
rs, d
evel
oped
by
AQSI
Q, t
he G
ener
al A
dmin
istra
tion
of Q
ualit
y Su
perv
isio
n, In
spec
tion
and
Qua
rant
ine.
Note
: MVA
is m
anuf
actu
ring
valu
e ad
ded.
IoT
is In
tern
et o
f Thi
ngs.
R&
D is
rese
arch
and
dev
elop
men
t. IC
T is
info
rmat
ion
and
com
mun
icat
ions
tech
nolo
gy.
Sour
ce: U
NID
O el
abor
atio
n.
Tabl
e A4
.1 (c
ontin
ued)
S
trate
gic
respon
ses
to A
DP
technolo
gie
s in
sele
cte
d e
conom
ies,
by
geogra
phic
al re
gio
n

184
An
ne
x A
.4
A Notes1. The average number of patent family application
across all economies with at least one patent in ADP technologies is 102.
2. That is, patent families that are not necessarily simul-taneously applied in two or more of the four patent offices used to define the global patents.
3. For details of the approach, see de Macedo and Lavopa (2017).
4. Data available at http://www.wiod.org/database/wiots16.
5. See https://ifr.org/worldrobotics.6. The industry structure is based on the Statistical
Classification of Economic Activities in the European Community (NACE) Rev. 2 industry classifica-tion and the System of National Accounts 2008 (SNA2008)/European System of National and Regional Accounts 2010 (ESA2010) methodology.
7. For details of the econometric model, see UNIDO background paper prepared by Ghodsi et al. (2019).
8. More detailed information about the sampling strat-egy and the structure of the questionnaire of the UNIDO surveys in Ghana, Thailand and Viet Nam are reported in the UNIDO background paper pre-pared by Kupfer et al. (2019).
9. To avoid an over-representation of small companies in the results, a binding constraint was introduced: no more than 50 percent of small companies in each sector.
10. As in Ghana, the number of small enterprises was limited to a maximum of 50 percent per sector in the sample.
11. For more information and details on the indica-tors, see the UNIDO background paper prepared by Kupfer et al. (2019).

185185
Annex B.1
Rankings on the three dimensions of the Competitive Industrial Performance Index, by geographical regions
Economy
Capacity to produce and export manufactures
(1st dimension)
Technological deepening and upgrading
(2nd dimension)World impact
(3rd dimension) CIP rank
2015 2017 2015 2017 2015 2017 2015 2017
Germany 5 5 6 5 3 3 1 1
Ireland 1 1 4 3 24 24 7 6
Switzerland 2 2 13 13 18 19 6 7
Belgium 4 4 21 21 17 17 8 8
Italy 19 18 24 24 7 6 9 9
Netherlands 7 7 27 30 14 13 11 10
France 22 21 22 22 6 7 10 11
Austria 6 6 16 16 25 25 14 14
Czechia 12 11 9 7 29 27 18 15
Sweden 9 10 18 19 26 26 17 16
United Kingdom 30 30 33 34 9 9 15 17
Spain 27 26 32 33 12 11 19 19
Denmark 10 9 26 20 33 33 21 20
Poland 39 36 25 26 22 22 23 23
Slovakia 14 14 10 9 41 39 25 24
Finland 13 13 30 27 39 38 26 25
Hungary 23 22 8 10 36 36 27 26
Turkey 48 48 37 37 20 20 28 28
Russian Federation 57 58 69 66 13 14 31 31
Romania 42 41 15 15 37 37 33 32
Slovenia 16 15 19 18 59 57 35 33
Portugal 35 34 49 48 42 42 34 34
Norway 18 20 59 67 43 46 32 36
Lithuania 26 25 36 39 60 59 40 40
Luxembourg 8 8 67 69 74 75 42 44
Belarus 49 50 23 23 56 55 45 46
Estonia 25 24 39 42 71 73 49 48
Greece 50 47 71 72 53 50 52 50
Croatia 45 43 43 46 67 63 56 54
Bulgaria 54 51 51 51 62 60 58 55
Latvia 41 40 55 55 77 76 59 57
Serbia 65 62 44 44 69 69 65 62
Malta 32 28 48 41 100 98 66 64
Ukraine 92 91 56 57 54 53 69 67
Iceland 24 27 87 89 104 107 71 73
North Macedonia 61 57 35 36 93 91 79 74
Table B1.1 European economies’ ranking on the three dimensions of industrial competitiveness

186
An
ne
x b
.1
B
Economy
Capacity to produce and export manufactures
(1st dimension)
Technological deepening and upgrading
(2nd dimension)World impact
(3rd dimension) CIP rank
2015 2017 2015 2017 2015 2017 2015 2017
Bosnia and Herzegovina 68 64 65 65 87 87 82 80
Cyprus 74 67 66 78 123 114 95 92
Georgia 96 93 74 74 108 103 96 94
Republic of Moldova 113 111 73 70 124 123 111 106
Albania 98 100 131 132 118 117 109 109
Montenegro 97 96 111 109 138 138 124 120
Europe (average) 38 37 42 42 53 52 43 42
Source: UNIDO elaboration based on the Competitive Industrial Performance Index 2019 database (UNIDO 2019c).
Table B1.1 (continued) European economies’ ranking on the three dimensions of industrial competitiveness
Economy
Capacity to produce and export manufactures
(1st dimension)
Technological deepening and upgrading
(2nd dimension)World impact
(3rd dimension) CIP rank
2015 2017 2015 2017 2015 2017 2015 2017
United States 31 31 28 31 2 2 4 5
Canada 20 19 46 47 11 12 16 18
Bermuda 99 97 80 77 149 148 139 136
North America (average) 50 49 51 52 54 54 53 53
Source: UNIDO elaboration based on the Competitive Industrial Performance Index 2019 database (UNIDO 2019c).
Table B1.2 North American economies’ ranking on the three dimensions of industrial competitiveness
Economy
Capacity to produce and export manufactures
(1st dimension)
Technological deepening and upgrading
(2nd dimension)World impact
(3rd dimension) CIP rank
2015 2017 2015 2017 2015 2017 2015 2017
Japan 17 17 7 6 4 4 2 2
China 52 52 5 8 1 1 3 3
Republic of Korea 11 12 1 1 5 5 5 4
Singapore 3 3 3 4 27 29 12 12
Taiwan Province of China 15 16 2 2 15 16 13 13
Malaysia 33 35 14 14 23 23 22 21
Thailand 46 46 12 12 21 21 24 27
Israel 21 23 29 28 38 40 29 29
Australia 34 33 91 95 28 28 30 30
Saudi Arabia 44 45 68 62 30 30 37 37
Table B1.3 Asia and Pacific economies’ ranking on the three dimensions of industrial competitiveness

187
An
ne
x b
.1
B
Economy
Capacity to produce and export manufactures
(1st dimension)
Technological deepening and upgrading
(2nd dimension)World impact
(3rd dimension) CIP rank
2015 2017 2015 2017 2015 2017 2015 2017
Indonesia 80 80 42 43 19 18 38 38
India 110 108 34 32 8 8 39 39
Philippines 81 81 11 11 31 32 43 41
United Arab Emirates 38 38 119 111 44 44 41 42
Viet Nam 79 77 31 29 32 31 46 43
New Zealand 37 37 94 92 57 56 48 47
Islamic Republic of Iran 77 75 62 60 35 34 53 49
Qatar 29 29 84 87 63 61 50 53
Bahrain 28 32 70 68 75 77 55 56
Kuwait 40 44 106 112 61 64 54 59
Kazakhstan 69 68 99 107 58 58 68 66
Oman 51 54 92 96 70 71 63 68
Bangladesh 114 113 63 58 45 43 73 72
Sri Lanka 86 86 75 76 65 62 78 77
Jordan 82 84 47 50 79 81 80 82
Pakistan 119 120 64 64 50 49 83 83
Lebanon 90 78 79 86 90 86 91 84
Brunei Darussalam 43 42 81 88 121 116 87 85
Hong Kong SAR, China 78 82 86 105 83 84 85 87
Cambodia 102 103 76 73 82 78 90 89
Myanmar 118 114 113 75 76 68 97 90
Armenia 95 89 110 104 114 110 104 99
Lao People’s Dem. Rep. 111 110 101 103 107 105 105 103
Mongolia 88 95 136 142 109 112 102 107
State of Palestine 112 112 98 93 115 119 110 111
Fiji 87 88 102 94 134 131 116 114
Azerbaijan 107 116 135 133 95 102 103 115
Syrian Arab Republic 126 123 117 116 94 93 115 116
Kyrgyzstan 121 117 96 99 127 124 121 118
Papua New Guinea 122 122 141 135 119 120 123 122
Tajikistan 135 135 104 101 131 129 130 129
Nepal 141 139 114 115 126 125 132 132
Yemen 145 144 120 129 133 133 140 140
Maldives 120 119 148 147 146 144 144 142
Afghanistan 146 145 143 146 130 135 143 143
Macao SAR, China 124 129 149 149 144 145 145 145
Iraq 143 143 147 150 125 128 142 146
Tonga 131 130 138 131 150 150 150 150
Asia and Pacific (average) 81 81 80 80 74 73 76 76
Source: UNIDO elaboration based on the Competitive Industrial Performance Index 2019 database (UNIDO 2019c).
Table B1.3 (continued) Asia and Pacific economies’ ranking on the three dimensions of industrial competitiveness

188
An
ne
x b
.1
B
Economy
Capacity to produce and export manufactures
(1st dimension)
Technological deepening and upgrading
(2nd dimension)World impact
(3rd dimension) CIP rank
2015 2017 2015 2017 2015 2017 2015 2017
Mexico 47 49 17 17 10 10 20 22
Brazil 70 69 53 52 16 15 36 35
Argentina 63 66 60 61 40 41 47 51
Chile 53 53 89 91 46 45 51 52
Trinidad and Tobago 36 39 45 45 80 82 57 58
Peru 76 72 93 90 51 48 61 60
Costa Rica 55 55 57 59 72 72 67 65
Bolivarian Republic of Venezuela 71 76 128 122 49 52 64 69
Colombia 89 92 78 80 52 51 70 70
El Salvador 72 71 50 49 81 79 76 75
Guatemala 83 85 54 54 68 70 75 76
Panama 56 61 97 102 78 80 74 78
Uruguay 58 60 90 98 84 85 77 79
Ecuador 93 94 126 127 73 74 89 91
Honduras 103 104 72 79 91 90 93 93
Paraguay 101 102 115 110 98 94 98 98
Plurinational State of Bolivia 106 106 140 128 89 89 99 100
Jamaica 94 98 85 84 113 115 100 101
Suriname 67 73 130 124 132 130 106 105
Barbados 73 74 58 56 137 139 108 108
Bahamas 91 90 77 71 140 140 120 119
Belize 100 99 124 108 141 141 127 125
Saint Lucia 104 101 123 118 147 146 136 134
Haiti 142 140 100 100 135 132 135 137
Latin America and the Caribbean (average) 79 80 86 84 84 84 83 83
Source: UNIDO elaboration based on the Competitive Industrial Performance Index 2019 database (UNIDO 2019c).
Table B1.4 Latin American and Caribbean economies’ ranking on the three dimensions of industrial competitiveness

189
An
ne
x b
.1
B
Economy
Capacity to produce and export manufactures
(1st dimension)
Technological deepening and upgrading
(2nd dimension)World impact
(3rd dimension) CIP rank
2015 2017 2015 2017 2015 2017 2015 2017
South Africa 64 65 52 53 34 35 44 45
Morocco 84 83 41 40 55 54 60 61
Tunisia 66 70 40 35 64 65 62 63
Egypt 105 105 61 63 48 47 72 71
Eswatini 60 59 38 38 103 101 81 81
Mauritius 59 56 83 82 105 104 88 86
Botswana 62 63 112 114 92 92 86 88
Algeria 108 109 146 144 66 66 94 95
Côte d’Ivoire 116 115 108 83 86 83 101 96
Namibia 75 79 118 121 101 106 92 97
Nigeria 115 132 116 119 47 67 84 102
Republic of Congo 109 107 129 123 112 108 114 104
Senegal 123 121 82 81 102 100 113 110
Kenya 128 128 95 106 85 88 107 112
Gabon 85 87 145 143 116 118 112 113
Cameroon 125 124 121 120 96 95 117 117
Zambia 127 125 133 130 106 109 118 121
Ghana 129 127 144 145 97 96 122 123
Zimbabwe 132 131 105 113 117 121 125 124
Madagascar 134 134 127 126 111 111 126 126
United Republic of Tanzania 133 136 132 139 88 99 119 127
Central African Republic 136 133 20 25 139 137 131 128
Uganda 138 138 122 125 110 113 128 130
Angola 130 126 150 148 99 97 133 131
Mozambique 137 137 137 140 120 122 129 133
Cabo Verde 117 118 107 85 143 143 138 135
Malawi 139 142 109 117 129 134 134 138
Rwanda 140 141 134 137 136 136 141 139
Ethiopia 149 146 139 136 122 126 148 141
Niger 147 148 88 97 128 127 137 144
Gambia 144 147 103 138 145 149 146 147
Burundi 148 149 125 134 142 142 147 148
Eritrea 150 150 142 141 148 147 149 149
Africa (average) 116 116 106 107 103 104 112 113
Source: UNIDO elaboration based on the Competitive Industrial Performance Index 2019 database (UNIDO 2019c).
Table B1.5 African economies’ ranking on the three dimensions of industrial competitiveness

190
Annex B.2
Sustainable Development Goals and the Competitive Industrial Performance Index
Economy
Proportion of medium- and high-tech industry value
added in total manufacturing value added (percent)
Manufacturing value added per capita
(2010 $)
Manufacturing value added as a proportion of GDP
(percent)
2017 2017 2017
Germany 61.68 10,064 21.33
Japan 56.77 10,191 21.14
China 41.45 2,254 31.27
Republic of Korea 63.01 7,548 28.62
United States 46.97 6,058 11.36
Ireland 54.32 24,077 32.18
Switzerland 64.55 14,688 19.07
Belgium 49.61 6,362 13.86
Italy 42.96 5,248 14.73
Netherlands 48.53 5,739 10.68
France 50.52 4,604 10.40
Singapore 78.16 9,437 17.63
Taiwan Province of China 69.53 4,525 21.94
Austria 45.97 8,913 18.03
Czechia 51.89 5,607 24.68
Sweden 52.09 7,766 13.44
United Kingdom 44.43 3,371 7.97
Canada 38.00 5,157 10.06
Spain 39.98 4,139 12.72
Denmark 55.34 7,733 12.47
Malaysia 44.12 2,682 23.28
Mexico 41.61 1,501 15.09
Poland 34.21 2,848 18.15
Slovakia 49.71 4,951 24.92
Finland 46.03 7,154 15.26
Hungary 56.59 3,007 19.10
Thailand 40.71 1,704 27.58
Turkey 32.21 2,460 16.47
Israel 42.40 4,098 11.43
Australia 28.20 3,833 6.05
Russian Federation 30.05 1,561 13.60
Romania 44.44 2,281 21.13
Slovenia 37.18 4,828 18.93
Portugal 25.04 2,856 12.41
Brazil 35.39 1,189 10.97
Norway 42.68 5,909 6.51
Table B2.1 Sustainable Development Goal 9 targets included in the CIP Index

191
An
ne
x b
.2
B
Economy
Proportion of medium- and high-tech industry value
added in total manufacturing value added (percent)
Manufacturing value added per capita
(2010 $)
Manufacturing value added as a proportion of GDP
(percent)
2017 2017 2017
Saudi Arabia 39.22 2,576 12.44
Indonesia 35.35 888 21.50
India 42.87 330 16.86
Lithuania 24.89 3,065 18.64
Philippines 43.32 651 22.49
United Arab Emirates 35.92 3,434 8.45
Viet Nam 38.68 309 16.84
Luxembourg 20.02 5,574 5.03
South Africa 24.43 927 12.37
Belarus 38.83 1,468 22.96
New Zealand 18.53 3,696 9.77
Estonia 27.48 2,799 14.68
Islamic Republic of Iran 46.02 868 12.46
Greece 20.03 1,829 8.24
Argentina 26.00 1,487 14.29
Chile 20.96 1,461 9.67
Qatar 47.86 5,961 9.21
Croatia 27.77 1,852 12.38
Bulgaria 29.21 1,113 13.41
Bahrain 22.17 3,315 15.01
Latvia 20.60 1,719 11.11
Trinidad and Tobago 39.60 2,428 15.41
Kuwait 32.87 1,544 4.62
Peru 15.13 795 12.91
Morocco 27.75 534 15.29
Serbia 26.75 728 15.20
Tunisia 28.87 665 15.65
Malta 37.97 2,202 7.65
Costa Rica 16.69 1,273 12.82
Kazakhstan 13.35 1,099 10.10
Ukraine 29.17 305 10.61
Oman 20.64 1,537 9.73
Bolivarian Republic of Venezuela 34.28 1,168 13.13
Colombia 23.33 835 10.99
Egypt 18.38 410 14.87
Bangladesh 9.76 222 20.47
Iceland 13.90 6,281 12.40
North Macedonia 29.61 709 13.51
El Salvador 19.13 749 19.35
Table B2.1 (continued) Sustainable Development Goal 9 targets included in the CIP Index
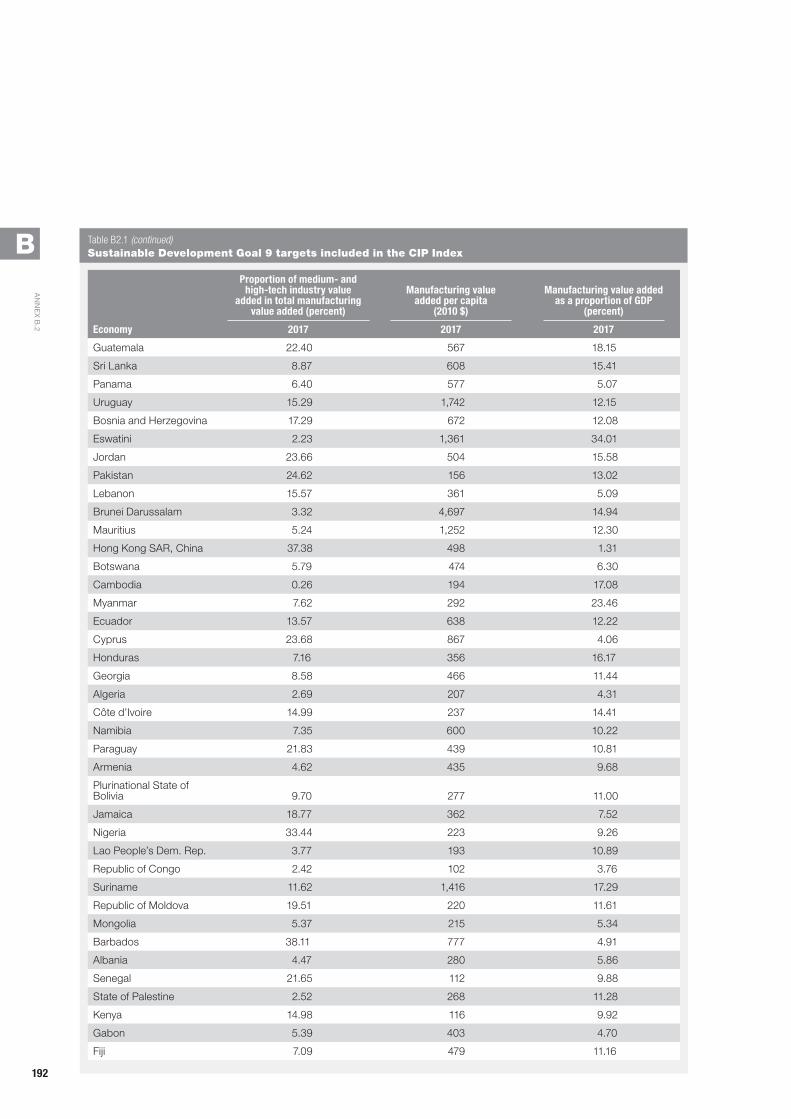
192
An
ne
x b
.2
B
Economy
Proportion of medium- and high-tech industry value
added in total manufacturing value added (percent)
Manufacturing value added per capita
(2010 $)
Manufacturing value added as a proportion of GDP
(percent)
2017 2017 2017
Guatemala 22.40 567 18.15
Sri Lanka 8.87 608 15.41
Panama 6.40 577 5.07
Uruguay 15.29 1,742 12.15
Bosnia and Herzegovina 17.29 672 12.08
Eswatini 2.23 1,361 34.01
Jordan 23.66 504 15.58
Pakistan 24.62 156 13.02
Lebanon 15.57 361 5.09
Brunei Darussalam 3.32 4,697 14.94
Mauritius 5.24 1,252 12.30
Hong Kong SAR, China 37.38 498 1.31
Botswana 5.79 474 6.30
Cambodia 0.26 194 17.08
Myanmar 7.62 292 23.46
Ecuador 13.57 638 12.22
Cyprus 23.68 867 4.06
Honduras 7.16 356 16.17
Georgia 8.58 466 11.44
Algeria 2.69 207 4.31
Côte d’Ivoire 14.99 237 14.41
Namibia 7.35 600 10.22
Paraguay 21.83 439 10.81
Armenia 4.62 435 9.68
Plurinational State of Bolivia 9.70 277 11.00
Jamaica 18.77 362 7.52
Nigeria 33.44 223 9.26
Lao People’s Dem. Rep. 3.77 193 10.89
Republic of Congo 2.42 102 3.76
Suriname 11.62 1,416 17.29
Republic of Moldova 19.51 220 11.61
Mongolia 5.37 215 5.34
Barbados 38.11 777 4.91
Albania 4.47 280 5.86
Senegal 21.65 112 9.88
State of Palestine 2.52 268 11.28
Kenya 14.98 116 9.92
Gabon 5.39 403 4.70
Fiji 7.09 479 11.16
Table B2.1 (continued) Sustainable Development Goal 9 targets included in the CIP Index

193
An
ne
x b
.2
B
Economy
Proportion of medium- and high-tech industry value
added in total manufacturing value added (percent)
Manufacturing value added per capita
(2010 $)
Manufacturing value added as a proportion of GDP
(percent)
2017 2017 2017
Azerbaijan 19.05 323 5.59
Syrian Arab Republic 21.52 55 3.30
Cameroon 7.61 212 14.03
Kyrgyzstan 2.71 147 13.54
Bahamas 27.77 599 2.34
Montenegro 14.86 315 4.08
Zambia 9.73 131 8.03
Papua New Guinea 12.61 54 2.35
Ghana 0.80 91 5.05
Zimbabwe 21.82 76 8.21
Belize 18.46 360 8.42
Madagascar 3.56 57 11.60
United Republic of Tanzania 6.47 58 6.78
Central African Republic 9.25 79 23.58
Tajikistan 2.19 120 12.41
Uganda 11.07 55 8.79
Angola 3.37 257 7.63
Nepal 8.38 40 5.41
Mozambique 10.89 46 8.76
Saint Lucia 7.83 184 2.51
Cabo Verde 27.10 208 5.88
Bermuda 27.06 795 0.93
Haiti 5.26 76 10.31
Malawi 11.34 46 9.47
Rwanda 6.66 46 6.01
Yemen 2.06 31 6.58
Ethiopia 16.07 28 5.60
Maldives 2.63 191 2.21
Afghanistan 9.51 66 10.52
Niger 16.86 24 6.16
Macao SAR, China 6.30 177 0.32
Iraq 6.91 47 0.87
Gambia 3.90 25 4.68
Burundi 2.57 24 10.80
Eritrea 4.31 35 5.80
Tonga 1.61 244 6.26
Note: Economies are ordered according to their Competitive Industrial Performance (CIP) Index in 2017. The present table is based on official data, but estimates were made for missing values and outliers following the procedures in UNIDO (2019b). See Annex C.2 for the technology classification of manufacturing activities.Source: UNIDO elaboration based on the Competitive Industrial Performance Index 2019 database (UNIDO 2019c).
Table B2.1 (continued) Sustainable Development Goal 9 targets included in the CIP Index

194
Annex C.1
Country and economy groups
INDUSTRIALIZED ECONOMIES
Asia and Pacific
Australiaa,b,c Hong Kong SAR, Chinaa Kuwait New Zealanda,c United Arab Emirates
Bahrain Israela Macao SAR, China Qatar
French Polynesia Japana,b,c Malaysiaa Singaporea,c
Guam Korea, Republic ofa,b,c New Caledonia Taiwan Province of Chinab
Europe
Andorra Estoniaa,b,c Irelandb Monaco Slovakiaa,b,c
Austriaa,b,c Finlanda,b,c Italya,b,c Netherlandsa,b,c Sloveniaa,b,c
Belarus Francea,b,c Liechtenstein Norwaya,b,c Spaina,b,c
Belgiuma,b,c Germanya,b,c Lithuaniaa,b,c Portugala,b,c Swedena,b,c
Czechiaa,b,c Hungarya,b,c Luxembourgb Russian Federation ab Switzerlandb
Denmarka,b,c Icelanda Maltaa,b San Marino United Kingdoma,b,c
Latin America and the Caribbean
Aruba Cayman Islands French Guiana Trinidad and Tobago
British Virgin Islands Curaçao Puerto Rico United States Virgin Islands
North America
Bermuda Canadaa,b,c Greenland United Statesa,b,c
EMERGING INDUSTRIAL ECONOMIES
Africa
Egypt Mauritius South Africaa Tunisiaa
Asia and Pacific
Brunei Darussalam Indiaa,b Iran, Islamic Republic of Oman Thailanda
Chinaa,b,c Indonesiaa,b Kazakhstana Saudi Arabiaa
Europe
Bulgariaa,b Greecea,b,c Polanda,b,c Turkeya,b,c
Croatiaa,b Latviaa,b Romaniaa,b,c Ukraine
Cyprusa,b North Macedonia Serbia
Latin America and the Caribbean
Argentinaa,c Chilea,c Costa Ricaa Perua Uruguay
Brazila,b Colombiaa Mexicoa,b,c Suriname Venezuela, Bolivarian Republic of
OTHER DEVELOPING ECONOMIES
Africa
Algeria Congo, Republic of the Gabon Moroccoa Seychelles
Botswana Côte d’Ivoire Ghana Namibia Zimbabwe
Cabo Verde Equatorial Guinea Kenya Nigeria
Cameroon Eswatini, Kingdom of Libya Réunion
Table C1.1 Countries and economies by industrialization level and geographical region

195
An
ne
x C
.1
COTHER DEVELOPING ECONOMIES
Asia and Pacific
Armenia Korea, Democratic People’s Republic of
Mongolia Samoa Uzbekistan
Azerbaijan Kyrgyzstan Pakistan Sri Lanka Viet Nam
Cook Islands Lebanon Palau Syrian Arab Republic
Fiji Maldives Palestine, State of Tajikistan
Iraq Marshall Islands Papua New Guinea Tonga
Jordan Micronesia, Federated States of
Philippinesa Turkmenistan
Europe
Albania Bosnia and Herzegovina
Georgia Moldova, Republic of Montenegro
Latin America and the Caribbean
Anguilla Bolivia, Plurinational State of
El Salvador Honduras Panama
Antigua and Barbuda Cuba Grenada Jamaica Paraguay
Bahamas Dominica Guadeloupe Martinique Saint Kitts and Nevis
Barbados Dominican Republic Guatemala Montserrat Saint Lucia
Belize Ecuador Guyana Nicaragua Saint Vincent and the Grenadines
LEAST DEVELOPED COUNTRIES
Africa
Angola Congo, Democratic Republic of the
Lesotho Niger Sudan
Benin Djibouti Liberia Rwanda Tanzania, United Republic of
Burkina Faso Eritrea Madagascar São Tomé and Príncipe Togo
Burundi Ethiopia Malawi Senegal Uganda
Central African Republic
Gambia Mali Sierra Leone Zambia
Chad Guinea Mauritania Somalia
Comoros Guinea-Bissau Mozambique South Sudan
Asia and Pacific
Afghanistan Cambodia Myanmar Timor-Leste Yemen
Bangladesh Kiribati Nepal Tuvalu
Bhutan Lao People’s Democratic Republic
Solomon Islands Vanuatu
Latin America and the Caribbean
Haiti
a. Included in OECD Inter-Country Input-Output (ICIO) tables (OECD 2016,2018b). b. Included in World Input-Output Database (WIOD) (Timmer et al. 2015). c. Included in the Analytical Business Enterprise R&D database (OECD 2018a).Note: Industrialized economies include economies with adjusted manufacturing value added (MVA) per capita higher than $2,500 (international PPP) or a gross domestic product higher than $20,000. Emerging industrial economies include economies with adjusted MVA per capita ranging between $1,000 (international PPP) and $2,500 or whose share of the world MVA is higher than 0.5 percent. The list of least developed countries is based on decisions of the United Nations General Assembly. All remaining economies are included in the group “other developing economies.”Source: UNIDO elaboration based on UNIDO (2019f).
Table C1.1 (continued) Countries and economies by industrialization level and geographical region

196
Annex C.2
Classification of manufacturing sectors by technology groups
Standard International Trade Classification Rev. 3 codes of medium- and high-technology exports
266t267
512t513, 525, 533, 541t542, 553t554, 562, 571t575, 579, 581t583, 591, 593, 597, 598
653, 671t672, 678
711t714, 716, 718, 721t728, 731, 733, 735, 737, 741t749, 751t752, 759, 761t764, 771t776, 778, 781t786, 791t793
811t813, 871t874, 881t882, 884t885, 891
Source: UNIDO elaboration based on UNIDO (2017c).
Table C2.1 Definition of medium- and high-technology manufacturing exports
International Standard Industrial Classification Rev. 4 Description Technology group
10 Manufacture of food products Low
11 Manufacture of beverages Low
12 Manufacture of tobacco products Low
13 Manufacture of textiles Low
14 Manufacture of wearing apparel Low
15 Manufacture of leather and related products Low
16 Manufacture of wood and of products of wood and cork, except furniture; manufacture of articles of straw and plaiting materials Low
17 Manufacture of paper and paper products Low
18 Printing and reproduction of recorded media Low
19 Manufacture of coke and refined petroleum products Medium-low
20 Manufacture of chemicals and chemical products Medium-high and high
21 Manufacture of basic pharmaceutical products and pharmaceutical preparations Medium-high and high
22 Manufacture of rubber and plastics products Medium-low
23 Manufacture of other non-metallic mineral products Medium-low
24 Manufacture of basic metals Medium-low
25 Manufacture of fabricated metal products, except machinery and equipment Medium-low
26 Manufacture of computer, electronic and optical products Medium-high and high
27 Manufacture of electrical equipment Medium-high and high
28 Manufacture of machinery and equipment not elsewhere classified Medium-high and high
29 Manufacture of motor vehicles, trailers and semi-trailers Medium-high and high
30 Manufacture of other transport equipment Medium-high and high
31 Manufacture of furniture Low
32 Other manufacturing Low
Source: UNIDO elaboration based on OECD (2011), adapted from ISIC rev. 3 to ISIC rev. 4.
Table C2.2 Technology classification of industrial activities

197197
Abeliansky, A. and Prettner, K., 2017. Automation and Demo-graphic Change. CEGE Discussion Papers No. 310. Göt-tingen: Center for European, Governance and Economic Development Research (CEGE), University of Göttingen.
Abood, D., Quilligan, A. and Narsalay, R., 2017. Industry X.0. Combine and Conquer: Unlocking the Power of Digi-tal. Accenture.
Abramovitz, M., 1986. Catching Up, Forging Ahead, and Falling Behind. The Journal of Economic History, 46(2), pp. 385–406.
Acemoglu, D., 2002. Technical Change, Inequality, and the Labor Market. Journal of Economic Literature, 40(1), pp. 7–72.
Acemoglu, D. and Restrepo, P., 2018. Artificial Intelligence, Automation and Work. Working Paper No. 18–01. Cambridge, MA: Massachusetts Institute of Technol-ogy Department of Economics.
Albrieu, R., Brest Lopez, C., Rapetti, M., Ferraz, J.C., Nogueira de Paiva Britto, J., Kupfer, D. and Torracca, J., 2019. The Adoption of Digital Technologies in Developing Countries: Insights from Firm-Level Surveys in Argen-tina and Brazil. Background paper prepared for the Industrial Development Report 2020. Vienna: United Nations Industrial Development Organization.
Andreoni, A., 2019. A Generalised Linkage Approach to Local Production Systems Development in the Era of Global Value Chains, with Special Reference to Africa. In: The Quality of Growth in Africa, eds. Kanbur, R., Noman, A. and Stiglitz, J., New York, NY: Columbia University Press.
Andreoni, A. and Anzolin, G., 2019. A Revolution in the Making? Challenges and Opportunities of Digital Produc-tion Technologies for Developing Countries. Background paper prepared for the Industrial Development Report 2020. Vienna: United Nations Industrial Development Organization.
Andreoni, A. and Chang, H.-J., 2019. The Political Econ-omy of Industrial Policy: Structural Interdependencies, Policy Alignment and Conflict Management. Structural Change and Economic Dynamics, 48, pp. 136–150.
Autor, D. and Salomons, A., 2018. Is Automation Labor-Displacing? Productivity Growth, Employment, and the Labor Share. Brookings Papers on Economic Activity, 49(1 (Spring)), pp. 1–87.
Baker, P., 2007. The Impact of Business-Services Use on Client Industries: Evidence from Input-Output Data. In: Business Services in European Economic Growth, eds. Rubalcaba, L. and Kox, H., London: Palgrave Macmillan, pp. 97–115.
Banga, K. and Willem te Velde, D., 2018a. Digitalisation and the Future of Manufacturing in Africa. Supporting Economic Transformation programme. London: Over-seas Development Institute.
———, 2018b. How to Grow Manufacturing and Create Jobs in a Digital Economy. 10 Policy Priorities for Kenya. Sup-porting Economic Transformation programme. Lon-don: Overseas Development Institute.
Baosteel Co., Ltd., 2016. Baosteel and Siemens Practice Indus-try 4.0 Together to Drive Intelligent Manufacturing Strat-egy. Available at: http://bg.baosteel.com/en/contents/ 3671/92252.html [Accessed 14 August 2019].
Barney, J., 1991. Firm Resources and Sustained Competitive Advantage. Journal of Management, 171(1), pp. 99–120.
Basque Industry 4.0, 2017. Basque Industry 4.0 Is Pre-sented at Hannover Messe. SPRI. Available at: https://www.irekia.euskadi.eus/uploads/attachments/9426/ BASQUEINDUSTRY_HANNOVER_NEWSPAPER _ING_prewiew.pdf ?1491986149.
Baxter, W., 2017. Thailand 4.0 and the Future of Work in the Kingdom. Background article commissioned to inform the Thailand National Dialogue on the Future of Work held in March 2017.
Berardino, C.D. and Onesti, G., 2018. The Two-Way Inte-gration Between Manufacturing and Services. The Ser-vice Industries Journal, pp. 1–21. Published online: 16 February 2018.
Blanchet, M., Rinn, T., Dujin, A. and Geissler, C., 2016. The Industrie 4.0 Transition Quantified: How the Fourth Industrial Revolution Is Reshuffling the Economic, Social and Industrial Model. Think Act - Beyond Mainstream. Munich: Roland Berger.
References

198198
re
Fe
re
nC
es
Board of Investment, 2017. Thailand 4.0 Means Opportu-nity Thailand. Thailand Investment Review, ( January), pp. 3–4.
Bogliacino, F. and Codagnone, C., 2019. Adoption of Industry 4.0 in Developing Countries: Learning from Process Innovation. Background paper prepared for the Industrial Development Report 2020. Vienna: United Nations Industrial Development Organization.
Brazil, MCTIC, 2017. Plano De CT&I para Manufatura Avan-çada no Brasil. Brasília: Ministry of Science, Technology, Innovation and Communication. Available at: https://www.mctic.gov.br/mctic/export/sites/institucional /tecnologia/tecnologias_convergentes/arquivos/ Cartilha-Plano-de-CTI_WEB.pdf [Accessed 21 January 2019].
Brazil, MDIC-MCTIC, 2016. Perspectivas de Especialistas Brasileiros Sobre a Manufatura Avançada no Brasil. Bra-silia: Ministry of Industry, Trade and Services and Min-istry of Science, Technology, Innovation and Communi-cation. Available at: http://oic.nap.usp.br/perspectivas -de-especialistas-brasileiros-sobre-a-manufatura -avancada-no-brasil/ [Accessed 21 January 2019].
BRICS Information Centre, 2017. BRICS Leaders Xiamen Declaration. September 4, 2017, Xiamen, China. Avail-able at: http://www.brics.utoronto.ca/docs/170904 -xiamen.html.
Brussevich, M., Dabla-Norris, E., Kamunge, C., Karnane, P., Khalid, S. and Kochhar, K., 2018. Gender, Technol-ogy, and the Future of Work. IMF Staff Discussion Note SDN/18/07. Washington, DC: International Mon-etary Fund.
Brynjolfsson, E. and McAfee, A., 2014. The Second Machine Age: Work, Progress, and Prosperity in a Time of Brilliant Technologies. W. W. Norton & Company.
Brynjolfsson, E. and McElheran, K., 2016. The Rapid Adop-tion of Data-Driven Decision-Making. American Eco-nomic Review, 106(5), pp. 133–139.
Brynjolfsson, E., Rock, D. and Syverson, C., 2017. Artifi-cial Intelligence and the Modern Productivity Paradox: A Clash of Expectations and Statistics. NBER Working Paper, 24001.
Bryson, J.R. and Daniels, P.W., 2010. Service Worlds. In: Handbook of Service Science, eds. P.P. Maglio, C.A.
Kieliszewski and J.C. Spohrer, Boston, MA: Springer US, pp. 79–104.
Calvino, F., Criscuolo, C., Marcolin, L. and Squicciarini, M., 2018. A Taxonomy of Digital Intensive Sectors. OECD Science, Technology and Industry Working Papers 2018/14. Paris: OECD Publishing.
Calza, E. and Fokeer, S., 2019. Absorbing Advanced Digital Production Technologies to Foster Industrialization. Evi-dence from Case Studies in Developing Countries. Back-ground paper prepared for the Industrial Development Report 2020. Vienna, Austria: United Nations Indus-trial Development Organization.
Cameron, A., Pham, T. and Atherton, J., 2018. Vietnam Today - First Report of the Vietnam’s Future Digital Econ-omy Project. Brisbane: Commonwealth Scientific and Industrial Research Organisation.
Castaldi, C., 2009. The Relative Weight of Manufacturing and Services in Europe: An Innovation Perspective. Technological Forecasting and Social Change, 76(6), pp. 709–722.
Chile, CORFO (Corporación de Fomento de la Produc-ción), 2016. Programa Estratégico Industrias Inteligentes. Resumen Ejecutivo. Santiago: Corporación de Fomento de la Producción.
Chile, Ministry of Foreign Affairs, 2019. Contribution of Chile to the Commission on Science and Technology for Development (CSTD) 2018–19 Priority Theme on ‘The Impact of Rapid Technological Change on Sustain-able Development’. Intersessional Panel of the United Nations Commission on Science and Technology for Development (CSTD). Vienna.
Chukwuekwe, D., Schjølberg, P., Rødseth, H. and Stuber, A., 2016. Reliable, Robust and Resilient Systems: Towards Development of a Predictive Maintenance Concept within the Industry 4.0 Environment. Proceedings of EFNMS Euro Maintenance Conference.
Cimoli, M. and Correa, N., 2005. Trade Openess and Tech-nological Gaps in Latin America: A Low Growth Trap. In: Beyond Reforms: Structural Dynamics and Macro-economic Vulnerability, ed. Ocampo, J.A., The World Bank, pp. 45–70.
Ciriaci, D. and Palma, D., 2016. Structural Change and Blurred Sectoral Boundaries: Assessing the Extent to

199
re
Fe
re
nC
es
Which Knowledge-Intensive Business Services Satisfy Manufacturing Final Demand in Western Countries. Economic Systems Research, 28(1), pp. 55–77.
Clifford, C., 2018. Elon Musk: Free Cash Handouts ‘Will Be Necessary’ if Robots Take Humans’ Jobs. Published online: 18 June 2018. Available at: https://www.cnbc.com/2018/06/18/elon-musk-automated-jobs-could -make-ubi-cash-handouts-necessary.html [Accessed 18 June 2019].
Cohen, M.D., Burkhart, R., Dosi, G., Egidi, M., Marengo, L., Warglien, M. and Winter, S., 1996. Routines and Other Recurring Action Patterns of Organizations: Contemporary Research Issues. Industrial and Corpo-rate Change, 5(3), pp. 653–698.
Colombia, DNP, 2018. Bases Del Plan Nacional de Desar-rollo 2018–2022. Pacto por Colombia, Pacto por la Equi-dad. Bogotá: Departamento Nacional de Planeación. Available at: https://www.dnp.gov.co/Plan-Nacional -de-Desarrollo/Paginas/Bases-del-Plan-Nacional-de -Desarrollo-2018-2022.aspx.
Colombia, MinTIC-CCB, 2018. Observatorio de Economia Digital de Colombia. Bogotá: Ministry of Information Technologies and Communications and Bogota Cham-ber of Commerce.
Comin, D. and Hobijn, B., 2010. An Exploration of Tech-nology Diffusion. American Economic Review, 100(5), pp. 2031–2059.
Consoli, D. and Elche-Hortelano, D., 2010. Variety in the Knowledge Base of Knowledge Intensive Business Ser-vices. Research Policy, 39(10), pp. 1303–1310.
Dachs, B. and Seric, A., 2019. Industry 4.0 and Chang-ing Topography of Global Value Chains. Background paper prepared for the Industrial Development Report 2020. Vienna: United Nations Industrial Development Organization.
Daudt, G. and Willcox, L.D., 2016. Reflexões Críticas a Partir das Experiências dos Estados Unidos e da Ale-manha em Manufatura Avançada. BNDES Setorial, 44, pp. 5–45.
Dauth, W., Findeisen, S., Suedekum, J. and Woessner, N., 2018. Adjusting To Robots: Worker-Level Evidence. Min-neapolis, MN: Federal Reserve Bank of Minneapolis, Opportunity and Inclusive Growth Institute.
Deloitte, 2016. Industry 4.0 Is Africa Ready for Digital Transformation? Deloitte.
———, 2018. The Fourth Industrial Revolution Is Here — Are You Ready? Deloitte Insights.
de Macedo, A.C. and Lavopa, A., 2017. Tracing The Incomes Generated By Domestic And Foreign Demand For Manu-facturing. Background paper prepared for the Industrial Development Report 2018. Vienna: United Nations Industrial Development Organization
Dietzenbacher, E. and Los, B., 2002. Externalities of R&D Expenditures. Economic Systems Research, 14(4), pp. 407–425.
Digital Transformation Monitor, 2017. Key Lessons from National Industry 4.0 Policy Initiatives in Europe. Avail-able at: https://ec.europa.eu/growth/tools-databases/dem/monitor/sites/default/files/DTM_Policy%20 initiative%20comparison%20v1.pdf [Accessed 19 December 2017].
Dosi, G. and Grazzi, M., 2006. Technologies as Problem-Solving Procedures and Technologies as Input-Out-put Relations: Some Perspectives on the Theory of Production. Industrial and Corporate Change, 15(1), pp. 173–202.
EMS, 2015. European Manufacturing Survey.EPO (European Patent Office), 2018. Worldwide Patent
Statistical Database 2018 Autumn Edition. Available at: https://www.epo.org/searching-for-patents/business/patstat.html#tab-1 [Accessed 17 June 2019].
EPSC (European Political Strategy Centre), 2017. Enter the Data Economy: EU Policies for a Thriving Data Ecosys-tem. EPSC Strategic Notes Issue 21. Brussels: European Commission.
Erdil, E. and Ertekin, Ş., 2017. Industry 4.0 and Turkish National Innovation System: Challenges and Prospects. Procedings, II International Scientific Conference Industry 4.0, Volume 2. Business and Industry 4. Society and Industry 4.0. Borovets, Bulgaria: Scientific-Techni-cal Union of Mechanical Engineering, pp. 209–212.
European Commission, 2016. Analysis of the Impact of Robotic Systems on Employment in the European Union — Update. Luxembourg: Publications Office of the European Union.
———, 2017. Communication from the Commission: Invest-ing in a Smart, Innovative and Sustainable Industry. A

200200
re
Fe
re
nC
es
Renewed EU Industrial Policy Strategy. COM(2017) 0479 final. Brussels.
———, 2019. National Initiatives.Eurostat, 2017. Methodological Manual for Statistics on the
Information Society. ICT Usage and E-Commerce in Enterprises- Survey Year 2018, Version 2.1. Eurostat.
———, 2019. Community Survey on ICT Usage and E-Com-merce in Enterprises 2018. Available at: https://ec.europa.eu/eurostat/web/digital-economy-and-society/data/comprehensive-database [Accessed 10 May 2019].
Felton, N., 2014. Consumption Spreads Faster Today. New York Time, from 2006 to 2011. Data Sourced from the US Census Bureau’s Extended Well-Being. Available at: https://ourworldindata.org/grapher/technology -adoption-by-households-in-the-united-states [Accessed 5 April 2019].
Foellmi, R., Wuergler, T. and Zweimüller, J., 2014. The Mac-roeconomics of Model T. Journal of Economic Theory, 153(C), pp. 617–647.
Foster-McGregor, N., Nomaler, Ö. and Verspagen, B., 2019. Measuring the Creation and Adoption of New Technologies Using Trade and Patent Data. Background paper prepared for the Industrial Development Report 2020. Vienna: United Nations Industrial Development Organization.
Francois, J.F., Manchin, M. and Tomberger, P., 2015. Ser-vices Linkages and the Value Added Content of Trade. The World Economy, 38(11), pp. 1631–1649.
Francois, J.F. and Woerz, J., 2008. Producer Services, Manu-facturing Linkages, and Trade. Journal of Industry, Com-petition and Trade, 8(3–4), pp. 199–229.
Freeman, C., 1995. The ‘National System of Innovation’ in Historical Perspective. Cambridge Journal of Economics, 19(1), pp. 5–24.
Frey, C.B. and Osborne, M.A., 2017. The Future of Employ-ment: How Susceptible are Jobs to Computerisation? Tech-nological Forecasting and Social Change, 114, pp. 254–280.
Fundación Chile and Microsoft, 2016. Chile 4.0: Cloud Com-puting y el Futuro de la Productividad. Santiago. Avail-able at: https://fch.cl/recurso/corporativo/chile-4-0 -cloud-computing-futuro-la-productividad/.
GAIA, 2019. Asociación de Industrias de las Tecnologías Elec-trónicas y de la Información del País Vasco. Available at: http://gaia.es/Inicio.html.
Gaulier, G. and Zignago, S., 2010. BACI: International Trade Database at the Product-Level: The 1994–2007 Version. CEPII Working Paper 23. Paris: Centre d’Études Pro-spectives et d’Informations Internationales.
Ghodsi, M., Reiter, O., Stehrer, R. and Stöllinger, R., 2019. Robotization, Employment, and Industrial Growth Intertwined across Global Value Chains. Background paper prepared for the Industrial Development Report 2020. Vienna: United Nations Industrial Development Organization.
Gobierno de Colombia, 2018. Bases del Plan Nacional de Desarrollo 2018–2022. Pacto por Colombia, Pacto por la Equidad. Departamento Nacional de Planeacion. Available at: https://www.dnp.gov.co/Plan-Nacional -de-Desarrollo/Paginas/Bases-del-Plan-Nacional-de -Desarrollo-2018-2022.aspx.
Graetz, G. and Michaels, G., 2018. Robots at Work. The Review of Economics and Statistics, 100(5), pp. 753–768.
Grant Thornton, 2017. India’s Readiness for Industry 4.0. A Focus on Automotive Sector. Available at: http://www.grant thornton.in/globalassets/1.-member-firms/india/assets/ pdfs/indias_readiness_for_industry_4_a_focus_on_automotive_sector.pdf [Accessed 24 September 2017].
Greenwood, J. and Kopecky, K.A., 2013. Measuring the Welfare Gain from Personal Computers. Economic Inquiry, 51(1), pp. 336–347.
Griffith, R., Redding, S. and Reenen, J.V., 2004. Mapping the Two Faces of R&D: Productivity Growth in a Panel of OECD Industries. The Review of Economics and Sta-tistics, 86(4), pp. 883–895.
Griliches, Z., 1979. Issues in Assessing the Contribution of Research and Development to Productivity Growth. In: R&D and Productivity: The Econometric Evidence, Chi-cago: University of Chicago Press.
———, 1988. Productivity Puzzles and R&D: Another Nonexplanation. Journal of Economic Perspectives, 2(4), pp. 9–21.
Grundke, R., Jamet, S., Kalamova, M., Keslair, F. and Squic-ciarini, M., 2017. Skills and Global Value Chains. OECD Science, Technology and Industry Working Papers 2017/05. Paris: OECD Publishing.
Guellec, D. and Van Pottelsberghe de la Potterie, B., 2004. From R&D to Productivity Growth: Do the

201
re
Fe
re
nC
es
Institutional Settings and the Source of Funds of R&D Matter? Oxford Bulletin of Economics and Statistics, 66(3), pp. 353–378.
Guerrieri, P. and Meliciani, V., 2005. Technology and Interna-tional Competitiveness: The Interdependence Between Manufacturing And Producer Services. Structural Change and Economic Dynamics, 16(4), pp. 489–502.
Halbinger, M.A., 2018. The Role of Makerspaces in Support-ing Consumer Innovation and Diffusion: An Empirical Analysis. Research Policy, 47(10), pp. 2028–2036.
Hiilamo, H., 2019. Heikki Hiilamo: ‘Disappointing Results from the Finnish Basic Income Experiment’. Published online: 8 February 2019. Available at: https://www. helsinki.fi/en/news/nordic-welfare-news/heikki -hiilamo-disappointing-results-from-the-finnish-basic -income-experiment [Accessed 18 June 2019].
den Hortog, P., 2001. Knowledge-Intensive Services as Co-producers of Innovation. International Journal of Inno-vation Management, 4(4), pp. 491–528.
Huang, R., Riddle, M., Graziano, D., Warren, J., Das, S., Nimbalkar, S., Cresko, J. and Masanet, E., 2016. Energy and Emissions Saving Potential of Additive Manufac-turing: The case of Lightweight Aircraft Components. Journal of Cleaner Production, 135, pp. 1559–1570.
IEA (International Energy Agency), 2018. Global EV Out-look 2018: Towards Cross-Modal Electrification.
IEL (Instituto Evualdo Lodi), 2018. Industry 2027: Risks and Opportunities for Brazil in the Face of Disruptive Innovations. Brasilia.
IfM-UNIDO, 2017. Emerging Trends in Global Advanced Manufacturing: Challenges, Opportunities and Policy Responses. Cambridge and Vienna: Institue for Manu-facturing and United Nations Industrial Development Organization.
IFR (International Federation of Robotics), 2017. World Robotics 2017. IFR Statistical Department.
———, 2018. Demystifying Collaborative Industrial Robots. Frankfurt.
Iizuka, M., Suzuki, I. and Ito, C., 2019. Democratizing Adoption and Use of Advanced Digital Production Tech-nologies. Background paper prepared for the Industrial Development Report 2020. Vienna: United Nations Industrial Development Organization.
ILO (International Labour Organization), 2018. World Employment and Social Outlook 2019. Geneva.
Kaldor, N., 1961. Capital Accumulation and Economic Growth. In: The Theory of Capital: Proceedings of a Con-ference Held by the International Economic Association, eds. Lutz, F.A., and Hague, D.C., London: Palgrave Macmillan UK, pp. 177–222.
Kaltzada, P., 2017. Las Empresas GAIA Alinean Recursos y Proyectos para Acelerar la Tranformación Digital de Euskadi. Available at: http://www.elmundoempresarial.es/noticias/noticias/es/1702/2/6248/.htm [Accessed 16 August 2019].
Kamp, B., Martinez, A., Oyon, C., and Vazquez, R., 2019. Basque Digital Transformation in the Global Economy: Industry 4.0 and Back-Shoring Reconfiguration of Global Value Chains. Background paper for the UNIDO Industrial Development Report 2019. Vienna: United Nations Industrial Development Organization.
Kavadias, S., Ladas, K. and Loch, C., 2016. The Transforma-tive Business Model. Harvard business review, 94(10), pp. 91–98.
Kazakhstan, 2019. Kazakhstan 2050. Industry 4.0: How the Work in the Fourth Industrial Revolution Is Car-ried Out. Available at: https://strategy2050.kz/ru/news/48918/.
Kazakhstan, MIID, 2018. Digitalization of Kazakhstan’s Industry. Nur-Sultan: Ministry of Industry and Infra-structural Development. Available at: http://miid.gov.kz/sites/default/files/pages/spravka_na_sayt_rus.docx.
Kaziboni, L., Nkhonjera, M. and Roberts, S., 2019. Machin-ery, Equipment and Electronic Control Systems: Leading Reindustrialisation in Southern Africa. Digital Industrial Policy Brief 1. Johannesburg: Industrial Development Think Tank, Centre for Competition, Regulation and Economic Development (CREED).
Kingdom of Saudi Arabia, 2018. National Industrial Devel-opment & Logistics Program: Vision 2030. Delivery Plan 2018–2020. Riyadh. Available at: http://www.arabia -saudita.it/files/news/2019/02/nidlp. 2019_en.pdf.
Koch, M., Manuylov, I. and Smolka, M., 2019. Robots and Firms. CESifo Working Paper No. 7608. Munich: Munich Society for the Promotion of Economic Research (CESifo).

202202
re
Fe
re
nC
es
Kraemer-Mbula, E., 2019. New Technologies and Indus-trial Development: An African Perspective. Background paper prepared for the Industrial Development Report 2020. Vienna: United Nations Industrial Development Organization.
Kupfer, D., Ferraz, J.C. and Torracca, J., 2019. A Compara-tive Analysis on Digitalization in Industry in Selected Developing Countries: Firm Level Data on Industry 4.0. Background paper prepared for the Industrial Develop-ment Report 2020. Vienna: United Nations Industrial Development Organization.
Lee, K., 2019. Economics of Technological Leapfrogging. Background paper prepared for the Industrial Develop-ment Report 2020. Vienna: United Nations Industrial Development Organization.
Lee, K. and Ki, J., 2017. Rise of Latecomers and Catch-Up Cycles in the World Steel Industry. Research Policy, 46(2), pp. 365–375.
Lee, K., Wong, C.-Y., Intarakumnerd, P. and Limaporn-vanich, C., 2019. Is the Fourth Industrial Revolution a Window of Opportunity for Upgrading or Reinforcing the Middle-Income Trap? Asian Model of Development in Southeast Asia. Journal of Economic Policy Reform, pp. 1–18. Published online: 14 February 2019.
Li, L., 2018. China’s Manufacturing Locus in 2025: With a Comparison of “Made in China 2025” and “Indus-try 4.0”. Technological Forecasting and Social Change, 135(C), pp. 66–74.
Liao, Y., Loures, E.R., Deschamps, F., Brezinski, G., Venân-cio, A., Liao, Y., Loures, E.R., Deschamps, F., Brezinski, G. and Venâncio, A., 2018. The Impact of the Fourth Industrial Revolution: A Cross-Country/Region Com-parison. Production, 28.
Liter.KZ, 2018. Нуротановцы Обсудили Вопросы Внедрения «Индустрии 4.0». Available at: https://liter.kz/ru/articles/show/46560-nurotanovcy_obsudili_voprosy _vnedreniya_industrii_4_0_ [Accessed 14 March 2019].
Make in India, 2017. Towards Smart Manufacturing: Indus-try 4.0 and India. Available at: http://www.makeinindia .com/article/-/v/towards-smart-manufacturing -industry-4-0-and-india [Accessed 3 October 2017].
Malaysia, MITI, 2018. Industry4wrd: National Policy on Industry 4. Kuala Lumpur: Ministry of International
Trade and Industry. Available at: https://www.miti.gov.my/miti/resources/National%20Policy%20on%20Industry%204.0/Industry4WRD_Final.pdf.
Mauritius, MTCI, 2018. Digital Mauritius 2030. Qua-tre Bornes: Ministry of Technology, Communication and Innovation. Available at: http://mtci.govmu.org/English/Documents/2018/Launching%20Digital%20Transformation%20Strateg y%20191218/DM%202030%2017%20December%202018%20at%2012.30hrs.pdf.
Mayer, J., 2018. Digitalization and Industrialization: Friends or Foes? UNCTAD Research Paper No. 25. Geneva: United Nations.
McKinsey & Co, 2017. Making It in America: Revitalizing US Manufacturing. McKinsey Global Institute.
McKinsey Global Institute, 2017. A Future that Works: Automation, Employment, and Productivity. McKinsey Global Institute.
Mexico, Gobierno Nuevo León, 2017. Inicia Revolución Tecnológica “Nuevo León 4.0”. Available at: http://www.nl.gob.mx/noticias/inicia-revolucion-tecnologica -nuevo-leon-40 [Accessed 2 October 2017].
Mexico, Ministry of Economy, 2016. Crafting the Future: A Roadmap for Industry 4.0 in Mexico. Mexico City. Avail-able at: https://clusterinstitute.com/Documentos/ MRT_Industry_I40.pdf [Accessed 11 September 2017].
Mokyr, J., Vickers, C. and Ziebarth, N.L., 2015. The History of Technological Anxiety and the Future of Economic Growth: Is this Time Different? Journal of Economic Perspectives, 29(3), pp. 31–50.
Montresor, S. and Marzetti, G.V., 2011. The Deindustriali-sation/Tertiarisation Hypothesis Reconsidered: A Sub-system Application to the OECD7. Cambridge Journal of Economics, 35(2), pp. 401–421.
Muller, E. and Zenker, A., 2001. Business Services as Actors of Knowledge Transformation: The Role of KIBS in Regional and National Innovation System. Research Policy, 30(9), pp. 1501–1516.
Nazarbayev, N., 2018. New Opportunities under the Fourth Industrial Revolution. The Ministry of Foreign Affairs. Republic of Kazakhstan. Available at: http://mfa.gov.kz/en/content-view/treta-modernizacia-kazahstana

203
re
Fe
re
nC
es
-globalnaa-konkurentosposobnost [Accessed 21 May 2018].
Nguyễn Xuân Phúc, 2017. Directive 16/CT-TTg Strength-ening of the Ability to Access the Fourth Industrial Revolution. THƯ VIỆN PHÁP LUẬT. Hanoi. Avail-able at: https://thuvienphapluat.vn/van-ban/Dau-tu/Directive-16-CT-TTg-strengthening-of-the-ability-to -access-the-Fourth-Industrial-Revolution-361701.aspx [Accessed 21 September 2017].
NL4.0, 2019. Nuevo Leon 4.0. Available at: https://www.nuevoleon40.org/autodiagnostico [Accessed 25 March 2019].
OECD (Organisation for Economic Co-operation and Development), 2000. Working Party on Pollution Pre-vention and Control. Strategic Waste Prevention. OECD Reference Manual. Paris: OECD Publishing.
———, 2002. Frascati Manual 2002: Proposed Standard Practice for Surveys on Research and Experimental Devel-opment, the Measurement of Scientific and Technological Activities. Paris: OECD Publishing.
———, 2011. ISIC Rev.3 Technology Intensity Definition - Classification of Manufacturing Industries into Categories Based on R&D Intensities. Paris.
———, 2016. OECD Inter-Country Input-Output (ICIO) Tables, ISIC REV.3, 2016 Edition. Available at: http://oe.cd/icio [Accessed 4 May 2019].
———, 2017. The Next Production Revolution: Implications for Governments and Business. Paris: OECD Publishing.
———, 2018a. Analytical Business Enterprise R&D Database. Available at: http://oe.cd/anberd [Accessed 4 May 2019].
———, 2018b. OECD Inter-Country Input-Output (ICIO) Tables, NA08, ISIC REV.4, 2018 Edition. Available at: http://oe.cd/icio [Accessed 4 May 2019].
———, 2019a. STAN Database for Structural Change Analy-sis ISIC Revision 3 (SNA93). Available at: https://stats.oecd.org/Index.aspx?DataSetCode=STANI4_2016# [Accessed 4 May 2019].
———, 2019b. STAN Database for Structural Change Analysis ISIC Revision 4 (SNA 93, SNA 08). Available at: https://stats.oecd.org/Index.aspx?DataSetCode =STANI4_2016# [Accessed 4 May 2019].
OECD/Eurostat, 2005. Oslo Manual: Guidelines for Collect-ing and Interpreting Innovation Data, 3rd Edition. The
Measurement of Scientific and Technological Activities. Paris: OECD Publishing.
O’Mahony, M. and Vecchi, M., 2009. R&D, Knowledge Spillovers and Company Productivity Performance. Research Policy, 38(1), pp. 35–44.
Osmonova, N., 2016. State Committee of Information Tech-nologies and Communications to Be Formed in Kyr-gyzstan. Available at: https://24.kg/archive/en/vlast/ 180902-news24.html/ [Accessed 14 March 2019].
Parisi, M.L., Schiantarelli, F. and Sembenelli, A., 2006. Pro-ductivity, Innovation and R&D: Micro Evidence for Italy. European Economic Review, 50(8), pp. 2037–2061.
Pasinetti, L.L., 1973. The Notion of Vertical Integration in Economic Analysis. Metroeconomica, 25(1), pp. 1–29.
Peneder, M., Kaniovski, S. and Dachs, B., 2003. What Fol-lows Tertiarisation? Structural Change and the Role of Knowledge-Based Services. The Service Industries Jour-nal, 23(2), pp. 47–66.
Peru, MEF, 2018. Política Nacional de Competitividad y Pro-ductividad. Decreto Supremo No 345–2018-EF. Lima: Ministry of Economy and Finance.
Peru, MTI, 2019. Contribution of Peru to the Commission on Science and Technology for Development (CSTD) 2018–19 Priority Theme on ‘The Impact of Rapid Technologi-cal Change on Sustainable Development’. Intersessional Panel of the United Nations Commission on Science and Technology for Development (CSTD), Ministry of Transport and Communications. Vienna.
Pfeiffer, S., 2017. The Vision of “Industrie 4.0” in the Making — a Case of Future Told, Tamed, and Traded. Nanoethics, 11(1), pp. 107–121.
Pianta, M., 2019. The Challenge of Digitalisation for Firms in Developing Countries. Background paper prepared for the Industrial Development Report 2020. Vienna, Austria: United Nations Industrial Development Organization.
Pieri, F., Vecchi, M. and Venturini, F., 2018. Modelling the Joint Impact of R&D and ICT on Productivity: A Frontier Analysis Approach. Research Policy, 47(9), pp. 1842–1852.
Pietrobelli, C., Delera, M., Calza, E., and Lavopa, A., 2019. Does Value Chain Participation Facilitate the Adop-tion of Digital Technologies in Developing Countries?
204204
re
Fe
re
nC
es
Background paper prepared for the Industrial Develop-ment Report 2020. Vienna: United Nations Industrial Development Organization.
Planes-Satorra, S. and Paunov, C., 2019. The Digital Innovation Policy Landscape in 2019. OECD Science, Technology and Industry Policy Papers, No. 71. Paris: OECD Publishing.
Portal Brasil, 2017. Grupo de Trabalho Coordenado pelo MDIC Debate Estratégia Para a Indústria 4.0. Avail-able at: http://www.mdic.gov.br/index.php/ultimas -noticias/2713-grupo-de-trabalho-coordenado-pelo-mdic -debate-estrategia-nacional-para-a-industria-4-0 [Accessed 4 September 2017].
PwC, 2016a. Industry 4.0: Building the Digital Enterprise. PricewaterhouseCoopers.
———, 2016b. Industry 4.0: Building the Digital Enterprise. South Africa Highlights. PricewaterhouseCoopers.
———, 2018. Global Digital Operations Study 2018. Digi-tal Champions: How Industry Leaders Build Integrated Operations Ecosystems to Deliver End-To-End Customer Solutions. PricewaterhouseCoopers.
Rizos, V., Behrens, A., Drabik, E., Rinaldi, D. and Tuokko, K., 2018. The Role of Business in the Circular Economy: Markets, Processes and Enabling Policies. Report of A CEPS Task Force. Centre for European Policy Studies.
Rodrik, D., 2007. Industrial Policy for the 21st Century. In: One Economics, Many Recipes, Princeton: Princeton University Press.
———, 2018. New Technologies, Global Value Chains, and Developing Economies. Working Paper No. 25164. Cam-bridge, MA: National Bureau of Economic Research.
Roland Berger GMBH, 2016. Skill Development for Industry 4.0. Available at: http://www.globalskillsummit.com/Whitepaper-Summary.pdf [Accessed 24 September 2017].
Santiago, F., 2018. You Say You Want a Revolution: Strate-gic Approaches to Industry 4.0 in Middle-Income Coun-tries. Inclusive and Sustainable Industrial Development Working Paper Series WP19/2018. Vienna: United Nations Industrial Development Organization.
Santiago, F. and Horst, J., 2018. What Can Policymakers Learn from Germany’s Industrie 4.0 Development Strat-egy? Inclusive and Sustainable Development Working Paper Series WP22/2018. Vienna: United Nations Industrial Development Organization.
Schaeffer, E., 2017. Industry X.0: Realizing Digital Value in Industrial Sectors. 1 edition. London: Kogan Page.
Schwab, K., 2016. The Fourth Industrial Revolution. Geneva: World Economic Forum.
Shearmur, R. and Doloreux, D., 2013. Innovation and Knowledge-Intensive Business Service: The Contribu-tion of Knowledge-Intensive Business Service to Inno-vation in Manufacturing Establishments. Economics of Innovation and New Technology, 22(8), pp. 751–774.
Sing, P.J., 2017. Digital Industrialisation in Developing Countries — a Review of the Business and Policy Land-scape. Bangalore: IT for Change.
Smits, J.-P., Woltjer, P. and Ma, D., 2009. A Dataset on Com-parative Historical National Accounts, c. 1870–1950: A Time-Series Perspective. Research Memorandum GD-107. Groningen: Groningen Growth and Develop-ment Centre, University of Groningen.
Sommer, L., 2015. Industrial Revolution - Industry 4.0: Are German Manufacturing SMEs the First Victims of this Revolution? Journal of Industrial Engineering and Man-agement, 8(5), pp. 1512–1532.
Sorgner, A., 2019. The Impacts of New Digital Technologies on Gender Equality in Developing Countries. Background paper prepared for the Industrial Development Report 2020. Vienna: United Nations Industrial Development Organization.
Sorgner, A., Bode, E. and Krieger-Boden, C., 2017. The Effects of Digitalization on the Gender Equality in the G20 Economies. Women20 Study. Kiel: Kiel Institute for the World Economy.
Sousa, R. and Silveira, G., 2017. Capability Antecedents and Performance Outcomes of Servitization. International Journal of Operations & Production Management, 37(4), pp. 444–467.
de Sousa Jabbour, A.B.L., Jabbour, C.J.C., Foropon, C. and Godinho Filho, M., 2018. When Titans Meet — Can Industry 4.0 Revolutionise the Environmentally- Sustainable Manufacturing Wave? The Role of Critical Success Factors. Technological Forecasting and Social Change, 132, pp. 18–25.
South Africa, CSIR-DST, 2016. A South African Additive Manufacturing Strategy. Pretoria: Department of Sci-ence and Technology and Council for Scientific and
205
re
Fe
re
nC
es
Industrial Research. Available at: https://site.rapdasa.org/wp-content/uploads/2017/02/South-African -Additive-Manufacturing-Strategy.pdf.
———, DST, 2018. White Paper on Science, Technology and Innovation. Draft. Pretoria: Department of Science and Technology. Available at: https://www.csir.co.za/sites/default/files/DST%20Draft%20White%20Paper%20on%20STI_Web%20version_FINAL_12092018.pdf.
———, DTI, 2016. Industrial Policy Action Plan IPAP 2016/17–2018/19. Pretoria: Department of Trade and Industry. Available at: http://www.thedti.gov.za/DownloadFileAction?id=1082.
———, DTI, 2017. Industrial Policy Action Plan 2017/18 - 2019/20. Economic Sectors, Employment and Infra-structure Development Cluster. Pretoria: Department of Trade and Industry.
———, The Presidency, 2019. President Appoints Commis-sion on Fourth Industrial Revolution. Available at: http://www.thepresidency.gov.za/press-statements/president -appoints-commission-fourth-industrial-revolution.
Spain, Ministry of Industry, Trade and Tourism, 2019. Estra-tegias para el Fomento de la Industria 4.0 en España. Indus-tria Conectada 4.0. Madrid. Available at: http://www.industriaconectada40.gob.es/Documents/Catalogo -I40-CCAAAGE.pdf.
SPRI, 2019. Basque Industry 4.0. Available at: https://www.spri.eus/es/basque-industry/ [Accessed 8 March 2019].
Sraffa, P., 1960. Production of Commodities by Means of Com-modities: Prelude to a Critique of Economic Theory. Lon-don: Cambridge University Press.
State Council of the People’s Republic of China, 2015. 国务院关于印发《中国制造2025》的通知(国发〔2015〕28号)政府信息公开专栏 . Made in China 2025. Beijing. Available at: http://www.gov.cn/zhengce/content/2015-05/19/content_9784.htm [Accessed 26 June 2019].
Steinmueller, E., 2001. ICTs and the Possibilities for Leap-frogging by Developing Countries. International Labour Review, 140(2), pp. 193–210.
Strambach, S., 2008. Knowledge-Intensive Business Services (KIBS) as Drivers of Multilevel Knowledge Dynamics. International Journal of Services Technology and Man-agement, 10(2/3/4), pp. 152–174.
Tansan, B., Gökbulut, A., Targotay, Ç. and Tevfik, E., 2016. Industry 4.0 in Turkey as an Imperative for Global Com-petitiveness: An Emerging Market Perspective. Executive Summary. Istanbul: TÜSİAD.
Thailand, Government Public Relations Department, 2016. Thailand’s 20-Year National Strategy and Thailand 4.0 Policy. Available at: http://thailand.prd.go.th/ewt_news.php?nid=3578&filename=index [Accessed 11 September 2017].
Timmer, M.P., Dietzenbacher, E., Los, B., Stehrer, R. and Vries, G.J. de, 2015. An Illustrated User Guide to the World Input–Output Database: The Case of Global Automotive Production. Review of International Eco-nomics, 23(3), pp. 575–605.
Turkey, TÜBİTAK, 2019. Contribution of Turkey to the Commission on Science and Technology for Develop-ment (CSTD) 2018–19 Priority Theme on ‘The Impact of Rapid Technological Change on Sustainable Develop-ment’. Intersessional Panel of the United Nations Com-mission on Science and Technology for Development (CSTD), Scientific and Technological Research Coun-cil. Vienna.
UNCTAD (United Nations Conference on Trade and Development), 2017. Trade and Development Report 2017. Beyond Austerity: Towards a Global New Deal. New York, NY and Geneva: United Nations.
———, 2018. Technology and Innovation Report 2018. Har-nessing Frontier Technologies for Sustainable Develop-ment. Geneva: United Nations.
UNESCAP (United Nations Economic and Social Com-mission for Asia and the Pacific), 2018. Frontier Tech-nologies for Sustainable Development in Asia and the Pacific. Bangkok.
UNIDO, 2002. Industrial Development Report 2002/3. Competing Through Innovation and Learning. Vienna.
———, 2005. Industrial Development Report 2005. Capabil-ity Building for Catching-Up. Historical, Empirical and Policy Dimensions. Vienna.
———, 2012. International Yearbook of Industrial Statistics 2012. Cheltenham: Edward Elgar Publishing.
———, 2013. Industrial Development Report 2013. Sustain-ing Employment Growth: The Role of Manufacturing and Structural Change. Vienna.

206206
re
Fe
re
nC
es
———, 2015. Industrial Development Report 2016. The Role of Technology and Innovation in Inclusive and Sustain-able Industrial Development. Vienna.
———, 2017a. Accelerating Clean Energy through Industry 4.0: Manufacturing the Next Revolution. Vienna.
———, 2017b. Circular Economy. Vienna.———, 2017c. Industrial Development Report 2018.
Demand for Manufacturing: Driving Inclusive and Sus-tainable Industrial Development. Vienna.
———, 2017d. Industry 4.0 - The Opportunities behind the Challenge. Vienna.
———, 2019a. Annual Report 2018. Vienna.———, 2019b. Competitive Industrial Performance Report
2018. Vienna.———, 2019c. Competitive Industrial Performance Index,
2019 Edition. Database. Available at: https://stat.unido.org/ [Accessed 17 June 2019].
———, 2019d. Inclusive and Sustainable Industrial Develop-ment: The Gender Dimension. Vienna.
———, 2019e. Industrial Statistics 2-Digit Level, ISIC Revi-sion 3 (INDSTAT2). Database. Available at: https://stat.unido.org/ [Accessed 17 June 2019].
———, 2019f. International Yearbook of Industrial Statistics 2019. Cheltenham: Edward Elgar Publishing.
———, 2019g. Manufacturing Value Added 2019. Database. Vienna. Available at: https://stat.unido.org/ [Accessed 17 June 2019].
UNSD (United Nations Statistics Division), 2019. United Nations Commodity Trade Statistics (Comtrade). Data-base. Available at: http://comtrade.un.org [Accessed March, 2019].
U.S. Bureau of Economic Analysis, 2019a. Historical Indus-try Accounts Data. Database. Available at: https://www.bea.gov/industry/historical-industry-accounts-data [Accessed 5 April 2019].
U.S. Bureau of Economic Analysis, 2019b. Industry Eco-nomic Accounts Data: GDP by Industry. Database.
Available at: https://apps.bea.gov/iTable/index_ industry_gdpindy.cfm [Accessed 5 April 2019].
U.S. Bureau of Economic Analysis, 2019c. Input-Output Accounts Data: Make and Use Tables and Historical Make and Use Tables, 1947–2017. Database. Available at: https://apps.bea.gov/iTable/index_industry_gdpindy.cfm [Accessed 5 April 2019].
U.S. Census Bureau, 2018. American Community Survey, 2010–2017, Computers in Households. Database. Avail-able at: https://factfinder.census.gov/faces/nav/jsf/pages/index.xhtml [Accessed 5 April 2019].
Viet Nam, Central Economic Commission, 2018. Directions on Formulating the National Industrial Development Pol-icy until 2030 with a Vision towards 2045. Reference Book.
White, A., 2016. Could a Basic Income Solve the Biggest Challenge of the Digital Economy? The Guardian. Pub-lished online: 25 January 2016. Available at: https://www.theguardian.com/commentisfree/2016/jan/25/basic-income-challenge-digital-economy-jobs-automation [Accessed 20 November 2018].
World Bank, 2013. World Bank Enterprise Survey. Data-base. Available at: https://microdata.worldbank.org/ index.php/catalog?sort_by=rank&sort_order=desc& sk=enterprise+survey [Accessed 11 August 2019].
———, 2016. STEP Skills Measurement Program. Available at: https://microdata.worldbank.org/index.php/catalog /step [Accessed 15 July 2019].
———, 2017. Global Value Chain Development Report 2017: Measuring and Analyzing the Impact of GVCs on Economic Development. Washington, DC: World Bank Group.
World Economic Forum, 2017. Readiness for the Future of Production: Country Profiles. White paper.
Zanello, G., Fu, X., Mohnen, P. and Ventresca, M., 2016. The Creation and Diffusion of Innovation in Develop-ing Countries: A Systematic Literature Review. Journal of Economic Surveys, 30(5), pp. 884–912.

Industrial Developm
ent Report 2020 Industrializing in the digital age
Sales No. E.20.II.B.49ISBN 978-92-1-106456-8eISBN 978-92-1-004602-2
UNITED NATIONS INDUSTRIAL DEVELOPMENT ORGANIZATIONVienna International Centre, P.O. Box 300, 1400 Vienna, AustriaTelephone: (+43-1) 26026-0, Fax: (+43-1) 26926-69E-mail: [email protected], Internet: www.unido.org
Printed in AustriaOctober 2019
“New technologies are a double-edged sword for developing nations. They can enable leapfrogging and faster economic catchup. But in the absence of basic capabilities, skills, and institutions, they also raise barriers to convergence by laggards. This data-filled report presents an up-to-date picture of the technology landscape and outlines strategies for making the most out of the opportunities while avoiding the pitfalls.”
Dani Rodrik, Harvard University
“UNIDO reminds the world in this report that industrialization continues to be essential for economic development. It argues that, through increased productivity and the development of new production sectors, the digital technologies offer significant opportunities in terms of improvements in standards of living and environmental sustainability. They also pose great challenges, given the limited diffusion of these technologies in most developing countries. It calls, therefore, for significant efforts to develop the digital infrastructure, build up the essential human skills and strengthen the research capacities of developing countries –all of which are also areas for increased international cooperation.”
José Antonio Ocampo, Central Bank of Colombia and Columbia University