Agilent 7500 Inductively Coupled Plasma Mass Spectrometry Gas
11 © 2009 PerkinElmer© 2009 PerkinElmer© 2009 PerkinElmer© 2010 - 2013 PerkinElmer, Inc.
Dr. Mark ParmanSenior Product Specialist, Atomic Spectroscopy
Inductively-Coupled Plasma Mass Spectrometry (ICPMS) –
The New Elemental Analysis Workhorse
22
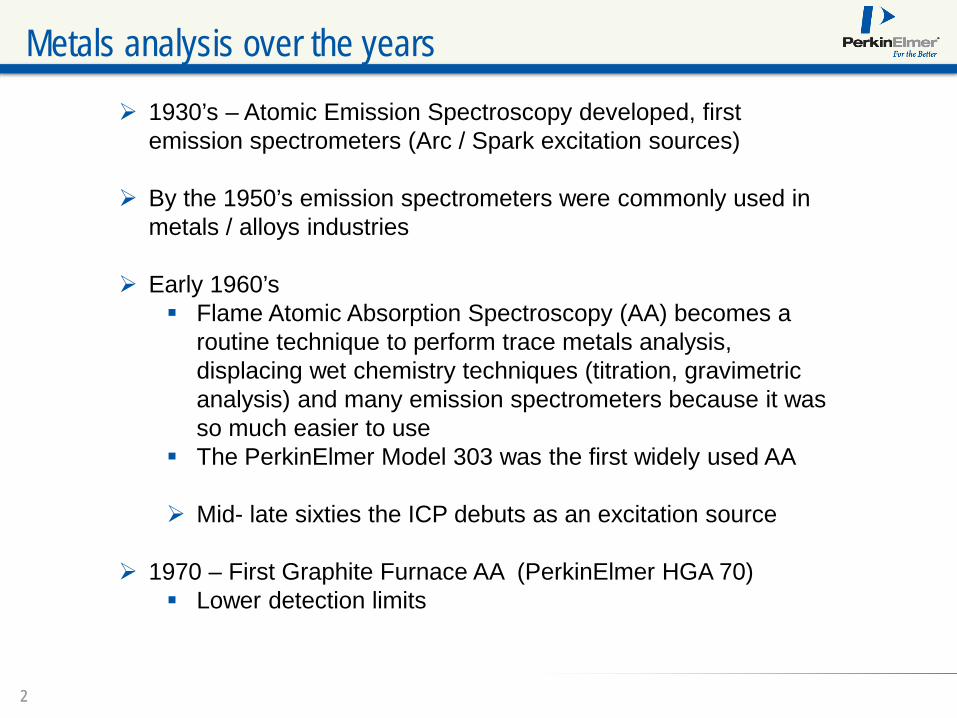
Metals analysis over the years 1930’s – Atomic Emission Spectroscopy developed, first
emission spectrometers (Arc / Spark excitation sources)
By the 1950’s emission spectrometers were commonly used in metals / alloys industries
Early 1960’s Flame Atomic Absorption Spectroscopy (AA) becomes a
routine technique to perform trace metals analysis, displacing wet chemistry techniques (titration, gravimetric analysis) and many emission spectrometers because it was so much easier to use
The PerkinElmer Model 303 was the first widely used AA
Mid- late sixties the ICP debuts as an excitation source
1970 – First Graphite Furnace AA (PerkinElmer HGA 70) Lower detection limits
33
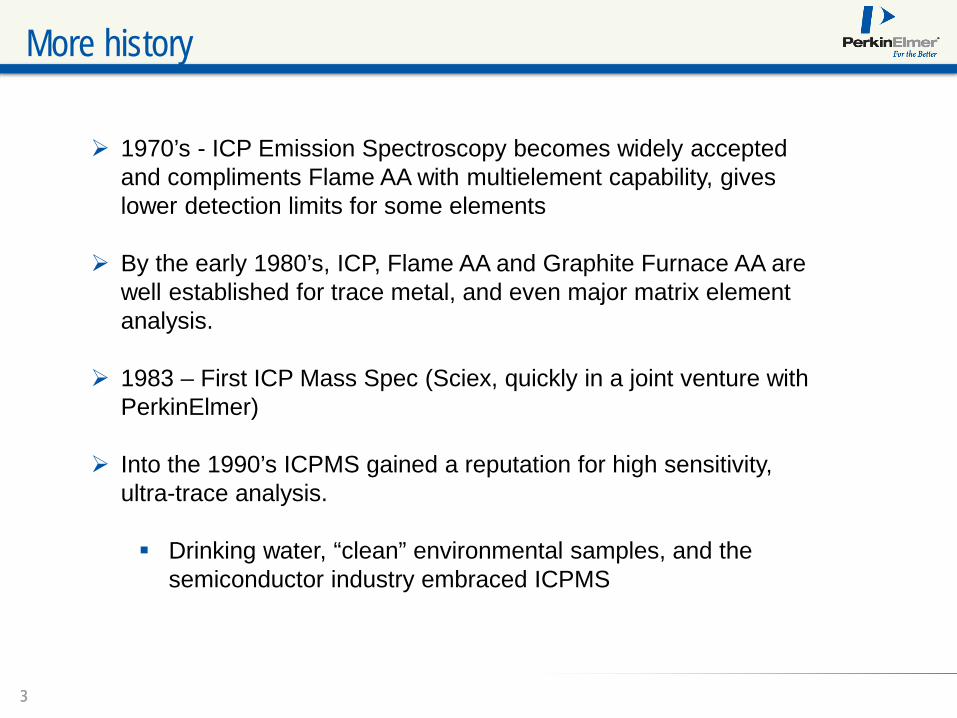
More history
1970’s - ICP Emission Spectroscopy becomes widely accepted and compliments Flame AA with multielement capability, gives lower detection limits for some elements
By the early 1980’s, ICP, Flame AA and Graphite Furnace AA are well established for trace metal, and even major matrix element analysis.
1983 – First ICP Mass Spec (Sciex, quickly in a joint venture with PerkinElmer)
Into the 1990’s ICPMS gained a reputation for high sensitivity, ultra-trace analysis.
Drinking water, “clean” environmental samples, and the semiconductor industry embraced ICPMS
44
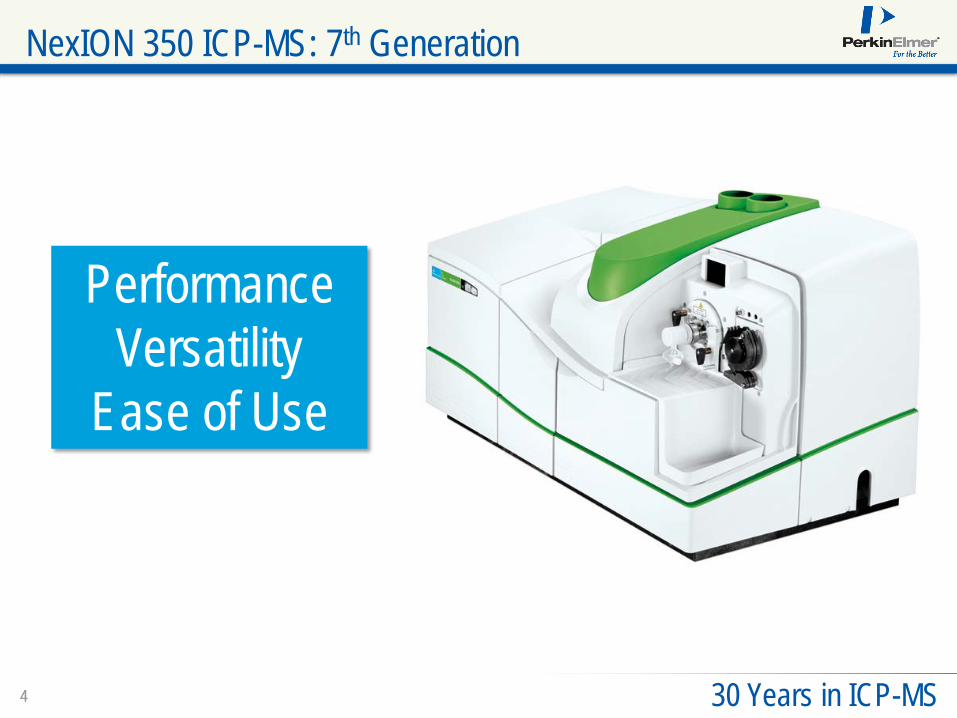
NexION 350 ICP-MS: 7th Generation
30 Years in ICP-MS
PerformanceVersatility
Ease of Use
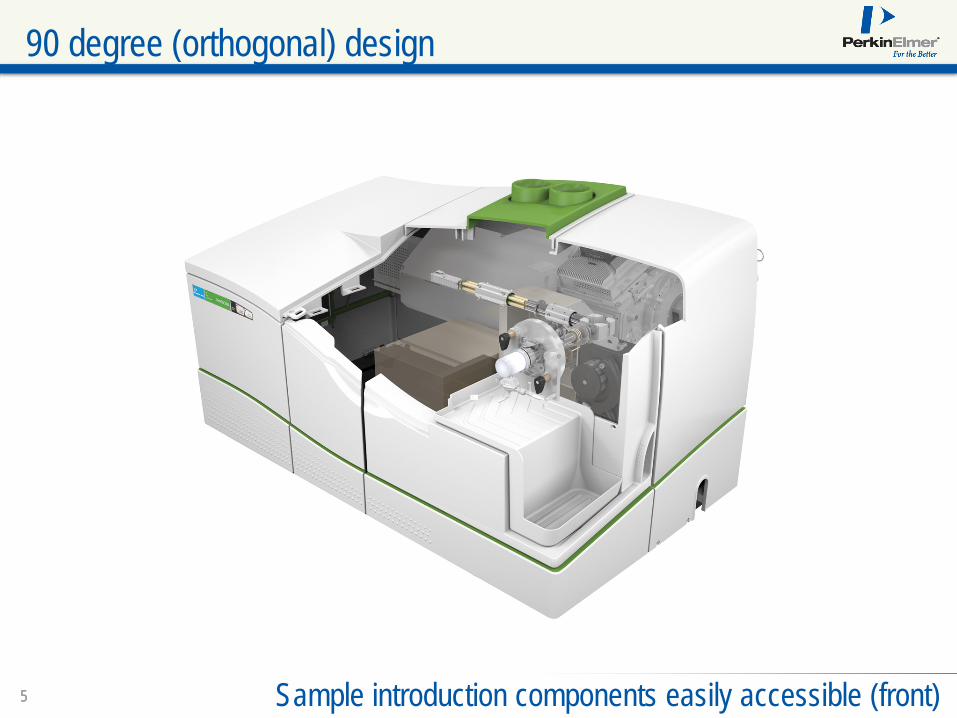
55 Sample introduction components easily accessible (front)
90 degree (orthogonal) design
66
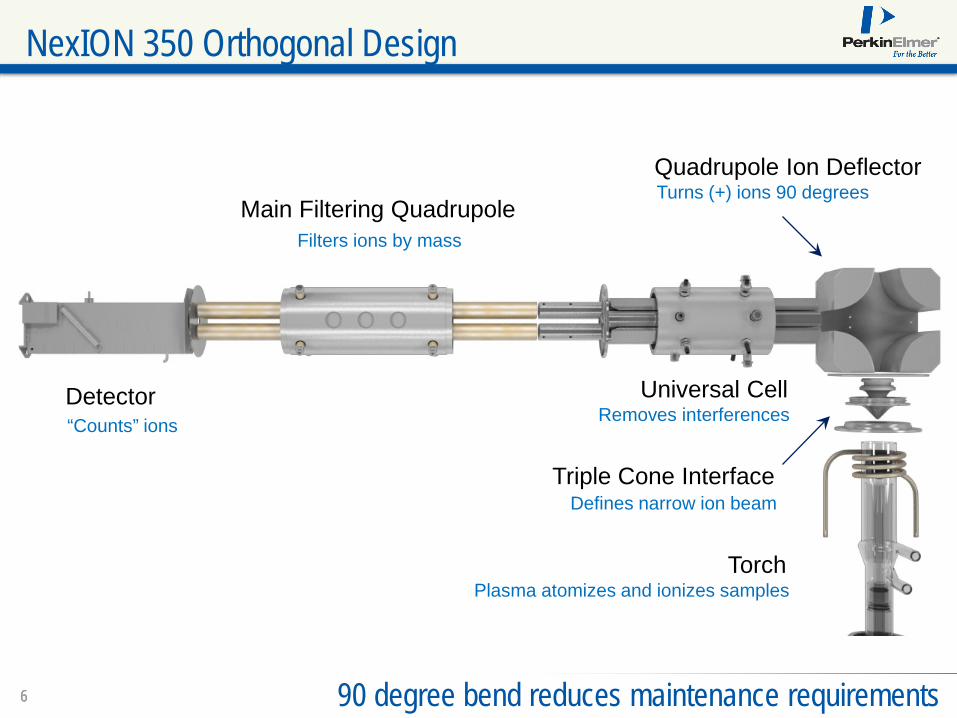
NexION 350 Orthogonal Design
Detector
Main Filtering Quadrupole
Universal Cell
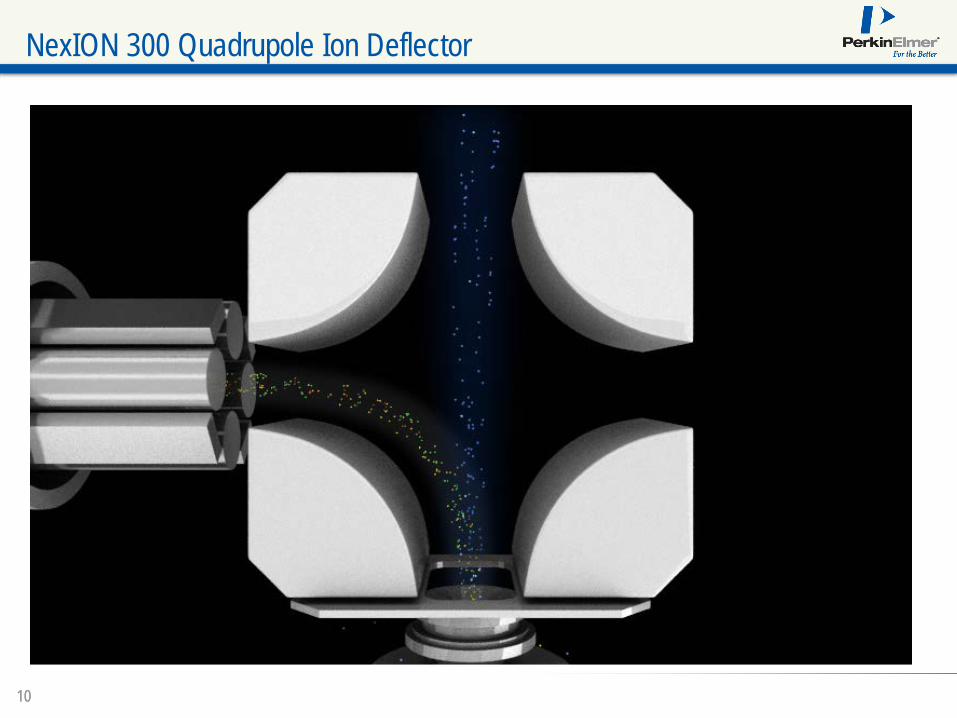
Quadrupole Ion Deflector
Triple Cone Interface
Torch
Defines narrow ion beam
Plasma atomizes and ionizes samples
90 degree bend reduces maintenance requirements
Turns (+) ions 90 degrees
Removes interferences
Filters ions by mass
“Counts” ions
77
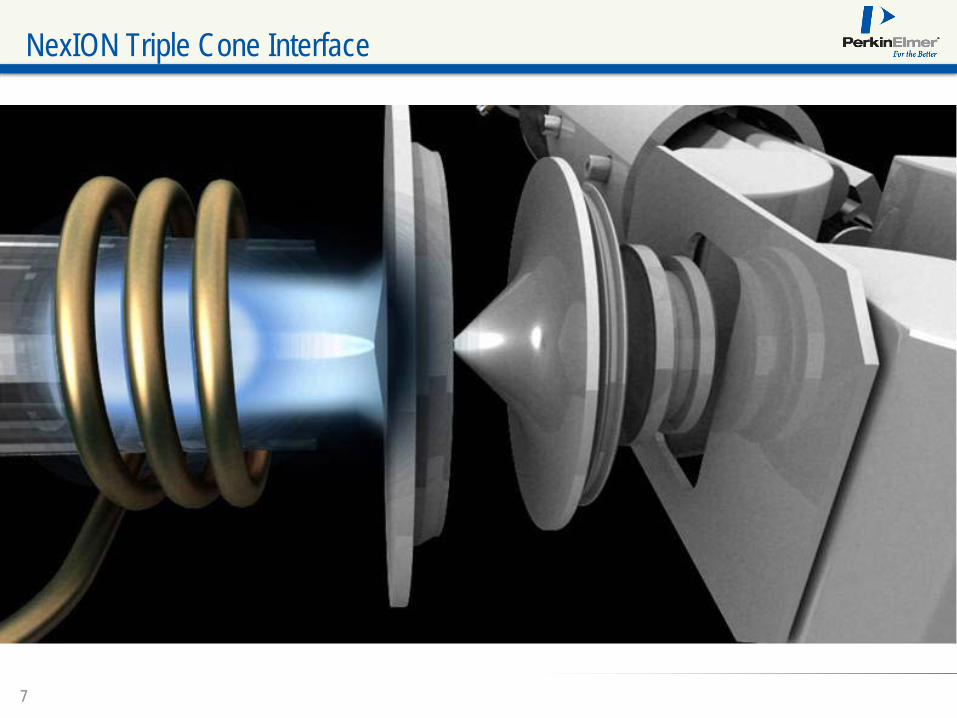
NexION Triple Cone Interface
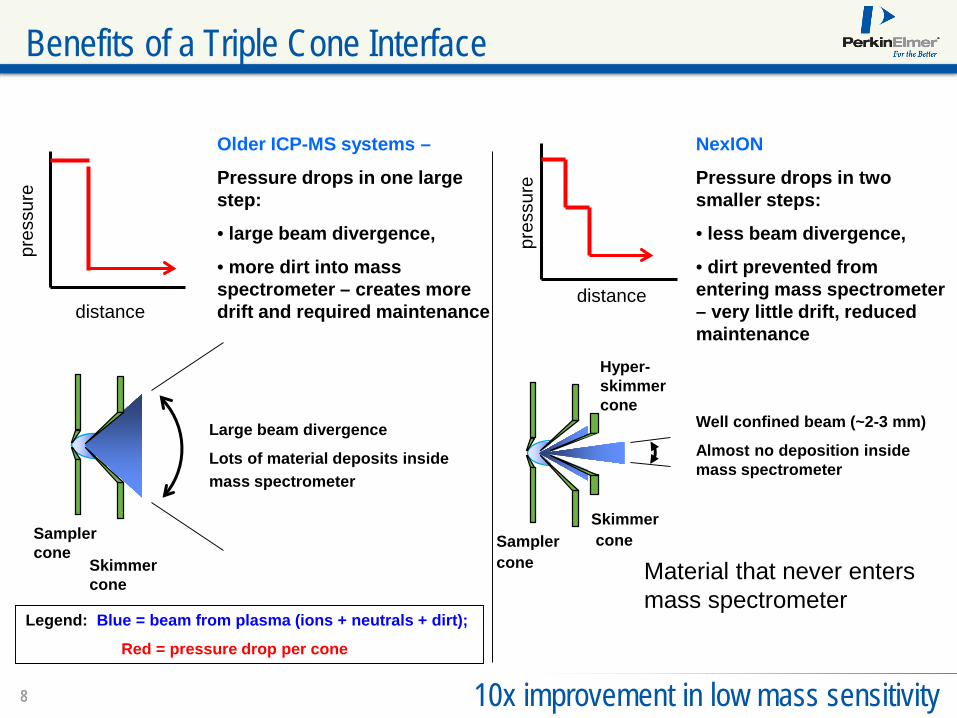
88 10x improvement in low mass sensitivity
Benefits of a Triple Cone Interface
Well confined beam (~2-3 mm)
Almost no deposition inside mass spectrometer
NexION
Pressure drops in two smaller steps:
• less beam divergence,
• dirt prevented from entering mass spectrometer – very little drift, reduced maintenance
Sampler cone
Skimmercone
Hyper-skimmer cone
pres
sure
distance
Large beam divergence
Lots of material deposits inside mass spectrometer
Older ICP-MS systems –
Pressure drops in one large step:
• large beam divergence,
• more dirt into mass spectrometer – creates more drift and required maintenance
Legend: Blue = beam from plasma (ions + neutrals + dirt);
Red = pressure drop per cone
Sampler cone
Skimmer cone
pres
sure
distance
Material that never enters mass spectrometer
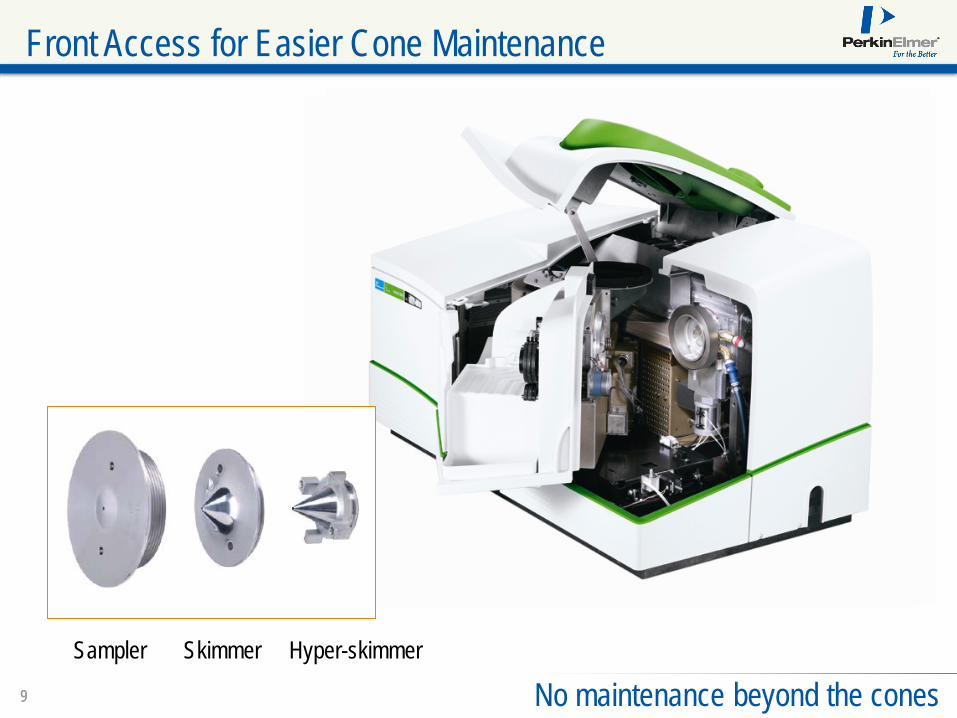
99 No maintenance beyond the cones
Front Access for Easier Cone Maintenance
Skimmer Hyper-skimmerSampler
1010
NexION 300 Quadrupole Ion Deflector
1111
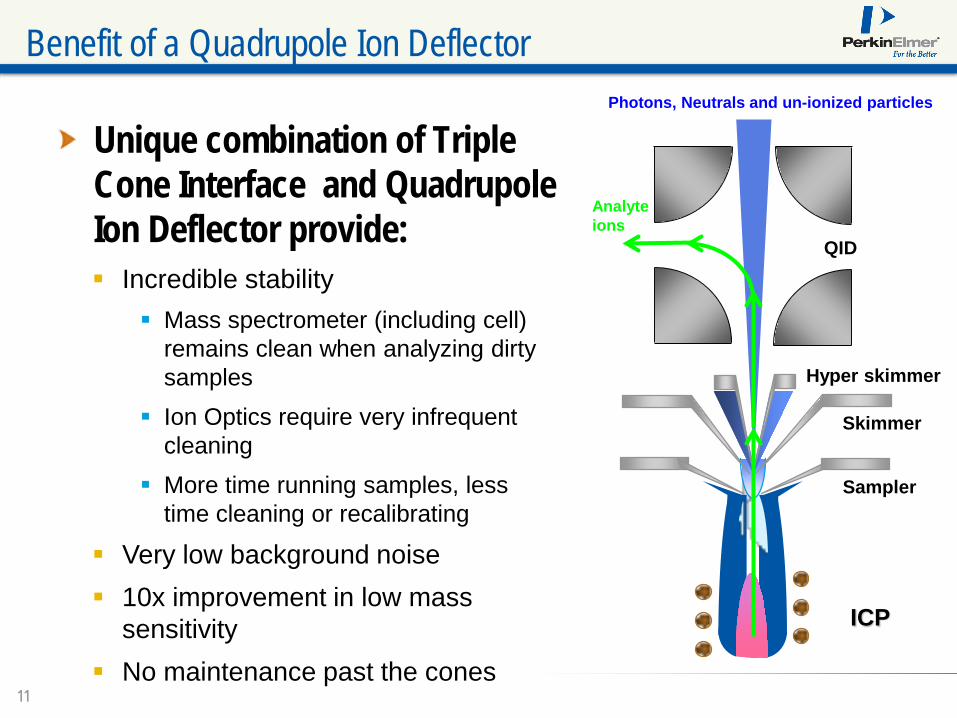
Unique combination of Triple Cone Interface and Quadrupole Ion Deflector provide:
Benefit of a Quadrupole Ion Deflector
Incredible stability Mass spectrometer (including cell)
remains clean when analyzing dirty samples
Ion Optics require very infrequent cleaning
More time running samples, less time cleaning or recalibrating
Very low background noise 10x improvement in low mass
sensitivity No maintenance past the cones
Sampler
Skimmer
ICP
Hyper skimmer
QID
Photons, Neutrals and un-ionized particles
Analyte ions

1212
Exceptional Stability – 9 Hour Drinking Water Analysis
80
85
90
95
100
105
110
115
120
0 1 1.4 2.1 2.8 3.5 4.2 4.9 5.6 6.3 7.0 7.7 8.4 9.1Elapsed Time Since Calibration (Hours)
% R
ecov
ery
of C
alib
ratio
n St
anda
rds
Be9
V51
Zn66
As75
Cd111
Hg202
Pb208
U238
1313
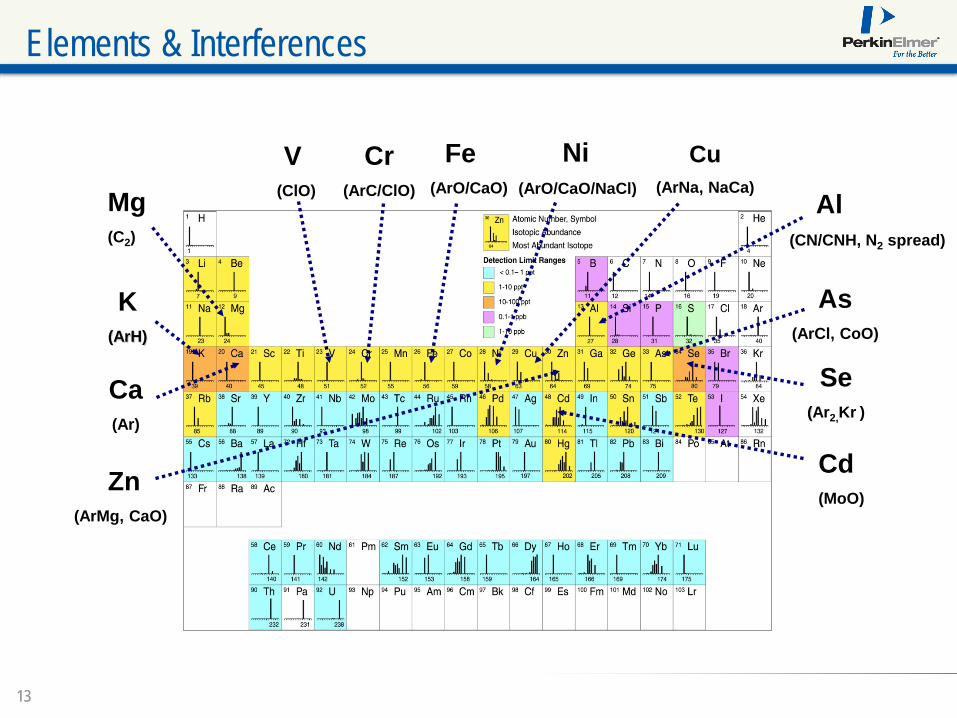
Elements & Interferences
Ca(Ar)
K(ArH)
V (ClO)
Cr(ArC/ClO)
As(ArCl, CoO)
Se(Ar2,Kr )
Cu(ArNa, NaCa)
Ni(ArO/CaO/NaCl)
Cd(MoO)
Zn(ArMg, CaO)
Fe(ArO/CaO)Mg
(C2)
Al(CN/CNH, N2 spread)
1414
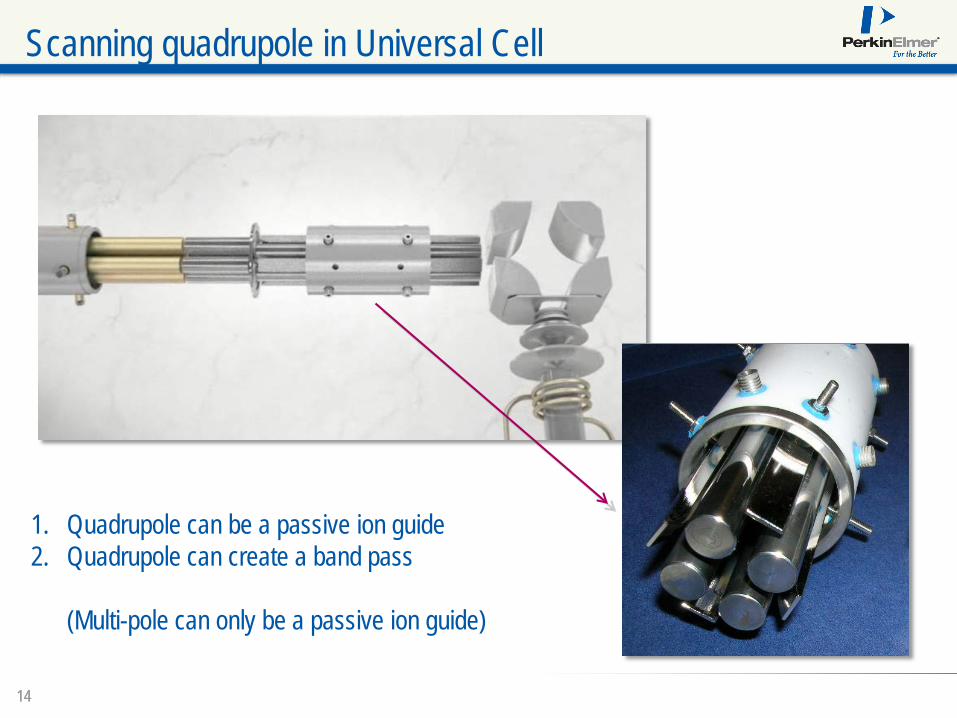
Scanning quadrupole in Universal Cell
1. Quadrupole can be a passive ion guide2. Quadrupole can create a band pass
(Multi-pole can only be a passive ion guide)
1515
Universal Cell - Introduction of Modes

1616
The STD mode is most suitable for: Applications with few interferences on analytes of interest Low mass or high mass elements
… BECs for interfered elements can be in the ppb range
Universal Cell Technology (UCT™)
1717
Correction equations work quite well with low levels of interference EPA 200.8 still does not allow cell technology for drinking water
Some correction equations have multiple terms Lowers precision of final result High levels of interference introduce more uncertainty
Some interferences cannot be corrected mathematically e.g. Br on Se and Ar
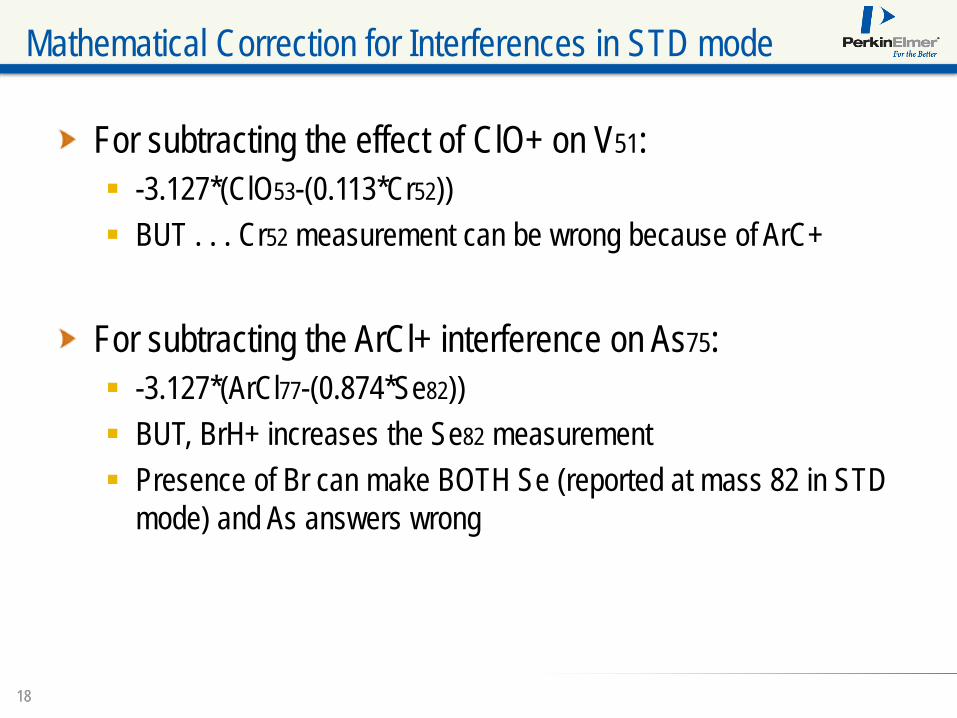
Mathematical Correction for Interferences in STD mode
1818
For subtracting the effect of ClO+ on V51: -3.127*(ClO53-(0.113*Cr52)) BUT . . . Cr52 measurement can be wrong because of ArC+
For subtracting the ArCl+ interference on As75: -3.127*(ArCl77-(0.874*Se82)) BUT, BrH+ increases the Se82 measurement Presence of Br can make BOTH Se (reported at mass 82 in STD
mode) and As answers wrong
Mathematical Correction for Interferences in STD mode
1919
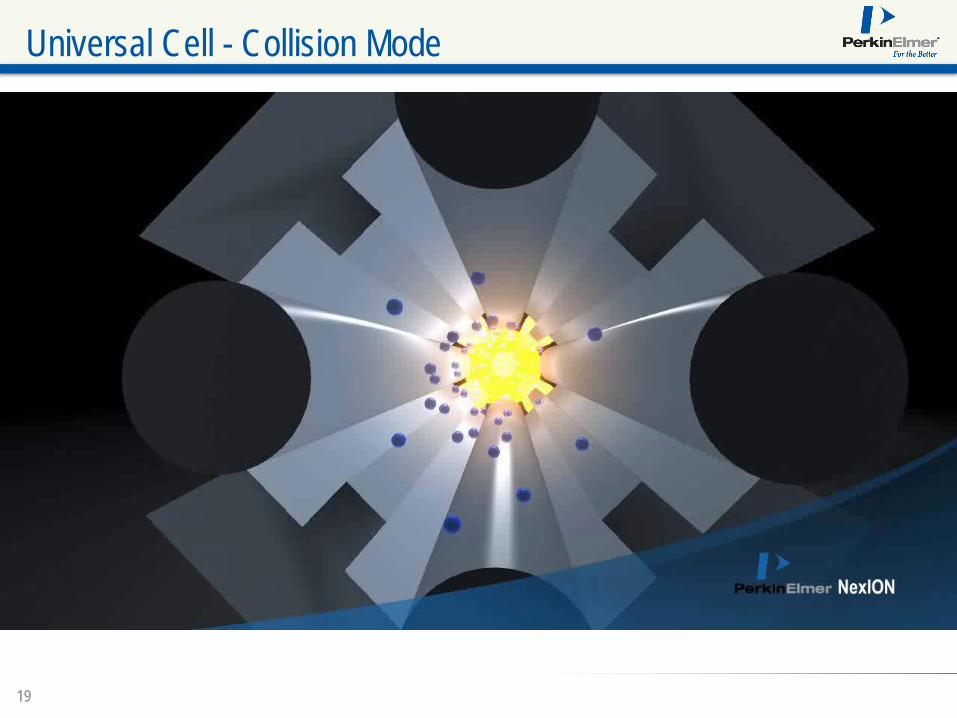
Universal Cell - Collision Mode

2020
The Collision (KED) mode is most suitable for: First row transition elements Applications susceptible to common interferences at moderate
levels
… BECs for interfered elements are in the ppt range
Universal Cell Technology (UCT™)
2121
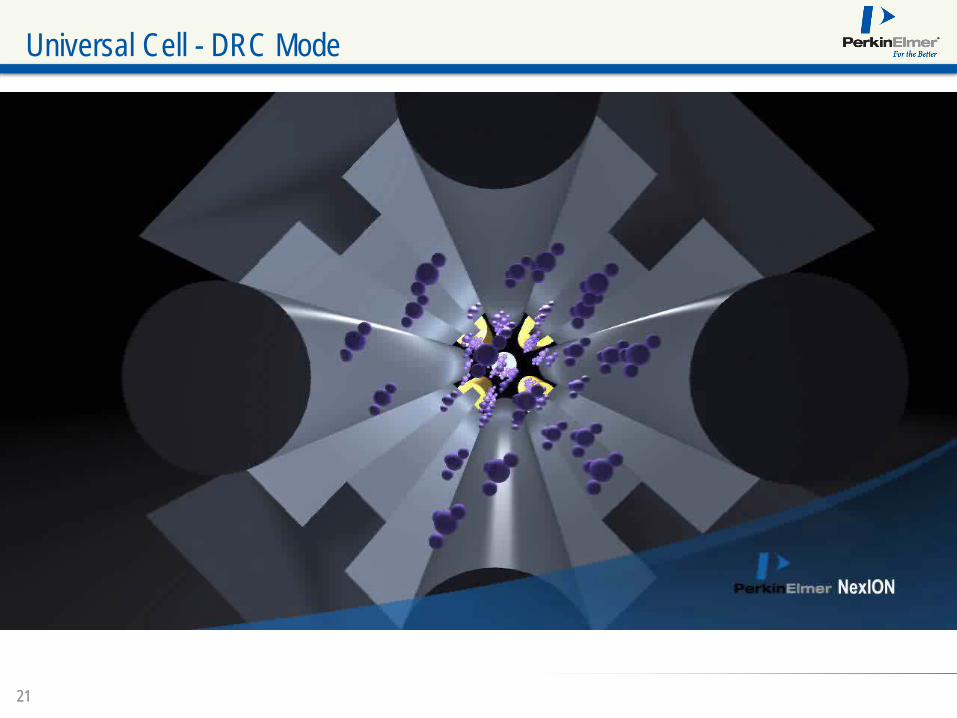
Universal Cell - DRC Mode
2222
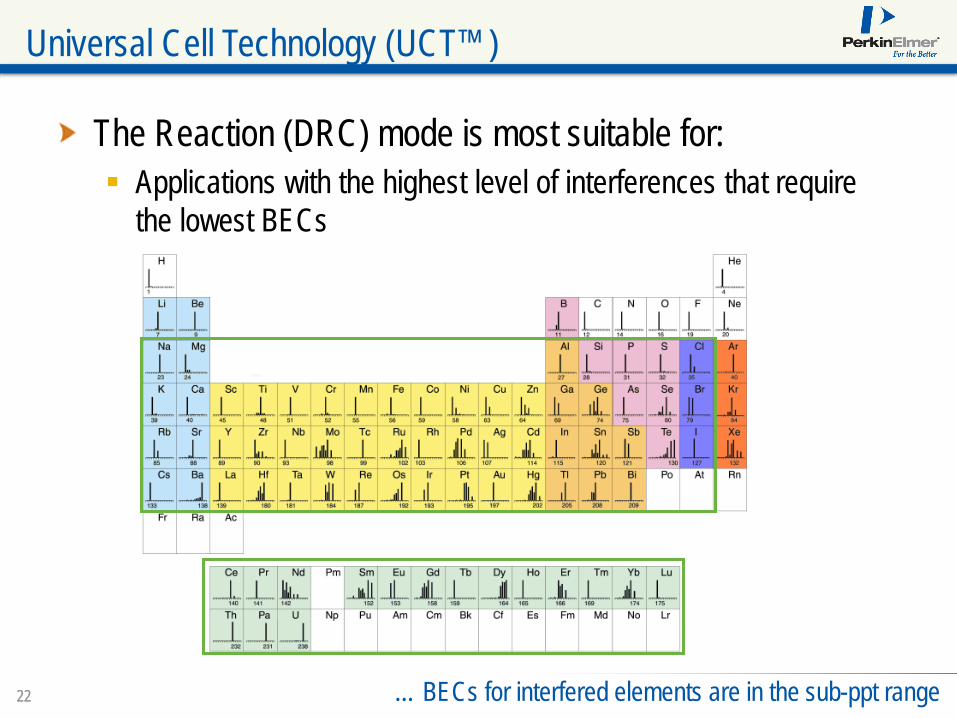
The Reaction (DRC) mode is most suitable for: Applications with the highest level of interferences that require
the lowest BECs
… BECs for interfered elements are in the sub-ppt range
Universal Cell Technology (UCT™)

2323
NEW! Comprehensive software for ICP-MSEasy setup of instrument, methods and sample analysesIn depth reporting of calibration, sample results, QC’s, internal standardsIntegrated instrument diagnostics for troubleshooting
Syngistix for ICP-MS
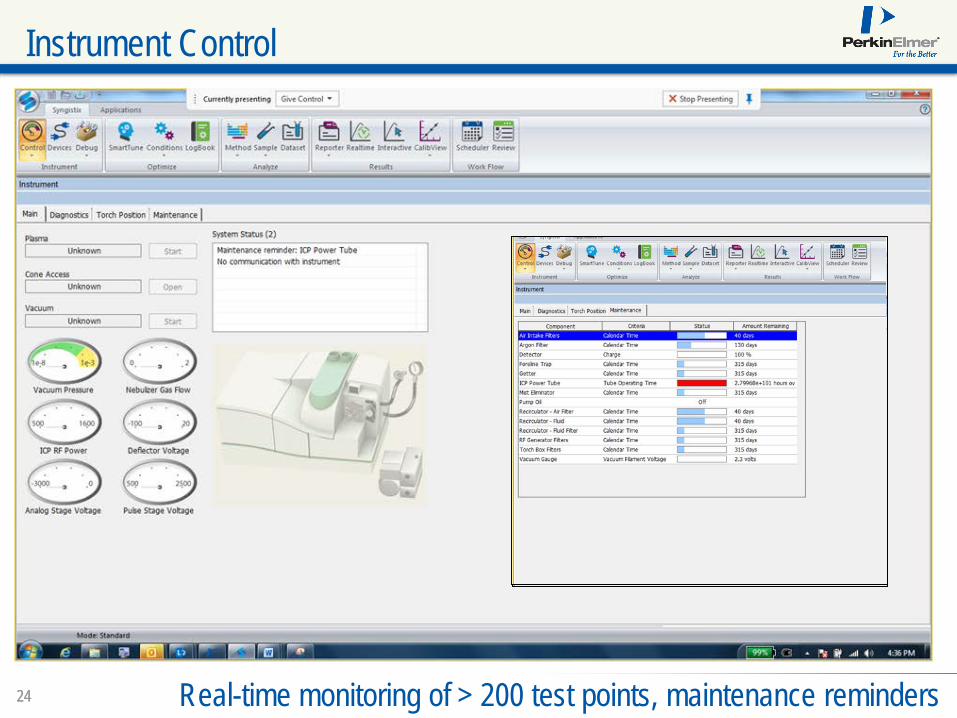
2424 Real-time monitoring of > 200 test points, maintenance reminders
Instrument Control
2525
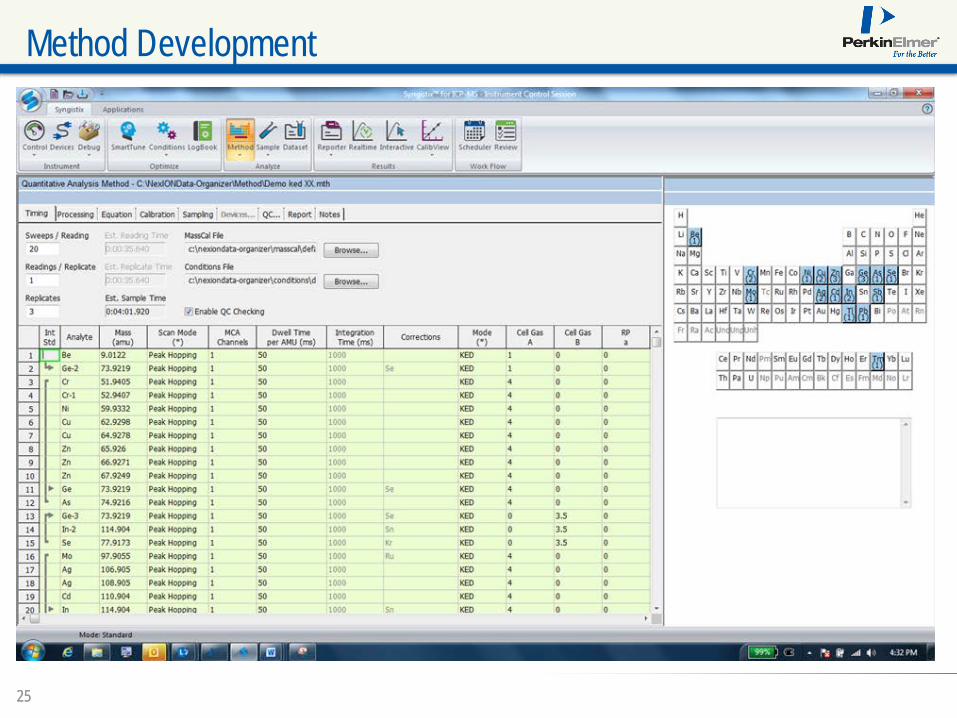
Method Development

2626
Sample Run List
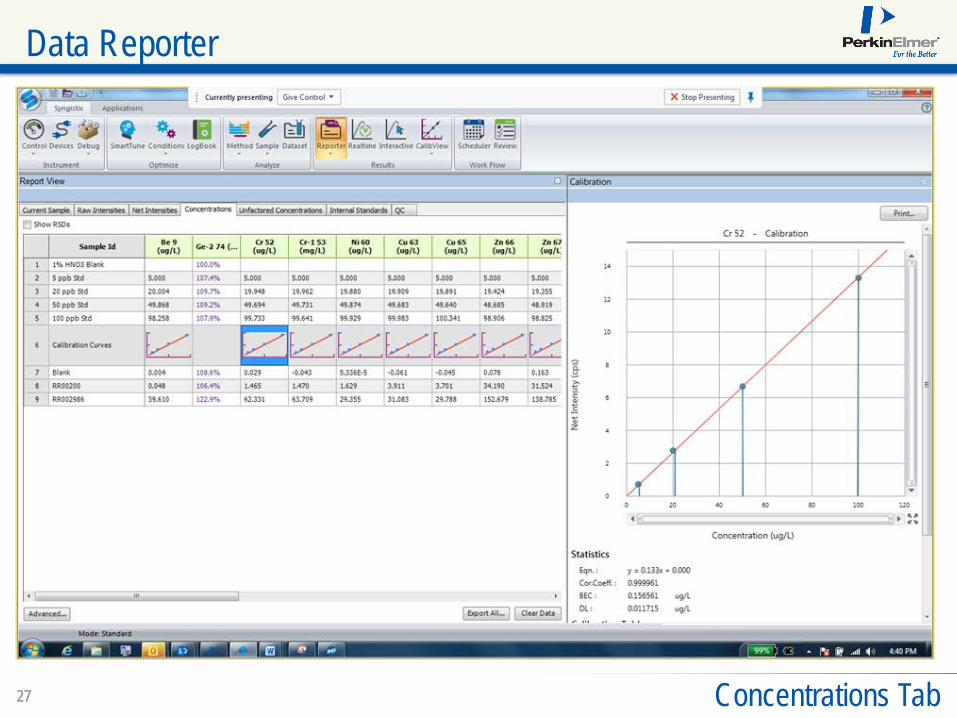
2727 Concentrations Tab
Data Reporter

2828
Routine EPA 200.8, 6020 (KED mode usually sufficient)
High sample throughput FAST autosampler prepFAST complete autodilution and preparation system
Specialized Speciation, e.g. Cr and As Direct seawater analysis with seaFAST
Requires DRC Single nanoparticle analysis
Unique to NexION due to ultra fast analysis time
Environmental Applications

2929
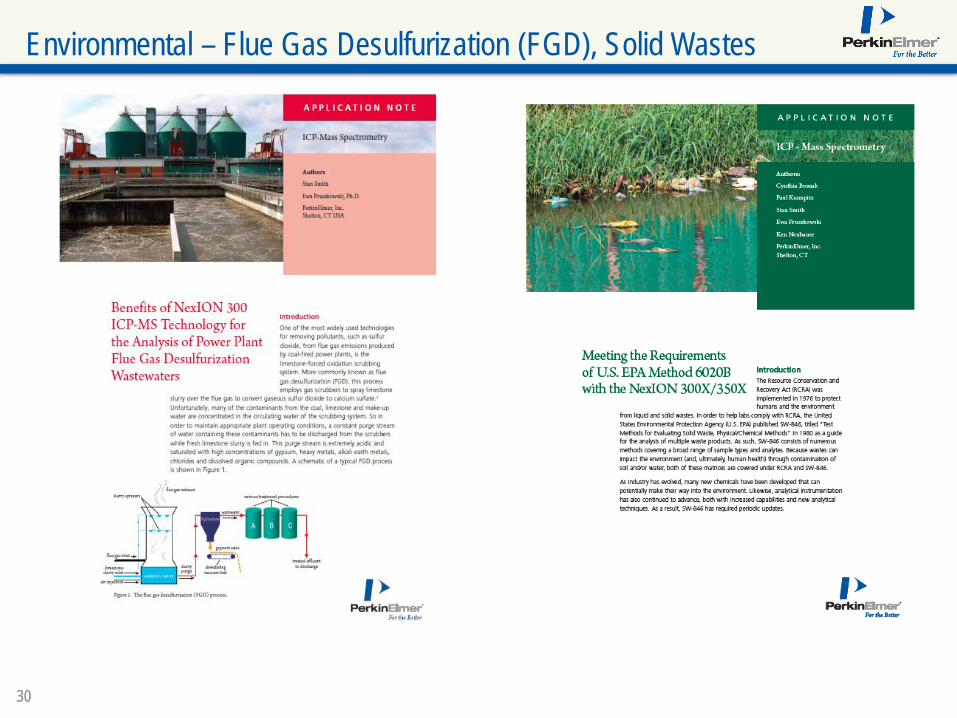
Three 200.8 Method Application Papers
2
The Analysis of DrinkingWaters by U.S. EPA Method200.8 Using the NexION300Q ICP-MS in StandardMode The Analysis of Drinking
Waters by U.S. EPA Method200.8 Using the NexION300X ICP-MS in Standardand Collision Modes The Analysis of Drinking
Waters by U.S. EPA Method200.8 Using the NexION300D ICP-MS in Standard,Collision and Reaction Modes
Each application note has:IDLs, MDLs and linear rangesResults for SRMs12hour stability runs
3030
Environmental – Flue Gas Desulfurization (FGD), Solid Wastes
© 2013 PerkinElmer, Inc. All rights reserved.
Use of ICP-MS for USP <232> and <2232> Laboratory Compliance
3232
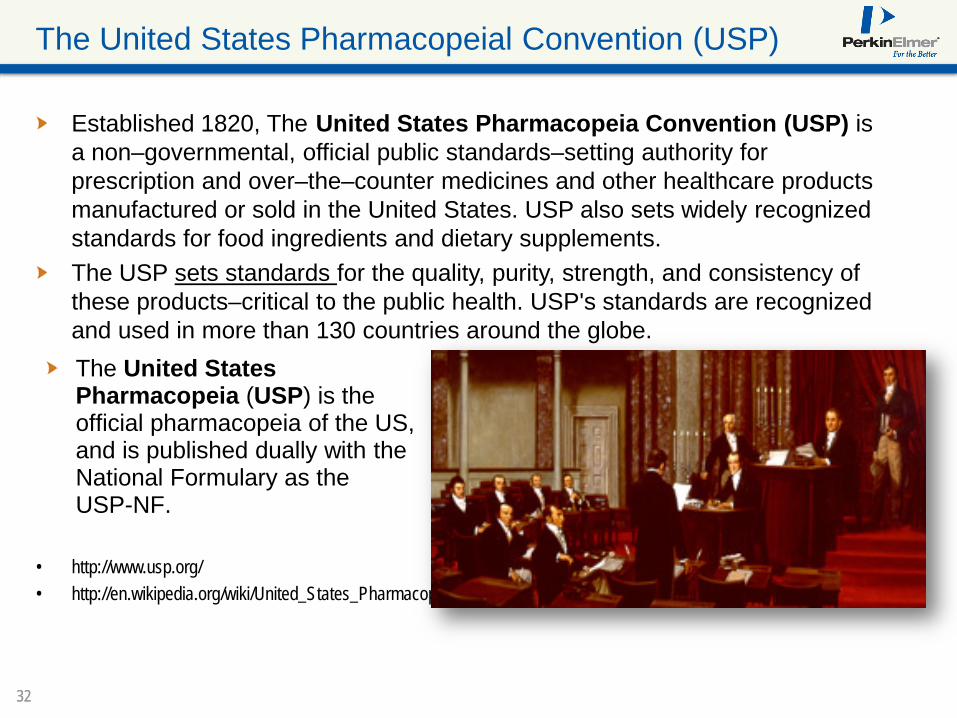
The United States Pharmacopeial Convention (USP)
Established 1820, The United States Pharmacopeia Convention (USP) is a non–governmental, official public standards–setting authority for prescription and over–the–counter medicines and other healthcare products manufactured or sold in the United States. USP also sets widely recognized standards for food ingredients and dietary supplements.The USP sets standards for the quality, purity, strength, and consistency of these products–critical to the public health. USP's standards are recognized and used in more than 130 countries around the globe.
• http://www.usp.org/• http://en.wikipedia.org/wiki/United_States_Pharmacopeia
The United States Pharmacopeia (USP) is the official pharmacopeia of the US, and is published dually with the National Formulary as the USP-NF.

3333
USP <231> Heavy Metals General Chapter
Detects metals colored by sulfide ion (Pb, Hg, Bi, As, Sb, Sn, Cd, Ag, Cu, Mo)
Color of sample compared to standard
Very non-specific Very labor intensive Large sample size
required (2 grams) Ashing sample
preparation step for solids
US Pharmacopeia <231>Heavy Metals ~ 100 year old Qualitative method
3434
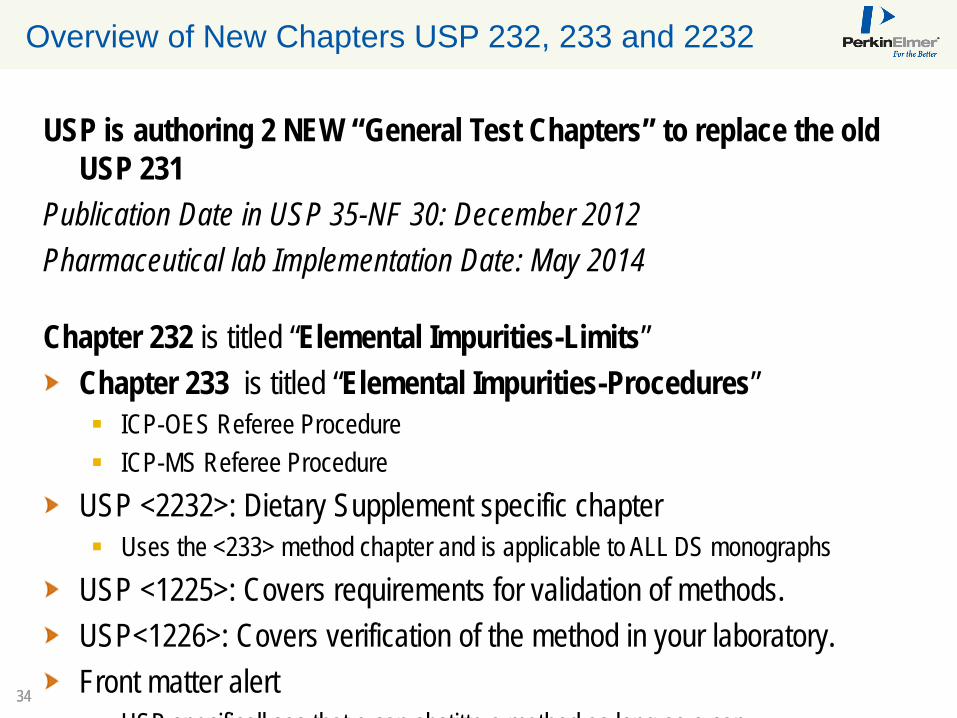
Overview of New Chapters USP 232, 233 and 2232
USP is authoring 2 NEW “General Test Chapters” to replace the old USP 231
Publication Date in USP 35-NF 30: December 2012Pharmaceutical lab Implementation Date: May 2014
Chapter 232 is titled “Elemental Impurities-Limits”Chapter 233 is titled “Elemental Impurities-Procedures” ICP-OES Referee Procedure ICP-MS Referee Procedure
USP <2232>: Dietary Supplement specific chapter Uses the <233> method chapter and is applicable to ALL DS monographs
USP <1225>: Covers requirements for validation of methods. USP<1226>: Covers verification of the method in your laboratory. Front matter alert
USP specificall sas that o can sbstitte a method as long as o can
3535
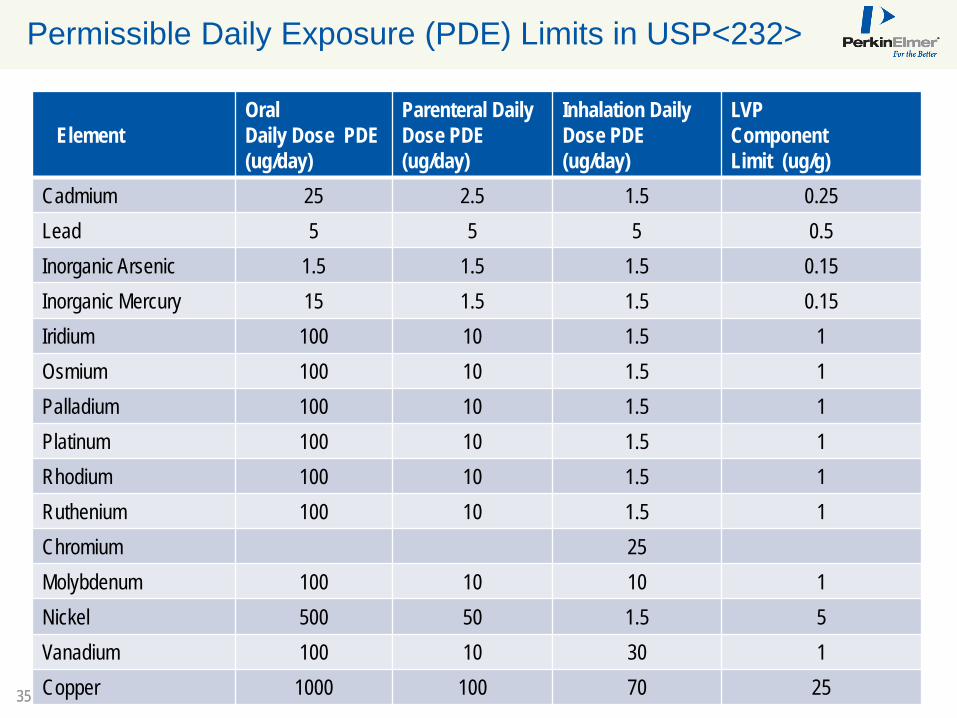
Permissible Daily Exposure (PDE) Limits in USP<232>
ElementOralDaily Dose PDE(ug/day)
Parenteral DailyDose PDE (ug/day)
Inhalation Daily Dose PDE (ug/day)
LVPComponentLimit (ug/g)
Cadmium 25 2.5 1.5 0.25Lead 5 5 5 0.5Inorganic Arsenic 1.5 1.5 1.5 0.15Inorganic Mercury 15 1.5 1.5 0.15Iridium 100 10 1.5 1Osmium 100 10 1.5 1Palladium 100 10 1.5 1Platinum 100 10 1.5 1Rhodium 100 10 1.5 1Ruthenium 100 10 1.5 1Chromium 25Molybdenum 100 10 10 1Nickel 500 50 1.5 5Vanadium 100 10 30 1Copper 1000 100 70 25
3636
How Many Elements covered in USP <2232>?
3
3737
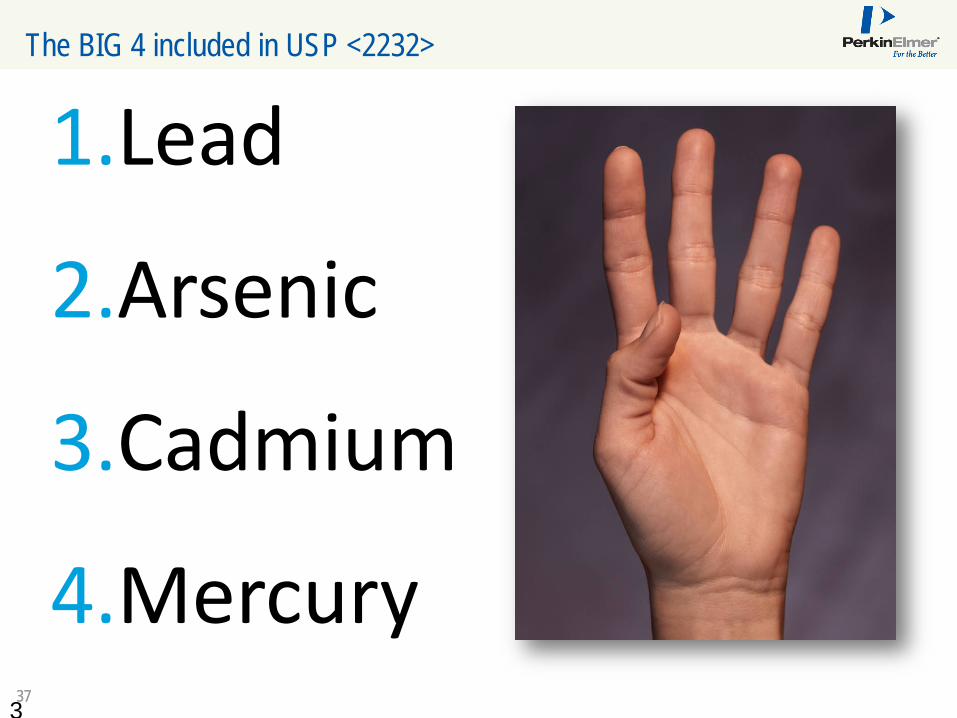
The BIG 4 included in USP <2232>
3
1.Lead
2.Arsenic
3.Cadmium
4.Mercury
3838
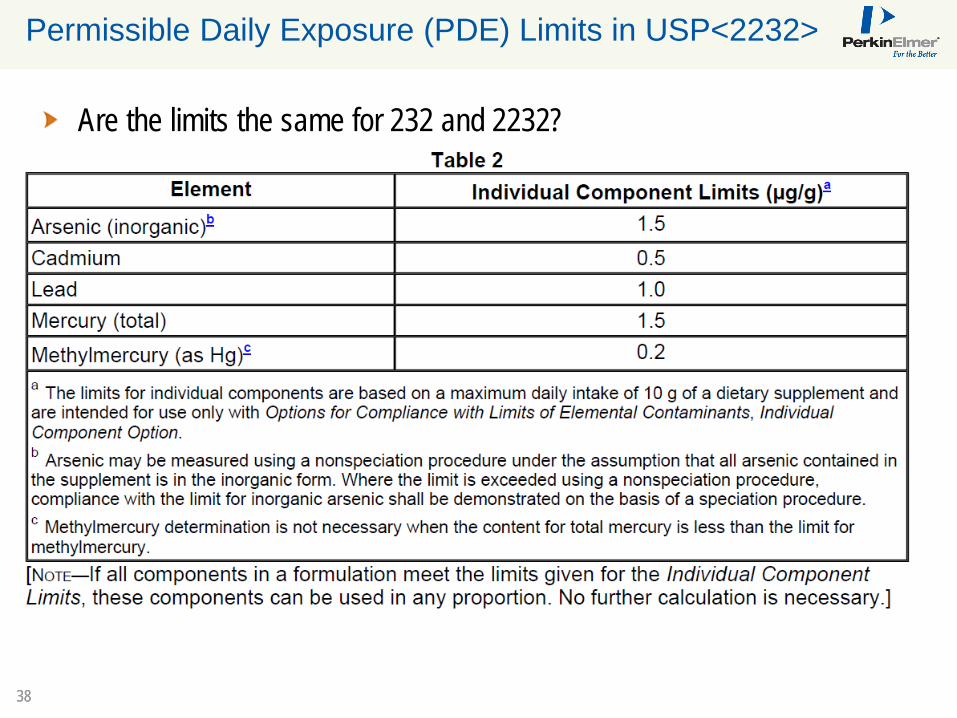
Permissible Daily Exposure (PDE) Limits in USP<2232>
Are the limits the same for 232 and 2232?

3939
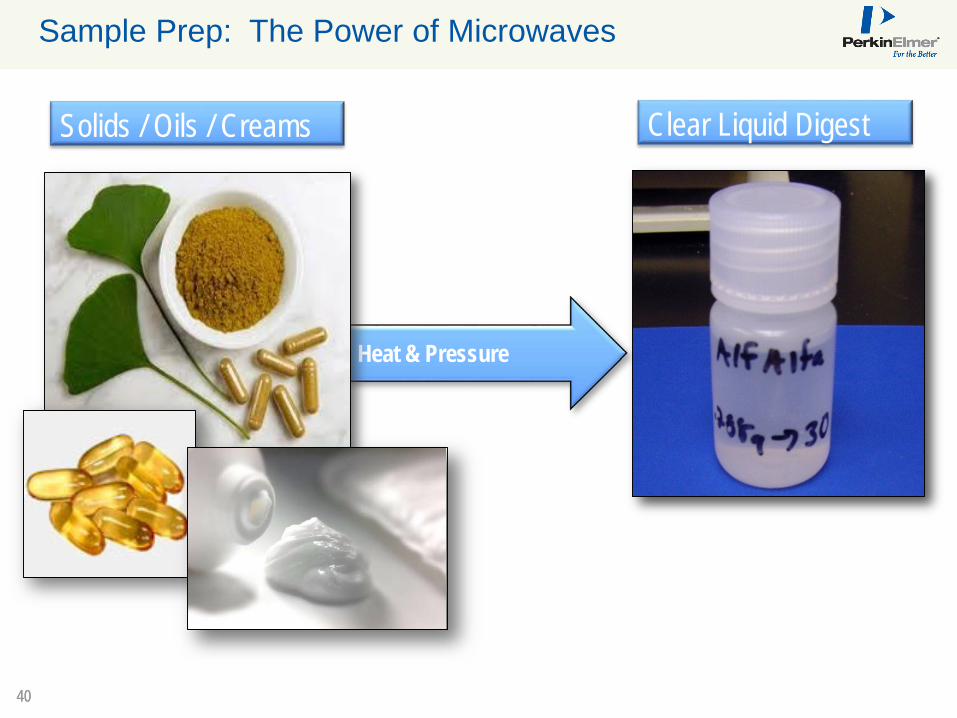
Briefing <233> Elemental Impurities—Procedures. 4 Choices1. Analyze Neat, undiluted if sample is in suitable form2. Dilute in Acidified Aqueous solution if soluble in water3. Dilute in an appropriate Organic solvent4. Closed vessel microwave digestion for insoluble samples
USP 233 on Sample Preparation
4040
Sample Prep: The Power of Microwaves
Heat & Pressure
Solids / Oils / Creams Clear Liquid Digest

4141
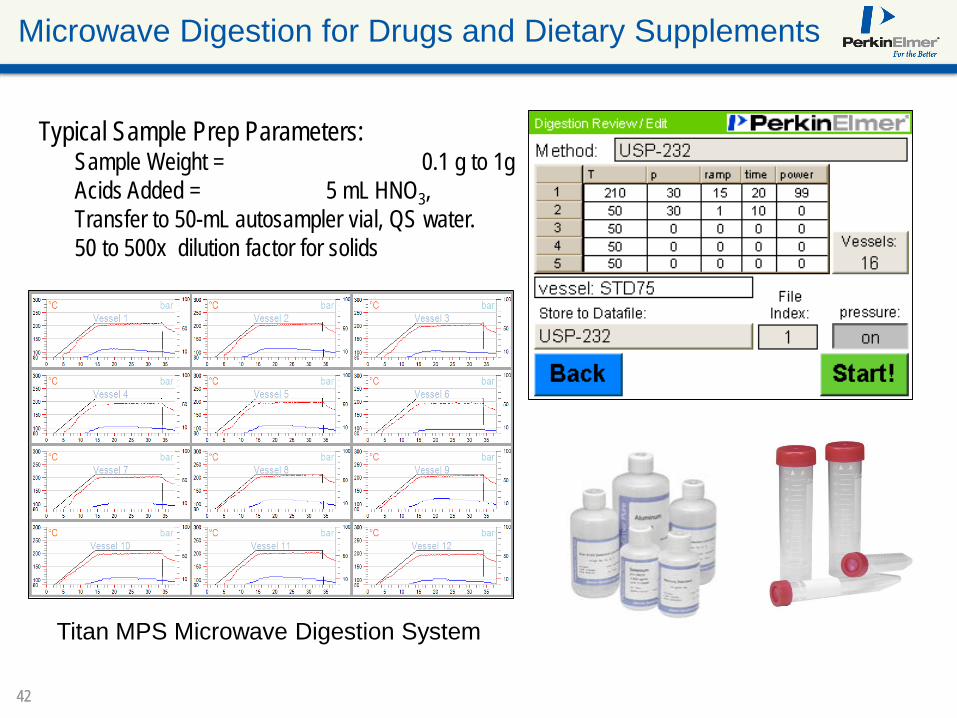
Vessel Specifications
Titan MPS Microwave Sample Prep Standard 75mL High Pressure 100mLVessel Material Solid PTFE-TFM™ Solid PTFE-TFM™Volume 75mL 100mLPressure Rating 40 bar (580psi) 100 bar (1450psi)Maximum Temperature 260 oC 260 oCVessels per turntable 16 8DTC™ All Vessels All VesselsDPC™ Reference Vessel Reference Vessel
All vessels come with a one-year warranty.
DTC™ :Reference quality sample temperature sensing in all vessels.
DPC™ : Reference quality sample pressure sensing in a single vessel.
4242
Microwave Digestion for Drugs and Dietary Supplements
Typical Sample Prep Parameters:Sample Weight = 0.1 g to 1gAcids Added = 5 mL HNO3, Transfer to 50-mL autosampler vial, QS water.50 to 500x dilution factor for solids
Titan MPS Microwave Digestion System

4343
USP on Analysis by ICP-MS
Ability to analyze most of the elements in the periodic tableWide dynamic range Part-per-trillion to high part-per-million
Only technique which can detect As, Cd, Hg and Pb at required levelsAnalyze high level elements using Extended Dynamic Range (EDR)Requires One Sample Prep and One Method
Three Modes of Spectral Interference Reduction1. Standard Mode with Correction Equations2. K.E.D. Helium Collision mechanism reduce Polyatomic Interferences3. DRC Reaction mechanism based on specific chemistry

4444
ICP-MS Spectral Interferences
Some spectral interferences found in common matrices with USP metals
Interference Analyte40Ar12C 52Cr98Mo16O 114Cd35Cl40Ar 75As44Ca16O 60Ni40Ar 23Na 63Cu35Cl16O 51V

4545
Measured Elemental Contaminants in Oral Drug Product
Element/Mass Oral PDE(ug/g)
Cold/FluRemedy(ug/g)
(%) Recov. 0.8J Spike
MDL’s500x Dilution(ug/g)
Cd 114 2.5 <MDL 105 0.0004Pb 206+207+208 0.5 5 106 0.0007As 75 0.15 1.5 110 0.0045Hg 202 1.5 <MDL 105 0.0080Ir 193 10 <MDL 105 0.0005Os 189 10 <MDL 105 0.0010Pd 105 10 <MDL 98 0.0025Pt 195 10 <MDL 104 0.0019Rh 103 10 <MDL 105 0.0002Ru 101 10 0.002 106 0.0005Mo 95 10 <MDL 105 0.003Ni 60 50 <MDL 106 0.0026V 51 100 0.054 105 0.0053Cu 63 100 < MDL 103 0.002
4646
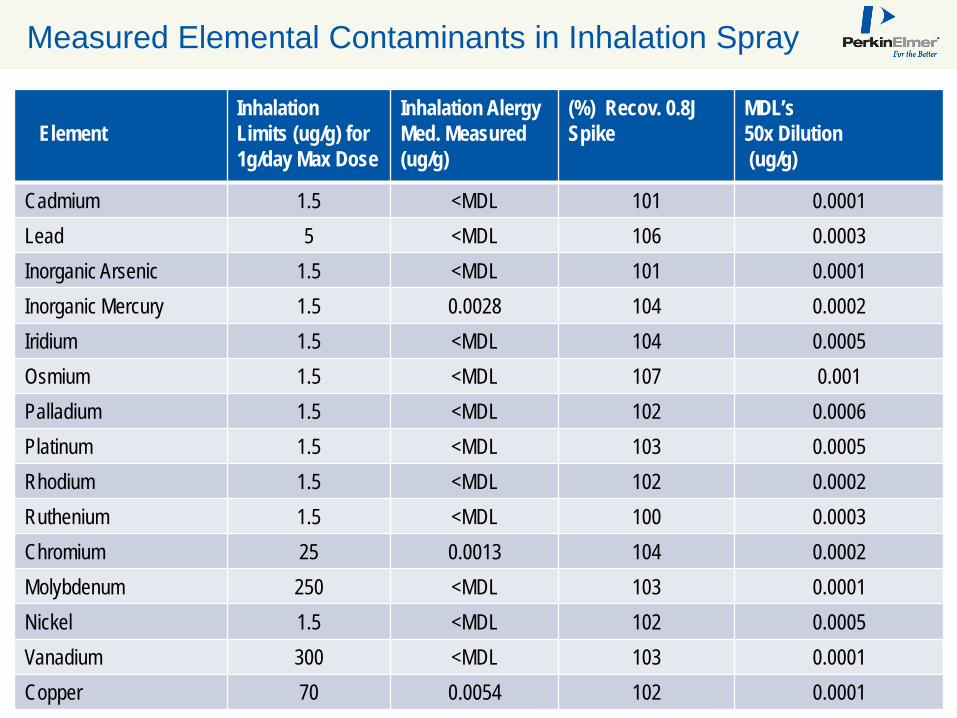
Measured Elemental Contaminants in Inhalation Spray
ElementInhalationLimits (ug/g) for 1g/day Max Dose
Inhalation AlergyMed. Measured (ug/g)
(%) Recov. 0.8J Spike
MDL’s50x Dilution(ug/g)
Cadmium 1.5 <MDL 101 0.0001Lead 5 <MDL 106 0.0003Inorganic Arsenic 1.5 <MDL 101 0.0001Inorganic Mercury 1.5 0.0028 104 0.0002Iridium 1.5 <MDL 104 0.0005Osmium 1.5 <MDL 107 0.001Palladium 1.5 <MDL 102 0.0006Platinum 1.5 <MDL 103 0.0005Rhodium 1.5 <MDL 102 0.0002Ruthenium 1.5 <MDL 100 0.0003Chromium 25 0.0013 104 0.0002Molybdenum 250 <MDL 103 0.0001Nickel 1.5 <MDL 102 0.0005Vanadium 300 <MDL 103 0.0001Copper 70 0.0054 102 0.0001

4747
HUMAN HEALTH • ENVIRONMENTAL HEALTH
Screening Plant Materials for Toxic and Nutritional Elements

4848
Application requires a wide dynamic range Low-level toxic elements – As, Cd, Pb, Se, and Hg Macro-level high concentrations – Ca, Mg, K and Na
If needed Extended Dynamic Range (EDR) can be employed
Samples are complex and require preparation Dissolve carbohydrates, minerals and proteins Require homogeneity and sometimes drying of
samples Microwave preparation can be used to digest into
solutions for analysis
Components in the matrix cause spectral interferences Organic components, minerals, digestion acids Universal Cell Technology (UCT) can be used to deal
with interferences
Experimental Challenges in Plant Material Analysis

4949
Microwave (Closed Digestion)
Common in Environmental, Food, Chemical Labs
Benefits:Closed, pressure digestionEasy methods, regulatory complianceSuitable for Mercury USP <232><233>
High temp, high pressuresFast digestionsTemp/Pressure controlData records
Challenges:Higher initial costPower/Ventilation requirements
Titan MPS

5050
Sample Preparation
Digestion Program
Approximately 0.25g of each sample was digested in duplicate with a mixture of HNO3 and H2O2. The addition of a small amount of HF is recommended for total digestion of siliceous material. After digestion, the sample solutions were diluted with deionized water to a final volume of 50 mL. Gold was added to all solutions to stabilize Hg.
Step TargetTemp (o
C)
Pressure Max (bar)
RampTime (min)
Hold Time (min)
Power (%)
1 150 30 5 5 60
2 200 30 5 20 90
3 50 30 1 10 0

5151
Speciation Capability – LC/ICPMS
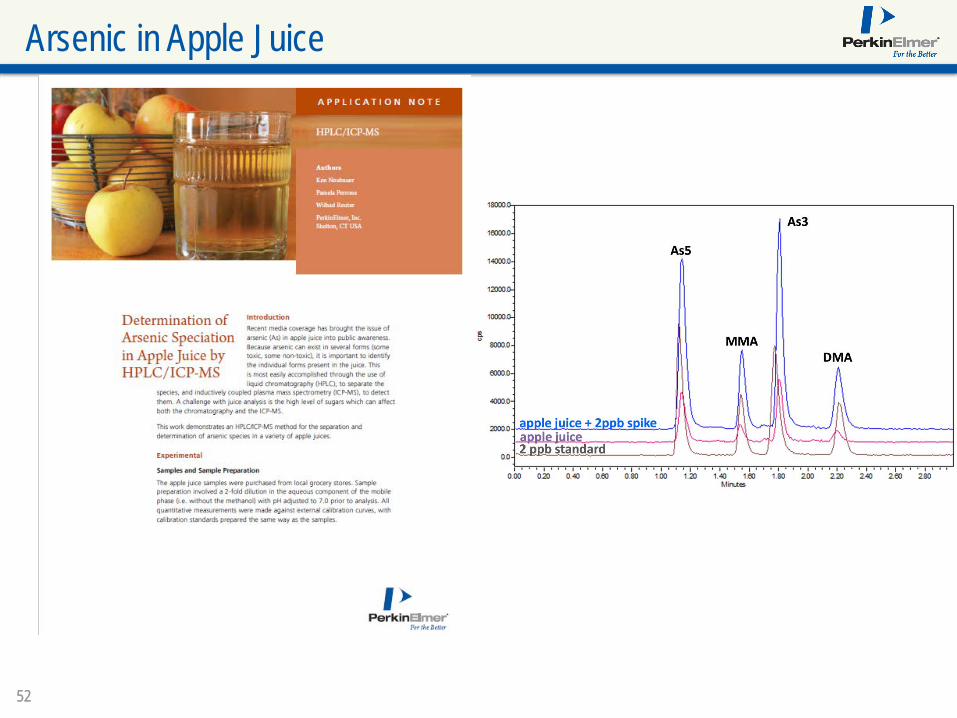
5252
Arsenic in Apple Juice

5353
SP-ICP-MS for Nanomaterials
www.perkinelmer.com
Environmental•Fate studies•Drinking water•Surface water•Water treatment•Remediation studies •Bioavailability studies•Bioaccumulation studies•Distribution in the ecosystem
Consumer•Health and Fitness•Energy •Food and Beverage•Textiles•Paint•Semiconductor•Automotive•Electronics and computers •Sunscreen•Nanocomposite materials
Biological/Biomedical•Early diagnosis•Cancer treatment•Drug design and delivery •Toxicological studies
Single Particle ICP-MSSyngistix™ Nano Application Module
5454
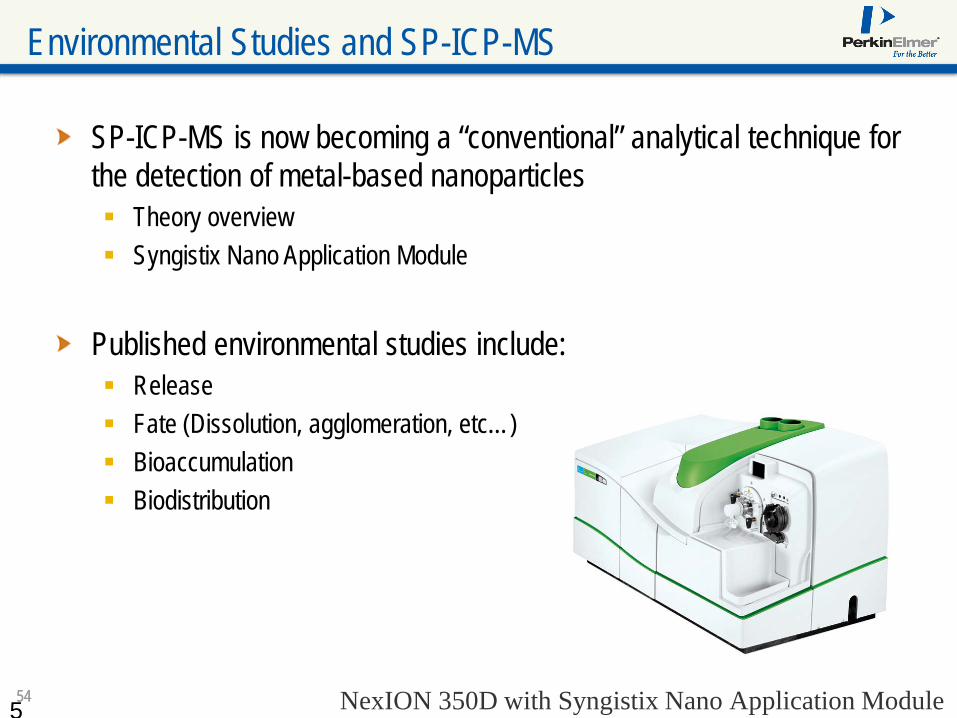
Environmental Studies and SP-ICP-MS
SP-ICP-MS is now becoming a “conventional” analytical technique for the detection of metal-based nanoparticles Theory overview Syngistix Nano Application Module
Published environmental studies include: Release Fate (Dissolution, agglomeration, etc…) Bioaccumulation Biodistribution
5 NexION 350D with Syngistix Nano Application Module

5555 © 2009 PerkinElmer© 2009 PerkinElmer© 2009 PerkinElmer© 2010 PerkinElmer
SP-ICP-MS Theory Overview
5
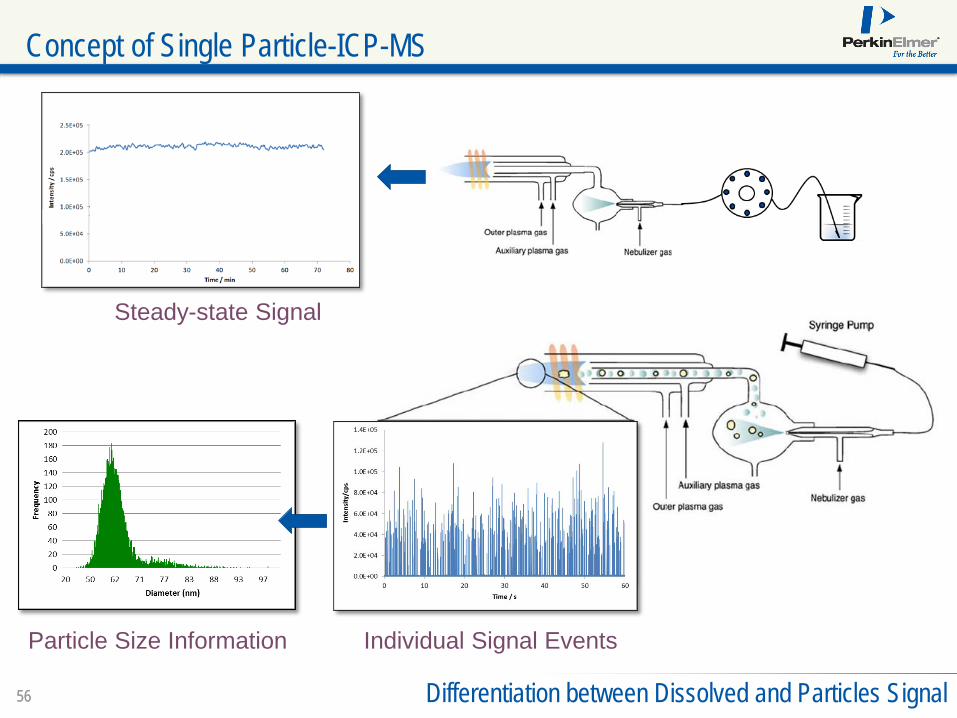
5656 Differentiation between Dissolved and Particles Signal
Steady-state Signal
Individual Signal EventsParticle Size Information
Concept of Single Particle-ICP-MS

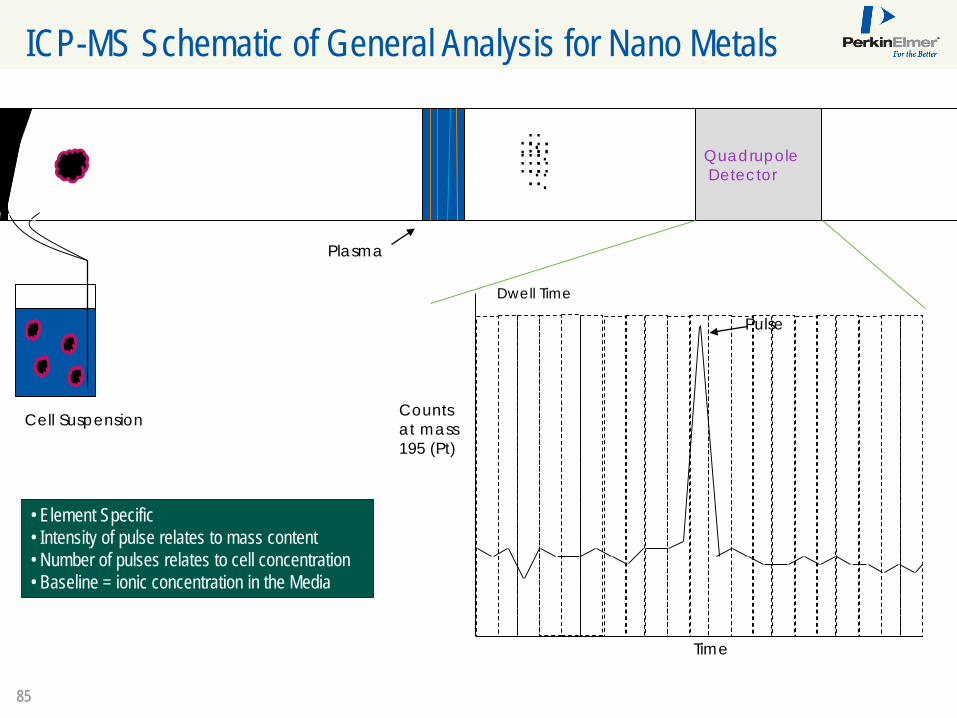
5757 Particles = Pulsed Signal
... ....... ..
..... ....... ......
..
... ...... ...
... ....... ..
..... ....... ......
..
..........QuadrupoleDetector
Time
Counts at mass 197 (Au)
Dwell Time
NanoparticulateMetals (Au)
Plasma
Pulse
• Tune Mass Spec for material• Intensity of pulse relates to
particle mass • Number of pulses relates to
particle concentration• Baseline = dissolved
300-500 µs
ICP-MS Schematic of General Analysis for Nano Metals

5858 NexION 350 Single Particle Mode
Overlap of ion plume transit with dwell time
ICP
-MS
Cou
nts
Time
Fast Continuous Data Acquisition = No Settling Time
Dwell Time Shorter than the Particle Transient Time
Fast Continuous Data Acquisition
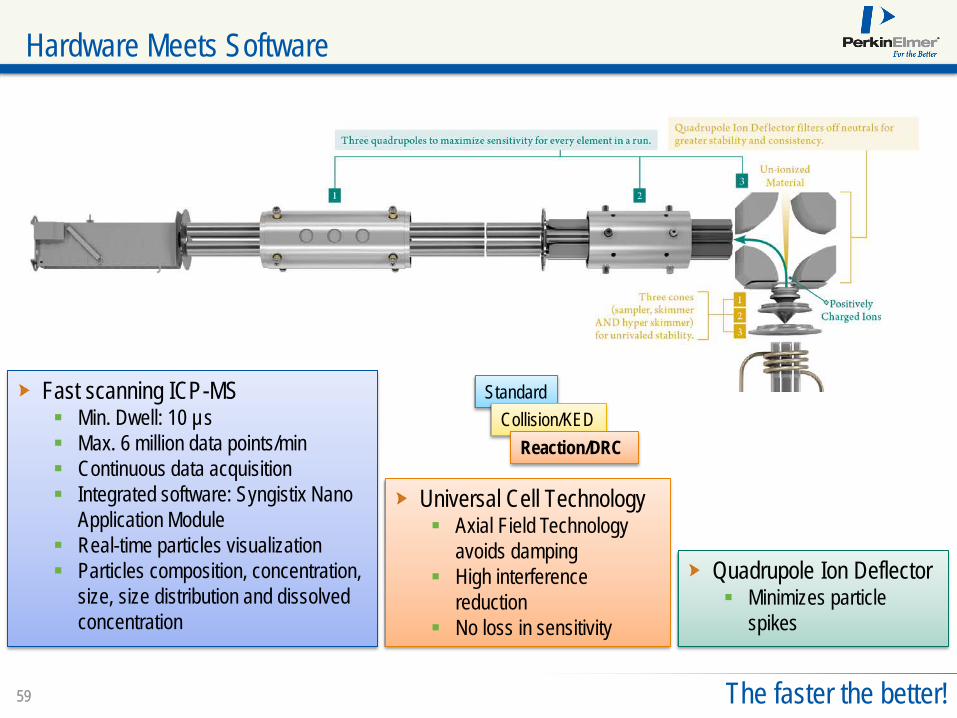
5959 The faster the better!
Fast scanning ICP-MS Min. Dwell: 10 µs Max. 6 million data points/min Continuous data acquisition Integrated software: Syngistix Nano
Application Module Real-time particles visualization Particles composition, concentration,
size, size distribution and dissolved concentration
StandardCollision/KED
Reaction/DRC
Universal Cell Technology Axial Field Technology
avoids damping High interference
reduction No loss in sensitivity
Quadrupole Ion Deflector Minimizes particle
spikes
Hardware Meets Software

6060 © 2009 PerkinElmer© 2009 PerkinElmer© 2009 PerkinElmer© 2014 PerkinElmer
NexION 350 ICP-MS
Syngistix Nano Application Module

6161
Real-World Sample
Continuous Data Acquisition at 100 µs Dwell Time
0
50
100
150
200
250
300
350
400
0 1 2 3 4 5 6 7 8 9 10
I (19
7 Au)
, cou
nts
Time (s)
020406080
100120140160180200
7.7835 7.784 7.7845 7.785 7.7855 7.786 7.7865 7.787
Coun
ts
Time (s)
0
20
40
60
80
100
1.557 1.5575 1.558 1.5585 1.559 1.5595 1.56 1.5605
Coun
ts
Time (s)
Dwell = 100 µs Dwell = 100 µs
100 000 data points
6262
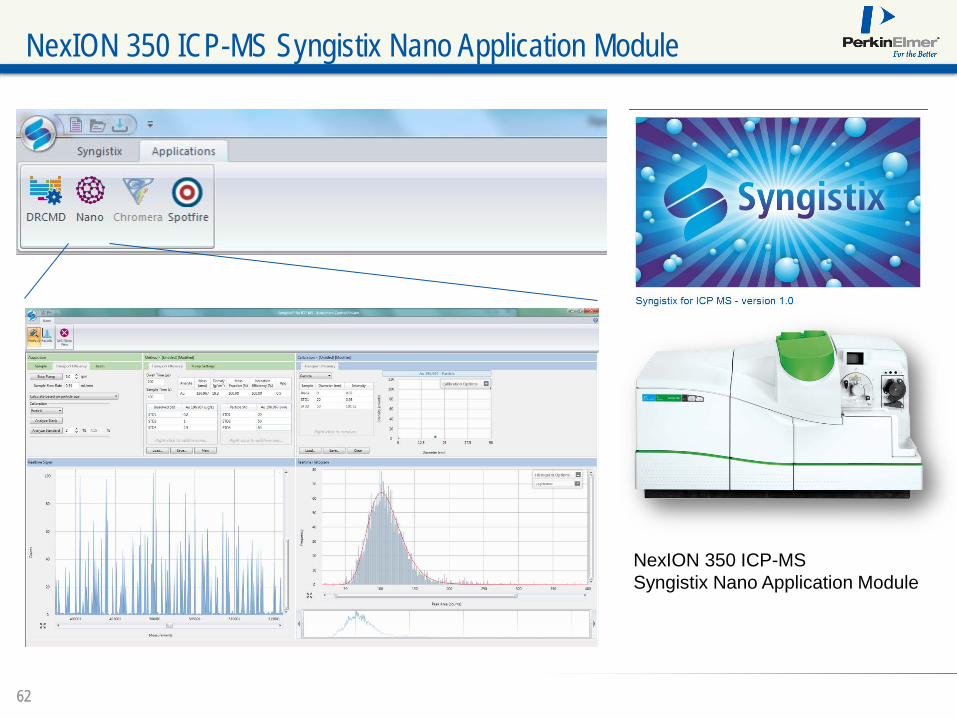
NexION 350 ICP-MSSyngistix Nano Application Module
NexION 350 ICP-MS Syngistix Nano Application Module
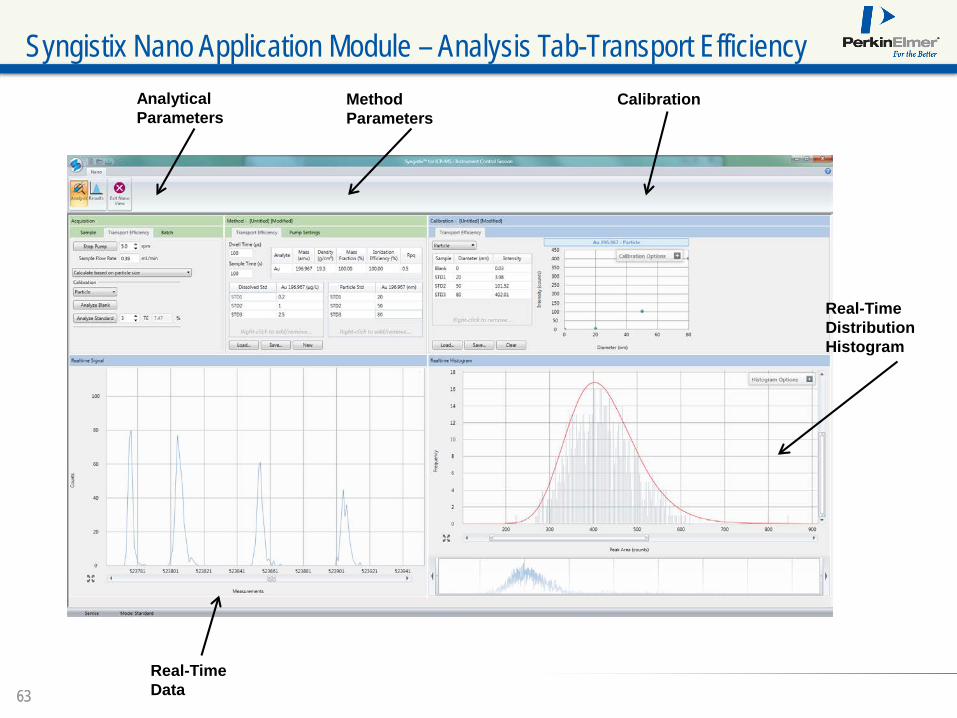
6363
Analytical Parameters
Method Parameters
Calibration
Real-Time Data
Real-Time Distribution Histogram
Syngistix Nano Application Module – Analysis Tab-Transport Efficiency

6464
Syngistix Nano Application Module – Analysis Panel
Analytical Parameters
Method Parameters Calibration
Real-Time Data
Real-Time Size Distribution Histogram
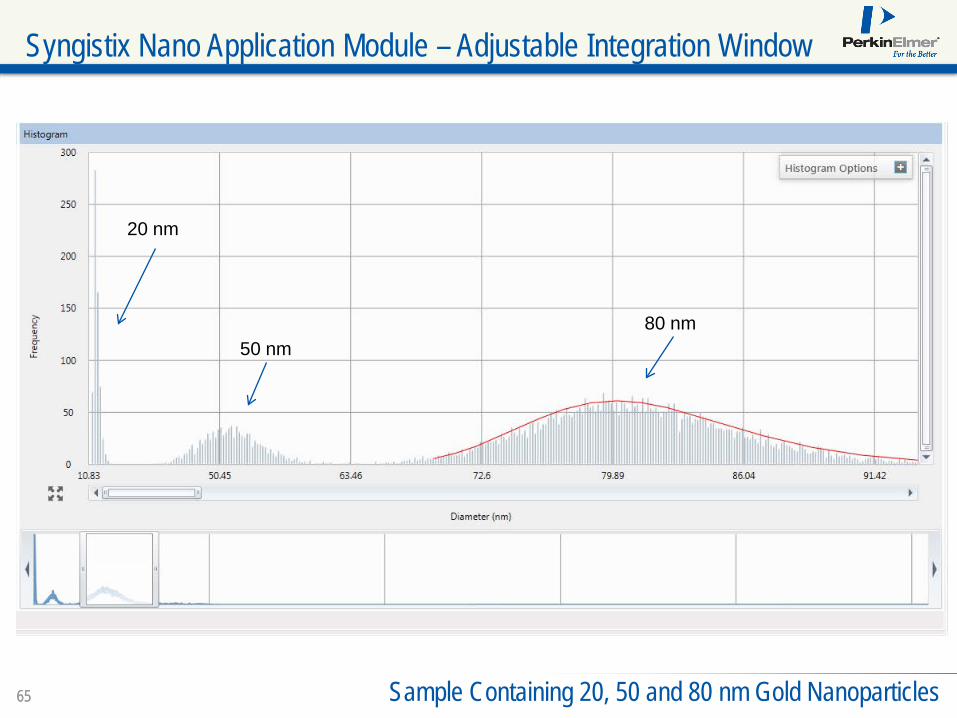
6565 Sample Containing 20, 50 and 80 nm Gold Nanoparticles
20 nm
50 nm 80 nm
Syngistix Nano Application Module – Adjustable Integration Window

6666 Particle Concentration, Size, Size Distribution, Dissolved Concentration
Syngistix Nano Application Module – Results Tab
6767 © 2009 PerkinElmer© 2009 PerkinElmer© 2009 PerkinElmer© 2010 PerkinElmer
Application of SP-ICP-MS in Environmental Studies

6868
Environmental Samples
G. Batley, SETAC Berlin 2012
G. Batley, SETAC Berlin 2012
6969
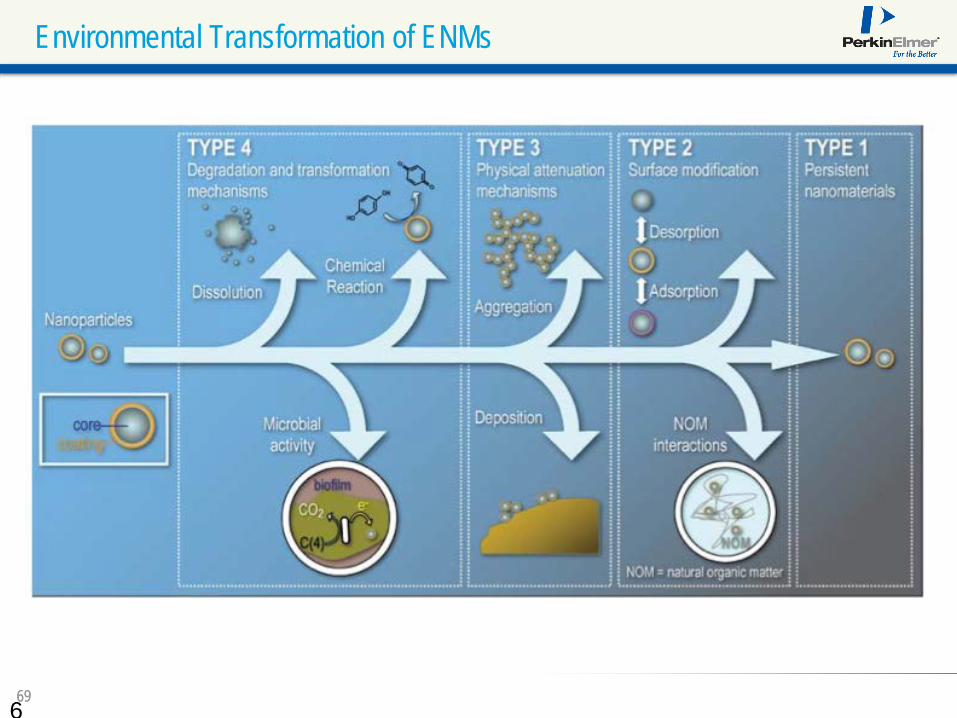
Environmental Transformation of ENMs
6
7070
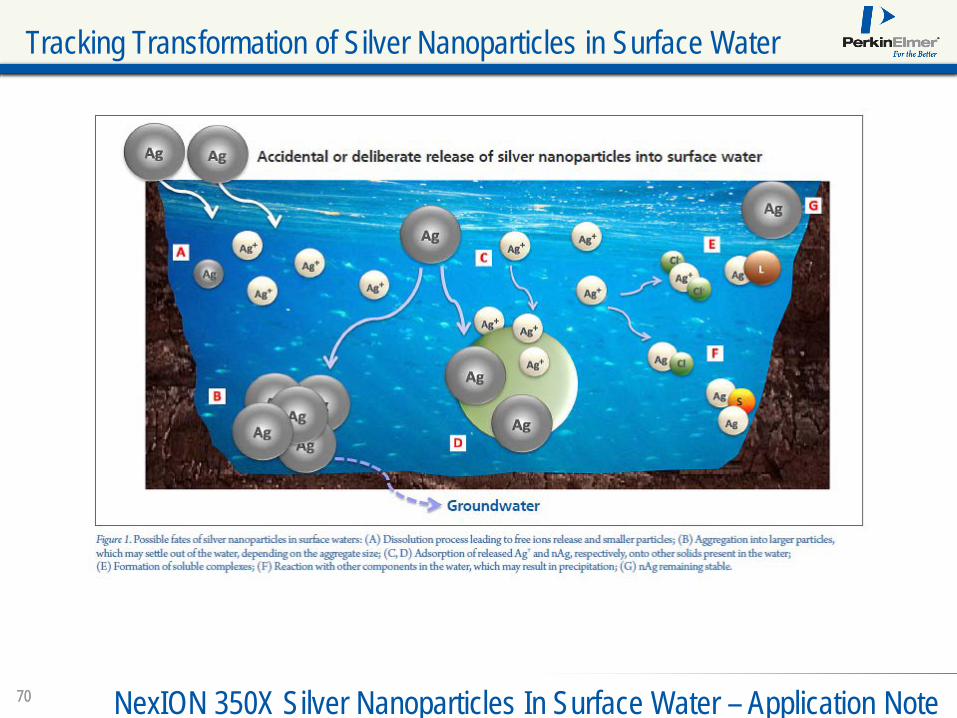
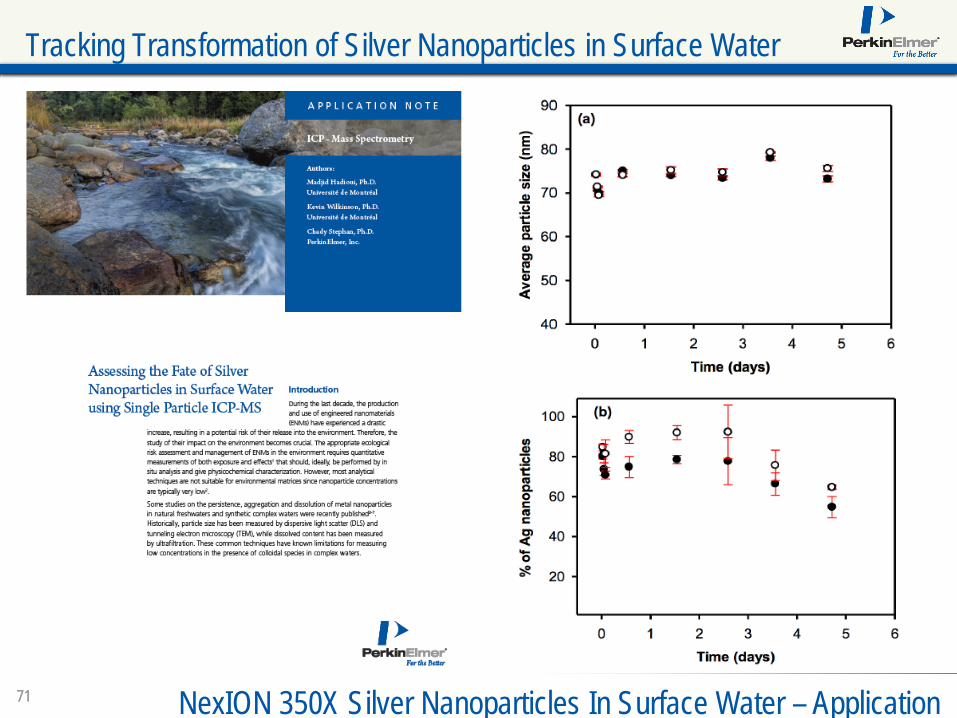
Tracking Transformation of Silver Nanoparticles in Surface Water
NexION 350X Silver Nanoparticles In Surface Water – Application Note
7171
Tracking Transformation of Silver Nanoparticles in Surface Water
NexION 350X Silver Nanoparticles In Surface Water – Application
7272
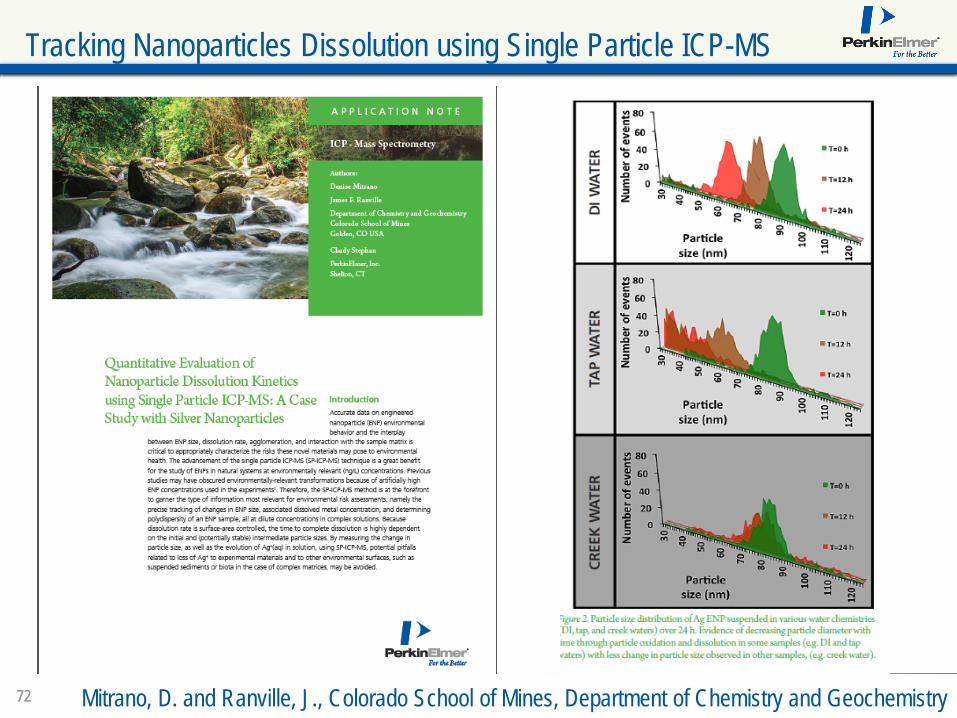
Tracking Nanoparticles Dissolution using Single Particle ICP-MS
Mitrano, D. and Ranville, J., Colorado School of Mines, Department of Chemistry and Geochemistry

7373
L. variegatus was readily digested using the TMAH procedure, allowing for SP-ICP-MS analysis of tissues. The pulses observed in Figure 2A, can clearly be observed above a very low Ag+ background.
Analysis of Nanoparticles in Biological Tissues Using SP-ICP-MS
Bioaccumulation/Bioavailability of Nanoparticles
7474
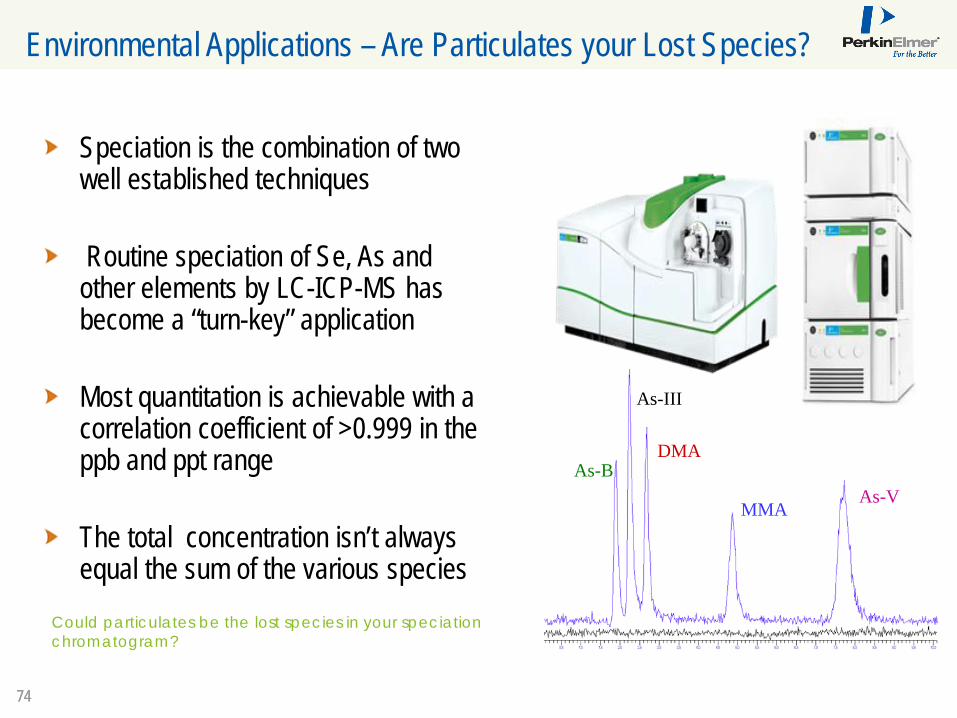
Environmental Applications – Are Particulates your Lost Species?
Speciation is the combination of two well established techniques
Routine speciation of Se, As and other elements by LC-ICP-MS has become a “turn-key” application
Most quantitation is achievable with a correlation coefficient of >0.999 in the ppb and ppt range
The total concentration isn’t always equal the sum of the various species
As-B
As-III
DMA
MMAAs-V
Could particulates be the lost species in your speciation chromatogram?
7575
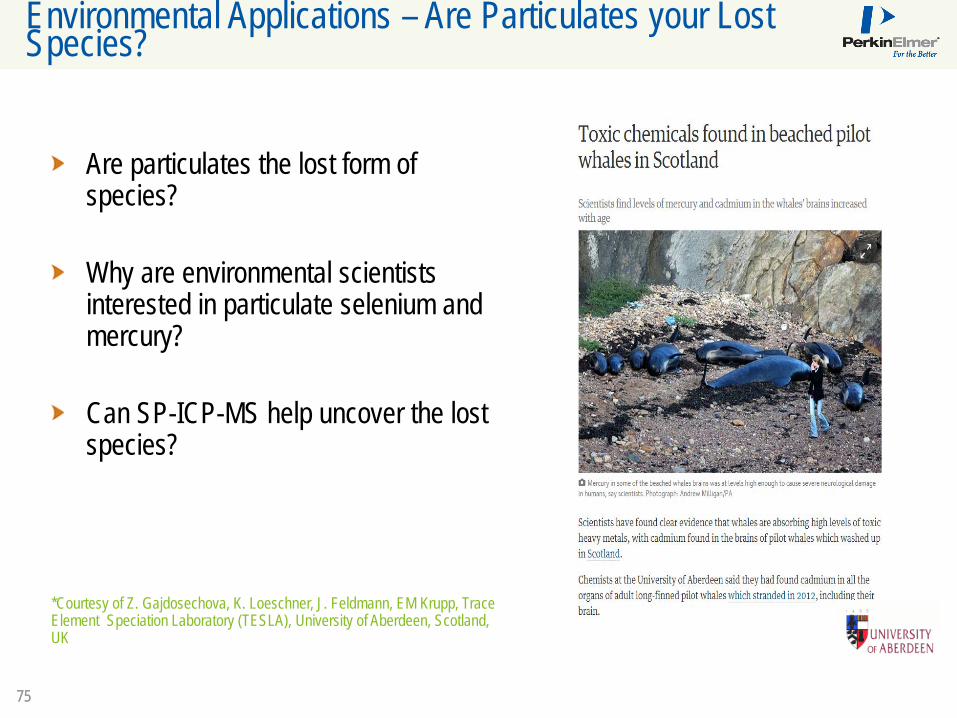
Environmental Applications – Are Particulates your Lost Species?
Are particulates the lost form of species?
Why are environmental scientists interested in particulate selenium and mercury?
Can SP-ICP-MS help uncover the lost species?
*Courtesy of Z. Gajdosechova, K. Loeschner, J. Feldmann, EM Krupp, Trace Element Speciation Laboratory (TESLA), University of Aberdeen, Scotland, UK

7676
Environmental Applications – Are Particulates your Lost Species?
20 mg of dry tissue
Lipids extraction(DCM:MeOH)
1 mg/mL Protease5 mg/mL SDS
Pre-concentration50 kDa centricon
filtersOvernight incubation at 37 ºC
*Courtesy of Z. Gajdosechova, K. Loeschner, J. Feldmann, EM Krupp, Trace Element Speciation Laboratory (TESLA), University of Aberdeen, Scotland, UK
Sam
ple
Prep
SP-IC
P-M
S A
naly
sis
7777
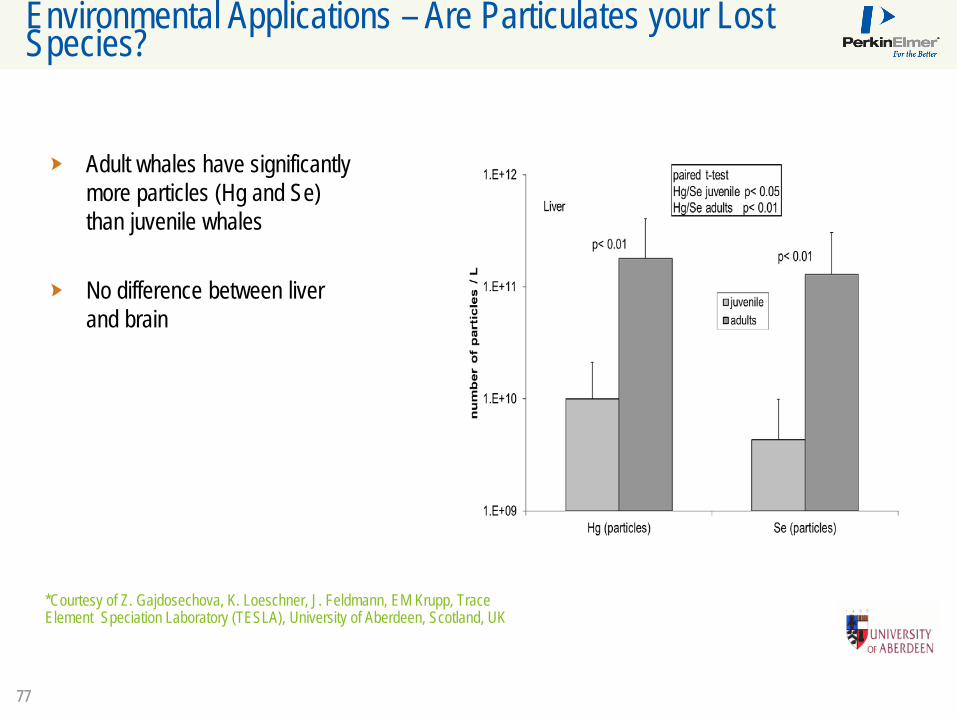
Environmental Applications – Are Particulates your Lost Species?
Adult whales have significantly more particles (Hg and Se) than juvenile whales
No difference between liver and brain
*Courtesy of Z. Gajdosechova, K. Loeschner, J. Feldmann, EM Krupp, Trace Element Speciation Laboratory (TESLA), University of Aberdeen, Scotland, UK
7878
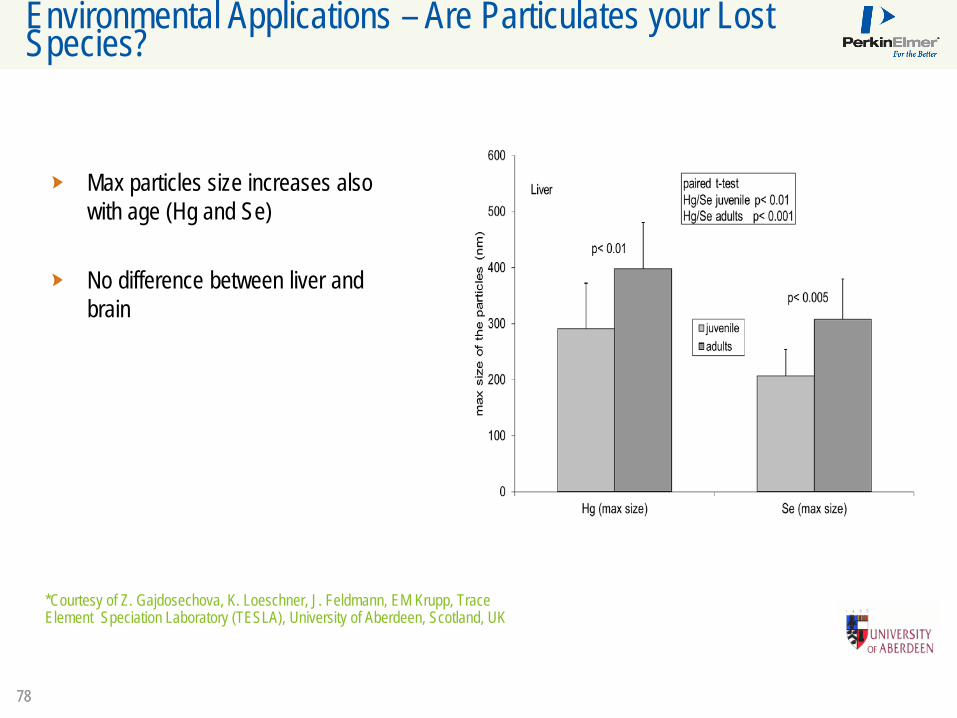
Environmental Applications – Are Particulates your Lost Species?
Max particles size increases also with age (Hg and Se)
No difference between liver and brain
*Courtesy of Z. Gajdosechova, K. Loeschner, J. Feldmann, EM Krupp, Trace Element Speciation Laboratory (TESLA), University of Aberdeen, Scotland, UK
7979
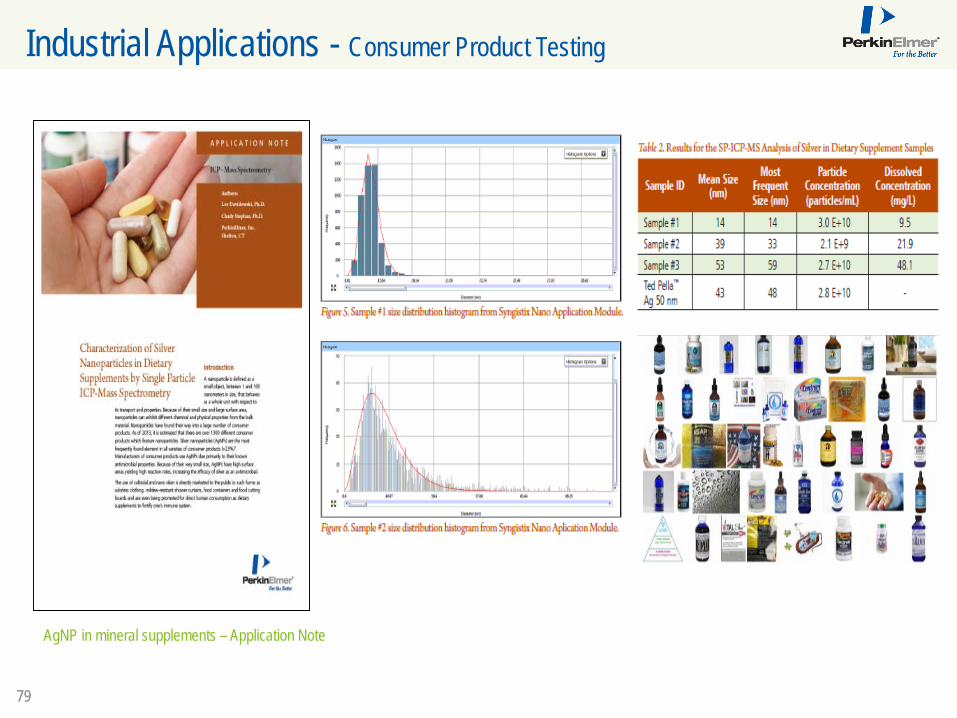
Industrial Applications - Consumer Product Testing
AgNP in mineral supplements – Application Note

8080
Overview of Biological Applications
8181
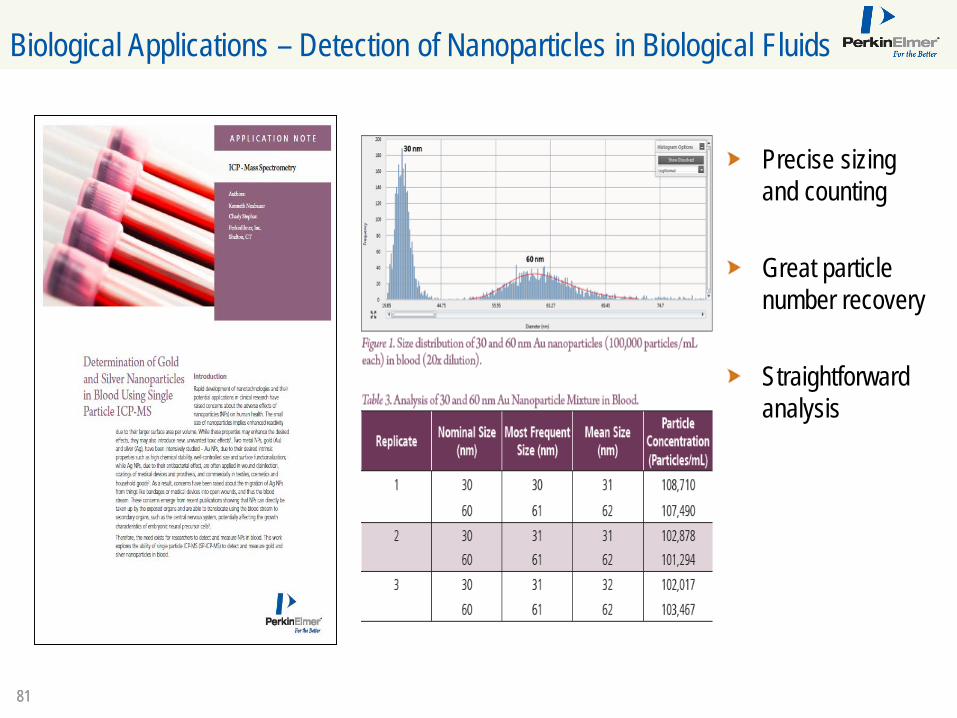
Biological Applications – Detection of Nanoparticles in Biological Fluids
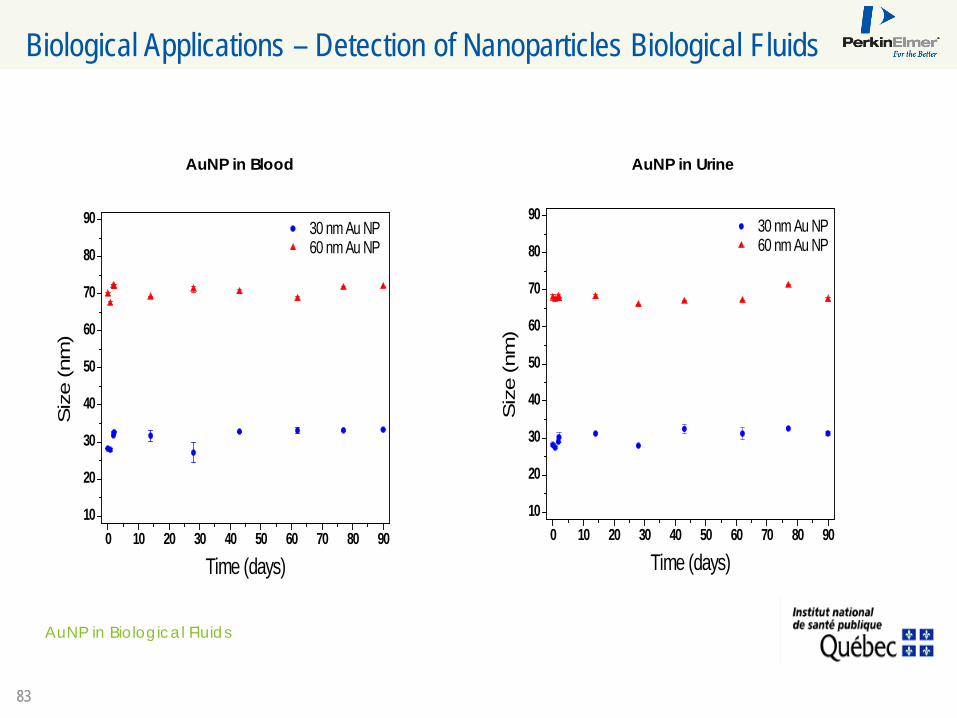
Precise sizing and counting
Great particle number recovery
Straightforward analysis

8282
Biological Applications – Detection of Nanoparticles in Biological Fluids
Blood (1/20 dilution in 0.5% NH4OH + 0.1% Triton)Urine (1/10 dilution in 0.5% NH4OH + 0.1% Triton)
8383
Biological Applications – Detection of Nanoparticles Biological Fluids
AuNP in Biological Fluids
0 10 20 30 40 50 60 70 80 9010
20
30
40
50
60
70
80
90 30 nm Au NP 60 nm Au NP
Siz
e (n
m)
Time (days)
AuNP in Blood
0 10 20 30 40 50 60 70 80 9010
20
30
40
50
60
70
80
90 30 nm Au NP 60 nm Au NP
Siz
e (n
m)
Time (days)
AuNP in Urine

8484
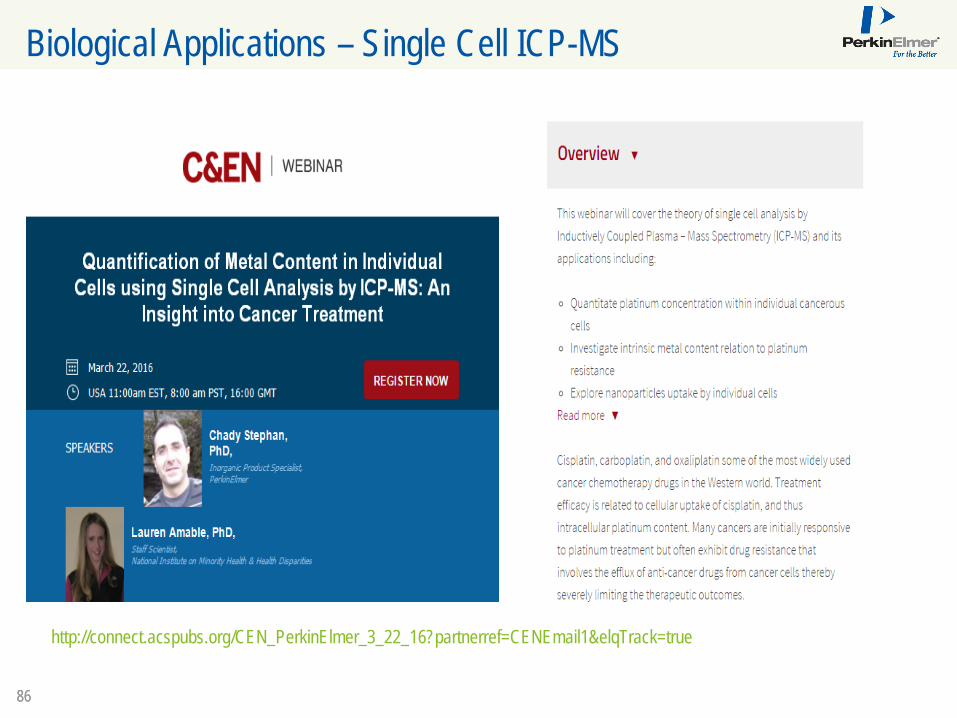
Introduction to the concept of Single Cell ICP-MS
Global Manager, PerkinElmer
Chady Stephan, Ph.D.
8585
... ....... ...
.... ..
..... ........
... ...... ...
... ....... ..
..... ....... ......
..
..........QuadrupoleDetector
Time
Counts at mass 195 (Pt)
Dwell Time
Cell Suspension
Plasma
Pulse
• Element Specific • Intensity of pulse relates to mass content• Number of pulses relates to cell concentration• Baseline = ionic concentration in the Media
ICP-MS Schematic of General Analysis for Nano Metals
8686
Biological Applications – Single Cell ICP-MS
http://connect.acspubs.org/CEN_PerkinElmer_3_22_16?partnerref=CENEmail1&elqTrack=true

8787
Application of Single Cell in Cancer Research
Staff Scientist, National Institute on Minority Health and Health Disparities (NIMHD)
Lauren Amable, Ph.D.
8888
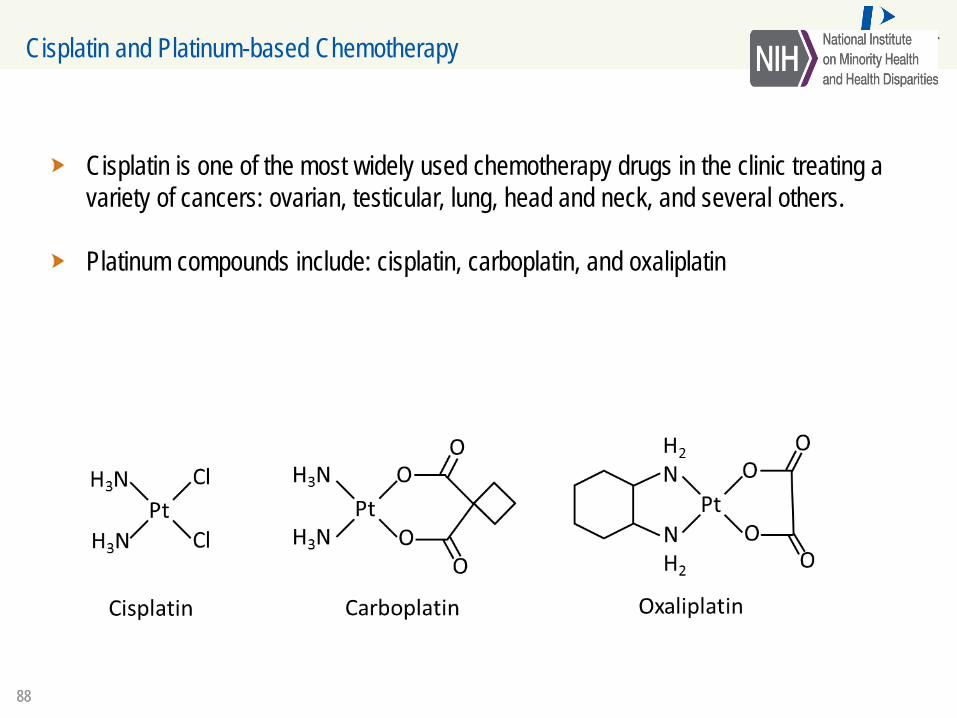
Cisplatin and Platinum-based Chemotherapy
Cisplatin is one of the most widely used chemotherapy drugs in the clinic treating a variety of cancers: ovarian, testicular, lung, head and neck, and several others.
Platinum compounds include: cisplatin, carboplatin, and oxaliplatin
8989
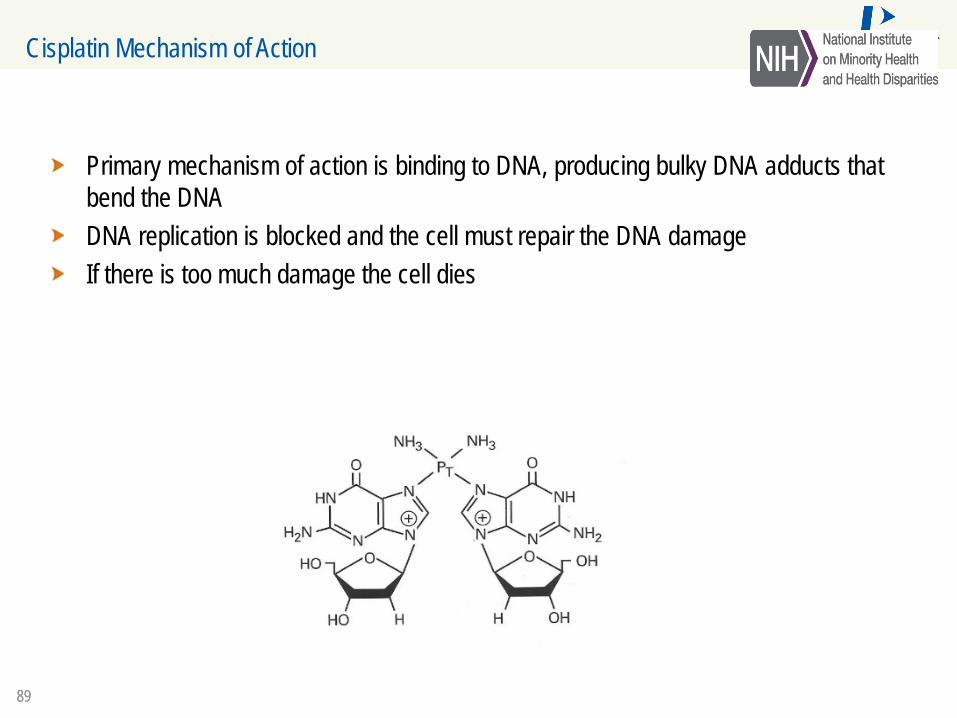
Cisplatin Mechanism of Action
Primary mechanism of action is binding to DNA, producing bulky DNA adducts that bend the DNADNA replication is blocked and the cell must repair the DNA damageIf there is too much damage the cell dies
9090
Patients’ Response to Treatment
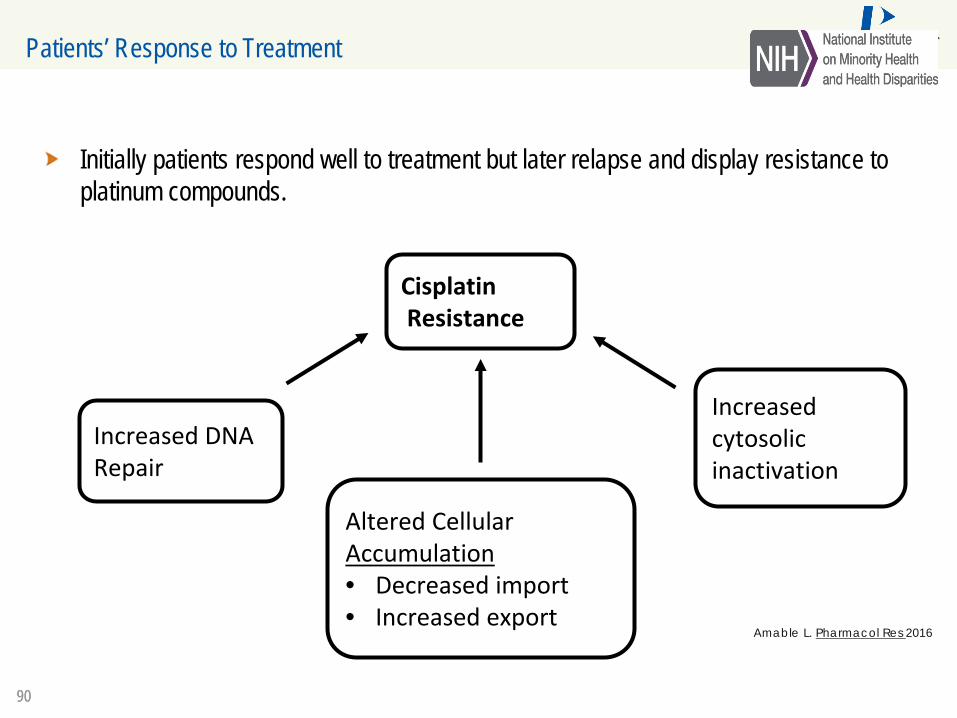
Initially patients respond well to treatment but later relapse and display resistance to platinum compounds.
CisplatinResistance
Increased DNA Repair
Altered Cellular Accumulation• Decreased import• Increased export
Increased cytosolic inactivation
Amable L. Pharmacol Res 2016
9191
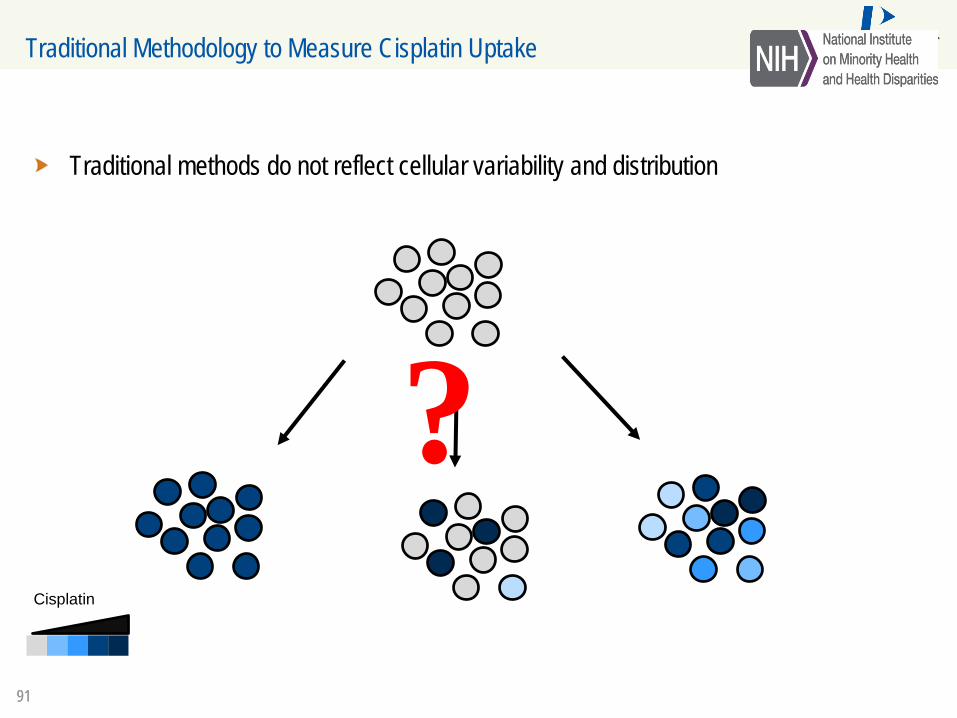
Traditional Methodology to Measure Cisplatin Uptake
Traditional methods do not reflect cellular variability and distribution
Cisplatin
?
9292
Cell Cycle and Serum Starvation
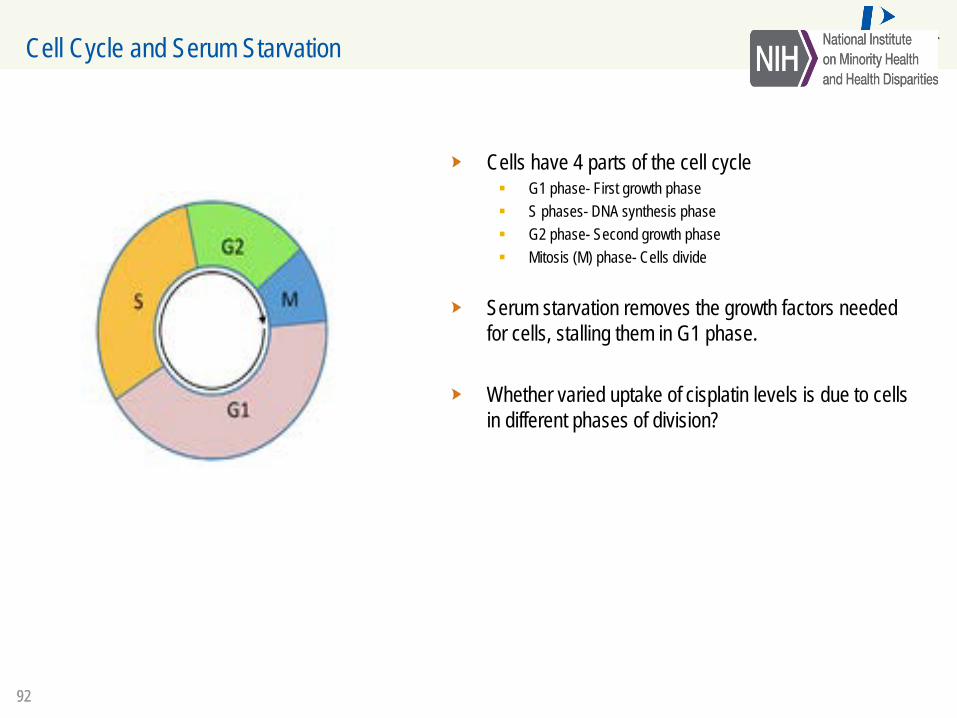
Cells have 4 parts of the cell cycle G1 phase- First growth phase S phases- DNA synthesis phase G2 phase- Second growth phase Mitosis (M) phase- Cells divide
Serum starvation removes the growth factors needed for cells, stalling them in G1 phase.
Whether varied uptake of cisplatin levels is due to cells in different phases of division?
9393
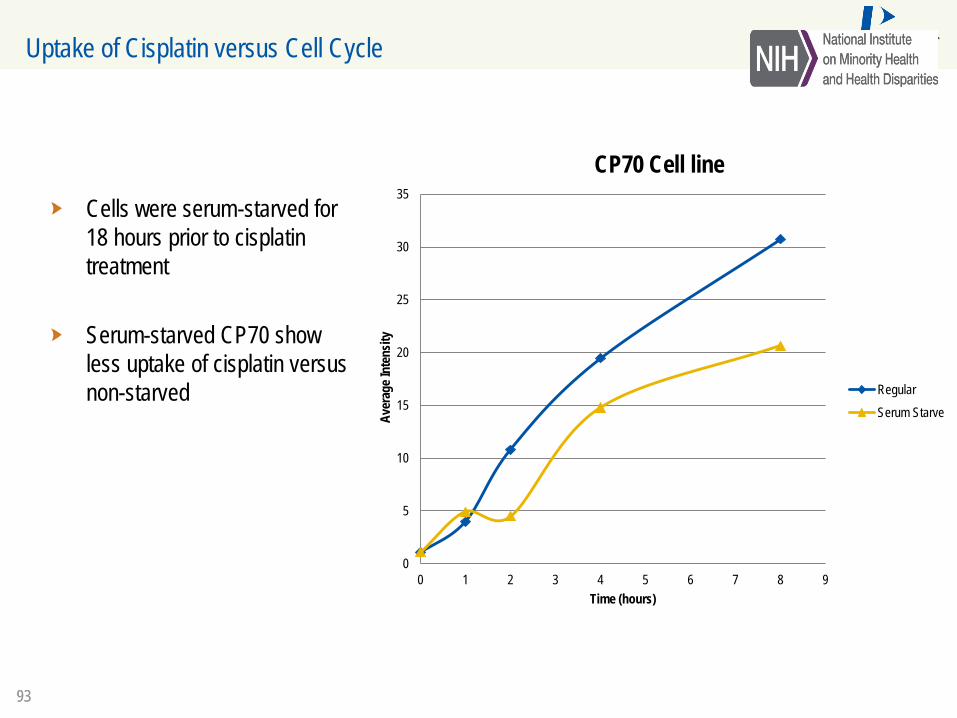
Uptake of Cisplatin versus Cell Cycle
Cells were serum-starved for 18 hours prior to cisplatin treatment
Serum-starved CP70 show less uptake of cisplatin versus non-starved
0
5
10
15
20
25
30
35
0 1 2 3 4 5 6 7 8 9
Aver
age I
nten
sity
Time (hours)
CP70 Cell line
RegularSerum Starve

9494
Nanoparticle Uptake vs Particle Number
0.0000.0020.0040.0060.0080.0100.0120.0140.0160.0180.020
CP70 A2780 CAOV3
Norm
alize
d up
take
rate
Ovarian cell lines
0.5 M1 M
• Uptake rate was measured by exposing the cells to two concentrations of Nanoparticles (0.5 and 1 M particles/mL) for 21 hours.
• CP70 and CAOV3 exhibit a similar Nanoparticle uptake, regardless of concentration, while A2780 show less Nanoparticle uptake
9595
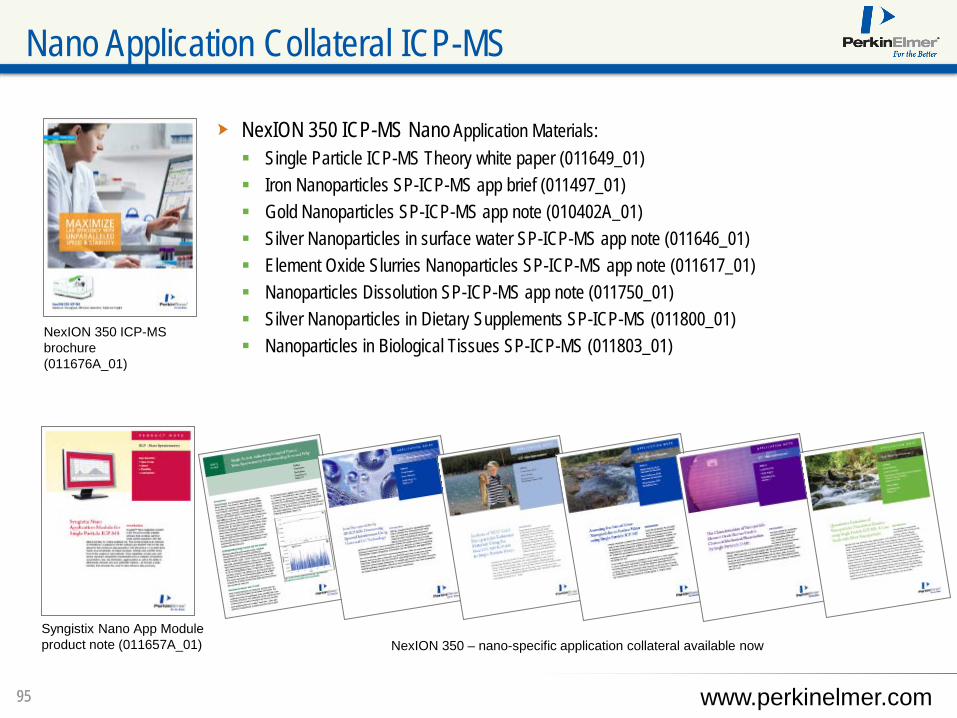
Nano Application Collateral ICP-MS
Syngistix Nano App Module product note (011657A_01)
NexION 350 ICP-MS brochure(011676A_01)
NexION 350 – nano-specific application collateral available now
NexION 350 ICP-MS Nano Application Materials: Single Particle ICP-MS Theory white paper (011649_01) Iron Nanoparticles SP-ICP-MS app brief (011497_01) Gold Nanoparticles SP-ICP-MS app note (010402A_01) Silver Nanoparticles in surface water SP-ICP-MS app note (011646_01) Element Oxide Slurries Nanoparticles SP-ICP-MS app note (011617_01) Nanoparticles Dissolution SP-ICP-MS app note (011750_01) Silver Nanoparticles in Dietary Supplements SP-ICP-MS (011800_01) Nanoparticles in Biological Tissues SP-ICP-MS (011803_01)
www.perkinelmer.com
9696 © 2009 PerkinElmer© 2009 PerkinElmer© 2009 PerkinElmer© 2014 PerkinElmer
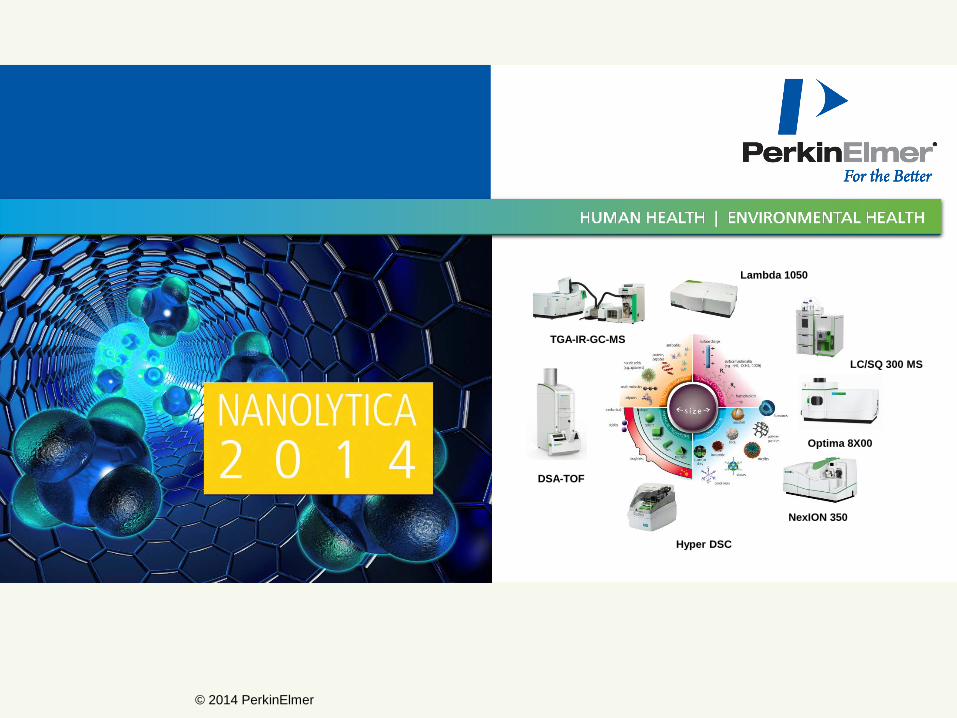
DSA-TOF
Hyper DSC
Lambda 1050
NexION 350
Optima 8X00
LC/SQ 300 MS
TGA-IR-GC-MS

9797
Thank you for your attendance