Induction of Decision Trees. An Example Data Set and Decision Tree yes no yesno sunnyrainy no med...
26
Induction of Decision Trees
-
Upload
claude-benson -
Category
Documents
-
view
221 -
download
1
Transcript of Induction of Decision Trees. An Example Data Set and Decision Tree yes no yesno sunnyrainy no med...
Induction of Decision Trees

An Example Data Set and Decision Tree
yes
no
yes no
sunny rainy
nomed
yes
small big
big
outlook
company
sailboat
# Class
Outlook Company Sailboat Sail?
1 sunny big small yes
2 sunny med small yes
3 sunny med big yes
4 sunny no small yes
5 sunny big big yes
6 rainy no small no
7 rainy med small yes
8 rainy big big yes
9 rainy no big no
10 rainy med big no
Attribute
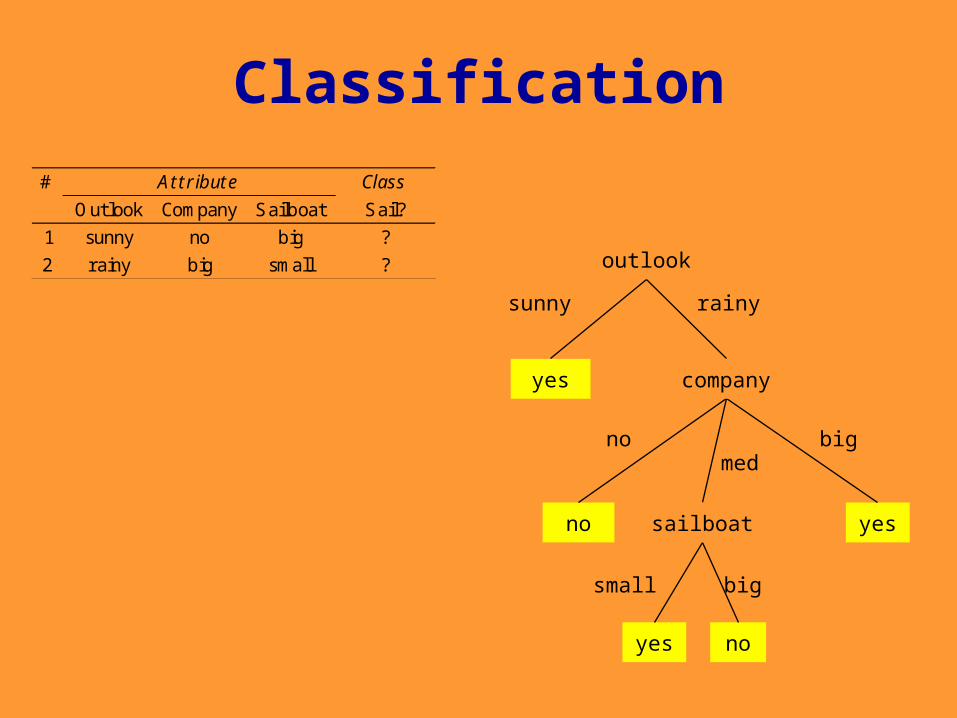
Classification
yes
no
yes no
sunny rainy
nomed
yes
small big
big
outlook
company
sailboat
# Class
Outlook Company Sailboat Sail?
1 sunny no big ?
2 rainy big small ?
Attribute
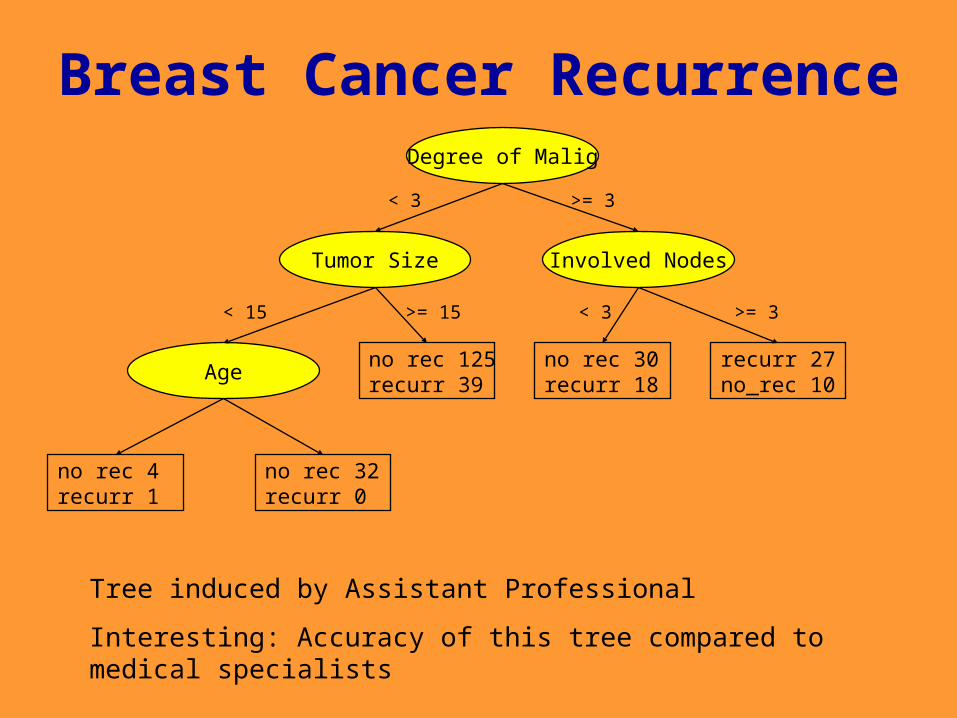
Tree induced by Assistant Professional
Interesting: Accuracy of this tree compared to medical specialists
Breast Cancer Recurrence
no rec 125recurr 39
recurr 27no_rec 10
Tumor Size
no rec 30recurr 18
Degree of Malig
< 3
Involved Nodes
Age
no rec 4recurr 1
no rec 32recurr 0
>= 3
< 15 >= 15 < 3 >= 3

Another Example# Class
Outlook Temperature Humidity Windy Play
1 sunny hot high no N
2 sunny hot high yes N
3 overcast hot high no P
4 rainy moderate high no P
5 rainy cold normal no P
6 rainy cold normal yes N
7 overcast cold normal yes P
8 sunny moderate high no N
9 sunny cold normal no P
10 rainy moderate normal no P
11 sunny moderate normal yes P
12 overcast moderate high yes P
13 overcast hot normal no P
14 rainy moderate high yes N
Attribute

Simple Tree
Outlook
Humidity WindyP
sunnyovercast
rainy
PN
high normal
PN
yes no

Complicated Tree
Temperature
Outlook Windy
cold
moderatehot
P
sunny rainy
N
yes no
P
overcast
Outlook
sunny rainy
P
overcast
Windy
PN
yes no
Windy
NP
yes no
Humidity
P
high normal
Windy
PN
yes no
Humidity
P
high normal
Outlook
N
sunny rainy
P
overcast
null
Attribute Selection Criteria
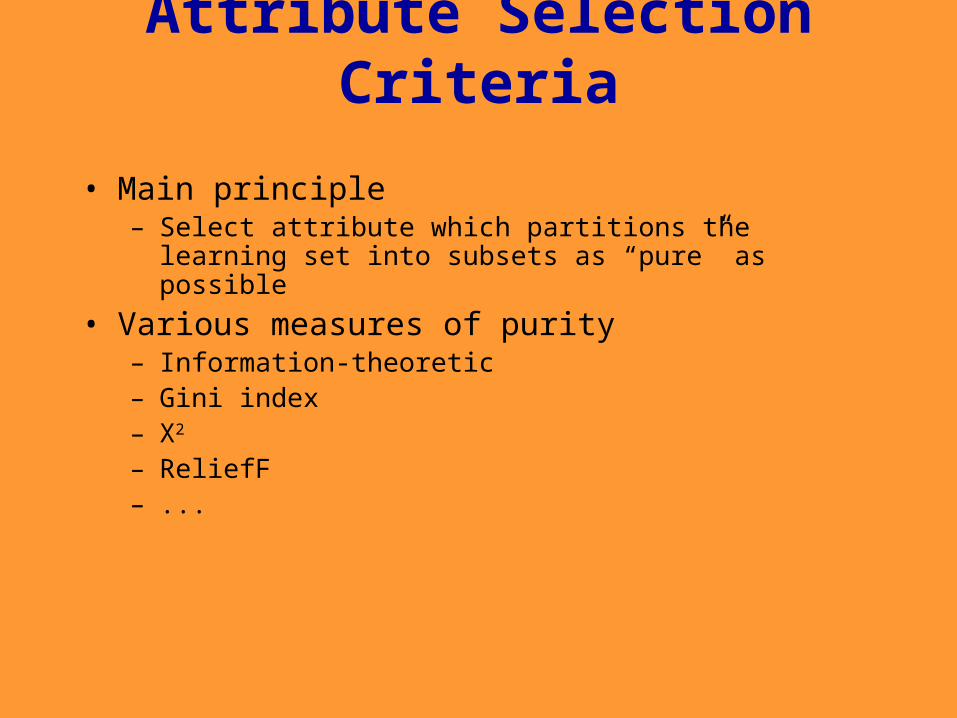
• Main principle– Select attribute which partitions the learning set into
subsets as “pure” as possible
• Various measures of purity– Information-theoretic– Gini index– X2
– ReliefF– ...

Information-Theoretic Approach
• To classify an object, a certain information is needed– I, information
• After we have learned the value of attribute A, we only need some remaining amount of information to classify the object– Ires, residual information
• Gain– Gain(A) = I – Ires(A)
• The most ‘informative’ attribute is the one that minimizes Ires, i.e., maximizes Gain
Entropy
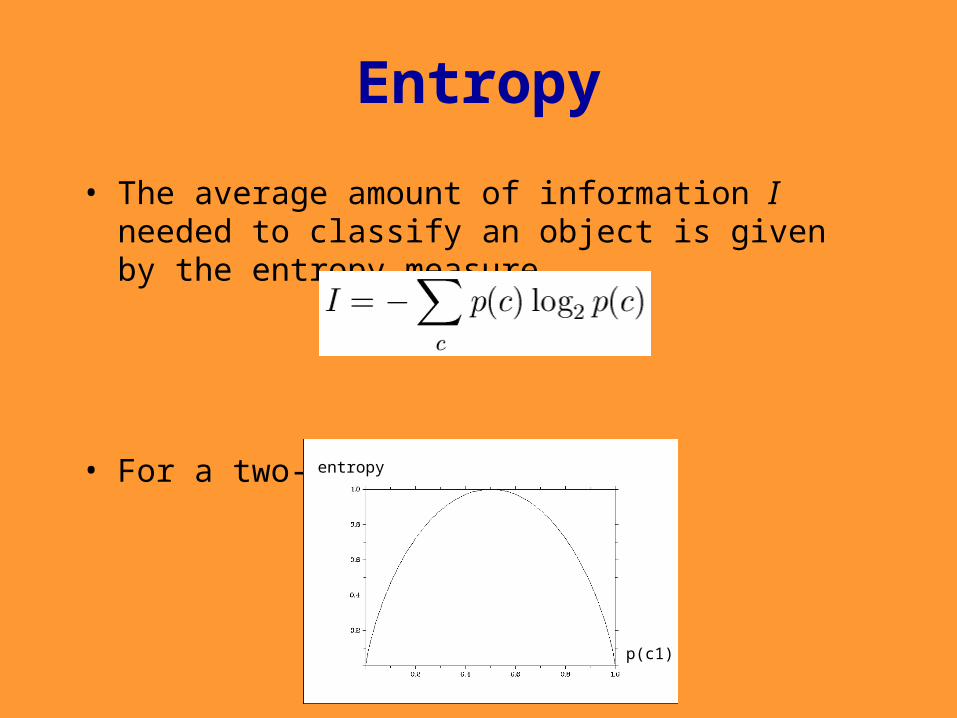
• The average amount of information I needed to classify an object is given by the entropy measure
• For a two-class problem:entropy
p(c1)
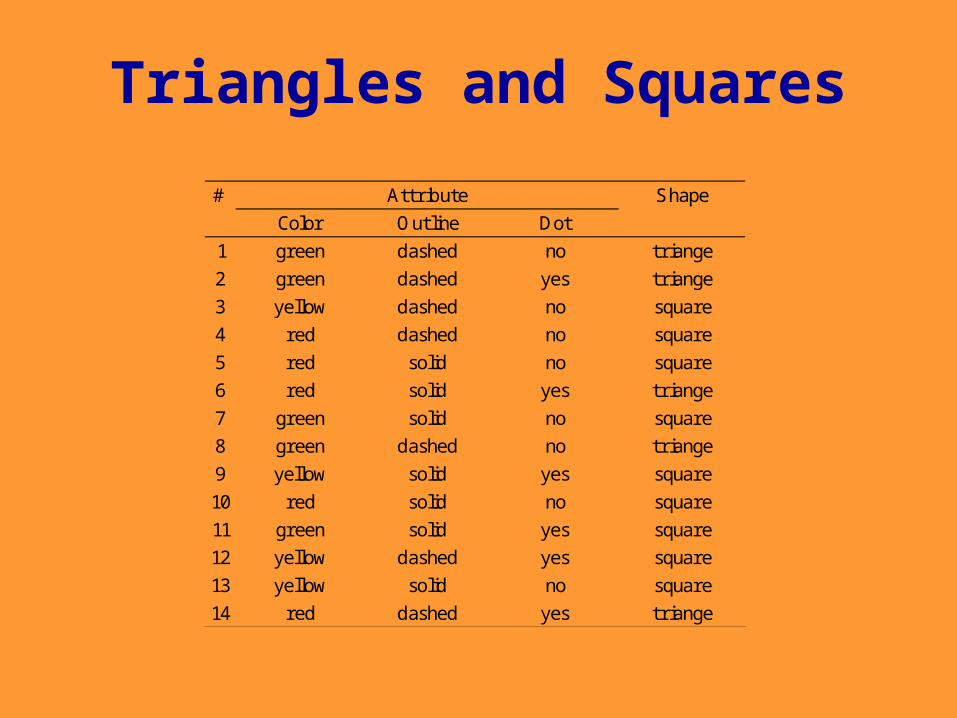
Triangles and Squares
# Shape
Color Outline Dot
1 green dashed no triange
2 green dashed yes triange
3 yellow dashed no square
4 red dashed no square
5 red solid no square
6 red solid yes triange
7 green solid no square
8 green dashed no triange
9 yellow solid yes square
10 red solid no square
11 green solid yes square
12 yellow dashed yes square
13 yellow solid no square
14 red dashed yes triange
Attribute
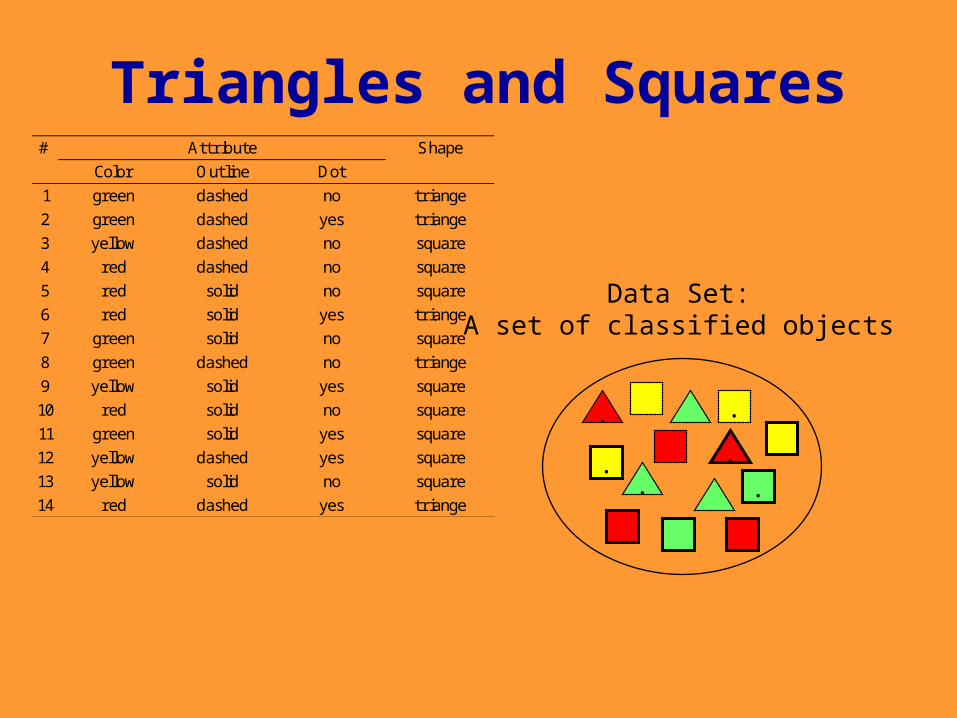
Triangles and Squares
.
.
..
.
.
# Shape
Color Outline Dot
1 green dashed no triange
2 green dashed yes triange
3 yellow dashed no square
4 red dashed no square
5 red solid no square
6 red solid yes triange
7 green solid no square
8 green dashed no triange
9 yellow solid yes square
10 red solid no square
11 green solid yes square
12 yellow dashed yes square
13 yellow solid no square
14 red dashed yes triange
Attribute
Data Set:A set of classified objects

Entropy
• 5 triangles• 9 squares• class probabilities
• entropy
.
.
..
.
.

Entropyreduction
bydata setpartitioni
ng
.
.
..
.
.
..
..
.
.
Color?
red
yellow
green

En
trop
ija v
red
nosti
atr
ibu
ta
..
..
.
.
..
..
.
.
Color?
red
yellow
green

Info
rmati
on
Gain
..
..
.
.
..
..
.
.
Color?
red
yellow
green

Information Gain of The Attribute
• Attributes– Gain(Color) = 0.246– Gain(Outline) = 0.151– Gain(Dot) = 0.048
• Heuristics: attribute with the highest gain is chosen
• This heuristics is local (local minimization of impurity)

.
.
..
.
.
..
..
.
.
Color?
red
yellow
green
Gain(Outline) = 0.971 – 0 = 0.971 bitsGain(Dot) = 0.971 – 0.951 = 0.020
bits

.
.
..
.
.
..
..
.
.
Color?
red
yellow
green
.
.
Outline?
dashed
solid
Gain(Outline) = 0.971 – 0.951 = 0.020 bits
Gain(Dot) = 0.971 – 0 = 0.971 bits

.
.
..
.
.
..
..
.
.
Color?
red
yellow
green
.
.
dashed
solid
Dot?
no
yes
.
.
Outline?
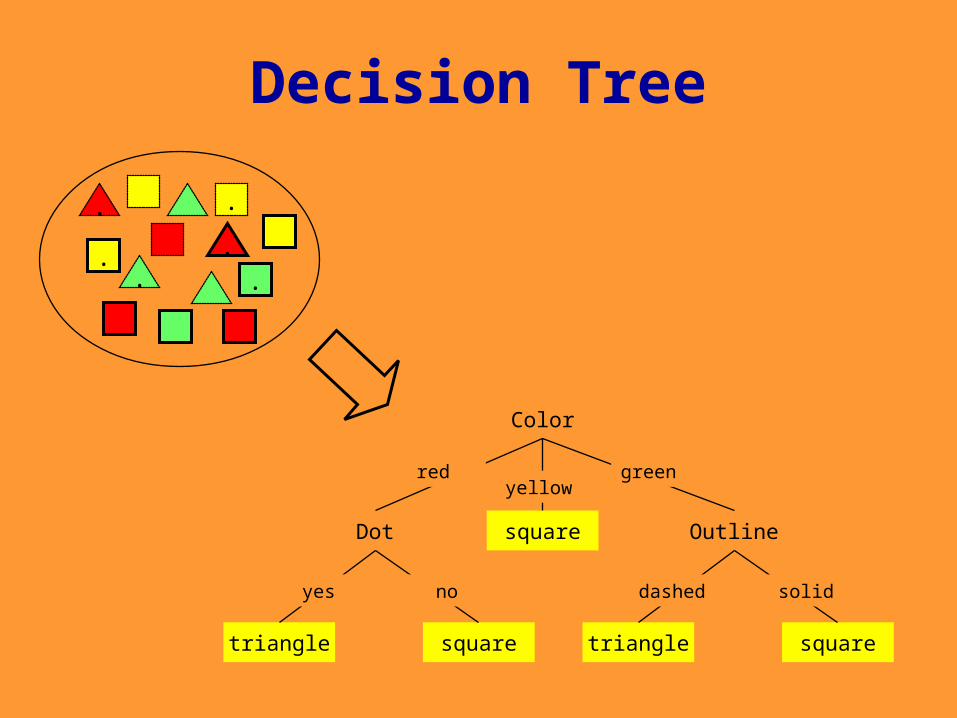
Decision Tree
Color
Dot Outlinesquare
redyellow
green
squaretriangle
yes no
squaretriangle
dashed solid
.
.
..
.
.

Gini Index
• Another sensible measure of impurity(i and j are classes)
• After applying attribute A, the resulting Gini index is
• Gini can be interpreted as expected error rate
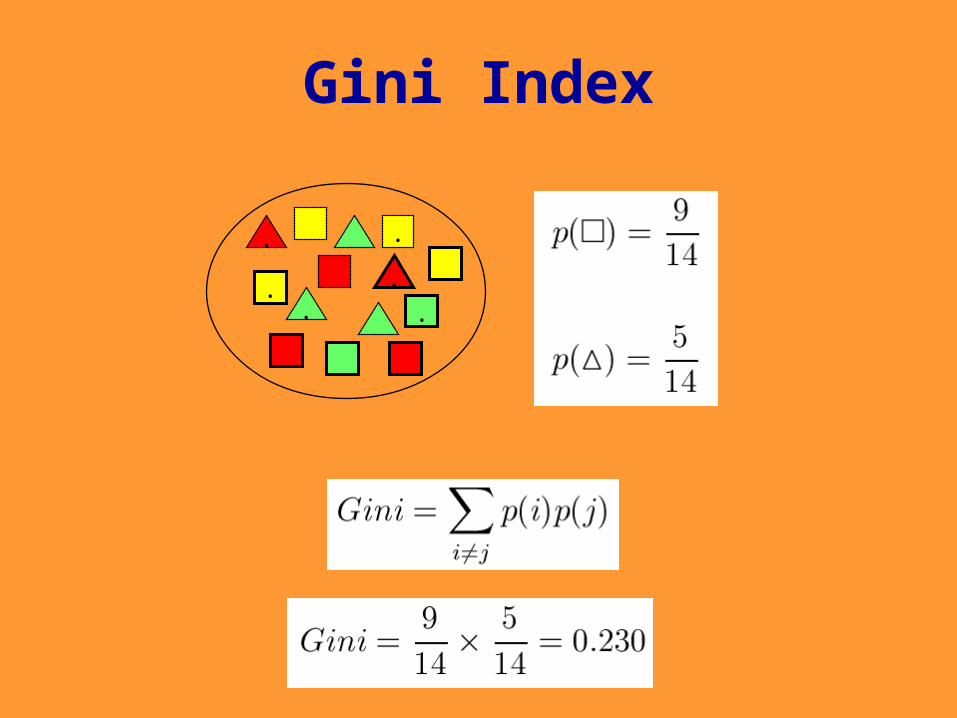
Gini Index
.
.
..
.
.

Gin
i In
dex f
or
Colo
r
..
..
.
.
..
..
.
.
Color?
red
yellow
green
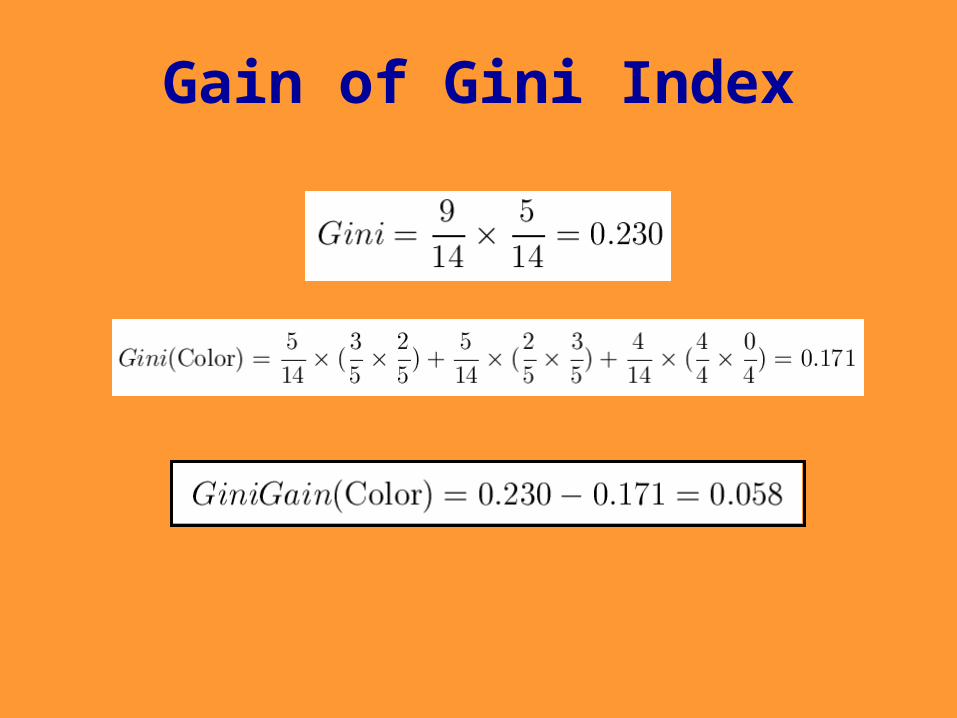
Gain of Gini Index
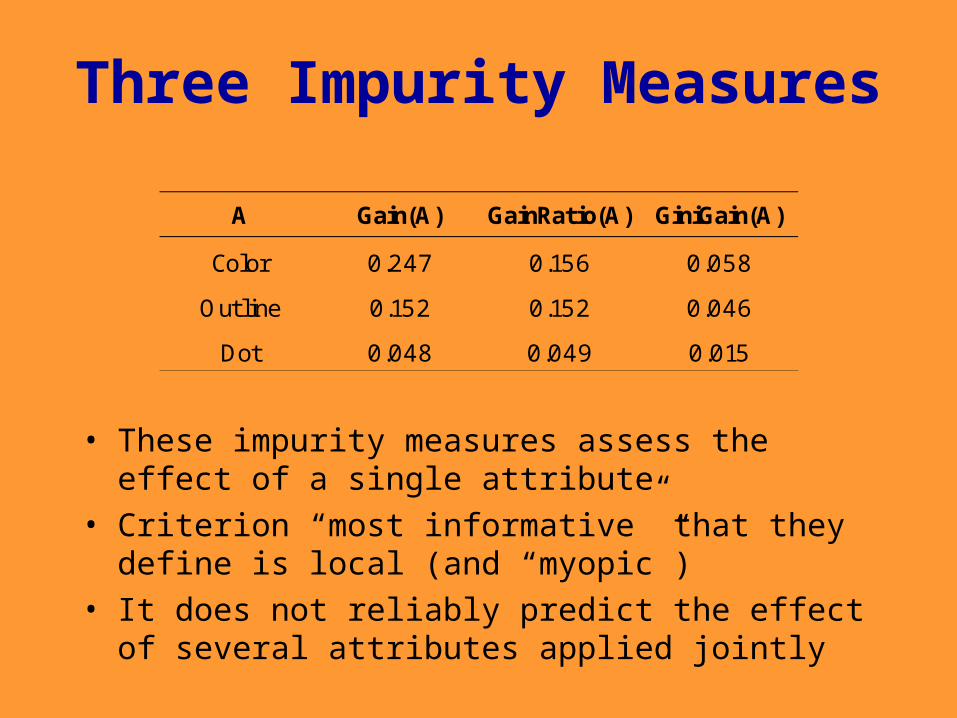
Three Impurity Measures
A Gain(A) GainRatio(A) GiniGain(A)
Color 0.247 0.156 0.058
Outline 0.152 0.152 0.046
Dot 0.048 0.049 0.015
• These impurity measures assess the effect of a single attribute
• Criterion “most informative” that they define is local (and “myopic”)
• It does not reliably predict the effect of several attributes applied jointly