Indoor Exposure Product Testing Protocols – Version · Indoor Exposure Product Testing Protocols...
41
United States EPA Document# 740-S1-5001 Environmental Protection September 2015 Agency Office of Chemical Safety and Pollution Prevention Indoor Exposure Product Testing Protocols Version 1.0 Indoor Exposure Product Testing Protocols – Version 1.0 September September 2015
Transcript of Indoor Exposure Product Testing Protocols – Version · Indoor Exposure Product Testing Protocols...
United States EPA Document# 740-S1-5001 Environmental Protection September 2015 Agency Office of Chemical Safety and
Pollution Prevention
Indoor Exposure Product Testing Protocols
Version 1.0
Indoor Exposure Product Testing Protocols – Version 1.0 September
September 2015
Page 2 of 41
Table of Contents
Introduction .................................................................................................................................................. 4 Exposure Testing Protocol 1: Source Characterization ................................................................................. 6 Exposure Testing Protocol 2: Short-Term Emission Testing ......................................................................... 8 Exposure Testing Protocol 3: Long-Term Emissions from Articles – Partition and Diffusion Coefficients . 15 Exposure Testing Protocol 4: Particulate Matter Formation Due to Mechanical Forces Applied to Product
or Article Surfaces ................................................................................................................... 23 Exposure Testing Protocol 5: Photolysis under Simulated Indoor Lighting Conditions .............................. 27 Exposure Testing Protocol 6: Oral Exposure – Migration Rate and Transfer Efficiency ............................. 32 Exposure Testing Protocol 7: Dermal Exposure – Potential Exposure ........................................................ 37
Tables
Table 1. Commonly used environmental chambers for testing of chemical emissions from products and articlesa ................................................................................................................................................... 8 Table 2. Methods for experimental determination of partition and diffusion coefficients ................. 15
Figures
Figure 1. Conceptual Diagram of source-to-dose continuum for consumer products and articles. ....... 5 Figure 2. Schematic of example 30 m3 full-scale chamber (Liu et al., 2012) ............................................ 9 Figure 3. Schematic diagram of small-scale VOC emission chamber (Yerramilli et al., 2010) ............... 10 Figure 4. Schematic plot of Field and Laboratory Emission Cell (FLEC) (Kim et al., 2007) a) horizontal view; b) schematic view .............................................................................................................................. 10 Figure 5. Photo of micro-chamber/ thermal extractor (µCTE) from Markes International, Llantrisant, UK (Cleanroom Technology, 2011) ............................................................................................................. 10 Figure 6. Schematic plot of the microbalance test system (Cox et al., 2001) ........................................ 17 Figure 7. Schematic plot of the dynamic-static chamber (He et al., 2010) ............................................ 17 Figure 8. Schematic plot of the diffusionmetric method (Bodalal et al., 2000) ..................................... 18 Figure 9 Schematic plot of the dual-chamber method (Xiong et al., 2009) .......................................... 19 Figure 10. Schematic plot of the dual chamber method (Liu et al., 2014) .......................................... 19 Figure 11. Schematic plot of the cup method (Blondeau et al., 2003) ................................................ 20 Figure 12. Schematic of the test facility for particle generation due to abrasion ............................... 23 Figure 13. Graphic example of generic procedure for photolysis without dust .................................. 29 Figure 14. Graphic example of generic procedure for photolysis with dust ....................................... 30 Figure 15. Graphic example of procedure for analyzing migration from product or article surface to saliva ………………………………………………………………………………………………………………………………………34 Figure 16. Graphic example of small-scale procedure for analyzing migration from product or article surface to sweat .......................................................................................................................................... 40

Page 3 of 41
AUTHORS, CONTRIBUTORS and ACKNOWLEDGEMENTS
This report was developed by the United States Environmental Protection Agency (US EPA), Office of Chemical Safety and Pollution Prevention (OCSPP), Office of Pollution Prevention and Toxics (OPPT). Mention of trade names does not constitute endorsement by the EPA. EPA Authors:
Charles Bevington, OPPT/RAD Christina Cinalli, OPPT/RAD (retired) Cathy Fehrenbacher, OPPT/RAD Zhishi Guo, ORD (retired) Acknowledgements The following individuals contributed to portions of this document: Xiaoyu Liu, ORD Treye Thomas, CPSC Kathleen Ernst, NIOSH (retired) This document was developed with support from ICF International under EPA Contract # EP-W-12-010.
Introduction
EPA’s Office of Pollution Prevention and Toxics has developed a set of seven indoor exposure product testing protocols intended to provide information on the purpose of the testing, general description of the sampling and analytical procedures, and references for a base-set of exposure tests that will be used to inform and refine estimates of indoor exposures. The scope of these protocols is limited to testing chemicals in products or articles/building used in indoor environments. These protocols are general in nature and will need to be tailored to the specific type of chemical to be analyzed, the particular product or article which is being evaluated and the data quality objective for the testing.
The protocols are intended to be used in combination to evaluate potential exposures when using products and articles in indoor environments. For example if the testing objective is to evaluate how much of a particular chemical is emitted during a short-term use of a particular product indoors, the source characterization protocol and the short-term emission test protocol would be appropriate. The protocols would be modified to include the appropriate analytical method for the chemical of interest, the appropriate type of chamber, sample preparation, sampling method, sampling volume, etc.
The protocols should be modified using methodologies generally accepted in the relevant scientific community at the time the study is initiated. Before starting to conduct any study that will use a modified version of these protocols, a written test protocol is generally submitted to the Agency for review. During the Agency review of the modified protocol, a review of the data quality objective, the sampling process design (experimental design), sampling and analytical methods, sample handling and custody, quality control procedures and activities (including reference samples, duplicates, replicates, etc.), instruments and equipment to be used in conducting the testing, data review, verification, and validation, as well as reporting requirements. Additional information on the Agency’s Quality Analysis procedures and programs is available (EPA, 2011). The final report shall contain study results and sufficient contextualizing information on testing conditions and analytical approaches to inform study results.
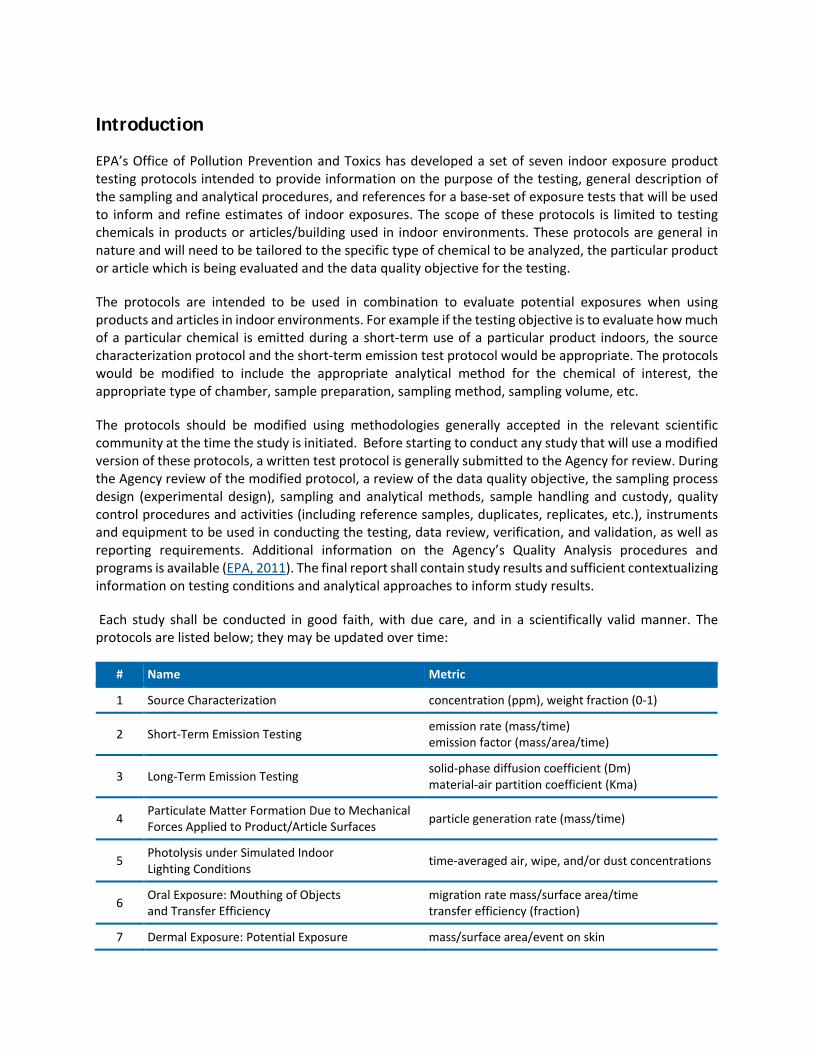
Each study shall be conducted in good faith, with due care, and in a scientifically valid manner. The protocols are listed below; they may be updated over time:
# Name Metric
1 Source Characterization concentration (ppm), weight fraction (0-1)
2 Short-Term Emission Testing emission rate (mass/time) emission factor (mass/area/time)
3 Long-Term Emission Testing solid-phase diffusion coefficient (Dm) material-air partition coefficient (Kma)
4 Particulate Matter Formation Due to Mechanical Forces Applied to Product/Article Surfaces particle generation rate (mass/time)
5 Photolysis under Simulated Indoor Lighting Conditions time-averaged air, wipe, and/or dust concentrations
6 Oral Exposure: Mouthing of Objects and Transfer Efficiency
migration rate mass/surface area/time transfer efficiency (fraction)
7 Dermal Exposure: Potential Exposure mass/surface area/event on skin

Page 5 of 41
Figure 1 provides an illustration of the types of potential exposures associated with the source (product or article in the indoor environment), and how the exposure data produced from applying the test protocols will be used to inform the potential for exposure.
Figure 1. Conceptual Diagram of source-to-dose continuum for consumer products and articles.
Page 6 of 41
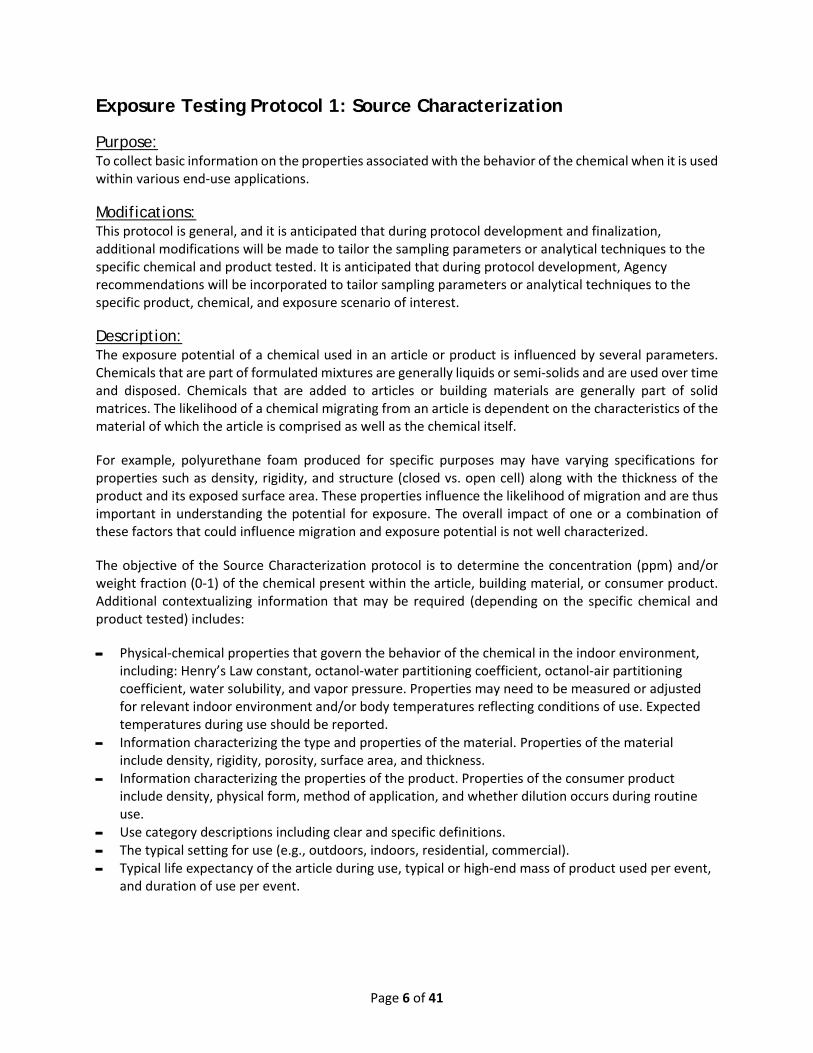
Exposure Testing Protocol 1: Source Characterization
Purpose: To collect basic information on the properties associated with the behavior of the chemical when it is used within various end-use applications.
Modifications: This protocol is general, and it is anticipated that during protocol development and finalization, additional modifications will be made to tailor the sampling parameters or analytical techniques to the specific chemical and product tested. It is anticipated that during protocol development, Agency recommendations will be incorporated to tailor sampling parameters or analytical techniques to the specific product, chemical, and exposure scenario of interest.
Description: The exposure potential of a chemical used in an article or product is influenced by several parameters. Chemicals that are part of formulated mixtures are generally liquids or semi-solids and are used over time and disposed. Chemicals that are added to articles or building materials are generally part of solid matrices. The likelihood of a chemical migrating from an article is dependent on the characteristics of the material of which the article is comprised as well as the chemical itself.
For example, polyurethane foam produced for specific purposes may have varying specifications for properties such as density, rigidity, and structure (closed vs. open cell) along with the thickness of the product and its exposed surface area. These properties influence the likelihood of migration and are thus important in understanding the potential for exposure. The overall impact of one or a combination of these factors that could influence migration and exposure potential is not well characterized.
The objective of the Source Characterization protocol is to determine the concentration (ppm) and/or weight fraction (0-1) of the chemical present within the article, building material, or consumer product. Additional contextualizing information that may be required (depending on the specific chemical and product tested) includes:
- Physical-chemical properties that govern the behavior of the chemical in the indoor environment, including: Henry’s Law constant, octanol-water partitioning coefficient, octanol-air partitioning coefficient, water solubility, and vapor pressure. Properties may need to be measured or adjusted for relevant indoor environment and/or body temperatures reflecting conditions of use. Expected temperatures during use should be reported.
- Information characterizing the type and properties of the material. Properties of the material include density, rigidity, porosity, surface area, and thickness.
- Information characterizing the properties of the product. Properties of the consumer product include density, physical form, method of application, and whether dilution occurs during routine use.
- Use category descriptions including clear and specific definitions. - The typical setting for use (e.g., outdoors, indoors, residential, commercial). - Typical life expectancy of the article during use, typical or high-end mass of product used per event,
and duration of use per event.

Page 7 of 41
Reporting of Results and Records Retention: A final report shall be prepared, and records shall be retained in accordance with 40 CFR 792, Subpart J – Records and Reports.
For example, the following types of key information should be included in the report:
- Sampling and analytical methods ― description or citation, including deviation from standard procedure, if applicable.
- Quality Assurance/Quality Control data: accuracy and precision of measurements
References: Product Properties Test Guidelines OPPTS 830.1550. Product Identity and Composition, available at:
http://www.regulations.gov/#!documentDetail;D=EPA-HQ-OPPT-2009-0151-0003 OPPT Voluntary Use and Exposure Information Project Form, available at:
http://www.epa.gov/oppt/exposure/pubs/ueipform.pdf

Page 8 of 41
Exposure Testing Protocol 2: Short-Term Emission Testing
Purpose: To collect information on emission rates of chemicals from products or articles through chamber testing.
Modifications: This protocol is general, and it is anticipated that during protocol development and finalization, additional modifications will be made to tailor the sampling parameters or analytical techniques to the specific chemical and product tested. It is anticipated that during protocol development, Agency recommendations will be incorporated to tailor sampling parameters or analytical techniques to the specific product, chemical, and exposure scenario of interest.
Description:
Approach Chemical emissions from products and articles are most commonly tested in environmental chambers, which are designed based on the theory of continuous stirred tank reactor (CSTR) in chemical engineering. Thus, many principals of the CSTR are applicable to test chambers, including mixing, residence time, steady state, and the assumption that the chemical concentration in the outlet air is representative of that inside the chamber. A typical chamber system consists of the chamber itself, clean air supply, air flow control, air sampling ports, temperature and humidity sensors and controls, and data acquisition system. An electric fan is often installed in small and large chambers, known as the conventional chambers, to improve air mixing and maintain certain air speed. Typical test conditions are 23°C, 50% relative humidity and 0.1 m/s air speed. The air change rate varies depending on chamber types. Over time, progress has been made to standardize testing for certain kinds of materials in certain kinds of chambers. The major chamber types are summarized in Table 1. More standard methods have been, or are being, developed for testing specific chemicals/materials ― such as California Department of Public Health/Environmental Health Laboratory Branch (CDPH/EHLB) standard method for California Specification 01350 (2010), ASTM D6007, ASTM WK40293, ANSI/BIFMA M7.1 and ANSI/BIFMA x7.1 ― but they are all based on the standards in Table 1.
Table 1. Commonly used environmental chambers for testing of chemical emissions from products and articlesa
Chamber Type
Typical Size
Typical Air Change Rate (h-1)
Commercially Available References
Full-scale chamber 30 m3 1 No ISO 16000-9
ASTM D6670
Small-scale chamber 50 L 1 Yes ISO 16000-9
ASTM D5116
Micro chamber 0.05-0.1 L >100 Yes ISO 12219-3
ASTM D7706
Field and Laboratory Emission Cells 0.035 L >100 Yes ISO 16000-10
ASTM D7143 aMid-scale chambers, typically 1 to 10 m3 in size, are also available but less commonly used.
Page 9 of 41
Selection of Test Chambers Selecting a chamber suitable for testing a given chemical in a given product or article depends on several factors, including the properties of the chemical of interest and those of the substrate. A general guideline is provided below.
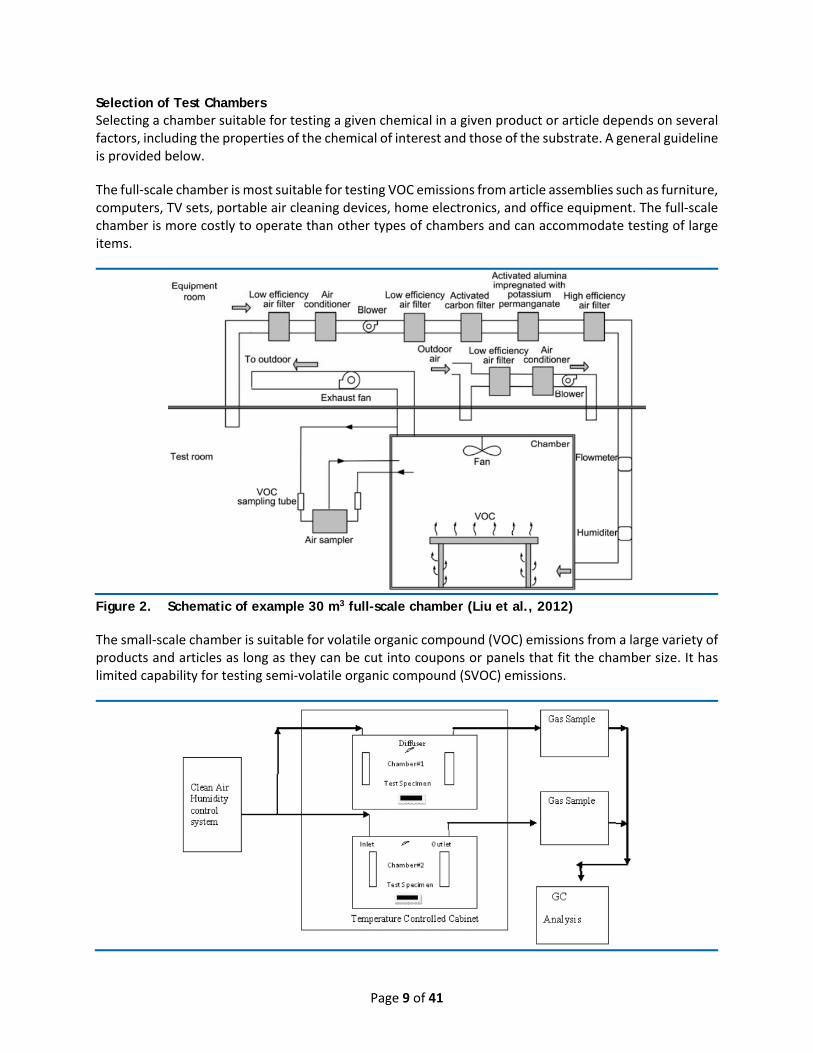
The full-scale chamber is most suitable for testing VOC emissions from article assemblies such as furniture, computers, TV sets, portable air cleaning devices, home electronics, and office equipment. The full-scale chamber is more costly to operate than other types of chambers and can accommodate testing of large items.
Figure 2. Schematic of example 30 m3 full-scale chamber (Liu et al., 2012)
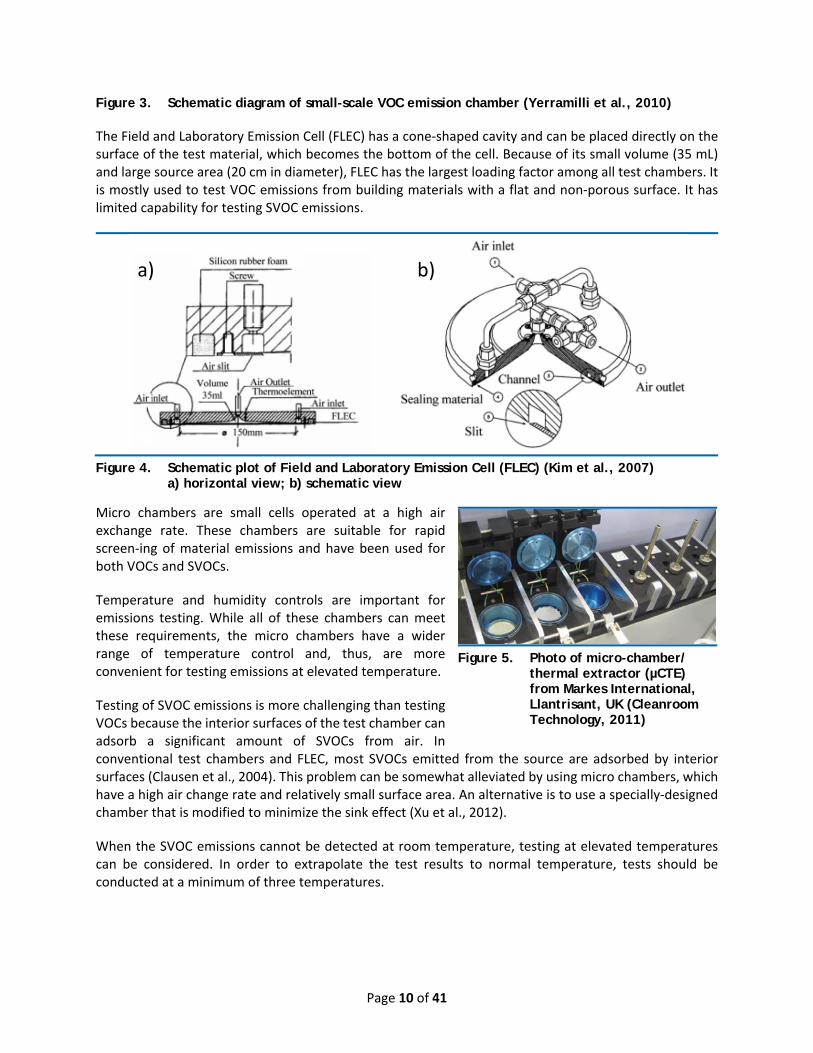
The small-scale chamber is suitable for volatile organic compound (VOC) emissions from a large variety of products and articles as long as they can be cut into coupons or panels that fit the chamber size. It has limited capability for testing semi-volatile organic compound (SVOC) emissions.
Page 10 of 41
Figure 3. Schematic diagram of small-scale VOC emission chamber (Yerramilli et al., 2010)
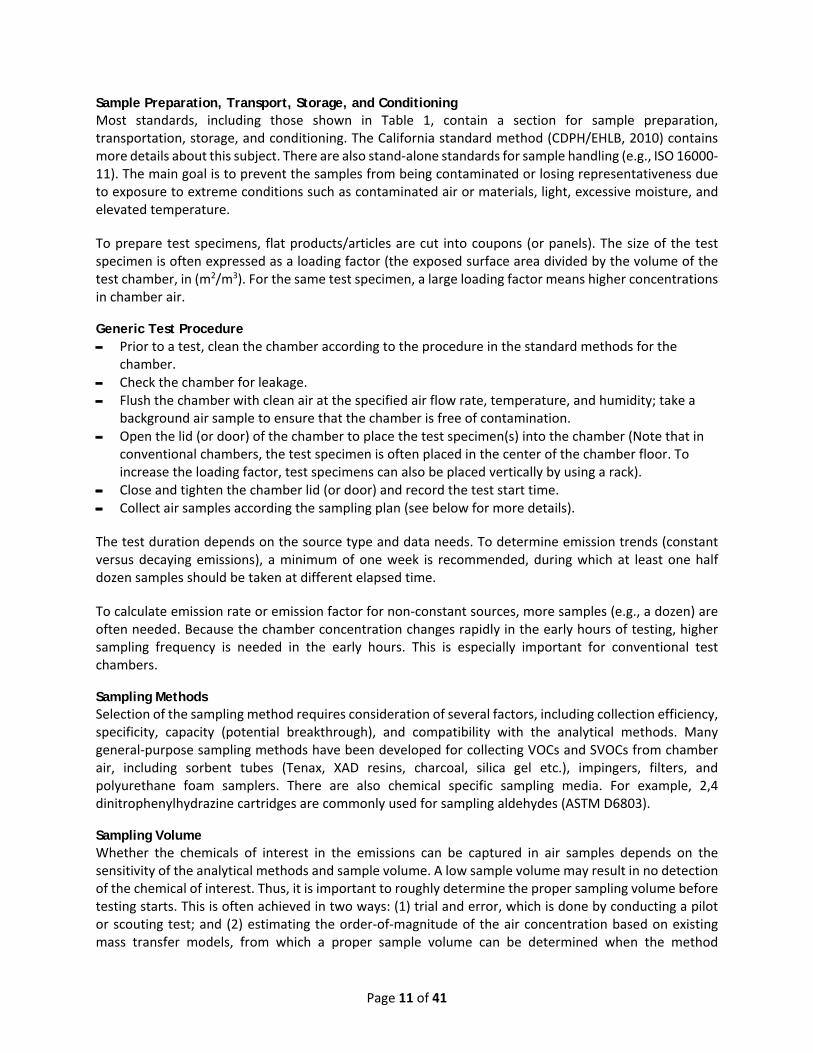
The Field and Laboratory Emission Cell (FLEC) has a cone-shaped cavity and can be placed directly on the surface of the test material, which becomes the bottom of the cell. Because of its small volume (35 mL) and large source area (20 cm in diameter), FLEC has the largest loading factor among all test chambers. It is mostly used to test VOC emissions from building materials with a flat and non-porous surface. It has limited capability for testing SVOC emissions.
Figure 4. Schematic plot of Field and Laboratory Emission Cell (FLEC) (Kim et al., 2007)
a) horizontal view; b) schematic view
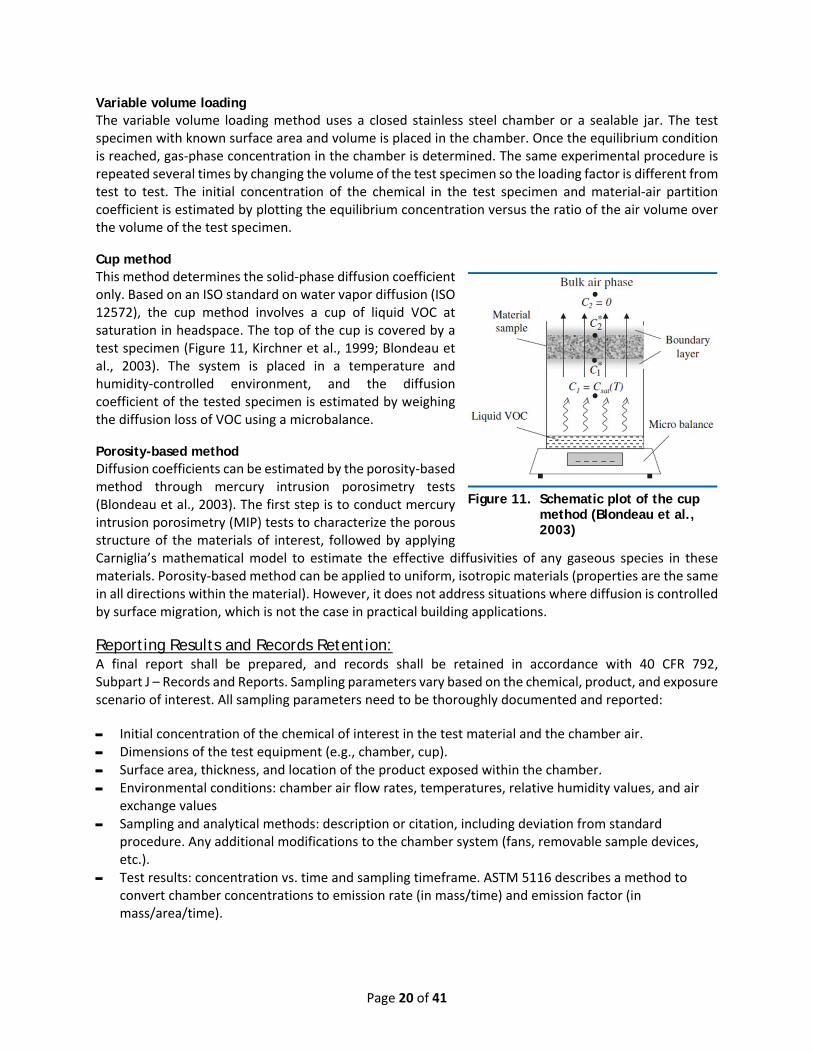
Micro chambers are small cells operated at a high air exchange rate. These chambers are suitable for rapid screen-ing of material emissions and have been used for both VOCs and SVOCs.
Temperature and humidity controls are important for emissions testing. While all of these chambers can meet these requirements, the micro chambers have a wider range of temperature control and, thus, are more convenient for testing emissions at elevated temperature.
Testing of SVOC emissions is more challenging than testing VOCs because the interior surfaces of the test chamber can adsorb a significant amount of SVOCs from air. In conventional test chambers and FLEC, most SVOCs emitted from the source are adsorbed by interior surfaces (Clausen et al., 2004). This problem can be somewhat alleviated by using micro chambers, which have a high air change rate and relatively small surface area. An alternative is to use a specially-designed chamber that is modified to minimize the sink effect (Xu et al., 2012).
When the SVOC emissions cannot be detected at room temperature, testing at elevated temperatures can be considered. In order to extrapolate the test results to normal temperature, tests should be conducted at a minimum of three temperatures.
a) b)
Figure 5. Photo of micro-chamber/
thermal extractor (µCTE) from Markes International, Llantrisant, UK (Cleanroom Technology, 2011)
Page 11 of 41
Sample Preparation, Transport, Storage, and Conditioning Most standards, including those shown in Table 1, contain a section for sample preparation, transportation, storage, and conditioning. The California standard method (CDPH/EHLB, 2010) contains more details about this subject. There are also stand-alone standards for sample handling (e.g., ISO 16000-11). The main goal is to prevent the samples from being contaminated or losing representativeness due to exposure to extreme conditions such as contaminated air or materials, light, excessive moisture, and elevated temperature.
To prepare test specimens, flat products/articles are cut into coupons (or panels). The size of the test specimen is often expressed as a loading factor (the exposed surface area divided by the volume of the test chamber, in (m2/m3). For the same test specimen, a large loading factor means higher concentrations in chamber air.
Generic Test Procedure - Prior to a test, clean the chamber according to the procedure in the standard methods for the
chamber. - Check the chamber for leakage. - Flush the chamber with clean air at the specified air flow rate, temperature, and humidity; take a
background air sample to ensure that the chamber is free of contamination. - Open the lid (or door) of the chamber to place the test specimen(s) into the chamber (Note that in
conventional chambers, the test specimen is often placed in the center of the chamber floor. To increase the loading factor, test specimens can also be placed vertically by using a rack).
- Close and tighten the chamber lid (or door) and record the test start time. - Collect air samples according the sampling plan (see below for more details).
The test duration depends on the source type and data needs. To determine emission trends (constant versus decaying emissions), a minimum of one week is recommended, during which at least one half dozen samples should be taken at different elapsed time.
To calculate emission rate or emission factor for non-constant sources, more samples (e.g., a dozen) are often needed. Because the chamber concentration changes rapidly in the early hours of testing, higher sampling frequency is needed in the early hours. This is especially important for conventional test chambers.
Sampling Methods Selection of the sampling method requires consideration of several factors, including collection efficiency, specificity, capacity (potential breakthrough), and compatibility with the analytical methods. Many general-purpose sampling methods have been developed for collecting VOCs and SVOCs from chamber air, including sorbent tubes (Tenax, XAD resins, charcoal, silica gel etc.), impingers, filters, and polyurethane foam samplers. There are also chemical specific sampling media. For example, 2,4 dinitrophenylhydrazine cartridges are commonly used for sampling aldehydes (ASTM D6803).
Sampling Volume Whether the chemicals of interest in the emissions can be captured in air samples depends on the sensitivity of the analytical methods and sample volume. A low sample volume may result in no detection of the chemical of interest. Thus, it is important to roughly determine the proper sampling volume before testing starts. This is often achieved in two ways: (1) trial and error, which is done by conducting a pilot or scouting test; and (2) estimating the order-of-magnitude of the air concentration based on existing mass transfer models, from which a proper sample volume can be determined when the method

Page 12 of 41
quantification limit is known. This method requires knowledge of mass transfer source models and parameter estimation methods, however.
Sample Analysis Many standard methods can be used to analyze the air samples collected from chamber testing (e.g., EPA Methods TO-01, TO-17, 3545A and 8270D; ASTM D 7339 and D 5197; ISO 16000-3 and ISO 16000-6). Gas chromatography (GC) with different detectors (e.g., flame ionization, electron capture, and mass spectrometry detectors) are most commonly used for VOC and SVOC analysis. High performance liquid chromatography (HPLC) is often used for aldehydes and some SVOCs. Commonly used detectors include UV, fluorescence, and tandem mass spectrometry.
Reporting Results and Records Retention: A final report shall be prepared, and records shall be retained in accordance with 40 CFR 792, Subpart J – Records and Reports.
The standard test methods mentioned above contain sections for reporting, which may aid in preparing the report of results. For example, the following key information should be included in the report:
- Test article: article name, manufacture and/or purchase date, origin, intended use, uniformity (homogeneous, layered, spray application, coating, etc.), dimensions of test specimens, density, exposed area, treatment of sample edges (sealed or exposed) and information about sample creation, transport, and storage.
- Target chemical(s) and their basic properties: CAS number, molecular formula, vapor pressure, chemical reactivity, content/percent within the material, etc.
- Test chamber: chamber type, volume, loading, dimensions, and interior surface material (e.g., polished stainless steel, PTFE-coated stainless steel, Silicosteel-coated stainless steel, and glass).
- Test procedure: description or citation, including deviation from standard procedure. - Sampling and analytical methods: description or citation, including deviation from standard
procedure. Description of accuracy and precision. - Environmental conditions: chamber air flow rates, temperatures, relative humidity values, and air
exchange rates expressed in arithmetic mean and standard deviation. - Test results: concentration vs. time. ASTM 5116 describes a method to convert chamber
concentrations to emission rate (in mass/time) and emission factor (in mass/area/time). - QA/QC data: accuracy and precision of measurements, calibrations, daily calibration checks,
background samples, blank samples.
References: ANSI/BIFMA M7.1-2011: Standard Test Method for determining VOC Emissions from Office Furniture
Systems, Components and Seating, available at: https://www.bifma.org/store/ViewProduct.aspx?id=1375383
ANSI/BIFMA X7.1-2011 Standard for Formaldehyde and TVOC Emissions of Low-emitting Office Furniture and Seating, available at https://www.bifma.org/store/ViewProduct.aspx?id=1375803
ASTM D5116-10 Standard Guide for Small-Scale Environmental Chamber Determinations of Organic Emissions from Indoor Materials/Products, available at http://compass.astm.org/EDIT/html_annot.cgi?D5116+10
ASTM D6007-14 Standard Test Method for Determining Formaldehyde Concentrations in Air from Wood Products Using a Small-Scale Chamber, available at http://www.astm.org/Standards/D6007.htm

Page 13 of 41
ASTM 6670-01 (2007) Standard Practice for Full-Scale Chamber Determination of Volatile Organic Emissions from Indoor Materials/Products, available at http://www.astm.org/Standards/D6670.htm
ASTM D6803-13 Standard Practice for Testing and Sampling of Volatile Organic Compounds (Including Carbonyl Compounds) Emitted from Paint Using Small Environmental Chambers, available at http://www.astm.org/Standards/D6803.htm
ASTM D7143 - 11 Standard Practice for Emission Cells for the Determination of Volatile Organic Emissions from Indoor Materials/Products, available at http://www.astm.org/Standards/D7143.htm
ASTM D7706-11 Standard Practice for Rapid Screening of VOC Emissions from Products Using Micro-Scale Chambers, available at http://www.astm.org/Standards/D7706.htm
ASTM E1333-10 Standard Method for Determining Formaldehyde Concentrations in Air and Emission Rates from Wood Products Using a Large Chamber, available at http://www.astm.org/search/fullsite-search.html?query=E1333&
ASTM WK40293 New test method for estimating chemical emissions from spray polyurethane foam (SPF) insulation using micro-scale environmental test chambers, available at http://www.astm.org/DATABASE.CART/WORKITEMS/WK40293.htm
CDPH/EHLB (2010). Standard Method V1.1, Standard method for the testing and evaluation of volatile organic chemical emissions from indoor sources using environmental chambers, Version 1.1., available at https://www.scsglobalservices.com/files/standards/CDPH_EHLB_StandardMethod_V1_1_2010.pdf
Clausen, P., Hansen, V., Gunnarsen, L., Afshari, A., Wolkoff, P. (2004). Emission of di-2-ethylhexyl phthalate from PVC flooring into air and uptake in dust: emission and sorption experiments in FLEC and CLIMPAQ. Environmental Science & Technologies, 38, 2531-2537.
Cleanroom Technology (2011). VOC emissions test method, available at http://www.cleanroomtechnology.com/ technical/article_page/VOC_emissions_testULmethod/58849
EPA Method 8260B Volatile Organic Compounds by Gas Chromatography/Mass Spectrometry (GC/MS) EPA Method 8270D: Semi volatile Organic Compounds by Gas Chromatography/Mass Spectrometry
(GC/MS), available at http://www3.epa.gov/epawaste/hazard/testmethods/sw846/pdfs/8270d.pdf EPA (2011). Quality Management Tools - QA Project Plans. http://www.epa.gov/QUALITY/qapps.html ISO 16000-6:2011 Indoor air - Part 6: Determination of volatile organic compounds in indoor and test
chamber air by active sampling on Tenax TA sorbent, thermal desorption and gas chromatography using MS or MS-FID
ISO 16000-9: Indoor Air−Part 9: Determination of the Emission of Volatile Organic Compounds from Building Products and Furnishing−Emission Test Chamber Method, available at http://www.iso.org/iso/catalogue_detail.htm?csnumber=38203
ISO (2006). ISO 16000-10:2006 -- Indoor air -- Part 10: Determination of the emission of volatile organic compounds from building products and furnishing -- Emission test cell method, available at http://www.iso.org/iso/iso_catalogue/catalogue_tc/catalogue_detail.htm?csnumber=38204
Kim S, Kim J, and Kim H (2007). Application of Field and Laboratory Emission Cell (FLEC) to Determine Formaldehyde and VOCs Emissions from Wood-Based Composites. Mokchae Konghak 35(5): 24−37.
Liu W, Zhang Y, and Yao Y (2012). Labeling of volatile organic compounds emissions from Chinese furniture: Consideration and practice. Chinese Science Bulletin, 58: 3499−3506

Page 14 of 41
Xu Y, Liu Z, Park J, Clausen PA, Benning JL, and Little JC (2012). Measuring and predicting the emission rate of phthalate plasticizer from vinyl flooring in a specially-designed chamber. Environmental Science and Technology, 46: 12534−12541.
Yerramilli S, Schiller R, Downie R, and Garnys V (2010). Measurement of Chemical Emissions from Building Products. The Australian Building Services Journal, 1: 41-44.

Page 15 of 41
Exposure Testing Protocol 3: Long-Term Emissions from Articles – Partition and Diffusion Coefficients
Purpose: To collect information on physical/chemical properties that influence migration rates of volatile and semi-volatile organic compounds (VOCs and SVOCs) into the indoor environment.
Modifications: This protocol is general, and it is anticipated that during protocol development and finalization, additional modifications will be made to tailor the sampling parameters or analytical techniques to the specific chemical and product tested. It is anticipated that during protocol development, Agency recommendations will be incorporated to tailor sampling parameters or analytical techniques to the specific product, chemical, and exposure scenario of interest.
Description:
Basics of partition and diffusion coefficients Volatile and semi-volatile organic compounds (VOCs and SVOCs) emitted from solid surfaces (e.g., building materials, consumer products) can affect indoor air quality (Cox et al., 2001). Because testing long-term emissions is costly and time-consuming, mass transfer models have been developed to predict the emission and transport of chemicals. Initial concentration in the source (C0), the solid-phase diffusion coefficient (Dm), material-air partition coefficient (Kma), and gas-phase mass transfer coefficient (h) are key parameters that impact the emissions. For new products and articles, C0 can be estimated based on product formulation and parameter h is often estimated with empirical models. Therefore, the partition and diffusion coefficients are key to understanding the long-term effect of chemical emission from products and articles.
Theoretically, the diffusion transport of molecules is related to the properties of the chemical such as molecular weight, molecular size (volume or area), and the molecular polarity; the properties of the substrate; and environmental conditions such as temperature, air velocity, and relative humidity. The material-air partition coefficient is often correlated with the volatility of the chemical and properties of the substrate. While there are many methods for experimental determination of Dm and Kma, standard methods are lacking. No single method is suitable for testing all materials and chemicals. Most existing methods are suitable for VOCs only.
Methods to estimate partition and diffusion coefficients Table 2 summarizes eight experimental methods for measuring the partition and diffusion coefficients for solid materials. Details associated with each method are described below.
Table 2. Methods for experimental determination of partition and diffusion coefficients
Method K D Applicability Reference
Microbalance Yes Yes VOCs Cox et al., 2001
Zhao et al., 2004
Dynamic-static chamber No Yes VOCs Meininghaus et al., 2002
Yes Yes VOCs He et al., 2010

Page 16 of 41
Static diffusion metric method Yes Yes VOCs Bodalal et al., 2000
Table 2. Methods for experimental determination of partition and diffusion coefficients
(continued)
Method K D Applicability Reference
Twin dynamic chamber methods Yes Yes VOCs
Xiong et al., 2009; Xu et al., 2012
Meininghaus et al., 2000 Meininghaus et al., 2002
Dual chamber in series Yes Yes SVOCs Liu et al., 2014
Variable volume loading Yes No VOCs Xiong et al., 2011
Cup method No Yes VOCs Kirchner et al., 1999
Porosity-based method No Yes VOCs Blondeau et al., 2003
Microbalance method The microbalance method can be used to estimate the partition and diffusion coefficients by placing the test specimen on a microbalance located in a dynamic chamber with temperature and humidity control, as shown in Figure 6 (Cox et al., 2001; Zhao et al., 2004). In the beginning of the test, the sample weight is first stabilized by passing clean air through the chamber until an equilibrium is obtained. The sorption process begins by introducing an air stream with a constant and known concentration of VOC into the chamber. The mass gain of the test specimen due to VOC sorption over time is monitored. The monitoring continues for a period of time after the equilibrium is reached. During the desorption process, the chamber is purged with clean air and the weight loss of the test specimen is monitored until an equilibrium is re-established. This is a gravimetric method. With the sorption and desorption data measured by the microbalance, the partition coefficient is determine by the ratio of the solid- and gas-phase concentrations and the diffusion coefficient by non-linear regression.

Page 17 of 41
Figure 6. Schematic plot of the microbalance test system (Cox et al., 2001)
Dynamic-static chamber method The system of the dynamic-static chamber method is composed of a Field and Laboratory Emission Cell (FLEC), a static chamber (test chamber), and a measurement device. One example of a measurement device is a proton transfer reaction-mass spectrometer (PTR-MS) (Meininghaus et al., 2002; He et al., 2010). The static chamber serves as a limited reservoir for gaseous VOCs. The test material, as a thin plate with uniform thickness, is placed between the FLEC and the static chamber. During the test, clean gas (VOC free) from a compressed air cylinder passes through the FLEC at a controlled rate (Figure 7), and VOC is introduced to the static chamber at a certain concentration. The VOC in the static chamber will diffuse to the FLEC through the test material driven by the concentration gradient. The real-time VOC concentration in the outlet air of the FLEC is sampled and analyzed by an appropriate method. The concentration data is used to estimate the partition and diffusion coefficients.
Figure 7. Schematic plot of the dynamic-static chamber (He et al., 2010)

Page 18 of 41
Static diffusion metric method The diffusion metric method uses a twin static diffusion chamber system to determine the diffusion coefficient (Bodalal et al., 2000). The testing material is installed between two chambers, and a fan is installed in each chamber to mix the air (Figure 8). During the test, the VOC compound under investigation is introduced into one chamber, while the initial concentration of the other chamber is zero. Partition and diffusion coefficients are estimated based on a comparison of the measured gas-phase concentrations in the two chambers.
Figure 8. Schematic plot of the diffusionmetric method (Bodalal et al., 2000)
Twin dynamic chamber method The twin chamber method features two chambers separated by the test material. One chamber is dosed with VOC through inlet air at a constant rate, while clean air passes through the other chamber. VOC concentrations in both chambers are monitored continuously. Depending on the type of chamber used, this method has several variations (Meininghaus et al., 2000, 2002; Xiong et al., 2009; Xu et al., 2012). Figure 9 shows the generic test facility for the twin chamber method (Xiong el at., 2009). Different methods are used to estimate the partition and diffusion coefficients from the experimental results. Non-linear regression based on solutions to Fick’s law is commonly used. The method proposed by Xiong et al. (2009) takes into consideration the convective mass transfer although the calculation is somewhat complex.

Page 19 of 41
Figure 9 Schematic plot of the dual-chamber method (Xiong et al., 2009)
Dual chamber in series method The dual chamber in series method is a recently developed approach to estimate partition and diffusion coefficients of SVOCs after solving issues such as low concentrations in air, difficulty of measuring the mass change, and strong sorption effects (Liu et al., 2014). The experiment setup is presented in Figure 10, in which two environmental chambers are operated in series as the source and the material test chambers. Outlet air from both chambers are measured by the polyurethane foam (PUF) samplers. Test materials are pre-cleaned, punched into circular disks, and are mounted on aluminum pin mounts (“buttons”), which are then placed on aluminum pin-mounted support blocks. Each chamber contains a cooling fan to ensure the air is well-mixed. Prior to the experiment, the test chamber walls are pre-coated with the SVOC to be investigated. During the tests, the material buttons are removed from the test chamber at different exposure times to determine the amount of SVOC absorbed by the buttons over time. Both partition and diffusion coefficients are estimated with a degree of sorption saturation (DSS) model, which was originally developed by Deng et al. (2010), as the sorption saturation degree (SSD) model.
Figure 10. Schematic plot of the dual chamber method (Liu et al., 2014)
Page 20 of 41
Variable volume loading The variable volume loading method uses a closed stainless steel chamber or a sealable jar. The test specimen with known surface area and volume is placed in the chamber. Once the equilibrium condition is reached, gas-phase concentration in the chamber is determined. The same experimental procedure is repeated several times by changing the volume of the test specimen so the loading factor is different from test to test. The initial concentration of the chemical in the test specimen and material-air partition coefficient is estimated by plotting the equilibrium concentration versus the ratio of the air volume over the volume of the test specimen.
Cup method This method determines the solid-phase diffusion coefficient only. Based on an ISO standard on water vapor diffusion (ISO 12572), the cup method involves a cup of liquid VOC at saturation in headspace. The top of the cup is covered by a test specimen (Figure 11, Kirchner et al., 1999; Blondeau et al., 2003). The system is placed in a temperature and humidity-controlled environment, and the diffusion coefficient of the tested specimen is estimated by weighing the diffusion loss of VOC using a microbalance.
Porosity-based method Diffusion coefficients can be estimated by the porosity-based method through mercury intrusion porosimetry tests (Blondeau et al., 2003). The first step is to conduct mercury intrusion porosimetry (MIP) tests to characterize the porous structure of the materials of interest, followed by applying Carniglia’s mathematical model to estimate the effective diffusivities of any gaseous species in these materials. Porosity-based method can be applied to uniform, isotropic materials (properties are the same in all directions within the material). However, it does not address situations where diffusion is controlled by surface migration, which is not the case in practical building applications.
Reporting Results and Records Retention: A final report shall be prepared, and records shall be retained in accordance with 40 CFR 792, Subpart J – Records and Reports. Sampling parameters vary based on the chemical, product, and exposure scenario of interest. All sampling parameters need to be thoroughly documented and reported:
- Initial concentration of the chemical of interest in the test material and the chamber air. - Dimensions of the test equipment (e.g., chamber, cup). - Surface area, thickness, and location of the product exposed within the chamber. - Environmental conditions: chamber air flow rates, temperatures, relative humidity values, and air
exchange values - Sampling and analytical methods: description or citation, including deviation from standard
procedure. Any additional modifications to the chamber system (fans, removable sample devices, etc.).
- Test results: concentration vs. time and sampling timeframe. ASTM 5116 describes a method to convert chamber concentrations to emission rate (in mass/time) and emission factor (in mass/area/time).
Figure 11. Schematic plot of the cup
method (Blondeau et al., 2003)

Page 21 of 41
- QA/QC data: accuracy and precision of measurements, calibrations, daily calibration checks, background samples, blank samples.
References: ASTM D5116-10, 2010. Standard guide for small-scale environmental chamber determinations of
organic emissions from indoor materials/products. ASTM International, West Conshohocken, PA. Blondeau, P., A. Tiffonnet, A. Damian, O. Amiri and J. Molina (2003). "Assessment of Contaminant
Diffusivities in Building Materials from Porosimetry Tests." Indoor Air 13(3): 310-318. Cox, S. S., D. Zhao and J. C. Little (2001). "Measuring Partition and Diffusion Coefficients for Volatile
Organic Compounds in Vinyl Flooring." Atmospheric Environment 35(22): 3823-3830. Corsi, R., Crain, N., Fardal, J., Little, J., and Xu, Y. (2007) Determination of Sorption Parameters for 36
VOC/Material Combinations. Final Report. EPA Report EPA 600/R-07/035-R1, submitted to Dr. Zhishi Guo.
Deng, Q., X. Yang and J. S. Zhang (2010). "New Indices to Evaluate Volatile Organic Compound Sorption Capacity of Building Materials (Rp-1321)." HVAC&R Research 16(1): 95-105.
Global CEM Net. Global Net on "Consumer Exposure Modeling". In: Kephalopoulos S., Arvanitis A., and Jayjock M. (Eds.). Workshop no. 2 report on "Source characterization, transport and fate", 20–21 June 2005, Intra (Italy), Office for Official Publication of the European Communities, Luxembourg. EUR 22521 EN/2, 2006b.
He, Z., W. Wei and Y. Zhang (2010). "Dynamic—Static Chamber Method for Simultaneous Measurement of the Diffusion and Partition Coefficients of VOCs in Barrier Layers of Building Materials." Indoor and Built Environment 19(4): 465-475.
ISO (2001). "12572: 2001." Hygrothermal performance of building materials and products. Determination of water vapor transmission properties,” AFNOR.
Kirchner, S., J. Badey, H. N. Knudsen, R. Meininghaus, D. Quenard, H. Sallee and A. Saarinen (1999). Sorption Capacities and Diffusion Coefficients of Indoor Surface Materials Exposed to Vocs. Proposal of New Test Procedures. Indoor Air 99.
Little, J. C. and A. T. Hodgson (1996). "Strategy for Characterizing Homogeneous, Diffusion-Controlled, Indoor Sources and Sinks." ASTM Special Technical Publication 1287: 294-304.
Liu, X., Z. Guo and N. F. Roache (2014a). "Experimental Method Development for Estimating Solid-Phase Diffusion Coefficients and Material/Air Partition Coefficients of SVOCs." Atmospheric Environment 89: 76-84.
Liu, X., N. F. Roache and M. R. Allen (2014b). “DEVELOPMENT OF A SMALL CHAMBER METHOD FOR SVOC SINK EFFECT STUDY " 13th International Conference on Indoor Air Quality and Climate, Indoor Air 2014; Hong Kong; Hong Kong.
Meininghaus, R., L. Gunnarsen and H. N. Knudsen (2000). "Diffusion and Sorption of Volatile Organic Compounds in Building Materials-Impact on Indoor Air Quality." Environmental Science & Technology 34(15): 3101-3108.
Meininghaus, R. and E. Uhde (2002). "Diffusion Studies of VOC Mixtures in a Building Material." Indoor Air 12(4): 215-222.
Wang, X., Y. Zhang and J. Xiong (2008). "Correlation between the Solid/Air Partition Coefficient and Liquid Molar Volume for Vocs in Building Materials." Atmospheric Environment 42(33): 7768-7774.
Xiong, J., Y. Zhang, W. Yan and Z. He (2009). "An Improvement for Dynamic Twin Chamber Method to Measure VOC Diffusion Coefficient and Partition Coefficient." ASHRAE Transactions 115(2).

Page 22 of 41
Xiong, J., W. Yan and Y. Zhang (2011). "Variable Volume Loading Method: A Convenient and Rapid Method for Measuring the Initial Emittable Concentration and Partition Coefficient of Formaldehyde and Other Aldehydes in Building Materials." Environmental science & technology 45(23): 10111-10116.
Xu, J., J. S. Zhang, X. Liu and Z. Gao (2012). "Determination of Partition and Diffusion Coefficients of Formaldehyde in Selected Building Materials and Impact of Relative Humidity." Journal of the Air & Waste Management Association 62(6): 671-679.
Zhao, D., J. C. Little and S. S. Cox (2004). "Characterizing Polyurethane Foam as a Sink for or Source of Volatile Organic Compounds in Indoor Air." Journal of environmental engineering 130(9): 983-989.

Page 23 of 41
Exposure Testing Protocol 4: Particulate Matter Formation Due to Mechanical Forces Applied to Product or Article Surfaces
Purpose: To determine how much particulate matter is formed due to mechanical forces (abrasion) applied to the surface of a product or article under simulated conditions designed to mimic routine use over the lifecycle of a product.
Modifications: This protocol is general, and it is anticipated that during protocol development and finalization, additional modifications will be made to tailor the sampling parameters or analytical techniques to the specific chemical and product tested. It is anticipated that during protocol development, Agency recommendations will be incorporated to tailor sampling parameters or analytical techniques to the specific product, chemical, and exposure scenario of interest.
Description:
Approach Particulate matter (PM), suspended or settled, plays an important role in human exposure to chemicals in the indoor environment. There are three major mechanisms by which chemicals in products/articles may transfer to particles: particle/air partitioning (sorption of vapor), particle/solid material partitioning (migration by direct contact), and particle formation due to weathering of the source or mechanical forces such as abrasion applied to the source (e.g., flaking and chalking). This document describes a generic protocol for testing particle formation due to abrasion. The design concept of this method is based on BS EN ISO 9073-10 (2004) and Morgeneyer et al. (2015).
Test Facility and Apparatus The test facility, as shown in Figure 12, consists of the abrasion apparatus, test chamber (or room), particle counters, and particle mass sampler. It is recommended that, if possible, the motor unit of the abrasion apparatus be located outside the test chamber (Morgeneyer et al., 2015). Otherwise, particle emission from the motor must be checked and treated as background emissions of the test chamber.
Figure 12. Schematic of the test facility for particle generation due to abrasion

Page 24 of 41
Abrasion Apparatus Many standard abrasion test methods are available. In this generic protocol the Taber abrasion method (BS EN ISO 9073-10, 2004) is recommended because it can be applied to a wide range of products/articles. There are over 100 standard methods for Taber abrasion tests alone. Selection of a proper method depends on the type of material to be tested although the basic principles are the same.
Test Chamber The test chamber (or room) is an air-tight enclosure with air flow, temperature and humidity controls. It is used to house the abrasion apparatus. Typical operating conditions of the chamber are 0.3 to 0.5 air change per hour, 23 °C, 50% relative humidity, and approximately 0.1 m/s air speed. Although several types of enclosures can serve as the test chamber for testing particle generation, large stainless steel chambers (ASTM D6670) are preferred as they can meet all the aforementioned requirements.
Particle Counters Particle counters are used to determine the size distribution of airborne particles. In addition, in the absence of valid filter samples, the results can be used to estimate the particle emission rate (described below). In this protocol, it is recommended that the size bins of the particle counter cover the range of aerodynamic diameters from 0.3 to 25 μm. If a single particle counter cannot cover this range, two particle counters with different size ranges can be used.
Particle Mass Sampler Particle mass monitoring allows determination of particle concentration in air and the emission rate from the source. This is done by collecting airborne particles onto filters. The particle mass is determined by weighing the filter before and after sampling. This method can be used to collect total suspended particles (TSP), PM2.5 (fine particles with diameters of 2.5 μm or smaller), PM10 (particles with diameters of 10 μm or smaller), or inhalable coarse particles. Collecting PM10 or PM2.5 mass requires placing a sizing device, most commonly a cyclone, upstream of the filter. For this test protocol, characterizing particle size is recommended.
Particle mass sampling devices are commercially available. They consist of a filter sample holder, air flow control, air pump, and timer. PTFE-coated membrane filters and quartz-fiber filters are most commonly used for collecting particle mass from air. Because these filters are sensitive to humidity, the filters must be conditioned under the weighing conditions before being weighed (EPA Method 201A). Dual particle samplers should be used to collect filter samples.
Other Equipment and Devices A micro balance with a readability of 1 μg or better is needed for weighing the particle filters. The balance should be located in a conditioned room with constant temperature and relative humidity.
Generic Test Procedure - Before a test, prepare the test materials according to the specifications in the abrasion test. - Condition the particle filters. - Calibrate the flow rates of the particle mass sampler and particle counters. - Start the test chamber and allow the temperature, humidity, and air flow to stabilize. In the
meantime, weight the particle filters. - After the test chamber approaches a steady state, turn on the particle counters. - Place the test specimen on the abrasion apparatus; start the abrasion apparatus. - Mount a particle filter onto the particle holder.
Page 25 of 41
- Start the pump of the particle mass sampler.
The particle mass collected on the filter depends on the airborne particle concentration, sampling flow, and sampling duration. For gravimetric measurements, a particle mass of 50 μg or more is recommended; for chemical speciation (discussed below), more mass is often needed.
Estimating the Average Particle Generation Rate from Filter Samples The average particle generation rate can be roughly estimated from Equation 1:
𝑅𝑅𝑓𝑓 = 𝑄𝑄 𝑚𝑚𝑞𝑞 𝑡𝑡
(1)
Where Rf = Particle generation rate during abrasion test based on filter mass (μg/h) Q = Air change flow rate of the test chamber (m3/h) m = Particle mass collected on filter (μg) q = Sampling air flow for particle mass sampler (m3/h) t = Sampling duration (h)
Note that Equation 1 underestimates the particle generation emission rate because of two factors. First, it ignores the particle deposition on the interior surfaces of the test chamber. Second, the particle concentration in the chamber air is fairly low in the early hours because it takes time for the concentration to reach a steady state. The result from Equation 1 can be corrected for these factors by means of mathematical modeling if the air change rate of the chamber and particle deposition rate, which is size dependent, are known.
Estimating the Average Particle Generation Rate Based on Data from Particle Counters If the filter sampler cannot collect enough particle mass, the particle generation rate can be roughly estimated based on the data from particle counters (Equation 2):
𝑅𝑅𝑐𝑐 = 10−6 𝑄𝑄 𝜋𝜋 𝜌𝜌6 𝑞𝑞
∑ (𝑁𝑁𝑖𝑖 − 𝑁𝑁0𝑖𝑖) 𝑑𝑑𝑖𝑖3𝑛𝑛𝑖𝑖=0 (2)
Where Rc = Particle generation rate during abrasion test based on data from particle counter (μg/h) Q = Air change flow rate of the test chamber (m3/h) ρ = Particle density (g/cm3) q = Sampling air flow for particle counter (m3/h) Ni = Particle number count in the ith size bin during abrasion test N0i = Particle number count in the ith size bin for chamber background di = Geometric mean diameter for the ith size bin (μm) n = Number of size bins.
Like Equation 1, Equation 2 is also subject to correction for particle deposition and non-steady-state condition in early hours.
Chemical Speciation The filter samples can be further analyzed for the chemical composition of the particles, known as speciation. A wide range of physical and chemical methods are available for particle speciation. Method selection depends on the chemical, article, and exposure scenario of interest. It is beyond the scope of this protocol to discuss technical details about particle speciation.
Page 26 of 41
Safety Issue It is highly recommended the abrasion apparatus be operated remotely outside the test chamber. If the operator must be inside the chamber during the test, a safety and health plan must be developed and implemented.
Reporting Results and Records Retention: A final report shall be prepared, and records shall be retained in accordance with 40 CFR 792, Subpart J – Records and Reports. For example, the following key information should be included in the report:
- Test material: material name, intended use, uniformity (homogeneous, layered, spray application, coating, etc.), and dimensions of test specimens.
- Abrasion apparatus: abrader brand and model number, abrading type (abrasive characteristics of the wheel), and operating parameters.
- Test chamber: chamber brand and model number, volume, dimensions, and interior surface material.
- Environmental conditions: chamber air flow rate, temperature, relative humidity, and air speed expressed in arithmetic mean and standard deviation.
- Particle counters: particle counter type, brand, and model number. - Particle mass sampler: sampler brand and model number, filter type and size, sampling flow rate
and duration. - Test procedure: description or citation, including deviation from standard procedure. - Test results: particle counts vs time for each size bin and sampling air flow; gravimetric data for
particle mass, sampling air flow and sampling duration. - QA/QC data: accuracy and precision of measurements, calibrations, daily calibration checks,
background samples, blank samples.
References: ASTM 6670-01 (2007) Standard Practice for Full-Scale Chamber Determination of Volatile Organic
Emissions from Indoor Materials/Products, available at http://www.astm.org/Standards/D6670.htm BS EN ISO 9073-10 (2004). Lint and other particles generation in the dry state., available at
http://shop.bsigroup.com/ProductDetail/?pid=000000000030099719 Morgeneyer, M., Shandilya, N., Chen, Y.M., Bihan, O.L. (2015). Use of a modified Taber abrasion
apparatus for investigating the complete stress state during abrasion and in-process wear particle aerosol generation, Chemical Engineering Research and Design, 93:251–256.

Page 27 of 41
Exposure Testing Protocol 5: Photolysis under Simulated Indoor Lighting Conditions
Purpose: To determine whether a chemical in a product or article is subject to photolytic degradation under simulated indoor lighting conditions and what the major degradation products are.
Modifications: This protocol is general, and it is anticipated that during protocol development and finalization, additional modifications will be made to tailor the sampling parameters or analytical techniques to the specific chemical and product tested. It is anticipated that during protocol development, Agency recommendations will be incorporated to tailor sampling parameters or analytical techniques to the specific product, chemical, and exposure scenario of interest.
Description:
(1) Approach Photolysis, or photolytic degradation, is a chemical reaction by which the compound is broken down by light (photons). This process is relevant to indoor environmental quality and human exposure because, in some cases, the broken-down chemicals may be hazardous. While most chemicals found in indoor products/articles are expected to be resistant to photolysis under indoor lighting conditions, a few chemicals are not. For example, decabrominated diphenyl ethers, or decaBDE, is known to undergo photolytic debromination under natural sunlight, forming less brominated congeners (Stapleton and Dodder, 2008). It is less clear, however, how significant decaBDE photolysis is under indoor lighting conditions.
In this protocol, a generic method is described for testing the photolysis potential for chemicals like decaBDE by exposing the test material to simulated sunlight through windows in an accelerated weathering chamber and potential photolysis products are detected from air (by static air sampling), the surface of the test specimens (by wipe sampling), and settled dust (by dust sampling). The presence or absence of photolysis products in the samples can be determined qualitatively by comparing the chromatograms and quantitative analytical results for exposed samples with those for unexposed samples.
(2) Facility and Apparatus
Test Chamber Photolysis tests should be conducted in an accelerated weathering chamber, which provides ultraviolet (UV) irradiation, controlled temperature, and humidity. Two types of weathering chambers are commercially available (ASTM G154 and ASTM G155). Those that conform to ASTM G155 are recommended for this protocol. To simulate indoor lighting conditions, the system must have optical filters that generates sunlight through window glass (ASTM D 4459-06: Standard Practice for Xenon-Arc Exposure of Plastics Intended for Indoor Applications). A chamber system conforming to ASTM D 4459-06 can provide spectral irradiance of approximately 0.3 (W/m2/nm) at 340 nm when operated in the continuous light-on mode without water spray. This light source satisfies the light intensity requirement of 5 W/m2 over the test specimens. For testing settled dust, the chamber model must allow the panels to be placed on a horizontal (or nearly horizontal) tray.
Page 28 of 41
Note that the standard methods for accelerated aging tests under UV irradiation are intended for examining the changes of physical properties. To detect photolysis products, the test procedure requires several modifications and additional steps, as described below.
Passive Air Sampler Passive air samplers are used to capture chemical vapors emitted from the test specimens during the accelerated weathering test. This method determined time-averaged concentrations by using polyurethane foam disk as the sampling media (Harrad & Abdallah, 2008). The sampler can be mounted onto the chamber walls prior to a test. The sample media removed from the chamber can be extracted by solvents and analyzed for potential photolysis products. The analytical procedure depends on the properties of the target chemicals.
(3) Test Specimens The product or article to be tested are cut into panels. Different chambers may have different standard panel sizes and some chambers allow custom-size panels. In general, panels for wipe sampling should be at least 100 cm2 in size and those for testing settled dust at least 500 cm2. For a given product or article, 12 panels are needed for wipe sampling and 12 for testing settled dust.
(4) Wipe Sampling If photolysis products are present on the exposed surface of the test specimens, they can be collected by wipe sampling.
Wipe Sampling on Solid Surfaces ASTM D 6661-10, Standard Practice for Field Collection of Organic Compounds from Surfaces Using Wipe Sampling, or an equivalent method, shall be used for surface sampling on solid panels. The wipe samples shall be extracted and then analyzed for potential photolysis products.
Surface sampling on Fabric Swatches The method is based on the California roller method (Ross et al., 1991; Fuller et al., 2001) with modifications. Use 3” × 6” heavy filter paper instead of cotton gauze pad; place the fabric swatch on a pre-cleaned, non-porous, flat surface (such as a rigid metal plate or polished granite block); place the heptane-wetted filter paper on the fabric swatch; place a 3” × 6” stainless steel (or aluminum) plate on the paper filter; add additional weights on the plate such that the total weight is 2 pounds (lb); wait for 5 minutes; remove plate and weights; extract the paper filter.
(5) Dust Sampling Photolysis may be difficult to detect on product or article surfaces by wipe sampling, and tests with settled dust are recommended.
House Dust or Surrogate Dust Ideally, cleaned-up standard house dust should be used (Stapleton and Dodder, 2008). Because of high cost of the standard reference material, surrogate dust (e.g., Arizona test dust) can be used. In either cases, the dust must be free of the chemical of interest and its degradation products. Otherwise, the dust must be cleaned by solvent extraction. For Arizona test dust, 10-μm mean diameter is recommended.
Dust Application Larger test specimens (i.e., coupons), such as 6” × 6” (15.2 cm × 15.2 cm), are recommended for tests with settled dust. The goal is to apply an adequate amount of house dust (or surrogate dust) on the coupons

Page 29 of 41
without forming a thick layer of dust. The target dust load is between 3.0 to 4.3 mg/cm2 coupon, which is roughly equivalent to 0.7 to 0.9 g dust per panel.
The house dust can be deposited on test specimens by using a separate dust deposition chamber (O'Shaughnessy et al., 2002) or spiked manually on test specimens (Ashley et al., 2007).
Dust Sampling Dust samples over the test coupons will be collected by the micro-vacuuming method (ASTM D 7144-05a; Ashley et al., 2007).
(6) Analytical Methods Selection of the analytical methods for air, wipe, and dust samples depends on the properties of the chemicals of interest and the type of sampling media. For example, for photolysis of decaBDE, chromatography or mass spectrometry in electron capture negative ionization mode (GC/MS-ECNI) has been used (Stapleton et al., 2008). Identification and quantification of photolysis products in the samples are sometimes challenging because of the dominance of the chemical of interest (i.e., the parent compound) in the chromatograms. This issue can be resolved by using highly sensitive instrument and by adopting a pre-separation method such as preparative chromatography.
(7) Generic Procedure for Photolysis without Dust - Prepare 12 3” × 6” (7.6 cm × 15.2 cm) coupons (panels
or fabric swatches). - Take wipe samples on 3 coupons, which represent no-
exposure conditions. - Clean the interior surfaces, wherever reachable, and
the sample tray of the test chamber by washing with soap and water, wiping with toluene, and wiping with methanol.
- Take two wipe samples (100 cm2 each) from the chamber walls.
- Place three passive air samplers (PUF disks) on the supporting cradle about half chamber height.
- Place the remaining 9 coupons on the sample tray. - Close the chamber door, set the temperature at 35 °C
and relative humidity at 30% (The moisture content is roughly equivalent to that of 50% RH at 25 °C).
- Turn on the UV light to start the test. - On day 4, turn off the UV light, open the chamber
door, and perform the following steps: - Remove three coupons from the chamber for
taking wipe samples. - Remove one PUF disk for determination of time-
integrated air concentrations of the target chemical and potential photolysis products.
- Close the chamber door and turn on the UV light to restart the test.
- On day 15 and day 30, repeat the steps on day 4.
Figure 13. Graphic example of generic
procedure for photolysis without dust
Page 30 of 41
- After all samples are removed, take two wipe samples from the chamber walls (100 cm2 each).
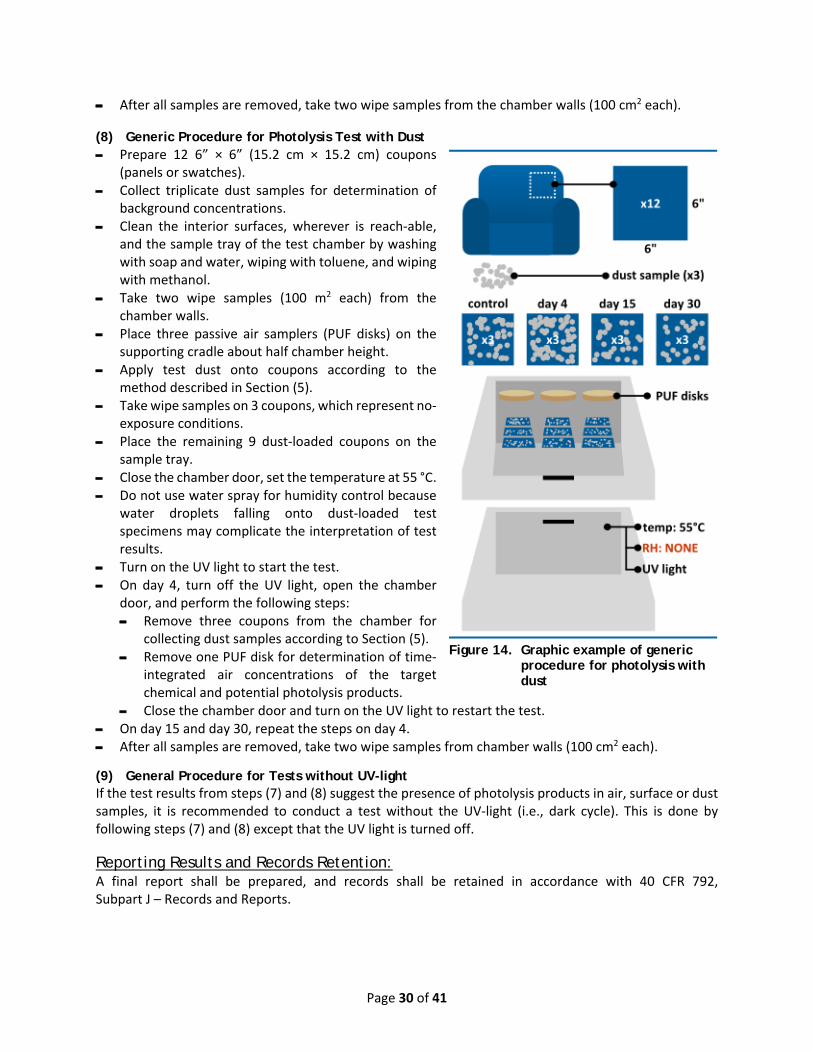
(8) Generic Procedure for Photolysis Test with Dust - Prepare 12 6” × 6” (15.2 cm × 15.2 cm) coupons
(panels or swatches). - Collect triplicate dust samples for determination of
background concentrations. - Clean the interior surfaces, wherever is reach-able,
and the sample tray of the test chamber by washing with soap and water, wiping with toluene, and wiping with methanol.
- Take two wipe samples (100 m2 each) from the chamber walls.
- Place three passive air samplers (PUF disks) on the supporting cradle about half chamber height.
- Apply test dust onto coupons according to the method described in Section (5).
- Take wipe samples on 3 coupons, which represent no-exposure conditions.
- Place the remaining 9 dust-loaded coupons on the sample tray.
- Close the chamber door, set the temperature at 55 °C. - Do not use water spray for humidity control because
water droplets falling onto dust-loaded test specimens may complicate the interpretation of test results.
- Turn on the UV light to start the test. - On day 4, turn off the UV light, open the chamber
door, and perform the following steps: - Remove three coupons from the chamber for
collecting dust samples according to Section (5). - Remove one PUF disk for determination of time-
integrated air concentrations of the target chemical and potential photolysis products.
- Close the chamber door and turn on the UV light to restart the test. - On day 15 and day 30, repeat the steps on day 4. - After all samples are removed, take two wipe samples from chamber walls (100 cm2 each).
(9) General Procedure for Tests without UV-light If the test results from steps (7) and (8) suggest the presence of photolysis products in air, surface or dust samples, it is recommended to conduct a test without the UV-light (i.e., dark cycle). This is done by following steps (7) and (8) except that the UV light is turned off.
Reporting Results and Records Retention: A final report shall be prepared, and records shall be retained in accordance with 40 CFR 792, Subpart J – Records and Reports.
Figure 14. Graphic example of generic
procedure for photolysis with dust

Page 31 of 41
The standard test methods mentioned above contain sections for reporting. For example, key information to be reported includes:
- Test material: material name, intended use, uniformity (homogeneous, layered, spray application, coating, etc.), dimensions of test specimens, exposed area, treatment of sample edges (sealed or exposed) and information about sample creation, transport, and storage.
- Target chemical(s) and their basic properties: CAS number, molecular formula, vapor pressure, chemical reactivity, concentration in material, etc.
- Test chamber: chamber type, model name, volume, dimensions, and interior surface material. - Test procedure: description or citation, including deviation from standard procedure. - Sampling methods for air, wipe, and dust samples and analytical methods ― description or citation,
including deviation from standard procedure. Description of accuracy and precision - Analytical methods: description or citation, including deviation from standard procedure. - Environmental conditions: lighting conditions (lamps, optical filter, light spectrum and intensity),
chamber temperature (expressed in arithmetic mean and standard deviation), and moisture content in cooling air.
- Test results: chromatograms of air, wipe and dust samples, identification of peaks, time-averaged concentrations in chamber air from static air sampler, concentrations in wipe and dust samples.
- QA/QC data: accuracy and precision of measurements, calibrations, daily calibration checks, background samples, blank samples.
References: Ashley, K., Applegate, G.T., Wise, T.J., Fernback, J.E., and Goldcamp, M.J. (2007). Evaluation of a
standardized micro-vacuum sampling method for collection of surface dust. Journal of Occupational and Environnemental Hygiene. 4:215-223.
ASTM D7144 - 05a (2011) Standard Practice for Collection of Surface Dust by Micro-vacuum Sampling for Subsequent Metals Determination
ASTM G154-12a, Standard Practice for Operating Fluorescent Ultraviolet (UV) Lamp Apparatus for Exposure of Nonmetallic Materials, ASTM International, West Conshohocken, PA, 2012, www.astm.org
ASTM G155-13, Standard Practice for Operating Xenon Arc Light Apparatus for Exposure of Non-Metallic Materials, ASTM International, West Conshohocken, PA, 2013, www.astm.org
Harrad, S. and Abdallah, M.A. (2008). Calibration of two passive air sampler configurations for monitoring concentrations of hexabromocyclododecanes in indoor air. Journal of Environmental Monitoring, 10(4):527-31.
O'Shaughnessy, P., Svendsen, E., Thorne, P.S., and Reynolds, S. (2002). A dust-settling chamber for sampling-instrument comparison studies. Presented at American Industrial Hygiene Association Conference and Exposition, San Diego, CA, June 1-6, 2002.
Ross, J., Fong, H., Thongsinthusak, T., Margetich, S., and Krieger, R. (1991). Measuring potential dermal transfer of surface pesticide residue generated from indoor fogger use: using the CDFA roller method interim report II. Chemosphere. 22:975-984.
Stapleton, H.M., Kelly, S.M,; Allen, J.G., McClean, M.D., and Webster, T.F. (2008). Measurement of polybrominated diphenyl ethers on hand wipes: estimating exposure from hand-to-mouth contact. Environmental Science & Technology. 42:3329-3334. 2008.
Stapleton, H.M. and Dodder, N.G. (2008). Photodegradation of decabromodiphenyl ether in house dust by natural sunlight. Environmental Toxicology and Chemistry. 27:306-312.

Page 32 of 41
Exposure Testing Protocol 6: Oral Exposure – Migration Rate and Transfer Efficiency
Purpose: To collect information on how much of a chemical migrates from an article or material into simulated saliva over time.
Modifications: This protocol is general, and it is anticipated that during protocol development and finalization, additional modifications will be made to tailor the sampling parameters or analytical techniques to the specific chemical and product tested. It is anticipated that during protocol development, Agency recommendations will be incorporated to tailor sampling parameters or analytical techniques to the specific product, chemical, and exposure scenario of interest.
Description:
Approach The methods for measuring migration from articles into simulated saliva have been described by the European Commission Joint Research Centre (JRC) (Simoneau et al., 2001), and several other studies have also used this approach to estimate migration rates of chemicals into saliva (Bouma and Schakel 2001) (Bouma et al 2002) (Corea-Tellez et al 2008) (Earls et al 2003) (Masuck et al 2011) (Niino et al 2001) (Niino et al 2002) (Ninno et al 2003) (Ozer and Gucer 2011) (Simoneau et al 2009) (TNO Nutrition and Food Research 2001). The U.S. Consumer Product Safety Commission (CPSC) recently characterized exposure of phthalates, including mouthing, using measured migration rates (Babich 2014). The head over heels (HOH) approach, also referred to as aggressive agitation, measures the amount of chemical that migrates from an article into simulated saliva. This migration is typically reported in µg/10 cm2/hour. Migration rates quantify the rate at which a chemical that is a part of the article itself migrates from an article over time. Additional information that characterizes the duration of the experiment and expected conditions of use, such as duration of mouthing time for the article or material is also needed to estimate exposure.
The transfer of a chemical deposited on the surface of an article onto hands and the transfer of a chemical from the surface of an article to the mouth are defined as the hand-to-mouth and object-to-mouth transfer efficiencies, respectively. The transfer efficiency likely varies based on the type of material, level of surface loading, and the physical form of the chemical itself (liquid or solid). A recently published transfer efficiency database contains all publicly available transfer efficiency values and includes a discussion of methods for measuring oral saliva transfer efficiency in the Gorman NG et al. (2012) paper. Both the hand-to-mouth and object-to-mouth transfer efficiencies are important in characterizing dust ingestion. Additional information that characterizes the frequency of hand-to-mouth and object-to-mouth transfers is needed for the article or material of interest in order to estimate intake.
Preparation of Saliva There are various approaches to prepare artificial saliva. It is recommended that saliva is prepared at a representative temperature and pH and contain relevant enzymes and salts in concentrations likely to be present within the human mouth. The composition of the saliva as well as the testing conditions of the saliva within the Head over Heels (HOH) testing apparatus should be transparent and well documented. An in vitro model was developed to estimate extraction via saliva (Brandon et al 2006). That paper references a composition of saliva from Versantvoort et al (2005) which is presented below. Another recent paper (Marques et al 2011), provides five different approaches to simulate saliva.

Page 33 of 41
Versantvoort et al 2005 - Inorganic Solution: 10 mL of 89.6 g/L KCl solution,
10 mL of 20 g/L KSCN solution, 10 mL of 88.8 g/L NaH2PO4 solution, 1.7 mL of 175.3 g/L NaCl solution, and 20 mL of 84.7 g/L NaHCO3
- Organic Solution: 8 mL of 25 g/L urea solution - Add to Inorganic and Organic Solution: 290 mg alpha-amylase,
15 mg uric acid, and 25 mg mucin
- pH 6.8 +/- 0.2
Marques et al 2011 - Simulated Saliva 1: 0.72 g/L KCl,
0.22 g/L calcium chloride dihydrate, 0.6 g/L NaCl, 0.68 g/L potassium phosphate monobasic, 0.866 g/L sodium phosphate dibasic (dodecahydrate), 1.5 g/L potassium bicarbonate, 0.06 g/L potassium thiocyanate, and 0.03 g/L citric acid (pH 6.5)
- Simulated Saliva 2: 0.72 g/L KCl, 0.22 g/L calcium chloride dihydrate, 0.6 g/L NaCl, 0.68 g/L potassium phosphate monobasic, 0.866 g/L sodium phosphate dibasic (dodecahydrate), 1.5 g/L potassium bicarbonate, 0.06 g/L potassium thiocyanate, and 0.03 g/L citric acid (pH 7.4)
- Simulated Saliva 3: 0.228 g/L calcium chloride dihydrate, 1.017 g/L NaCl, 0.204 g/L sodium phosphate dibasic (heptahydrate), 0.061 g/L magnesium chloride hexahydrate, 0.603 g/L potassium carbonate hemihydrate, 0.273 g/L sodium phosphate monobasic monohydrate, 1 g/L submaxillary mucin, and 2 g/L alpha-amylase
- Simulated Saliva 4: 0.149 g/L KCl, 0.117 g/L NaCl, 2.1 g/L sodium bicarbonate, 2 g/L alpha-amylase, and 1 g/L mucin gastric
- Simulated Saliva 5: 8.0 g/L NaCl, 0.19 g/L potassium phosphate monobasic, and

Page 34 of 41
2.38 g/L sodium phosphate dibasic (pH 6.8)
Preparation of Samples, Extraction, and Analysis To prepare samples, discs, coupons, or circular samples are cut from the surface of the test article. The diameter of the samples should be approximately 2 inches.
Note, for each extraction, 50 mL is typically used. The weight and the volume of the simulated saliva should be reported. Many test procedures and ASTM F963 require a 50:1 ratio of solvent to sample for this type of extraction. The samples will be extracted four times each in 50 mL of simulated saliva in a 250 mL Schott Duran (or similar) bottle for 30 minutes. The bottle is shaken at 60 rpms in a circular head-over-heels (HOH) motion for the duration of the experiment, vertical diameter of 2 feet.
The liquid simulated saliva extract is removed after each extraction and saved for analysis. A fresh 25 mL of simulated saliva is added to the bottle containing the sample, and the bottle is shaken as above for 30 minutes. The replicate simulated saliva extract is then removed and also saved for analysis. The HOH procedure is then repeated a third time. Each separate solution obtained from these shakings is analyzed for the chemical of interest.
Figure 15. Graphic example of procedure for analyzing migration from product or article surface
to saliva
For chemical analysis, 10 mL of the simulated saliva is placed in a test tube. One mL of xylene (or suitable solvent) is added to the test tube and the tube is spun for one minute. The supernatant solvent is analyzed for chemical content by injecting 1.0 µL into the Gas Chromatography/Mass Spectrometry (GC/MS, or other suitable instrument). The results for the four extractions are then combined. The chemicals present in simulated saliva will be analyzed using different analytical methods, depending on the chemical present.
A variety of analytical methods can be used depending on the chemical(s) present. For example, GC/MS, inductively coupled plasma atomic emission spectroscopy (ICP) or HPLC. Note the instrumentation conditions for whichever analytical technique is used.
Page 35 of 41
Reporting Results and Records Retention: A final report shall be prepared, and records shall be retained in accordance with 40 CFR 792, Subpart J – Records and Reports.
For example, key information to be reported includes:
- Sampling and analytical methods ― description or citation, including deviation from standard procedure, if applicable.
- Description of simulated saliva composition (components, weight, volume) - Description of tested material (size, dimensions) - QA/QC data: accuracy and precision of measurements
References: Babich, M. (2014). Report to the U.S. Consumer Product Safety Commission by the CHRONIC HAZARD
ADVISORY PANEL ON PHTHALATES AND PHTHALATE ALTERNATIVES. Appendix E-2-4, available at http://www.cpsc.gov/PageFiles/169914/Appendix-E2-Substitutes-Exposure-FINAL.pdf
Bhooshan, B., (2005). Vinylidene Chloride Testing in Mattress Barrier Samples. Tab H. Pages 535-537, available at https://www.nvwa.nl/txmpub/files/?p_file_id=10485
Bouma K and Schakel D.J., 2001. Plasticisers in Soft PVC Toys. Report number: NDTOY002/01, available at https://www.nvwa.nl/txmpub/files/?p_file_id=10485
Bouma, K., & Schakel, D. J. (2002). Migration of phthalates from PVC toys into saliva simulant by dynamic extraction. Food Additives & Contaminants, 19(6), 602-610., available at http://www.tandfonline.com/doi/abs/10.1080/02652030210125137#.VgqkTJe2q8R
Brandon, E. F., Oomen, A. G., Rompelberg, C. J., Versantvoort, C. H., van Engelen, J. G., & Sips, A. J. (2006). Consumer product in vitro digestion model: Bioaccessibility of contaminants and its application in risk assessment. Regulatory Toxicology and Pharmacology, 44(2), 161-171.
Cobb, D. (2005). Migration of Flame retardant Chemicals in Mattress Barriers. Tab H. Pages 542-553, available at http://www.cpsc.gov/PageFiles/88231/matttabh.pdf
Corea-Tellez, K. S., Bustamante-Montes, P., Garcia-Fabila, M., Hernández-Valero, M. A., & Vazquez-Moreno, F. (2008). Estimated risks of water and saliva contamination by phthalate diffusion from plasticized polyvinyl chloride. Journal of environmental health, 71(3), 34-9., available at http://europepmc.org/abstract/med/18990931
Earls, A. O., Axford, I. P., & Braybrook, J. H. (2003). Gas chromatography–mass spectrometry determination of the migration of phthalate plasticisers from polyvinyl chloride toys and childcare articles. Journal of chromatography A, 983(1), 237-246., available at http://www.sciencedirect.com/science/article/pii/S0021967302017363
Masuck, I., Hutzler, C., & Luch, A. (2011). Estimation of dermal and oral exposure of Children to scented toys: Analysis of the migration of fragrance allergens by dynamic headspace GC–MS. Journal of separation science, 34(19), 2686-2696., available at http://onlinelibrary.wiley.com/doi/10.1002/jssc.201100360/abstract;jsessionid=CD01BF2ED5C27F03C6AC1E405B78E4D6.f03t04?deniedAccessCustomisedMessage=&userIsAuthenticated=false
Marques, M. R., Loebenberg, R., & Almukainzi, M. (2011). Simulated biological fluids with possible application in dissolution testing. Dissolution Technol,18(3), 15-28 (Table 10).
Ng, M. G., Semple, S., Cherrie, J. W., Christopher, Y., Northage, C., Tielemans, E., Veroughstraete, V., & Van Tongeren, M. (2012). The relationship between inadvertent ingestion and dermal exposure
Page 36 of 41
pathways: A new integrated conceptual model and a database of dermal and oral transfer efficiencies. Annals of occupational hygiene.
Niino T, Ishibashi T, Itho T, Sakai S, Ishiwata H, Yamada T, and Onodera S , 2001. Monoester formation by hydrolysis of dialkyl phthalate migrating from PVC products in human saliva. Journal of Health Science, 47(3):318-322., available at http://jhs.pharm.or.jp/data/47%283%29/47%283%29p318.pdf
Niino T, Ishibashi T, Itho T, Sakai S, Ishiwata H, Yamada T, Onodera S, 2002. Comparison of Diisonoyl Phthalate Migration from Polyvinyl chloride products into human saliva in Vivo and into saliva simulant In vitro. Journal of Health Science, 48(3):227-281., available at http://jhs.pharm.or.jp/data/48%283%29/48_277.pdf?origin=publication_detail
Niino T, Asakura T, Ishibashi T, Itho T, Sakai S, Ishiwata H, Yamada T, Onodera S, 2003. A Simple and Reproducible Testing Method for Dialkyl Phthalate Migration from Polyvinyl Chloride Products into Saliva Simulant . J. Food Hyg. Soc. Japan Vol. 44, No. 1, available at https://www.jstage.jst.go.jp/article/shokueishi/44/1/44_1_13/_pdf
Özer, E. T., & Güçer, Ş. (2011). Determination of some phthalate acid esters in artificial saliva by gas chromatography–mass spectrometry after activated carbon enrichment. Talanta, 84(2), 362-367., available at http://www.sciencedirect.com/science/article/pii/S003991401100035X
Simoneau, C., Hannaert, P., and Sarigiannis, D. E. 2009. Effect of the nature and concentration of phthalates on their migration from PVC materials under dynamic simulated conditions of mouthing. EUR 23813 EN; pp. 20.,available at http://publications.jrc.ec.europa.eu/repository/bitstream/JRC51604/reqno_jrc51604_chemtest_part2-phthalates_release_toys_cs02009_05_26.pdf%5B1%5D.pdf
Thomas, T. A., & Brundage, P. M. (2006). Quantitative Assessment of Potential Health Effects from the Use of Fire Retardant Chemicals in Mattresses. CPSC. Tab D. Section 2. Methods. Pages 10 -13, available at http://www.cpsc.gov/PageFiles/88208/matttabd.pdf
Thomas, T. A., & Brundage, P. M. (2006). Quantitative Assessment of Potential Health Effects from the Use of Fire Retardant Chemicals in Mattresses. CPSC. Tab D. Appendix 2. Experimental Protocol Flow Chart. Pages 239-242, available at http://www.cpsc.gov/PageFiles/88208/matttabd.pdf
TNO Nutrition and Food Research, 2001. Migration of phthalate plasticizers from soft PVC toys and childcare articles –Final report. Netherlands Organization for Applied Scientific Research, available at http://ec.europa.eu/enterprise/sectors/chemicals/files/studies/phthalates2_en.pdf
Versantvoort, C. H., Oomen, A. G., Van de Kamp, E., Rompelberg, C. J., & Sips, A. J. (2005). Applicability of an in vitro digestion model in assessing the bioaccessibility of mycotoxins from food. Food and Chemical Toxicology,43(1), 31-40.

Page 37 of 41
Exposure Testing Protocol 7: Dermal Exposure – Potential Exposure
Purpose: To collect information on how much of a chemical load is present on the surface of the skin and potentially available for exposure through various exposure pathways.
Modifications: This protocol is general, and it is anticipated that during protocol development and finalization, additional modifications will be made to tailor the sampling parameters or analytical techniques to the specific chemical and product tested. It is anticipated that during protocol development, Agency recommendations will be incorporated to tailor sampling parameters or analytical techniques to the specific product, chemical, and exposure scenario of interest.
Description: For this protocol, actual skin (i.e. animal skin, cadaver skin, human subject skin, where proper ethical and scientific research requirements have been met, etc.) or a skin surrogate such as filter paper may be used to estimate chemical load present on the surface of the skin. If human subjects are used for the testing, ensure that all requirements related to issues associated with scientific and ethical aspects of human subject research are adhered to. There are three primary mechanisms for chemical loading on to the surface of the skin:
- Application of liquid or semi-solid of the chemical as part of a formulation - Contact with surface of article or building material and migration into simulated sweat. - Proximity of skin to vapor-phase chemical concentrations in the air
The first mechanism applies primarily to products; the second to articles. The third mechanism can occur as a result of product use or article exposure. This exposure pathway may also be significant depending on the chemical, product, and environment of interest for the exposure scenario. Methods, such as those presented by Weschler et al, 2015 and Gong et al, 2014, show promise, and information from studies like this could inform an expanded basis for protocols characterizing the dermal pathway in the future.
Note, potential dermal exposure is described here. There are approaches available to estimate absorbed dose if dermal exposure is expected to be an important exposure pathway but this is outside the scope of this protocol. In vivo measurements, in vitro measurements and/or measured permeability coefficients could be used to estimate absorbed dose. The flux of a chemical across the skin membrane, whether an infinite or finite dose is assumed, exposure duration, and comparison of different approaches can be considered (OECD 2004a) (OECD 2004b) (Buist et al 2010) (Frasch et al 2014).
Approach for Determination of Film Thickness from Application of Liquids or Semi-solid Product For products in which skin contact other than direct application to the skin occurs, the measurement of the thickness of the product film that remains on the skin after contact is used to characterize the mass of product that remains on the skin after contact. The film thickness can be measured in up to five use scenarios depending on the intended product use. In all scenarios, the product should be prepared according to use instructions. Because the test is measuring the thickness of a film of a product retained on the skin as a result of use of the product, a surrogate test product with similar properties (e.g., volatility,
Page 38 of 41
viscosity, etc.) can be used for testing. For example, surrogate test products which are generally regarded as non-toxic or safe should be used if human subjects will be used during testing.
Primary and secondary contact For the initial contact scenario, a cloth saturated with the product should be rubbed over the front and back of both clean, dry hands. For the secondary contact scenario, a cloth saturated with the product should be rubbed over the front and back of both hands for a second time, after as much as possible of the liquid that adhered to skin during the first contact event was removed using a clean cloth. The subject’s hands should then be fully wiped, defined as wiping with a clean dry cloth as thoroughly as possible for 10 seconds. The film thickness is determined by dividing the difference in cloth weight before and after wiping by the surface area of the hand and the density of the prepared product. Four to 6 replicate tests should be conducted and reported.
Immersion To measure the film thickness that results from immersion, the hand should be immersed in the prepared product and then allowed to drip back into the container for 30 seconds. The weight of the container of prepared product should be weighed before and after immersion. The difference in weight of the container divided by the surface area of the hand, normalized by the density of the product is the film thickness. Four to 6 replicate tests should be conducted and reported.
Contact from Handling a Wet Rag To estimate film thickness from handling a wet rag, a cloth saturated with the product should be rubbed over the palms of both hands in a manner simulating handling of a wet cloth. The subject’s hands should then be fully wiped, defined as wiping with a clean dry cloth as thoroughly as possible for 10 seconds. The film thickness is determined by dividing the difference in cloth weight before and after wiping by the surface area of the hand and the density of the prepared product. Four to 6 replicate tests should be conducted and reported.
Contact from Cleaning a Spill A subject should use a clean cloth to wipe up 50 mL of prepared product poured onto a non-porous surface. After cleanup, the subject’s hands should then be fully wiped, defined as wiping with a clean dry cloth as thoroughly as possible for 10 seconds. The film thickness is determined by dividing the difference in cloth weight before and after wiping by the surface area of the hand and the density of the prepared product. Four to 6 replicate tests should be conducted and reported.
Approach for Estimating Migration into Simulated Sweat from Contact with an Article A small or large scale experiment can be used to evaluate sweat facilitated migration from an article onto skin or skin surrogate. The sampling conditions shall be varied based on the chemical, article, and scenario of interest. Parameters that shall be varied include the: - size and thickness of the article, - amount of surrogate sweat applied, - amount and timing of pressure (psi) applied, - size of skin surrogate material used, and - additional barrier present or not present between article surface and surrogate skin material of filter
paper

Page 39 of 41
Preparation of Sweat Artificial sweat or perspiration is the reagent extract solution. Typical components of artificial sweat include water, lactate, urea, sodium, potassium, calcium, and magnesium. Saline solution may be used as a starting point. Because the swelling of water-soluble polymers is suppressed by some metal ions, especially calcium, and by low pH, Marques et al. (2011) provide five different approaches to simulate sweat with different concentrations of calcium and different pH.
- Simulated Sweat 1 (3 milliequivalents of calcium ions): 2.92 mEq/L NaCl, 0.166 mEq/L CaCl2, 0.12 mEq/L MgSO4, and 1.02 mEq/L potassium phosphate monobasic (pH 5.4)
- Simulated Sweat 2 (60 milliequivalents of calcium ions):5.49 mEq/L NaCl, 3.32 mEq/L CaCl2, 0.24 mEq/L MgSO4, and 1.36 mEq/L potassium phosphate monobasic (pH 4.5)
- Simulated Sweat 3 (120 milliequivalents of calcium ions): 5.49 mEq/L NaCl, 6.64 mEq/L CaCl2, 0.24 mEq/L MgSO4, and 1.36 mEq/L potassium phosphate monobasic (pH 4.5)
- Simulated Sweat 4 (240 milliequivalents of calcium ions): 5.49 mEq/L NaCl, 13.28 mEq/L CaCl2, and 0.24 mEq/L MgSO4, 1.36 mEq/L potassium phosphate monobasic (pH 4.5)
- Simulated Sweat 5: 0.5 % (in mass) NaCl, 0.1 % lactic acid, and 0.1 % urea with the recommended volume of simulated fluid (about 1 mL per cm2 sample area)
Preparation of Samples, Extraction, and Analysis A small-scale experiment can be used to evaluate an article coupon with surface area corresponding to a circle with a diameter of 5.5 cm. The article sample is placed in a 600 mL beaker and covered with skin or skin surrogate such as Whatman #2 filter paper large enough to cover the article sample. Two to 4 mL of simulated sweat extract is poured onto the filter paper. The filter paper and article surface are allowed to dry for 6-8 hours, and the filter paper is removed. The surface of the article in the beaker is then covered with another filter paper and the experiment is repeated with the same simulated sweat solution four times, for a total of 5 filter paper samples. It is recommended to consider the application of pressure to the filter paper covered article using a range of weights (i.e. one psi weight measuring 2 inches in diameter and weighing 3.4 lbs, or other weights consistent with typical and high-end dermal contact) in a portion of the replicates. If the article being tested contains a barrier material (i.e., textile covering of a couch cushion), this should be considered in the testing; the replicates should consider migration both with and without the presence of such a barrier between the filter paper and the article. After collection and drying, the five filter replicate paper samples are then extracted and analyzed for the chemical of interest.

Page 40 of 41
Figure 16. Graphic example of small-scale procedure for analyzing migration from product or
article surface to sweat
As an alternative, a large scale experiment could be conducted to evaluate a larger surface area of an article including up to full size (e.g., full couch cushion, pillow, and mattress). The actual surface area and thickness of the article used in the experiment may vary but should be documented. Two filter papers should be placed on the entire surface of the article and wetted with 25 mL of simulated sweat. Note, the amount of simulated sweat may vary depending on the physical activity level and age of an individual so a range of simulated sweat amounts can be considered. One psi weight should be placed on each filter. One weight should be removed after the filter paper is thoroughly wetted; the other should be removed six hours after application of the simulated sweat. The first situation mimics intermittent skin contact with the article while the second mimics continuous skin contact with the article. The surface of the article is then covered with two new dry pieces of filter paper and the experiment is repeated with the same simulated sweat solution four times, for a total of 5 tests with 10 filter paper samples collected. Five replicate tests are done for each sample. If the article being tested contains a barrier material (i.e., textile covering of a couch cushion), this should be considered in the testing; the replicates should consider migration both with and without the presence of such a barrier between the filter paper and the article. The 10 filter paper samples are then extracted and analyzed for the chemical of interest.
Barrier materials and/or the surfaces of the articles themselves may or may not be treated with various chemicals which are intended to promote stain resistance, water repellence, etc. The use of materials with these chemicals added is applicable if representative of the exposure scenario of interest. If a barrier material of any kind is used, the experiments should be repeated five times both with and without the use of the barrier material.
These experiments can be described as surface migration tests which estimate the quantity of chemical that might migrate to the skin from the surface of an article over time under certain conditions of use. Extraction methods and analytical approaches for the skin or skin surrogate such as filter paper will vary based on the chemical and exposure scenario of interest.
Reporting Results and Records Retention: A final report shall be prepared, and records shall be retained in accordance with 40 CFR 792, Subpart J – Records and Reports.
For example, the following key information should be included in the report:
- Sampling and analytical methods ― description or citation, including deviation from standard procedure, if applicable.
- Description of simulated sweat composition (components, weight, volume) - Description of tested material (size, dimensions) - Compliance with applicable human subjects research or other ethical requirements
Page 41 of 41
- QA/QC data: accuracy and precision of measurements
References: Bhooshan, B., (2005). Vinylidene Chloride Testing in Mattress Barrier Samples. Tab H. Pages 535-537,
available at http://www.cpsc.gov/PageFiles/88231/matttabh.pdf Cobb, D. (2005). Migration of Flame retardant Chemicals in Mattress Barriers. Tab H. Pages 542-553,
available at http://www.cpsc.gov/PageFiles/88231/matttabh.pdf Buist, H. E., van Burgsteden, J. A., Freidig, A. P., Maas, W. J., & van de Sandt, J. J. (2010). New in vitro
dermal absorption database and the prediction of dermal absorption under finite conditions for risk assessment purposes. Regulatory Toxicology and Pharmacology, 57(2), 200-209.
EPA Method—Methods for Assessing Consumer Exposure to Chemical Substances, Report EPA/747/R-92/003
EPA Method A Laboratory Method to Determine the Retention of Liquids on the Surface of Hands, Report EPA/560/585/007
Frasch, H. F., Dotson, G. S., Bunge, A. L., Chen, C. P., Cherrie, J. W., Kasting, G. B., Kissel, J.C., Sahmel J., Semple S. and Wilkinson, S. (2014). Analysis of finite dose dermal absorption data: Implications for dermal exposure assessment. Journal of Exposure Science and Environmental Epidemiology, 24(1), 65-73.
Gong, M., Zhang, Y., & Weschler, C.J. (2014). Measurement of Phthalates in Skin Wipes: Estimating Exposure from Dermal Absorption. Environmental Science & Technology, 48, 7428−7435
Marques, M. R., Loebenberg, R., & Almukainzi, M. (2011). Simulated biological fluids with possible application in dissolution testing. Dissolution Technol,18(3), 15-28 (Table 17).
Ng, M. G., Semple, S., Cherrie, J. W., Christopher, Y., Northage, C., Tielemans, E., Veroughstraete, V., & Van Tongeren, M. (2012). The relationship between inadvertent ingestion and dermal exposure pathways: A new integrated conceptual model and a database of dermal and oral transfer efficiencies. Annals of occupational hygiene.
Organization for Economic Co-operation and Development, 2004a. (Test Guideline 428) Skin Absorption-In vitro method.
Organization for Economic Co-operation and Development, 2004b. (Section 4-Other Test Guidelines) Guidance Document for the Conduct of Skin Absorption Studies.
Thomas, T. A., & Brundage, P. M. (2006). Quantitative Assessment of Potential Health Effects from the Use of Fire Retardant Chemicals in Mattresses. CPSC. Tab D. Section 2. Methods. Pages 10 -13, available at http://www.cpsc.gov/PageFiles/88208/matttabd.pdf
Thomas, T. A., & Brundage, P. M. (2006). Quantitative Assessment of Potential Health Effects from the Use of Fire Retardant Chemicals in Mattresses. CPSC. Tab D. Appendix 2. Experimental Protocol Flow Chart. Pages 239-242, available at http://www.cpsc.gov/PageFiles/88208/matttabd.pdf
Weschler, C.J., Bekö, G., Koch, M., Salthammer, T., Schripp, T., Toftum, J. & Claesen, G. (2015) Transdermal Uptake of Diethyl Phthalate and Di(n-butyl) Phthalate Directly from Air: Experimental Verification. Environmental Health Perspectives, http://dx.doi.org/10.1289/ehp.1409151.