INDOOR AIR QUALITY SURVEY REPORT LITERATURE BUILDING UNIVERSITY OF
154
INDOOR AIR QUALITY SURVEY REPORT LITERATURE BUILDING UNIVERSITY OF CALIFORNIA, SAN DIEGO LA JOLLA, CALIFORNIA PREPARED FOR: University of California, San Diego 9500 Gilman Drive, CSC-Fm/c0958 La Jolla, California 92093 PREPARED BY: Ninyo & Moore Geotechnical and Environmental Sciences Consultants 5710 Ruffin Road San Diego, California 92123 November 6, 2009 (Revised December 11, 2009) Project No. 106702001
Transcript of INDOOR AIR QUALITY SURVEY REPORT LITERATURE BUILDING UNIVERSITY OF

INDOOR AIR QUALITY SURVEY REPORT LITERATURE BUILDING
UNIVERSITY OF CALIFORNIA, SAN DIEGO LA JOLLA, CALIFORNIA
PREPARED FOR: University of California, San Diego
9500 Gilman Drive, CSC-Fm/c0958 La Jolla, California 92093
PREPARED BY: Ninyo & Moore
Geotechnical and Environmental Sciences Consultants 5710 Ruffin Road
San Diego, California 92123
November 6, 2009 (Revised December 11, 2009)
Project No. 106702001

Literature Building, UCSD Revised December 11, 2009 La Jolla, California Project No. 106702001
106702001 R Rev2.doc i
TABLE OF CONTENTS Page
EXECUTIVE SUMMARY .............................................................................................................1
1. INTRODUCTION ....................................................................................................................4
2. INVOLVED PARTIES ............................................................................................................4
3. FIELD OBSERVATIONS........................................................................................................4
4. VENTILATION AND GENERAL INDOOR AIR QUALITY (IAQ) ....................................5
5. AIR SAMPLING......................................................................................................................6 5.1. Evacuated Canister Samples.........................................................................................6 5.2. Sorbent Tube Samples ..................................................................................................6
6. GENERAL DISCUSSION AND INTERPRETATION OF RESULTS ..................................7 6.1. Temperature and Relative Humidity ............................................................................7 6.2. Carbon Monoxide .........................................................................................................7 6.3. Carbon Dioxide.............................................................................................................8 6.4. Ultra-Fine Particles.......................................................................................................8 6.5. Volatile Organic Analytes ............................................................................................9 6.6. Sorbent Tube Sampling for Aldehydes and PAHs .....................................................11
7. CONCLUSIONS AND RECOMMENDATIONS .................................................................11
8. LIMITATIONS.......................................................................................................................12
Tables Table 1 − Summary of Indoor Air Quality Measurements Table 2 – TO-15 Analysis Results Table 3 – Aldehyde Scan Analysis Results Table 4 – Polynuclear Aromatic Hydrocarbon Results
Appendices Appendix A – Volatile Organics Laboratory Report and Chain-of-Custody Documentation Appendix B – Aldehyde Scan Laboratory Report and Chain-of-Custody Documentation Appendix C – Polynuclear Aromatic Hydrocarbon Laboratory Report and Chain-of-Custody Documentation

Literature Building, UCSD Revised December 11, 2009 La Jolla, California Project No. 106702001
106702001 R Rev2.doc 1
EXECUTIVE SUMMARY
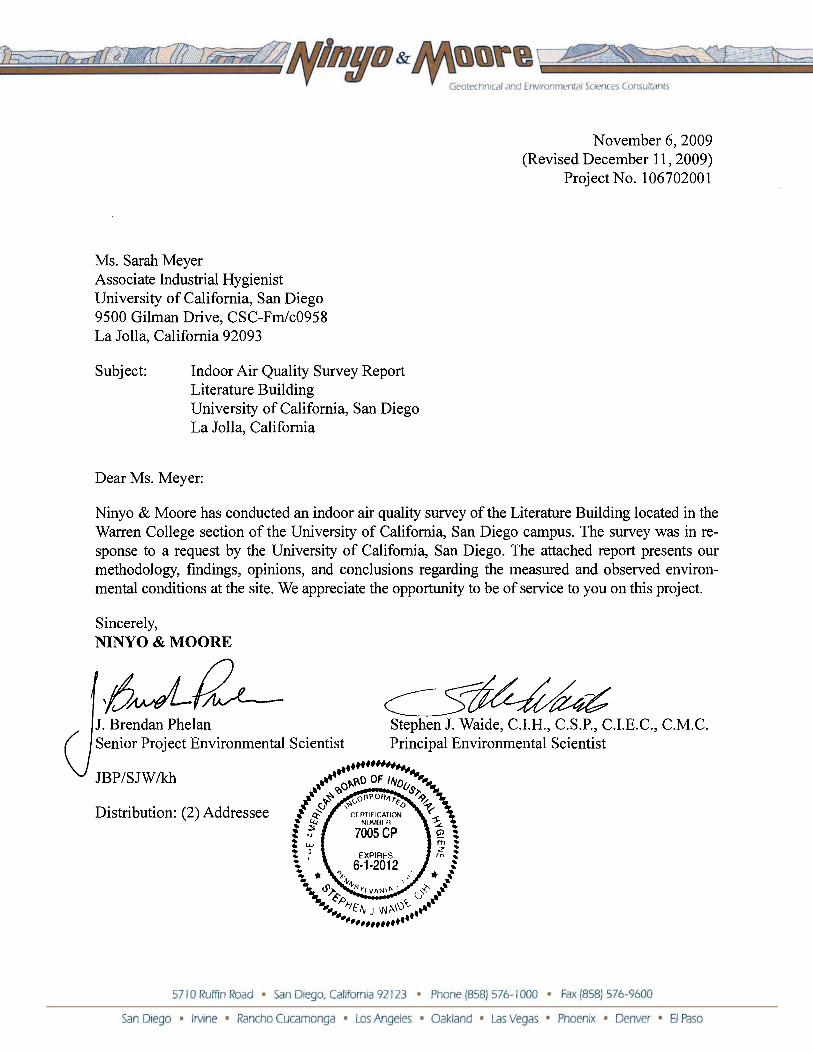
Ninyo & Moore was retained by the University of California, San Diego (UCSD) to perform in-door air quality studies of the Literature Building in response to indoor air quality concerns. The Literature Building is located in the Warren College section of the University of California, San Diego campus and the concern was that airborne contaminants may be present within the building envelope. Field activities were performed on October 8 and 9, 2009.
Sampling of various air quality parameters included temperature, relative humidity, carbon mon-oxide (CO) levels, carbon dioxide (CO2) levels, ultra-fine particles, and a broad spectrum of volatile organic analytes. To summarize the findings of the assessment, the facility’s indoor air quality (IAQ) can be characterized by the following major points:
• Temperature and relative humidity were assessed within the Literature Building to determine if these air quality parameters fall outside recommended ranges. Measurement of these parame-ters outside of recommended ranges can sometimes be indicative of problems with building design or maintenance. On October 8 and 9, 2009 the average temperature inside the building was in the low to mid-70’s and the indoor relative humidity ranged from the low to high 50’s. These conditions were found to be within the American Society of Heating, Refrigerating and Air Conditioning Engineers (ASHRAE) Standard 55 comfort parameters of 68 to 74.5 degrees Fahrenheit (wintertime) and 30 percent to 65 percent relative humidity.
• Direct-reading instruments showed CO levels in measured areas of the building to be 1 part per million (ppm) or less. The United Sates Environmental Protection Agency (USEPA) has set National Primary Ambient Air Quality Standards for Outdoor Air to be used in locating ventilation sources for buildings. Exposure limits for CO are a maximum of 35 ppm for one hour, not more than one time per year, or 9 ppm over any eight-hour period. The Ameri-can Conference of Governmental Industrial Hygienists (ACGIH) and US Occupational Safety and Health Administration (OSHA) have also set similar maximum exposure limits in the Industrial Workplace Standard. There are no federal regulations governing CO exposure limits in non-industrial indoor environments. In any case, concentrations of CO, as meas-ured in the Literature Building, are not considered significant.
• CO2 is a good indicator of proper ventilation within a building environment and the ASHRAE’s Standard 62 recommends an indoor level not to exceed 650 ppm above outdoor ambient air. Direct-reading instruments employed during the study showed CO2 levels in measured areas of the Literature Building to be generally between 420 and 700 ppm, in comparison to the measured outdoor levels at approximately 390 to 400 ppm. This is con-sidered within the recommended balance of outdoor to re-circulated indoor air.
• A photo-ionization detector (PID), with a detection limit in the parts per billion (ppb) range, was utilized to detect any ambient volatile organic compounds within the Literature Building in real time. The intent was to use this qualitative instrument to locate areas of high organic vapor (or “hot-spots”) for further sampling. Indications of organic vapor were carefully docu-

Literature Building, UCSD Revised December 11, 2009 La Jolla, California Project No. 106702001
106702001 R Rev2.doc 2
mented, however, volatile organic vapors in excess of 5 ppb were not noted during the assess-ment.
• A condensation particle counter was used to assess any unusual condition associated with the presence of ultra-fine particles (UFPs) that were present, resulting from sources of combustion or chemical reaction, not previously detected. Respiration of UFPs challenges the body’s natural defense mechanisms and overexposure may strain these mechanisms, causing an adverse reaction. Measurements of UFPs within the Literature Building during this assessment were generally well within acceptable parameters for indoor air and the only unusual condition noted appears to be a transitory elevated reading within Room 441. No apparent source was readily identified for this elevated UFP reading. A representative of the UCSD Environment, Health and Safety office collected an additional set of UFP readings of Room 441 on December 1, 2009, and reported that the UFP readings were consistent with measurements collected from outdoors and the first floor of the Literature Building.
• Evacuated canisters were utilized in a number of different areas within the Literature Build-ing, with exact locations chosen by the Literature Building Committee. The canisters were submitted to a laboratory for subsequent analysis via Mass Spectroscopy. The analytical method (USEPA Method TO-15) included analysis of a broad spectrum of volatile organic vapor analytes. Some chemicals, most commonly associated with household cleaning prod-ucts, were detected in the parts per billion range, including ethanol, acetone, and isopropyl alcohol. The levels of the detected compounds were present in concentrations that should not cause concern (i.e., compounds were present in the parts per billion range, not parts per million range). These compounds were also found in similar low concentrations in both of the control buildings and in the outdoor sample collected on the second day of sampling activities. Toxic compounds or compounds widely recognized as being carcinogenic were not identified in the laboratory analysis.
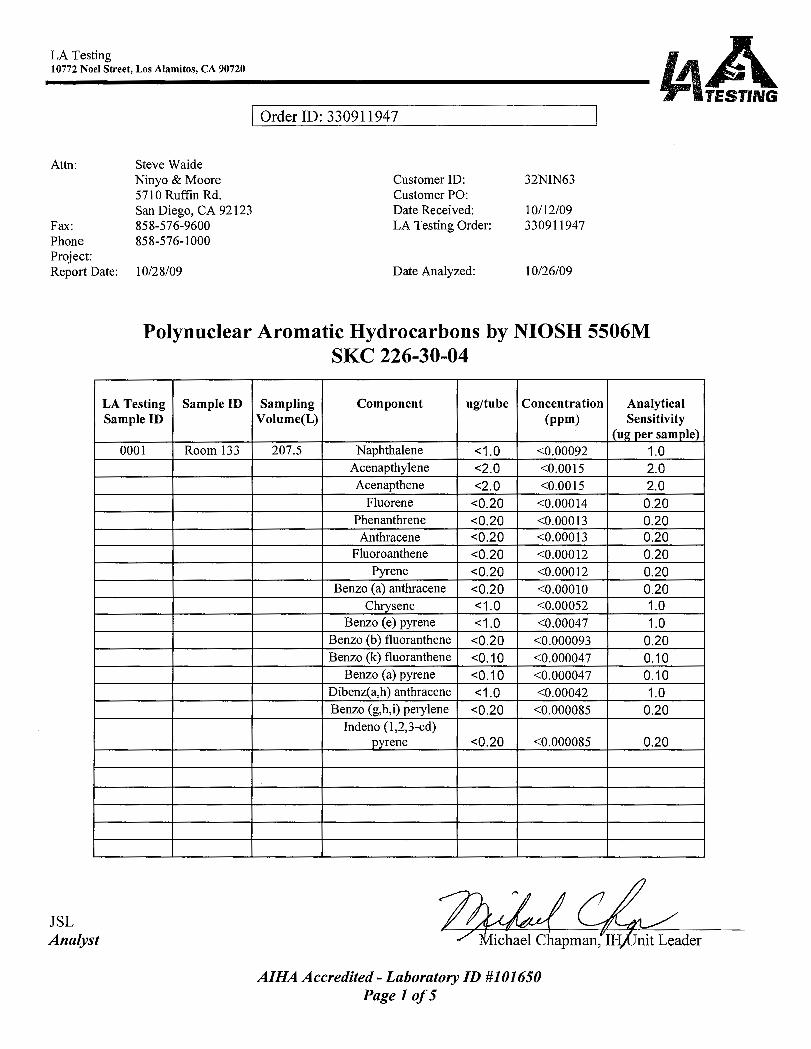
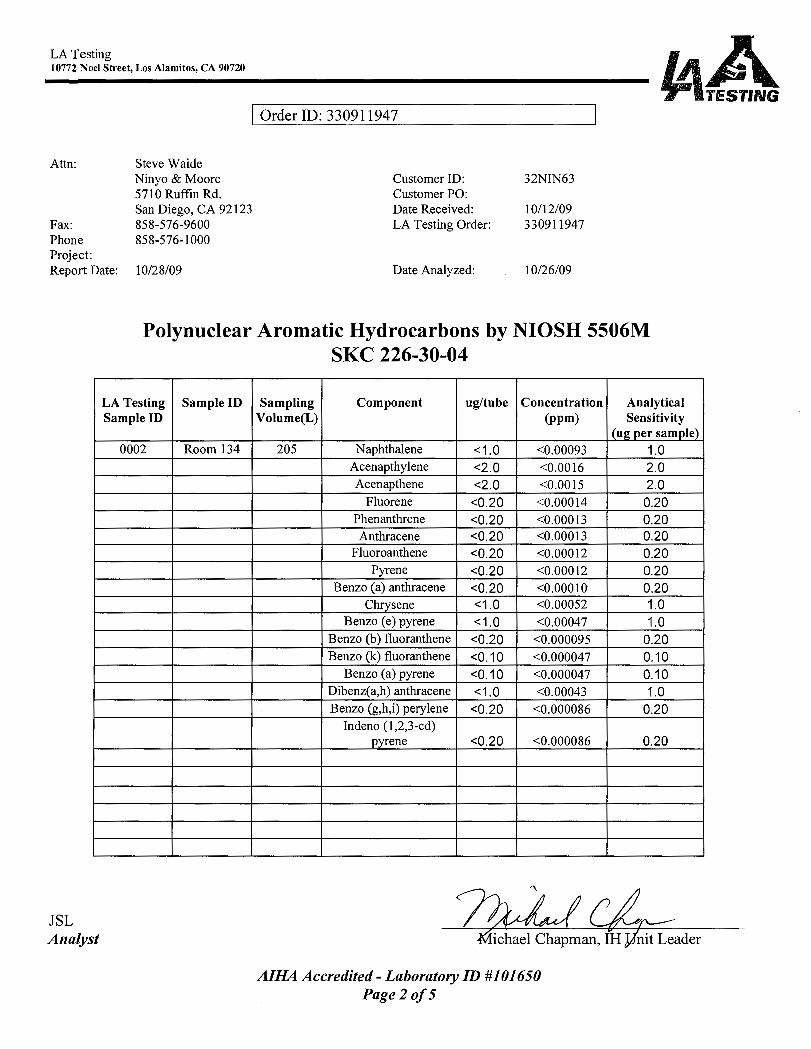
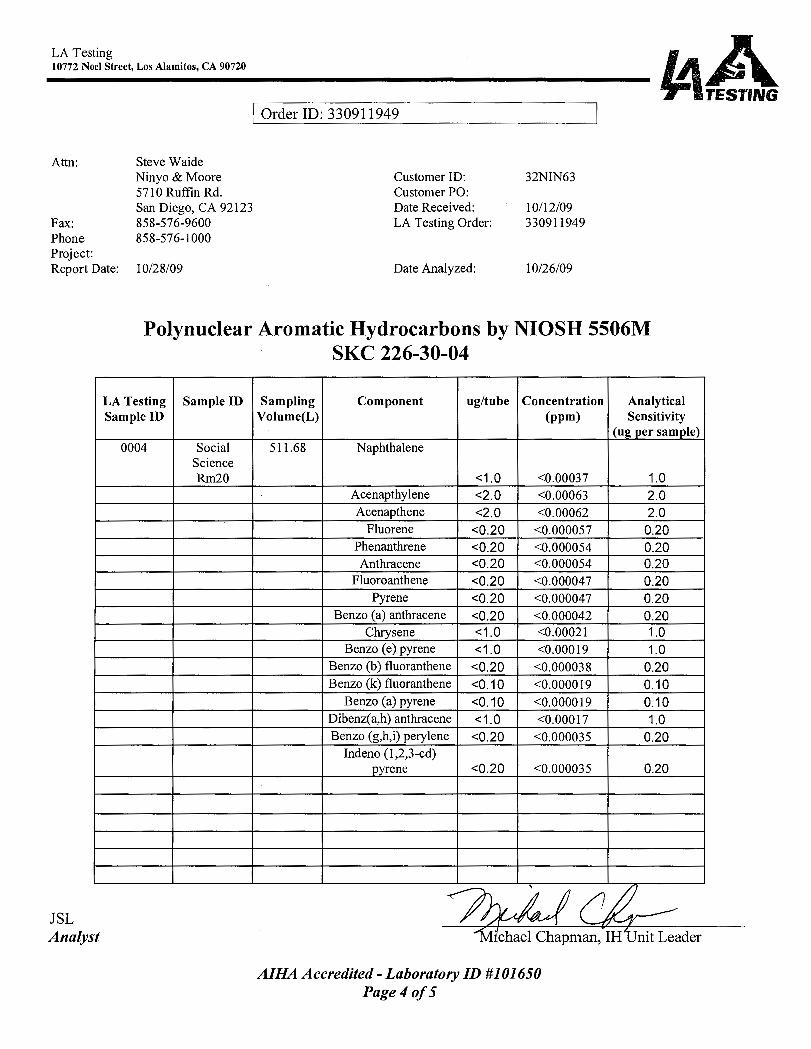
• Sorbent tubes were used for sampling for polynuclear aromatic hydrocarbons (PAHs) for analysis by National Institute for Occupational Safety and Health (NIOSH) Method 5506. The analysis included anthracene, benzoapyrene, chrysene, phenanthrene and pyrene among other known carcinogenic compounds. Locations mirrored the canister sampling described above. These analytes were not detected above the method detection limit (generally in the parts per billion range) in any of the samples collected.
• Sorbent tubes were used for sampling for aldehydes for analysis by NIOSH Method 2016. The analysis included acid aldehyde, acetone, acrolein, benzaldehydes, butyraldehydes, chrotonaldehydes, propionaldehyde and formaldehyde. Again, sampling locations mirrored the canister sampling, which were located according to Literature Building Committee instructions. In the samples collected, formaldehyde and acetaldehyde were detected in the majority of the samples, however, the concentrations of these compounds were in the part-per-billion range. Similar low concentrations of formaldehyde and acetaldehyde were also found in the samples collected from within both of the control buildings. Concentrations of acetone was also detected in two samples and in one of the control building samples. Low

Literature Building, UCSD Revised December 11, 2009 La Jolla, California Project No. 106702001
106702001 R Rev2.doc 3
concentrations of formaldehyde, acetaldehyde, and acetone, as found in this study, are often detectable in indoor environments and should not be considered abnormal or problematic at the detected low concentrations.
• In addition to the findings above, a visual evaluation was performed of the main air handling unit on the roof of the building and several of the intermediary units located on the first floor. No evidence of biological growth or standing water was noted within the heating, ven-tilation, and air conditioning units evaluated, nor was any significant moisture condition or unusual finding noted in or around these units. In addition, no evidence of past moisture-related issues that might cause an adverse condition were observed within the air handling units on the roof or first floor of the building, accessible plenum returns, or in filtration ap-paratus during this assessment.
In summary, during on-site investigation, Ninyo & Moore could not find evidence to corroborate a health concern nor did our own sampling and subsequent analytical testing indicate an untoward condition. Based on all of the findings mentioned above, no further action is recommended con-cerning further specialized investigation of indoor air quality in the Literature Building at this time.
Literature Building, UCSD Revised December 11, 2009 La Jolla, California Project No. 106702001
106702001 R Rev2.doc 4
1. INTRODUCTION
Ninyo & Moore was retained by the University of California, San Diego, to perform indoor air
quality studies in response to concerns regarding indoor air quality. The Literature Building is
located in the Warren College section of the University of California, San Diego campus and the
concern was that possible airborne contaminants may be present within the building envelope.
Field activities were performed on October 8 and 9, 2009.
2. INVOLVED PARTIES
Mr. Stephen Waide, a Ninyo & Moore Certified Industrial Hygienist (CIH 7005CP), Certified Indoor
Environmental Consultant (CIEC 0611042) and Certified Microbial Consultant (CMC 0608087)
designed the assessment, performed field observations and data analysis, and provided project over-
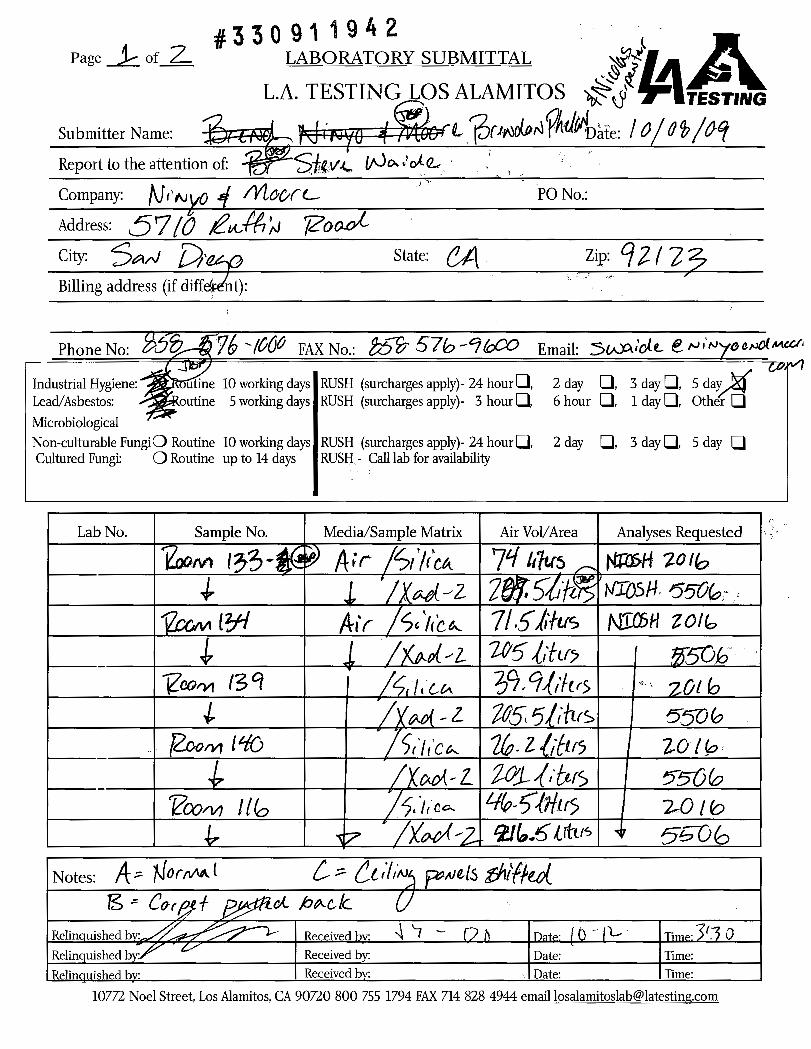
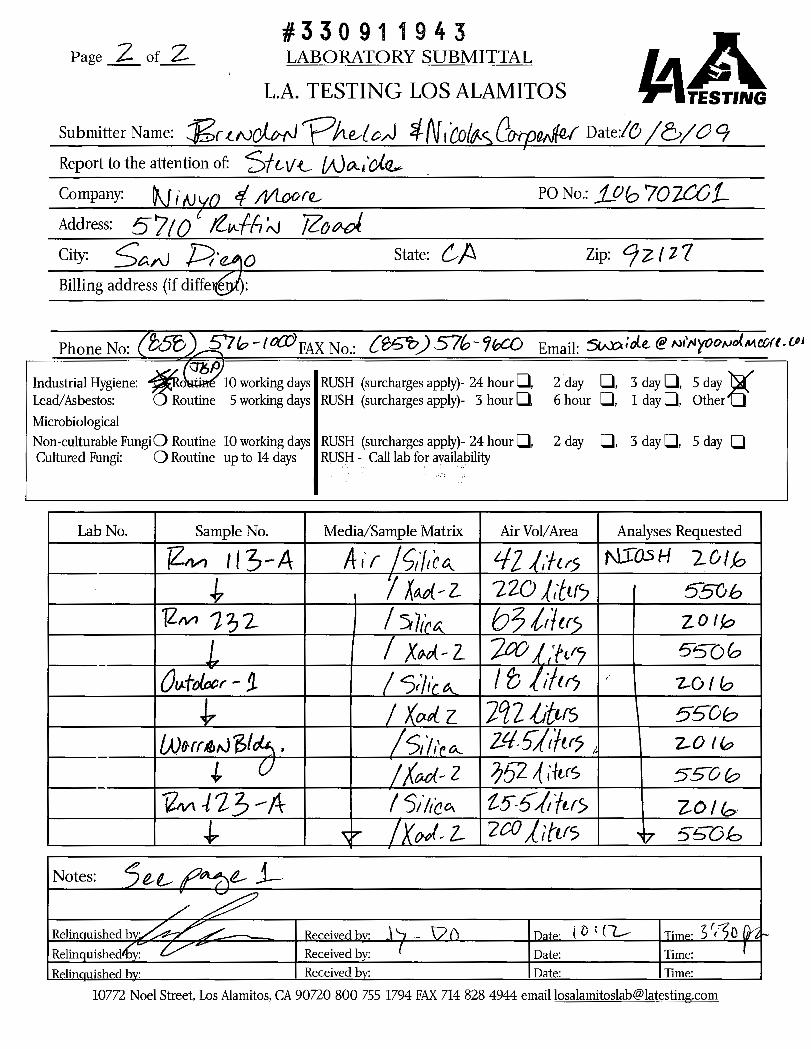
sight and quality review. Air sampling was performed by Mr. Waide, Mr. J. Brendan Phelan, and Mr.
Nicolas Carpenter on October 8 and 9, 2009. Mr. Waide, Mr. Phelan, and Mr. Carpenter were ac-
companied by Professor Roddy Reid of the UCSD Literature Building Committee, Professor Dan
Donahue, and Ms. Daphne Thaung (CIH) of the UCSD Environment, Health and Safety office dur-
ing site reconnaissance and sampling activities. Building air handling units, located in a mechanical
room on the fifth floor of the building and in interstitial ceiling plenums on the first floor of the
building, were observed on the first day of sampling.
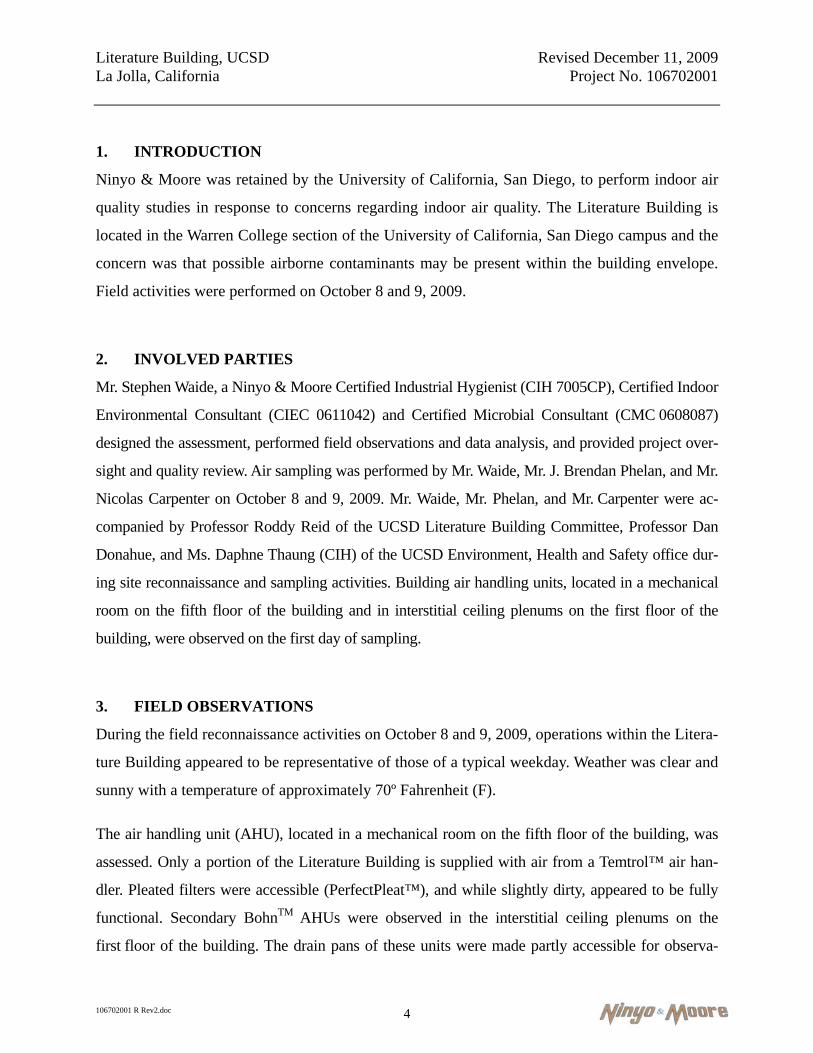
3. FIELD OBSERVATIONS
During the field reconnaissance activities on October 8 and 9, 2009, operations within the Litera-
ture Building appeared to be representative of those of a typical weekday. Weather was clear and
sunny with a temperature of approximately 70º Fahrenheit (F).
The air handling unit (AHU), located in a mechanical room on the fifth floor of the building, was
assessed. Only a portion of the Literature Building is supplied with air from a Temtrol™ air han-
dler. Pleated filters were accessible (PerfectPleat™), and while slightly dirty, appeared to be fully
functional. Secondary BohnTM AHUs were observed in the interstitial ceiling plenums on the
first floor of the building. The drain pans of these units were made partly accessible for observa-

Literature Building, UCSD Revised December 11, 2009 La Jolla, California Project No. 106702001
106702001 R Rev2.doc 5
tion. Visible interior areas of the units were observed to be dry and relatively clean. Neither debris,
mold growth, nor standing water was observed in the drain pans underneath the secondary AHUs.
4. VENTILATION AND GENERAL INDOOR AIR QUALITY (IAQ)
An assessment of major air handling systems was conducted using a calibrated Q-Track Plus,
Model 8554 IAQ meter produced by TSI Instruments. Measurements of temperature (Temp),
relative humidity (rH), carbon monoxide (CO), and carbon dioxide (CO2) were collected
throughout the Literature Building. Assessments were conducted in the morning of October 8,
2009, and in the afternoon of October 9, 2009. Measurements of these parameters were also ob-
tained from the outdoor environment for comparative analysis. Pressure differentials were
assessed with ventilation smoke tubes for areas adjacent to the common areas (hallways). Visual
observation of the generated smoke generally indicated an appropriate movement of air includ-
ing negative pressure to the restrooms on each of the three floors of the building.
The heating, ventilation, and air conditioning (HVAC) system appeared to be appropriate for the
size of, and activities in, the Literature Building. Measurements of temperature, relative humid-
ity, CO, and CO2 within the facility all fell within normal ranges and indicates the system is
capable of delivering sufficient outdoor air. Measurements obtained of temperature, relative hu-
midity, CO, and CO2 are presented in Table 1.
The following is a summary of the readings obtained, with a further discussion of these reading
provided in Section 6:
• Temp – On October 8, 2009, the temperature within the Literature Building ranged from approximately 70 to 75º F while the outside temperature the building was approximately 70º F. On October 9, 2009, the temperature within the Literature Building ranged from approxi-mately 73 to 75º F while the outside temperature was approximately 73º F.
• rH – On October 8, 2009, the relative humidity was approximately 52 to 55 percent, while the outside relative humidity was 52 percent. On October 9, 2009, the relative humidity was approximately 52 to 60 percent, while the outside relative humidity was 53 percent.
• CO – On October 8 and 9, 2009, the carbon monoxide readings within the Literature Build-ing and outside the building were generally less than 1 part per million (ppm).

Literature Building, UCSD Revised December 11, 2009 La Jolla, California Project No. 106702001
106702001 R Rev2.doc 6
• CO2 – On October 8, 2009, carbon dioxide readings ranged from 450 to 610 ppm inside the Literature Building, while carbon dioxide readings were 390 ppm. On October 9, 2009, car-bon dioxide readings ranged from 420 to 700 ppm inside the Literature Building, while carbon dioxide readings were 400 ppm
5. AIR SAMPLING
Air samples were obtained from the Literature Building for the analysis of volatile organic va-
pors, polynuclear aromatic hydrocarbons, and aldehydes to aid in evaluation of the indoor air
quality. Descriptions of both evacuated canisters and sorbent tube sampling methods follow:
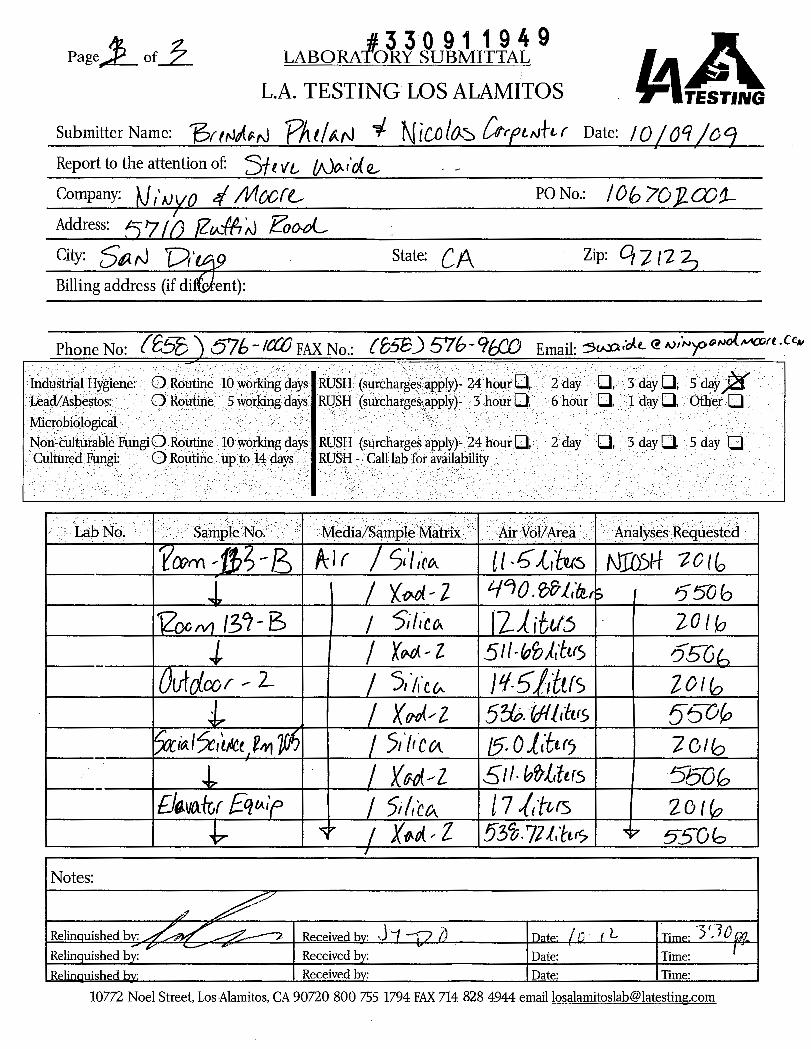
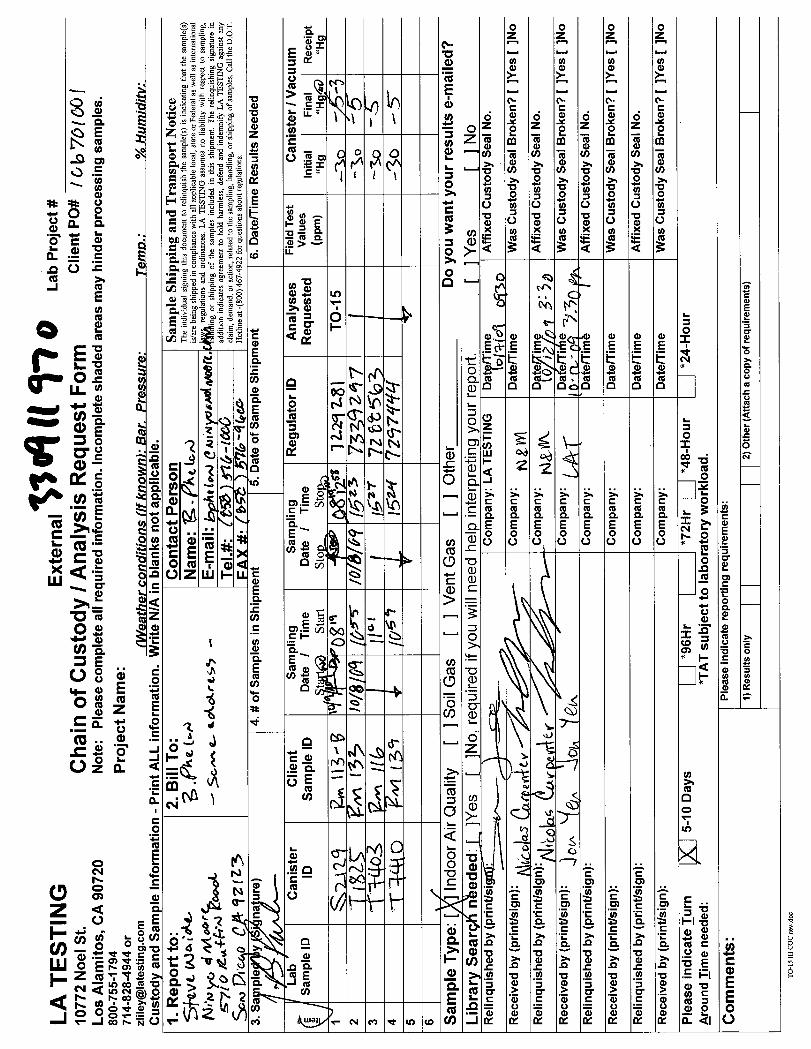
5.1. Evacuated Canister Samples
A total of 22 evacuated canisters were utilized during this assessment to capture a representative
sample of indoor air for subsequent analysis via Mass Spectroscopy. The analytical method in-
cluded analysis of a broad spectrum of volatile organic vapor analytes. The 6-liter evacuated
canisters were supplied and pre-cleaned by LA Testing of Los Alamitos, California. The ap-
proximate four-hour samples were collected by opening the valve on each canister to collect a
sample of the air within the specified room until the canister obtained nearly equalized pressure
with ambient surroundings. Each evacuated canister was then labeled with an identification
number, documented on a chain-of-custody form, and submitted to the laboratory for analysis
by the United Sates Environmental Protection Agency (USEPA) Method TO-15. The samples
were submitted to LA Testing, an AIHA Industrial Hygiene Accredited Laboratory. Laboratory
reports and chain-of-custody documentation are presented in Appendix A.
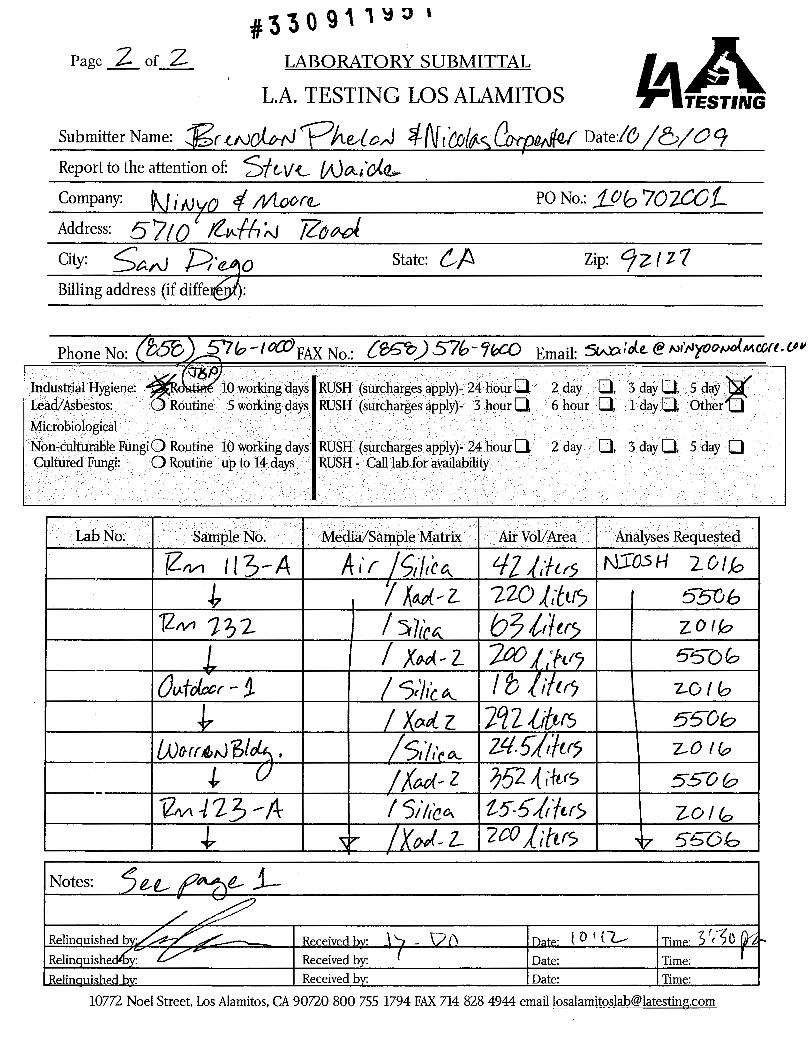
5.2. Sorbent Tube Samples
Air samples collected for the evaluation of PAHs and aldehydes were collected using glass
sorbent tubes and personal sampling pumps. The sampling pumps were calibrated to 0.50 li-
ters per minutes for the aldehyde samples and to 2.0 liters per minute for the PAH samples,
in accordance with the appropriate National Institute for Occupational Safety and (NIOSH)
Method. The sorbent tubes used for the aldehyde samples was filled with a silica gel treated

Literature Building, UCSD Revised December 11, 2009 La Jolla, California Project No. 106702001
106702001 R Rev2.doc 7
with 2,4-dinitrophenylhydrazine, while the sorbent tubes used for the PAH samples was
filled was XAD-2 resin. The sorbent tubes were provided to Ninyo & Moore by LA Testing.
After sample collection, the ends of each sorbent tube were capped and each tube was
placed in a labeled sample identification bag, which was kept in a chilled cooler. The sam-
ples were transferred to LA Testing for analysis.
The aldehyde samples were analyzed using NIOSH Method 2016M, which utilizes High Per-
formance Liquid Chromatography (HPLC) and Ultraviolet (UV) detection. The PAH samples
were analyzed using NIOSH Method 5506M, which utilizes HPLC and Fluores-
cence/Ultraviolet detection. Laboratory analytical reports and chain-of-custody documentation
are presented in Appendices B and C.
6. GENERAL DISCUSSION AND INTERPRETATION OF RESULTS
The following sections present a discussion of the results for the general IAQ parameters ob-
tained and the air samples collected for identification and analysis of volatile organic
compounds.
6.1. Temperature and Relative Humidity
On October 8 and 9, 2009, the average temperature inside the building was in the low to
mid-70’s and the indoor relative humidity ranged from the low to high 50’s. These condi-
tions were found to be within the American Society of Heating, Refrigerating and Air
Conditioning Engineers (ASHRAE) Standard 55 comfort parameters of 68 to 74.5 degrees
Fahrenheit (wintertime) and 30 percent to 65 percent relative humidity.
6.2. Carbon Monoxide
Direct instrument readings indicated that CO concentrations in the surveyed areas were less
than 1 ppm. Although there are no federal regulations governing CO exposure limits in non-
industrial indoor environments, USEPA has set National Primary Ambient Air Quality Stan-
dards for Outdoor Air to be used in locating ventilation sources for buildings. Exposure

Literature Building, UCSD Revised December 11, 2009 La Jolla, California Project No. 106702001
106702001 R Rev2.doc 8
limits for CO have been established at a maximum of 35 ppm for one hour, not more than
one time per year, or 9 ppm over any eight-hour period. The American Conference of Gov-
ernmental Industrial Hygienists (ACGIH) and the Occupational Safety and Health
Administration (OSHA) have established similar maximum exposure limits in the Industrial
Workplace Standard. In view of these guidelines, the CO concentrations measured in the
surveyed areas are not considered significant.
6.3. Carbon Dioxide
CO2 is a good indicator of proper ventilation within a building environment and the ASHRAE’s
Standard 62 recommends an indoor level not to exceed 650 ppm above outdoor ambient air.
Carbon dioxide concentrations above 1,000 ppm can cause occupants to feel sluggish and may
be indicative of low ventilation rates. Direct-reading instruments employed during the study
showed CO2 levels in measured areas of the facility to be generally between 420 and 700 ppm,
in comparison to the measured outdoor levels at approximately 390 to 400 ppm. This is consid-
ered within the recommended balance of outdoor to re-circulated indoor air although
background (outdoor) levels appeared slightly elevated during the day of the study.
6.4. Ultra-Fine Particles
A condensation particle counter was used to assess any unusual condition associated with
the presence of ultra-fine particles (UFPs) that were present, resulting from sources of
combustion or chemical reaction, not previously detected. Respiration of UFPs challenges
the body’s natural defense mechanisms and overexposure may strain these mechanisms,
causing an adverse reaction. Measurements of UFPs within the Literature Building during
this assessment were generally well within acceptable parameters for indoor air and the only
unusual condition noted was an elevated measurement of UFPs within Room 441. No ap-
parent source was readily identified for what appears to have been either a transitory
elevated UFP reading or a transcribing error. A representative of the UCSD Environment,
Health and Safety office collected an additional set of UFP readings of Room 441 on De-

Literature Building, UCSD Revised December 11, 2009 La Jolla, California Project No. 106702001
106702001 R Rev2.doc 9
cember 1, 2009, and reported that these readings were consistent with measurements col-
lected from outdoors and the first floor of the Literature Building.
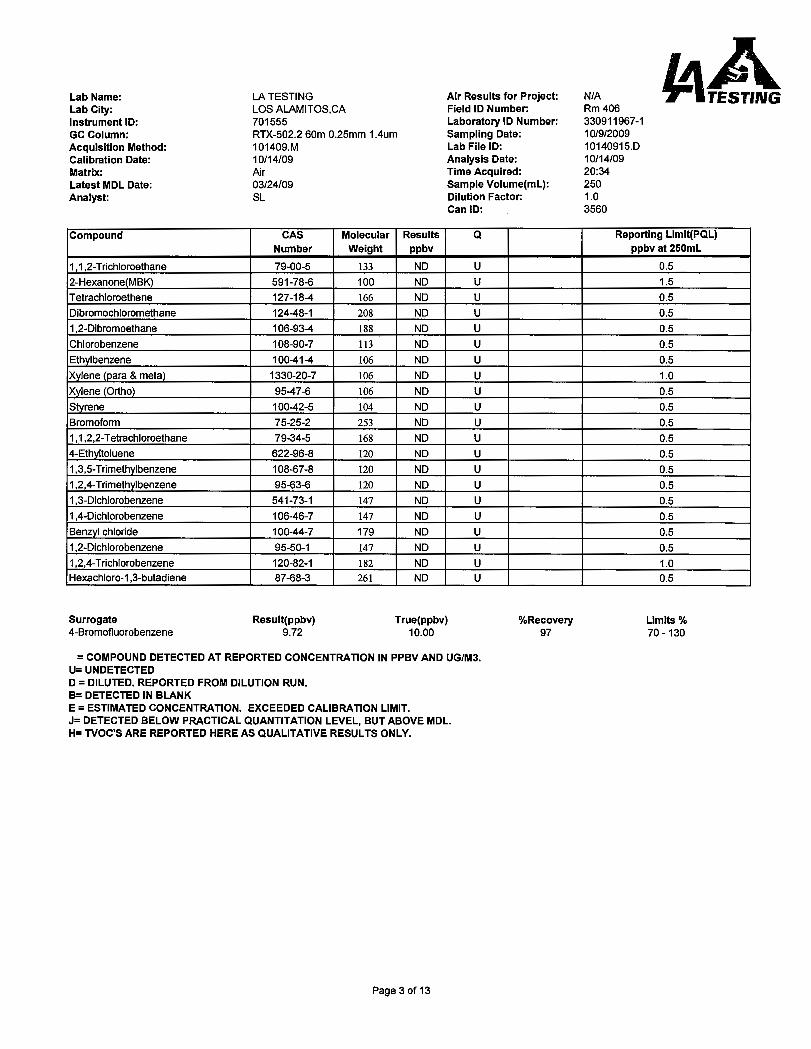
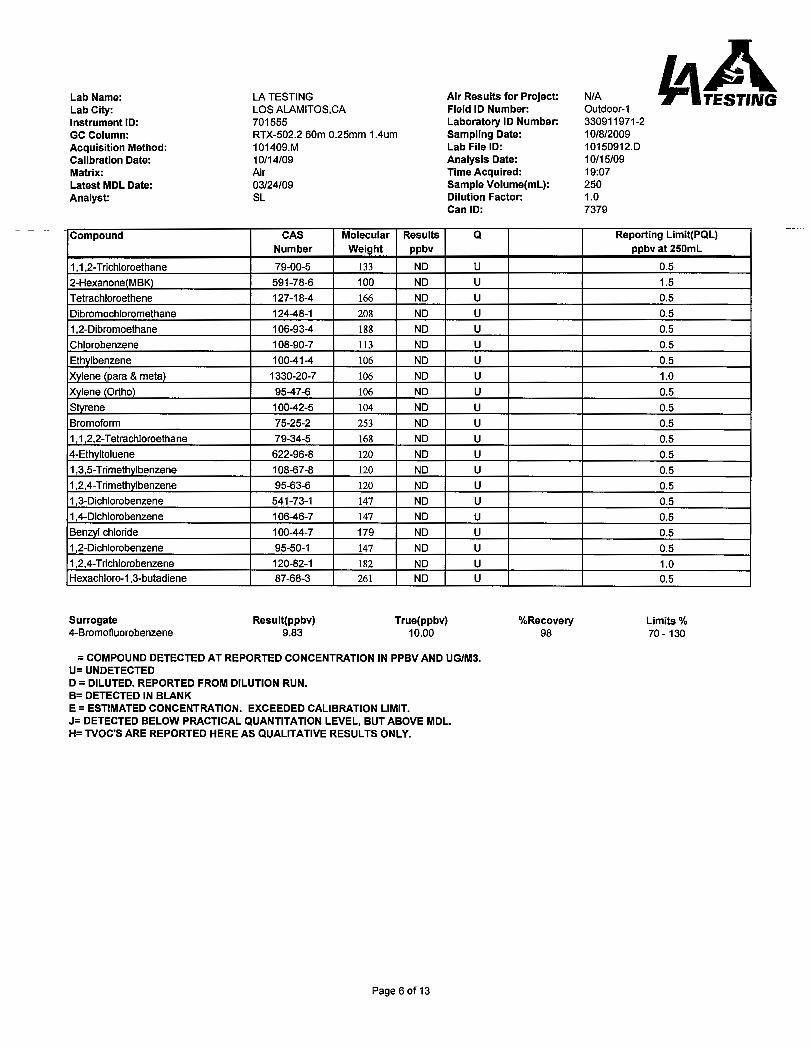
6.5. Volatile Organic Analytes
Evacuated canisters were utilized in numerous areas of the Literature Building to capture a
representative sample of the indoor air for subsequent analysis via Mass Spectroscopy. The
analytical method (USEPA Method TO-15) included analysis of a broad spectrum of volatile
organic vapor analytes as shown in Appendix A. Exact sampling locations were chosen by
the Literature Building Committee. At the direction of the Literature Building Committee,
duplicate samples were collected in Rooms 113, 123, and 129. “Normal” conditions within
the room were identified with an “-A” modifier following the room location or where simply
stated as the room location. Duplicate samples were collected after the carpet in the rooms
were pulled back to expose the bare concrete. Samples collected during this variation were
identified with a “-B” modifier following the room location. In Rooms 113 and 139 only,
further duplicate samples were collected after the drop-in, acoustic ceiling panels had been
displaced to expose the metal ceiling deck above. Samples collected during this variation
were identified with a “-C” modifier following the room location.
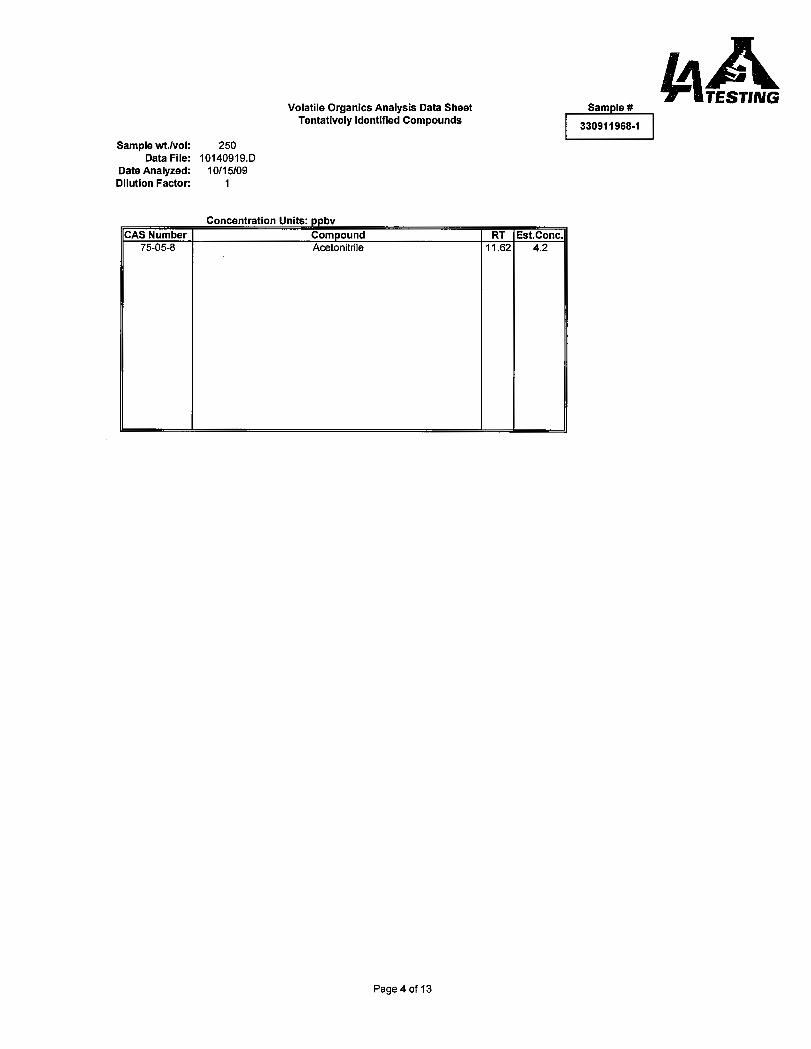
The laboratory analytical report indicated that acetone, ethanol, isopropanol and acetonitrile
were detected in nearly all of the evacuated canister samples, including both control build-
ings and one of the outdoor samples. Acetone, ethanol and isopropanol can almost always be
found in indoor environments at low concentrations due to their presence in common house-
hold cleaning products. The low concentrations detected were indicative of levels normally
seen in indoor air quality investigations. The levels of the detected compounds were present
in concentrations that should not cause concern (i.e., compounds were present in the parts
per billion range, not parts per million range).
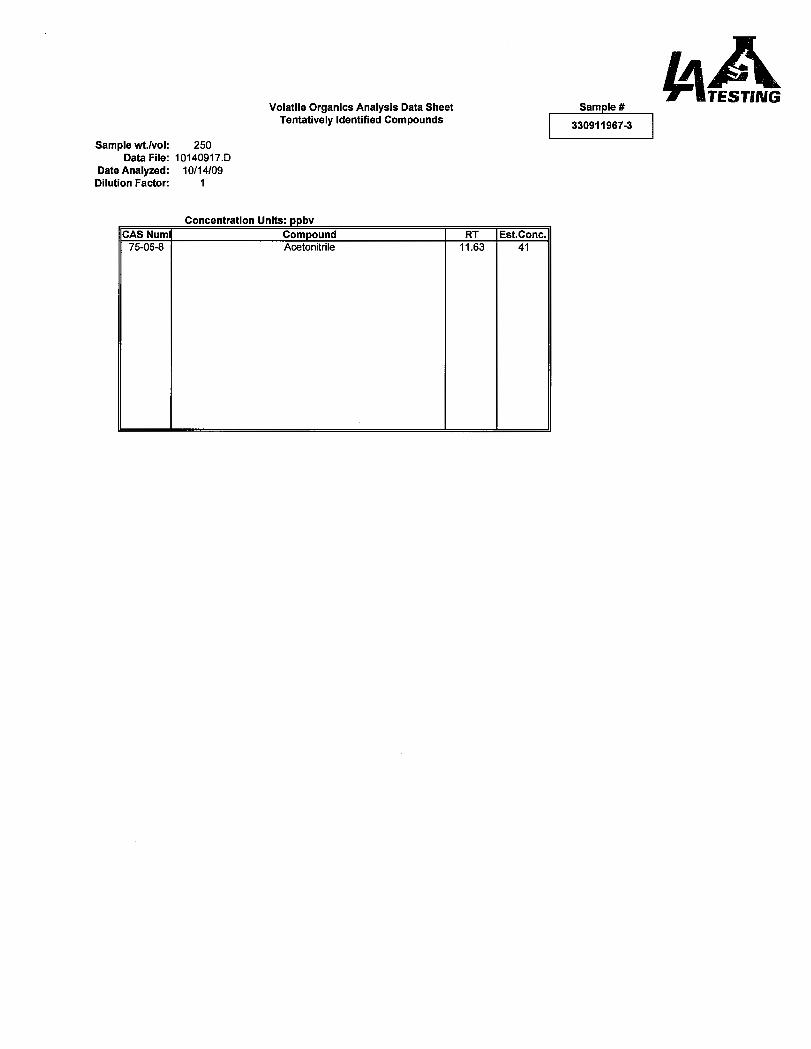
Acetonitrile is commonly used in organic synthesis, acrylic fibers, pharmaceuticals, perfumes,
room fresheners, and in nitrile rubber. While the source is not immediately apparent, acetoni-

Literature Building, UCSD Revised December 11, 2009 La Jolla, California Project No. 106702001
106702001 R Rev2.doc 10
trile in these low concentrations is not of particular concern, as the concentration would need
to be over two orders of magnitude larger to approach any recognized exposure limit.
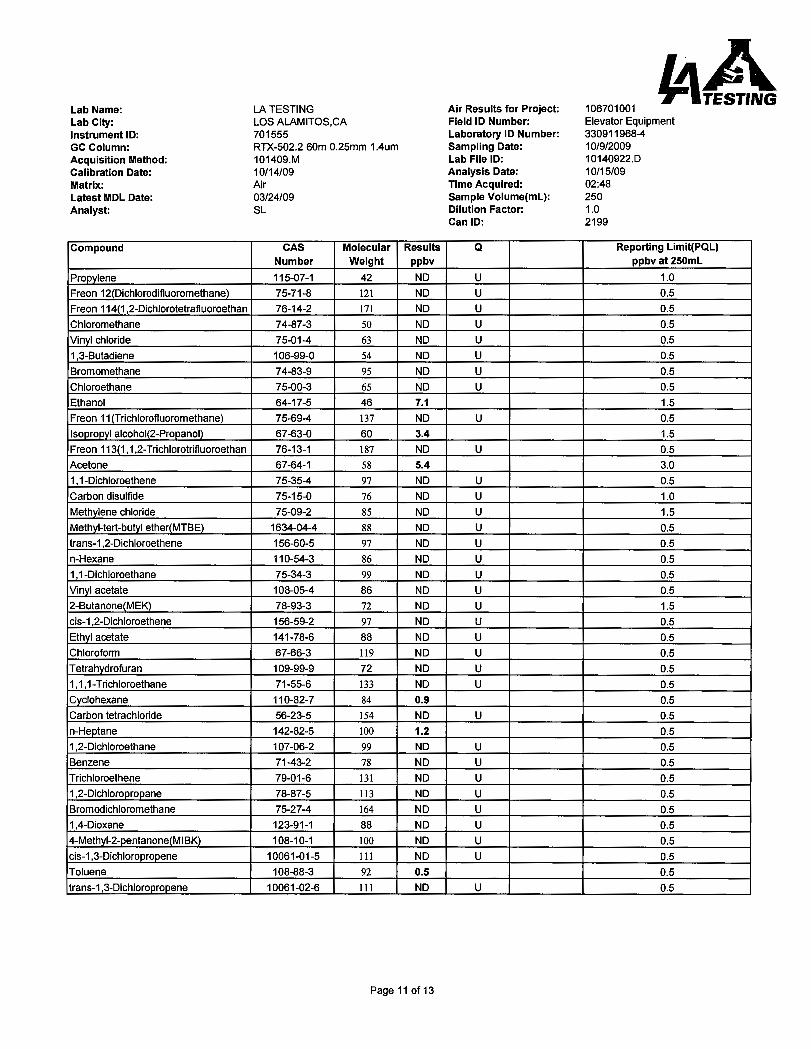
The Elevator Equipment Room represented an outlier in the study as many trace organic com-
pounds were present, however none are generally recognized as toxic and these organic
compounds were present at concentrations measured in the parts per billion range. This room
was not expected to represent a normal indoor air environment and the results are not unusual
for an environment with working mechanical, electrical and hydraulic equipment. In addition,
these organic compounds were not found in the analysis of the samples collected from the hall-
way outside the Elevator Equipment Room, in the adjacent Room 123, and in the Elevator Car.
The other contaminants found in what were considered trace amounts in occupied areas in-
cluded toluene, 1,1-difluoroethane, 2-methyl-3-pentanone (MIBK), tetrachloroethene and
Freon 11. Toluene, detected in the samples collected in the Elevator Room, Room 454, and
in one of the outdoor samples, could come from a product like WD-40 or petroleum prod-
ucts used outside. The 1,1-difluoroethane and Freon 11, found in Room 123-B, Room 232,
and Room 139-B are both refrigerants, with the likely source being air conditioners or small,
office-sized refrigerators. The MIBK at the measured concentration (Room 139-B) could
have come from the use of an office supply product and the tetrachloroethene at the meas-
ured concentration (Room 139-B) is potentially a dry cleaning product brought in on
clothing. Again, these compounds were found at concentrations in the parts per billion
range; at such concentrations, the presence of these compounds do not represent a concern.
In summary, while canister sampling detected a number of compounds in trace concentra-
tions (i.e., parts per billion range) in the occupied spaces, none were present in concentration
to be of concern (i.e. concentrations in the parts per million range). With the possible excep-
tion of acetonitrile (also detected in some outdoor and control building samples), none of the
compounds detected are unusual to an indoor office environment. The types and concentra-
tions of none of these compounds should cause particular concern as the concentrations of
these compounds, at levels as low as our study indicates, should not lead to chronic illness

Literature Building, UCSD Revised December 11, 2009 La Jolla, California Project No. 106702001
106702001 R Rev2.doc 11
nor would they normally cause any discomfort. Laboratory reports and chain-of-custody
documentation are presented in Appendix A.
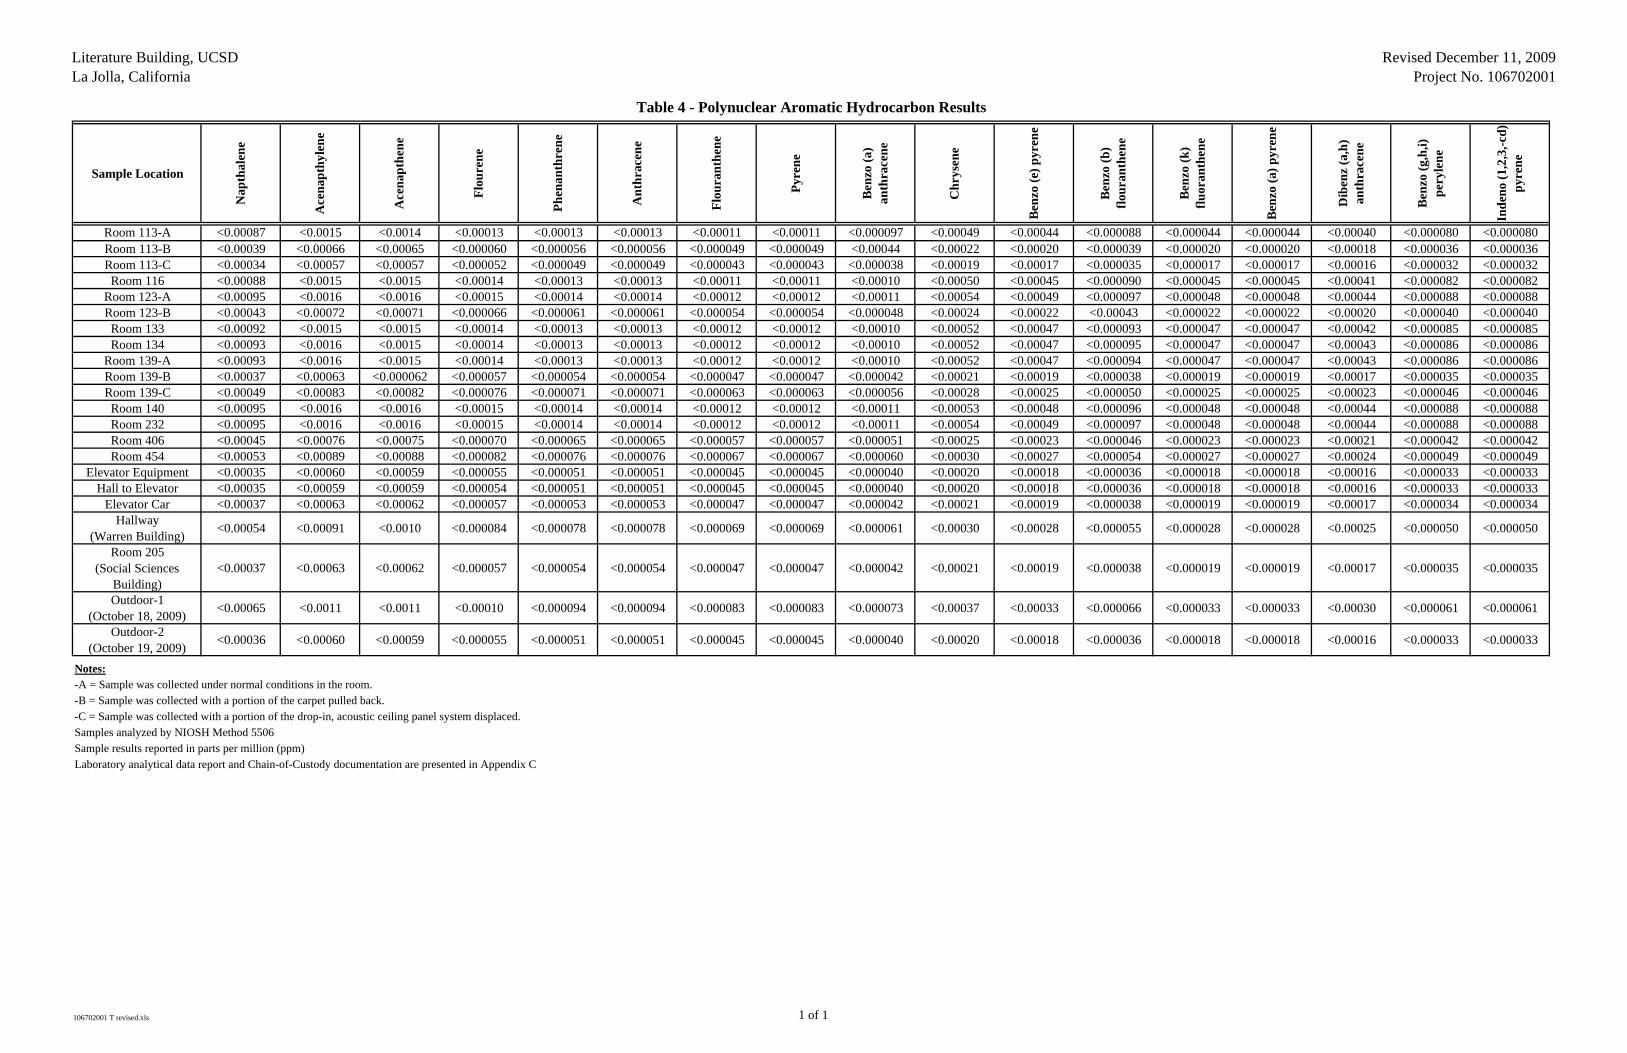
6.6. Sorbent Tube Sampling for Aldehydes and PAHs
Sorbent tubes were used for sampling for polynuclear aromatic hydrocarbons (PAHs) for
analysis by NIOSH Method 5506. The analysis included anthracene, benzoapyrene, chry-
sene, phenanthrene and pyrene among other known carcinogenic compounds. Sample
locations and duplicate sampling mirrored the canister sampling described in the previous
section. None of the analytes were detected at concentrations above the method detection
limit (generally in the parts per billion range) in any of the samples collected.
Sorbent tubes were used for sampling for aldehydes for analysis by NIOSH Method 2016. The
analysis included acid aldehyde, acetone, acrolein, benzaldehydes, butyraldehydes, chrotonal-
dehydes, propionaldehyde and formaldehyde. Again, sampling locations mirrored the canister
sampling that were located according to Literature Building Committee instructions. In the
samples collected, formaldehyde and acetaldehyde were detected in the majority of the sam-
ples, however, the concentrations of these compounds were in the part-per-billion range.
Similar low concentrations of formaldehyde and acetaldehyde were also found in the samples
collected from within both of the control buildings. Concentrations of acetone was also de-
tected in two samples and in one of the control building samples. Low concentrations of
formaldehyde, acetaldehyde, and acetone, as found in this study, are often detectable in indoor
environments and should not consider abnormal or problematic at these low concentrations.
7. CONCLUSIONS AND RECOMMENDATIONS
Indoor air quality parameters investigated during this assessment included temperature, humidity,
CO levels, CO2 levels, pressure differentials, ultra-fine particles, and a broad spectrum of volatile
organic analytes that might be associated with indoor air quality problems. Air quality measure-
ments were performed throughout the interior of the building and air samples were collected in the
specific rooms, at the direction of the Literature Building Committee, at outdoor locations, and

Literature Building, UCSD Revised December 11, 2009 La Jolla, California Project No. 106702001
106702001 R Rev2.doc 12
within two control buildings. One control building (the Warren Building) is located adjacent to the
Literature Building. The second control building (the Social Science Building) is of a similar de-
sign and age to the Literature Building. In each case, direct measurements and results of collected
samples indicated conditions consistent with a building that has an efficient and balanced HVAC
system that is properly removing indoor air and properly mixing fresh, outdoor air. In addition,
there were no conditions noted that would indicate a chemical exposure nor any evidence of past
moisture-related issues that might cause an adverse condition in the observed air handling units on
the roof and first floor of the building, accessible plenum returns, or in filtration apparatus.
Due to the lack of evidence of potential contaminants capable of causing chronic health problems,
sensitization or discomfort within samples collected and analyzed, no further action is recommended
concerning pursuing future investigations to the indoor air quality of the Literature Building.
8. LIMITATIONS
Air sampling results are limited in that they represent airborne concentrations at the time of sample
collection only. Changes in weather, operating procedures, ventilation, temperature, humidity, ten-
ant practices and other conditions, including the inappropriate introduction of moisture, may cause
variations in anticipated airborne chemical concentrations.
While this assessment was relatively comprehensive, airborne contaminants may still be present
that facilitate a faint, unpleasant odor in some individuals. There is no universal reaction to a
measured amount of a particular material. People simply have different tolerance levels. Because
of this, it is difficult to assign standards or even guidelines to set acceptable versus unacceptable
levels of literally thousands of airborne pollutants present in indoor environments. Undetected
contaminants could be present in differing amounts that hyper-sensitive individuals will find irri-
tating or otherwise unpleasant.
Ninyo & Moore has performed the tasks set forth above in a thorough and professional manner
consistent with industry guidelines and under supervision of a certified professional. Ninyo &
Moore cannot guarantee and does not warrant that this limited assessment has revealed all ad-

Literature Building, UCSD Revised December 11, 2009 La Jolla, California Project No. 106702001
106702001 R Rev2.doc 13
verse environmental conditions affecting the site. Nor can Ninyo & Moore warrant that the as-
sessment requested would satisfy the dictates of, or provide a legal defense in connection with,
environmental laws or regulations.
The results reported and any opinions reached by Ninyo & Moore are for the benefit of the cli-
ent. Our conclusions, recommendations, and opinions are based on an analysis of the observed
site conditions. It should be understood that changes to the applicable laws, regulations, codes,
and standards of practice may occur due to government action or the broadening of knowledge.
The services provided do not constitute a complete and comprehensive assessment of indoor air
quality, and the information obtained is relevant for the time and date the services were per-
formed. The findings and conclusions as presented in this letter are based on the services
provided. No warranty, express or implied, is intended regarding the results of this report and
any subsequent reports, correspondence, or consultation. The services summarized herein were
performed in accordance with the local standard of care in the geographic region at the time the
services were rendered.

Literature Building, UCSDLa Jolla, California
Revised December 11, 2009Project No. 106702001
Floor Room
1st Floor Outside 390 70.5 51.6 1 4,700 -- --1st Floor East Hall 460 72.4 52.8 1 4,600 -- --1st Floor Room 133 523 73.2 55.0 1 4,800 0 --1st Floor Room 134 490 73.5 52.9 1 3,200 0 --1st Floor Main Hall 492 73.1 53.6 1 4,100 -- --1st Floor Room 139 512 73.1 53.6 1 3,080 0 --1st Floor Room 140 548 73.6 54.4 1 2,050 0 --1st Floor Room 110 480 72.2 53.8 1 3,600 0 --1st Floor Room 113 550 71.8 54.6 1 3,300 0 --1st Floor Room 116 504 72.1 55.0 1 3,500 0 --2nd Floor Room 232 590 74.7 54.4 1 5,200 0 --
2nd FloorHallway outside
Room 232 500 75.0 52.2 1 4,500 0 --
3rd Floor Stair #1 610 73.5 52.1 1 5,200 0 --
4th FloorHallway outside
Room 454 437 73.5 53.1 1 4,100 0 --
4th Floor Room 454 454 73.0 52.7 1 3,700 0 --4th Floor Elevator Lobby 432 72.4 52.9 1 5,100 0 --4th Floor Room 406 510 72.2 53.9 1 3,000 0 --4th Floor Room 407 552 72.2 53.9 1 2,600 0 --4th Floor Room 410 487 71.9 54.2 1 3,500 0 --3rd Floor Elevator Lobby 412 71.4 54.3 1 4,400 0 --2nd Floor Elevator Lobby 570 72.0 55.9 1 6,200 0 --1st Floor Elevator Lobby 450 71.6 55.2 1 4,400 0 --
1st Floor Outside 400 72.9 53.7 0 4,500 0 --1st Floor Room 123 695 74.7 57.3 0 2,200 1 --1st Floor Elevator Room 585 74.9 55.4 0 1,550 1 --1st Floor Room 133 650 74.6 54.7 1 1,680 0 --
Table 1 - Summary of Indoor Air Quality Measurements
CO2
(ppm)Temperature
(º F)Relative
Humidity (%)CO
(ppm)UFP (p/cc)
VOCs (ppb) Comments
Location
Measurements collected October 8, 2009 from 11:00 AM to 12:00 PM
Measurements collected October 9, 2009 from 3:45 PM to 5:20 PM
106702001 T revised.xls 1 of 3

Literature Building, UCSDLa Jolla, California
Revised December 11, 2009Project No. 106702001
Floor Room
Table 1 - Summary of Indoor Air Quality Measurements
CO2
(ppm)Temperature
(º F)Relative
Humidity (%)CO
(ppm)UFP (p/cc)
VOCs (ppb) Comments
Location
1st FloorHallway outside
Room 131 660 74.9 56.8 0 2,580 0 Measurements collected by HVAC supply vent
1st Floor Room 125 465 74.8 56.3 0 2,250 0 --1st Floor Stair #2 530 74.2 56.1 1 3,780 0 --1st Floor Men's Restroom 560 74.2 57.3 1 3,780 0 --1st Floor Room 139 495 74.0 56.6 1 2,070 0 --1st Floor Room 149 435 73.9 53.0 1 1,380 0 --1st Floor Stair #3 650 73.9 57.1 0 3,050 0 --
1st FloorHallway outside
Room 150 670 74.2 59.0 1 1,950 5 Measurements collected by HVAC supply vent
1st Floor Room 116 450 73.6 58.2 1 1,510 0 --1st Floor Room 113 502 73.8 59.1 1 1,410 0 --1st Floor Elevator Lobby 490 73.4 58.6 1 1,570 0 --2nd Floor Stair #1 618 72.7 58.5 1 4,040 2 --2nd Floor Elevator Lobby 630 73.2 59.1 1 2,650 0 --2nd Floor Room 210 540 73.6 60.4 1 1,790 0 --2nd Floor Room 254 510 73.6 60.4 1 1,970 0 --
2nd FloorHallway outside
Room 249 536 73.9 59.5 1 2,280 0 Measurements collected by HVAC supply vent
2nd Floor Room 232 580 74.9 60.8 1 2,380 0 --2nd Floor Room 226 540 76.2 58.5 1 1,760 0 --
2nd FloorHallway outside
Room 229 920 76.0 58.8 1 2,570 3 Measurements collected by HVAC supply vent
3rd FloorHallway outside
Room 331 750 74.7 59.8 1 1,420 0 Measurements collected by HVAC supply vent
3rd Floor Room 326 670 74.7 57.2 1 1,660 0 Windows open in room3rd Floor Room 329 530 74.3 57.0 1 1,520 0 Windows open in room3rd Floor Elevator Lobby 415 73.4 57.2 1 1,850 0 --3rd Floor Room 352 590 74.4 58.8 1 2520 0 --
3rd FloorHallway outside
Room 343 420 74.7 58.1 0 1,840 0 Measurements collected by HVAC supply vent
106702001 T revised.xls 2 of 3

Literature Building, UCSDLa Jolla, California
Revised December 11, 2009Project No. 106702001
Floor Room
Table 1 - Summary of Indoor Air Quality Measurements
CO2
(ppm)Temperature
(º F)Relative
Humidity (%)CO
(ppm)UFP (p/cc)
VOCs (ppb) Comments
Location
3rd Floor Room 344 470 75.0 58.8 1 2,360 0 Windows open in room
3rd Floor Elevator Car 510 73.9 58.6 0 1,700 0Measurements collected in transit from 3rd to 4th Floors
4th Floor Room 410 585 75.0 59.6 1 1,410 1 --4th Floor Room 406 480 75.6 59.0 1 1,160 0 --4th Floor Room 407 485 75.8 59.0 1 1,290 0 --4th Floor Elevator Lobby 445 75.2 57.8 1 1,740 0 --4th Floor Men's Restroom 460 75.4 58.0 1 1,580 0 --4th Floor Women's Restroom 500 75.0 52.4 1 1,180 0 --4th Floor Room 454 475 74.0 57.9 1 1,230 0 --
4th FloorHallway outside
Room 439 530 74.2 59.2 1 2,100 3 Measurements collected by HVAC supply vent
4th Floor Room 441 500 74.5 59.6 1 10800 (1) 0 --4th Floor Room 423 470 75.0 58.2 1 1,980 2 --4th Floor Room 431 570 74.8 57.8 1 1,890 0 --4th Floor Stair #1 560 73.6 58.1 1 2,130 2 --4th Floor Stair #2 700 74.6 58.6 1 2,260 0 --4th Floor Stair #3 540 75.0 58.4 1 3,880 0 --
Notes: CO2 = Carbon DioxideCO = Carbon MonoxideUFP = Ultra-Fine ParticulatesVOCs = Volatile Organic Compoundsppm = parts per millionppb = parts per billionp/cc = particles per cubic centimeter(1) = Reading appears to be a transitory elevated reading. A representative of the UCSD Environment, Health and Safety office collected an additional set of UFP readings of Room 441 on December 1, 2009, and reported that the UFP readings were consistent with measurements collected from outdoors and the first floor of the Literature Building
106702001 T revised.xls 3 of 3

Literature Building, UCSDLa Jolla, California
Revised December 11, 2009Project No. 106702001
Sam
ple
Loc
atio
n
Roo
m 1
13-A
Roo
m 1
13-B
Roo
m11
3-C
Roo
m 1
16
Roo
m12
3-A
Roo
m 1
23-B
Roo
m 1
33
Roo
m 1
34
Roo
m 1
39-A
Roo
m 1
39-B
Roo
m 1
39-C
Roo
m 1
40
Roo
m 2
32
Roo
m 4
06
Roo
m 4
54
Ele
vato
r E
quip
men
t
Hal
l to
Ele
vato
r
Ele
vato
r C
ab
Hal
lway
(W
arre
n B
uldi
ng)
Roo
m 2
05
(S
ocia
l Sci
ence
s B
uild
ing)
Out
door
-1
(O
ctob
er 1
8, 2
009)
Out
door
-2
(O
ctob
er 1
9, 2
009)
Propylene ND ND ND ND ND ND ND ND ND ND ND ND ND ND ND ND ND ND ND ND ND NDFreon 12(Dichlorodifluoromethane) ND ND ND ND ND ND ND ND ND ND ND ND ND ND ND ND ND ND ND ND ND ND
Freon 114(1,2-Dichlorotetrafluoroethane) ND ND ND ND ND ND ND ND ND ND ND ND ND ND ND ND ND ND ND ND ND NDChloromethane ND ND ND ND ND ND ND ND ND ND ND ND ND ND ND ND ND ND ND ND ND NDVinyl chloride ND ND ND ND ND ND ND ND ND ND ND ND ND ND ND ND ND ND ND ND ND ND1,3-Butadiene ND ND ND ND ND ND ND ND ND ND ND ND ND ND ND ND ND ND ND ND ND ND
Bromomethane ND ND ND ND ND ND ND ND ND ND ND ND ND ND ND ND ND ND ND ND ND NDChloroethane ND ND ND ND ND ND ND ND ND ND ND ND ND ND ND ND ND ND ND ND ND ND
Ethanol 15 110 12 28 9.4 12 13 12 110 10 14 29 2.5 24 3.6 7.1 8.5 6.5 4.6 4.7 ND 3.0Freon 11(Trichlorofluoromethane) ND ND ND ND ND ND ND ND ND ND ND ND ND ND ND ND ND ND 2.9 ND ND ND
Isopropyl alcohol(2-Propanol) 3.2 2.9 4.8 6.2 32 87 12 11 9.6 3.3 9.7 7.7 8.1 ND ND 3.4 4.3 ND ND 31 ND 1.7Freon 113(1,1,2-Trichlorotrifluoroethane) ND ND ND ND ND ND ND ND ND ND ND ND ND ND ND ND ND ND ND ND ND ND
Acetone 5.1 3.0 4.3 6.0 5.2 5.3 4.2 3.8 5.8 4.9 4.9 3.3 4.7 4.3 ND 5.4 4.5 5.7 5.6 6.2 ND ND1,1-Dichloroethene ND ND ND ND ND ND ND ND ND ND ND ND ND ND ND ND ND ND ND ND ND ND
Carbon disulfide ND ND ND ND ND ND ND ND ND ND ND ND ND ND ND ND ND ND ND ND ND NDMethylene chloride ND ND ND ND ND ND ND ND ND ND ND ND ND ND ND ND ND ND ND ND ND ND
Methyl-tert-butyl ether(MTBE) ND ND ND ND ND ND ND ND ND ND ND ND ND ND ND ND ND ND ND ND ND NDtrans-1,2-Dichloroethene ND ND ND ND ND ND ND ND ND ND ND ND ND ND ND ND ND ND ND ND ND ND
n-Hexane ND ND ND ND ND ND ND ND ND ND ND ND ND ND ND ND ND ND ND ND ND ND1,1-Dichloroethane ND ND ND ND ND ND ND ND ND ND ND ND ND ND ND ND ND ND ND ND ND ND
Vinyl acetate ND ND ND ND ND ND ND ND ND ND ND ND ND ND ND ND ND ND ND ND ND ND2-Butanone(MEK) ND ND ND ND ND ND ND ND ND ND ND ND ND ND ND ND ND ND ND ND ND ND
cis-1,2-Dichloroethene ND ND ND ND ND ND ND ND ND ND ND ND ND ND ND ND ND ND ND ND ND NDEthyl acetate ND ND ND ND ND ND ND ND ND ND ND ND ND ND ND ND ND ND ND ND ND NDChloroform ND ND ND ND ND ND ND ND ND ND ND ND ND ND ND ND ND ND ND ND ND ND
Tetrahydrofuran ND ND ND ND ND ND ND ND ND ND ND ND ND ND ND ND ND ND ND ND ND ND1,1,1-Trichloroethane ND ND ND ND ND ND ND ND ND ND ND ND ND ND ND ND ND ND ND ND ND ND
Cyclohexane ND ND ND ND ND ND ND ND ND ND ND ND ND ND ND 0.9 ND ND ND ND ND NDCarbon tetrachloride ND ND ND ND ND ND ND ND ND ND ND ND ND ND ND ND ND ND ND ND ND ND
n-Heptane ND ND ND ND ND ND ND ND ND ND ND ND ND ND ND 1.2 ND ND ND ND ND ND1,2-Dichloroethane ND ND ND ND ND ND ND ND ND ND ND ND ND ND ND ND ND ND ND ND ND ND
Benzene ND ND ND ND ND ND ND ND ND ND ND ND ND ND ND ND ND ND ND ND ND NDTrichloroethene ND ND ND ND ND ND ND ND ND ND ND ND ND ND ND ND ND ND ND ND ND ND
1,2-Dichloropropane ND ND ND ND ND ND ND ND ND ND ND ND ND ND ND ND ND ND ND ND ND NDBromodichloromethane ND ND ND ND ND ND ND ND ND ND ND ND ND ND ND ND ND ND ND ND ND ND
1,4-Dioxane ND ND ND ND ND ND ND ND ND ND ND ND ND ND ND ND ND ND ND ND ND ND4-Methyl-2-pentanone(MIBK) ND ND ND ND ND ND ND ND ND 1.1 ND ND ND ND ND ND ND ND ND ND ND ND
cis-1,3-Dichloropropene ND ND ND ND ND ND ND ND ND ND ND ND ND ND ND ND ND ND ND ND ND NDToluene ND ND ND ND ND ND ND ND ND ND ND ND ND ND 0.7 0.5 ND ND ND ND ND 1.8
trans-1,3-Dichloropropene ND ND ND ND ND ND ND ND ND ND ND ND ND ND ND ND ND ND ND ND ND ND1,1,2-Trichloroethane ND ND ND ND ND ND ND ND ND ND ND ND ND ND ND ND ND ND ND ND ND ND2-Hexanone(MBK) ND ND ND ND ND ND ND ND ND ND ND ND ND ND ND ND ND ND ND ND ND NDTetrachloroethene ND ND ND ND ND ND ND ND ND 0.6 ND ND ND ND ND ND ND ND ND ND ND ND
Dibromochloromethane ND ND ND ND ND ND ND ND ND ND ND ND ND ND ND ND ND ND ND ND ND ND
Table 2 - TO-15 Analysis Results
Standard TO-15 Analytes
106702001 T revised.xls 1 of 2

Literature Building, UCSDLa Jolla, California
Revised December 11, 2009Project No. 106702001
Sam
ple
Loc
atio
n
Roo
m 1
13-A
Roo
m 1
13-B
Roo
m11
3-C
Roo
m 1
16
Roo
m12
3-A
Roo
m 1
23-B
Roo
m 1
33
Roo
m 1
34
Roo
m 1
39-A
Roo
m 1
39-B
Roo
m 1
39-C
Roo
m 1
40
Roo
m 2
32
Roo
m 4
06
Roo
m 4
54
Ele
vato
r E
quip
men
t
Hal
l to
Ele
vato
r
Ele
vato
r C
ab
Hal
lway
(W
arre
n B
uldi
ng)
Roo
m 2
05
(S
ocia
l Sci
ence
s B
uild
ing)
Out
door
-1
(O
ctob
er 1
8, 2
009)
Out
door
-2
(O
ctob
er 1
9, 2
009)
Table 2 - TO-15 Analysis Results
1,2-Dibromoethane ND ND ND ND ND ND ND ND ND ND ND ND ND ND ND ND ND ND ND ND ND NDChlorobenzene ND ND ND ND ND ND ND ND ND ND ND ND ND ND ND ND ND ND ND ND ND NDEthylbenzene ND ND ND ND ND ND ND ND ND ND ND ND ND ND ND 1.5 ND ND ND ND ND ND
Xylene (para & meta) ND ND ND ND ND ND ND ND ND ND ND ND ND ND ND 6.2 ND ND ND ND ND NDXylene (Ortho) ND ND ND ND ND ND ND ND ND ND ND ND ND ND ND 1.8 ND ND ND ND ND ND
Styrene ND ND ND ND ND ND ND ND ND ND ND ND ND ND ND ND ND ND ND ND ND NDBromoform ND ND ND ND ND ND ND ND ND ND ND ND ND ND ND ND ND ND ND ND ND ND
1,1,2,2-Tetrachloroethane ND ND ND ND ND ND ND ND ND ND ND ND ND ND ND ND ND ND ND ND ND ND4-Ethyltoluene ND ND ND ND ND ND ND ND ND ND ND ND ND ND ND 2.0 ND ND ND ND ND ND
1,3,5-Trimethylbenzene ND ND ND ND ND ND ND ND ND ND ND ND ND ND ND ND ND ND ND ND ND ND1,2,4-Trimethylbenzene ND ND ND ND ND ND ND ND ND ND ND ND ND ND ND 1.6 ND ND ND ND ND ND
1,3-Dichlorobenzene ND ND ND ND ND ND ND ND ND ND ND ND ND ND ND ND ND ND ND ND ND ND1,4-Dichlorobenzene ND ND ND ND ND ND ND ND ND ND ND ND ND ND ND ND ND ND ND ND ND ND
Benzyl chloride ND ND ND ND ND ND ND ND ND ND ND ND ND ND ND ND ND ND ND ND ND ND1,2-Dichlorobenzene ND ND ND ND ND ND ND ND ND ND ND ND ND ND ND ND ND ND ND ND ND ND
1,2,4-Trichlorobenzene ND ND ND ND ND ND ND ND ND ND ND ND ND ND ND ND ND ND ND ND ND NDHexachloro-1,3-butadiene ND ND ND ND ND ND ND ND ND ND ND ND ND ND ND ND ND ND ND ND ND ND
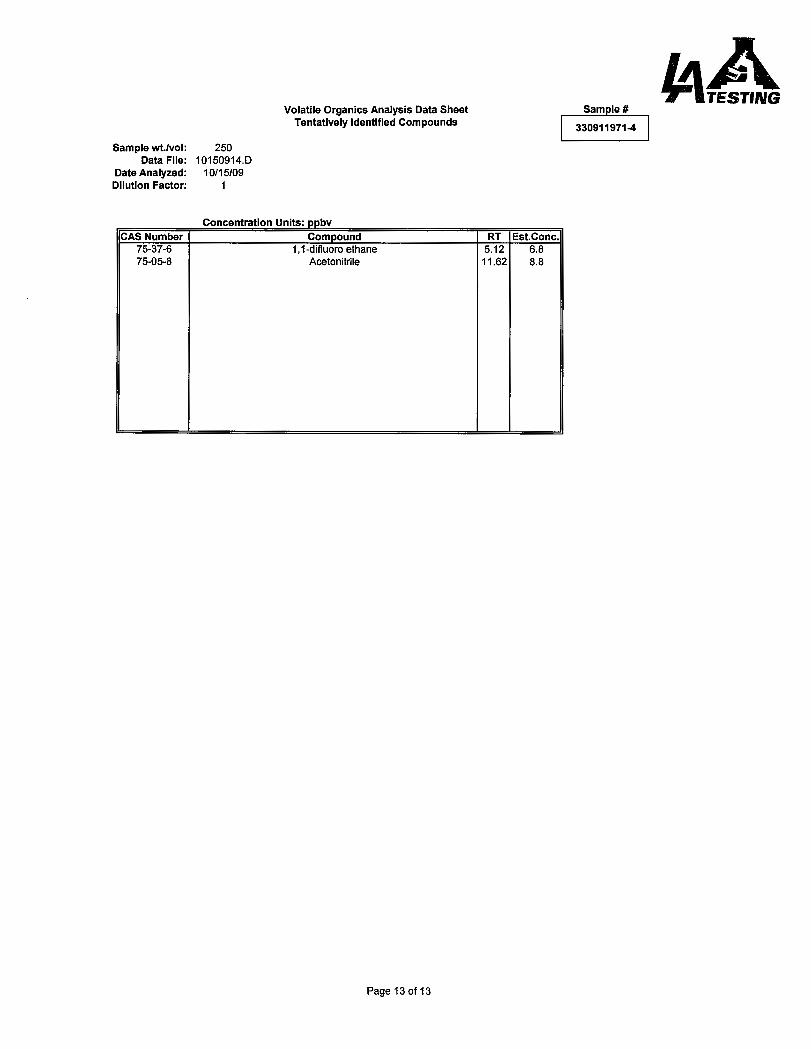
Acetonitrile 3.3 -- 18 97 36 15 3.5 4.9 7.9 8.8 4.2 5.4 28 -- -- 140 5.4 41 -- 92 -- 2.51,1-difluoroethane -- -- -- -- -- 4.8 -- -- -- 6.8 -- -- 16 -- -- -- -- -- -- -- -- --2-Propenoic acid -- -- -- -- -- -- -- -- -- -- -- -- -- -- -- 7.6 -- -- -- -- -- --
Octane -- -- -- -- -- -- -- -- -- -- -- -- -- -- -- 2.3 -- -- -- -- -- --Nonane -- -- -- -- -- -- -- -- -- -- -- -- -- -- -- 2.0 -- -- -- -- -- --Decane -- -- -- -- -- -- -- -- -- -- -- -- -- -- -- 11 -- -- -- -- -- --
Dodecane -- -- -- -- -- -- -- -- -- -- -- -- -- -- -- 3.4 -- -- -- -- -- --2-methyl butane -- -- -- -- -- -- -- -- -- -- -- -- -- -- -- -- -- -- -- -- -- 1.6
Notes:-A = Sample was collected under normal conditions in the room.-B = Sample was collected with a portion of the carpet pulled back. -C = Sample was collected with a portion of the drop-in, acoustic ceiling panel system displaced. ND = Not detected-- = Analyte was not detected in the TO-15 Library search. Samples analyzed by EPA Method TO-15Sample results reported in parts per billion (ppb)Laboratory analytical data report and Chain-of-Custody documentation are presented in Appendix B
Other Detected Analytes
106702001 T revised.xls 2 of 2

Literature Building, UCSDLa Jolla, California
Revised December 11, 2009Project No. 106702001
Sample Location
Ace
tald
ehyd
e
Ace
tone
Acr
olei
n
Ben
zald
ehyd
e
But
rald
ehyd
e
Form
alde
hyde
Prop
iona
ldey
de
Cro
tona
ldeh
yde
Room 113-A 0.0067 <0.0030 <0.0042 <0.0022 <0.0024 0.015 <0.0024 <0.0050Room 113-B 0.032 <0.011 <0.015 <0.0080 <0.0088 0.0096 <0.0088 <0.018Room 113-C <0.0035 <0.0040 <0.0055 <0.0029 <0.0032 0.0077 <0.0032 <0.0080Room 116 0.0052 <0.0027 <0.0038 <0.0020 <0.0022 0.0070 <0.0022 <0.0054
Room 123-A <0.0044 <0.0050 <0.0068 <0.0036 <0.0040 0.0035 <0.0040 <0.0099Room 123-B 0.0060 <0.0039 <0.0055 <0.0029 <0.0032 0.0070 <0.0032 <0.0069
Room 133 0.0020 <0.0017 <0.0024 <0.0013 <0.0014 0.0047 <0.0014 <0.0028Room 134 0.0021 <0.0018 <0.0024 <0.0013 <0.0014 0.0059 <0.0014 <0.0035
Room 139-A 0.0056 0.0045 <0.0044 <0.0023 <0.0026 0.0093 <0.0025 <0.0052Room 139-B 0.020 <0.011 <0.015 <0.0077 <0.0085 0.0069 <0.0084 <0.021Room 139-C <0.0036 <0.0041 <0.0057 <0.0030 <0.0033 0.0080 <0.0033 <0.0059Room 140 0.0062 <0.0048 <0.0067 <0.0035 <0.0039 0.014 <0.0039 <0.0096Room 232 0.0032 0.0015 <0.0028 <0.0015 <0.0016 0.0092 <0.0016 <0.0040Room 406 0.013 <0.0059 <0.0081 <0.0043 <0.0047 0.020 <0.0047 <0.0097Room 454 0.0051 <0.0057 <0.0079 <0.0042 <0.0046 0.0080 <0.0046 <0.012
Elevator Equipment 0.021 <0.0074 <0.010 <0.0054 <0.0060 0.025 <0.0059 <0.015Hall to Elevator <0.0060 <0.0068 <0.0094 <0.0049 <0.0055 0.014 <0.0055 <.011
Elevator Car 0.0077 <0.0060 <0.0083 <0.0044 <0.0048 0.022 <0.0048 <0.012Hallway
(Warren Building) 0.0079 <0.0052 <0.0071 <0.0038 <0.0042 0.0093 <0.0041 <0.010
Room 205 (Social Sciences
Building)0.018 0.014 <0.012 <0.0061 <0.0068 0.0074 <0.0067 <0.017
Outdoor-1 (October 18, 2009) <0.0062 <0.0070 <0.0097 <0.0051 <0.0057 <0.0045 <0.0056 <0.012
Outdoor-2 (October 19, 2009) 0.018 <0.0087 <0.012 <0.0064 <0.0070 <0.0056 <0.0070 <0.014
Notes:-A = Sample was collected under normal conditions in the room.-B = Sample was collected with a portion of the carpet pulled back. -C = Sample was collected with a portion of the drop-in, acoustic ceiling panel system displaced. Samples analyzed by NIOSH Method 2016Sample results reported in parts per million (ppm)Laboratory analytical data report and Chain-of-Custody documentation are presented in Appendix B
Table 3 - Aldehyde Scan Analysis Results
106702001 T revised.xls 1 of 1
Literature Building, UCSDLa Jolla, California
Revised December 11, 2009Project No. 106702001
Sample Location
Nap
thal
ene
Ace
napt
hyle
ne
Ace
napt
hene
Flou
rene
Phen
anth
rene
Ant
hrac
ene
Flou
rant
hene
Pyre
ne
Ben
zo (a
) an
thra
cene
Chr
ysen
e
Ben
zo (e
) pyr
ene
Ben
zo (b
) flo
uran
then
e
Ben
zo (k
) flu
oran
then
e
Ben
zo (a
) pyr
ene
Dib
enz
(a,h
) an
thra
cene
Ben
zo (g
,h,i)
pe
ryle
ne
Inde
no (1
,2,3
,-cd)
py
rene
Room 113-A <0.00087 <0.0015 <0.0014 <0.00013 <0.00013 <0.00013 <0.00011 <0.00011 <0.000097 <0.00049 <0.00044 <0.000088 <0.000044 <0.000044 <0.00040 <0.000080 <0.000080Room 113-B <0.00039 <0.00066 <0.00065 <0.000060 <0.000056 <0.000056 <0.000049 <0.000049 <0.00044 <0.00022 <0.00020 <0.000039 <0.000020 <0.000020 <0.00018 <0.000036 <0.000036Room 113-C <0.00034 <0.00057 <0.00057 <0.000052 <0.000049 <0.000049 <0.000043 <0.000043 <0.000038 <0.00019 <0.00017 <0.000035 <0.000017 <0.000017 <0.00016 <0.000032 <0.000032Room 116 <0.00088 <0.0015 <0.0015 <0.00014 <0.00013 <0.00013 <0.00011 <0.00011 <0.00010 <0.00050 <0.00045 <0.000090 <0.000045 <0.000045 <0.00041 <0.000082 <0.000082
Room 123-A <0.00095 <0.0016 <0.0016 <0.00015 <0.00014 <0.00014 <0.00012 <0.00012 <0.00011 <0.00054 <0.00049 <0.000097 <0.000048 <0.000048 <0.00044 <0.000088 <0.000088Room 123-B <0.00043 <0.00072 <0.00071 <0.000066 <0.000061 <0.000061 <0.000054 <0.000054 <0.000048 <0.00024 <0.00022 <0.00043 <0.000022 <0.000022 <0.00020 <0.000040 <0.000040Room 133 <0.00092 <0.0015 <0.0015 <0.00014 <0.00013 <0.00013 <0.00012 <0.00012 <0.00010 <0.00052 <0.00047 <0.000093 <0.000047 <0.000047 <0.00042 <0.000085 <0.000085Room 134 <0.00093 <0.0016 <0.0015 <0.00014 <0.00013 <0.00013 <0.00012 <0.00012 <0.00010 <0.00052 <0.00047 <0.000095 <0.000047 <0.000047 <0.00043 <0.000086 <0.000086
Room 139-A <0.00093 <0.0016 <0.0015 <0.00014 <0.00013 <0.00013 <0.00012 <0.00012 <0.00010 <0.00052 <0.00047 <0.000094 <0.000047 <0.000047 <0.00043 <0.000086 <0.000086Room 139-B <0.00037 <0.00063 <0.000062 <0.000057 <0.000054 <0.000054 <0.000047 <0.000047 <0.000042 <0.00021 <0.00019 <0.000038 <0.000019 <0.000019 <0.00017 <0.000035 <0.000035Room 139-C <0.00049 <0.00083 <0.00082 <0.000076 <0.000071 <0.000071 <0.000063 <0.000063 <0.000056 <0.00028 <0.00025 <0.000050 <0.000025 <0.000025 <0.00023 <0.000046 <0.000046Room 140 <0.00095 <0.0016 <0.0016 <0.00015 <0.00014 <0.00014 <0.00012 <0.00012 <0.00011 <0.00053 <0.00048 <0.000096 <0.000048 <0.000048 <0.00044 <0.000088 <0.000088Room 232 <0.00095 <0.0016 <0.0016 <0.00015 <0.00014 <0.00014 <0.00012 <0.00012 <0.00011 <0.00054 <0.00049 <0.000097 <0.000048 <0.000048 <0.00044 <0.000088 <0.000088Room 406 <0.00045 <0.00076 <0.00075 <0.000070 <0.000065 <0.000065 <0.000057 <0.000057 <0.000051 <0.00025 <0.00023 <0.000046 <0.000023 <0.000023 <0.00021 <0.000042 <0.000042Room 454 <0.00053 <0.00089 <0.00088 <0.000082 <0.000076 <0.000076 <0.000067 <0.000067 <0.000060 <0.00030 <0.00027 <0.000054 <0.000027 <0.000027 <0.00024 <0.000049 <0.000049
Elevator Equipment <0.00035 <0.00060 <0.00059 <0.000055 <0.000051 <0.000051 <0.000045 <0.000045 <0.000040 <0.00020 <0.00018 <0.000036 <0.000018 <0.000018 <0.00016 <0.000033 <0.000033Hall to Elevator <0.00035 <0.00059 <0.00059 <0.000054 <0.000051 <0.000051 <0.000045 <0.000045 <0.000040 <0.00020 <0.00018 <0.000036 <0.000018 <0.000018 <0.00016 <0.000033 <0.000033
Elevator Car <0.00037 <0.00063 <0.00062 <0.000057 <0.000053 <0.000053 <0.000047 <0.000047 <0.000042 <0.00021 <0.00019 <0.000038 <0.000019 <0.000019 <0.00017 <0.000034 <0.000034Hallway
(Warren Building) <0.00054 <0.00091 <0.0010 <0.000084 <0.000078 <0.000078 <0.000069 <0.000069 <0.000061 <0.00030 <0.00028 <0.000055 <0.000028 <0.000028 <0.00025 <0.000050 <0.000050
Room 205 (Social Sciences
Building)<0.00037 <0.00063 <0.00062 <0.000057 <0.000054 <0.000054 <0.000047 <0.000047 <0.000042 <0.00021 <0.00019 <0.000038 <0.000019 <0.000019 <0.00017 <0.000035 <0.000035
Outdoor-1 (October 18, 2009) <0.00065 <0.0011 <0.0011 <0.00010 <0.000094 <0.000094 <0.000083 <0.000083 <0.000073 <0.00037 <0.00033 <0.000066 <0.000033 <0.000033 <0.00030 <0.000061 <0.000061
Outdoor-2 (October 19, 2009) <0.00036 <0.00060 <0.00059 <0.000055 <0.000051 <0.000051 <0.000045 <0.000045 <0.000040 <0.00020 <0.00018 <0.000036 <0.000018 <0.000018 <0.00016 <0.000033 <0.000033
Notes:-A = Sample was collected under normal conditions in the room.-B = Sample was collected with a portion of the carpet pulled back. -C = Sample was collected with a portion of the drop-in, acoustic ceiling panel system displaced. Samples analyzed by NIOSH Method 5506Sample results reported in parts per million (ppm)Laboratory analytical data report and Chain-of-Custody documentation are presented in Appendix C
Table 4 - Polynuclear Aromatic Hydrocarbon Results
106702001 T revised.xls 1 of 1

Literature Building, UCSD Revised December 11, 2009 La Jolla, California Project No. 106702001
106702001 R Rev2.doc
APPENDIX A
VOLATILE ORGANICS LABORATORY REPORT AND CHAIN-OF-CUSTODY DOCUMENTATION


Literature Building, UCSD Revised December 11, 2009 La Jolla, California Project No. 106702001
106702001 R Rev2.doc
APPENDIX B
ALDEHYDE SCAN LABORATORY REPORT AND CHAIN-OF-CUSTODY DOCUMENTATION


Literature Building, UCSD Revised December 11, 2009 La Jolla, California Project No. 106702001
106702001 R Rev2.doc
APPENDIX C
POLYNUCLEAR AROMATIC HYDROCARBON LABORATORY REPORT AND CHAIN-OF-CUSTODY DOCUMENTATION