Indonesian Interests in the Agricultural Negotiations under the … · 2005-04-26 · Indonesian...
25
Indonesian Interests in the Agricultural Negotiations under the Doha Development Agenda: an Analysis of the "July 2004 Package" Thom J. Achterbosch, a Budiman Hutaburat, b Nizwar Syafa’at, b and Frank W. van Tongeren a Abstract This paper takes the ‘July 2004 package’ as a starting point to assess Indonesian interests in the agricultural negotiations under the WTO Doha Development Agenda. The ambitions on reforming domestic support in OECD countries seem to be moderate, at best, and a number of developing countries are less inclined to open their markets through improved access. Members now agree on far reaching exemptions from reforms in individual products (special products for developing countries and sensitive products for developed countries). This paper uses a large-scale economic model of trade and production (GTAP) to identify the possible impact of a realistic global liberalisation scenario in the spirit of the ‘July 2004 package’ on the Indonesian economy. Given the prevailing quite liberal trade regime in Indonesia the expected overall impacts on national income, trade and production are positive, but rather limited. For Indonesian agriculture global liberalisation offers positive prospects for vegetable oils and for animal products. There are small adverse effects on the protected rice and sugar sectors, which can be managed at modest costs by designating rice as special product (SP). An import ban or restrictive quota regime would entail significant welfare losses. Contents 1. Introduction .................................................................................................... 1 2. The three pillars and protection in Indonesia................................................. 2 3. Model, data and scenarios .............................................................................. 9 4. Impact of the Doha Development Agenda................................................... 12 5. Exempting SPs from multilateral liberalization........................................... 18 6. Conclusions .................................................................................................. 21 Acknowledgements ............................................................................................. 23 References ........................................................................................................... 23 a Agricultural Economics Research Institute (LEI), Wageningen UR; b Indonesian Center for Agricultural Socio-Economic Research and Development (ICASERD) 0
Transcript of Indonesian Interests in the Agricultural Negotiations under the … · 2005-04-26 · Indonesian...

Indonesian Interests in the Agricultural Negotiations under the
Doha Development Agenda: an Analysis of the "July 2004 Package"
Thom J. Achterbosch,a Budiman Hutaburat,b Nizwar Syafa’at,b and Frank W. van Tongeren a
Abstract
This paper takes the ‘July 2004 package’ as a starting point to assess Indonesian interests in the agricultural negotiations under the WTO Doha Development Agenda. The ambitions on reforming domestic support in OECD countries seem to be moderate, at best, and a number of developing countries are less inclined to open their markets through improved access. Members now agree on far reaching exemptions from reforms in individual products (special products for developing countries and sensitive products for developed countries). This paper uses a large-scale economic model of trade and production (GTAP) to identify the possible impact of a realistic global liberalisation scenario in the spirit of the ‘July 2004 package’ on the Indonesian economy. Given the prevailing quite liberal trade regime in Indonesia the expected overall impacts on national income, trade and production are positive, but rather limited. For Indonesian agriculture global liberalisation offers positive prospects for vegetable oils and for animal products. There are small adverse effects on the protected rice and sugar sectors, which can be managed at modest costs by designating rice as special product (SP). An import ban or restrictive quota regime would entail significant welfare losses.
Contents
1. Introduction....................................................................................................1 2. The three pillars and protection in Indonesia.................................................2 3. Model, data and scenarios..............................................................................9 4. Impact of the Doha Development Agenda...................................................12 5. Exempting SPs from multilateral liberalization...........................................18 6. Conclusions..................................................................................................21 Acknowledgements.............................................................................................23 References...........................................................................................................23
a Agricultural Economics Research Institute (LEI), Wageningen UR; b Indonesian Center for Agricultural Socio-Economic Research and Development (ICASERD)
0

1. Introduction
This paper discusses the interests of Indonesia in the agricultural negotiations
under the Doha Development Agenda (DDA) of the WTO. It uses a global model of
trade and production to quantitatively assess the possible effects of a successful Doha
round on the world and on the Indonesian economy.
Since the start of the Doha round in 2001 the scope for liberalization in
agricultural trade has gradually declined. The recent ‘July 2004 package’ reveals that
WTO members agree on far reaching exemptions from reforms in individual products
(special products for developing countries and sensitive products for developed
countries). The ambitions on reforming domestic support in OECD countries seem to
be moderate, at best, and a number of developing countries is less inclined to open
their markets through improved access. It is against this background that we formulate
our DDA scenario.
Several recent studies have shown that agricultural market access is one of the
most important issues on the Doha development-round agenda (e.g. Anderson, 2004;
Bouët et al 2004b; Francois et al. 2003; World Bank, 2003). There is much focus on
tariff reductions in the present paper. Section 2 provides background to the Doha
Development Agenda, and provides input into the discussions on formulae through an
analysis at tariff-line level. We find that any formula that reduces post-UR bound
rates by less than 80 per cent will leave most currently applied tariffs on agricultural
imports into Indonesian untouched. Stated otherwise, Indonesia brings much capital to
the negotiation table when it comes to improving other countries' access to its
markets.
The GTAP model and database are geared to an analysis that provides most
detail on the agricultural sectors in Indonesia, and the South and East Asian region
(section 3). While the impact of the Doha Development Agenda on global income is
modest, as reported in section 4, Indonesia is one of the countries that reap above-
average gains driven by the improved export performance in agriculture. The income
form farming activities will rise. The export opportunities compensate by far the
limited contraction of the rice and sugar sectors that occur as imports grow;
designating rice a Special Product will counteract contraction at modest costs (section
5). Criteria design for SPs is a potential deadlock, however, that may consume much
of the scarce negotiating resources that developing countries have at their disposal.
Section 6 concludes that there are firm interests for Indonesia in the Doha
1

Development Agenda. Some are on the defensive side, aimed at conserving flexibility
for protectionist policies. Others are on the offensive side, and relate to the realization
of export potential through domestic transformation of agriculture, and improved
access to export markets.
2. The three pillars and protection in Indonesia
The Doha Development Round aims to obtain “substantial improvement of
market access, reduction of all export subsidies, in view of their progressive
withdrawal, and substantial reduction of domestic support having effects on trade
distortion”. These are the three "pillars" in the agriculture negotiations under the Doha
Development Agenda: market access concerns reductions in tariffs and tariff rate
quotas; domestic support concerns commitments to reduce trade-distorting farm
income policies; export competition concerns the promotion of agricultural exports
through direct subsidies, export credits, subsidy element in food aid and state trading
enterprises.
Domestic support
Domestic support to agriculture is monitored in the WTO according to the
concept of the Aggregate Measure of Support (AMS), and member countries have
agreed to bind and reduce their domestic support in the last multilateral trade round,
the Uruguay Round (UR). The domestic support ceilings have never been binding
since the UR for any member, partly due to the relatively soft definition of AMS that
allows reallocation of expenditures between categories. Most importantly, a
significant part of domestic support has been shifted to the so-called ‘Green box’
which contains support that is considered minimally trade distorting and is not subject
to reductions. Similarly, the so-called ‘blue box’, used mainly by the EU, has not been
subject to reductions, and might possibly be extended in the DDA. Bringing down
AMS will, therefore, not always result in actual reduction in domestic support.
Table 1 provides data on the subsidies from farm-income policies and export
competition for selected countries and regions. These data are drawn from the
OECD’s estimates of producer support and adjusted to fit the GTAP database.1 A
1 The data does not include the so called ‘Market Price Support’ component, and is therefore lower than the OECD’s Producer Support Estimates (PSE).
2

negative number refers to a net tax on producers in that sector. It is evident that the
European Union, North America (USA and Canada), Japan an Korea choose to
subsidize their agricultural sectors, while most of the developing countries are taxing
their farmers.
Table 1. Domestic support and export competition (*) Indo-
nesia ASEAN China
P.R. Japan
and Korea
India EU-25 North America
Brazil South and
Central America
Australia and New Zealand
All other countries
% of value of output
Rice -1 -2 -3 3 6 3 25 -1 0 1 0Sugar -7 -4 -2 0 0 0 1 -2 -1 2 -1Oilseeds -1 0 -2 35 3 42 27 1 -1 2 -1Grains -1 -11 -2 8 3 61 32 1 11 3 0Vegetable Oils -1 -1 -4 0 -1 0 0 -3 0 0 0
Animal Products -1 -2 -2 1 0 3 2 -1 -1 1 -1
Other agriculture -1 -2 -2 3 5 9 18 1 0 1 -1
Food processing -7 -13 -13 -19 -4 -4 0 -3 -3 -1 -2
Source: GTAP version 6.4 pre-release (October 2004), calculations LEI (*) Negative number means a net tax, positive number means a net subsidy
Export subsidies
Export subsidies have received much criticism from academics and
policymakers, and are widely believed to be amongst the most trade distorting forms
of policies. The issue has received high priority in the current Doha round of
negotiations. Between the kick-off of the round with the Doha ministerial declaration
(WTO, 2001) and the latest general council decision of July 2004 (WTO, 2004), the
wording on export subsidies has changed from ‘…reductions of, with a view of
phasing out ...’ to a much more ambitious ‘… ensure the parallel elimination of all
forms of export subsidies..’. This signals a broad consensus that export subsidies will
have to disappear over time.
Under the Uruguay Round (UR) only direct subsidies were subject to discipline.
While taking the removal of subsidies further, the DDA also addresses indirect forms
of subsidization through various forms of institutional arrangements. These include
food aid, officially supported export credits and state trading enterprises (STEs). The
General Council decision (WTO, 2004) calls for the elimination of all forms of export
subsidies, and Members have been instructed to work with the OECD to develop
3

monitoring tools. The OECD (2000) study on export credits is the forerunner of much
more work in this area.
The WTO (2002a) provides data on the notified usage of direct export subsidies
between 1995- 2000. All direct export subsidies average at US$ 7 billion annually. Of
these, 90 per cent are from the EU, which is currently in the process of making sharp
reductions in budget outlays on export subsidies. The dairy sector uses the largest
share. The USA notified only US$ 487 million of direct export subsidies, but
according to OECD (2000), the USA has been the largest user of export credits to
subsidize exports. It is noteworthy that there are also positive notifications by
developing countries, six of which did not make reduction commitments in the UR
because they did not use them at the time. These countries are India, Korea, Morocco,
Pakistan, Thailand and Tunisia.
Export subsidies display a considerable volatility over the years. The amount of
export subsidies depends on the vagaries of world markets, in combination with the
desire of some countries to stabilize their own domestic markets. In value terms the
volatility is even greater, since an additional price component enters the picture.
Market access in agriculture
Countries protect their domestic markets in a number of ways. The resulting
pattern of protection measures is often complex and faces the exporter with a non-
transparent administrative burden, involving tariffs, quota, technical standards,
sanitary and phytosanitary standards, import licenses, infrastructure charges, and,
increasingly popular after the UR, anti-dumping duties. All these measures tend to
raise the domestic price of the imported good above its ‘world’ price, i.e. the price
that the exporter actually receives.
Tariffs are the most commonly applied form of import protection. Market access
negotiations in the GATT/WTO have generally been based on tariff bindings, or
schedules of concessions tabled under GATT rules that define a maximum or ceiling
rate for trade restrictions. The coverage and level of these bindings is an important
element of the initial conditions for the negotiations. While tariffs in the OECD (and
Latin America) are generally bound, many Asian and African economy tariffs remain
unbound despite more than a four-fold increase in the coverage of developing-country
tariff bindings in the Uruguay Round.
4

For both industrial tariffs and agricultural tariffs, the phenomenon that bound
rates exceed applied rates, or ‘binding overhang’ (Francois and Martin, 2003) is an
important element for the initial negotiations in the Doha round. The binding
overhang – sometimes called 'water in the tariff' – reduces the effectiveness of bound
tariff reductions. For example, Francois et al (2003) show that, in general, for
developing countries, binding overhang is large enough that reductions in the range of
50 per cent are necessary to force any reductions at all in average applied rates for
countries like Brazil. Below we analyze the level of border protection in Indonesia. A
more detailed discussion on the composition of agricultural tariffs, and the global
pattern of protection is provided in Achterbosch et al. (2004).
Patterns of border protection in Indonesia
The current pattern of border protection in Indonesia, its profile of bound rates
and its profile of applied rates determine the potential impact of the specific tariff
reduction modalities that are to be agreed in the Doha negotiations. For Indonesia we
observe that its applied protection is low on average, around 5 per cent in agri-food
and slightly higher in manufacturing and textiles. We also see that the protection
afforded is lower than the protection faced by Indonesian exporters, which points to
potential export revenue gains from a multilateral reduction of tariffs.
Below we present data obtained from the AMAD database, which contains
information on bound ad valorem tariff rates in agriculture, as well as information on
TRQs.2 The bound rates are directly from Indonesia’s commitment schedule, and the
AMAD database contains 1331 Indonesian tariff lines at the HS-10 level. Figure 1
provides a picture of the tariff landscape. With the exception of a few peaks, the
landscape is rather flat, with most bound tariffs in the range 40 – 60 per cent. The
important exceptions are found in dairy, sugar, rice and beverages. See table 2-3 for
summary statistics for the agricultural commodities only, and calculated at the HS-2
group level. We also estimate the current binding overhang, i.e. the difference
between bound rates and the post-UR applied rates. The overhang is very large indeed
and this reflects the fact that Indonesia has reduced its tariffs far below the UR
commitments in the wake of the Asia crisis. The current low rates reflect an already
2 AMAD is a collaborative effort between USDA/ERS, OECD, Agriculture Canada, UNCTAD, FAO and the EC. See www.amad.org
5

liberal trade regime, with most tariffs around 5 per cent. Two exceptions are sugar and
rice where specific tariffs are applied, and in the case of rice also quantitative import
restrictions. Another exception is (alcoholic) beverages.
The DDA negotiations on agriculture have introduced several approaches to
achieve tariff reform. The European Union has favoured a Uruguay Round approach
in its agricultural proposals, which defines as the goal an average cut in tariffs. The
Uruguay Round has in practice lead to the outcome that larger cuts were applied to
tariffs that were already relatively low, while applying only modest reductions to high
tariffs.
The USA and the CAIRNS group have proposed a formula approach. The
fundamental difference to a UR approach is that a formula approach sets out rules to
cut tariffs on each tariff-line. Specifically, these countries proposed to apply a Swiss
formula approach on account that it achieves higher proportional cuts in higher tariff
rates and results in a maximum ceiling tariff per tariff line. The Swiss formula is the
most appropriate modality for a reduction of address tariff escalation. The so-called
Derbez text that emerged during the 2003 Cancun ministerial proposed to combine
both a UR approach and a Swiss formula in a ‘blended’ formula as a modality for
market access negotiations. The more recent July package of 2004 speaks about
‘tiered formulae’, without specifying exactly what this might look like. See Sawit
(2004) for a detailed analysis on Indonesia.
Table 2 clearly shows that very substantial reductions in bound rates would be
required to actually reduce Indonesian applied rates. Required reductions larger than
80 per cent are not uncommon, given the enormous binding overhang. Consequently,
all of the suggested reduction modalities would have little impact on applied tariffs,
but could reduce some of the bound rates substantially. The consequent reduction of
binding overhang would limit Indonesia’s future ability to raise tariffs above current
levels.
6

0
50
100
150
200
250
1011
1000
1060
0919
2064
1000
2102
0900
4064
0000
5080
0100
6029
9291
6039
0100
7095
1000
7123
0000
8023
2000
8081
0000
8131
0000
9041
1100
9083
0000
1006
3010
0
1104
1920
0
1108
1290
0
1207
6000
0
1211
9014
0
1301
9014
0
1401
2018
0
1401
9021
0
1504
3000
0
1515
2100
0
1518
0013
9
1602
3919
0
1701
9919
1
1704
9012
0
1901
9091
0
2001
1010
0
2005
6010
0
2008
5019
0
2009
3091
0
2103
2030
0
2202
1090
0
2208
2019
0
2306
2000
0
2402
1020
0
3301
2970
0
4101
3020
0
5101
2100
0
HS-10
%dairy
rice
sugar
beverages
Average tariff, post Uruguay round
Committed ad valorem rate, post Uruguay Round
Figure 1. Post Uruguay Round tariff landscape Indonesia, bound rates
7

Table 2. Bound and applied tariff rates imposed by Indonesia (per cent ad valorem)
Bound rate, % Applied rate, %
Reduction of bound rates, required to equalize bound and applied rate %
HS 1996
Commodity group Max Min Mean Max Min Mean Mean
01 Live animals 40 40 40 15 0 5 89
02 Meat bovine and non-
bovine 50 40 48 5 5 5 89
03 Fish, fish products . . . 15 0 5 100
04 Dairy, eggs and honey 210 40 90 5 0 4 92
05 Hair and feather 40 40 40 5 0 4 91
06 Ornamental plants 60 40 45 20 10 13 70
07 Vegetables 50 40 45 5 0 5 89
08 Nuts and fruits 60 40 46 5 5 5 89
09 Coffee, tea and spices 60 40 44 5 5 5 88
10 Rice and cereals (*) 160 27 103 5 0 3 91
11 Processed cereals (flours,
flakes) and starch 40 9 36 5 0 4 87
12 Oilseeds 40 27 40 5 0 4 90
13 Vegetable saps 40 30 39 5 0 4 89
14 Bamboo, rattan and other
plant fibres 40 40 40 5 0 2 95
15 Vegetable oil and animal
oils 60 35 42 10 0 5 88
16 Animal products 40 40 40 5 5 5 88
17 Sugar and –products (**) 95 40 54 5 5 5 88
18 Cocoa products 40 40 40 5 5 5 88
19 Cereal products 60 40 41 5 5 5 88
20 Processed vegetables
and –fruits 60 40 49 5 5 5 89
21 Soya sauce and other
food preparations 60 40 41 5 5 5 88
22 Beverages 150 40 125 170 5 129 13
23 Animal feed products 40 30 40 5 0 1 96
24 Tobacco and –products 40 40 40 15 5 9 78
Source: Bound rates are from AMAD database, Applied rates have been obtained from Departemen Pertanian. Calculations LEI Notes: Mean values per HS-2 group calculated from tariff-line data at HS-10 level; (*) For rice the bound rate includes estimate of the ad-valorem equivalent of specific tariffs. The column “applied rate” only contains the average of ad applied valorem tariffs. The current applied specific tariff is Rp 430/kg. At current world prices and exchange rates this is roughly 20% ad valorem. (**) For sugar the bound rate includes estimate of the ad-valorem equivalent of specific tariffs. The column “applied rate” only contains the average of applied ad valorem tariffs. The current applied specific tariff is Rp 700/kg for raw sugar (p 550/kg for cane sugar). At current world prices and exchange rates this amounts to roughly 30% ad valorem.
8

3. Model, data and scenarios
Scenarios
The challenge in constructing scenarios is to translate bound rates and bound
AMS ceilings, which are negotiated under DDA, into changes to the applied levels
that can be incorporated in the modeling analysis. As usual one has to make
simplifying assumptions to capture the spirit of the likely set of policy changes
without being trapped into the details of the (legal) agreements. Our analysis of the
impact of the DDA on the world and on Indonesia is structured around one central
DDA scenario, which assumes the following with regard to the three pillars in the
agricultural negotiations:
- Market access: 30% reduction of applied levels of protection;
- Domestic support: 5% reduction of applied levels;
- Export subsidy: 75% reduction
This scenario purports to reflect the current stance in the negotiations:
substantial progress in market access albeit less in applied rates than in bound rates;
limited progress on domestic support – despite strong commitments to lower AMS
ceilings, perhaps – as the EU and the USA strive to expand the definition of the blue
box and put increasing amounts of support in the green box; finally, we believe that
very substantial reductions of export subsidies can be achieved in this round.
In one of the scenarios we construct a potential modality for SP in developing
countries along two lines. First, we see little fundamental difference between
“sensitive products” proposed by OECD countries, and special products in developing
countries. Special or sensitive are taken to be those products for which current levels
of (bound) border protection are high. Second, we largely exempt sensitive/special
products within this tariff range from liberalization by assuming a “symbolic” 5 per
cent cut on applied support or border measures.
Model
Our analysis uses calculations done with the general equilibrium model of the
Global Trade Analysis Project. The GTAP model is a comparative static multi-sector
multi-region general equilibrium model. Each country or region is depicted within the
same structural model. The regional household to which the income of factors, tariff
9

revenues and taxes are assigned represents the consumer side. The regional household
allocates its income to three expenditure categories: private household expenditures,
government expenditures and savings. For the consumption of the private household,
the non-homothetic Constant Difference of Elasticities (CDE) function is applied.
A representative producer for each sector of a country or region makes
production decisions to maximize profits by choosing inputs of labor, capital, and
intermediates to produce a single sector output. Producers can substitute primary
factors for each other, modeled with a Constant Elasticity of Substitution (CES)
functional form, while intermediates are used in fixed proportions (Leontief). In the
case of crop production, farmers also make decisions on land allocation. Intermediate
inputs are produced domestically or imported, while primary factors cannot move
across countries. Internationally traded commodities are assumed to be distinguished
according to region of origin. Using this so-called Armington assumption implies that
for example wheat imported from the US is different from wheat imported from the
EU, and trade flows in both varieties have their own price tag. A great advantage of
the Armington assumption is the possibility to model bilateral trade flows and
bilateral trade policies.
The welfare changes are measured by the equivalent variation. This tells us how
much money can be taken away from the representative household, or must be given
to the representative household, to make it as well off as without the policy change. In
practice, the equivalent variation correlates with changes in real GDP. We also report
changes in farming income. This is measured as change in value added derived from
agricultural activities, and hence excludes income from off-farm activities that the
rural household may be engaged in.
Taxes are included in the theory of the model at several levels. Production taxes
are placed on intermediate or primary inputs, or on output. Some trade taxes are
modeled at the border. Additional internal taxes can be placed on domestic or
imported intermediate inputs, and may be applied at differential rates that discriminate
against imports. Trade policy instruments are represented as import or export
taxes/subsidies. A detailed discussion of the basic algebraic model structure of the
GTAP model can be found in Hertel (1997). Our model is implemented in
GEMPACK, a software package designed for solving large applied general
equilibrium models. The model is solved as an explicit non-linear system of
equations, through techniques described by Harrison and Pearson (1996).
10

Data
We use the version 6.4 pre-release (September 2004) of the GTAP database that
is benchmarked to the year 2001. A special feature of the database is the trade
protection information that comes from the MacMaps database. This is a joint effort
by the Centre d’études Prospectives et d’information Internationales (CEPII) and the
International Trade Center (WTO/ITC). This database is used to convert tariffs
applying to trade in products measured at a very disaggregate level (HS6) into their ad
valorem equivalent. The import protection measures include ad valorem tariffs,
specific tariffs, quota, tariff rate quota regimes, and anti-dumping duties. These are all
converted into ad valorem equivalents. An important feature of this dataset is its
inclusion of existing trade preferences, including GSP, ACP, AGOA and existing
bilateral preferences. See Bouët et al (2004a) for a comprehensive documentation.
Information on domestic agricultural support is consistent with OECD producer
Support Estimate information, but limited to OECD members and a few non-
members.
The GTAP database contains economy-wide information 87 regions or
individual countries and information on 57 commodities. For the purposes of this
study we have aggregated those into 11 regions and 10 commodities, listed in Table 3.
Table 3. Aggregation of the database Commodities Regions
1 Rice Indonesia
2 Sugar ASEAN (excl. Indonesia)
3 Oilseeds China P.R.
4 Grains Japan and Korea
5 Vegetable Oils India
6 Animal Products EU-25
7 Other agriculture North America (US and Canada)
8 Food processing Brazil
9 Manufactures South and Central America
10 Services Australia and New Zealand
11 All other countries
11

4. Impact of the Doha Development Agenda
As negotiations under the Doha Development Agenda (DDA) proceed, the
prospects for strong economic benefits from the round get bleaker. Below we report
on the results of our model simulations under a realistic Doha scenario.
Global Effects
On the global level, we estimate gains of USD 11 billion in agriculture, and of
USD 10 billion in non-agriculture. Because of the small share of agriculture in the
global economy, the relative gain is much bigger in agriculture (0.6 per cent of global
agricultural GDP) than in non-agriculture (0.04 per cent of global non-agricultural
GDP). Figure 3 reveals the distribution of national income gains over the agriculture
economy and the non-agriculture economy, by region. Several developing regions
score well above the global average, notably India, the ASEAN countries, and Brazil.
Of the OECD countries, those in the far East (Japan, South Korea, Australia and New
Zealand) reap substantial gains, which are largely driven by agricultural reforms in
Japan and Korea. The benefits in the EU are in line with the EU share in the global
economy. We report a slight net loss for the US, giving the US little incentive to push
hard on a deal. The national income gain in Indonesia amounts to 0.3 per cent of
GDP, far above the world average. Most gains occur in manufacturing and services.
Under the agriculture negotiations, the July package reveals that little action is
expected on the critical pillars of domestic support and market access. Consequently,
the gains in agriculture are quite small. What is the contribution of the three pillars to
these global gains? 94 per cent of gains relate to improved market access for
agricultural products, 4 per cent to reduced domestic support and just 1 per cent to the
downscaling of export competition policies. The agriculture dossier under the Doha
Round seems to have made most progress under a pillar that shows little potential for
substantial welfare gains in developing countries.
12

National income effects, liberalisation all sectors, DDA scenario
-0.5
0
0.5
1
1.5
2
2.5
3
3.5
Indon
esia
ASEAN
China P
.R.
Japa
n and
Kore
aInd
iaEU-25
North A
merica
Brazil
South
and C
entra
l Ameri
ca
Autrali
a and
New
Zealan
d
All othe
r cou
ntries
WORLD
% o
f Val
ue a
dded
-5000
0
5000
10000
15000
20000
25000
mill
ion
US$
Total in million US$ (right axis)
AgricultureNon-Agriculture
Figure 2. National income effects of a DDA liberalization in all sectors
The Impact of the Doha Round on Indonesia
Trade theory is straightforward in predicting that the gains from global
liberalization accrue to those countries that remove their own distortions. Yet,
Indonesia has quite a liberal trade regime, and few public means are allocated to
support agricultural production or exports. This explains why the Doha round does
little to boost Indonesian GDP (figure 2).
Comparing the impact on Indonesia with the rest of ASEAN, what strikes is that
the gain in the latter region from countries opening up their markets is about four
times bigger. Basically, the other ASEAN countries are able to materialize more
export gains than Indonesia. The implication is that Indonesia – being a part of the
global trading system – should aim to fulfill more of its export potential in order to
derive firm benefits from the system. In addition, we see that Indonesia reaps indirect
benefits from participating in a global liberalization effort. The matter returns below.
First, we zoom in on the results of DDA reform for Indonesia.
13

Percent change output volume, DDA liberalisation scenario all sectors, INDONESIA
-2 -1 0 1 2 3 4
Sugar
Rice
Other agriculture
Manufactures
Food processing
Services
Grains
Oilseeds
Animal Products
Vegetable Oils
%5
Figure 3. Output in Indonesia after Doha reform, by sector (per cent change)
Sectoral impact. Figure 3 compares the changes in value of output in sectors of
the Indonesian economy. It should be read as an indication for changing patterns of
specialization after reform.
In Indonesia most food crops are largely unaffected, and there is a substantial
expansion in food production. For rice the share of domestic rice in consumption
decreases slightly as a result of import growth of 20 per cent. Imports of sugar,
already about half of domestic consumption, grow by an additional 10 per cent. The
decline in rice and sugar farming allows resources to move into animal production
and the oilseed/vegetable oil production, which both expand by 3 to 6 per cent.
Looking just at quantities of output, there is 2.5 per cent growth in oilseeds and
animal products, and over 6 per cent in vegetable oil.
The opportunities in animal products and vegetable oil relate to policy changes
in Japan and Korea, which open up the highly protected market for rice, grains and
oilseeds in these regions. ASEAN countries and North America fill the gap. More
resources in these countries are absorbed by rice production, which opens up
opportunities for Indonesia to increase its share on world markets for oilseed crops
and vegetable oil. As the EU, Japan and Korea reduce their strong policies on dairy,
14

beef and other animal products, Indonesia can be among the countries that expand
their livestock sectors, albeit in strong competition with Brazil, Oceania, and other
ASEAN countries.
Below we discuss in more detail the impact on agriculture of a DDA reform that
covers only agriculture and food.
Farm income. There will, of course, be a consequent adjustment in the revenues
from farming over the various sectors. Figure 4 provides detail on the changes to real
farmer income from a DDA reform, and to the drivers of change.3 Regarding the level
of farm income, we find strong losses in the OECD countries that result from reduced
levels of trade-distorting support; losses are fully compensated, however, through
increased support under the Green Box. Farmers in emerging Asia – Indonesia
included – gain under DDA, largely because of increased prices for their output (table
4). The results for Indonesia have to be interpreted with care because farming is often
a part-time activity. In the lowland and upland area the share of agricultural (and
fishing) activities in income is just about 50 per cent, in the coastal area it is just one-
third.4 We report on changes to the income from farming activities only, and exclude
the returns from fishing activities from the analysis. It will be clear that a proper
analysis of the household impact from trade liberalization will have to include the
effect on off-farm income.
We find that average real income from farming (all activities) in Indonesia could
increase by 1.2 per cent after the DDA reform of global agricultural policies. For the
potential gain to materialize, farmers will need to shift resources into the production
of vegetable oil and animal products.
3 Change in real farm income is calculated as the CPI-deflated change in value added of agricultural activities. 4 These data are ICASERD data for 2001.
15

Change in real farm income, %
-5,0 -4,0 -3,0 -2,0 -1,0 0,0 1,0 2,0 3,0 4,0 5,0
Indonesia
ASEAN
China P.R.
Japan and Korea
India
EU-25
North America
Brazil
South and Central America
Autralia and New Zealand
All other countries
%
Policy changes Indonesia Import barriers other countriesExport subsidies other countries Domestic support other countries
Figure 4. Impact of DDA on farm income, by region (per cent change)
The decomposition of the total change allows us to pinpoint the policies that
drive change. Keep in mind our scenario design! The reduction of export subsidies
and domestic support bears little impact outside the EU and Oceania. Nonetheless,
Indonesian farmers benefit from rising market prices for their rice and oilseeds – as
support policies become less distorting or decline, supply contracts, and prices rise.
Increased market access is the biggest cause of adjustments worldwide. Indonesian
export opportunities improve under the Asian rice domino; when Japan and Korea
open up their markets for rice from the ASEAN region, Indonesian farmers get
opportunities to step up their exports of animal products and vegetable oil, and take
over market share from other ASEAN countries in these products. We find that a
removal of protection on Indonesian agriculture slightly reduces farm income by
about 0.4 per cent, a reflection of the minor contraction in rice and sugar production.
Most rural households are net buyers of food, i.e. consumption outweighs
household supply. Although real farm income rises, the net impact on the rural
household is likely to be negative. The income gain is partially based on the upward
pressure on prices for agricultural products. The net impact in the household depends
on their food balance. Hertel et al. (2004) show that poor agricultural households in
16
Indonesia are likely to witness a net income drop in the face of global liberalization,
as their food budget rises without being fully compensated by rising remuneration for
their activities.
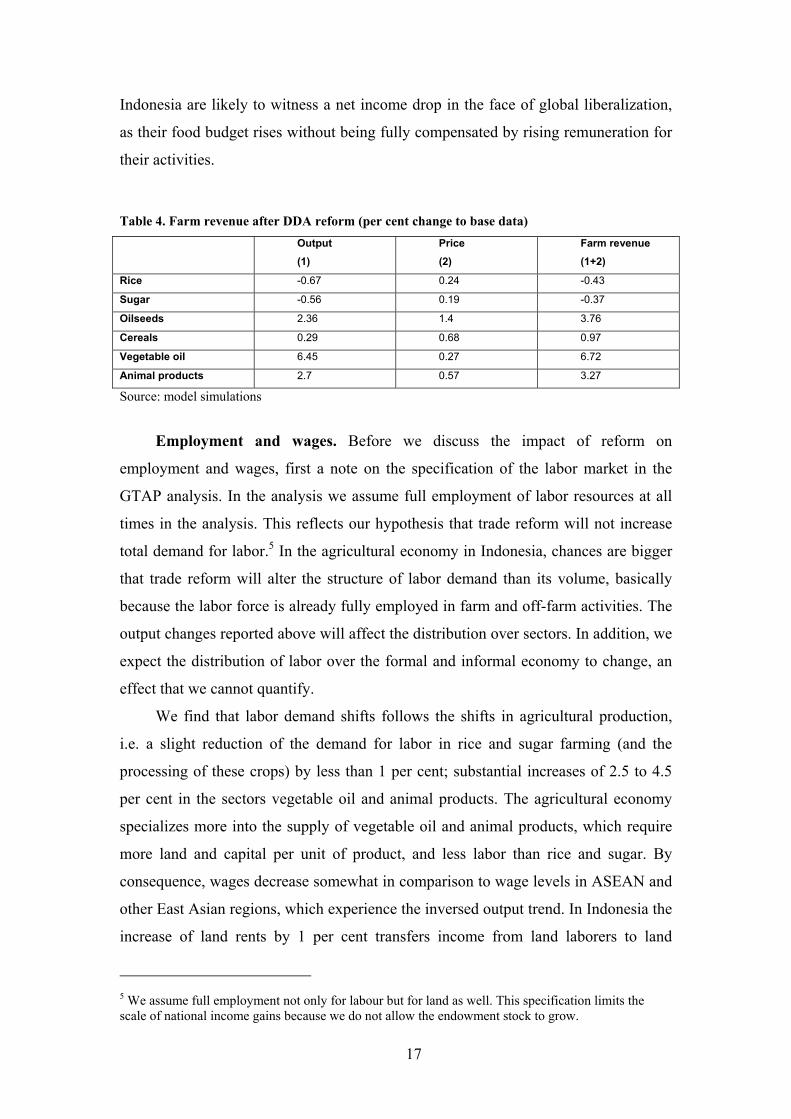
Table 4. Farm revenue after DDA reform (per cent change to base data) Output
(1) Price (2)
Farm revenue (1+2)
Rice -0.67 0.24 -0.43
Sugar -0.56 0.19 -0.37
Oilseeds 2.36 1.4 3.76
Cereals 0.29 0.68 0.97
Vegetable oil 6.45 0.27 6.72
Animal products 2.7 0.57 3.27
Source: model simulations
Employment and wages. Before we discuss the impact of reform on
employment and wages, first a note on the specification of the labor market in the
GTAP analysis. In the analysis we assume full employment of labor resources at all
times in the analysis. This reflects our hypothesis that trade reform will not increase
total demand for labor.5 In the agricultural economy in Indonesia, chances are bigger
that trade reform will alter the structure of labor demand than its volume, basically
because the labor force is already fully employed in farm and off-farm activities. The
output changes reported above will affect the distribution over sectors. In addition, we
expect the distribution of labor over the formal and informal economy to change, an
effect that we cannot quantify.
We find that labor demand shifts follows the shifts in agricultural production,
i.e. a slight reduction of the demand for labor in rice and sugar farming (and the
processing of these crops) by less than 1 per cent; substantial increases of 2.5 to 4.5
per cent in the sectors vegetable oil and animal products. The agricultural economy
specializes more into the supply of vegetable oil and animal products, which require
more land and capital per unit of product, and less labor than rice and sugar. By
consequence, wages decrease somewhat in comparison to wage levels in ASEAN and
other East Asian regions, which experience the inversed output trend. In Indonesia the
increase of land rents by 1 per cent transfers income from land laborers to land
5 We assume full employment not only for labour but for land as well. This specification limits the scale of national income gains because we do not allow the endowment stock to grow.
17
owners. As trade theory predicts, the reduced border protection on manufactures
results in a decline of domestic capital prices. The decline is partly undone by an
increased demand for capital from agriculture.
The realization of potential gains. The results indicate that a key challenge to
Indonesia is to improve export performance in agriculture. Globally, enterprises in the
food sector have incorporated consumer concerns and regulatory demands regarding
health, quality and the environment into their production, marketing and distribution
activities. The core of large retailers and trans-national “agribusiness” corporations
has introduced various technical specifications that govern quality and safety of local
and imported food products, e.g. the guidelines from EurepGAP and British Retail
Consortium.6 As tariffs decline in global food trade, such technical standards that
importers impose become the more impeding trade barriers. They were once skillfully
described as 'the emerging rocks in the ebbing tide.'
The organizational response has generally been to integrate buyers and sellers
within so-called supply chains, which is controlled by the dominant link in the chain.
In many cases this requires direct investments of the controlling link into the primary
stages of production. For such chains to reach out to agriculture in Indonesia requires
quality and stability of supply, and a sound investment climate. The constructive
attitude towards liberalization under the WTO signals a drive towards openness in
Indonesia, which improves investment climate. Such intangible benefits from the
WTO will support the value adding in agriculture through processing and exports.
5. Exempting SPs from multilateral liberalization
In the previous section we looked at the effects of a possible outcome of the
Doha round, but without taking into account the important issue of ‘special products’.
Members agreed in the July package that “Developing country Members will have the flexibility to designate an appropriate number of
products as Special Products, based on criteria of food security, livelihood security and rural
development needs. These products will be eligible for more flexible treatment. The criteria and
6 In marketing, standards operate as a response to an increasing demand for differentiation and quality (including safety) in food consumption. In production, standards are instrumental to achieving efficiency gains within a food chain, by reducing waste, co-ordination cost and incompatibility between links in the chain (Reardon et al., 2001).
18

treatment of these products will be further specified during the negotiation phase and will
recognize the fundamental importance of Special Products to developing countries.” At the same time, developed country members are also granted considerable
leeway by allowing them so-called ‘sensitive products’ that will also receive a more
‘flexible’ treatment with regard to market access commitments: “Without undermining the overall objective of the tiered approach, Members may designate an
appropriate number, to be negotiated, of tariff lines to be treated as sensitive, taking account of
existing commitments for these products.”
Developed countries will designate those products ‘sensitive’ that are currently
subject to regulated trade under tariff rate quota (TRQ). The text speaks of no
justification in the case of sensitive products. By contrast, developing countries will
have to justify the designation of SPs according to food security, rural development,
and similar considerations. Criteria design is a potential deadlock, however, that will
draw heavy on the Geneva delegations of developing countries. Instead these might
want to propose self-designation of SPs, quite in line with the approach of developed
countries.
At this point it is difficult/impossible to foresee the outcomes on SPs. Still, we
have undertaken to estimate the possible effects of exempting products from
liberalization efforts. The coarse nature of our commodity aggregation limits the
choice of products. In the simulation experiment, we therefore allow each region to
designate at most one product as SP.
In order to arrive at some general principles for designation of SPs, we have
used two simple indicators: (i) the existing level of border protection. Assuming that
existing protection patterns reveals countries’ preferences as to what they see as
products that deserve protection, we select those agricultural products that currently
have the highest applied tariffs. This indicator is combined with (ii) the output-
weighted contribution to total farm income. This indicator should reveal the
importance of the commodity concerned for rural incomes, and we choose those
products that contribute the highest shares. All this leads us to a rather simple list: for
all the Asian countries we assume rice to be a special product, except for India, where
we assume vegetable oils to be of particular importance; the EU is very likely to
continue some form of restrictive sugar policies, in spite of recent moves towards
reforms of the EU sugar regime; for North America and South-and Central America
19

we assume animal products to be special; finally, Brazil, the Oceania region and our
heterogeneous ‘rest of world’ are not assumed to designate SPs.
Modelling SPs. Our implementation of SPs is very straightforward, and is
certainly an oversimplified representation of what will eventually be negotiated in the
Doha round: we simply assume that members choose not to liberalize policies in their
SPs. That is, they do not commit to further reductions in market access barriers, and if
applicable no reduction of domestic support and no reduction of export subsidies.
Table 5 reveals the economy-wide welfare effects, from excluding SPs in the
worldwide liberalization efforts. The world as a whole would forego 2.2 billion US$,
or about 20 per cent, relative to the original 11.2 billion US$ gains (21.1 billion US$
including manufactures) discussed in the previous section. The foregone income gain
is unequally distributed, though. It is mainly the high income regions that have high
current protection levels and choose not to liberalize their sensitive products that
would potentially loose: Not reforming the EU25 sugar regime and maintaining the
practice of export subsidization implies a net loss of about 1.4 billion US$. Similarly,
not opening the highly protected rice markets in Japan and Korea leads to a drop in
welfare equivalent to 1.1 billion US$ in this region, with a negative welfare impact on
rice exporting regions in Asia.
Even more disturbing is the effect on real farm incomes. While farm incomes in
Japan and Korea and in the EU25 would rise relative to the original scenario, the low-
income regions in our model would see a (very) slight, and negligible drop in their
farming incomes. Hence, while high-income regions would transfer resources from
consumers and citizens to farmers in sensitive products, farmers in low-income
countries would not experience significant income gains from the exclusion of SPs.
The reason for this result is that the multilateral non-inclusion of products in the
liberalization efforts hampers export opportunities for low-income countries. This is
especially evident in the rice (JAKO) and sugar (EU25) case. To Indonesia, the
decline in export opportunities due to SPs is insignificant in our model.
Table 5. Welfare change after designating Special Products (million US dollar) Total EV
Million US$
1 = 2+3+4
Border protection
2
Export subsidies
3
Domestic support
4
Real farm income (%)
5INDON 4 -4 8 0 -0.02
20

ASEAN -48 -78 31 -1 -0.9CHINA 58 -12 71 0 -0.06JAKO -1133 -1381 270 -22 1.11INDIA 2 4 -2 0 -0.06EU25 -1377 -120 -1273 15 1.37NAME -697 -685 -21 9 -0.83BRAZ -17 39 -56 0 -0.22SCAM -24 -114 89 1 -0.45OCEA 49 161 -110 -3 0.21ROW 946 -104 1050 -1 -0.27TOTAL -2239 -2293 57 -3 -
Source: model simulations Note: table reports changes in income due to SPs, relative to Doha scenario without SPs
6. Conclusions
This paper has employed a large-scale economic model to quantify potential
interests of Indonesia in the agricultural negotiations under the Doha Development
Agenda. As with all such modeling studies the analysis represents an abstraction from
many details and could be refined in various ways. From our analysis we can draw a
number of conclusions.
Model results. Indonesia's quite liberal trade regime emerged in the wake of the
financial crisis in Asia during the late 1990s. Given low applied protection in
Indonesia, we estimate only small economy-wide welfare (efficiency) gains from own
reforms. In fact, all effects of trade reform are rather small because the integration of
Indonesian agriculture with global markets is quite limited. Small simulated drops in
rice and sugar incomes are more than compensated through expansion in vegetable
oils and animal products. Overall, this results in a small improvement of farmers’
incomes. The realization of these potential benefits depends on the ability to shift
resources into these promising areas of agricultural production. Indonesia’s active
participation in the DDA might facilitate this process of change through its impact on
the investment climate in the country.
Trade negotiations. Our results quantify a range of interests of Indonesia in the
agriculture negotiation. Some are on the defensive side, aimed at conserving
flexibility for protectionist policies. Others are on the offensive side, and relate to the
realization of export potential through domestic transformation of agriculture, and
improved access to export markets.
21

Defensive interests of Indonesia in the negotiations include: (i) Current applied
tariffs are very low, while bound rates are high. The resulting binding overhang gives
a lot of flexibility to increase border protection should Indonesia want to protect
domestic activities from world markets. (ii) Formula reductions of bound rates will
have a limited impact on applied rates. A tiered formula retains flexibility, especially
if ‘special products’ are to be exempted from reduction commitments. (iii) In rice we
find a double-digit rise of imports in the DDA scenario due to reduced border
protection at slightly rising world prices. The import surge could be mitigated through
designating rice as special product (SP). The cost of this price-based policy in terms
of national income loss is limited, while an import ban or restrictive quota regime
would entail significant welfare losses. Not only would an import ban lead to losses in
consumer welfare, through more restricted availability, but the country would also
forego tariff revenues. Criteria design for SPs is a potential deadlock, however. (iv)
Safeguards are an alternative to requesting high bound tariffs for stabilization
purposes. To the extent that Indonesia will be able to negotiate higher bound tariffs on
some agricultural products, the case for a safeguard mechanism in addition is
diminished. However, if bound rates come down then it might be worthwhile to
consider safeguard mechanisms.
Offensive interests in the negotiations include: (i) Domestic support reduction
by OECD is estimated to have small negative impacts on the net importing Indonesian
economy through higher import prices. However, higher world sugar prices that
would result from some reforms in OECD countries would support expansion of the
sugar sector in Indonesia. (ii) The simulations show a limited effect on Indonesia of
improved market access to other countries. The limited realization of export potential
is due to current specialization pattern. Diversification into first-stage processing to
add value to primary products would lead to positive prospects in animal products and
vegetable oils. (iii) If aggressive opening of other markets is attained, Indonesia will
also have to lower its own bound rates, hence loosing some flexibility. This flexibility
can be regained through pushing for a Special Safeguard Mechanism (SSM) and/or
Special Products (SP). Alternatively, maintaining global protection levels would also
leave Indonesia’s flexibility untouched, but this comes at the cost of foregoing future
benefits of opening markets.
22
Acknowledgements
Many thanks to the participants of a seminar at ICASERD in Bogor on November 9, 2004, for providing the authors with useful suggestions. The Ministry of International Cooperation (DGIS) of the Netherlands sponsored this research through the PBSI program, project "Strengthening Agricultural Policies".
References
Achterbosch, T.J., B. Hutabarat, N. Syafa'at, and F.W. van Tongeren (2004) Indonesian Interests in the Agricultural Negotiations under the Doha Development Agenda, ICASERD Working Paper, Bogor
Anderson, K. (2004) Subsidies and Trade Barriers, Challenge Paper prepared for the Copenhagen Consensus project, presented at a roundtable in Copenhagen, 24-28 May 2004.
Bouët, A.,Y. Decreux, L. Fontagné , S. Jean, D. Laborde (2004a), Computing an exhaustive and consistent, ad-valorem equivalent measure of applied protection: a detailed description of MAcMap-HS6 methodology, Paris: CEPII. http://www.cepii.fr/anglaisgraph/bdd/macmap/method.pdf
Bouët, A., J. Bureau, Y. Decreux, S. Jean, (2004b), Assessing the impact of multilateral agricultural liberalization: the contrasted fortunes of developing countries in the Doha Round, Paper presented at the 7th Annual Conference on Global Economic Analysis, Trade, Poverty and the Environment, Washington D.C. June 17-19, 2004. www.gtap.org
Francois, J.F. and Martin, W. (2003), Formula approaches to market access negotiations, World Economy: January, 1-28.
Francois, J., H. van Meijl and F. van Tongeren (2003), Trade liberalisation and developing countries under the Doha round, CEPR discussion paper DP4032.
Harrison, W.J. and K.R. Pearson (1996), Computing solutions for large general equilibrium models using GEMPACK, Computational Economics, Vol 9:83-127.
Hertel, T. (eds)., Global Trade Analysis. Cambridge University Press: Cambridge MA., 1997.
Hertel, T.W, M. Ivanic, P. Preckel and J.A.L. Cranfield (2004), The earnings effect of multilateral trade liberalization: Implications for poverty, The World Bank Economic Review, Vol 18, no. 4: 205-236.
Reardon, T., J.-M. Codron, L. Busch, J. Bingen and C. Harris (2001) “Global change in agrifood grades and standards: Agribusiness strategic responses in developing countries” International Food and Agribusiness Management Review 2(3)
Sawit, M. Husein (2004), Penggunaan Tiered Formula untuk Pemotongan Tarif buat produk Pertanian Indonesia, Bogor: ICASERD, (november 2004).
Organization for Economic Cooperation and Development (OECD), (2000), An Analysis of Officially Supported Export Credits in Agriculture. Directorate for Food, Agriculture and Fisheries and Trade Directorate, Joint Working Party of the Agriculture Committee and the Trade Committee, COM/AGR/TD/WP(2000)91/FINAL, Paris, December.
World Bank (2003), Global Economic Prospects 2004: Realizing the Development Promise of the Doha Agenda, Washington D.C.: The World Bank, September.
WTO (2001), Ministerial Declaration, WTO Ministerial conference, Fourth Session, Doha 9-14 November 2001, WT/MIN(01)/DEC/W/1.
23

WTO (2002a), Members' Usage Of Domestic Support Categories, Export Subsidies And Export Credits, Background Paper by the Secretariat,Committee on Agriculture, Special Session, (5 March 2002), TN/AG/S/1.
WTO (2002b), Export Subsidies: background paper by the secretariat, Committee on Agriculture, Special Session (April 2002), TN/AG/S/8.
WTO (2003), Negotiations on agriculture. First draft of modalities for the further commitments, Committee on Agriculture, Special Session (18 March 2003), TN/AG/W/1/Rev.1.
WTO (2004), Doha work programme: Draft general council decision of 31 July 2004, General Council, WT/GC/W/535.
24