Indonesia Japan Project for Development of REDD+...
105
Indonesia-Japan Project for Development of REDD+ Implementation Mechanism (REDD+ Planning Study) Final Report April 2016 Japan International Cooperation Agency (JICA) Mitsubishi UFJ Research and Consulting Japan Forest Technology Association
Transcript of Indonesia Japan Project for Development of REDD+...

Indonesia-Japan Project for Development of REDD+ Implementation Mechanism
(REDD+ Planning Study)
Final Report
April 2016
Japan International Cooperation Agency (JICA)
Mitsubishi UFJ Research and Consulting
Japan Forest Technology Association

Indonesia-Japan Project for Development of REDD+ Implementation Mechanism (REDD+ Planning Study) Final Report
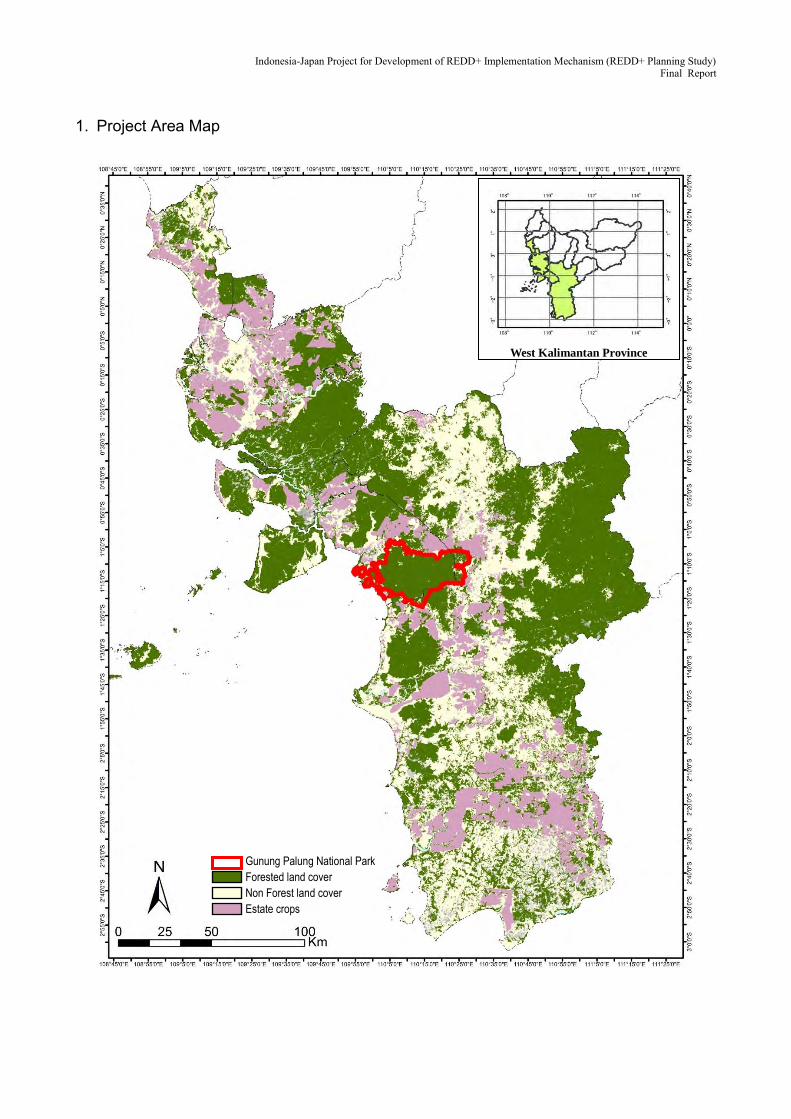
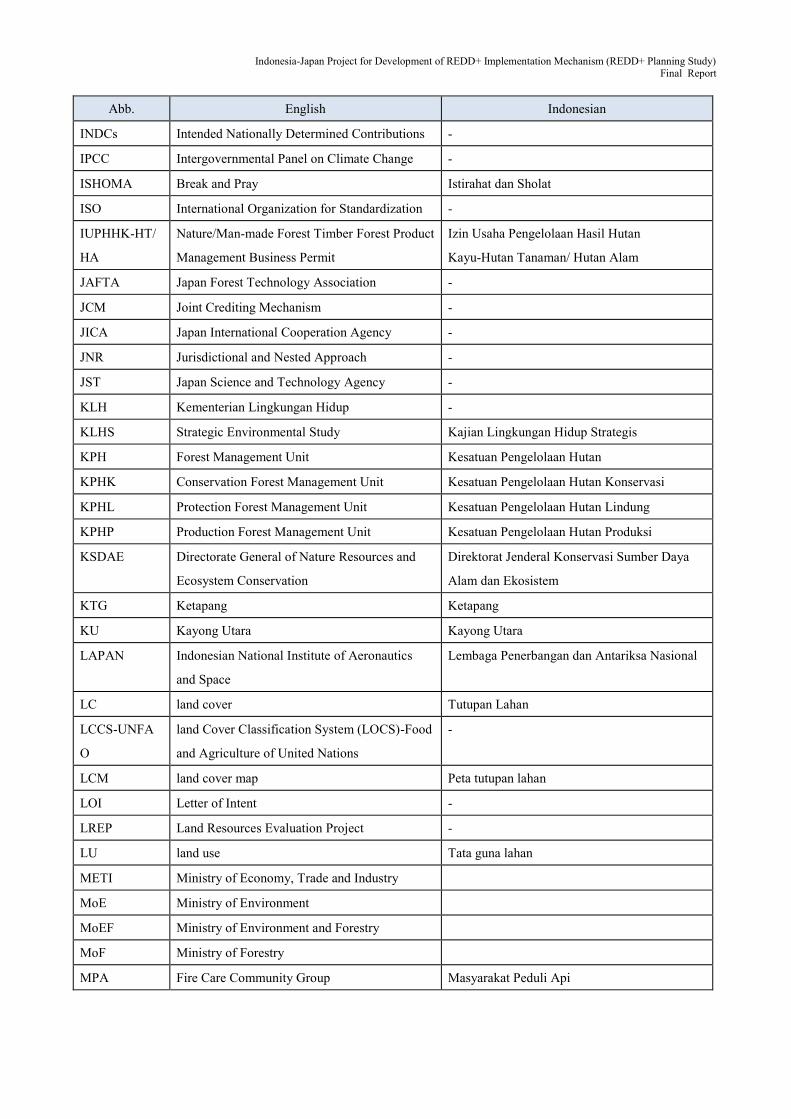
1. Project Area Map
West Kalimantan Province
Gunung Palung National Park
Forested land cover
Non Forest land cover
Estate crops

Indonesia-Japan Project for Development of REDD+ Implementation Mechanism (REDD+ Planning Study) Final Report

Indonesia-Japan Project for Development of REDD+ Implementation Mechanism (REDD+ Planning Study) Final Report
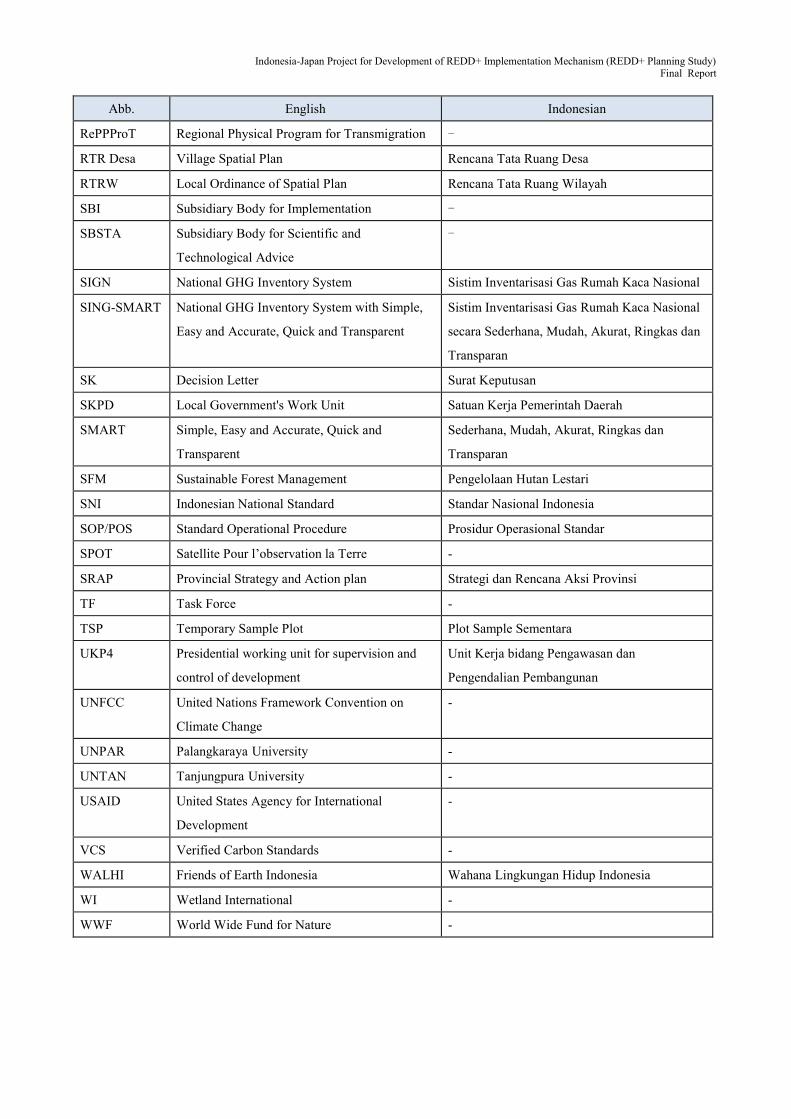
2. Abbreviation Table
Abb. English Indonesian
ADB Asian Development Bank -
ADP The Ad Hoc Working Group on the Durban
Platform for Enhanced Action
-
AEZ Agro Ecological Zone -
AGB Above Ground Biomass -
APL Other land use Areal Penggunaan Lain
ASEAN Association of South‐East Asian Nations -
ASRI - Alam Sehat Lestari (NGO)
BAPENASS National Development Planning Board Badan Perencanaan Pembangunan Nasional
BAPPEDA Local Development and Planning Agency Badan Perencanaan Pembangunan Daerah
BAU Business as Usual
BBSDLP Agriculture Land Resources Research and
Development Center
Balai Besar Penelitian dan Pengembangan
Sumberdaya Lahan Pertanian
BIG Geospatial Information Agency Badan Informasi Geospasial
BKPRD Coordination Agency for Local Spatial Plan
Regulation
Badan Koordinasi Penataan Ruang Daerah
BKSDA Natural Resources Conservation Office Balai Konservasi Sumber Daya Alam
BLH Environmental Agency Badan Lingkungan Hidup
BLHD Local Environmental Agency Badan Lingkungan Hidup Daerah
BPDAS Watershed Management Office Balai pengelolaan Daerah Aliran Sungai
BPKH State Forest Consolidation Office Balai Pemantapan Kawasan Hutan
BPN National Land Affairs Agency Badan Pertanahan Nasional
BSN National Standardization Agency Badan Standarisasi Nasional
CAR Corrective Action Request -
CCLA Community Conservation Livelihood
Agreement
-
CIFOR Center for International Forestry Research -
COP Conference of the Parties -
DAK Special Allocation Fund Dana Alokasi Khusus
DisPU Public Work Service Dinas Pekerjaan Umum
DNPI Indonesian National Council on Climate
Change
Dewan Nasional Perubahan Iklim
DRC Democratic Republic of the Congo -

Indonesia-Japan Project for Development of REDD+ Implementation Mechanism (REDD+ Planning Study) Final Report
Abb. English Indonesian
FAO Food and Agriculture Organization of the
United Nations
-
FCP Japanese Technical Cooperation Project for
Program of Community Development of Fires
Control in Peat Land Area
Program Pengembangan Masyarakat dalam
Pengendalian Kebakaran di Areal Gambut
FFI Fauna Flora International (NGO) -
FGD Focus Group Discussion -
FMU Forest Management Unit -
FORDA Forest Research and Development Agency -
FPIC Free, Prior, and Informed Consent -
FREL Forest Reference Emission Level -
GCF Green Climate Fund -
GCF Governors' Climate and Forests Task Force -
GHG Greenhouse Gases -
GIS Geographical Information System -
GIZ Deutsche Gesellschaft fϋr Internationale
Zusammenarbeit
-
GPNP/TNGP Gunung Palung National Park -
GPS Global Positioning System -
HD Village Forest Hutan Desa
HGU Business Use Right Hak Guna Usaha
HH Right Forest Hutan Hak
HK Conservation Forest Hutan Konservasi
HL Protection Forest Hutan Lindung
HP Production Forest Hutan Produksi
HPT Limited Production Forest Hutan Produksi Terbatas
HPK Convertible Production Forest Hutan Produksi yang Dapat Konversi
HPH Forest Concession Hak Pengusahaan Hutan
HR Private Forest Hutan Rakyat
HTI Industrial Plantation Forest Hutan Tanaman Industri
IAR International Animal Rescue (NGO) -
IFACS Indonesia Forestry and Climate Support -
IJ-REDD+ Indonesia-Japan Project for Development of
REDD+ Implementation Mechanism
-
INCAS Indonesian National Carbon Accounting System -
Indonesia-Japan Project for Development of REDD+ Implementation Mechanism (REDD+ Planning Study) Final Report
Abb. English Indonesian
INDCs Intended Nationally Determined Contributions -
IPCC Intergovernmental Panel on Climate Change -
ISHOMA Break and Pray Istirahat dan Sholat
ISO International Organization for Standardization -
IUPHHK-HT/
HA
Nature/Man-made Forest Timber Forest Product
Management Business Permit
Izin Usaha Pengelolaan Hasil Hutan
Kayu-Hutan Tanaman/ Hutan Alam
JAFTA Japan Forest Technology Association -
JCM Joint Crediting Mechanism -
JICA Japan International Cooperation Agency -
JNR Jurisdictional and Nested Approach -
JST Japan Science and Technology Agency -
KLH Kementerian Lingkungan Hidup -
KLHS Strategic Environmental Study Kajian Lingkungan Hidup Strategis
KPH Forest Management Unit Kesatuan Pengelolaan Hutan
KPHK Conservation Forest Management Unit Kesatuan Pengelolaan Hutan Konservasi
KPHL Protection Forest Management Unit Kesatuan Pengelolaan Hutan Lindung
KPHP Production Forest Management Unit Kesatuan Pengelolaan Hutan Produksi
KSDAE Directorate General of Nature Resources and
Ecosystem Conservation
Direktorat Jenderal Konservasi Sumber Daya
Alam dan Ekosistem
KTG Ketapang Ketapang
KU Kayong Utara Kayong Utara
LAPAN Indonesian National Institute of Aeronautics
and Space
Lembaga Penerbangan dan Antariksa Nasional
LC land cover Tutupan Lahan
LCCS-UNFA
O
land Cover Classification System (LOCS)-Food
and Agriculture of United Nations
-
LCM land cover map Peta tutupan lahan
LOI Letter of Intent -
LREP Land Resources Evaluation Project -
LU land use Tata guna lahan
METI Ministry of Economy, Trade and Industry
MoE Ministry of Environment
MoEF Ministry of Environment and Forestry
MoF Ministry of Forestry
MPA Fire Care Community Group Masyarakat Peduli Api

Indonesia-Japan Project for Development of REDD+ Implementation Mechanism (REDD+ Planning Study) Final Report
Abb. English Indonesian
MRV Measuring/Reporting/Verification Pengukuran, Pelaporan dan Verifikasi
MURC Mitsubishi UFJ Research & Consulting -
NAMAs Nationally Appropriate Mitigation Actions -
NFI National Forest Inventory Inventarisasi Hutan Nasional
NGO Non Government Organization LSM
NIR Near Infrared -
NP National Park Taman Nasional
NTFP Non timber forest products Hasil Hutan Bukan Kayu
ODA Official Development Assistance -
PALSAR Phased Array type L-band Synthetic Aperture
Rader
-
PCA Principal Component Analysis -
PD Project Description -
PDD Project Design Document -
PDM Project Design Matrix -
PEP Monitoring, Evaluation and Reporting Pemantauan, Evaluasi dan Pelaporan
PHKA Directorate General of Forest Protection and
Nature Conservation
Direktorat Jenderal Perlindungan Hutan dan
Konservasi Alam
PIPIB Indonesian Forest Moratorium map Peta Indikatif Penundaan Izin Baru
PLANOLOGI Directorate General of Forest Planning Direktorat Planlogi Hutan
PLG Mega Rice Project Pengembangan Lahan Gambut
PO Plan of Operation -
PSF Peat Swamp Forest -
PSP Permanent Sample Plot Petak Sample Permanen
QA/QC Quality Assessment/Quality Control -
QGIS Quantum GIS -
R/D Record of discussion -
RAD-GRK Regional Action Plan for Green House Gasses Rancana Aksi Daerah Penurunan Emisi Gas
Rumah Kaca
RAN-GRK National Action Plan Reducing Greenhouse Gas
Emissions
Rancana Aksi Nasional Penurunan Emisi Gas
Rumah Kaca
RBI - Peta Rupa Bumi Indonesia
REDD+ Reducing emissions from deforestation and
forest degradation and plus
-
REL/RL Reference Emission Level/reference level -
Indonesia-Japan Project for Development of REDD+ Implementation Mechanism (REDD+ Planning Study) Final Report
Abb. English Indonesian
RePPProT Regional Physical Program for Transmigration -
RTR Desa Village Spatial Plan Rencana Tata Ruang Desa
RTRW Local Ordinance of Spatial Plan Rencana Tata Ruang Wilayah
SBI Subsidiary Body for Implementation -
SBSTA Subsidiary Body for Scientific and
Technological Advice
-
SIGN National GHG Inventory System Sistim Inventarisasi Gas Rumah Kaca Nasional
SING-SMART National GHG Inventory System with Simple,
Easy and Accurate, Quick and Transparent
Sistim Inventarisasi Gas Rumah Kaca Nasional
secara Sederhana, Mudah, Akurat, Ringkas dan
Transparan
SK Decision Letter Surat Keputusan
SKPD Local Government's Work Unit Satuan Kerja Pemerintah Daerah
SMART Simple, Easy and Accurate, Quick and
Transparent
Sederhana, Mudah, Akurat, Ringkas dan
Transparan
SFM Sustainable Forest Management Pengelolaan Hutan Lestari
SNI Indonesian National Standard Standar Nasional Indonesia
SOP/POS Standard Operational Procedure Prosidur Operasional Standar
SPOT Satellite Pour l’observation la Terre -
SRAP Provincial Strategy and Action plan Strategi dan Rencana Aksi Provinsi
TF Task Force -
TSP Temporary Sample Plot Plot Sample Sementara
UKP4 Presidential working unit for supervision and
control of development
Unit Kerja bidang Pengawasan dan
Pengendalian Pembangunan
UNFCC United Nations Framework Convention on
Climate Change
-
UNPAR Palangkaraya University -
UNTAN Tanjungpura University -
USAID United States Agency for International
Development
-
VCS Verified Carbon Standards -
WALHI Friends of Earth Indonesia Wahana Lingkungan Hidup Indonesia
WI Wetland International -
WWF World Wide Fund for Nature -

Indonesia-Japan Project for Development of REDD+ Implementation Mechanism (REDD+ Planning Study) Final Report
Indonesia-Japan Project for Development of REDD+ Implementation Mechanism (REDD+ Planning Study) Final Report
Indonesia-Japan Project for Development of REDD+ Implementation
Mechanism (REDD+ Planning Study)
Final Report
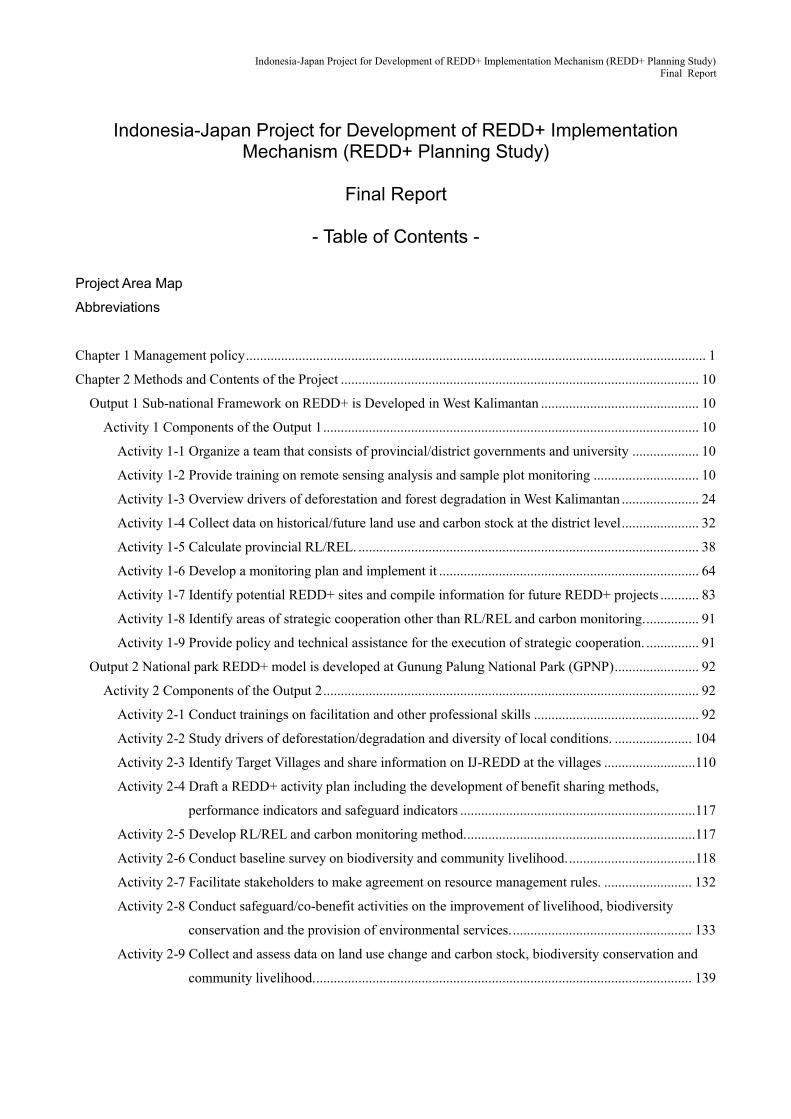
- Table of Contents - Project Area Map Abbreviations
Chapter 1 Management policy ................................................................................................................................... 1
Chapter 2 Methods and Contents of the Project ...................................................................................................... 10
Output 1 Sub-national Framework on REDD+ is Developed in West Kalimantan ............................................. 10
Activity 1 Components of the Output 1 ........................................................................................................... 10
Activity 1-1 Organize a team that consists of provincial/district governments and university ................... 10
Activity 1-2 Provide training on remote sensing analysis and sample plot monitoring .............................. 10
Activity 1-3 Overview drivers of deforestation and forest degradation in West Kalimantan ...................... 24
Activity 1-4 Collect data on historical/future land use and carbon stock at the district level ...................... 32
Activity 1-5 Calculate provincial RL/REL. ................................................................................................. 38
Activity 1-6 Develop a monitoring plan and implement it .......................................................................... 64
Activity 1-7 Identify potential REDD+ sites and compile information for future REDD+ projects ........... 83
Activity 1-8 Identify areas of strategic cooperation other than RL/REL and carbon monitoring. ............... 91
Activity 1-9 Provide policy and technical assistance for the execution of strategic cooperation. ............... 91
Output 2 National park REDD+ model is developed at Gunung Palung National Park (GPNP) ........................ 92
Activity 2 Components of the Output 2 ........................................................................................................... 92
Activity 2-1 Conduct trainings on facilitation and other professional skills ............................................... 92
Activity 2-2 Study drivers of deforestation/degradation and diversity of local conditions. ...................... 104
Activity 2-3 Identify Target Villages and share information on IJ-REDD at the villages ..........................110
Activity 2-4 Draft a REDD+ activity plan including the development of benefit sharing methods,
performance indicators and safeguard indicators ...................................................................117
Activity 2-5 Develop RL/REL and carbon monitoring method. .................................................................117
Activity 2-6 Conduct baseline survey on biodiversity and community livelihood. ....................................118
Activity 2-7 Facilitate stakeholders to make agreement on resource management rules. ......................... 132
Activity 2-8 Conduct safeguard/co-benefit activities on the improvement of livelihood, biodiversity
conservation and the provision of environmental services. ................................................... 133
Activity 2-9 Collect and assess data on land use change and carbon stock, biodiversity conservation and
community livelihood. ........................................................................................................... 139

Indonesia-Japan Project for Development of REDD+ Implementation Mechanism (REDD+ Planning Study) Final Report
Activity 2-10 Draft a REDD+ PDD for GPNP and its Landscape............................................................. 152
Output 3 REDD+ model for HP/HL/APL is developed at pilot site(s) in West Kalimantan.. ........................... 174
Activity 3 Components of the Output 3 ......................................................................................................... 174
Activity 3-1 Conduct studies on conventional management of HP/HL/APL (peatland) ........................... 174
Activity 3-2 Identify pilot site(s) for improved management of HP/HL/APL (peatland) .......................... 174
Activity 3-3 Calculate RL/REL for pilot site(s). ........................................................................................ 174
Activity 3-4 Identify policy and measures for improved management of HP/HL/APL (peatland) including
the development of performance/safeguard indicators. ......................................................... 174
Activity 3-5 Estimate CO2 emission for improved management. .............................................................. 174
Activity 3-6 Develop a carbon monitoring method. .................................................................................. 174
Activity 3-7 Conduct baseline survey on biodiversity and community livelihood. ................................... 174
Activity 3-8 Conduct safeguard/co-benefit activities on the improvement of livelihood, biodiversity
conservation and the provision of environmental services. ................................................... 174
Activity 3-9 Collect and assess data on land use change and carbon stock, biodiversity conservation and
community livelihood. ........................................................................................................... 174
Activity 3-10 Draft an operational manual of REDD+ model by analyzing local conditions, policy
instruments, project activities and their impacts.................................................................... 174
Output 4 Capacity of carbon monitoring is enhanced at the provincial level in Central Kalimantan. ............... 176
Activity 4 Components of Output 4 ............................................................................................................... 176
Activity 4-1 Assist to organize MRV institution. ....................................................................................... 176
Activity 4-2 Provide training for MRV institution, local governments and communities to enhance
knowledge and skills on carbon monitoring. ......................................................................... 176
Activity 4-3 Assess carbon monitoring methods that are applied/being developed by REDD+ projects
including JICA-JST in terms of accuracy, costs and accessibility. ........................................ 179
Activity 4-4 Provide technical assistance for MRV institution according to its requirement. ................... 179
Other Activities Conducted................................................................................................................................ 180
Chapter 3 Recommendations ................................................................................................................................. 182
Output 1 ............................................................................................................................................................. 182
Output 2 ............................................................................................................................................................. 182
Others ................................................................................................................................................................ 183
Indonesia-Japan Project for Development of REDD+ Implementation Mechanism (REDD+ Planning Study) Final Report
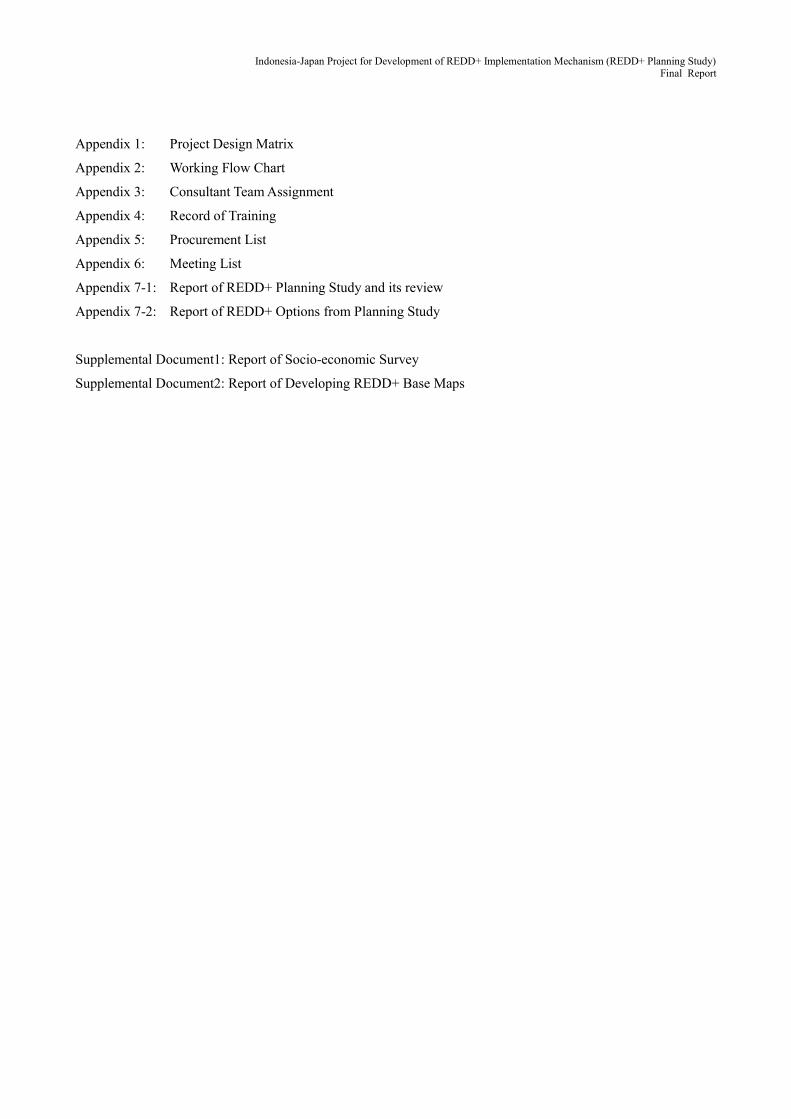
Appendix 1: Project Design Matrix
Appendix 2: Working Flow Chart
Appendix 3: Consultant Team Assignment
Appendix 4: Record of Training
Appendix 5: Procurement List
Appendix 6: Meeting List
Appendix 7-1: Report of REDD+ Planning Study and its review
Appendix 7-2: Report of REDD+ Options from Planning Study
Supplemental Document1: Report of Socio-economic Survey
Supplemental Document2: Report of Developing REDD+ Base Maps

Indonesia-Japan Project for Development of REDD+ Implementation Mechanism (REDD+ Planning Study) Final Report

Indonesia-Japan Project for Development of REDD+ Implementation Mechanism (REDD+ Planning Study) Final Report
- 1 -
Chapter 1 Management policy
1. Background
1.1. International trend in REDD+
At the 13th Conference of the Parties (COP 13) to the United Nations Framework Convention on Climate Change (UNFCCC) in 2007, hosted by Indonesia, the Bali Action Plan was adopted. Under the plan, REDD+ was recognized as one of the mitigation actions of the next framework started in 2013. Since then technical issues had been discussed and the broad agreement (Warsaw Outcomes) was made on measures for the issues by 2013 (COP 19).
Meanwhile the agreements were also made on the mechanism and strategy for REDD+ implementation that developing countries establish national entities or focal points as REDD+ windows for UNFCCC and prepare to implement REDD+ and receive results-based payments (e.g. providing summary of information on safeguards). Also in COP 20 in 2014 held in Peru, it was decided that UNFCCC secretariat established special REDD+ information hub named in “Lima REDD+ Information Hub”, which was according to Warsaw International Mechanism.
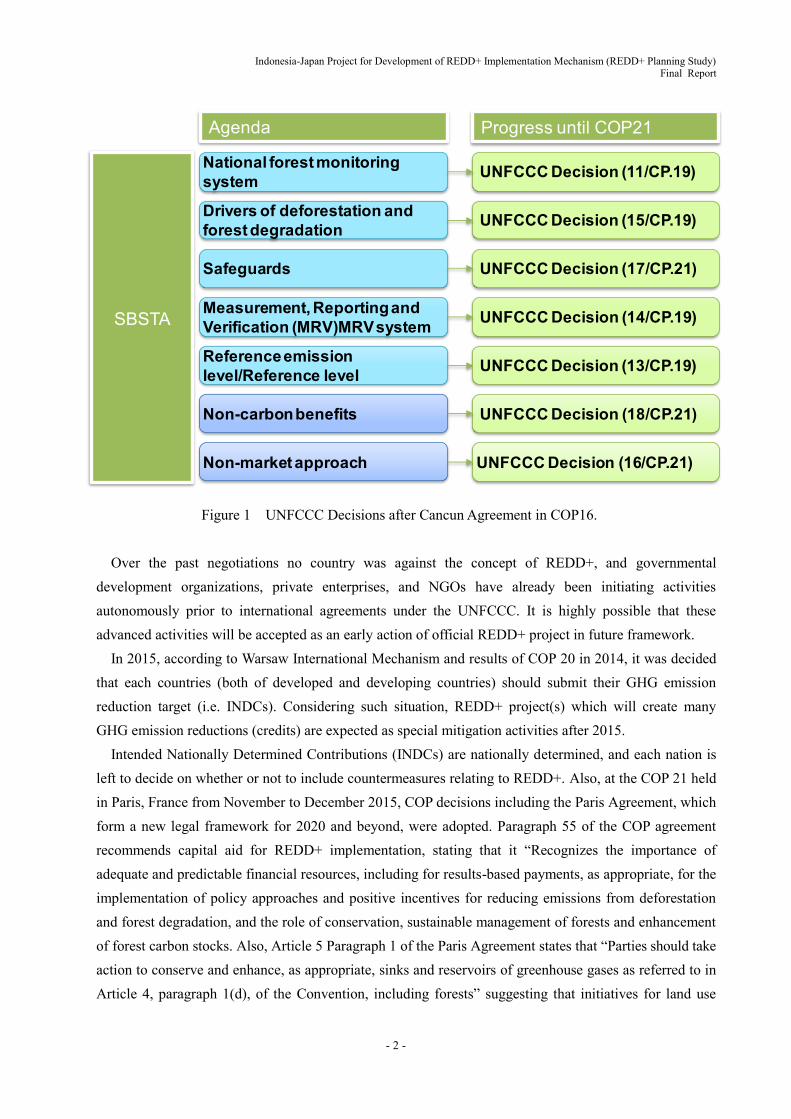
The Ad Hoc Working Group on the Durban Platform for Enhanced Action (ADP 2-9) and the 42nd sessions of the Subsidiary Body for Implementation (SBI 42) and the Subsidiary Body for Scientific and Technological Advice (SBSTA 42) were held in June 2015 in Bonn, Germany. The SBSTA 42 meeting gave consideration of three methodological issues on REDD+ (non-carbon benefit, non-market based approaches, safeguard) that were left, with an agreement reached on a draft conclusion (FCCC/SBSTA/2015/L.5) and all technical considerations relating to REDD+ completed (Figure 1).
Indonesia-Japan Project for Development of REDD+ Implementation Mechanism (REDD+ Planning Study) Final Report
- 2 -
Figure 1 UNFCCC Decisions after Cancun Agreement in COP16.
Over the past negotiations no country was against the concept of REDD+, and governmental development organizations, private enterprises, and NGOs have already been initiating activities autonomously prior to international agreements under the UNFCCC. It is highly possible that these advanced activities will be accepted as an early action of official REDD+ project in future framework.
In 2015, according to Warsaw International Mechanism and results of COP 20 in 2014, it was decided that each countries (both of developed and developing countries) should submit their GHG emission reduction target (i.e. INDCs). Considering such situation, REDD+ project(s) which will create many GHG emission reductions (credits) are expected as special mitigation activities after 2015.
Intended Nationally Determined Contributions (INDCs) are nationally determined, and each nation is left to decide on whether or not to include countermeasures relating to REDD+. Also, at the COP 21 held in Paris, France from November to December 2015, COP decisions including the Paris Agreement, which form a new legal framework for 2020 and beyond, were adopted. Paragraph 55 of the COP agreement recommends capital aid for REDD+ implementation, stating that it “Recognizes the importance of adequate and predictable financial resources, including for results-based payments, as appropriate, for the implementation of policy approaches and positive incentives for reducing emissions from deforestation and forest degradation, and the role of conservation, sustainable management of forests and enhancement of forest carbon stocks. Also, Article 5 Paragraph 1 of the Paris Agreement states that “Parties should take action to conserve and enhance, as appropriate, sinks and reservoirs of greenhouse gases as referred to in Article 4, paragraph 1(d), of the Convention, including forests” suggesting that initiatives for land use
National forest monitoring system
Reference emission level/Reference level
Safeguards
Drivers of deforestation and forest degradation
Non-market approach
Non-carbon benefits
SBSTA
UNFCCC Decision (11/CP.19)
UNFCCC Decision (14/CP.19)
UNFCCC Decision (13/CP.19)
UNFCCC Decision (17/CP.21)
UNFCCC Decision (15/CP.19)
UNFCCC Decision (16/CP.21)
UNFCCC Decision (18/CP.21)
Agenda Progress until COP21
Measurement, Reporting and Verification (MRV)MRV system
Indonesia-Japan Project for Development of REDD+ Implementation Mechanism (REDD+ Planning Study) Final Report
- 3 -
fields including REDD+ are important both in developed and developing countries. The Paris Agreement also sets forth an obligation for nations to renew their reduction targets every 5 years, with each nation requested to make greater efforts in order to achieve a reducing emissions to hold the increase temperature to below 2 degree above pre-industrial levels. REDD+ will contribute greatly to reducing emissions, and it is expected that each nation will further investigate targets including REDD+ going forwards.
1.2. Actions by the Government of Japan
Japan proposed not participating in the second commitment period of the Kyoto Protocol so that Japan does not have responsibility to reduce GHG emissions. On the other hand, a scheme for promoting strategy for reducing GHG emissions in developing countries by fully utilizing Japan’s ability of contribution through such as low carbon technology and products should be discussed. Based on this view, Japan has been proposing the Joint Crediting Mechanism (JCM) (In August 2013, Japan and Indonesia agreed and singed to the JCM documents). Various guidelines and methodologies have been prepared in order to achieve emission reductions under the JCM at an early stage. The first JCM project was registered in October 2014 in Indonesia, and as of November 2015 a total of 10 methodologies and 3 projects have been registered.
One feasibility study was undertaken for REDD+ in fiscal year 2015 by the Ministry of Economy, Trade and Industry (METI), and two JCM-REDD+ subsidized projects were implemented by the Ministry of the Environment (the Secretariat was the Global Environment Center Foundation). In Indonesia, discussions were held between Japan and Indonesia regarding REDD+ methodology development guidelines (there are also plans to consider various other guidelines relating to REDD+) with the aim of implementing REDD+ under the JCM, and the Ministry of the Environment is proceeding with subsidized projects in Boalemo province. These REDD+ initiatives under the JCM are considered important because of the enormous potential.
To promote REDD+ activities under the JCM, public-private collaboration has put efforts, and some private enterprises have made steady progress, such as obtaining permission (concessions), to implement REDD+ fully. Also most of stakeholders of REDD+ expected that registration of REDD+ project(s) and creation of GHG emission reductions (credits) are be done in 2015 and after 2015,
1.3. Role of Japan International Cooperation Agency (JICA) in promoting REDD+
Since REDD+ is to be implemented in developing countries, it is inseparable from technical issues on methods to project future GHG emissions and to calculate actual GHG emissions and removals, and political issues such as harmonizing views amongst stakeholders including rural people. That is why immense knowledge and experience are required to implement REDD+. In that context, JICA has been continuously running forest conservation projects in developing countries: actions against technical issues on measuring/reporting/verification (MRV) system, focusing on capacity building toward REDD+

Indonesia-Japan Project for Development of REDD+ Implementation Mechanism (REDD+ Planning Study) Final Report
- 4 -
implementation including promoting participatory forest conservation, cultivating knowledge and experience of concerned issues on REDD+, and building human network.
The cooperation between JICA and other organizations such as private enterprises is significant to proceed with REDD+ projects implemented and supported by Japan, including such as enterprises. It is also important to build a JICA-centered REDD+ implementation structure (Figure 2).
*This study will consider collaborations with such as private enterprises in the phase 2 as depicted in the figure above.
Figure 2 Collaboration between JICA and private enterprises, etc. for REDD+ implementation
In November 2014, specific forum of “Japan Public-Private Platform for REDD+” had established, and as one of the taskforces under the forum, “Taskforce on REDD+ Business Model” also established. The Taskforce is aiming to develop the REDD+ implementing structure which will be designed as “Japan REDD+ Model” and such activities will be related in REDD+ activities in Indonesia and direction of this study.
2. Objectives
2.1. Planning study for developing REDD+ project model
This study is in charge of a part of REDD+ activities undertaken for West Kalimantan Province, which is a technical cooperation project, Indonesia-Japan Project for Development of REDD+ Implementation Mechanism (IJ-REDD+), and aims to promote activities inclusively to implement REDD+. In particular, this study supported REDD+ implementation in the four western districts of West Kalimantan Province -Mempawah, Kubu Raya, Kayong Utara and Ketapang- and carried out activities for studying to develop a REDD+ project model for Gunung Palung National Park (GPNP) and its landscape. In addition, this study was technically support REDD+ and mitigation actions by the forest sector such as establishing a sub-national based reference level (RL), which West Kalimantan Province is working on in accordance with the Local Action Plan for Reducing Greenhouse Gas Emissions (RAD-GRK) formalized through the Presidential Regulation No.71/2011. Thus, this study was implemented in order to intend to develop the
Payment for performance on the basis of achievement of agreed emission reductions by using easy-to-measure indicators
Payment on the basis of emission reductions and removals verified through MRV system
Phase 1: Readiness
Building collaboration between JICA and such as private enterprises
Phase 3: Full-scale implementation
Phase2: Implementation
Developing national REDD+ strategies (e.g. capacity building in developing countries)
Conducted by private enterprises and etc.Conducted by JICA
Indonesia-Japan Project for Development of REDD+ Implementation Mechanism (REDD+ Planning Study) Final Report
- 5 -
project to a sub-national based REDD+ project across West Kalimantan Province in the future.
2.2. Others
This study carried out activities in the four western districts of West Kalimantan Province (Mempawah, Kubu Raya, Kayong Utara and Ketapang) and GPNP, especially focusing on activities to be validated and registered as a REDD+ project for GPNP. Such activities would be good case studies not only for REDD+ projects undertaken in the areas concerned but also for other areas in Indonesia and other countries all over the world. Thus, knowledge and experience, which was accumulated through this study, would be shared effectively and efficiently to promote REDD+ projects undertaken and supported by the Government of Japan.
3. Understanding of this study
3.1. Key points to be considered
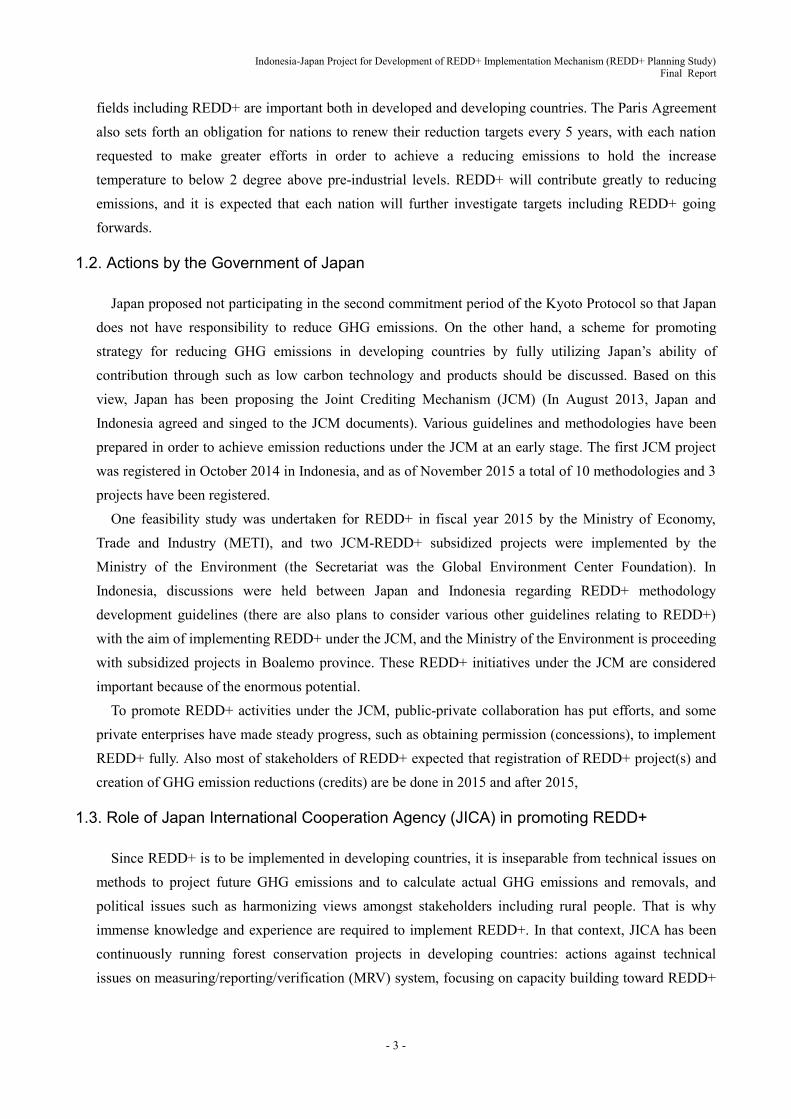
Regarding the emission trading system, including free market, as a place to trade REDD+-derived credits, its methodology has been discussed and its structure has also been continuously coordinated. As a result, its circumstance is changing every minute. For example, according to an Ecosystem Marketplace report, projects originating from deforestation control in 2014 ranked highest by sector in independent markets, and there are high hopes for credits derived from REDD+. Therefore, to understand and evaluate such trend appropriately, it is necessary to provide personnel thoroughly familiar with international negotiations, activities undertaken by other countries and trends in Japan from the past up to the present. Consequently, regarding ever-changing emission trading system and REDD+, it is highly possible that the most updated information has not documented yet or even if information is documented, the circumstances have already changed.
Indonesia-Japan Project for Development of REDD+ Implementation Mechanism (REDD+ Planning Study) Final Report
- 6 -
Source) Ecosystem Market Place entitled as ”State of the Carbon Markets 2015” Figure 3 Transaction of REDD+ credits in Voluntary Market in 2014
For this reason, it is particularly important to exchange information with researchers, consultants and
government officials engaged in REDD+ in Japan and abroad.
3.2. Understanding of Indonesia
Indonesia submitted goals for GHG emission reductions at the Copenhagen Accord, COP15 held in the end of 2010, so that it is imperative to implement mitigation actions with a central focus on REDD+. In February 2011, the National Action Plan for Reducing Greenhouse Gas Emissions (RAN-GRK) was prepared under the Presidential Regulation No.61/2011 and “GHG emission reduction targets for each sector” were announced. Meanwhile, each Indonesian province was required to prepare “provincial GHG emission reduction scenario” by September 2012 in accordance with the RAD-GRK. This raised expectations for REDD+ to have profound mitigation effect by synergy between the RAN-GRK and the RAD-GRK. Under the RAN-GRK, GHG emission reduction target is to be achieved by implementing expected Nationally Appropriate Mitigation Actions (NAMAs), including REDD+. The NAMAs basically consists of existing emission reduction programs and activities of all sectors (forestry, agriculture, industry, mining, energy, public works and so forth). It remains to be seen what methods will be taken to achieve the targets; however, the National Council on Climate Change (DNPI) set the RL as Business as Usual (BaU) and announced following: utilizing the national budget for measures to reduce emission by 26% or autonomously implementing NAMAs (Unilateral NAMAs) within Indonesia, and for
Indonesia-Japan Project for Development of REDD+ Implementation Mechanism (REDD+ Planning Study) Final Report
- 7 -
the extra 15% emission reduction, utilizing the budget of Official Development Assistance (ODA) or implementing financially supported foreign NAMAs (Financed/Supported NAMAs). Additionally, further emission reduction seems to be considered as NAMAs, which enables to generate credit (Creditable NAMAs).
3.3. Context of forest sector in Indonesia
In Indonesia, 1.36 million hectares out of 1.92 million hectares of land mass (approximately 71%) is classified as forest, which is the third biggest tropical forest (approximately 10% of world tropical forest mass) behind Brazil and Democratic Republic of the Congo (DRC). Therefore, forest management in Indonesia is not a domestic agenda but the particularly important to mitigate global warming on global basis. However, as a result of exploitation of forest development and timber products since the early 1970s, over 20 million m3 of logs had been produced per year till 1990s and this significant deforestation became a concern world widely. In addition, illegal logging, forest fire, and conversion of lands to agriculture enhance forest degradation. Researchers and NGOs have alerted that if no immediate action is taken, Sumatra Island as well as 98% of Kalimantan Island forest will be disappeared by 2022.
Demand of wood resources and developing oil palm farm are not exception. Intensive buying of resources by multinational companies is getting noticeable in response to a world trend to secure resources. In particular, conversion to oil palm farms in Indonesia has increased drastically since bio fuel, as a raw material, has caught attention as substitute energy.
Considering land use change driven by deforestation etc., Indonesia’s GHG emission is the third biggest, following USA and China. According to the Second National Communication of Indonesia submitted to UNFCCC in 2005, more than 60% of the GHG emission was resulted from forest related causes including forest fire and peatland fire. Since the COP13 of UNFCCC held in Bali in December 2007, Indonesia, with the supports by Norway and other countries, has developed the National REDD+
Strategy1and discussed a management body for REDD and MRV (REDD+ Agency and MRV Agency), and fund mechanism. In addition, REDD+ Agency had been established in September 2013.
In 2014, Indonesia had President Selection and its result had big effects on Governmental re-structure in central level. From results of Governmental re-structuring, the Ministry of Forestry which is counter-part organization of IJ-REDD+ integrated into the Ministry of Environment and Forestry. Also re-structuring is considered that other organization including REDD+ Agency was integrated into the Ministry of Environment and Forestry.
3.4. Actions for REDD+ in Indonesia
Indonesia and Norway signed a Letter of Intent (LOI) in 2010, and it consequently had accelerated REDD+ efforts in Indonesia. Notably, issuing logging rights has been suspended (moratorium) since 2011, and responding to it, concession (right of land-use) for developing new oil palm farms has been
1 The REDD+ National Strategy was already formulated in June 2012.
Indonesia-Japan Project for Development of REDD+ Implementation Mechanism (REDD+ Planning Study) Final Report
- 8 -
frozen. Such significant political challenges in land use are deeply related to implementation of REDD+ in Indonesia so that it is important to take place tangible REDD+ activities during the moratorium period to ensure the effect of REDD+ will be fully recognized by the time moratorium ends.
Hereafter, major challenges are to review effects of the moratorium, and to maintain the status of deforestation and forest degradation, which have been temporally prevented due to the moratorium. It is assumed that especially areas, in which local economy largely relies on logging industry, like West Kalimantan Province -the target area of this study- will reach a turning point.
Although an REDD+ agency was officially established in Indonesia in September 2013 and actions for various issues to implement REDD+ got underway in earnest, Presidential Regulation No. 16, which was issued on January 23, 2015 led to the REDD Agency being disassembled and its functions were integrated into the Ministry of Environment and Forestry. There are five departments established within the Ministry of Environment and Forestry (Climate Change Mitigation Department, Climate Change Adaptation Department, GHG Inventory/MRV Department, Resource Mobilization Department, and Forest Land Fire Management Department), and it is mainly the Climate Change Mitigation Department that is focusing on REDD+ initiatives. At the same time, when implementing REDD+, it is necessary to proceed not only with initiatives in the forestry field centered on the Ministry of Environment and Forestry, but also through coordination with mine development (under the jurisdiction of the Ministry of Industry and Trade) and plantation development (under the jurisdiction of the Ministry of Agriculture) etc., which are also connected to deforestation/forest degradation.
In 2015, the El Nino phenomenon caused a prolonged dry season and abnormally high temperatures and dryness continued and had been leading to frequent large-scale forest fires in Indonesia. According to a report by the World Resource Institute, 127,000 forest fires were observed, which was the highest numbers since 1997, and peatland fires became severe on Kalimantan Island, where peatland is widely dispersed. In view of this chain of events, President Joko Widodo at UNFCCC COP21 declared the establishment of the Peatland Restoration Agency to perform restoration of peatland destroyed by forest/peatland fires on Sumatra Island and Kalimantan Island, management of peatland, and direct control of rights to use, etc. Going forwards, it is assumed that full-blown initiatives for control of peatland degradation and restoration will be implemented.
Also, Indonesia progressed with development of a National based level submitted to UNFCCC, and “the National Forest Reference Emissions Level (FREL) for REDD+” was submitted to UNFCCC on December 9, 2015. Applied methodologies in the FREL can be related in direction of the technical approach of this study, so attention must be paid to ensure that there is consistency. In addition, because the FREL in Indonesia is very closely related to GHG emission reduction potential (an amount of more than 10 million t-CO2) by implementing REDD+ as described above, the results will be connected to GHG emission reductions (i.e., GHG emission reductions, or INDC) in developed countries. At UNFCCC COP21, held from November to December 2015, each nation submitted an INDC and Indonesia also submitted an INDC on September 24, 2015, indicating GHG (target gases: carbon dioxide, methane, nitrogen oxide) of a 26% BAU ratio from 2010 to 2020 and, with support such as international
Indonesia-Japan Project for Development of REDD+ Implementation Mechanism (REDD+ Planning Study) Final Report
- 9 -
cooperation, a 41% BAU ratio by the year 2030.
Indonesia-Japan Project for Development of REDD+ Implementation Mechanism (REDD+ Planning Study) Final Report
- 10 -
Chapter 2 Methods and Contents of the Project
Output 1 Sub-national Framework on REDD+ is Developed in West Kalimantan
Activity 1 Components of the Output 1
According to Project Design Matrix (PDM) of the project, activities under the Output 1 are separated into 7 activities (from Activity 1-1 to Activity 1-7).
Activity 1-1 Organize a team that consists of provincial/district governments and university
(Not addressed by REDD+ planning study team)
Activity 1-2 Provide training on remote sensing analysis and sample plot monitoring
1. Implementing methods
1.1. Components of the training
REDD+ of this study is expected to be developed into sub-national based REDD+ in medium-long term. It is, thus, preferable that staffs of province or district level get involved in REDD+ proactively. In that context, trainings aimed to nurture people who will be dedicated to REDD+. In addition, the trainings encouraging cooperation with stakeholders such as counterparts of activities in West Kalimantan Province initiated by IJ-REDD+.
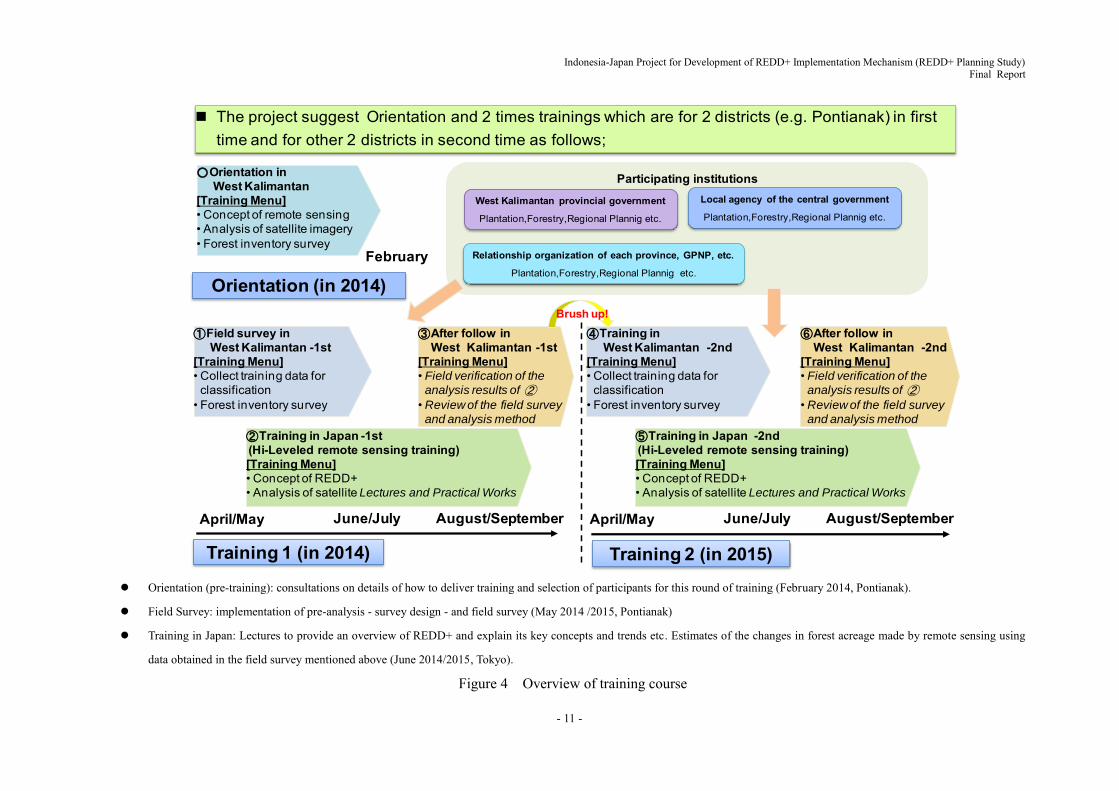
We decided to carry out a course of training as per the schedule and delivery guidelines shown in Figure 4; this included lectures to explain the overview, concept and trends of REDD+. Furthermore, we divided the training into two lots (Year 1: 2014, and Year 2: 2015) as we expected the institutions involved to send a large number of people to participate in the training; institutions that included the state government of West Kalimantan, 4 provincial governments and the central government.
Indonesia-Japan Project for Development of REDD+ Implementation Mechanism (REDD+ Planning Study) Final Report
- 11 -
Orientation (pre-training): consultations on details of how to deliver training and selection of participants for this round of training (February 2014, Pontianak).
Field Survey: implementation of pre-analysis - survey design - and field survey (May 2014 /2015, Pontianak)
Training in Japan: Lectures to provide an overview of REDD+ and explain its key concepts and trends etc. Estimates of the changes in forest acreage made by remote sensing using
data obtained in the field survey mentioned above (June 2014/2015, Tokyo).
Figure 4 Overview of training course
Participating institutions
The project suggest Orientation and 2 times trainings which are for 2 districts (e.g. Pontianak) in first time and for other 2 districts in second time as follows;
June/July
Training 1 (in 2014)
①Field survey in West Kalimantan -1st
[Training Menu]• Collect training data for
classification• Forest inventory survey
②Training in Japan -1st(Hi-Leveled remote sensing training)[Training Menu]• Concept of REDD+• Analysis of satellite Lectures and Practical Works
③After follow in West Kalimantan -1st
[Training Menu]• Field verification of the
analysis results of ②• Review of the field survey
and analysis method
Training 2 (in 2015)
Orientation (in 2014)
West Kalimantan provincial government
Plantation,Forestry,Regional Plannig etc.
④Training in West Kalimantan -2nd
[Training Menu]• Collect training data for
classification• Forest inventory survey
⑤Training in Japan -2nd(Hi-Leveled remote sensing training)[Training Menu]• Concept of REDD+• Analysis of satellite Lectures and Practical Works
Local agency of the central government
Plantation,Forestry,Regional Plannig etc.
⑥After follow in West Kalimantan -2nd
[Training Menu]• Field verification of the
analysis results of ②• Review of the field survey
and analysis method
Relationship organization of each province, GPNP, etc.
Plantation,Forestry,Regional Plannig etc.February
○Orientation in West Kalimantan
[Training Menu]• Concept of remote sensing• Analysis of satellite imagery• Forest inventory survey
Brush up!
April/May August/September June/JulyApril/May August/September

Indonesia-Japan Project for Development of REDD+ Implementation Mechanism (REDD+ Planning Study) Final Report
- 12 -
1.2. Training details – Year 1
The training for Year 1, which began in February 2014, firstly promoted an understanding of REDD+ as a whole and secondly encouraged capacity building among RAD-GRK officers etc., to ensure that in the ordinary course of business they would be able to use GIS analysis technology to carry out studies, investigations and adjustments. In other words the training developed at this stage emphasized the expansion of fundamental personnel involved in the implementation of REDD+, rather than being advanced training to make the REDD+ project in West Kalimantan ready for immediate implementation. As a result the training did not include, for example, the use of advanced technology for the analysis of satellite imagery (such as the introduction/use of software to develop automatic categorization); instead, it taught participants how to efficiently carry out basic tasks for the REDD+ project (such as the use of land cover maps etc.) with the aim of improving fundamental capacity at provincial/state level.
It was noted that with regard to the acquisition of technology for GIS analysis, we used the free GIS/Remote Sensing software "QGIS"; a software that has performed well in recent years and has become popular in developing countries Figure 5.
Figure 5 Target persons and used software
2. Detailed operations in Year-1
2.1. Local pre-training in Indonesia
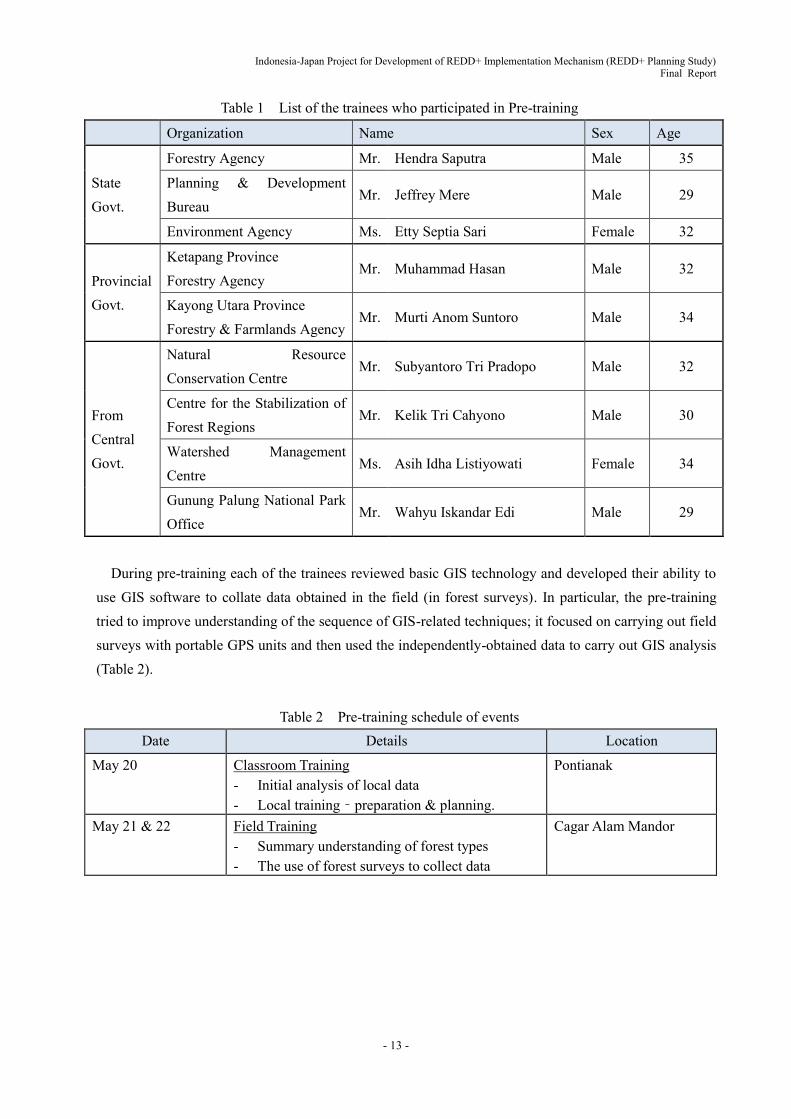
In February 2014, the first phase was the basic training held in Pontianak, then in April 2014 advance preparations (pre-training) were held to link in with the later training scheduled for June 2014 in Japan. The 9 trainees scheduled to participate in the training in Japan took part in the pre-training (Table 1).
1) Upper-
Level
2) Middle-Level
3) Lower-Level
Basic analysis
Data processing
Data management
Free softwereMultispec
QGISGRASS
Etc.
Commercial softwareIMAGINEArcGISArcInfoArcView
Etc.
Target L
evel
Indonesia-Japan Project for Development of REDD+ Implementation Mechanism (REDD+ Planning Study) Final Report
- 13 -
Table 1 List of the trainees who participated in Pre-training
Organization Name Sex Age
State Govt.
Forestry Agency Mr. Hendra Saputra Male 35
Planning & Development Bureau
Mr. Jeffrey Mere Male 29
Environment Agency Ms. Etty Septia Sari Female 32
Provincial Govt.
Ketapang Province Forestry Agency
Mr. Muhammad Hasan Male 32
Kayong Utara Province Forestry & Farmlands Agency
Mr. Murti Anom Suntoro Male 34
From Central Govt.
Natural Resource Conservation Centre
Mr. Subyantoro Tri Pradopo Male 32
Centre for the Stabilization of Forest Regions
Mr. Kelik Tri Cahyono Male 30
Watershed Management Centre
Ms. Asih Idha Listiyowati Female 34
Gunung Palung National Park Office
Mr. Wahyu Iskandar Edi Male 29
During pre-training each of the trainees reviewed basic GIS technology and developed their ability to
use GIS software to collate data obtained in the field (in forest surveys). In particular, the pre-training tried to improve understanding of the sequence of GIS-related techniques; it focused on carrying out field surveys with portable GPS units and then used the independently-obtained data to carry out GIS analysis (Table 2).
Table 2 Pre-training schedule of events
Date Details Location
May 20 Classroom Training - Initial analysis of local data - Local training – preparation & planning.
Pontianak
May 21 & 22 Field Training - Summary understanding of forest types - The use of forest surveys to collect data
Cagar Alam Mandor

Indonesia-Japan Project for Development of REDD+ Implementation Mechanism (REDD+ Planning Study) Final Report
- 14 -
Data collecting by using GPS machine
Ground truth in the forest
Figure 6 Pre-Training (May 2014)
2.2. Training in Japan
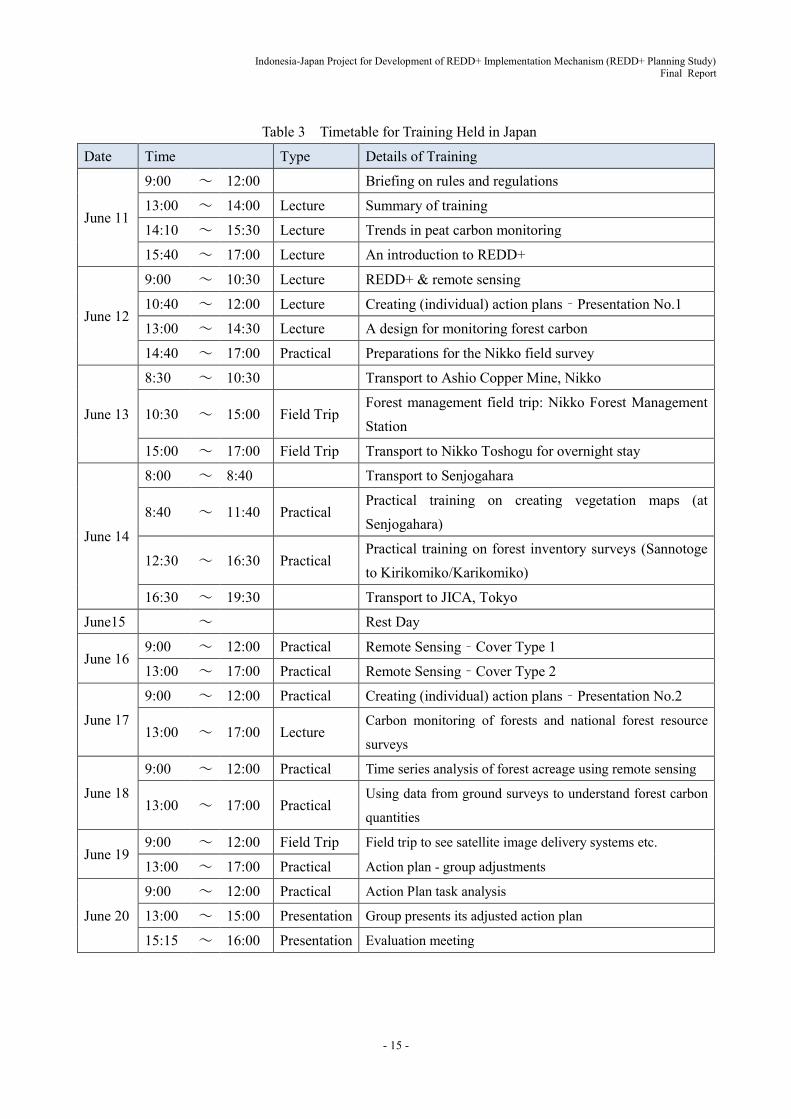
The training in Japan took place in June 2014, after the pre-training conducted in Indonesia in May 2014. As well as sequential, technical improvements in GIS analysis, the training in Japan developed planning (work to develop an Action Plan) to enable trainees to use the knowledge they had gained, in their routine works (Figure 7).
Figure 7 Diagram of the concepts behind the training in Japan
9 trainees were participated in the training in Japan for10 days in total; some of them were participated
in the pre-training as well (Table 3).
Image analysis technique・Forest, grassland, water・Land use・Size and density of the
crown・Time series variation・Characteristics on the
index image
Field observation and survey technique・Component species and shape・Tree diameter, height, density・Comparison with the index
image・Depth and composition of peat
Image analysis and use technique・Classification of cover type・Characteristics of the cover
type・Distribution of biomass・Calculation of the time-
series variation
Understanding of land cover change
for forest management
Zoning for park management
Creating basic data for
biodiversity surveys
Identification of problem areas for
watershed management
planning Etc.
Techniques obtained in training
Development of the action plan that will contribute to the day-to-day work
Indonesia-Japan Project for Development of REDD+ Implementation Mechanism (REDD+ Planning Study) Final Report
- 15 -
Table 3 Timetable for Training Held in Japan
Date Time Type Details of Training
June 11
9:00 ~ 12:00 Briefing on rules and regulations
13:00 ~ 14:00 Lecture Summary of training
14:10 ~ 15:30 Lecture Trends in peat carbon monitoring
15:40 ~ 17:00 Lecture An introduction to REDD+
June 12
9:00 ~ 10:30 Lecture REDD+ & remote sensing
10:40 ~ 12:00 Lecture Creating (individual) action plans – Presentation No.1
13:00 ~ 14:30 Lecture A design for monitoring forest carbon
14:40 ~ 17:00 Practical Preparations for the Nikko field survey
June 13
8:30 ~ 10:30 Transport to Ashio Copper Mine, Nikko
10:30 ~ 15:00 Field Trip Forest management field trip: Nikko Forest Management Station
15:00 ~ 17:00 Field Trip Transport to Nikko Toshogu for overnight stay
June 14
8:00 ~ 8:40 Transport to Senjogahara
8:40 ~ 11:40 Practical Practical training on creating vegetation maps (at Senjogahara)
12:30 ~ 16:30 Practical Practical training on forest inventory surveys (Sannotoge to Kirikomiko/Karikomiko)
16:30 ~ 19:30 Transport to JICA, Tokyo
June15 ~ Rest Day
June 16 9:00 ~ 12:00 Practical Remote Sensing – Cover Type 1
13:00 ~ 17:00 Practical Remote Sensing – Cover Type 2
June 17 9:00 ~ 12:00 Practical Creating (individual) action plans – Presentation No.2
13:00 ~ 17:00 Lecture Carbon monitoring of forests and national forest resource
surveys
June 18 9:00 ~ 12:00 Practical Time series analysis of forest acreage using remote sensing
13:00 ~ 17:00 Practical Using data from ground surveys to understand forest carbon
quantities
June 19 9:00 ~ 12:00 Field Trip Field trip to see satellite image delivery systems etc.
13:00 ~ 17:00 Practical Action plan - group adjustments
June 20
9:00 ~ 12:00 Practical Action Plan task analysis
13:00 ~ 15:00 Presentation Group presents its adjusted action plan
15:15 ~ 16:00 Presentation Evaluation meeting
Indonesia-Japan Project for Development of REDD+ Implementation Mechanism (REDD+ Planning Study) Final Report
- 16 -
2.3. Training summary – Year 1
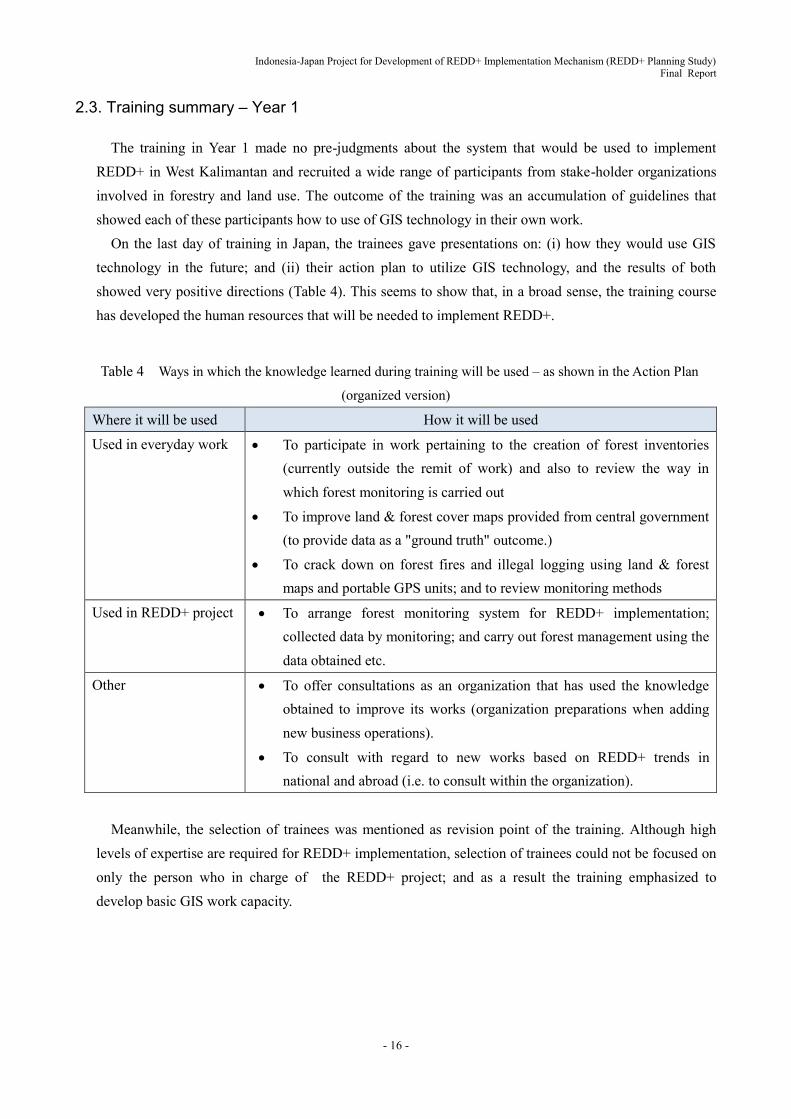
The training in Year 1 made no pre-judgments about the system that would be used to implement REDD+ in West Kalimantan and recruited a wide range of participants from stake-holder organizations involved in forestry and land use. The outcome of the training was an accumulation of guidelines that showed each of these participants how to use of GIS technology in their own work.
On the last day of training in Japan, the trainees gave presentations on: (i) how they would use GIS technology in the future; and (ii) their action plan to utilize GIS technology, and the results of both showed very positive directions (Table 4). This seems to show that, in a broad sense, the training course has developed the human resources that will be needed to implement REDD+.
Table 4 Ways in which the knowledge learned during training will be used – as shown in the Action Plan
(organized version)
Where it will be used How it will be used
Used in everyday work To participate in work pertaining to the creation of forest inventories (currently outside the remit of work) and also to review the way in which forest monitoring is carried out
To improve land & forest cover maps provided from central government (to provide data as a "ground truth" outcome.)
To crack down on forest fires and illegal logging using land & forest maps and portable GPS units; and to review monitoring methods
Used in REDD+ project To arrange forest monitoring system for REDD+ implementation; collected data by monitoring; and carry out forest management using the data obtained etc.
Other To offer consultations as an organization that has used the knowledge obtained to improve its works (organization preparations when adding new business operations).
To consult with regard to new works based on REDD+ trends in national and abroad (i.e. to consult within the organization).
Meanwhile, the selection of trainees was mentioned as revision point of the training. Although high levels of expertise are required for REDD+ implementation, selection of trainees could not be focused on only the person who in charge of the REDD+ project; and as a result the training emphasized to develop basic GIS work capacity.

Indonesia-Japan Project for Development of REDD+ Implementation Mechanism (REDD+ Planning Study) Final Report
- 17 -
3. Detailed operations in Year-2
3.1. Local pre-training in Indonesia -Year 2
The Pre-training of the second year took place from June 1st to June 5th in 2015 in Pontianak of West Kalimantan. Same like the last year, the purpose of this training is set capacity development of the technical expert of RAD-GRK and activity related REDD+. With the cooperation of certificated trainee of the first year, we intended the development of the cooperative relationship between whole trainees.
Table 5 Pre-training schedule
Date / Time Activity Resource Persons
Monday / 1st June 2015 Day 1 : Orientation & Preparation for Field Survey Trip
08.00 – 09.00 Registration Trainees
09.00 – 09.15 Opening session Mr. Marcel, Head of Technical Committee IJ-REDD+
09.15 – 09.30 Orientation for training and providing a format of action plan
Team IJ-REDD+
09.30 – 09.45 Coffee Break
09.45 - 10.15 Review of Pre-training/Basic-level (Remote Sensing and QGIS)
Hendarto, S.Hut. Msc
10.15 – 12.30 Session 1: Orientation for Field Survey trip & its Preparation (1): Basemap
Kazuyo Hirose Kouhei Niitsuma
12.30 – 13.30 ISHOMA
13.30 – 14.30 UNTAN Biomass Carbon Meter, Introduction for easy tool for biomass measurement.
Dr. Ir. Gusti Hardiansyah M.Sc. QAM
14.30 – 14.45 Coffee Break
14.45 – 17.00 Session 2: Preparation for Field Survey trip (2): Field Survey sheet
Kouhei Niitsuma
17.00 – Introduction for importance of Mangrove
Kazuyo Hirose
Tuesday / 2nd June 2015 National Holiday
Wednesday / 3rd June 2015 Day 2 : Field training for Ground checking of Land Covers
06.00 – 17.00 6.00 Leave Mercur Hotel
08.30 – 10.00 Land Cover & Land Use on Peatland K. Hirose and assistants
10.00 – 10.15 Coffee Break

Indonesia-Japan Project for Development of REDD+ Implementation Mechanism (REDD+ Planning Study) Final Report
- 18 -
Date / Time Activity Resource Persons
10.15 – 12.00 Peatland Irrigation K. Hirose and assistants
12.30 – 13.30 ISHOMA
13.30 – 14.45 Demonstration of UBCM & Plot survey using Vertex, Diameter tape.
Mr. X, Kouhei, Ega and assistants
14.45 – 15.00 Coffee Break
15.15 – 16.00 Observation of Mangrove forest K. Hirose and assistants
16.00 – 16.10 Evaluation 2nd day
Thursday / 4th June 2015 Day 3 : Field Data & Land Cover Type Analysis
08.00 – 08.30 Review of 2nd day
08.30 – 10.00 Session 1: Demonstration Auger drill on Peatland
K. Hirose and UNTAN
10.00 – 10.15 Coffee Break
10.15 – 10.45 Introduction of Peatland condition in West Kalimantan
K. Hirose
10.45 – 12.00 Session 2 : Calculating Biomass Data entry of field survey & Comparison of the results
N. Kouhei and assistants
12.30 – 13.30 ISHOMA
13.30 – 14.45 Session 3: Importing GPS data & Coordination into PC and How to import them into QGIS.
K. Hirose and assistants
14.45 – 15.00 Coffee Break
15.15 – 16.00 Georeference in QGIS K. Hirose and assistants
16.00-17.30 Making Polygon feature for Mangrove area on QGIS
K. Hirose and assistants
17.30 – 17.40 Evaluation 3rd day
Friday / 5 June 2015 Day 5: Land cover Analysis & Reporting
08.00– 08.15 Review 3rd day
08.15 – 09.45 Land Cover Data Analysis: Supervised Classification
Pak Subyantoro & Pak Hirose
09.45 – 10.00 Coffee Break
10.00 – 11.00 Follow-up: Question & Answers K. Hirose and assistants
11.00 – 13.30 SOLAT JUMAT & ISHOMA
13.30 – 15.00 Preparation for Action plan K. Hirose and assistants
15.00 – 15.15 Coffee Break

Indonesia-Japan Project for Development of REDD+ Implementation Mechanism (REDD+ Planning Study) Final Report
- 19 -
Date / Time Activity Resource Persons
15.15 – 16.15 Preparation for Action plan Participants
16.15 – 17.30 Presentation of Action plan Participants
17.30 – 17.40 Closing Head of Technical Committee IJ-REDD+
Table 6 List of the trainee
Organization Name
Provincial level.
State Ministry of National Development Planning
Mr. M. RIfani, S. Hut
Department of Forestry, West Kalimantan
Mr. Henry Octavius K
Ms. Radiah, S.Hut
Mr. Novi Adriansyah, S.Hut
Forest Area Planning Office, Region III Pontianak
Mr. Andi Suhandi
Department of Environment, West Kalimantan Mr. Sigit Purwanto, A.Md
Ms. Etty Septia Sari, ST. M.I.L
Natural Resource Conservation Office, West Kalimantan
Mr. Tahir Wisata, S.Hut
Department of Plantation, West Kalimantan Ms. Meity Moerdiyanti, S.T
Mr. M. Alfiansyah, SP
District level
Department of Agriculture, Livestock industry, Plantation and Forestry, Mempawah District
Ms. Riza Nopinilianti, S.Hut
Ms. Reny Ayufrida O, S.Hut
Mr. Yuliansyah, S.Hut
University Department of Forestry, UNTAN Ms. Dra.Siti Latifah, M.Si
Ms. Dra. Tri Widiastuti, M.Si
Indonesia-Japan Project for Development of REDD+ Implementation Mechanism (REDD+ Planning Study) Final Report
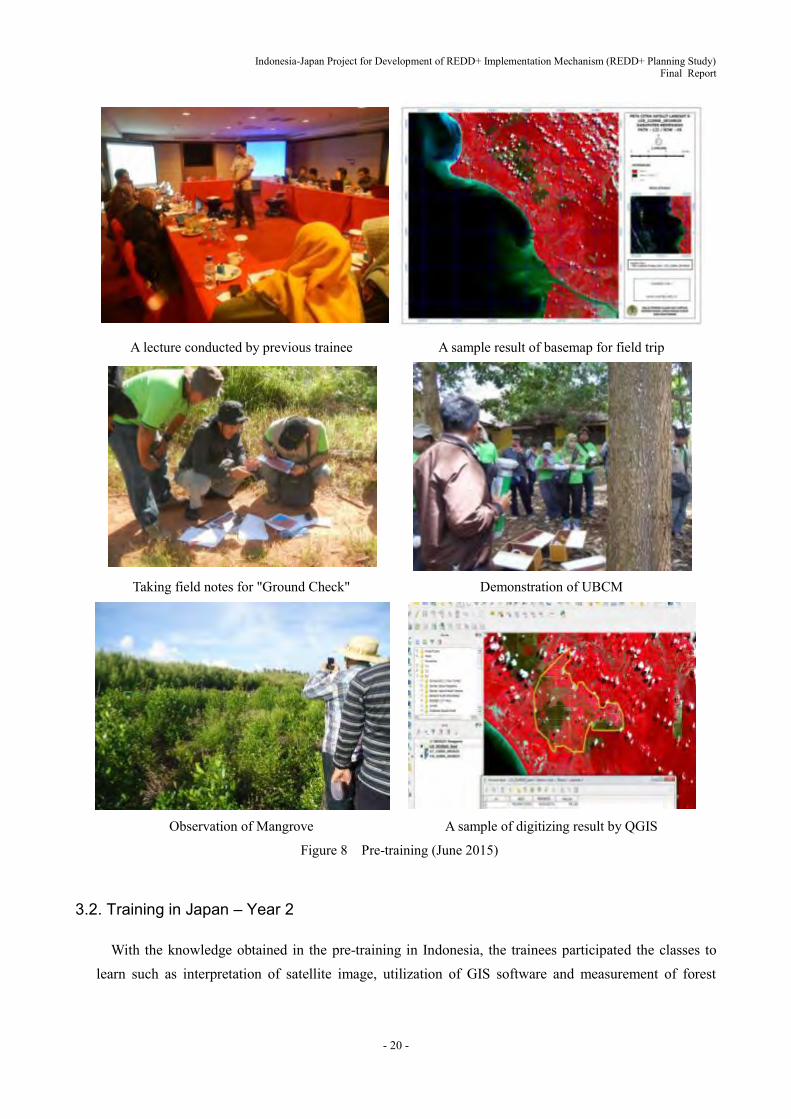
- 20 -
A lecture conducted by previous trainee
A sample result of basemap for field trip
Taking field notes for "Ground Check"
Demonstration of UBCM
Observation of Mangrove
A sample of digitizing result by QGIS
Figure 8 Pre-training (June 2015)
3.2. Training in Japan – Year 2
With the knowledge obtained in the pre-training in Indonesia, the trainees participated the classes to learn such as interpretation of satellite image, utilization of GIS software and measurement of forest

Indonesia-Japan Project for Development of REDD+ Implementation Mechanism (REDD+ Planning Study) Final Report
- 21 -
biomass. Using these techniques, every trainee produced the action plans for their daily works. Trainees also discussed and designed the provincial action plan together through group discussion. This is intended that trainees will create the technical working group in their province.
Another two participants from Province who had already acquired the basics of forest monitoring attended the advanced course separately (Group B in Table 7).
Table 7 Timetable for training held in Japan
Date Time Type Details of training
Sep.7 10:00 ~ 12:00 Briefing
13:00 ~ 13:30 Orientation : Explanation about Training
13:40 ~ 15:00 Lecture International discussion & trend in REDD+
15:10 ~ 16:30 Lecture Corporation between R.I. and Japan in REDD+
Sep.8 9:00 ~ 10:30 Lecture Designing Forest Carbon Monitoring for REDD+
10:45 ~ 12:30 Lecture Basic of Forest Carbon Monitoring
13:00 ~ 17:00 Lecture Download LANDSAT images and Import it into QGIS
Sep.9 9:00 ~ 10:30 Lecture Remote Sensing data utilization in QGIS
10:45 ~ 17:00 Remote Sensing data utilization in QGIS
Sep.10 9:00 ~ 10:30 Lecture Manual Interpretation & Digitizing Satellite Images
10:45 ~ 12:15 Practice Composing Land cover map in QGIS
13:00 ~ 17:00 Practice Composing Land cover map in QGIS
Sep.11 9:00 ~ 12:00 Lecture Understanding Forest Carbon and Biomass; Practical and
basic method
13:00 ~ 15:00 Practice Preparation for field trip
15:15 ~ 16:15 Lecture Calculating the forest area using GIS
16:15 ~ 17:30 Practice Preparation of Action plan (each persons)
Sep.12 10:00 ~ 11:00 Practice Understanding Forest Carbon and Biomass; Practical and
basic method (Field trial)
11:10 ~ 15:00 Practice Field course: Measuring Above Ground Biomass
Sep.13 Holiday, Two trainees arrived
Sep.14 10:00 ~ 16:50 Practice Ground Truth
Practice Field trip around Fuji
Sep.15 Group A 6 trainee
9:30 ~ 13:00 Practice Follow-up for Field trip: Data arrangement
13:00 ~ 14:30 Practice Follow-up for Field trip: Question & Answer
14:45 ~ 17:00 Practice Group discussion for design AP
Group B 2 trainee
9:30 ~ 12:00 Lecture How to utilize PALSAR images

Indonesia-Japan Project for Development of REDD+ Implementation Mechanism (REDD+ Planning Study) Final Report
- 22 -
Date Time Type Details of training
13:00 ~ 17:00 Practice How to utilize PALSAR images
Sep.16 Group A
9:30 ~ 12:00 Tour Satellite Image Distributing System
13:00 ~ 14:30 Lecture Current trend in Carbon monitoring for Peat land
14:40 ~ 17:00 Practice Finalizing Action plan
Group B
9:30 ~ 12:00 Lecture Managing Database
13:00 ~ 17:00 Practice Managing Database
Sep.17 Group A
9:00 ~ 12:30 Lecture Correction of land cover map
13:00 ~ 15:30 Practice Correction of land cover map
15:45 ~ 17:45 Presentation Finalizing Action plan
Group B
9:30 ~ 17:00 Practice Managing Database
Sep.18 9:00 ~ 12:00 Presentation Action plan preparation
12:00 ~ 12:30 Presentation Evaluation
Table 8 List of the trainee
Organization Name Sex Age
Wes
t Kal
iman
tan
Prov
ince
Department of Forestry, West Kalimantan Province
Mr. Henry Octavius K Male 45
Department Plantation, West Kalimantan Province
Mr. Hendarto Male 48
Natural Resources Conservation Office in West Kalimantan
Mr. Tahir Wisata Male 36
Department of Agriculture, Livestock Industry, Plantation and Forestry, Mempawah District
Mr. Yuliansyah Male 47
Cen
tral K
alim
anta
n Pr
ovin
ce Regional Environmental Department,
Central Kalimantan Province Mr.
Adiyaksa Prasidapati
Male 42
Regional Environmental Department, Central Kalimantan Province
Ms. Humala Pontas Male 52
Natural Resources Conservation Office in Central Kalimantan
Ms. Maulida Indira Female 31
Forest Area Planning Office, Region XXI Palangka Raya
Mr. Danang Gian C.N Male 29
Indonesia-Japan Project for Development of REDD+ Implementation Mechanism (REDD+ Planning Study) Final Report
- 23 -
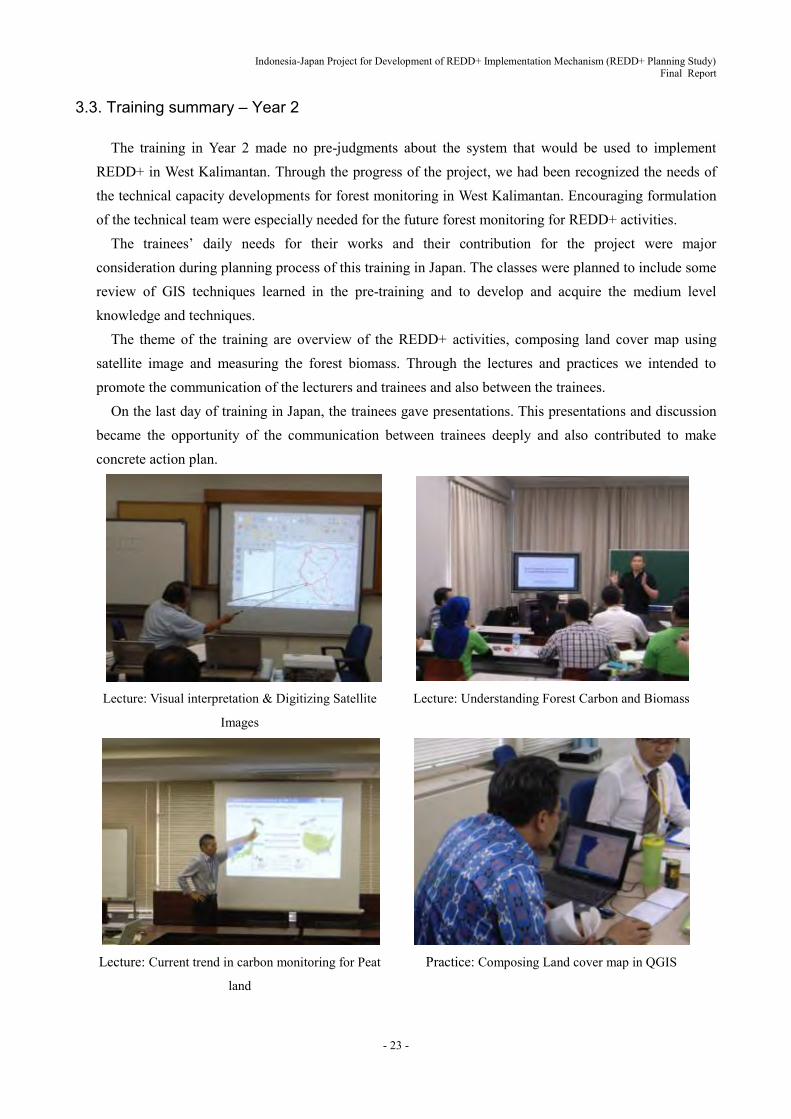
3.3. Training summary – Year 2
The training in Year 2 made no pre-judgments about the system that would be used to implement REDD+ in West Kalimantan. Through the progress of the project, we had been recognized the needs of the technical capacity developments for forest monitoring in West Kalimantan. Encouraging formulation of the technical team were especially needed for the future forest monitoring for REDD+ activities.
The trainees’ daily needs for their works and their contribution for the project were major consideration during planning process of this training in Japan. The classes were planned to include some review of GIS techniques learned in the pre-training and to develop and acquire the medium level knowledge and techniques.
The theme of the training are overview of the REDD+ activities, composing land cover map using satellite image and measuring the forest biomass. Through the lectures and practices we intended to promote the communication of the lecturers and trainees and also between the trainees.
On the last day of training in Japan, the trainees gave presentations. This presentations and discussion became the opportunity of the communication between trainees deeply and also contributed to make concrete action plan.
Lecture: Visual interpretation & Digitizing Satellite
Images
Lecture: Understanding Forest Carbon and Biomass
Lecture: Current trend in carbon monitoring for Peat
land
Practice: Composing Land cover map in QGIS
Indonesia-Japan Project for Development of REDD+ Implementation Mechanism (REDD+ Planning Study) Final Report
- 24 -
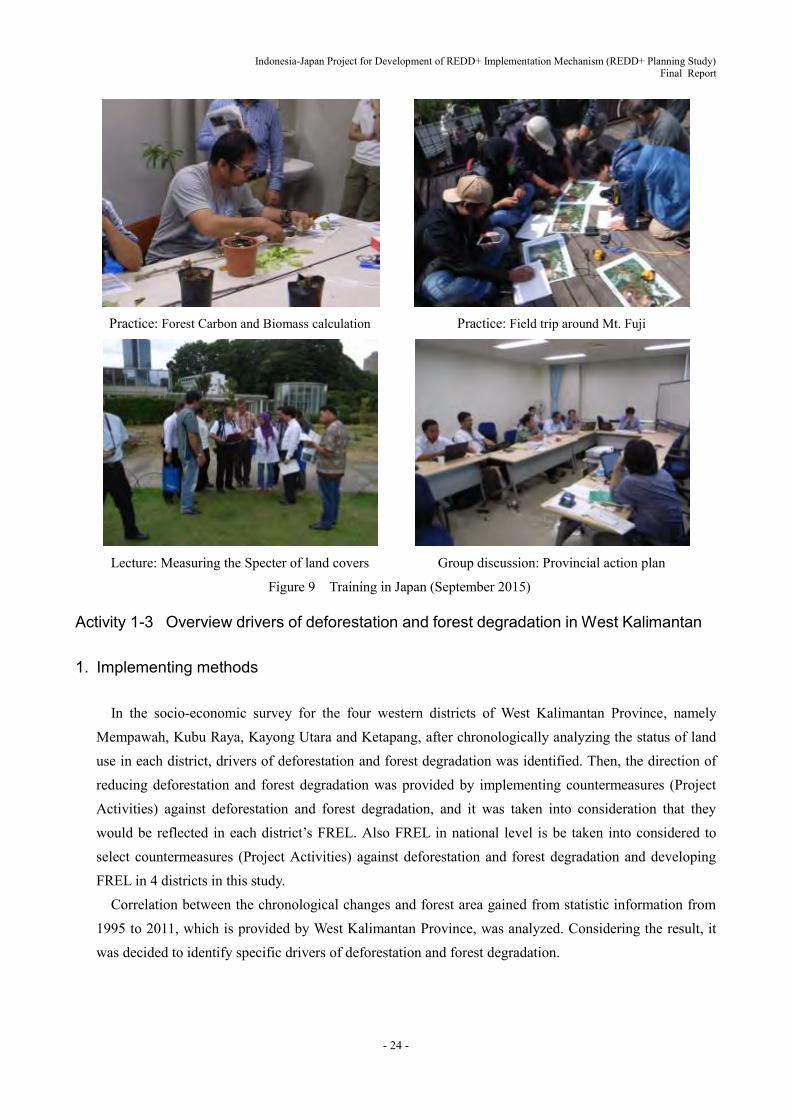
Practice: Forest Carbon and Biomass calculation
Practice: Field trip around Mt. Fuji
Lecture: Measuring the Specter of land covers
Group discussion: Provincial action plan
Figure 9 Training in Japan (September 2015)
Activity 1-3 Overview drivers of deforestation and forest degradation in West Kalimantan
1. Implementing methods
In the socio-economic survey for the four western districts of West Kalimantan Province, namely Mempawah, Kubu Raya, Kayong Utara and Ketapang, after chronologically analyzing the status of land use in each district, drivers of deforestation and forest degradation was identified. Then, the direction of reducing deforestation and forest degradation was provided by implementing countermeasures (Project Activities) against deforestation and forest degradation, and it was taken into consideration that they would be reflected in each district’s FREL. Also FREL in national level is be taken into considered to select countermeasures (Project Activities) against deforestation and forest degradation and developing FREL in 4 districts in this study.
Correlation between the chronological changes and forest area gained from statistic information from 1995 to 2011, which is provided by West Kalimantan Province, was analyzed. Considering the result, it was decided to identify specific drivers of deforestation and forest degradation.

Indonesia-Japan Project for Development of REDD+ Implementation Mechanism (REDD+ Planning Study) Final Report
- 25 -
Left: Cover, Right: Example from the statistics (production from wetland paddy)
Figure 10 Statistics (Kalimantan Barat in Figures) issued by Central Bureau of Statistics, West Kalimantan Province (2011)
2. Progress in this period
2.1. Data processing
In January 2014, the statistics data (PDF version) from 1995 to 2011 provided by the Central Bureau of Statistics of West Kalimantan Province was put into a statistical software (primary processing). After that, additional statistics data in 2012 and 2013 was provided in August 2014 and putting into a statistical software (primary processing) had been done. From using results of primary processing, the correlation between land use (e.g. agriculture, plantation) and forest area, was identified (secondary processing) (Figure 11).

Indonesia-Japan Project for Development of REDD+ Implementation Mechanism (REDD+ Planning Study) Final Report
- 26 -
Figure 11 Factors related to land use and correlation between factors gained from statistical information
For
est
area
(ha
)_R
AD
-G
RK
Pop
ulat
ion
Wet
land
Pad
dy(h
a)
Dry
land
Pad
dy(h
a)
Mai
ze(h
a)
Cas
sava
(ha)
Sw
eet
Pot
ato(
ha)
Gro
undn
ut(h
a)
Soy
been
(ha)
Gre
enpe
as(h
a)
Cuc
umbe
r(ha
)
Chi
nese
Cab
bage
(ha)
Lon
gyam
Bea
ns(h
a)
Egg
plan
t(ha
)
Wat
er C
abba
ge(h
a)
Spi
nach
(ha)
Spr
ing
Oni
ons(
ha)
Red
Pep
per(
ha)
Tom
ato(
ha)
Ked
ney
bean
(ha)
Rub
ber
(larg
e st
ate)
(ha
)
Rub
ber
(larg
e st
ate)
(t)
Oil
Pal
m (
larg
e st
ate)
(ha)
Oil
Pal
m (
larg
e st
ate)
(t)
Rub
ber
(sm
allh
olde
rsst
ate)
(ha)
Rub
ber
(sm
allh
olde
rsst
ate)
(t)
Oil
Pal
m (
smal
lhol
ders
stat
e)(h
a)
Oil
Pal
m (
smal
lhol
ders
stat
e)(t
)
Hyb
rida
Coc
onut
(sm
allh
olde
rs s
tate
)(ha
)
Hyb
rida
Coc
onut
(sm
allh
olde
rs s
tate
)(t)
Loc
al C
ocon
ut(s
mal
lhol
ders
sta
te)(
ha)
Loc
al C
ocon
ut(s
mal
lhol
ders
sta
te)(
t)
Cat
tle(
tail)
Dai
ry c
attle(
tail)
Buf
falo
(tai
l)
Pig
(tai
l)
She
ep(t
ail)
Goa
t(ta
il)
Nat
ive
Chi
cken
(tai
l)
Bro
iler(
tail)
Lay
er(t
ail)
Duc
k(ta
il)
Cat
tle
prod
uction
(t)
Goa
t pr
oduc
tion
(t)
Pig
pro
duct
ion(
t)
Nat
ive
Chi
cken
prod
uction
(t)
Bro
iler
prod
uction
(t)
Duc
k pr
oduc
tion
(t)
Forest area (ha)_RAD-GRK 1.00
Population -1.00 1.00
Wetland Paddy(ha) -0.81 0.70 1.00
Dryland Paddy(ha) 0.02 0.33 0.75 1.00
Maize(ha) -0.99 0.66 0.49 0.07 1.00
Cassava(ha) 0.99 -0.11 -0.15 -0.17 0.19 1.00
Sweet Potato(ha) 0.72 -0.16 -0.12 -0.29 0.01 0.70 1.00
Groundnut(ha) 0.96 -0.24 -0.40 -0.40 0.07 0.73 0.72 1.00
Soybeen(ha) -0.16 -0.60 -0.51 -0.45 -0.45 -0.06 0.02 0.04 1.00
Greenpeas(ha) -0.84 0.51 0.40 0.27 0.20 0.30 0.12 0.09 -0.61 1.00
Cucumber(ha) -0.70 -0.36 -0.44 -0.11 -0.43 -0.32 -0.45 -0.12 0.63 -0.43 1.00
Chinese Cabbage(ha) -0.94 0.13 -0.15 0.02 0.07 0.10 -0.32 0.18 0.30 0.00 0.64 1.00
Longyam Beans(ha) 0.16 -0.28 -0.21 -0.17 -0.31 0.01 0.23 0.09 0.24 0.05 -0.20 -0.21 1.00
Eggplant(ha) -0.80 0.46 0.45 0.13 0.30 0.13 0.17 -0.17 -0.48 0.54 -0.48 -0.49 -0.07 1.00
Water Cabbage(ha) -0.56 0.27 0.23 0.07 -0.13 -0.10 0.12 -0.30 -0.01 0.21 0.03 -0.28 0.00 0.65 1.00
Spinach(ha) 0.42 -0.38 -0.30 0.09 -0.24 0.37 0.14 0.32 0.12 -0.04 0.27 0.06 -0.12 0.02 0.17 1.00
Spring Onions(ha) -0.11 0.13 0.65 0.85 0.01 -0.21 -0.33 -0.46 -0.26 0.19 -0.09 -0.14 -0.03 0.21 0.16 0.24 1.00
Red Pepper(ha) 0.94 0.29 0.44 0.50 -0.02 -0.11 -0.08 -0.05 -0.25 0.26 -0.06 0.10 0.07 0.25 0.16 0.02 0.44 1.00
Tomato(ha) -0.91 0.75 0.70 0.41 0.37 -0.06 -0.03 -0.32 -0.58 0.68 -0.41 -0.21 -0.13 0.81 0.60 -0.14 0.32 0.34 1.00
Kedney bean(ha) -0.63 0.61 0.81 0.63 0.28 -0.05 0.09 -0.24 -0.69 0.62 -0.51 -0.37 -0.10 0.71 0.47 -0.16 0.49 0.48 0.87 1.00
Rubber (large state) (ha) 0.11 -0.71 -0.52 -0.21 -0.57 -0.08 0.17 0.24 0.49 -0.42 0.38 -0.04 0.12 -0.46 -0.25 0.33 0.00 -0.15 -0.63 -0.51 1.00
Rubber (large state) (t) 0.94 -0.76 -0.67 -0.48 -0.51 -0.07 0.18 0.23 0.37 -0.45 0.32 -0.18 -0.04 -0.35 -0.23 0.06 -0.38 -0.26 -0.63 -0.48 0.73 1.00
Oil Palm (large state)(ha) -0.94 0.87 0.53 0.18 0.42 -0.20 -0.08 -0.26 -0.43 0.34 -0.25 0.03 -0.15 0.50 0.53 -0.39 0.02 0.36 0.70 0.58 -0.64 -0.58 1.00
Oil Palm (large state)(t) -0.97 0.92 0.65 0.36 0.67 0.02 -0.14 -0.09 -0.76 0.61 -0.39 0.12 -0.37 0.47 0.18 -0.30 0.14 0.26 0.74 0.66 -0.73 -0.66 0.76 1.00
Rubber (smallholders state)(ha) -0.96 0.66 0.37 0.10 0.45 -0.08 -0.22 -0.16 -0.27 0.54 -0.04 0.28 -0.16 0.36 0.16 -0.15 0.14 0.04 0.53 0.24 -0.23 -0.51 0.40 0.58 1.00
Rubber (smallholders state)(t) -0.80 0.85 0.82 0.61 0.36 -0.20 -0.08 -0.24 -0.65 0.50 -0.36 -0.02 -0.27 0.40 0.30 -0.34 0.35 0.54 0.73 0.80 -0.54 -0.61 0.78 0.82 0.40 1.00
Oil Palm (smallholders state)(ha) -0.99 0.83 0.49 0.29 0.45 -0.20 -0.07 -0.20 -0.51 0.23 -0.23 0.05 -0.20 0.35 0.39 -0.29 0.07 0.34 0.57 0.53 -0.50 -0.50 0.93 0.72 0.34 0.76 1.00
Oil Palm (smallholders state)(t) -1.00 0.54 0.57 0.31 0.67 0.05 -0.16 -0.04 -0.59 0.55 -0.36 0.01 -0.27 0.33 -0.14 -0.15 0.29 0.01 0.51 0.46 -0.46 -0.49 0.14 0.68 0.63 0.42 0.10 1.00
Hybrida Coconut (smallholders state)(ha) -0.38 -0.16 0.02 0.33 -0.12 0.04 0.00 0.05 -0.35 0.27 -0.11 -0.17 -0.08 0.11 -0.24 0.32 0.40 0.18 0.02 0.14 0.50 0.26 -0.32 -0.09 0.17 -0.03 -0.11 0.13 1.00
Hybrida Coconut (smallholders state)(t) 0.82 0.23 0.24 0.36 0.28 0.29 0.07 0.34 -0.73 0.45 -0.44 0.01 -0.18 0.05 -0.41 0.04 0.18 0.34 0.19 0.35 -0.22 -0.14 0.01 0.50 0.02 0.37 0.10 0.51 0.35 1.00
Local Coconut (smallholders state)(ha) -0.91 0.65 0.28 0.14 0.46 -0.06 -0.26 -0.12 -0.25 0.38 0.05 0.40 -0.27 0.23 0.07 -0.04 0.15 0.07 0.40 0.13 -0.12 -0.45 0.46 0.54 0.88 0.37 0.51 0.39 0.29 0.01 1.00
Local Coconut (smallholders state)(t) -0.97 0.93 0.64 0.35 0.71 -0.01 -0.17 -0.16 -0.71 0.54 -0.46 0.12 -0.25 0.34 0.06 -0.33 0.15 0.16 0.67 0.53 -0.72 -0.76 0.71 0.94 0.63 0.76 0.69 0.68 -0.11 0.46 0.59 1.00
Cattle(tail) -0.93 0.56 0.42 0.24 0.55 -0.03 -0.24 -0.32 -0.12 0.04 -0.06 0.32 -0.26 0.05 -0.07 -0.34 -0.01 -0.18 0.37 0.14 -0.55 -0.59 0.32 0.46 0.44 0.32 0.33 0.42 -0.27 -0.03 0.42 0.59 1.00
Dairy cattle(tail) -0.58 0.66 0.41 0.05 0.42 -0.35 -0.12 -0.27 -0.19 0.02 -0.06 0.04 -0.11 0.26 0.44 -0.47 -0.03 0.32 0.37 0.36 -0.45 -0.31 0.85 0.52 0.25 0.58 0.81 0.04 -0.41 -0.17 0.30 0.47 0.16 1.00
Buffalo(tail) 0.93 -0.85 -0.55 -0.23 -0.76 -0.03 0.19 0.16 0.66 -0.47 0.34 -0.12 0.42 -0.45 -0.09 0.34 -0.01 0.01 -0.66 -0.50 0.77 0.63 -0.62 -0.92 -0.62 -0.62 -0.59 -0.74 0.15 -0.37 -0.54 -0.90 -0.68 -0.41 1.00
Pig(tail) -0.96 -0.11 -0.62 -0.84 0.08 0.26 0.21 0.44 0.45 -0.16 0.30 0.32 0.12 -0.06 0.11 0.04 -0.74 -0.38 -0.25 -0.52 0.01 0.18 0.06 -0.13 0.08 -0.46 -0.05 -0.25 -0.47 -0.38 0.10 -0.17 -0.09 0.15 0.04 1.00
Sheep(tail) -0.94 0.76 0.51 -0.03 0.73 -0.01 -0.06 -0.22 -0.38 0.48 -0.35 -0.07 -0.14 0.67 0.41 -0.36 -0.02 0.02 0.74 0.52 -0.73 -0.56 0.67 0.72 0.62 0.46 0.50 0.61 -0.29 -0.01 0.46 0.69 0.47 0.57 -0.77 0.20 1.00
Goat(tail) -0.64 0.54 0.54 0.21 0.39 0.08 0.05 -0.11 0.11 0.08 0.02 0.26 -0.04 0.30 0.48 -0.17 0.18 0.24 0.43 0.35 -0.53 -0.64 0.60 0.43 0.30 0.45 0.46 0.16 -0.60 -0.25 0.24 0.39 0.41 0.59 -0.39 0.18 0.54 1.00
Native Chicken(tail) 0.19 0.62 0.60 0.20 0.74 0.17 -0.07 -0.20 -0.41 0.29 -0.47 -0.07 -0.19 0.49 0.18 -0.32 0.12 0.12 0.55 0.50 -0.90 -0.62 0.53 0.65 0.16 0.43 0.40 0.51 -0.44 0.21 0.08 0.63 0.51 0.45 -0.70 -0.03 0.77 0.58 1.00
Broiler(tail) -0.56 0.76 0.66 0.42 0.50 -0.29 -0.30 -0.30 -0.63 0.42 -0.22 -0.01 -0.24 0.46 0.37 -0.28 0.29 0.42 0.69 0.73 -0.71 -0.54 0.78 0.83 0.31 0.77 0.72 0.49 -0.21 0.32 0.27 0.71 0.21 0.71 -0.68 -0.17 0.67 0.49 0.66 1.00
Layer(tail) -0.50 0.71 0.39 0.27 0.68 -0.01 -0.17 0.07 -0.66 0.25 -0.23 0.23 -0.38 0.06 -0.15 -0.16 0.04 0.00 0.28 0.29 -0.45 -0.49 0.53 0.79 0.43 0.57 0.67 0.52 0.00 0.43 0.54 0.79 0.39 0.44 -0.75 -0.05 0.40 0.23 0.38 0.60 1.00
Duck(tail) -0.95 0.80 0.35 0.01 0.57 -0.10 -0.15 -0.15 -0.30 0.15 -0.08 0.23 -0.24 0.34 0.38 -0.34 -0.15 0.10 0.47 0.32 -0.67 -0.56 0.89 0.73 0.41 0.56 0.84 0.18 -0.47 -0.07 0.50 0.68 0.44 0.81 -0.71 0.32 0.67 0.67 0.57 0.70 0.68 1.00
Cattle production(t) 0.88 -0.77 -0.47 -0.35 -0.60 -0.10 0.12 -0.03 0.80 -0.67 0.40 -0.09 0.23 -0.45 -0.04 -0.02 -0.15 -0.22 -0.65 -0.54 0.58 0.66 -0.53 -0.83 -0.60 -0.62 -0.58 -0.66 -0.22 -0.52 -0.60 -0.83 -0.38 -0.22 0.78 0.17 -0.56 -0.12 -0.43 -0.61 -0.77 -0.51 1.00
Goat production(t) 0.88 -0.71 -0.31 -0.20 -0.58 -0.09 0.18 -0.06 0.76 -0.66 0.30 -0.14 0.25 -0.44 -0.04 -0.05 -0.07 -0.12 -0.59 -0.44 0.53 0.56 -0.50 -0.81 -0.62 -0.50 -0.54 -0.64 -0.22 -0.50 -0.64 -0.78 -0.29 -0.22 0.77 -0.01 -0.58 -0.08 -0.39 -0.60 -0.76 -0.54 0.96 1.00
Pig production(t) 0.88 -0.77 -0.74 -0.63 -0.54 0.00 0.11 0.14 0.81 -0.64 0.50 0.05 0.24 -0.44 -0.02 0.07 -0.44 -0.39 -0.69 -0.71 0.49 0.68 -0.50 -0.78 -0.53 -0.78 -0.57 -0.66 -0.35 -0.53 -0.53 -0.79 -0.39 -0.21 0.68 0.53 -0.45 -0.15 -0.42 -0.59 -0.66 -0.35 0.89 0.77 1.00
Native Chicken production(t) 0.88 -0.61 -0.31 -0.25 -0.33 0.12 0.05 -0.14 0.71 -0.51 0.30 0.02 0.10 -0.25 -0.02 -0.05 -0.06 -0.20 -0.49 -0.45 0.29 0.44 -0.43 -0.66 -0.47 -0.59 -0.52 -0.52 -0.23 -0.49 -0.45 -0.65 -0.11 -0.20 0.54 0.16 -0.31 0.04 -0.07 -0.53 -0.71 -0.37 0.85 0.82 0.75 1.00
Broiler production(t) 0.88 -0.39 -0.13 -0.15 -0.09 0.20 -0.06 -0.23 0.46 -0.31 0.11 0.01 -0.01 -0.07 -0.06 -0.14 -0.02 -0.16 -0.29 -0.28 -0.06 0.22 -0.29 -0.41 -0.39 -0.45 -0.41 -0.30 -0.27 -0.31 -0.39 -0.40 0.07 -0.16 0.25 0.08 -0.08 0.09 0.26 -0.32 -0.54 -0.22 0.60 0.58 0.52 0.91 1.00
Duck production(t) 0.88 -0.73 -0.50 -0.39 -0.49 0.03 0.08 -0.04 0.85 -0.65 0.45 0.05 0.21 -0.41 -0.02 0.02 -0.20 -0.27 -0.64 -0.61 0.42 0.54 -0.51 -0.80 -0.55 -0.70 -0.58 -0.64 -0.33 -0.58 -0.55 -0.78 -0.23 -0.23 0.69 0.29 -0.45 -0.01 -0.27 -0.62 -0.75 -0.41 0.95 0.90 0.91 0.94 0.76 1.00
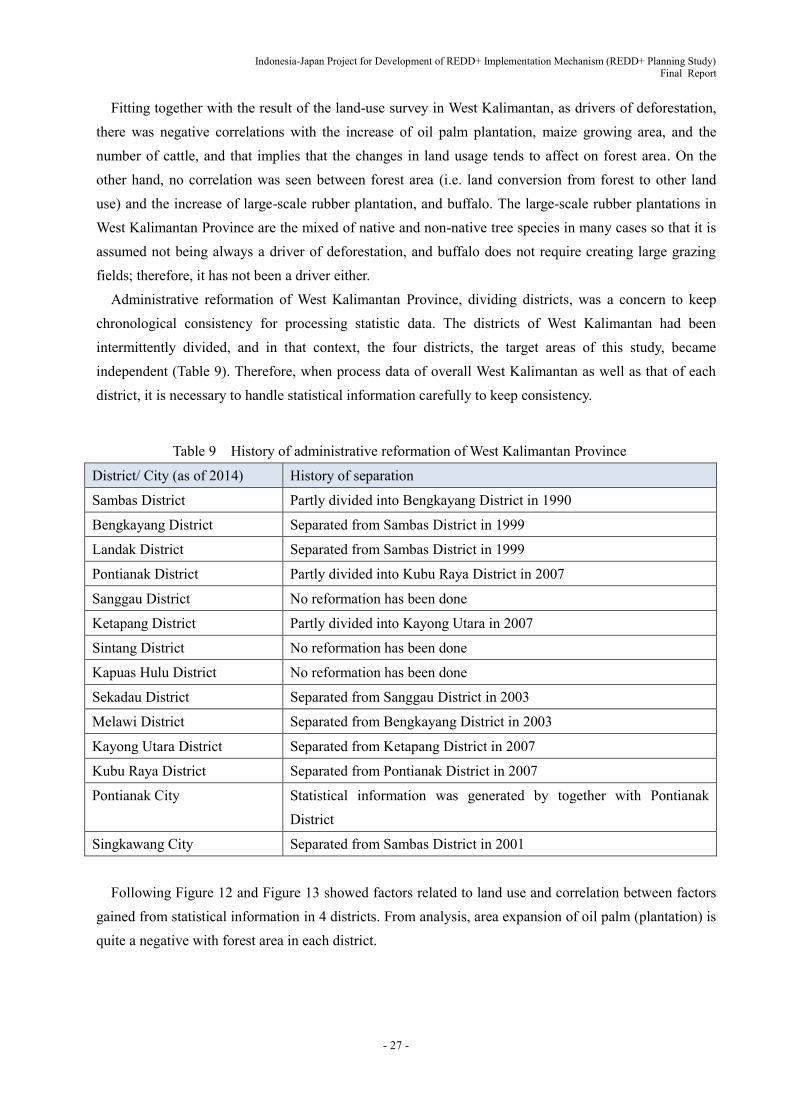
Indonesia-Japan Project for Development of REDD+ Implementation Mechanism (REDD+ Planning Study) Final Report
- 27 -
Fitting together with the result of the land-use survey in West Kalimantan, as drivers of deforestation, there was negative correlations with the increase of oil palm plantation, maize growing area, and the number of cattle, and that implies that the changes in land usage tends to affect on forest area. On the other hand, no correlation was seen between forest area (i.e. land conversion from forest to other land use) and the increase of large-scale rubber plantation, and buffalo. The large-scale rubber plantations in West Kalimantan Province are the mixed of native and non-native tree species in many cases so that it is assumed not being always a driver of deforestation, and buffalo does not require creating large grazing fields; therefore, it has not been a driver either.
Administrative reformation of West Kalimantan Province, dividing districts, was a concern to keep chronological consistency for processing statistic data. The districts of West Kalimantan had been intermittently divided, and in that context, the four districts, the target areas of this study, became independent (Table 9). Therefore, when process data of overall West Kalimantan as well as that of each district, it is necessary to handle statistical information carefully to keep consistency.
Table 9 History of administrative reformation of West Kalimantan Province
District/ City (as of 2014) History of separation
Sambas District Partly divided into Bengkayang District in 1990
Bengkayang District Separated from Sambas District in 1999
Landak District Separated from Sambas District in 1999
Pontianak District Partly divided into Kubu Raya District in 2007
Sanggau District No reformation has been done
Ketapang District Partly divided into Kayong Utara in 2007
Sintang District No reformation has been done
Kapuas Hulu District No reformation has been done
Sekadau District Separated from Sanggau District in 2003
Melawi District Separated from Bengkayang District in 2003
Kayong Utara District Separated from Ketapang District in 2007
Kubu Raya District Separated from Pontianak District in 2007
Pontianak City
Statistical information was generated by together with Pontianak District
Singkawang City Separated from Sambas District in 2001
Following Figure 12 and Figure 13 showed factors related to land use and correlation between factors gained from statistical information in 4 districts. From analysis, area expansion of oil palm (plantation) is quite a negative with forest area in each district.
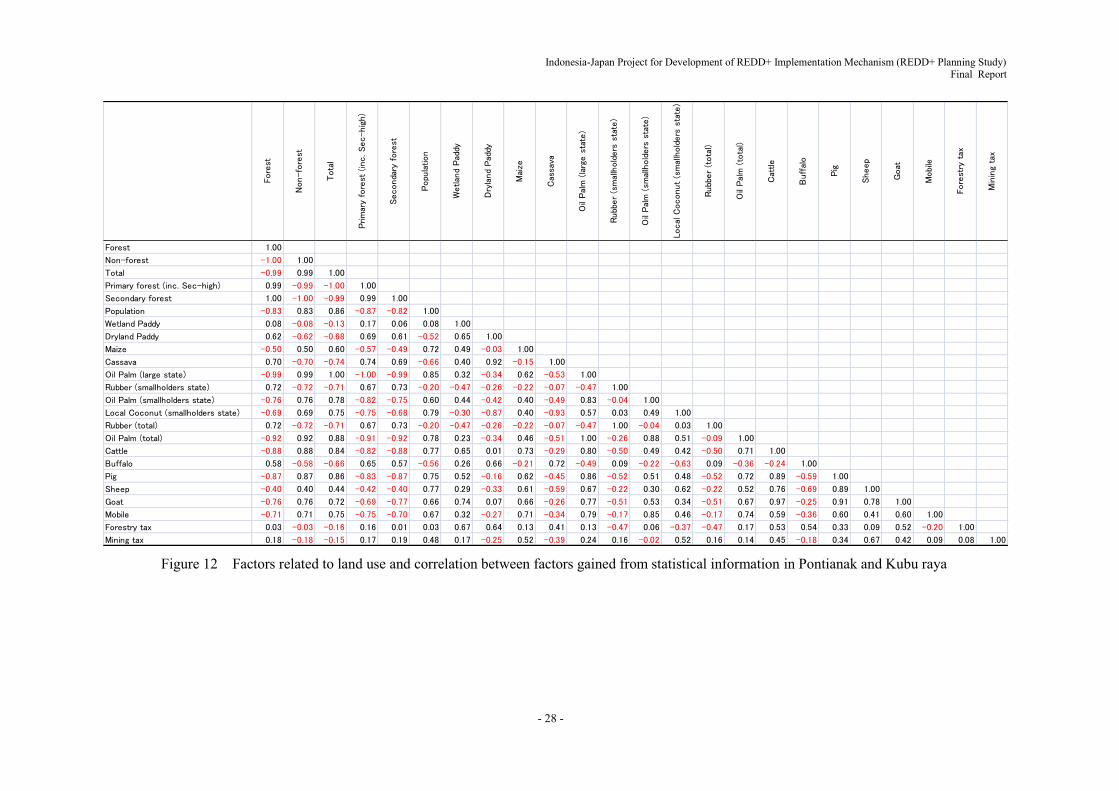
Indonesia-Japan Project for Development of REDD+ Implementation Mechanism (REDD+ Planning Study) Final Report
- 28 -
Figure 12 Factors related to land use and correlation between factors gained from statistical information in Pontianak and Kubu raya
Fore
st
Non-fo
rest
Tota
l
Prim
ary
fore
st (
inc. Sec-hig
h)
Seconda
ry f
ore
st
Popu
lation
Wetlan
d Pad
dy
Dry
land
Pad
dy
Mai
ze
Cas
sava
Oil
Pal
m (
larg
e s
tate
)
Rubb
er
(sm
allh
old
ers
sta
te)
Oil
Pal
m (
smal
lhold
ers
sta
te)
Local
Coconut
(sm
allh
old
ers
sta
te)
Rubb
er
(tota
l)
Oil
Pal
m (
tota
l)
Cat
tle
Buff
alo
Pig
Sheep
Goat
Mobi
le
Fore
stry
tax
Min
ing
tax
Forest 1.00
Non-forest -1.00 1.00
Total -0.99 0.99 1.00
Primary forest (inc. Sec-high) 0.99 -0.99 -1.00 1.00
Secondary forest 1.00 -1.00 -0.99 0.99 1.00
Population -0.83 0.83 0.86 -0.87 -0.82 1.00
Wetland Paddy 0.08 -0.08 -0.13 0.17 0.06 0.08 1.00
Dryland Paddy 0.62 -0.62 -0.68 0.69 0.61 -0.52 0.65 1.00
Maize -0.50 0.50 0.60 -0.57 -0.49 0.72 0.49 -0.03 1.00
Cassava 0.70 -0.70 -0.74 0.74 0.69 -0.66 0.40 0.92 -0.15 1.00
Oil Palm (large state) -0.99 0.99 1.00 -1.00 -0.99 0.85 0.32 -0.34 0.62 -0.53 1.00
Rubber (smallholders state) 0.72 -0.72 -0.71 0.67 0.73 -0.20 -0.47 -0.26 -0.22 -0.07 -0.47 1.00
Oil Palm (smallholders state) -0.76 0.76 0.78 -0.82 -0.75 0.60 0.44 -0.42 0.40 -0.49 0.83 -0.04 1.00
Local Coconut (smallholders state) -0.69 0.69 0.75 -0.75 -0.68 0.79 -0.30 -0.87 0.40 -0.93 0.57 0.03 0.49 1.00
Rubber (total) 0.72 -0.72 -0.71 0.67 0.73 -0.20 -0.47 -0.26 -0.22 -0.07 -0.47 1.00 -0.04 0.03 1.00
Oil Palm (total) -0.92 0.92 0.88 -0.91 -0.92 0.78 0.23 -0.34 0.46 -0.51 1.00 -0.26 0.88 0.51 -0.09 1.00
Cattle -0.88 0.88 0.84 -0.82 -0.88 0.77 0.65 0.01 0.73 -0.29 0.80 -0.50 0.49 0.42 -0.50 0.71 1.00
Buffalo 0.58 -0.58 -0.66 0.65 0.57 -0.56 0.26 0.66 -0.21 0.72 -0.49 0.09 -0.22 -0.63 0.09 -0.36 -0.24 1.00
Pig -0.87 0.87 0.86 -0.83 -0.87 0.75 0.52 -0.16 0.62 -0.45 0.86 -0.52 0.51 0.48 -0.52 0.72 0.89 -0.59 1.00
Sheep -0.40 0.40 0.44 -0.42 -0.40 0.77 0.29 -0.33 0.61 -0.59 0.67 -0.22 0.30 0.62 -0.22 0.52 0.76 -0.69 0.89 1.00
Goat -0.76 0.76 0.72 -0.69 -0.77 0.66 0.74 0.07 0.66 -0.26 0.77 -0.51 0.53 0.34 -0.51 0.67 0.97 -0.25 0.91 0.78 1.00
Mobile -0.71 0.71 0.75 -0.75 -0.70 0.67 0.32 -0.27 0.71 -0.34 0.79 -0.17 0.85 0.46 -0.17 0.74 0.59 -0.36 0.60 0.41 0.60 1.00
Forestry tax 0.03 -0.03 -0.16 0.16 0.01 0.03 0.67 0.64 0.13 0.41 0.13 -0.47 0.06 -0.37 -0.47 0.17 0.53 0.54 0.33 0.09 0.52 -0.20 1.00
Mining tax 0.18 -0.18 -0.15 0.17 0.19 0.48 0.17 -0.25 0.52 -0.39 0.24 0.16 -0.02 0.52 0.16 0.14 0.45 -0.18 0.34 0.67 0.42 0.09 0.08 1.00
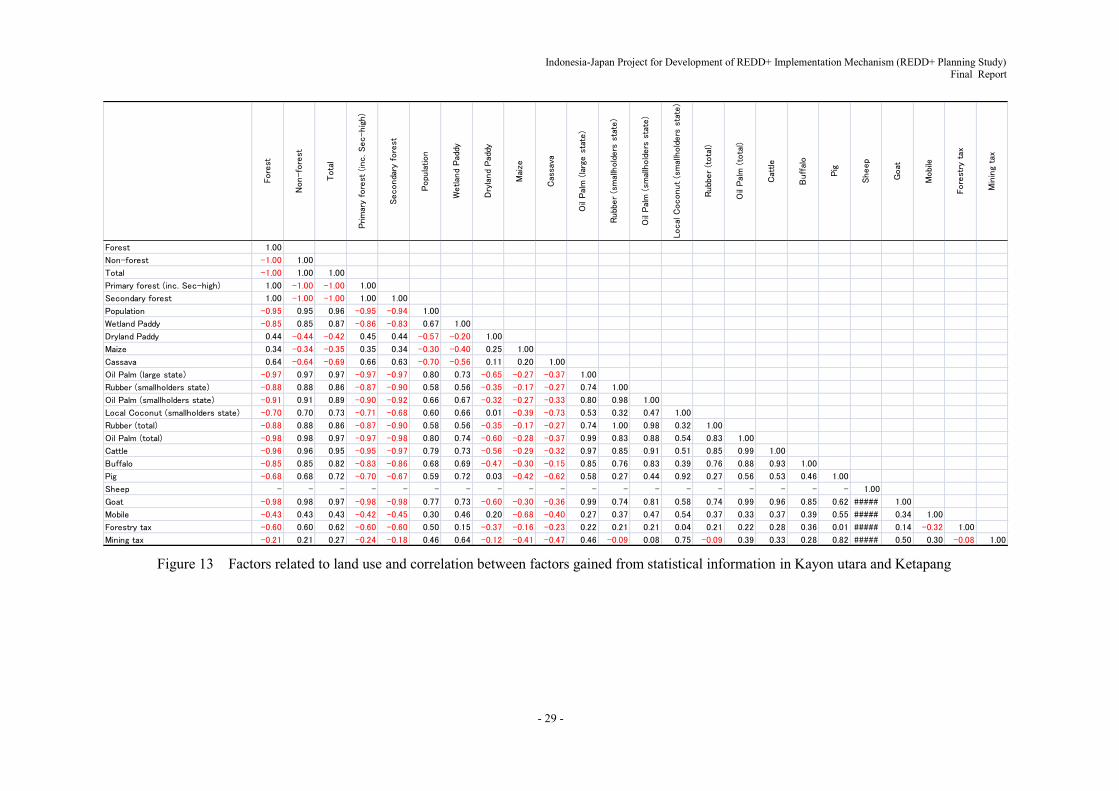
Indonesia-Japan Project for Development of REDD+ Implementation Mechanism (REDD+ Planning Study) Final Report
- 29 -
Figure 13 Factors related to land use and correlation between factors gained from statistical information in Kayon utara and Ketapang
Fore
st
Non-fo
rest
Tota
l
Prim
ary
fore
st (
inc. Sec-hig
h)
Seconda
ry f
ore
st
Popu
lation
Wetlan
d Pad
dy
Dry
land
Pad
dy
Mai
ze
Cas
sava
Oil
Pal
m (
larg
e s
tate
)
Rubb
er
(sm
allh
old
ers
sta
te)
Oil
Pal
m (
smal
lhold
ers
sta
te)
Local
Coconut
(sm
allh
old
ers
sta
te)
Rubb
er
(tota
l)
Oil
Pal
m (
tota
l)
Cat
tle
Buff
alo
Pig
Sheep
Goat
Mobi
le
Fore
stry
tax
Min
ing
tax
Forest 1.00
Non-forest -1.00 1.00
Total -1.00 1.00 1.00
Primary forest (inc. Sec-high) 1.00 -1.00 -1.00 1.00
Secondary forest 1.00 -1.00 -1.00 1.00 1.00
Population -0.95 0.95 0.96 -0.95 -0.94 1.00
Wetland Paddy -0.85 0.85 0.87 -0.86 -0.83 0.67 1.00
Dryland Paddy 0.44 -0.44 -0.42 0.45 0.44 -0.57 -0.20 1.00
Maize 0.34 -0.34 -0.35 0.35 0.34 -0.30 -0.40 0.25 1.00
Cassava 0.64 -0.64 -0.69 0.66 0.63 -0.70 -0.56 0.11 0.20 1.00
Oil Palm (large state) -0.97 0.97 0.97 -0.97 -0.97 0.80 0.73 -0.65 -0.27 -0.37 1.00
Rubber (smallholders state) -0.88 0.88 0.86 -0.87 -0.90 0.58 0.56 -0.35 -0.17 -0.27 0.74 1.00
Oil Palm (smallholders state) -0.91 0.91 0.89 -0.90 -0.92 0.66 0.67 -0.32 -0.27 -0.33 0.80 0.98 1.00
Local Coconut (smallholders state) -0.70 0.70 0.73 -0.71 -0.68 0.60 0.66 0.01 -0.39 -0.73 0.53 0.32 0.47 1.00
Rubber (total) -0.88 0.88 0.86 -0.87 -0.90 0.58 0.56 -0.35 -0.17 -0.27 0.74 1.00 0.98 0.32 1.00
Oil Palm (total) -0.98 0.98 0.97 -0.97 -0.98 0.80 0.74 -0.60 -0.28 -0.37 0.99 0.83 0.88 0.54 0.83 1.00
Cattle -0.96 0.96 0.95 -0.95 -0.97 0.79 0.73 -0.56 -0.29 -0.32 0.97 0.85 0.91 0.51 0.85 0.99 1.00
Buffalo -0.85 0.85 0.82 -0.83 -0.86 0.68 0.69 -0.47 -0.30 -0.15 0.85 0.76 0.83 0.39 0.76 0.88 0.93 1.00
Pig -0.68 0.68 0.72 -0.70 -0.67 0.59 0.72 0.03 -0.42 -0.62 0.58 0.27 0.44 0.92 0.27 0.56 0.53 0.46 1.00
Sheep - - - - - - - - - - - - - - - - - - - 1.00
Goat -0.98 0.98 0.97 -0.98 -0.98 0.77 0.73 -0.60 -0.30 -0.36 0.99 0.74 0.81 0.58 0.74 0.99 0.96 0.85 0.62 ##### 1.00
Mobile -0.43 0.43 0.43 -0.42 -0.45 0.30 0.46 0.20 -0.68 -0.40 0.27 0.37 0.47 0.54 0.37 0.33 0.37 0.39 0.55 ##### 0.34 1.00
Forestry tax -0.60 0.60 0.62 -0.60 -0.60 0.50 0.15 -0.37 -0.16 -0.23 0.22 0.21 0.21 0.04 0.21 0.22 0.28 0.36 0.01 ##### 0.14 -0.32 1.00
Mining tax -0.21 0.21 0.27 -0.24 -0.18 0.46 0.64 -0.12 -0.41 -0.47 0.46 -0.09 0.08 0.75 -0.09 0.39 0.33 0.28 0.82 ##### 0.50 0.30 -0.08 1.00
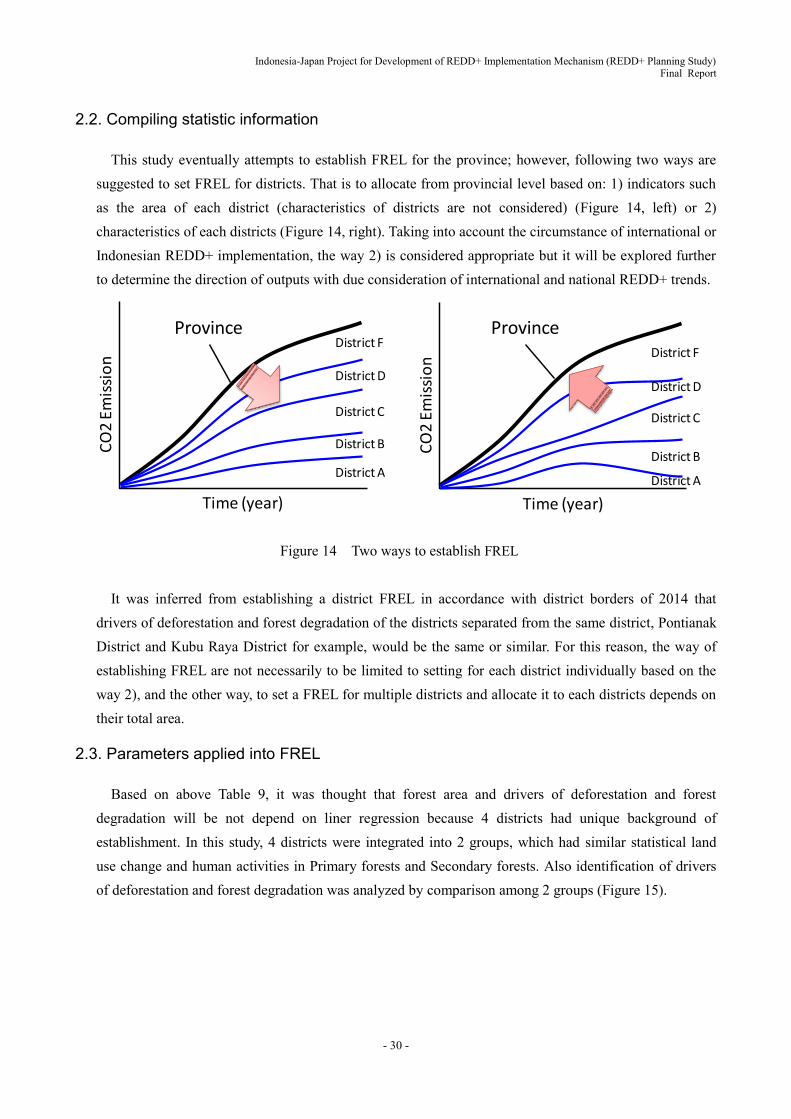
Indonesia-Japan Project for Development of REDD+ Implementation Mechanism (REDD+ Planning Study) Final Report
- 30 -
2.2. Compiling statistic information
This study eventually attempts to establish FREL for the province; however, following two ways are suggested to set FREL for districts. That is to allocate from provincial level based on: 1) indicators such as the area of each district (characteristics of districts are not considered) (Figure 14, left) or 2) characteristics of each districts (Figure 14, right). Taking into account the circumstance of international or Indonesian REDD+ implementation, the way 2) is considered appropriate but it will be explored further to determine the direction of outputs with due consideration of international and national REDD+ trends.
Figure 14 Two ways to establish FREL
It was inferred from establishing a district FREL in accordance with district borders of 2014 that drivers of deforestation and forest degradation of the districts separated from the same district, Pontianak District and Kubu Raya District for example, would be the same or similar. For this reason, the way of establishing FREL are not necessarily to be limited to setting for each district individually based on the way 2), and the other way, to set a FREL for multiple districts and allocate it to each districts depends on their total area.
2.3. Parameters applied into FREL
Based on above Table 9, it was thought that forest area and drivers of deforestation and forest degradation will be not depend on liner regression because 4 districts had unique background of establishment. In this study, 4 districts were integrated into 2 groups, which had similar statistical land use change and human activities in Primary forests and Secondary forests. Also identification of drivers of deforestation and forest degradation was analyzed by comparison among 2 groups (Figure 15).
Time (year)
CO
2 E
mis
sio
n
Time (year)
CO
2 E
mis
sio
n
Province
District A
District B
District C
District D
District F
District A
District B
District C
District D
District F
Province

Indonesia-Japan Project for Development of REDD+ Implementation Mechanism (REDD+ Planning Study) Final Report
- 31 -
Figure 15 Area change in Primary forests and Secondary forests in each district
From analysis in 2 groups, there was not obvious difference of historical forest area change among 4 districts. On the other hand, Primary forest in Pontianak and Kubu Raya had been high pressures and had experiences of big decrease. Also Kayong Utara and Ketapang had difference experiences, which had small decrease in Primary forests and still keep high ratio of Primary forests even in 2013.
Therefore it indicated that total forest area change in 4 districts had not much difference (flow is not difference), but forest carbon stock in Pontianak and Kubu Raya had specific characteristics by comparison with Kayong Utara and Ketapang (stock is high). Then groups are classified by 1) Pontianak and Kubu Raya and 2) Kayong Utara and Ketapang and such grouping was supported by following reasons;
Pontianak and Kubu Raya, and Kayong Utara and Ketapang were separated into 4 districts in year
2007. It means 4 districts in 2015 were statistically merged into 2 groups from 2000 to current year with keeping consistency of socio-economic statistics.
National FREL which is on progress by Indonesian Central Government applied data from 2000. Therefore, FREL and/or some related activities (i.e. socio-economic survey) should be keep historical consistency with such national activities. If this study uses data from year 2000, analysis and/or results will keep consistency with all of activities of REDD+ activities in Central level.
From now, drivers’ analysis of deforestation and forest degradation should be based n 2 groups and
future analysis will be according to some statistics approaches.
-10%
0%
10%
20%
30%
40%
50%
-20% 0% 20% 40% 60% 80% 100%
Are
a ch
ange
fro
m 2
000
t0 2
013
in
Seco
nd
ary
Fore
sts
(%)
Area change from 2000 to 2013 in Primary Forests (%)
Ketapang
Kayoung utara
Kubu raya
Pontianak
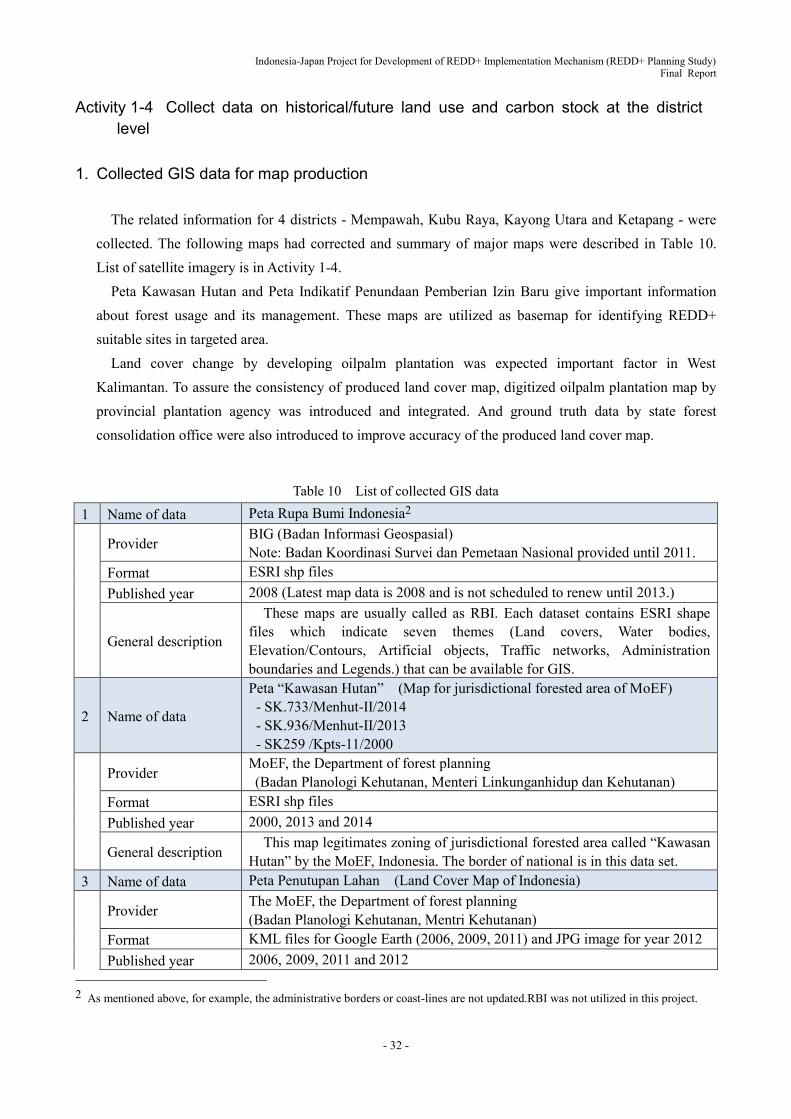
Indonesia-Japan Project for Development of REDD+ Implementation Mechanism (REDD+ Planning Study) Final Report
- 32 -
Activity 1-4 Collect data on historical/future land use and carbon stock at the district level
1. Collected GIS data for map production
The related information for 4 districts - Mempawah, Kubu Raya, Kayong Utara and Ketapang - were collected. The following maps had corrected and summary of major maps were described in Table 10. List of satellite imagery is in Activity 1-4.
Peta Kawasan Hutan and Peta Indikatif Penundaan Pemberian Izin Baru give important information about forest usage and its management. These maps are utilized as basemap for identifying REDD+ suitable sites in targeted area.
Land cover change by developing oilpalm plantation was expected important factor in West Kalimantan. To assure the consistency of produced land cover map, digitized oilpalm plantation map by provincial plantation agency was introduced and integrated. And ground truth data by state forest consolidation office were also introduced to improve accuracy of the produced land cover map.
Table 10 List of collected GIS data
1 Name of data Peta Rupa Bumi Indonesia2
Provider BIG (Badan Informasi Geospasial) Note: Badan Koordinasi Survei dan Pemetaan Nasional provided until 2011.
Format ESRI shp files Published year 2008 (Latest map data is 2008 and is not scheduled to renew until 2013.)
General description
These maps are usually called as RBI. Each dataset contains ESRI shape files which indicate seven themes (Land covers, Water bodies, Elevation/Contours, Artificial objects, Traffic networks, Administration boundaries and Legends.) that can be available for GIS.
2 Name of data
Peta “Kawasan Hutan” (Map for jurisdictional forested area of MoEF) - SK.733/Menhut-II/2014 - SK.936/Menhut-II/2013 - SK259 /Kpts-11/2000
Provider MoEF, the Department of forest planning (Badan Planologi Kehutanan, Menteri Linkunganhidup dan Kehutanan)
Format ESRI shp files Published year 2000, 2013 and 2014
General description This map legitimates zoning of jurisdictional forested area called “Kawasan
Hutan” by the MoEF, Indonesia. The border of national is in this data set. 3 Name of data Peta Penutupan Lahan (Land Cover Map of Indonesia)
Provider The MoEF, the Department of forest planning (Badan Planologi Kehutanan, Mentri Kehutanan)
Format KML files for Google Earth (2006, 2009, 2011) and JPG image for year 2012 Published year 2006, 2009, 2011 and 2012
2 As mentioned above, for example, the administrative borders or coast-lines are not updated.RBI was not utilized in this project.

Indonesia-Japan Project for Development of REDD+ Implementation Mechanism (REDD+ Planning Study) Final Report
- 33 -
General description This map is updated every 3 years. LANDSAT7 and SPOT4 satellite images
are processed to create this map, and forest cover change in Indonesia is analyzed and calculated by using this map.
4 Name of data Peta Indikatif Penundaan Pemberian Izin Baru (Indicative Map for Moratorium)
Provider UKP4, MoEF Format ESRI shp files, Published year Version 5, 6, 7, 9. Ver. 5 was used. (updated every 6 months)
General description
This map, so-called “PIPIB”, is regularly updated at 6-month interval. The dataset can be downloaded from the MoEF's web GIS site. This dataset shows the Moratorium area which the government suspends to newly issue land-use concession in “Primary natural forest and Peatlands”.
5 Name of data Administrative border of West Kalimantan province for Local Ordinance of Spatial Plan
Provider BAPPEDA Format ESRI shp files Published year 2014
General description This GIS data includes administrative border of the province, districts, and sub-districts for RTRWP..
6 Name of data Digitized Oilpalm land cover map in West Kalimantan Provider Provincial Plantation agency of West Kalimantan Format ESRI shp files Published year 2014
General description This map is visual interpreted and delineated by a lead technician works in the Dinas Perkebunan who supports Pokja REDD+ in West Kalimantan..
7 Name of data Ground Check survey result around Maya Island in Kayong Utara district Provider A BPKH staff. Format ESRI shp files Published year 2013
General description This data provided by a BPKH staff who has experiences around Maya Island in Kayong Utara district. And includes the result of field observation of land cover.
8 Name of data RBI data especially "Settlement" around Maya Island in Kayong Utara district Provider A Forest agency staff Format ESRI shp files Published year 20008
General description This data was provided by a staff working in Dinas Kehutanan Prop. Kalimantan Barat who has corporative relationship with Pokja REDD+ in West Kalimantan.
2. Collecting related documents
In case of implementing REDD+ activities and MRV system in Indonesia, there are several important documents that is, “RAD-GRK”, ”SRAP” and “National Forest Reference Emission Level For Deforestation And Forest Degradation”. The background and detail of these documents are described in
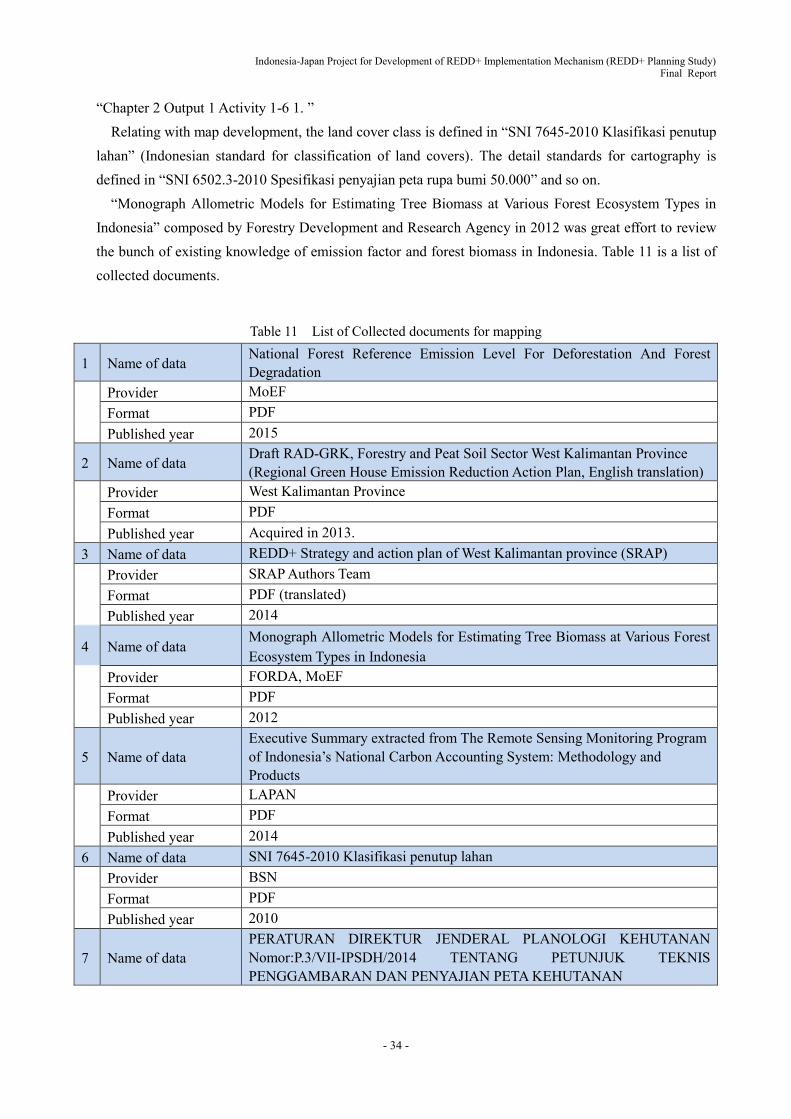
Indonesia-Japan Project for Development of REDD+ Implementation Mechanism (REDD+ Planning Study) Final Report
- 34 -
“Chapter 2 Output 1 Activity 1-6 1. ” Relating with map development, the land cover class is defined in “SNI 7645-2010 Klasifikasi penutup
lahan” (Indonesian standard for classification of land covers). The detail standards for cartography is defined in “SNI 6502.3-2010 Spesifikasi penyajian peta rupa bumi 50.000” and so on.
“Monograph Allometric Models for Estimating Tree Biomass at Various Forest Ecosystem Types in Indonesia” composed by Forestry Development and Research Agency in 2012 was great effort to review the bunch of existing knowledge of emission factor and forest biomass in Indonesia. Table 11 is a list of collected documents.
Table 11 List of Collected documents for mapping
1 Name of data National Forest Reference Emission Level For Deforestation And Forest Degradation
Provider MoEF Format PDF Published year 2015
2 Name of data Draft RAD-GRK, Forestry and Peat Soil Sector West Kalimantan Province (Regional Green House Emission Reduction Action Plan, English translation)
Provider West Kalimantan Province Format PDF Published year Acquired in 2013. 3 Name of data REDD+ Strategy and action plan of West Kalimantan province (SRAP) Provider SRAP Authors Team Format PDF (translated) Published year 2014
4 Name of data Monograph Allometric Models for Estimating Tree Biomass at Various Forest Ecosystem Types in Indonesia
Provider FORDA, MoEF Format PDF Published year 2012
5 Name of data Executive Summary extracted from The Remote Sensing Monitoring Program of Indonesia’s National Carbon Accounting System: Methodology and Products
Provider LAPAN Format PDF Published year 2014 6 Name of data SNI 7645-2010 Klasifikasi penutup lahan Provider BSN Format PDF Published year 2010
7 Name of data PERATURAN DIREKTUR JENDERAL PLANOLOGI KEHUTANAN Nomor:P.3/VII-IPSDH/2014 TENTANG PETUNJUK TEKNIS PENGGAMBARAN DAN PENYAJIAN PETA KEHUTANAN
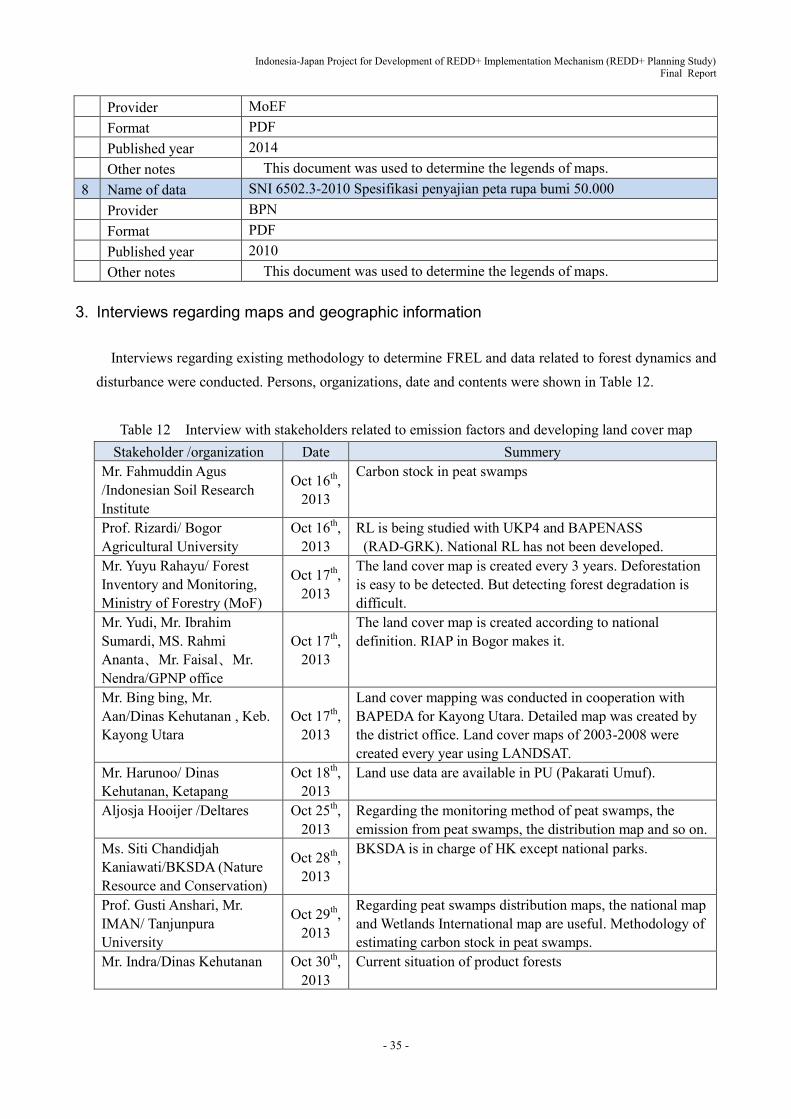
Indonesia-Japan Project for Development of REDD+ Implementation Mechanism (REDD+ Planning Study) Final Report
- 35 -
Provider MoEF Format PDF Published year 2014 Other notes This document was used to determine the legends of maps. 8 Name of data SNI 6502.3-2010 Spesifikasi penyajian peta rupa bumi 50.000 Provider BPN Format PDF Published year 2010 Other notes This document was used to determine the legends of maps.
3. Interviews regarding maps and geographic information
Interviews regarding existing methodology to determine FREL and data related to forest dynamics and disturbance were conducted. Persons, organizations, date and contents were shown in Table 12.
Table 12 Interview with stakeholders related to emission factors and developing land cover map
Stakeholder /organization Date Summery Mr. Fahmuddin Agus /Indonesian Soil Research Institute
Oct 16th, 2013
Carbon stock in peat swamps
Prof. Rizardi/ Bogor Agricultural University
Oct 16th, 2013
RL is being studied with UKP4 and BAPENASS (RAD-GRK). National RL has not been developed.
Mr. Yuyu Rahayu/ Forest Inventory and Monitoring, Ministry of Forestry (MoF)
Oct 17th, 2013
The land cover map is created every 3 years. Deforestation is easy to be detected. But detecting forest degradation is difficult.
Mr. Yudi, Mr. Ibrahim Sumardi, MS. Rahmi Ananta、Mr. Faisal、Mr. Nendra/GPNP office
Oct 17th, 2013
The land cover map is created according to national definition. RIAP in Bogor makes it.
Mr. Bing bing, Mr. Aan/Dinas Kehutanan , Keb. Kayong Utara
Oct 17th, 2013
Land cover mapping was conducted in cooperation with BAPEDA for Kayong Utara. Detailed map was created by the district office. Land cover maps of 2003-2008 were created every year using LANDSAT.
Mr. Harunoo/ Dinas Kehutanan, Ketapang
Oct 18th, 2013
Land use data are available in PU (Pakarati Umuf).
Aljosja Hooijer /Deltares Oct 25th, 2013
Regarding the monitoring method of peat swamps, the emission from peat swamps, the distribution map and so on.
Ms. Siti Chandidjah Kaniawati/BKSDA (Nature Resource and Conservation)
Oct 28th, 2013
BKSDA is in charge of HK except national parks.
Prof. Gusti Anshari, Mr. IMAN/ Tanjunpura University
Oct 29th, 2013
Regarding peat swamps distribution maps, the national map and Wetlands International map are useful. Methodology of estimating carbon stock in peat swamps.
Mr. Indra/Dinas Kehutanan Oct 30th, 2013
Current situation of product forests
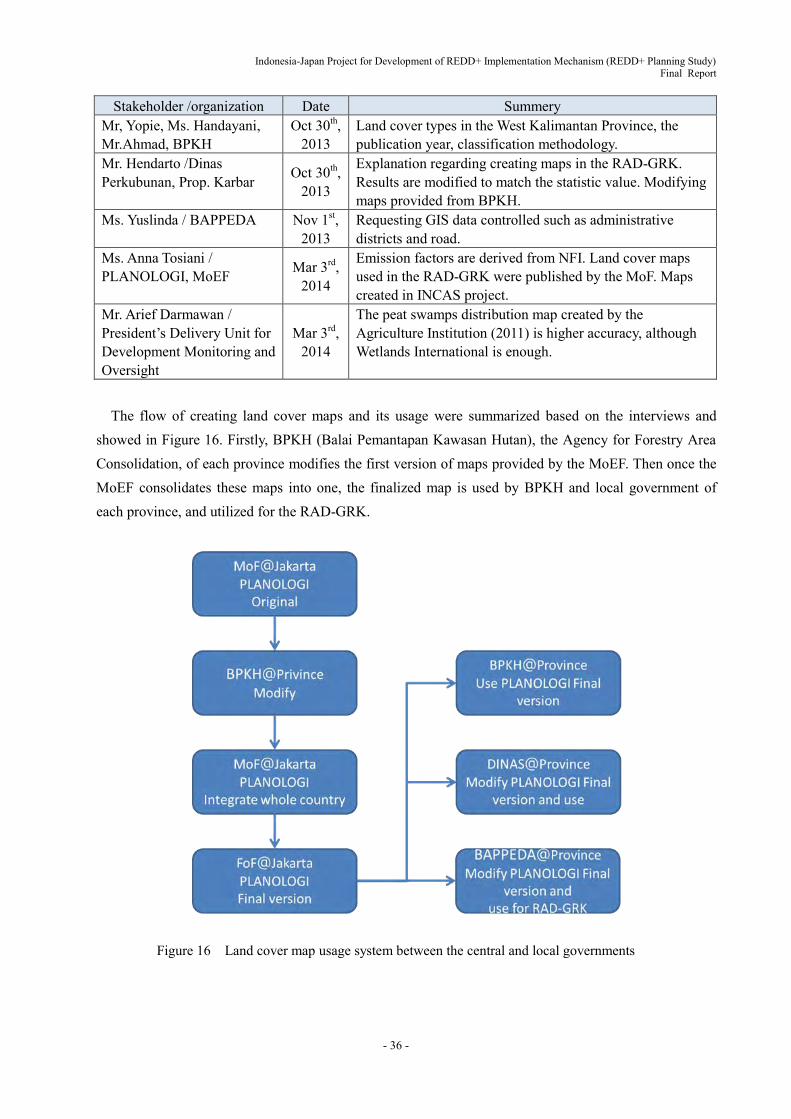
Indonesia-Japan Project for Development of REDD+ Implementation Mechanism (REDD+ Planning Study) Final Report
- 36 -
Stakeholder /organization Date Summery Mr, Yopie, Ms. Handayani, Mr.Ahmad, BPKH
Oct 30th, 2013
Land cover types in the West Kalimantan Province, the publication year, classification methodology.
Mr. Hendarto /Dinas Perkubunan, Prop. Karbar Oct 30th,
2013
Explanation regarding creating maps in the RAD-GRK. Results are modified to match the statistic value. Modifying maps provided from BPKH.
Ms. Yuslinda / BAPPEDA Nov 1st, 2013
Requesting GIS data controlled such as administrative districts and road.
Ms. Anna Tosiani / PLANOLOGI, MoEF Mar 3rd,
2014
Emission factors are derived from NFI. Land cover maps used in the RAD-GRK were published by the MoF. Maps created in INCAS project.
Mr. Arief Darmawan / President’s Delivery Unit for Development Monitoring and Oversight
Mar 3rd, 2014
The peat swamps distribution map created by the Agriculture Institution (2011) is higher accuracy, although Wetlands International is enough.
The flow of creating land cover maps and its usage were summarized based on the interviews and
showed in Figure 16. Firstly, BPKH (Balai Pemantapan Kawasan Hutan), the Agency for Forestry Area Consolidation, of each province modifies the first version of maps provided by the MoEF. Then once the MoEF consolidates these maps into one, the finalized map is used by BPKH and local government of each province, and utilized for the RAD-GRK.
Figure 16 Land cover map usage system between the central and local governments
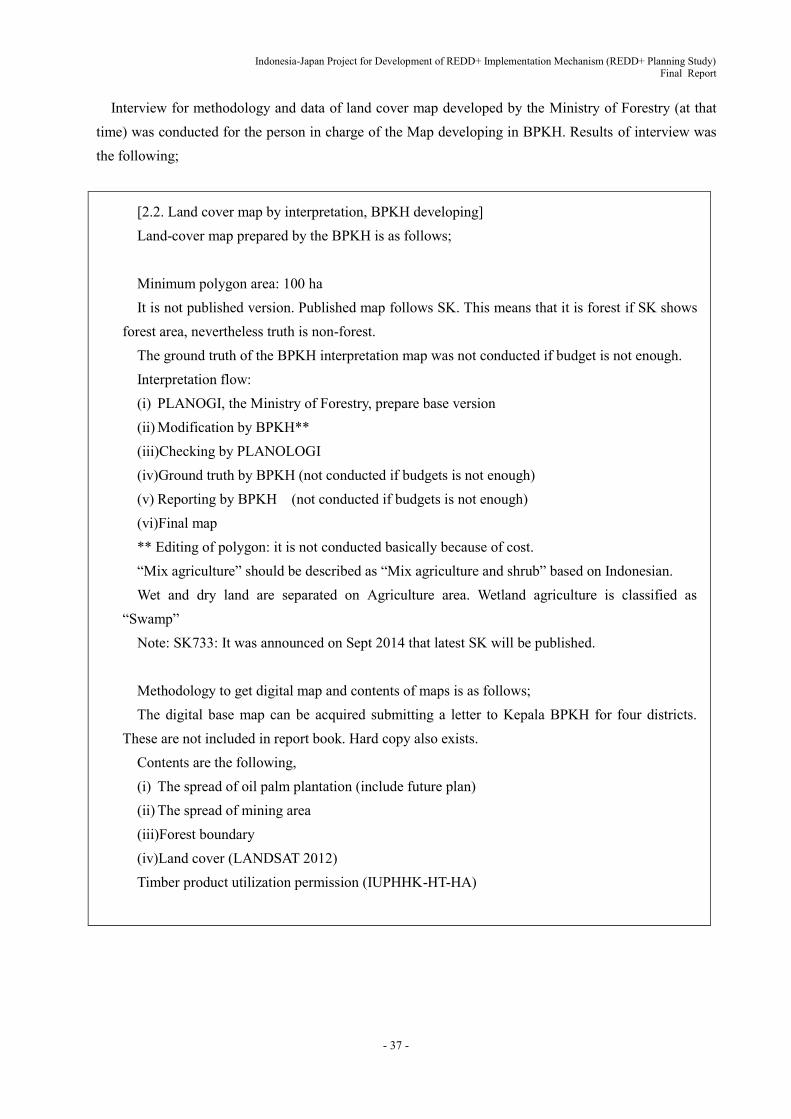
Indonesia-Japan Project for Development of REDD+ Implementation Mechanism (REDD+ Planning Study) Final Report
- 37 -
Interview for methodology and data of land cover map developed by the Ministry of Forestry (at that time) was conducted for the person in charge of the Map developing in BPKH. Results of interview was the following;
[2.2. Land cover map by interpretation, BPKH developing] Land-cover map prepared by the BPKH is as follows; Minimum polygon area: 100 ha It is not published version. Published map follows SK. This means that it is forest if SK shows
forest area, nevertheless truth is non-forest. The ground truth of the BPKH interpretation map was not conducted if budget is not enough. Interpretation flow: (i) PLANOGI, the Ministry of Forestry, prepare base version (ii) Modification by BPKH** (iii)Checking by PLANOLOGI (iv)Ground truth by BPKH (not conducted if budgets is not enough) (v) Reporting by BPKH (not conducted if budgets is not enough) (vi)Final map ** Editing of polygon: it is not conducted basically because of cost. “Mix agriculture” should be described as “Mix agriculture and shrub” based on Indonesian. Wet and dry land are separated on Agriculture area. Wetland agriculture is classified as
“Swamp” Note: SK733: It was announced on Sept 2014 that latest SK will be published. Methodology to get digital map and contents of maps is as follows; The digital base map can be acquired submitting a letter to Kepala BPKH for four districts.
These are not included in report book. Hard copy also exists. Contents are the following, (i) The spread of oil palm plantation (include future plan) (ii) The spread of mining area (iii)Forest boundary (iv)Land cover (LANDSAT 2012) Timber product utilization permission (IUPHHK-HT-HA)
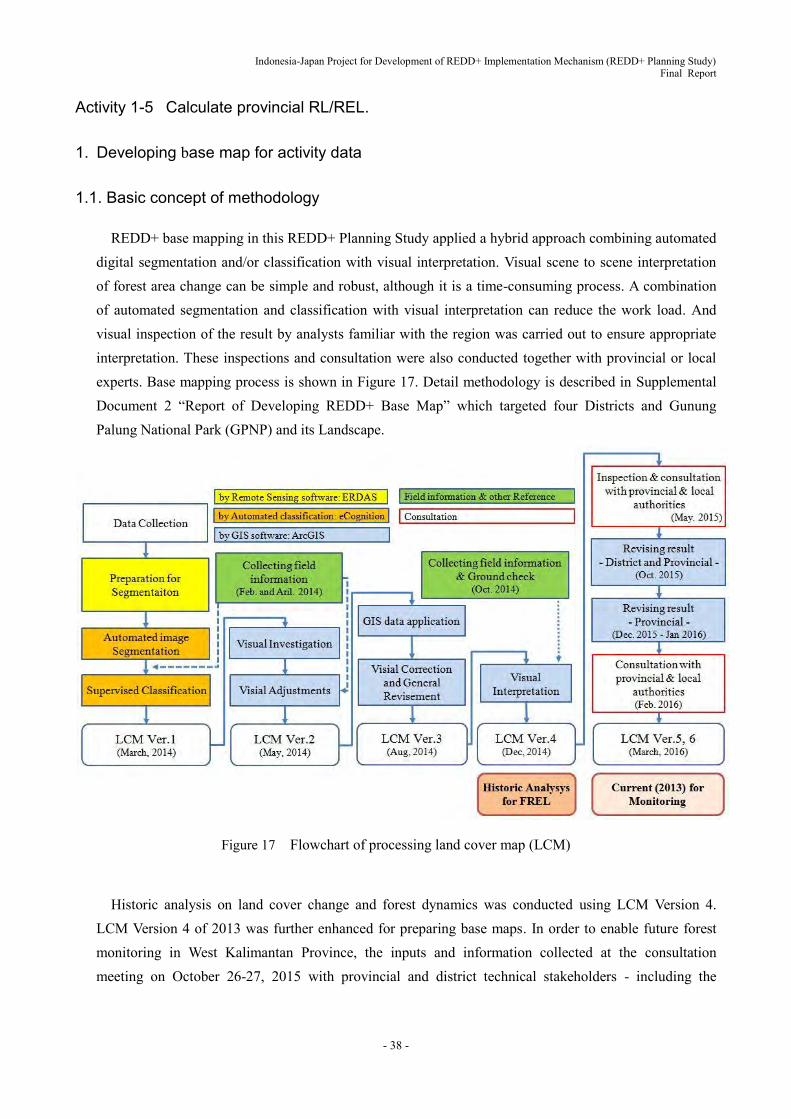
Indonesia-Japan Project for Development of REDD+ Implementation Mechanism (REDD+ Planning Study) Final Report
- 38 -
Activity 1-5 Calculate provincial RL/REL.
1. Developing base map for activity data
1.1. Basic concept of methodology
REDD+ base mapping in this REDD+ Planning Study applied a hybrid approach combining automated digital segmentation and/or classification with visual interpretation. Visual scene to scene interpretation of forest area change can be simple and robust, although it is a time-consuming process. A combination of automated segmentation and classification with visual interpretation can reduce the work load. And visual inspection of the result by analysts familiar with the region was carried out to ensure appropriate interpretation. These inspections and consultation were also conducted together with provincial or local experts. Base mapping process is shown in Figure 17. Detail methodology is described in Supplemental Document 2 “Report of Developing REDD+ Base Map” which targeted four Districts and Gunung Palung National Park (GPNP) and its Landscape.
Figure 17 Flowchart of processing land cover map (LCM)
Historic analysis on land cover change and forest dynamics was conducted using LCM Version 4. LCM Version 4 of 2013 was further enhanced for preparing base maps. In order to enable future forest monitoring in West Kalimantan Province, the inputs and information collected at the consultation meeting on October 26-27, 2015 with provincial and district technical stakeholders - including the

Indonesia-Japan Project for Development of REDD+ Implementation Mechanism (REDD+ Planning Study) Final Report
- 39 -
information on oil palm plantation distribution of provincial crop estate office - was introduced to produce LCM Ver. 5. LCM Ver. 5 was finalized based on the consultation with provincial stakeholders as LCM Version 6.
1.2. Satellite imagery used
The 5-year LANDSAT imageries (2000, 2006, 2009, 2011 and 2013) were used to develop LCM of four districts in West Kalimantan. Table 13 shows LANDSAT imageries used. And SPOT6 higher resolution satellite imageries also utilized to improve the classification around GPNP and its Landscape.
Table 13 List of LANDSAT imageries for producing LCM 2000 2006 2009 2011 2013
File name Source File name Source File name Source File name Source File name Source LE71200602001134SGS00
USGS LT51200602006268BKT00
USGS MOSAIK_2009_NUTM49_N01
INCAS-LAPAN
MOSAIK_2011_NUTM49_N01
INCAS-LAPAN
LC81200602013175LGN00
USGS
LE71200612001134SGS00
USGS LT51200612006268BKT00
USGS MOSAIK_2009_NUTM49_S01
INCAS-LAPAN
MOSAIK_2011_NUTM49_S01
INCAS-LAPAN
LC81200612013175LGN00
USGS
LE71200622001134SGS00
USGS LT51200622006268BKT00
USGS MOSAIK_2009_NUTM49_S02
INCAS-LAPAN
MOSAIK_2011_NUTM49_S02
INCAS-LAPAN
LC81200622013175LGN00
USGS
LE71210602001173SGS00
USGS LT51210602005224BKT00
USGS MOSAIK_2009_NUTM49_S05
INCAS-LAPAN
MOSAIK_2011_NUTM49_S05
INCAS-LAPAN
LC81210602013166LGN00
USGS
LE71210612001173SGS00
USGS LT51210612005224BKT00
USGS LC81210612013166LGN00
USGS
LE71210622001173SGS00
USGS LT51210622005224BKT00
USGS LC81210622013150LGN00
USGS
1.3. Land cover classes
Indonesian National Standard (Standar Nasional Indonesia) named “SNI 7645:2010 Klasifikasi penutup lahan” defines land cover classes for Indonesia. This standard refers to the land cover classification system by FAO (LCCS-UNFAO) and “ISO 19144-1 Geographic information – Classification Systems – Part 1: Classification system structure”. Based on these documents, it was modified and developed for especially Indonesia. Land cover map (LCM) produced by project is based on this standard. 23 land cover class of MoEF was referred to and modified as like Table 14.
Table 14 Land cover class applied No. Ministry of Environment and Forestry No. IJ-REDD+ 1 Hutan lahan kering primer Primary dry forest 1 Primary dry forest 2 Hutan lahan kering sekunder Secondary dry forest 2 Secondary dry forest 3 Hutan rawa primer Primary swamp forest 3 Primary swamp forest 4 Hutan rawa sekunder Secondary swamp forest 4 Secondary swamp forest 5 Hutan mangrove primer Primary mangrove forest 5 Primary mangrove forest 6 Hutan mangrove sekunder Secondary mangrove forest 6 Secondary mangrove forest 7 Semak belukar Shrub 7 Shrub 8 Semak belukar rawa Swamp shrub 8 Swamp shrub 9 Hutan tamanan Forest plantation 9 Forest plantation 10 Perkebunan Plantation/Estate crops 10 Plantation oilpalm
11 Plantation rubber
12 Plantation others 11 Permukiman Settlements 13 Settlements

Indonesia-Japan Project for Development of REDD+ Implementation Mechanism (REDD+ Planning Study) Final Report
- 40 -
No. Ministry of Environment and Forestry No. IJ-REDD+ 12 Tanah terbuka Open ground 14 Open ground 13 Savana Grassland 15 Grassland 14 Air Water 16 Water 15 Pertanian lahan kering Dry land agriculture 17 Agriculture 16 Pertanian lahan kering campur semak Dry agriculture mixed with shrub 18 Mixed agriculture 17 Sawah Rice field 19 Rice field 18 Tambak Fishponds 20 Fishponds 19 Bandara/Pelabuhan Airport/Port (merged with Settlements) 20 Transmigrasi Transmigration area (merged with Settlements) 21 Pertambangan Mining area 21 Mining 22 Rawa Swamps 22 Swamps 23 Awan Clouds 23 Clouds
24 Cloud shadows
2. Activities for developing peat distribution map
2.1. Collecting spatial data and maps for improving peatland maps
Peatland covers about 20 percent of the study area (Wetlands International, 2004; Ritung et al., 2011). Recent developments of industrial forest plantations and conversion to agricultural land have caused rapid disappearance of peat. Moreover, huge amount of carbon dioxide emissions has been accelerated from dried peat which was formed by intensive canal constructions and decreasing ground water table. Although total amount of carbon dioxide emission from peat is needed to calculate, there is an uncertainty of accuracy of existing peatland map because of the difficulty of the access to the peatland. In this situation, collecting spatial data, maps and interviews to experts were carried out for improving existing peatland maps.
Ministry of Agriculture and Ministry of Public Works developed peatland maps at 1/250,000 scale
based on the field surveys that had been conducted since 1970s (e.g. RePPProT3,1990). Wetlands International developed revised peatland distribution maps for Sumatera, Kalimantan and Papua with new field survey data during 2003-2006 and they have been widely used in Indonesia. Meanwhile, Ministry of Agriculture has developed the latest peatland distribution map of Indonesia (Ritung et al., 2011) using all available data collected during 1989-2011. It was authorized by Indonesian Government as a national peatland map of Indonesia in 2014.
As two peatland maps have been used widely in Indonesia, those maps were used as base map for improving accuracy of existing peatland distribution maps. The peatland map of Kalimantan Island including West Kalimantan was developed by Wetlands International in 2004 (hereinafter called WI (2004)). General information of the two maps are as follows;
3 World Bank-funded Regional Physical Planning Program for Transmigration (RePPProT, 1990)

Indonesia-Japan Project for Development of REDD+ Implementation Mechanism (REDD+ Planning Study) Final Report
- 41 -
Table 15 General information of the two maps
Name of map General description
Peta Lahan Gambut
Indonesia
(Skala 1:250,000) Edisi
Desember 2011
Provider: Ministry of Agriculture(Kementerian Pertanian, Badan Penelitian dan
Pengembangan Pertanian, BBSDLP (Balai Besar Penelitian dan Pengembangan
Sumberdaya Lahan Pertanian)
Published year/data format: Dec.2011/ PDF format
・Purpose is to be applied to moratorium map which is instructed by Perpes
(10/2011). Peatland distribution map using available data collected during
1989-2011.
・Determining the various data topo sheets at 1:250,000 scale, topographic map
(BIG),1:250,000 geological map(Ministry of Mine and Energy), 1/250,000 soil
map (LREP:Land Resources Evaluation Project), 1/100,000 soil map
(PLG:Pengembangan Lahan Gambut/1 million hectares project in Kalteng),
Landsat-7/ETM+
・Different peat depth with five colors (D0:<50cm, D1:50-100cm, D2:100-200cm,
D3:200-300cm, D4>=300cm).
Maps of peatland
distribution and carbon
content in Sumatra,
Kalimantan and Papua
(2003, 2004, 2006)
Provider: Wetlands International
Published Year/ data format: 2003(Sumatera), 2004 (Kalimantan), 2006 (Papua)/
ESRI shape format
・Different peat depth with six colors(H0:<50cm, H1:50-100cm, H2:100-200cm,
H3:200-400cm, H4:400-800cm, H5:800-1200cm).
Figure 18 Peatland distribution Map (Left:Ritung et al (2011),Right:Wetlands International (2004))

Indonesia-Japan Project for Development of REDD+ Implementation Mechanism (REDD+ Planning Study) Final Report
- 42 -
2.2. Interview with the experts regarding peatland distribution maps
Interviews with experts were conducted to discuss the method and accuracy of existing peatland distribution map (Table 16).
Table 16 Summary of the interview survey
Name of expert/organization Date Content of the interview
Dr.Gusti Anshari/UNTAN Feb 24th , 2014 The peatland map of WI (2004) is not correct,
especially at Rasau Jaya area. Field verification
survey should be conducted
Mr. Nyoman/Wetlands International May 16th , 2014 Accuracy of WI (2004) may not be high especially
for West Kalimantan due to the lack of data.
Dr. Kusumo Nuguroho/Ministry of
Agriculture,BBSDLP
July 11th, 2014 Discussion of the map integrated by Ritung et al.
(2011)
Mr. NyomanWetlands International July 11th, 2014 Peatland distribution in the part of Jambi and
Central Kalimantan were improved by the latest
field survey data.
Mr. Kusumo Nuguroho/Ministry of
Agriculture,BBSDLP
Sept 19th, 2014 Peatland map of Ritung et al (2011) was authorized
by Indonesian government as a national peatland
map in Indonesia.
Following is a process of peatland map integration of Ritung et al (2011). However, the type and observation date of the satellite images were not specified as well as scale and reference source in the topographic map, geologic map and the existing research data.
【Process of peatland map integration of Ritung et al (2011)】 1) Review of basic peatland information
i) RePPPRoT, 1989 (All Indonesia) ii) Soil Map Merauke-Digul-Tanah Merah, 1985-1986 iii) Land Resources / Land Sumatra (LREP-I), 1989/4 iv) Map of the Land exploration Indonesia (Puslitanak, 2000) v) Potential Map of land for oil palm, Sumatra and Kalimantan, 2009 vi) Soil Map of Borneo 1998-2009 vii) Peat Wetland Map Intern Program (2004 & 2005)
2) Review of land resources information DB 3) Review of satellite data, geologic map and topographic map 4) Review of existing research data

Indonesia-Japan Project for Development of REDD+ Implementation Mechanism (REDD+ Planning Study) Final Report
- 43 -
5) Review of Riau, Jambi, Aceh, South Sumatra (2007-2010)GHG/peatland map 6) Review of land use map in Borneo (2010-2011) 7) Review of land use map in Papua/ West Papua 8) Review of Papua/ West Papua Agro Ecological Zone (AEZ) map 9) Review of survey in Mamberamo (2005)
2.3. Improvement of accuracy of peatland map
Accuracy of peatland distribution map is generally depending on the availability of the data sets. Satellite image is expected to contribute for improvement of accuracy. As development and canal construction have been made intensively in peat swamp forests since the 1990s, characteristics of peat swamp forest can be recognized on the satellite images before 1990s. In addition, digital surface elevation data which was taken in 2000 is available. Furthermore, by utilizing the polarization of the microwave such as PALSAR, distribution of peat swamp forest is suggested by unique signals of different scatter mechanism. Therefore, it is important to conduct field survey at the areas where available data is scarce and characteristics of peat swamp forests are clearly indicated in DEM and satellite image.
Figure 19 Characteristics of peat swamp forest on the images (left: LANDSAT in 1972, Right:SRTM/DEM)
2.4. Flow of satellite data analysis and selection of field verification survey area
Determination of data set was carried out for 1970-1980's satellite images (LANDSAT-MSS/TM), elevation values obtained in 2000 (SRTM / DEM), the boundary of the WI (2004) and the latest peatland distribution map of Ritung et al (2011). Furthermore, as accessibility to the field verification area is also important, the final field verification area is selected considering existing roads and drainage.
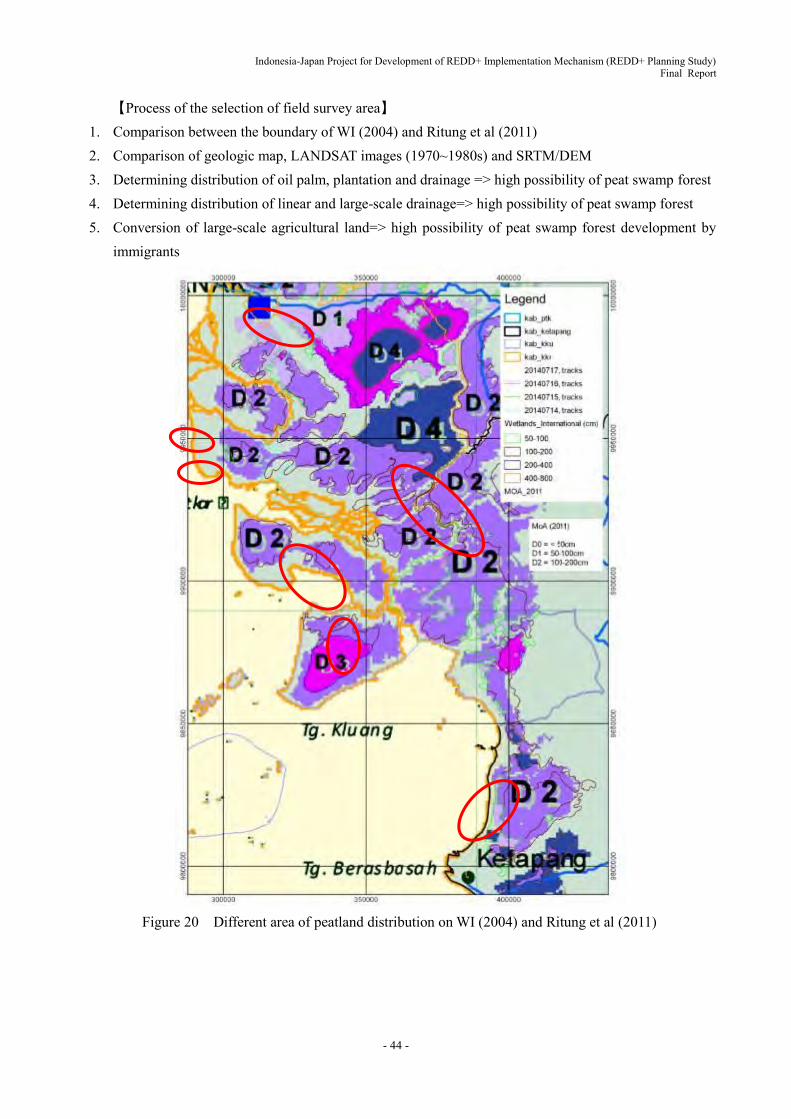
Indonesia-Japan Project for Development of REDD+ Implementation Mechanism (REDD+ Planning Study) Final Report
- 44 -
【Process of the selection of field survey area】 1. Comparison between the boundary of WI (2004) and Ritung et al (2011) 2. Comparison of geologic map, LANDSAT images (1970~1980s) and SRTM/DEM 3. Determining distribution of oil palm, plantation and drainage => high possibility of peat swamp forest 4. Determining distribution of linear and large-scale drainage=> high possibility of peat swamp forest 5. Conversion of large-scale agricultural land=> high possibility of peat swamp forest development by
immigrants
Figure 20 Different area of peatland distribution on WI (2004) and Ritung et al (2011)
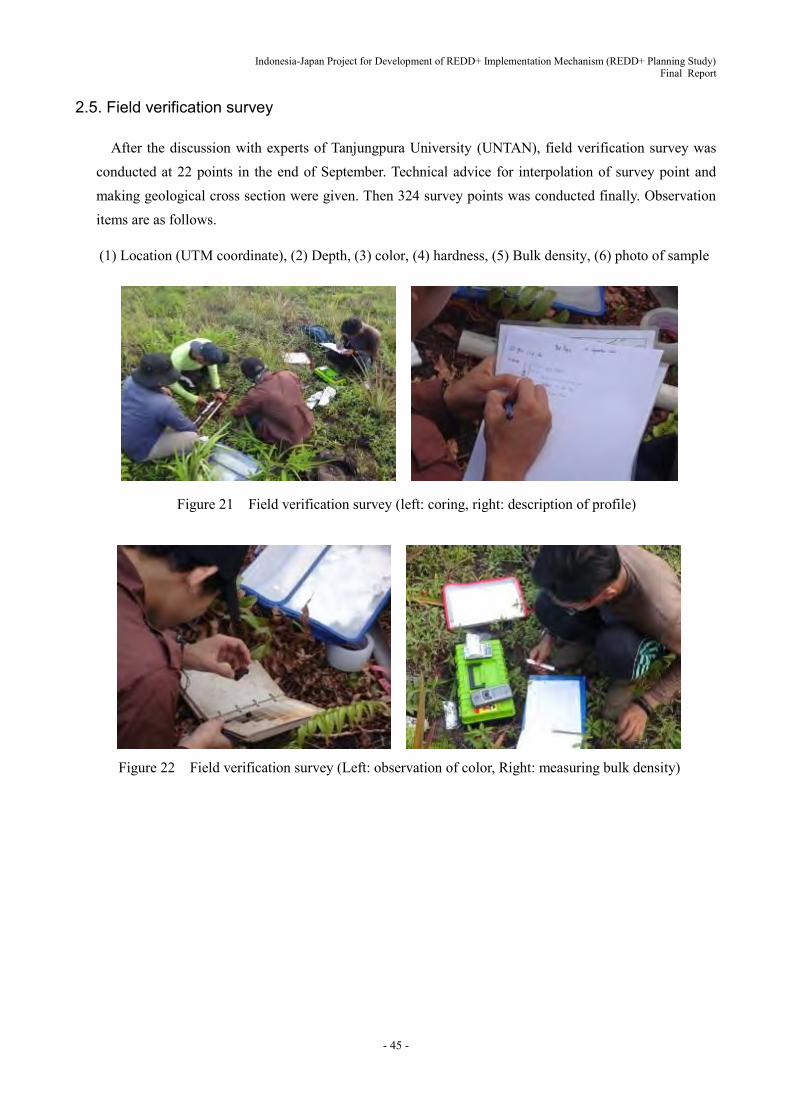
Indonesia-Japan Project for Development of REDD+ Implementation Mechanism (REDD+ Planning Study) Final Report
- 45 -
2.5. Field verification survey
After the discussion with experts of Tanjungpura University (UNTAN), field verification survey was conducted at 22 points in the end of September. Technical advice for interpolation of survey point and making geological cross section were given. Then 324 survey points was conducted finally. Observation items are as follows.
(1) Location (UTM coordinate), (2) Depth, (3) color, (4) hardness, (5) Bulk density, (6) photo of sample
Figure 21 Field verification survey (left: coring, right: description of profile)
Figure 22 Field verification survey (Left: observation of color, Right: measuring bulk density)

Indonesia-Japan Project for Development of REDD+ Implementation Mechanism (REDD+ Planning Study) Final Report
- 46 -
Figure 23 Field verification survey (Left: boundary with clay, right: basement granite)
The purpose of the field verification survey is to make sure of peat boundaries. Since definition of peat
is more than 50 cm in thickness of peat layer, thickness of peat was determined by the peat boundaries.
Figure 24 Field verification survey (survey direction should be perpendicular to boundary of map
2.6. Revised peatland distribution map
Field verification survey was carried out at 324 points to collect information of peat boundary. For example, the result of 22 survey points which was obtained in middle of September 2014, shows the minus 4,000 m difference between WI (2004) and revised peatland distribution map prepared by IJ-REDD+ project (hereafter called as IJ-REDD+ (2015). Also 1,500 m difference was recognized between Ritung et al (2011) and IJ-REDD+ (2015). That is, WI (2004) is relatively overestimated, and Ritung et al (2011) shows an underestimation. Furthermore, decreased area of peatland has impact on annual CO2 emissions of 25,600 t (in case of emission of 20 t-CO2-e/ha/y).
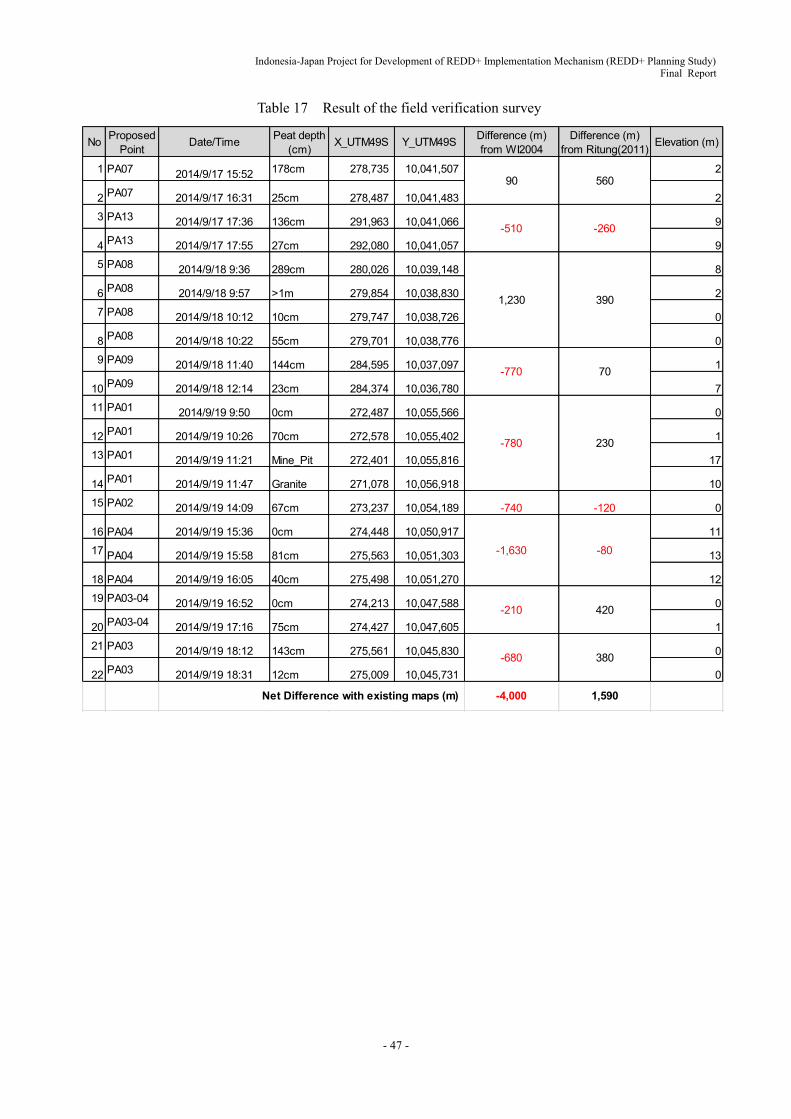
Indonesia-Japan Project for Development of REDD+ Implementation Mechanism (REDD+ Planning Study) Final Report
- 47 -
Table 17 Result of the field verification survey
No ProposedPoint Date/Time Peat depth
(cm) X_UTM49S Y_UTM49S Difference (m)from WI2004
Difference (m)from Ritung(2011) Elevation (m)
1 PA07 2014/9/17 15:52 178cm 278,735 10,041,507 2
2 PA07 2014/9/17 16:31 25cm 278,487 10,041,483 23 PA13 2014/9/17 17:36 136cm 291,963 10,041,066 9
4 PA13 2014/9/17 17:55 27cm 292,080 10,041,057 95 PA08 2014/9/18 9:36 289cm 280,026 10,039,148 8
6 PA08 2014/9/18 9:57 >1m 279,854 10,038,830 27 PA08 2014/9/18 10:12 10cm 279,747 10,038,726 0
8 PA08 2014/9/18 10:22 55cm 279,701 10,038,776 09 PA09 2014/9/18 11:40 144cm 284,595 10,037,097 1
10 PA09 2014/9/18 12:14 23cm 284,374 10,036,780 711 PA01 2014/9/19 9:50 0cm 272,487 10,055,566 0
12 PA01 2014/9/19 10:26 70cm 272,578 10,055,402 113 PA01 2014/9/19 11:21 Mine_Pit 272,401 10,055,816 17
14 PA01 2014/9/19 11:47 Granite 271,078 10,056,918 1015 PA02 2014/9/19 14:09 67cm 273,237 10,054,189 -740 -120 0
16 PA04 2014/9/19 15:36 0cm 274,448 10,050,917 1117 PA04 2014/9/19 15:58 81cm 275,563 10,051,303 13
18 PA04 2014/9/19 16:05 40cm 275,498 10,051,270 1219 PA03-04 2014/9/19 16:52 0cm 274,213 10,047,588 0
20 PA03-04 2014/9/19 17:16 75cm 274,427 10,047,605 121 PA03 2014/9/19 18:12 143cm 275,561 10,045,830 0
22 PA03 2014/9/19 18:31 12cm 275,009 10,045,731 0
Net Difference with existing maps (m) -4,000 1,590
-210 420
-680 380
-780 230
-1,630 -80
1,230 390
-770 70
90 560
-510 -260

Indonesia-Japan Project for Development of REDD+ Implementation Mechanism (REDD+ Planning Study) Final Report
- 48 -
Figure 25 Revised peatland map based on the field verification survey (17th-19th September)
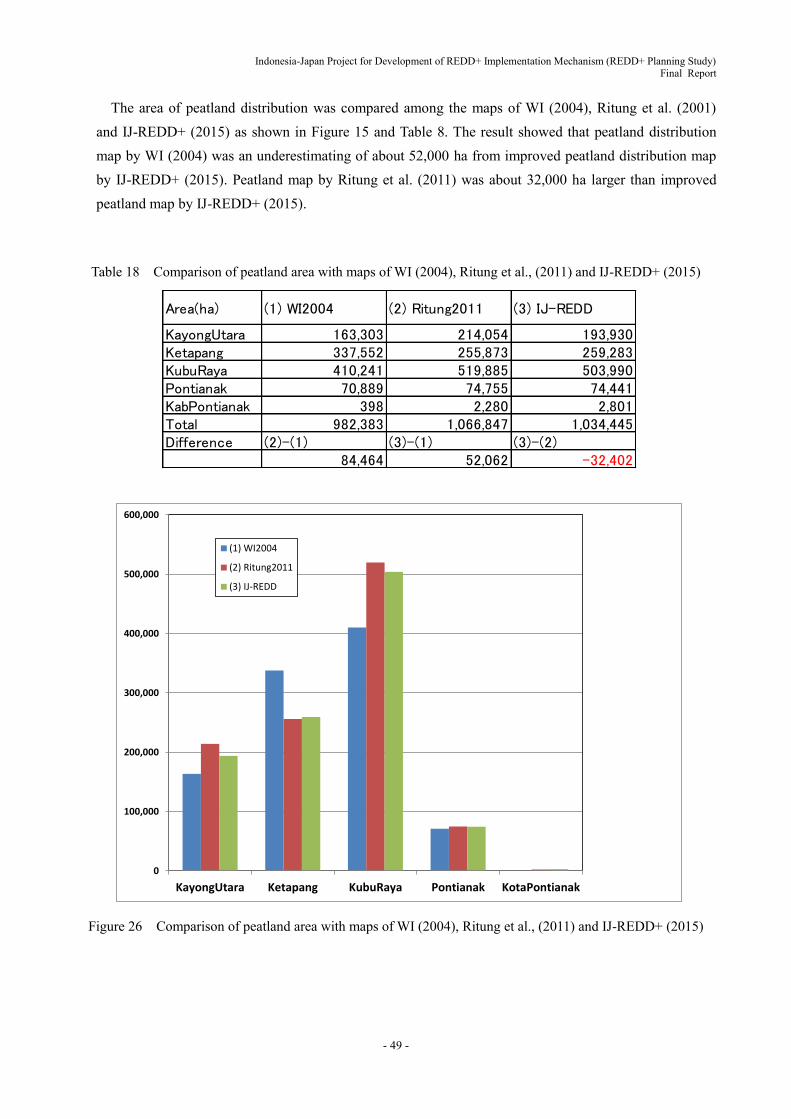
Indonesia-Japan Project for Development of REDD+ Implementation Mechanism (REDD+ Planning Study) Final Report
- 49 -
The area of peatland distribution was compared among the maps of WI (2004), Ritung et al. (2001) and IJ-REDD+ (2015) as shown in Figure 15 and Table 8. The result showed that peatland distribution map by WI (2004) was an underestimating of about 52,000 ha from improved peatland distribution map by IJ-REDD+ (2015). Peatland map by Ritung et al. (2011) was about 32,000 ha larger than improved peatland map by IJ-REDD+ (2015).
Table 18 Comparison of peatland area with maps of WI (2004), Ritung et al., (2011) and IJ-REDD+ (2015)
Figure 26 Comparison of peatland area with maps of WI (2004), Ritung et al., (2011) and IJ-REDD+ (2015)
Area(ha) (1) WI2004 (2) Ritung2011 (3) IJ-REDD
KayongUtara 163,303 214,054 193,930Ketapang 337,552 255,873 259,283KubuRaya 410,241 519,885 503,990Pontianak 70,889 74,755 74,441KabPontianak 398 2,280 2,801Total 982,383 1,066,847 1,034,445Difference (2)-(1) (3)-(1) (3)-(2)
84,464 52,062 -32,402
0
100,000
200,000
300,000
400,000
500,000
600,000
KayongUtara Ketapang KubuRaya Pontianak KotaPontianak
(1) WI2004
(2) Ritung2011
(3) IJ-REDD
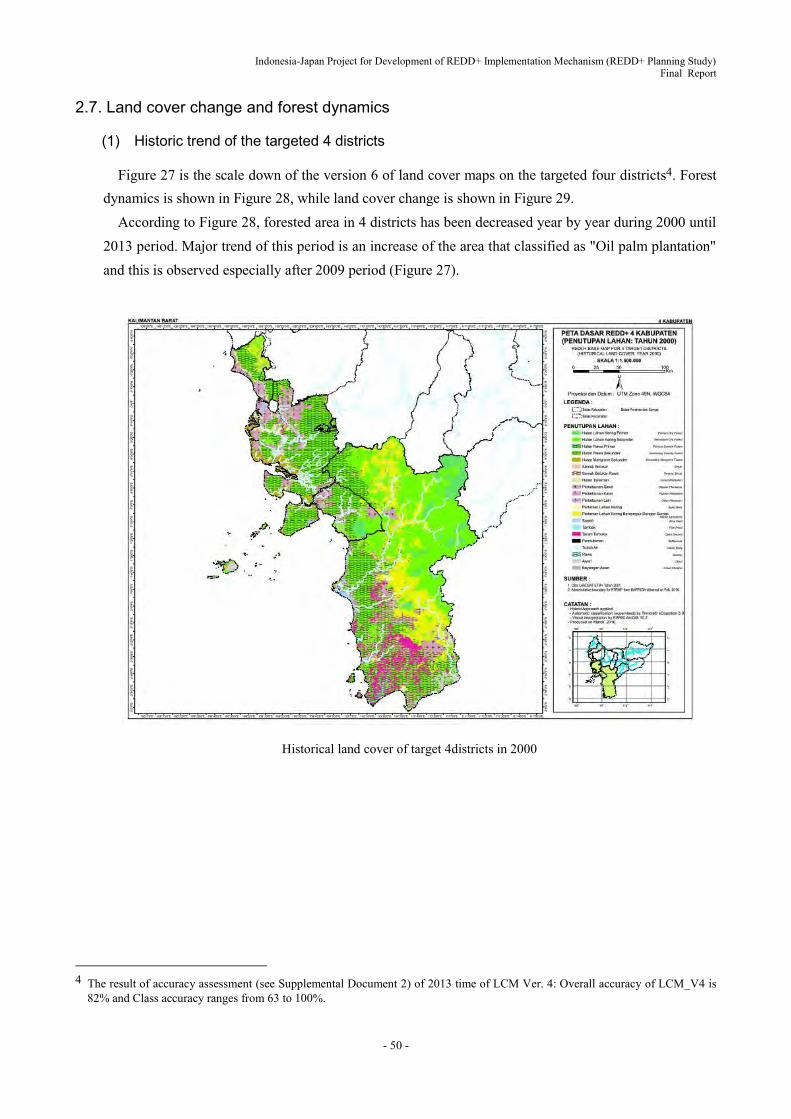
Indonesia-Japan Project for Development of REDD+ Implementation Mechanism (REDD+ Planning Study) Final Report
- 50 -
2.7. Land cover change and forest dynamics
(1) Historic trend of the targeted 4 districts
Figure 27 is the scale down of the version 6 of land cover maps on the targeted four districts4. Forest dynamics is shown in Figure 28, while land cover change is shown in Figure 29.
According to Figure 28, forested area in 4 districts has been decreased year by year during 2000 until 2013 period. Major trend of this period is an increase of the area that classified as "Oil palm plantation" and this is observed especially after 2009 period (Figure 27).
Historical land cover of target 4districts in 2000
4 The result of accuracy assessment (see Supplemental Document 2) of 2013 time of LCM Ver. 4: Overall accuracy of LCM_V4 is
82% and Class accuracy ranges from 63 to 100%.

Indonesia-Japan Project for Development of REDD+ Implementation Mechanism (REDD+ Planning Study) Final Report
- 51 -
Historical land cover of target 4districts in 2006
Historical land cover of target 4districts in 2009

Indonesia-Japan Project for Development of REDD+ Implementation Mechanism (REDD+ Planning Study) Final Report
- 52 -
Historical land cover of target 4districts in 2011
Current land cover of target 4districts in 2013
Figure 27 Historic LCMs of targeted 4 districts

Indonesia-Japan Project for Development of REDD+ Implementation Mechanism (REDD+ Planning Study) Final Report
- 53 -
Figure 28 Forest dynamics of targeted 4 districts (LCM Ver. 6) (Unit: %)
Figure 29 Land cover change of the targeted 4 districts (LCM Ver. 6) (Unit: %)
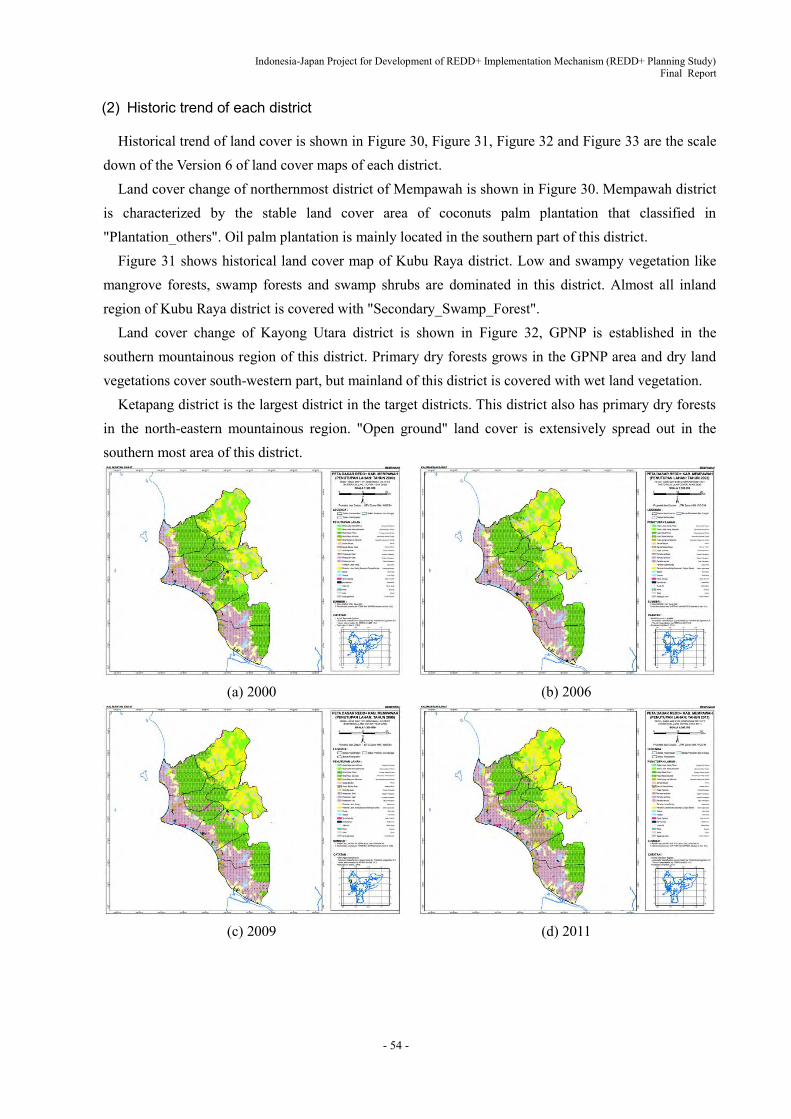
Indonesia-Japan Project for Development of REDD+ Implementation Mechanism (REDD+ Planning Study) Final Report
- 54 -
(2) Historic trend of each district
Historical trend of land cover is shown in Figure 30, Figure 31, Figure 32 and Figure 33 are the scale down of the Version 6 of land cover maps of each district.
Land cover change of northernmost district of Mempawah is shown in Figure 30. Mempawah district is characterized by the stable land cover area of coconuts palm plantation that classified in "Plantation_others". Oil palm plantation is mainly located in the southern part of this district.
Figure 31 shows historical land cover map of Kubu Raya district. Low and swampy vegetation like mangrove forests, swamp forests and swamp shrubs are dominated in this district. Almost all inland region of Kubu Raya district is covered with "Secondary_Swamp_Forest".
Land cover change of Kayong Utara district is shown in Figure 32, GPNP is established in the southern mountainous region of this district. Primary dry forests grows in the GPNP area and dry land vegetations cover south-western part, but mainland of this district is covered with wet land vegetation.
Ketapang district is the largest district in the target districts. This district also has primary dry forests in the north-eastern mountainous region. "Open ground" land cover is extensively spread out in the southern most area of this district.
(a) 2000
(b) 2006
(c) 2009
(d) 2011

Indonesia-Japan Project for Development of REDD+ Implementation Mechanism (REDD+ Planning Study) Final Report
- 55 -
(e) 2013
Figure 30 Historic LCMs of Mempawah district (LCM Ver. 6)
(a) 2000
(b) 2006
(c) 2009
(d) 2011
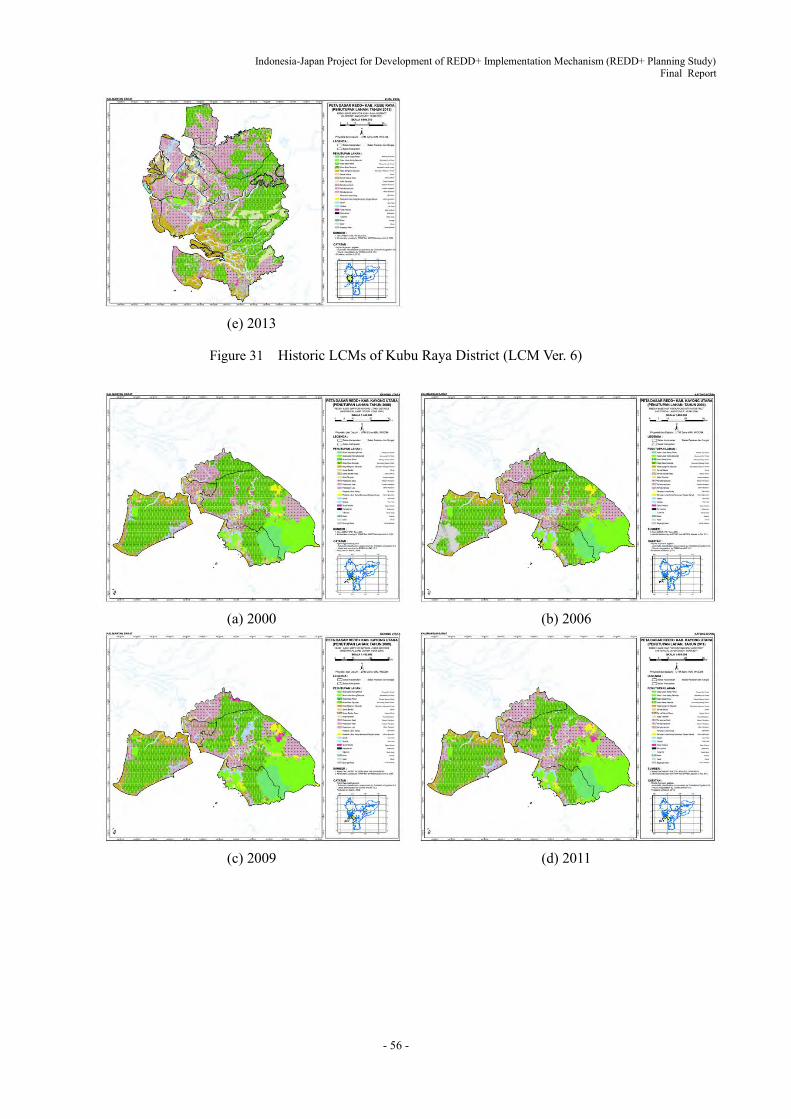
Indonesia-Japan Project for Development of REDD+ Implementation Mechanism (REDD+ Planning Study) Final Report
- 56 -
(e) 2013
Figure 31 Historic LCMs of Kubu Raya District (LCM Ver. 6)
(a) 2000
(b) 2006
(c) 2009
(d) 2011
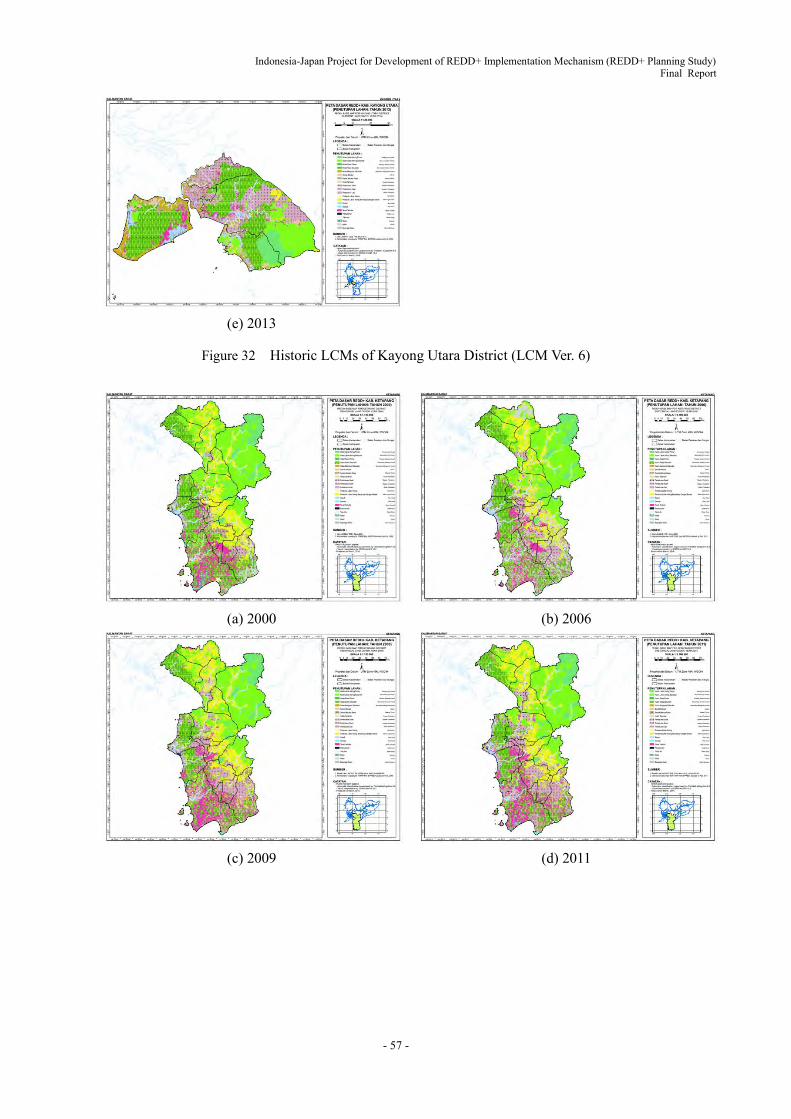
Indonesia-Japan Project for Development of REDD+ Implementation Mechanism (REDD+ Planning Study) Final Report
- 57 -
(e) 2013
Figure 32 Historic LCMs of Kayong Utara District (LCM Ver. 6)
(a) 2000
(b) 2006
(c) 2009
(d) 2011
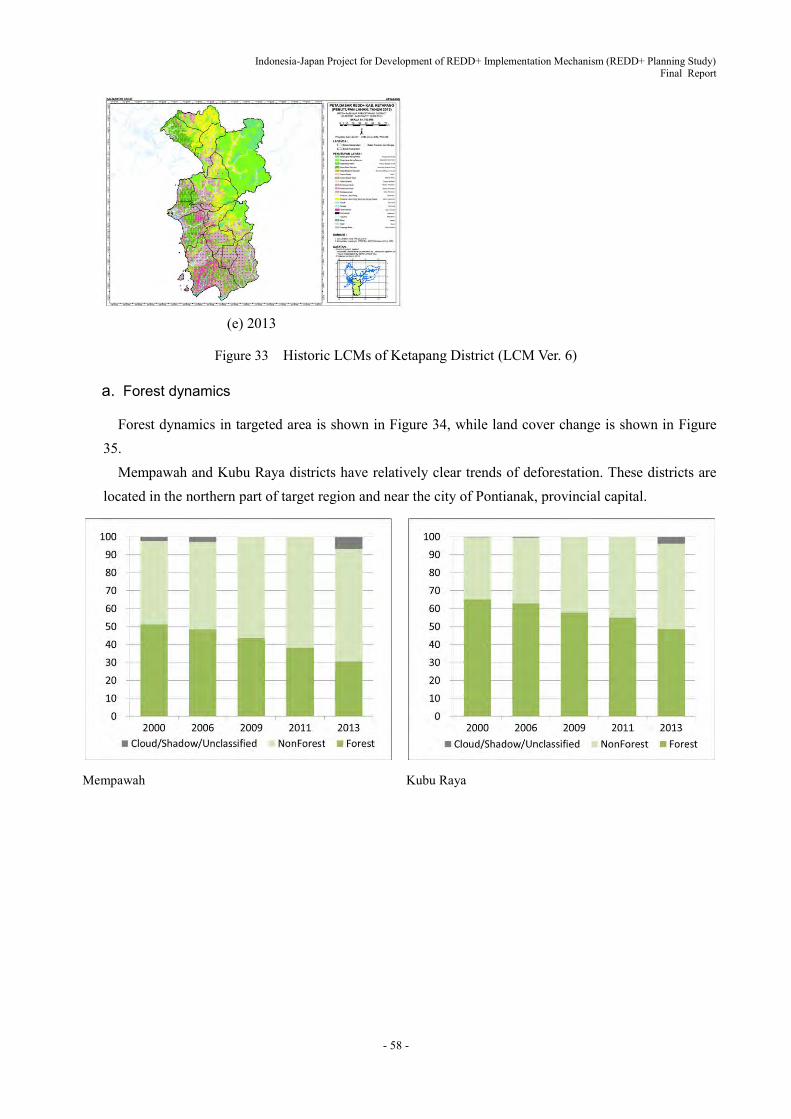
Indonesia-Japan Project for Development of REDD+ Implementation Mechanism (REDD+ Planning Study) Final Report
- 58 -
(e) 2013
Figure 33 Historic LCMs of Ketapang District (LCM Ver. 6)
a. Forest dynamics
Forest dynamics in targeted area is shown in Figure 34, while land cover change is shown in Figure 35.
Mempawah and Kubu Raya districts have relatively clear trends of deforestation. These districts are located in the northern part of target region and near the city of Pontianak, provincial capital.
Mempawah Kubu Raya
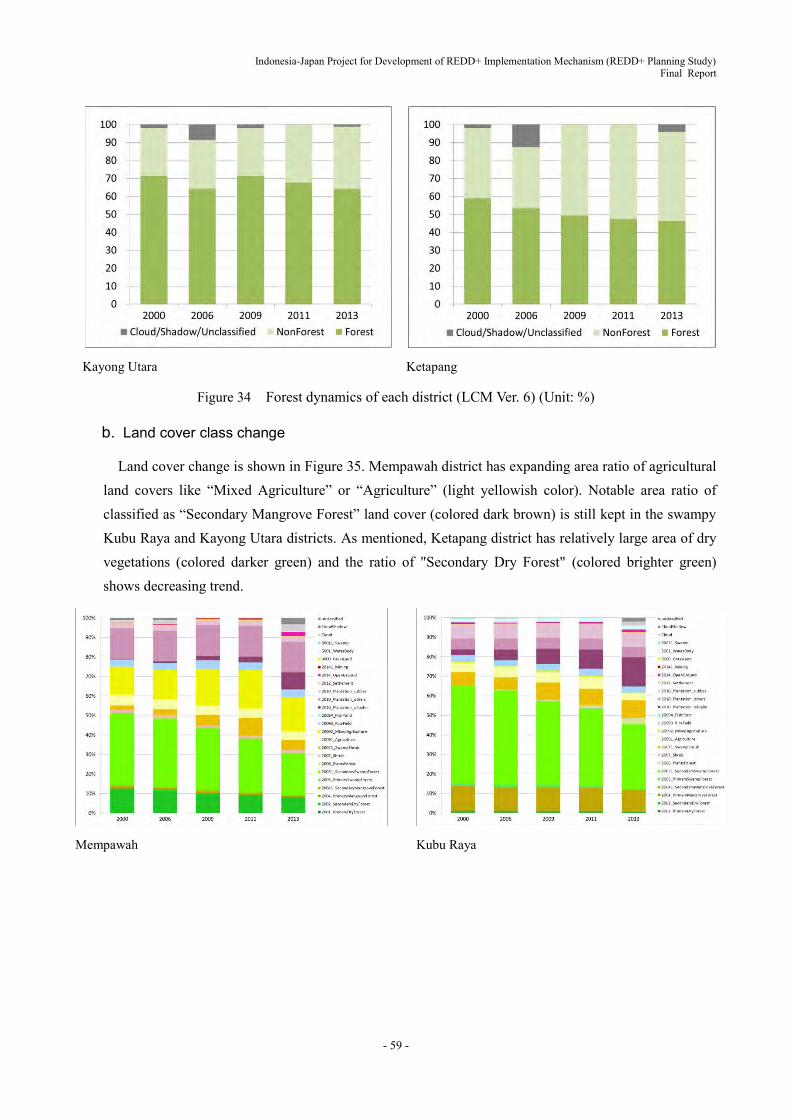
Indonesia-Japan Project for Development of REDD+ Implementation Mechanism (REDD+ Planning Study) Final Report
- 59 -
Kayong Utara Ketapang
Figure 34 Forest dynamics of each district (LCM Ver. 6) (Unit: %)
b. Land cover class change
Land cover change is shown in Figure 35. Mempawah district has expanding area ratio of agricultural land covers like “Mixed Agriculture” or “Agriculture” (light yellowish color). Notable area ratio of classified as “Secondary Mangrove Forest” land cover (colored dark brown) is still kept in the swampy Kubu Raya and Kayong Utara districts. As mentioned, Ketapang district has relatively large area of dry vegetations (colored darker green) and the ratio of "Secondary Dry Forest" (colored brighter green) shows decreasing trend.
Mempawah Kubu Raya
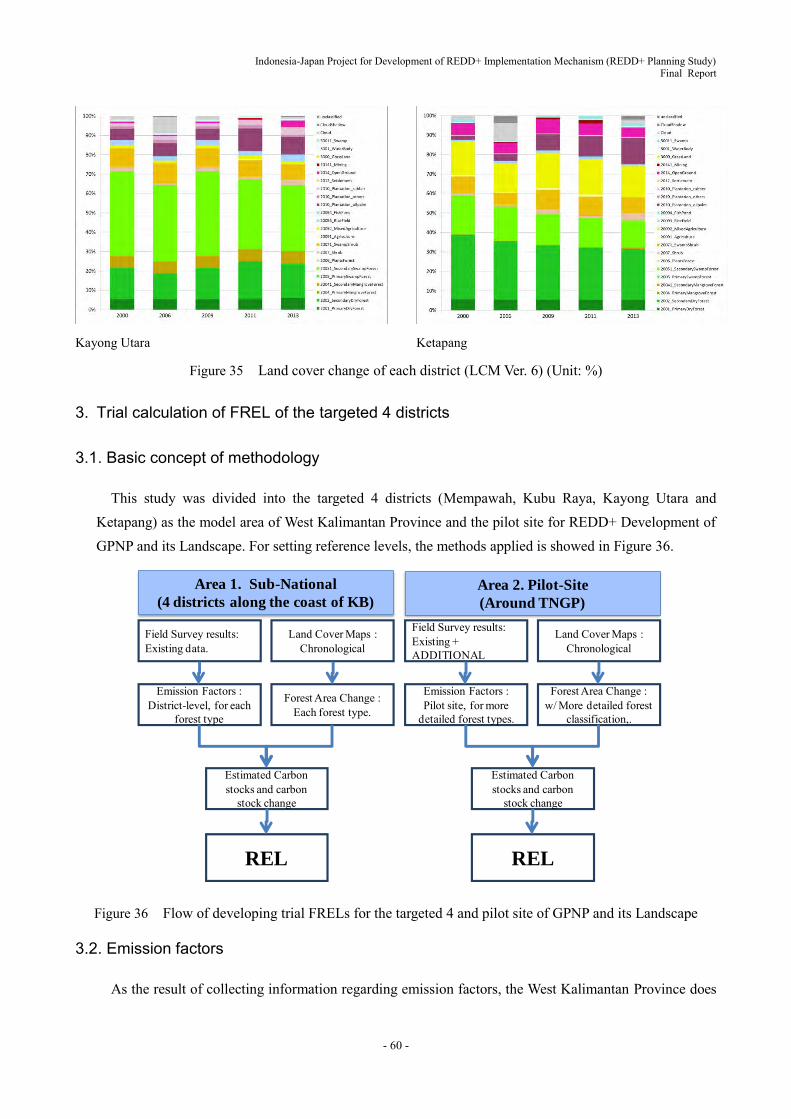
Indonesia-Japan Project for Development of REDD+ Implementation Mechanism (REDD+ Planning Study) Final Report
- 60 -
Kayong Utara Ketapang
Figure 35 Land cover change of each district (LCM Ver. 6) (Unit: %)
3. Trial calculation of FREL of the targeted 4 districts
3.1. Basic concept of methodology
This study was divided into the targeted 4 districts (Mempawah, Kubu Raya, Kayong Utara and Ketapang) as the model area of West Kalimantan Province and the pilot site for REDD+ Development of GPNP and its Landscape. For setting reference levels, the methods applied is showed in Figure 36.
Figure 36 Flow of developing trial FRELs for the targeted 4 and pilot site of GPNP and its Landscape
3.2. Emission factors
As the result of collecting information regarding emission factors, the West Kalimantan Province does
Field Survey results:Existing data.
Emission Factors :District-level, for each
forest type
Land Cover Maps :Chronological
Forest Area Change :Each forest type.
Estimated Carbon stocks and carbon
stock change
REL
Field Survey results:Existing + ADDITIONAL
Emission Factors :Pilot site, for more
detailed forest types.
Land Cover Maps :Chronological
Forest Area Change :w/ More detailed forest
classification,.
Estimated Carbon stocks and carbon
stock change
REL
Area 1. Sub-National
(4 districts along the coast of KB)
Area 2. Pilot-Site
(Around TNGP)
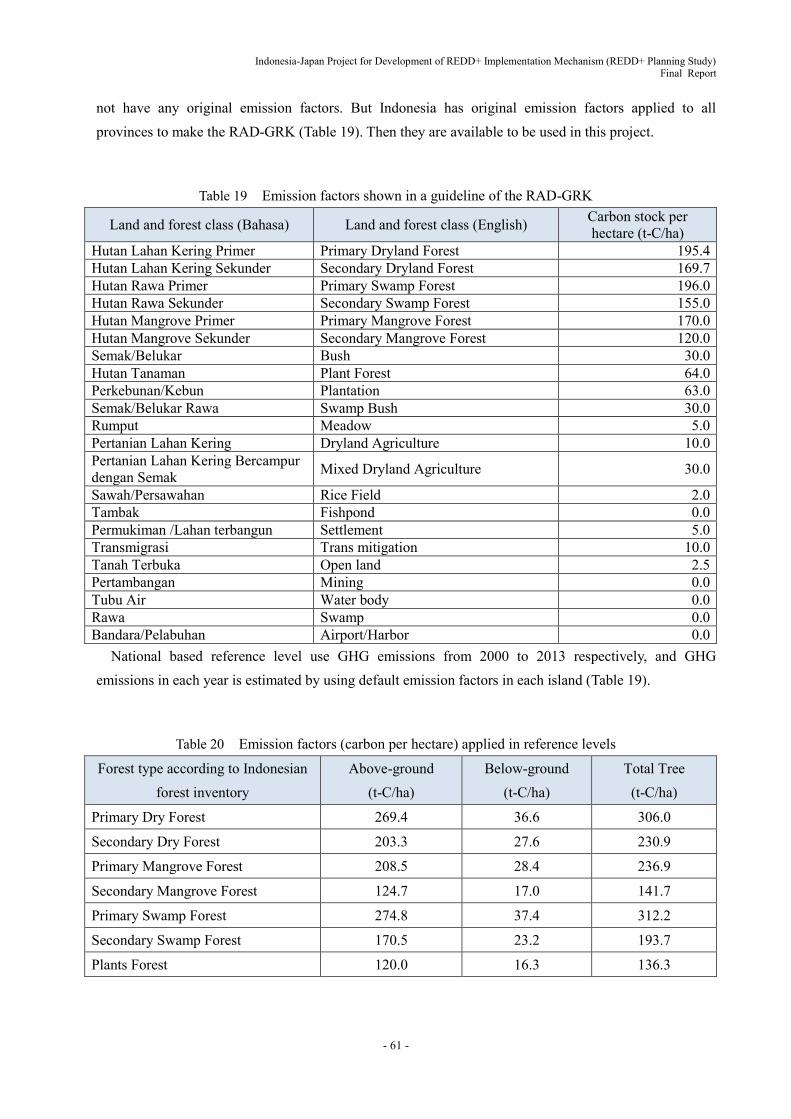
Indonesia-Japan Project for Development of REDD+ Implementation Mechanism (REDD+ Planning Study) Final Report
- 61 -
not have any original emission factors. But Indonesia has original emission factors applied to all provinces to make the RAD-GRK (Table 19). Then they are available to be used in this project.
Table 19 Emission factors shown in a guideline of the RAD-GRK
Land and forest class (Bahasa) Land and forest class (English) Carbon stock per hectare (t-C/ha)
Hutan Lahan Kering Primer Primary Dryland Forest 195.4 Hutan Lahan Kering Sekunder Secondary Dryland Forest 169.7 Hutan Rawa Primer Primary Swamp Forest 196.0 Hutan Rawa Sekunder Secondary Swamp Forest 155.0 Hutan Mangrove Primer Primary Mangrove Forest 170.0 Hutan Mangrove Sekunder Secondary Mangrove Forest 120.0 Semak/Belukar Bush 30.0 Hutan Tanaman Plant Forest 64.0 Perkebunan/Kebun Plantation 63.0 Semak/Belukar Rawa Swamp Bush 30.0 Rumput Meadow 5.0 Pertanian Lahan Kering Dryland Agriculture 10.0 Pertanian Lahan Kering Bercampur dengan Semak Mixed Dryland Agriculture 30.0
Sawah/Persawahan Rice Field 2.0 Tambak Fishpond 0.0 Permukiman /Lahan terbangun Settlement 5.0 Transmigrasi Trans mitigation 10.0 Tanah Terbuka Open land 2.5 Pertambangan Mining 0.0 Tubu Air Water body 0.0 Rawa Swamp 0.0 Bandara/Pelabuhan Airport/Harbor 0.0
National based reference level use GHG emissions from 2000 to 2013 respectively, and GHG emissions in each year is estimated by using default emission factors in each island (Table 19).
Table 20 Emission factors (carbon per hectare) applied in reference levels
Forest type according to Indonesian forest inventory
Above-ground (t-C/ha)
Below-ground (t-C/ha)
Total Tree (t-C/ha)
Primary Dry Forest 269.4 36.6 306.0
Secondary Dry Forest 203.3 27.6 230.9
Primary Mangrove Forest 208.5 28.4 236.9
Secondary Mangrove Forest 124.7 17.0 141.7
Primary Swamp Forest 274.8 37.4 312.2
Secondary Swamp Forest 170.5 23.2 193.7
Plants Forest 120.0 16.3 136.3

Indonesia-Japan Project for Development of REDD+ Implementation Mechanism (REDD+ Planning Study) Final Report
- 62 -
3.3. Prediction of trial FREL
Setting a RL requires calculation of GHG emissions in the past. For calculating GHG emissions in West Kalimantan Province, the RAD-GRK uses a stock-change/difference method, calculating GHG emissions by carbon stock estimated by land area of each forest type and existing emission factors at some time points from 2010 to 2011. Therefore this project was in accordance with this method.
In this study, reference level in each district which is tentative version and applied simple approach (i.e. using mean GHG emissions in past) also use default emission factors (Table 19) and developed reference levels are shown in Figure 37.
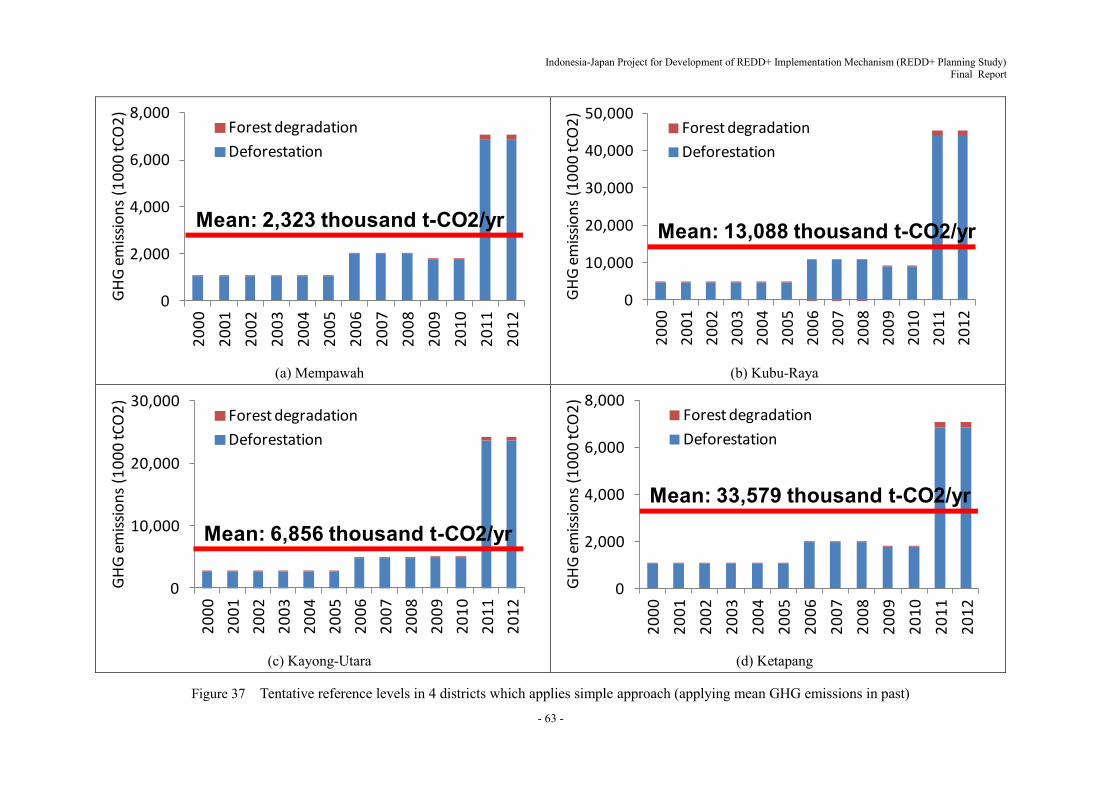
Indonesia-Japan Project for Development of REDD+ Implementation Mechanism (REDD+ Planning Study) Final Report
- 63 -
(a) Mempawah
(b) Kubu-Raya
(c) Kayong-Utara
(d) Ketapang
Figure 37 Tentative reference levels in 4 districts which applies simple approach (applying mean GHG emissions in past)
0
2,000
4,000
6,000
8,000
20
00
20
01
20
02
20
03
20
04
20
05
20
06
20
07
20
08
20
09
20
10
20
11
20
12
GH
G e
mis
sio
ns
(10
00
tCO
2)
Forest degradation
Deforestation
Mean: 2,323 thousand t-CO2/yr
0
10,000
20,000
30,000
40,000
50,000
20
00
20
01
20
02
20
03
20
04
20
05
20
06
20
07
20
08
20
09
20
10
20
11
20
12
GH
G e
mis
sio
ns
(10
00
tCO
2)
Forest degradation
Deforestation
Mean: 13,088 thousand t-CO2/yr
0
10,000
20,000
30,000
20
00
20
01
20
02
20
03
20
04
20
05
20
06
20
07
20
08
20
09
20
10
20
11
20
12
GH
G e
mis
sio
ns
(10
00
tCO
2)
Forest degradation
Deforestation
Mean: 6,856 thousand t-CO2/yr
0
2,000
4,000
6,000
8,000
20
00
20
01
20
02
20
03
20
04
20
05
20
06
20
07
20
08
20
09
20
10
20
11
20
12
GH
G e
mis
sio
ns
(10
00
tCO
2)
Forest degradation
Deforestation
Mean: 33,579 thousand t-CO2/yr

Indonesia-Japan Project for Development of REDD+ Implementation Mechanism (REDD+ Planning Study) Final Report
- 64 -
Activity 1-6 Develop a monitoring plan and implement it
1. Review for drafting Sub-national level forest ecosystem carbon monitoring plan in West Kalimantan Province
1.1. Existing methodology and previous research
Before drafting forest ecosystem carbon monitoring plan, the progress of examination and implementation of sub-national base MRV as well as previous research was reviewed in addition to review of development of international discussions.
(1) Legal basis of sub-national MRV in Indonesia
Table 21 shows the laws and regulations relating to MRV of sub-national base in Indonesia. It can be inferred that an integrated system and/or mechanism that is combined by GHG inventory administration as compulsory duty in local autonomy administration, and of forest inventory administration mainly handled by central authorities as the following legal development.
a) Forest inventory administration as the basis of forest ecosystem carbon monitoring has a system conducting monitoring more than once five year in each central, provincial and district level
b) GHG inventory including forest ecosystem carbon has a system to report through province by district once a year
c) Monitoring GHG emissions in environmental pollution and devastation control is compulsory administration of local government. While the revision of Local Administration Law in 2014 will influence development of a system that forest inventory in forestry sector is conducted by mainly central government.
Table 21 Summary of laws and regulations relating to Sub-national MRV Law &
Regulation Summary Remarks
Law No. 41/1999 on Forestry5
a) “Forestry Planning” in Forestry Administration Field (Article 10)
b) “Forest Inventory” in “Forest Planning Sub-field” (Article 12) c) Forest inventory must be classified into national, regional,
watershed and forest management unit level (Article 13)
Governmental Regulation on Forestry Planning 6 prescribes the details a) Regional level: to be implemented by the Governor and District Governor b) Frequency: more than once 5 years
Presidential Regulation No.
a) The central authorities covers planning, implementation, monitoring and evaluation of GHG reduction action plan to
Basis of planning, implementation, reporting
5 Undang-undang Republik Indonesia Nomor 41 Tahun 1999 tentang Kehutanan (30 September 1999) 6 Peraturan Pemerintah Republik Indonesia Nomor 44 Tahun 2004 tentang Perencanaan Kehutanan (18 Oktober 2004)

Indonesia-Japan Project for Development of REDD+ Implementation Mechanism (REDD+ Planning Study) Final Report
- 65 -
Law & Regulation Summary Remarks
61/ 2011 on National Action Plan for GHG Reduction of GHG(RAN-GRK)7
give standard in formulating Local GHG Reduction Action Plan by the Local Authorities (Article 3)
b) The Governor must formulate provincial level GHG reduction action plan (Article 6)
c) The Minister/ Head of Central Institution reports to The Coordinating Minister of Economy in order to report the President once a year (Article 10)
(once a year) of climate change mitigation measures nationwide
Presidential Regulation No. 71/2011 on Implementation of National GHG Inventory8
a) The Governor conducts “GHG inventory in provincial level”, “coordination of implementation of GHG inventory in District/City level” and “instruct duty to technical implementation unit covering environment field” (Article9)
b) The District Governor/Mayer conducts “implementation of GHG inventory in district/city level” (Article 10)
c) The District Governor/Mayer reports once a year “results of GHG inventory to the Governor” and the Governor reports “results of GHG inventory from district/city to Minister”(Article 12)
d) Proponent having potential GHG emissions/ removals report GHG inventory data to the Governor, District Governor/ Mayer once a year (Article 15)
System to implement and report (once a year) GHG inventory in subnational level from district level through provincial level
Ministerial Decree No. 15/ 2013 on MRV of Climate Change9
a) Climate change mitigation action conduct through MRV (Article 3).
b) The achievement of mitigation action is measured by the increase/decreases of GHG emissions in comparison with baseline emission(Article 4)
c) The responsible party of mitigation action must prepare achievement report (Article 5). MRV report must report to the Minister (Article 8).
d) Report mush be verified (Article 6). e) The Environmental Minister organizes National MRV
Committee and implement evaluation of MRV results and national registry system of mitigation actions (Article 10).
Planning of revision in DG of Climate Change Control, MoEF in 201510
Law No. 23/2014 on Local Administration11
a) Environment field is the compulsory administration in local autonomy while forestry field is the selective administration in local autonomy(Article 12)
b) Administration sensitive to ecological impact (Forestry, Oceanology, Energy and Mineral field) is shared by central and provincial government (Article 14)
c) Central administration implement directly, dis-concentration to local government, assistance administration by local government (Article 19)
d) Sharing forestry administration indicate that forest inventory administration assigned to central level (Annex B.B.1.)
The district government still has authority to Tahura (Great Forest Park), one of conservation forests.
7 Peraturan Presiden Republik Indonesia Nomr 61 Tahun 2011 tentang Rencana Aksi Nasional Penurunan Emisi Gas Rumah Kaca
(20 September 2011) 8 Peraturan Presiden Republik Indonesia Nomr 71 Tahun 2011 tentang Penyelenggaraan Inventarisasi Gas Rumah Kaca Nasional (5
Oktober 2011) 9 Peraturan Menteri Negara Lingkngan Hidup Repulik Indonesia Nomor 15 Tahun 2013 tentang Pengukuran, Pelaporan, dan
Verifikasi Aksi Mitigasi Perubahan Iklim (29 Desember 2013) 10 According to the results of interviews in Directorate of GHG Inventory and MRV, Directorate General of Climate Change
Control, MoEF on 23 Nov. 2015(Head of Sub-directorate of MRV) 11 Undang-undang Repulik Indonesia Nomor 23 Tahun 2014 tentang Pemerintahan Daerah (30 September 2014)
Indonesia-Japan Project for Development of REDD+ Implementation Mechanism (REDD+ Planning Study) Final Report
- 66 -
(2) Development of MRV methodology in Indonesia
a. Background and history
The National REDD+ Task Force (Satuan Tugas Persiapan Kelembagaan REDD+) under the Presidential Working Unit for Supervision and Management of Development (Unit Kerja Presiden bidang Pengawasan dan Pengendalian Pembangunan or UKP4) was established in 2011 and this task force has made great effort to organize Indonesian REDD+ MRV system. REDD National FREL (2015) is based on their efforts. The REDD+ Task Force worked to complete “REDD+ National Strategy”, implement “Moratorium” area, set Central Kalimantan as pilot province for REDD+ and so on. After the task force finished its mandate, the Special REDD+ Team (Tim Khusus REDD+) took over the task, and finally Indonesian REDD+ Agency was established in August, 2013.
There are two governmental movements related to REDD+. The RAN-GRK and the RAD-GRK are maintained by UKP4/REDD+ Agency and more international oriented flame work. And the SRAP (Strategi dan Rencana Aksi Provinsi, Provincial Strategy and Action plan) is the regional oriented frame work which Provincial Governments have initiative. The Provincial Government of West Kalimantan has addressed SRAP in December, 2013 and the plan describes the relationship between the RAN-GRK, the RAD-GRK and the SRAP. It is needed to coordinate and harmonize those two flame works when implementing the nation-wide MRV system in Indonesia. The national strategic plan for implementing MRV draws the role of stake-holders. The UKP4 has been integrating and standardizing geographical information as “One Map” policy. The REDD+ Agency was also combined into the merged Ministry of Environment and Forestry (MoEF)12.
West Kalimantan Province has participated in Governor’s Climate & Forests Task Force; GCF-TF which was established in 2008. Using the fund from GCF Fund established by GCF, a project for “Strengthening Indonesian Capacity for Developing National Forest Carbon Inventory, Mapping and MRV Technical Systems” mainly in East Kalimantan. This project aims at capacity building for GCF provinces to conduct forest carbon inventory, measurement, monitoring and reporting at jurisdictional scales.
b. Methodology
Following Table 22 shows the methodology relating to sub-national MRV. It can be inferred that activity data with minimum scale level at least 1:250,000 and improving emission factors toward Tier 3 will be prioritized as the following methodology development.
The land cover change maps as the basis forest ecosystem carbon monitoring satisfying at least
12 Based on the following laws and regulations.
a) Presidential Regulation No. 165/2014 on Decision of Duty and Function of “Work Cabinet” (27 Oct. 2014): Ministry of Environment and Ministry of Forestry were merged.
b) Presidential Regulation No. 16/ 2015 on Ministry of Environment and Forestry (21 Jan. 2015): Climate Change Council (DNPI) and REDD+ Agency (BP-REDD+) were combined into MoEF.
c) Environment and Forestry Ministerial Decree 2015 (P.18/KemenLHK-II/2015) on Organization and Duty Control (14 Apr. 2015): The organization of Directorate General of Climate Change Control was established.

Indonesia-Japan Project for Development of REDD+ Implementation Mechanism (REDD+ Planning Study) Final Report
- 67 -
minimum scale 1:250,000 a) To contribute to monitoring by the bottom-up approach as RAD-GRK and SIGN in a short term b) To estimation of forest carbon removal with Tier 3 according to Indonesian National Standard in
a long term c) To respond the area for improvement of National FREL in a future d) To synchronize software for simulation of land-based GHG emissions developed by
international institutions as Michigan State University and World Agroforestry Center
Table 22 Summary of Methodology relating to MRV Methodology (Published year) Prepared by Features Remarks
Forestry Ministerial Decree No. 67/2006 on Criteria and Standard of Forest Inventory (2006)13
Ministry of Forestry (MoF)
Inventory standard by level (Mapping scale, inventory items etc.)
a) Provincial level should be conducted by the Governor, while district level should be conducted by the District Governor.
b) Mapping scale of national level at least 1:500,000, provincial level is at least 1:250,000, while district level is at least 1:100,000
Land cover classification (2010)14
Indonesian National Standard Agency (SNI)
Land cover (LC)/ Land Use (LU) class
a)Classification according to FAO and
ISO19144-1(Geographical Information-Classification System)
b)Detailing classification according to mapping scale
Standard on Carbon Measurement to Support Application of REDD+ in Indonesia (2010)15
MoF Sorting international methods
Proposed methods on monitoring is limited.
Measurement and Calculation of Carbon Reserve –Field Measurement to Estimate Forest Carbon Reserve -(2011)16
SNI Sample survey method on biomass
a) Applying Tier 3 forest carbon removal monitoring
b) According to IPCC methodology c) Including peat lands
Preparation of Allometric Equation to Estimate Forest Carbon Reserve based on Field Measurement (2011)17
SNI Method of destructive survey of sample trees to estimate biomass
Based on SNI 7724 and IPCC 2003,2006
Strategy and Implementation Plan for REDD+ Measurement, Monitoring, Reporting, and
National REDD+ Task Force
Concept of REDD+MRV
Assuming feedback to central level from monitoring in sub-national level with higher accuracy
13 Peraturan Menteri Kehutanan Republik Indonesia Nomor: P.67/Menhut-II/2006 tentang Kriteria dan Standar Inventarisasi Hutan
(6 Nopember 2006) 14 Badan Standardisasi Nasional. 2010. SNI 7645:2010 Klasifikasi Penutup Lahan 15 Tim Perubahan Iklim Badan Litbang Kehutanan. Kementerian Kehutanan. 2010. Pedoman Pengukuran Karbon untuk
Mendukung Penerapan REDD+ di Indonesia. Pusat Penelitaian dan Pengembangan Perubahan Iklim dan Kebijakan. Badan Penelitian dan Pengembangan Kehutanan
16 Badan Standardisasi Nasional. 2011. SNI 7724:2011 Pengukuran dan Penghitungan Cadangan Karbon-Pengukuran Lapangan untuk Penaksiran Cadangan Karbon Hutan-
17 Badan Standardisasi Nasional. 2011. SNI 7725:2011 Pennyusunan Persamaan Alometrik untuk penaksiran cadangan karbon hutan berdasarkan pengukuran lapangan

Indonesia-Japan Project for Development of REDD+ Implementation Mechanism (REDD+ Planning Study) Final Report
- 68 -
Methodology (Published year) Prepared by Features Remarks Verification (MRV) in Indonesia (2012)18
National GHG Inventory Implementation Standard (2012)19
Ministry of Environment (MoE)
GHG emission inventory in national/ provincial, district/ city level aiming at report to UNFCCC (biannual report and national communication)
a) Basis of national GHG inventory system (SIGN)
b) Bottom-up approach from district through province
c) Recommendation to conduct inventory since 1994 if possible but at least since 2000
REDD Abacus SP(2012) World Agroforestry Center
Software to calculate BAU and scenario of land-based GHG emission
Recommendation to utilize in preparing RAD-GRK
Standard on Monitoring and Evaluation, and Reporting of Implementation of Local GHG Emission Reduction Action Plan (RAD-GRK) (2013)20
National Development and Planning Agency (Bappenas)
Standard of annual report of RAD-GRK Mainly reporting format
Implementation of Demonstration Activity of REDD+ in Indonesia (2013)21
SNI Standard to be applied for demonstration activity
a) Applicable for demonstration activity b) Recommendation of SNI and IPCC
Guideline
Technical Standard for Calculation of Land-based GHG Emission in Preparing BAU and Scenario of Mitigation Action (2013)22
Bappenas Standard to prepare REL and RL for RAD-GRK
a) 2006-2011 base period b) RL:2011-2020 c) Emission factors are average of
nationwide. This is one of area for improvement.
d) There is a plan to revise RAN-GRK in 2016. RAD-GRK will also be required to revise based on the revision of RANN-GRK23.
Calculation Method on Forest Cover Change based on Visual Interpretation of Optical Satellite Imagery (2014)24
SNI Procedure of visual interpretation of optical satellite imagery
To be applied in national level
GCF Forest Carbon Inventory Toolbox (2014)
Michigan State University-GCF Fund
Web-based software to collect, process and use data to support REDD+ MRV on line
a) Project information management toolkit
b) Plot sample design toolkit c) Geographic data management toolkit d) Forest carbon measuring toolkit
i. Plot inventory manager ii. Allometric equation library
iii. Forest carbon (Emission Factor)
18 Tim Kerja MRV Satgas REDD+. 2012. Strategi dan Rencana Implementasi Pengukuran, Pemantauan, dan Pelaporan yang
Terverfikasi (MRV) unutk REDD+ Indoneisa. Satuan Tugas Persiapan Kelembagaan REDD+ 19 KLH. 2012. Pedoman Penyelenggaraan Inventarisasi Gas Rumah Kaca Nasional (INV/KLH/290612) 20 Bappenas. 2013. Pedoman Umum & Petunjuk Teknis Pemantauan, Evaluasi dan Pelaporan Pelaksanaan RAD-GRK 21 Badan Standardisasi Nasional. 2013. SNI 7848:2013 Penyelenggaraan Demonstration Activity REDD+ 22 F. Agus, I. Santosa, S. Dewi, P. Setyanto, S. Thamrin, Y. C. Wulan, F. Suryaningrum (eds.). 2013. Petunjuk Teknis Penghitungan
Emisi Gas Rumah Kaca Sektor Berbasis Lahan Pada Skenario BAU dan Aksi Mitigasi: I. Landasan Ilmiah. Badan Perencanaan Pembangunan Nasional, Jakarta
23 Information collected at the meeting of drafting team from Ex IJREDD+ GIS Trainees held on 21-22 Dec. 2015 (A participant from Provincial Local Development and Planning Agency [Bappeda])
24 Badan Standardisasi Nasional. 2014. SNI 8033:2014 Metode Penghitungan Perubahan Tutupan Hutan berdasarkan Hasil Penafsiran Citra Penginderaan Jauh Optik secara Visual

Indonesia-Japan Project for Development of REDD+ Implementation Mechanism (REDD+ Planning Study) Final Report
- 69 -
Methodology (Published year) Prepared by Features Remarks reporting
Indonesian National Carbon Accounting System (INCAS) (2015)25
MoF
Accounting system of GHG emission and removal in land sector (including REDD+)
a) Public consultation done in Oct. 2015 b) Covering the follows (Base period
2001-2012) i. Peat fires
ii. Peat oxidation and other than carbon
iii. Other REDD+ activity (SMF, Enhancement of forest carbon stock)
REDD National FREL (2015)26 REDD+ Agency National FREL
a) Base period: 2000-2012, Only deforestation and forest degradation
b) Area for improvement i. Activity data
ii. Forest emission factors iii. Peat emission factors iv. Peat fire emission v. Covering other REDD+ activity
REDD National FREL (2015)27 MoEF National FREL
a) Base period: 1990-2012, Only deforestation and forest degradation
b) Area for improvement i. Activity data
ii. Forest emission factors iii. Peat emission factors iv. Peat fire emission v. Covering other REDD+ activity
SOP to Arrange Measurement Plot and Data Collection-Forestry Carbon Inventory- East Kalimantan (2015)28
Michigan State University-East Kalimantan Climate Change Council
Sample plot survey method for forest carbon survey
Utilizing GCF Forest Carbon Inventory Toolbox (Forest Carbon Inventory Toolbox) (2014)
In addition to REDD Abacus mentioned in the above table, a training on Lumens software (using
Q-GIS) improved from REDD Abacus were conducted in 2015.
1.2. Reviews on Sub-national Institutional arrangement for forest ecosystem carbon in West Kalimantan Province
(1) MRV strategy in West Kalimantan Provincial level
25 Krisnawati, H., Imanuddin, R., Adinugroho, W.C. and Hutabarat, S. 2015. Standard Methods for Estimating Greenhouse Gas
Emissions from the Forestry Sector in Indonesia (Version 1) Indonesian National Carbon Accounting System (INCAS) 26 BP-REDD+, 2015, National Forest Reference Emission Level for Deforestation and Forest Degradation in the Context of the
Activities Referred to in Decision 1/CP.16, Paragraph 70 (REDD+) Under the UNFCCC: A Reference for Decision Makers, Published by BP-REDD+ Indonesia
27 MoEF. 2015. National Forest Reference Emission Level for Deforestation and Forest Degradation: in the Context of Decision 1/CP.16 para 70 UNFCCC (Encourages developing country Parties to contribute to mitigation actors in the forest sector), Directorate General of Climate Change, The Ministry of Environment and Forestry, Indonesia
28 Michigan State University dan Dewan Daerah Perubabahan Iklim Kalimantan Timur. 2015. POS untuk Penyusunan Petak Ukur dan Pengumpulan Data-Inventarisasi Karbon Hutan-

Indonesia-Japan Project for Development of REDD+ Implementation Mechanism (REDD+ Planning Study) Final Report
- 70 -
The following strategies implicate the assumption that Provincial Local Development and Planning Agency (Bappeda Prov.) arrange the report on mitigation action while Provincial Local Environmental Agency (BLHD Prov.) handles monitoring and reporting on GHG. Provincial Local Environmental Agency sets developing methods and organizations of MRV as one of top priority in the short run.
Table 23 Summary on strategy relating to MRV in West Kalimantan Provincial level Strategy
(Published year)
Main in-charge
organization Summary of MRV Strategy Remarks
RAD-GRK (2012)
Provincial Local Development and Planning Agency (Bappeda)
1) A team organized by Provincial BLHD conduct setting baseline and calculation of GHG emission (once a year),
2) A team organized by Bappeda to coordinate, monitoring, reporting, evaluation of implementation of GHG reduction activity (already organized29).
3) Reporting is conducted from the each local administration unit (SKPD) to Bappeda.
Reviews and evaluation in each 3 to 5 years
Provincial REDD+ Strategy and Action Plan (SRAP REDD+) (2013)30
Provincial Environmental Agency (BLHD)
1) To develop method and organization of MRV 2) To prepare MRV method based on academic 3) To prepare technical standard and SOP of establishing
REL and MRV system 4) To develop MRV networks 5) To develop and organize Integrated Information Center
on REDD MRV, Finance and Spatial Plan (One roof, One Data、One Map)
Priority in the short run
(2) Overview of institutional arrangement for monitoring in West Kalimantan Province and the Targeted Districts
The following table shows the outline of institutional arrangement for monitoring in West Kalimantan Province and the targeted districts. There are organizations in provincial level concerned with monitoring. Such organizations have started preparation to strengthen institutional arrangement for MRV. According to the experiences of monitoring RAD-GRK, the monitoring results seem to be utilized a
little to design reduction action with additionality based on the monitoring results31.
Table 24 Summary of needs and examples of Sub-national forest ecosystem carbon monitoring in targeted
Provinces and Districts
Level Main in-charge Organization Needs for Monitoring Cases Remarks
Province Local Development
a) Monitoring and evaluation, and
a) Every year the local administration unit (SKPD) is
29 Keputusan Sekretaris Daerah Provinsi Kalimantan Barat Nomor 2/BAPPEDA/2015 tentang Pembentukan Tim Fasilitasi dan
Koordinasi Rencana Aksi Daerah Penurunan Emisi Gas Rumah Kaca 30 Tim Penyusun (Gusti Hardiansyah, Adi Yani, Fahrizal, Yosef Lego Ngo, Boy Manuputty, Arifin, Hendarto, Darmawel, Rosadi
Jamani, Zuhry Haryono, Iskandar, Idham, Ilyas, Zailani, Yuslinda, Yenny, Rifwan, Micahel Jeno, Eny Septia Sati, Sholatiana, Asnan Fauzi Irvanto). 2013. Strategi dan Rencana Aksi Provinsi REDD+ KALBAR
31 Accoring to the results of interviews in Provincial Local Development and Planning Agency [Bappeda] on 18 Nov. 2015 (Head of Division of Regional Infrastructure Planning)
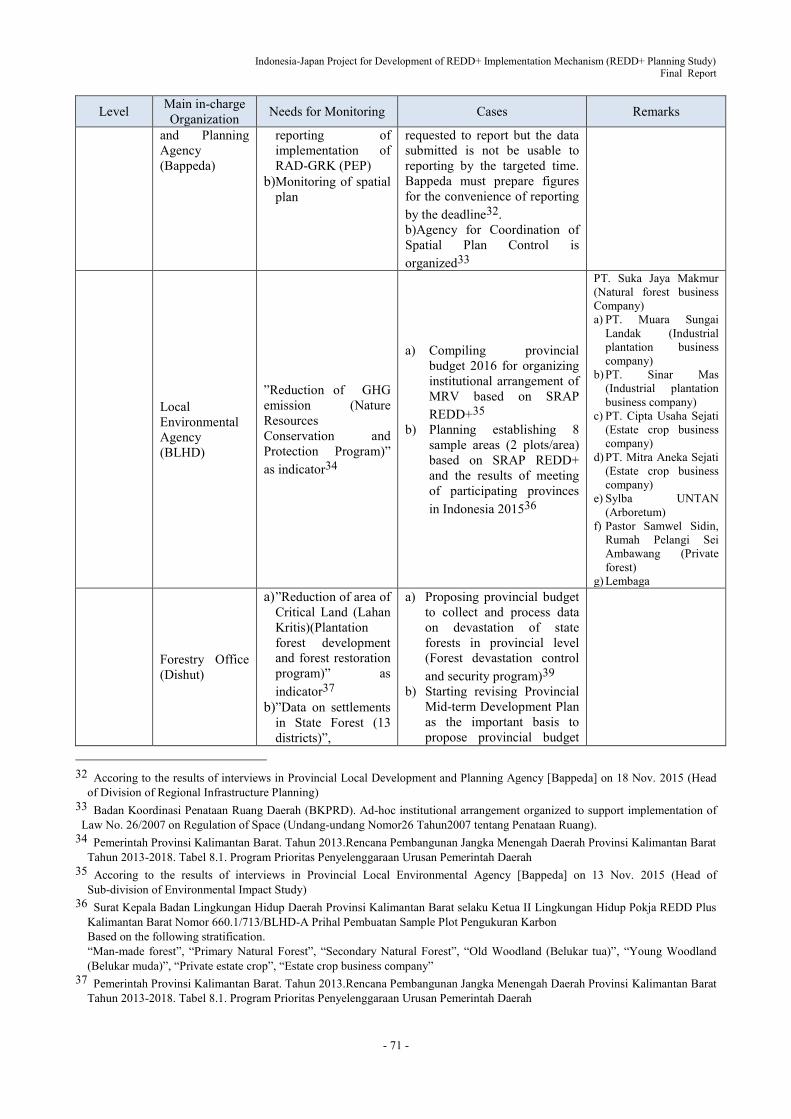
Indonesia-Japan Project for Development of REDD+ Implementation Mechanism (REDD+ Planning Study) Final Report
- 71 -
Level Main in-charge Organization Needs for Monitoring Cases Remarks
and Planning Agency (Bappeda)
reporting of implementation of RAD-GRK (PEP)
b)Monitoring of spatial plan
requested to report but the data submitted is not be usable to reporting by the targeted time. Bappeda must prepare figures for the convenience of reporting by the deadline32. b)Agency for Coordination of Spatial Plan Control is organized33
Local Environmental Agency (BLHD)
”Reduction of GHG emission (Nature Resources Conservation and Protection Program)” as indicator34
a) Compiling provincial budget 2016 for organizing institutional arrangement of MRV based on SRAP REDD+35
b) Planning establishing 8 sample areas (2 plots/area) based on SRAP REDD+ and the results of meeting of participating provinces in Indonesia 201536
PT. Suka Jaya Makmur (Natural forest business Company) a) PT. Muara Sungai
Landak (Industrial plantation business company)
b) PT. Sinar Mas (Industrial plantation business company)
c) PT. Cipta Usaha Sejati (Estate crop business company)
d) PT. Mitra Aneka Sejati (Estate crop business company)
e) Sylba UNTAN (Arboretum)
f) Pastor Samwel Sidin, Rumah Pelangi Sei Ambawang (Private forest)
g) Lembaga
Forestry Office (Dishut)
a) ”Reduction of area of Critical Land (Lahan Kritis)(Plantation forest development and forest restoration program)” as indicator37
b)”Data on settlements in State Forest (13 districts)”,
a) Proposing provincial budget to collect and process data on devastation of state forests in provincial level (Forest devastation control and security program)39
b) Starting revising Provincial Mid-term Development Plan as the important basis to propose provincial budget
32 Accoring to the results of interviews in Provincial Local Development and Planning Agency [Bappeda] on 18 Nov. 2015 (Head
of Division of Regional Infrastructure Planning) 33 Badan Koordinasi Penataan Ruang Daerah (BKPRD). Ad-hoc institutional arrangement organized to support implementation of
Law No. 26/2007 on Regulation of Space (Undang-undang Nomor26 Tahun2007 tentang Penataan Ruang). 34 Pemerintah Provinsi Kalimantan Barat. Tahun 2013.Rencana Pembangunan Jangka Menengah Daerah Provinsi Kalimantan Barat
Tahun 2013-2018. Tabel 8.1. Program Prioritas Penyelenggaraan Urusan Pemerintah Daerah 35 Accoring to the results of interviews in Provincial Local Environmental Agency [Bappeda] on 13 Nov. 2015 (Head of
Sub-division of Environmental Impact Study) 36 Surat Kepala Badan Lingkungan Hidup Daerah Provinsi Kalimantan Barat selaku Ketua II Lingkungan Hidup Pokja REDD Plus
Kalimantan Barat Nomor 660.1/713/BLHD-A Prihal Pembuatan Sample Plot Pengukuran Karbon Based on the following stratification. “Man-made forest”, “Primary Natural Forest”, “Secondary Natural Forest”, “Old Woodland (Belukar tua)”, “Young Woodland
(Belukar muda)”, “Private estate crop”, “Estate crop business company” 37 Pemerintah Provinsi Kalimantan Barat. Tahun 2013.Rencana Pembangunan Jangka Menengah Daerah Provinsi Kalimantan Barat
Tahun 2013-2018. Tabel 8.1. Program Prioritas Penyelenggaraan Urusan Pemerintah Daerah

Indonesia-Japan Project for Development of REDD+ Implementation Mechanism (REDD+ Planning Study) Final Report
- 72 -
Level Main in-charge Organization Needs for Monitoring Cases Remarks
“Arrangement of data on potential of superior forest resources (5 districts)” (Development of forestry information system, Optimizing sustainable natural forest management, Enhancement of control and strengthening of utilization of State Forests) as indicator38
for forest carbon monitoring40
c) Implementing potential surveys on superior trees in natural forests, monitoring of boundary piles of Protection Forest and profile survey on Protection Forest by Forest Inventory and Mapping Unit by provincial budget41
Districts
(Ketapang District)
Forestry Office (Dishut) -
a) Monitoring mainly Protection Forest (using satellite imagery and field surveys) by District Budget
b) Possible patrols by forest rangers (Polhut)
GIS skill holder: about 5 persons
(Kayong Utara District)
Forestry and Estate Office (Dishutbun)
-
a) Constructing post for guard of Protection Forest using national budget subsidy with designated use (DAK)
b) Compiling data on critical lands (Lahan Kritis) (in cooperation with Watershed Management Office [BPDAS], a branch of MoEF)
GIS skill holder: about 1 person
(3) Challenge to develop sub-national forest ecosystem carbon monitoring in West Kalimantan Province
The following figure is the overviews of issues and expectation to sub-national MRV based on the review results mentioned above. It is expected to be more accurate and more appropriate to local needs in comparison with national MRV.
39 Accoring to the results of interviews in Provincial Forestry Office [Dishut Prov.] on 16 Nov. 2015 (Nature Resources Protection
Division) 38 Dinas Kehutanan Provinsi Kalimantan Barat. 2013. Rencana Strategis Satuan Kerja Perangkat Daerah Dinas Kehutanan Provinsi
Kalimantan Barat Tahun 2013-2018 40 Information collected at “Workshop for Preparation of Provincial Forest and Land Monitoring Team in West Kalimantan
Province” participating from Ex IJREDD+ GIS Trainees held on 28-29 Oct. 2015 (A participant from Provincial Forestry Office [Dishut Prov.])
41 Accoring to the results of interviews in Provincial Forestry Office [Dishut Prov.] on 17 Nov. 2015 (Forest Inventory and Mapping Unit)

Indonesia-Japan Project for Development of REDD+ Implementation Mechanism (REDD+ Planning Study) Final Report
- 73 -
Figure 38 (Draft) Summary of challenging conditions to role of Sub-national MRV
(1) Stakeholder analysis
According to a stakeholder analysis on REDD+ in West Kalimantan provincial level, BLHD is inferred one of key players having interests and being influential.

Indonesia-Japan Project for Development of REDD+ Implementation Mechanism (REDD+ Planning Study) Final Report
- 74 -
Figure 39 Overviews of Main Stakeholders on REDD+ in West Kalimantan Province42
(2) Facilitation to reactivate REDD+ Working Group and establishing monitoring organization and formulating MRV plans
In order to facilitate formulating provincial forest ecosystem carbon monitoring by participatory planning of stakeholders, concept of organizing “(temporary named) provincial forest and land forest and land monitoring team” (see the figure below) as institutional arrangement of authorities concerned with monitoring and MRV was prepared.
42 Tim Peneliti (Gusti Hardiansyah, Emi Roslinda, Fahrizal, Farah Diba). 2015. Laporan Penelitian Analisis Stakeholder dalam Pelaksanaan Program REDD+ di Kalimantan Barat. IJREDD-Fakultas Kehutanan Universitas Tanjungpura-JICA
0
12.5
25
0 12.5 25
Inte
rest
Influence
Quadrant I
Subject Quadrant I
Key Player
BLHD
Yayasan Titian
PRCF Indonesia
Fahutan Untan
IJ-REDD
RAD GRK Working GroupREDD+ Working Group
APHI
BAPPEDDA Prop/KabDishut Prop/KabUPT Kementerian WWF Kalbar
USAID IFACS
Quadrant IV
CrowdQuadrant III
Context setter
BLHD
Yayasan Titian
PRCF Indonesia
Faperta UntanFahutan Untan
GIZ
RAD GRK Working GroupREDD+ Working Group
APHIPT.CUS
BAPPEDDA Prop/KabDishut Prop/KabUPT KementerianUSAID IFACS
Matrix interest and influence stakeholders in REDD + activities in West Kalimantan Province

Indonesia-Japan Project for Development of REDD+ Implementation Mechanism (REDD+ Planning Study) Final Report
- 75 -
Figure 40 (Draft) Concept of role of (temporary named) provincial forest and land monitoring team using the concept, brainstorming by visit interviews was conducted (Oct.-Nov. 2015).
a) Members of REDD+ Working Group in Provincial Local Development and Planning Agency, Local Environmental Agency, Forestry Service and Estate Crop Service
b) Branches of MoEF, Nature Resources Conservation Office (BKSDA), State Forest Consolidation
Office (BPKH) c) Ex trainees of IJREDD+ GIS training
These activities aims at activating stagnant provincial REDD+ working group43 which seems to be inactive after merger of REDD+ agency.
And workshops were also held as follows.
43 Keputusan Gubernur Kalimantan Barat Nomor 115/BLHD/2012 tentang Pembentukan Kelompok Kerja Pengurangan Emisi dari
Deforestasi dan Degradasi Hutan (Pokja REDD+) di Kalimantan Barat (18 Januari 2012)
(1) Organizing (2) Improvement measures
Reducing GHG(Presidential Decree No. 61/2011)
Inventory of GHG(Presidential Decree No. 71/2011)
Forestry(Law No. 41/1999)
Proposed Image of Strategic Strengthening of Subnational Institutional Arrangement for REDD+
National Forest Inventory (NFI)
(DG Forestry Planology [Planologi]-Environment Control, MoEF)
Reporting & Evaluation of RAN-GRK/ RAD-GRK (Bappenas)
National GHG Inventory (SIGN) (DG Climate Change Control ,MoEF)
Local Spatial Control, Planning & Coordination Agency /BKPRD
(Bappeda)Provincial Facilitation/Coordination Team of RAD-GRK <0>
Institutional Arrangement in Land-based GHG Emission Reduction (Forest & [Peat] Land Sector)
Provincial REDD+ Working Group <0>
Policy improvement etc. (e.g.. Improvement of [Implementation of] RPJMD)
Action to improve fact (e.g. mitigation action)
Improvement of strategy(e.g.. Improvement of [Implementation] SRAP)
Feedback of facts(e.g. Location of deforestation/ forest degradation; Spatial plan)
Technical Secretariat of Provincial WG (REDD+ Management Team) <2>
Provincial Forest/Land Monitoring Team (MRV Team) <1>
AGB: Above Ground BiomassBGB: Below Ground Biomass E.g.
Forest/Land Cover (AGB)
(later +Peat distribution /BGB)
Plot (PSP/TSP) (later +Observation Station of
thickness/carbon content, water table in peat etc.)
Provincial Web (GIS)
Development of Competency
Activating local HR who has remote sensing skills in provincial REDD+ WG’s member organizations
Empowering local HR who has experiences of training of the related skills (e.g. IJREDD GIS Training) di Local government institutions/branch of ministries concerned
E.g. Strategic program/ Work planning (include.
Budgeting/Executing [Subsidy /Local Budget/CSR etc.])
Socialization/ PR (e.g. RAD-GRK/ SRAP)
Registration of mitigation/REDD+ Safe Guard System (e.g. Bio-diversity, Traditional
community, Stakeholder consultation [FPIC])
Involving provincial stakeholders (e.g. GIZ/FORClime, ADB/Forest Investment Program, WWF/HoB, WALHI dsb.)
Facilitating adaptation to revision of laws and regulation (e.g. Law No. 23/2014)
Involving district level (e.g. model activities for reducing GHG emissions in district/ field level)
Provinicial REDD+ Program Implementation Working Group
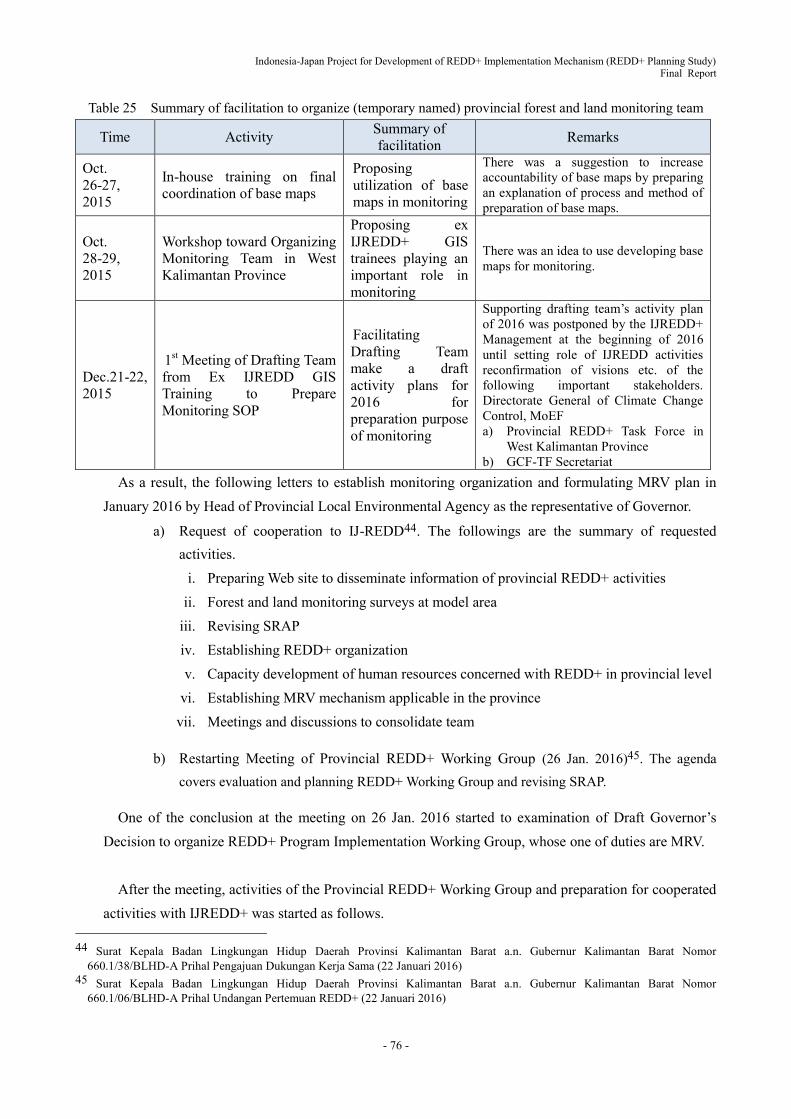
Indonesia-Japan Project for Development of REDD+ Implementation Mechanism (REDD+ Planning Study) Final Report
- 76 -
Table 25 Summary of facilitation to organize (temporary named) provincial forest and land monitoring team
Time Activity Summary of facilitation Remarks
Oct. 26-27, 2015
In-house training on final coordination of base maps
Proposing utilization of base maps in monitoring
There was a suggestion to increase accountability of base maps by preparing an explanation of process and method of preparation of base maps.
Oct. 28-29, 2015
Workshop toward Organizing Monitoring Team in West Kalimantan Province
Proposing ex IJREDD+ GIS trainees playing an important role in monitoring
There was an idea to use developing base maps for monitoring.
Dec.21-22, 2015
1st Meeting of Drafting Team from Ex IJREDD GIS Training to Prepare Monitoring SOP
Facilitating Drafting Team make a draft activity plans for 2016 for preparation purpose of monitoring
Supporting drafting team’s activity plan of 2016 was postponed by the IJREDD+ Management at the beginning of 2016 until setting role of IJREDD activities reconfirmation of visions etc. of the following important stakeholders. Directorate General of Climate Change Control, MoEF a) Provincial REDD+ Task Force in
West Kalimantan Province b) GCF-TF Secretariat
As a result, the following letters to establish monitoring organization and formulating MRV plan in January 2016 by Head of Provincial Local Environmental Agency as the representative of Governor.
a) Request of cooperation to IJ-REDD44. The followings are the summary of requested activities.
i. Preparing Web site to disseminate information of provincial REDD+ activities ii. Forest and land monitoring surveys at model area
iii. Revising SRAP iv. Establishing REDD+ organization v. Capacity development of human resources concerned with REDD+ in provincial level
vi. Establishing MRV mechanism applicable in the province vii. Meetings and discussions to consolidate team
b) Restarting Meeting of Provincial REDD+ Working Group (26 Jan. 2016)45. The agenda covers evaluation and planning REDD+ Working Group and revising SRAP.
One of the conclusion at the meeting on 26 Jan. 2016 started to examination of Draft Governor’s Decision to organize REDD+ Program Implementation Working Group, whose one of duties are MRV.
After the meeting, activities of the Provincial REDD+ Working Group and preparation for cooperated
activities with IJREDD+ was started as follows. 44 Surat Kepala Badan Lingkungan Hidup Daerah Provinsi Kalimantan Barat a.n. Gubernur Kalimantan Barat Nomor
660.1/38/BLHD-A Prihal Pengajuan Dukungan Kerja Sama (22 Januari 2016) 45 Surat Kepala Badan Lingkungan Hidup Daerah Provinsi Kalimantan Barat a.n. Gubernur Kalimantan Barat Nomor
660.1/06/BLHD-A Prihal Undangan Pertemuan REDD+ (22 Januari 2016)

Indonesia-Japan Project for Development of REDD+ Implementation Mechanism (REDD+ Planning Study) Final Report
- 77 -
a) Holding the training46 on inventory analysis related with carbon monitoring on 10 Feb. 2016 involving approximately 20 persons of human resources in provincial level mainly
from the former participants of IJ-REDD+ GIS Training47 b) Proposing Draft TOR on cooperated activities with IJREDD in March 201648
(3) (Proposed) Basic plan of annual forest carbon monitoring (forest ecosystem monitoring) by the (developing) Provincial REDD+ Program Implementation Working Group
Using the review results, the following basic structure and procedures are proposed to plan forest ecosystem carbon monitoring applicable to provincial level taking into consideration harmonization to national level.
Figure 41 (Proposed) Structure of monitoring (data collection and management system plan) by “(developing)
Provincial REDD+ Program Implementation Working Group”
46 Surat Kepala Badan Lingkungan Hidup Daerah Provinsi Kalimantan Barat a.n. Gubernur Kalimantan Barat Nomor
660.1/09/BLHD-A Prihal Undangan Pelatihan Analisis Inventarisasi (5 Februari 2016) 47 There is information that after the training, a meeting held by Provincial BLHD on 15 Feb. 2016 to prepare for Indonesia GCF
Member Province Meeting (held on 18 Feb. 2016). 48 Surat Kepala Badan Lingkungan Hidup Daerah Provinsi Kalimantan Barat Nomor 660.1/219/BLHD-A Prihal Pengajuan KAK
Proyek REDD+ (4 Maret 2016)
(Presidential Decree No. 61/2011[Reducing GHG]) (Presidential Decree No. 71/2011 [Inventory of GHG])(Law No. 41/1999 [Forestry])
Forest Inventory (Forest Planning) (DG Forestry Planology [Planologi]-Environment Control, MoEF)
Reporting & Evaluation of RAN-GRK/ RAD-GRK (Bappenas)
National GHG Inventory (SIGN) (DG Climate Change Control ,MoEF)
Local Spatial Control, Planning & Coordination Agency /BKPRD(Bappeda)
Provincial Facilitation/Coordination Team of RAD-GRK (Secretariat: Provincial Bappeda)
Institutional Arrangement in Land-based GHG Emission Reduction (Forest & [Peat] Land Sector)
Provincial REDD+ Working Group (Secretariat: Provincial BLHD)
Improvement of strategy(e.g.. Improvement of [Implementation] SRAP)
Feedback of facts(e.g. Location of deforestation/ forest degradation; Spatial plan)
Empowering local HR who has experiences of training of the related skills (e.g. IJREDD GIS Training) in
Local government institutions/branch of ministries concerned
Developing “Provincial REDD+ Program Implementation Working Group” & Related Activities (Training, Monitoring etc.)
(Proposed) Basic Structure of Subnational Monitoring(Developing Institutional Arrangement)
Bottom-up: District-Province-Central (once/year)
Each level (minimum once/ 5years)
Provincial-detailed LC Maps (updating the existing LC maps) <starting headed by Provincial Estate Service on Mempawah District using IJREDD Base maps since Jan. 2016>
Provincial planned/managed PSP/TSP
<Starting headed by Provincial BLHD since Nov. 2015>
II.Future Target: Field Level Monitoring (Safe guard/ Prevention for better SFM/Forest Protection [to Adapt Law
No. 23/2014 too)III. (mainly Protected Area/ State Forest without Actual Field Manager e.g. Protection Forest [HL] etc.)
I. Prioritized Target (Provincial BLHD): Annual Provincial Monitoring

Indonesia-Japan Project for Development of REDD+ Implementation Mechanism (REDD+ Planning Study) Final Report
- 78 -
Table 26 (Proposed) Basic points of implementation of Provincial Annual Forest Carbon Monitoring by
“Provincial REDD+ Program Implementation Working Group in West Kalimantan” Component (Draft) basic plan Remarks
Activity Data
The existing base maps49 will be corrected and improved in 5 years one cycle (approximately 1/4 area of the province per one year) as follows. a) The recent geographical information (e.g. project location maps)
possessed and/ or prepared by the land based local administration unit (SKPD) and branches of MoEF will be collected through Provincial BLHD.
b) The changed sites around a) above will be checked using the recent satellite imagery (procurable freely by the authorities).
c) The ground truth surveys will be conducted on the sites necessary according to b) above.
d) The base maps will be updated on the results above using GIS (using Q-GIS etc. which can be usable freely ). The result including recapitulation of area calculation will be shared through Provincial BLHD.
a) The USGS has established a no charge Web access archive.
b) The Indonesian Governmental Organization can procure high resolution satellite imagery as SPOT freely based on the Presidential Instruction50
c) The 5th year is to update the remaining area in the 4th year and edit the whole province.
Emission Factor
The existing sample plots will be repeatedly measured in order to calculate and update provincial average of emission factors. The result will also be shared through Provincial BLHD.
a) 8 areas set for GCF-TF as mentioned above
b) BPKH has also established Permanent Sample Plot.
GHG equivalent calculation
GHG equivalent values will be calculated and shared through Provincial BLHD.
The data will be utilized for reporting RAD-GRK by Provincial Bappeda.
(4) (Proposed) Basic method of field level forest carbon monitoring (village-based forest monitoring) by “(developing) Provincial REDD+ Program Implementation Working Group“
Because of revised laws on local administration (see “Table 13), forest management authority shifts to National and Provincial Governments. From such situation, it can be expected that only forest administration authorities are difficult to conduct monitoring up to field level. Thus the following field level monitoring mainly on Activity Data (forest degradation etc.) by collaboration with Provincial Forestry Service and village administration is can be proposed in order to supplement updating base maps and continuous surveys of sample plots mainly “(developing) Provincial REDD+ Program Implementation Working Group” and contribute social safeguard (see the figure above and below).
The developing a method of village-based monitoring by involving community will contribute to adopt “Village Head is obliged to develop nature resources potential and to protect environment” stipulated in Acticle 26 (4) Clause, “Local administration in district/ city level etc. are obliged to involve village administration in developing rural regions related with village spatial plans (RTR Desa) of “Law
on Village No. 6, 201451”. 49 The LC maps prepared as the REDD+ base maps in the course of IJREDD (Current time is 2013) are also utilizable. As far as
the information obtained from the former participants for IJREDD+ GIS Training in Feb. 2016 (the representative from the Provincial Estate Office [Disbun] etc.), the LC maps of REDD+ base maps was utilized to update LC of Mempawah District etc. And also they would like to utilized the LC maps of REDD; base maps in other districts.
50 Instruksi Presiden Republik Indonesia Nomor 6 Tahun 2012 tentang Penyediaan, Penggunaan, Pengendalian Kualitas, Pengolahan dan Distribusi Data Satelit Penginderaan Jauh Resolusi Tinggi
51 Undang-Undang Republik Indonesia Nomor 6 Tahun 2014 tentang Desa (15 Januari 2014)

Indonesia-Japan Project for Development of REDD+ Implementation Mechanism (REDD+ Planning Study) Final Report
- 79 -
a) A model, which is developing in GPNP and its Landscape pilot site (Output 2), can be applied to
facilitate daily monitoring of forest degradation (patrol and watching out etc.) by collaborative
management (see Activity2-1). b) Facilitators will be the personnel of units and forest rangers of Provincial Forestry service for
landscapes other than national parks. The target sites will be the surrounding the open access State Forest where no any actual management implementers on the ground as Protection Forests. Collaborative management with the surrounding village will be developed.
Figure 42 (Proposed) Overview of village-based forest monitoring method by “(developing) Provincial REDD+
Program Implementation Working Group”
1.3. Proposed necessary capacity building measures for implementation of Provincial Forest Ecosystem Carbon Monitoring
(1) Capacity building measures for establishing provincial annual forest carbon monitoring
The following activities are proposed as the necessary capacity building based on the discussion in 2.1 (2) above.
Table 27 (Draft) Capacity building measures for implementation of Provincial Annual Forest Carbon Monitoring
Component Targets Necessary capacity (Draft)
Building measures
Remarks
Activity Data Those who is related in implementatio
Capacity to update LU/LC using GIS based on the ground
Training a) Trainer will be one of MRV technical
stakeholders of provincial REDD+ working group
Non-hutan
Targets of monitoring by manager of State Forest (Protection Forest etc.)
(e.g. Provincial Forestry Office/ Production or Protection Forest Management Unit [KPHL or KPHP])
Jurisdictional
Protected Area (e.g. Protection Forest
1. Regular Joint Patrol by Province-Village: inside Protection Forest (around the boundary)
(Proposed) 2 Ways of Approaches for Village-based State Forest (Protection Forest etc.) Collaborative Monitoring in Field Level
(GPNP Landscape)
Forest
2. Daily Collaborative Watch-out(Watching out even at the direction of Protection
Forests ): outside of Protection Forest
Deforestation (historic/ past)
Deforestation (Prediction/ Recent or prone)
Non-forest
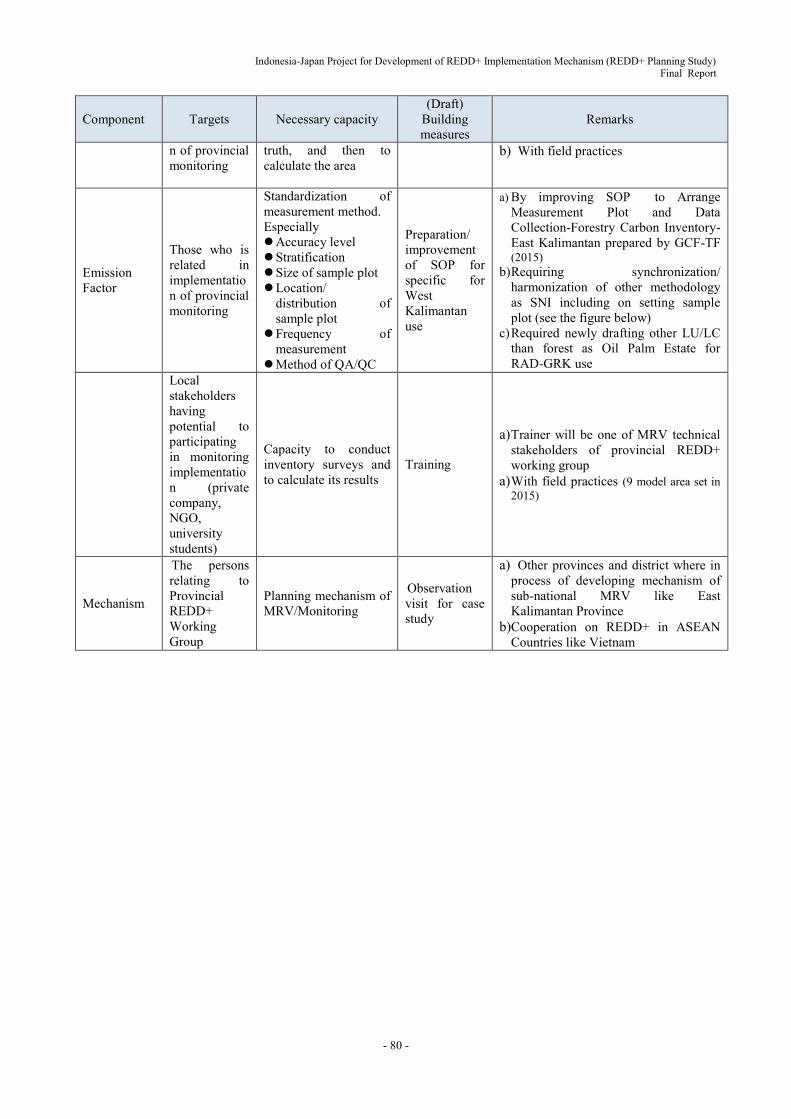
Indonesia-Japan Project for Development of REDD+ Implementation Mechanism (REDD+ Planning Study) Final Report
- 80 -
Component Targets Necessary capacity (Draft)
Building measures
Remarks
n of provincial monitoring
truth, and then to calculate the area
b) With field practices
Emission Factor
Those who is related in implementation of provincial monitoring
Standardization of measurement method. Especially Accuracy level Stratification Size of sample plot Location/
distribution of sample plot
Frequency of measurement
Method of QA/QC
Preparation/ improvement of SOP for specific for West Kalimantan use
a) By improving SOP to Arrange Measurement Plot and Data Collection-Forestry Carbon Inventory- East Kalimantan prepared by GCF-TF (2015)
b) Requiring synchronization/ harmonization of other methodology as SNI including on setting sample plot (see the figure below)
c) Required newly drafting other LU/LC than forest as Oil Palm Estate for RAD-GRK use
Local stakeholders having potential to participating in monitoring implementation (private company, NGO, university students)
Capacity to conduct inventory surveys and to calculate its results
Training
a) Trainer will be one of MRV technical stakeholders of provincial REDD+ working group
a) With field practices (9 model area set in 2015)
Mechanism
The persons relating to Provincial REDD+ Working Group
Planning mechanism of MRV/Monitoring
Observation visit for case study
a) Other provinces and district where in process of developing mechanism of sub-national MRV like East Kalimantan Province
b)Cooperation on REDD+ in ASEAN Countries like Vietnam

Indonesia-Japan Project for Development of REDD+ Implementation Mechanism (REDD+ Planning Study) Final Report
- 81 -
Figure 43 Example of needs of synchronization/harmonization of methodology
(2) Capacity building measures for provincial field level forest carbon monitoring
The following activities are proposed as the necessary capacity building based on the discussion in 2.1 (3) above.
Table 28 (Draft) Capacity building measures for implementation of provincial field level forest carbon
monitoring
Component Targets Necessary capacity (Draft) Building measures Remarks
Activity Data
Field implementers of Forest Inventory and Mapping Unit of Provincial Forestry Service; Forest rangers of provincial and
Capacity to locate the position with GPS
And report on field monitoring information
Training
a) Trainer will be one of MRV technical stakeholders of provincial REDD+ working group
b) With field practices
Example of Needs of Synchronization/ Harmonization of Methodology (Square Plot)
20 X 20m (D>=20cm)
10 X 10m (10<D<20cm)
5 X 5m (2<D<=10cm)
2X2m(D<2cm, H<=1.5m; litter; Below Ground Biomass)
SNI-7724
30 X 30m (Tree)
10 X 10m (Scrub)
1 X 1m(Litter)
GCF SOP (East Kalimantan)
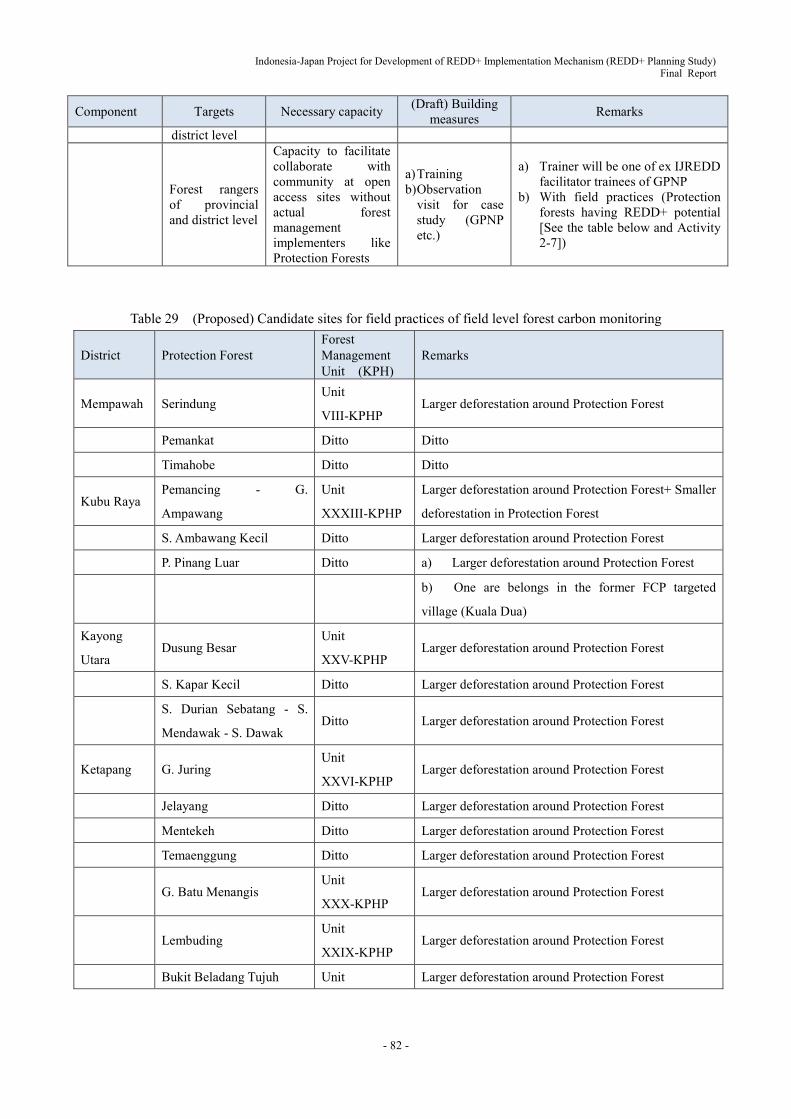
Indonesia-Japan Project for Development of REDD+ Implementation Mechanism (REDD+ Planning Study) Final Report
- 82 -
Component Targets Necessary capacity (Draft) Building measures Remarks
district level
Forest rangers of provincial and district level
Capacity to facilitate collaborate with community at open access sites without actual forest management implementers like Protection Forests
a) Training b) Observation
visit for case study (GPNP etc.)
a) Trainer will be one of ex IJREDD facilitator trainees of GPNP
b) With field practices (Protection forests having REDD+ potential [See the table below and Activity 2-7])
Table 29 (Proposed) Candidate sites for field practices of field level forest carbon monitoring
District Protection Forest Forest Management Unit (KPH)
Remarks
Mempawah Serindung Unit
VIII-KPHP Larger deforestation around Protection Forest
Pemankat Ditto Ditto
Timahobe Ditto Ditto
Kubu Raya Pemancing - G.
Ampawang
Unit
XXXIII-KPHP
Larger deforestation around Protection Forest+ Smaller
deforestation in Protection Forest
S. Ambawang Kecil Ditto Larger deforestation around Protection Forest
P. Pinang Luar Ditto a) Larger deforestation around Protection Forest
b) One are belongs in the former FCP targeted
village (Kuala Dua)
Kayong
Utara Dusung Besar
Unit
XXV-KPHP Larger deforestation around Protection Forest
S. Kapar Kecil Ditto Larger deforestation around Protection Forest
S. Durian Sebatang - S.
Mendawak - S. Dawak Ditto Larger deforestation around Protection Forest
Ketapang G. Juring Unit
XXVI-KPHP Larger deforestation around Protection Forest
Jelayang Ditto Larger deforestation around Protection Forest
Mentekeh Ditto Larger deforestation around Protection Forest
Temaenggung Ditto Larger deforestation around Protection Forest
G. Batu Menangis
Unit
XXX-KPHP Larger deforestation around Protection Forest
Lembuding
Unit
XXIX-KPHP Larger deforestation around Protection Forest
Bukit Beladang Tujuh Unit Larger deforestation around Protection Forest
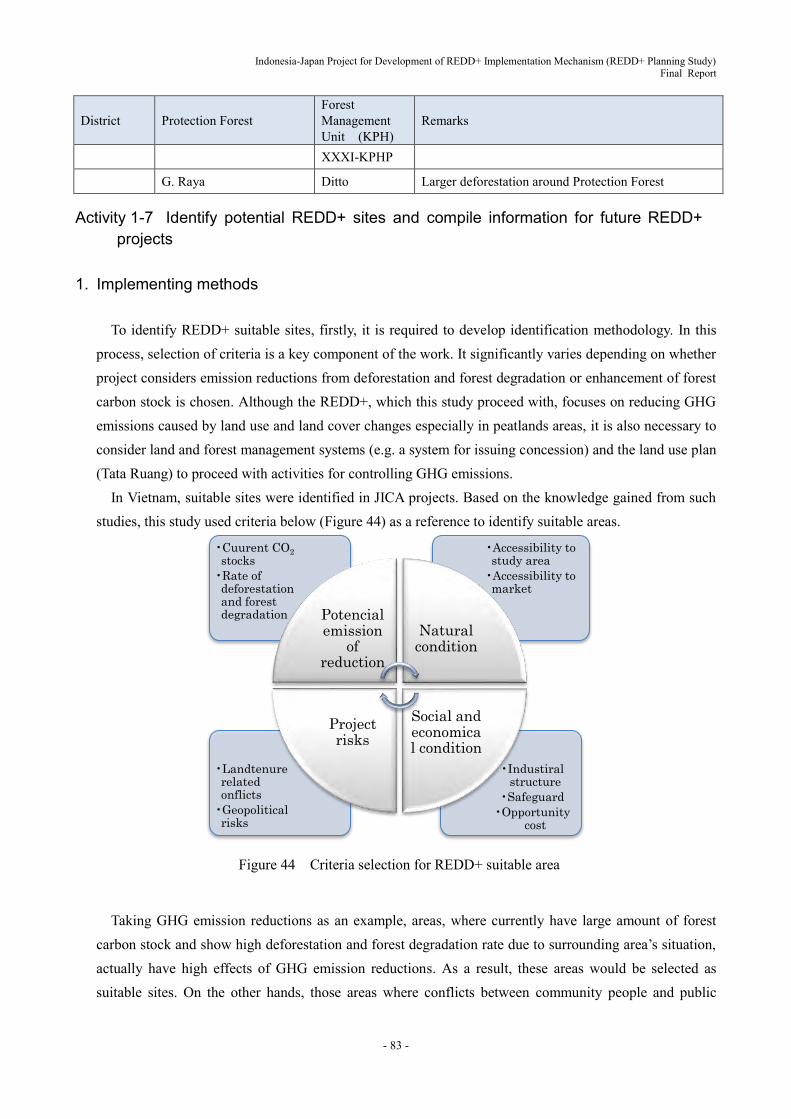
Indonesia-Japan Project for Development of REDD+ Implementation Mechanism (REDD+ Planning Study) Final Report
- 83 -
District Protection Forest Forest Management Unit (KPH)
Remarks
XXXI-KPHP
G. Raya Ditto Larger deforestation around Protection Forest
Activity 1-7 Identify potential REDD+ sites and compile information for future REDD+ projects
1. Implementing methods
To identify REDD+ suitable sites, firstly, it is required to develop identification methodology. In this process, selection of criteria is a key component of the work. It significantly varies depending on whether project considers emission reductions from deforestation and forest degradation or enhancement of forest carbon stock is chosen. Although the REDD+, which this study proceed with, focuses on reducing GHG emissions caused by land use and land cover changes especially in peatlands areas, it is also necessary to consider land and forest management systems (e.g. a system for issuing concession) and the land use plan (Tata Ruang) to proceed with activities for controlling GHG emissions.
In Vietnam, suitable sites were identified in JICA projects. Based on the knowledge gained from such studies, this study used criteria below (Figure 44) as a reference to identify suitable areas.
Figure 44 Criteria selection for REDD+ suitable area
Taking GHG emission reductions as an example, areas, where currently have large amount of forest
carbon stock and show high deforestation and forest degradation rate due to surrounding area’s situation, actually have high effects of GHG emission reductions. As a result, these areas would be selected as suitable sites. On the other hands, those areas where conflicts between community people and public
•Industiral structure
•Safeguard
•Opportunity cost
•Landtenure related onflicts
•Geopolitical risks
•Accessibility to study area
•Accessibility to market
•Cuurent CO2 stocks
•Rate of deforestation and forest degradation Potencial
emission of
reduction
Natural condition
Social and economical condition
Project risks

Indonesia-Japan Project for Development of REDD+ Implementation Mechanism (REDD+ Planning Study) Final Report
- 84 -
administration exist should be excluded from suitable sites because, in fact, it is difficult to carry out the project. Moreover, cost efficiency of project implementation is indispensable. Cost of driving force of GHG emissions and cost of countermeasure against GHG emissions should be balanced and this precondition would be a key to identify REDD+ suitable sites. Based on such criteria, preliminary attribute needs to be clarified. Under this process, it is necessary to arrange the functional classification of forest and a unit of measure for it. That is, it will be thoroughly discussed that the smallest unit should be totaled up based on which administrative unit (e.g. province, district or village level), natural condition (ecological condition), and land and forest management system (such as a system for issuing concession).
Firstly, district level base-maps are created for potential REDD+ sites (areas of which the expected effectiveness of conservation is high due to the presence of the high deforestation pressure) in the four western districts of West Kalimantan Province. The potential REDD+ sites are extracted by analyzing current status of land use and forest disturbance. Therefore, base-map is configured as a basic information maps layered changes in forest dynamics and current forest disturbance, which is delivered from satellite imagery analysis, on various special information (e.g. land use map, vegetation map, moratorium map) (Figure 45, Figure 46, Figure 47, Figure 48, Figure 49). Information to be used is concluded through discussion with such as the counterpart and partners.
Figure 45 Concept of the base-map
The base-map is configured by collecting relevant data
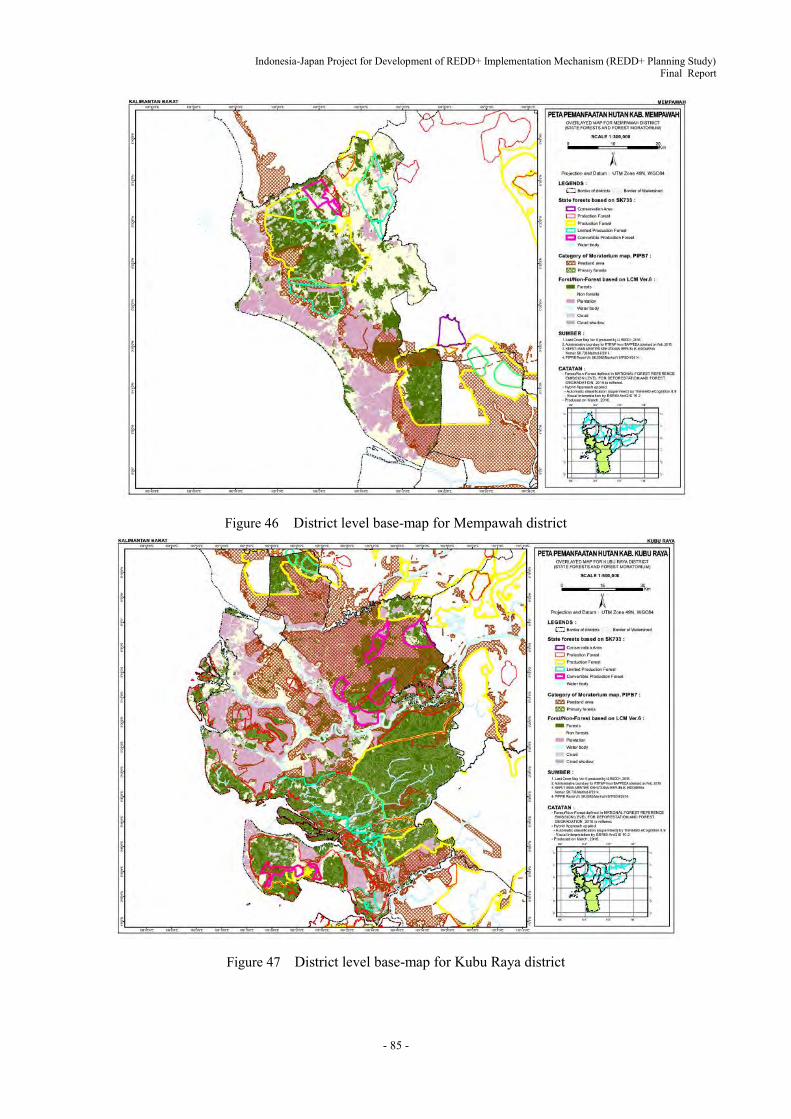
Indonesia-Japan Project for Development of REDD+ Implementation Mechanism (REDD+ Planning Study) Final Report
- 85 -
Figure 46 District level base-map for Mempawah district
Figure 47 District level base-map for Kubu Raya district
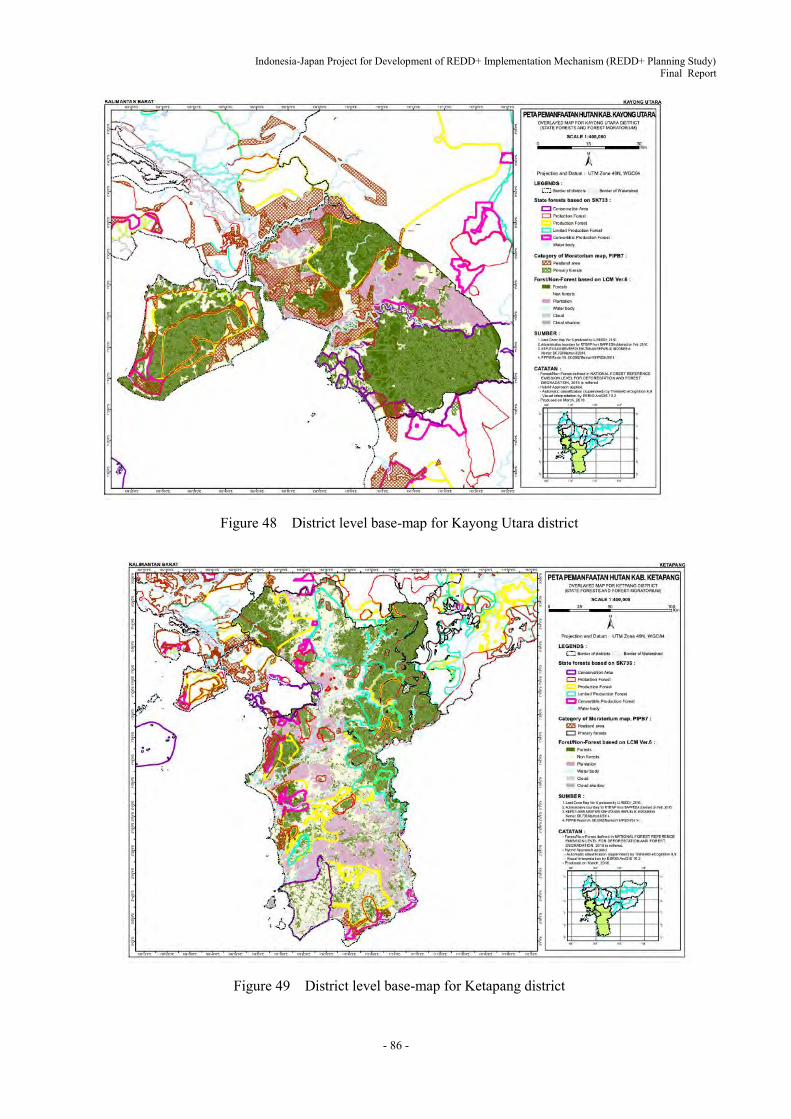
Indonesia-Japan Project for Development of REDD+ Implementation Mechanism (REDD+ Planning Study) Final Report
- 86 -
Figure 48 District level base-map for Kayong Utara district
Figure 49 District level base-map for Ketapang district
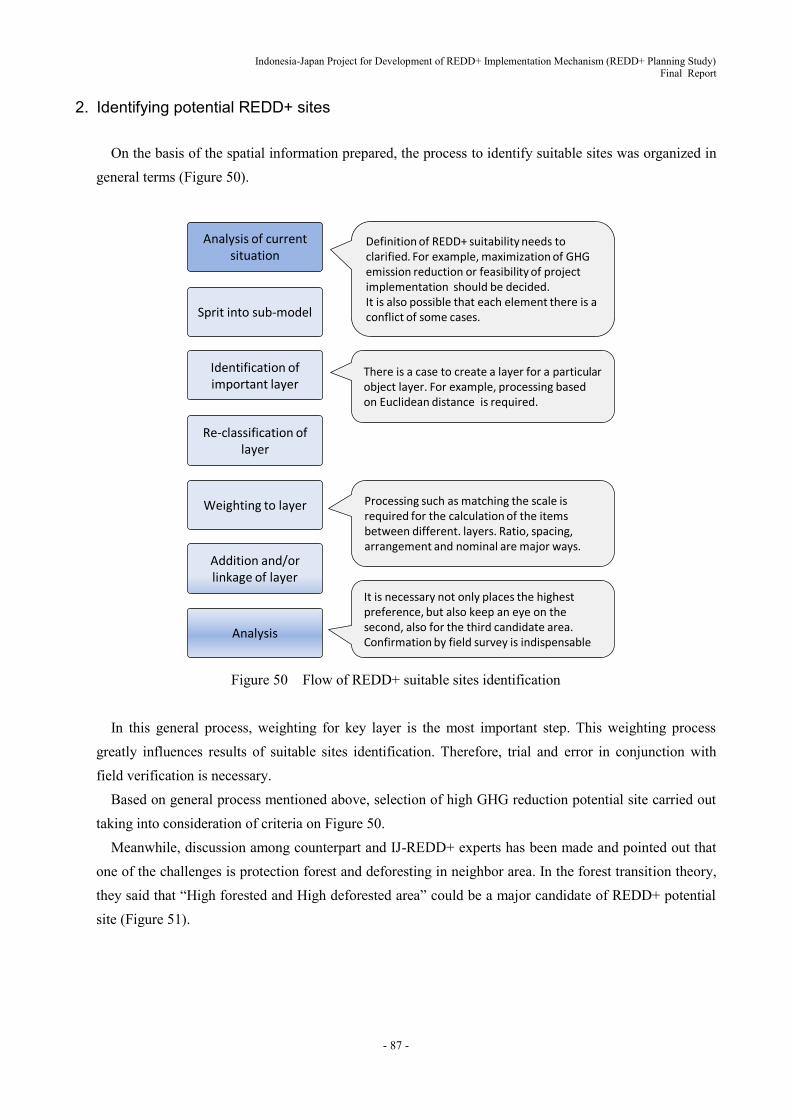
Indonesia-Japan Project for Development of REDD+ Implementation Mechanism (REDD+ Planning Study) Final Report
- 87 -
2. Identifying potential REDD+ sites
On the basis of the spatial information prepared, the process to identify suitable sites was organized in general terms (Figure 50).
Figure 50 Flow of REDD+ suitable sites identification
In this general process, weighting for key layer is the most important step. This weighting process
greatly influences results of suitable sites identification. Therefore, trial and error in conjunction with field verification is necessary.
Based on general process mentioned above, selection of high GHG reduction potential site carried out taking into consideration of criteria on Figure 50.
Meanwhile, discussion among counterpart and IJ-REDD+ experts has been made and pointed out that one of the challenges is protection forest and deforesting in neighbor area. In the forest transition theory, they said that “High forested and High deforested area” could be a major candidate of REDD+ potential site (Figure 51).
Analysis of current situation
Sprit into sub-model
Identification of important layer
Re-classification of layer
Weighting to layer
Addition and/or linkage of layer
Analysis
Definition of REDD+ suitability needs to clarified. For example, maximization of GHG emission reduction or feasibility of project implementation should be decided.It is also possible that each element there is a conflict of some cases.
There is a case to create a layer for a particular object layer. For example, processing based on Euclidean distance is required.
Processing such as matching the scale is required for the calculation of the items between different. layers. Ratio, spacing, arrangement and nominal are major ways.
It is necessary not only places the highest preference, but also keep an eye on the second, also for the third candidate area. Confirmation by field survey is indispensable

Indonesia-Japan Project for Development of REDD+ Implementation Mechanism (REDD+ Planning Study) Final Report
- 88 -
Figure 51 Selection of REDD+ potential site (in aspect of forest resources change)
Forest change from 2000~
2013Boundary of HL
Buffer generation(1.5㎞, 3km, 5km)
Data merging
Forest change in HL area
Forest change in out side of
HL
High forested in HL
High deforested out side of HL
(Potential site)
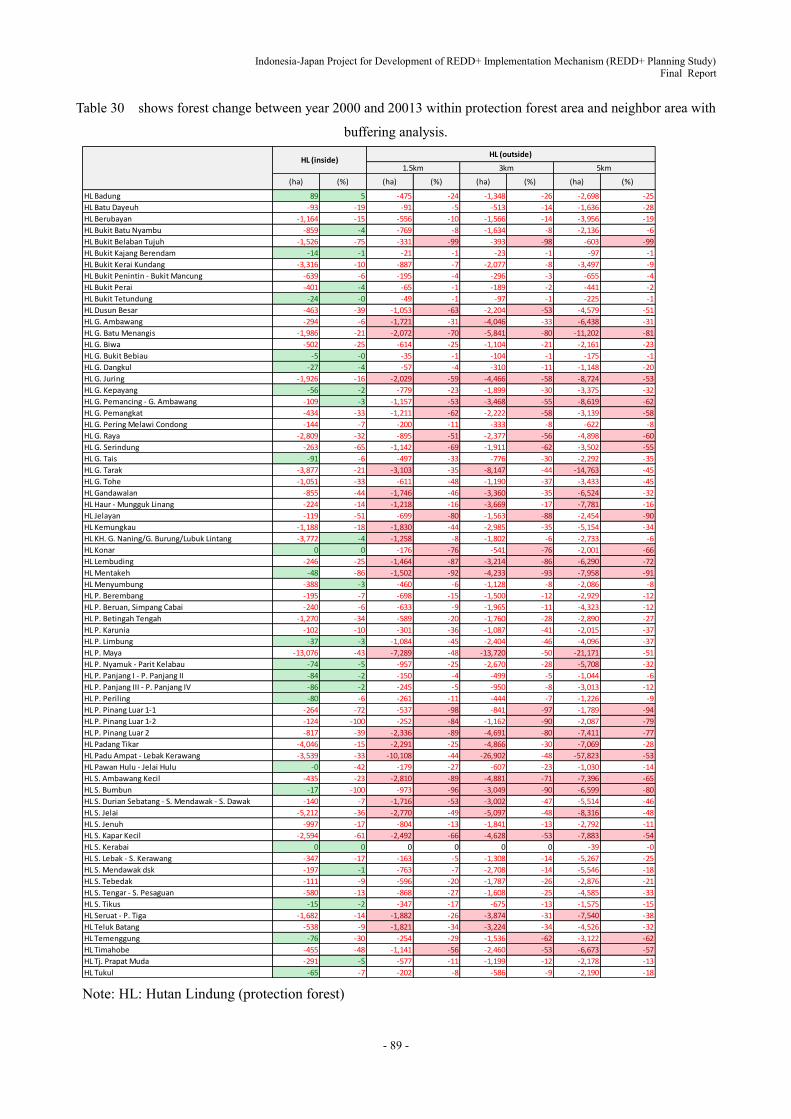
Indonesia-Japan Project for Development of REDD+ Implementation Mechanism (REDD+ Planning Study) Final Report
- 89 -
Table 30 shows forest change between year 2000 and 20013 within protection forest area and neighbor area with
buffering analysis.
Note: HL: Hutan Lindung (protection forest)
(ha) (%) (ha) (%) (ha) (%) (ha) (%)
HL Badung 89 5 -475 -24 -1,348 -26 -2,698 -25
HL Batu Dayeuh -93 -19 -91 -5 -513 -14 -1,636 -28
HL Berubayan -1,164 -15 -556 -10 -1,566 -14 -3,956 -19
HL Bukit Batu Nyambu -859 -4 -769 -8 -1,634 -8 -2,136 -6
HL Bukit Belaban Tujuh -1,526 -75 -331 -99 -393 -98 -603 -99
HL Bukit Kajang Berendam -14 -1 -21 -1 -23 -1 -97 -1
HL Bukit Kerai Kundang -3,316 -10 -887 -7 -2,077 -8 -3,497 -9
HL Bukit Penintin - Bukit Mancung -639 -6 -195 -4 -296 -3 -655 -4
HL Bukit Perai -401 -4 -65 -1 -189 -2 -441 -2
HL Bukit Tetundung -24 -0 -49 -1 -97 -1 -225 -1
HL Dusun Besar -463 -39 -1,053 -63 -2,204 -53 -4,579 -51
HL G. Ambawang -294 -6 -1,721 -31 -4,046 -33 -6,438 -31
HL G. Batu Menangis -1,986 -21 -2,072 -70 -5,841 -80 -11,202 -81
HL G. Biwa -502 -25 -614 -25 -1,104 -21 -2,161 -23
HL G. Bukit Bebiau -5 -0 -35 -1 -104 -1 -175 -1
HL G. Dangkul -27 -4 -57 -4 -310 -11 -1,148 -20
HL G. Juring -1,926 -16 -2,029 -59 -4,466 -58 -8,724 -53
HL G. Kepayang -56 -2 -779 -23 -1,899 -30 -3,375 -32
HL G. Pemancing - G. Ambawang -109 -3 -1,157 -53 -3,468 -55 -8,619 -62
HL G. Pemangkat -434 -33 -1,211 -62 -2,222 -58 -3,139 -58
HL G. Pering Melawi Condong -144 -7 -200 -11 -333 -8 -622 -8
HL G. Raya -2,809 -32 -895 -51 -2,377 -56 -4,898 -60
HL G. Serindung -263 -65 -1,142 -69 -1,911 -62 -3,502 -55
HL G. Tais -91 -6 -497 -33 -776 -30 -2,292 -35
HL G. Tarak -3,877 -21 -3,103 -35 -8,147 -44 -14,763 -45
HL G. Tohe -1,051 -33 -611 -48 -1,190 -37 -3,433 -45
HL Gandawalan -855 -44 -1,746 -46 -3,360 -35 -6,524 -32
HL Haur - Mungguk Linang -224 -14 -1,218 -16 -3,669 -17 -7,781 -16
HL Jelayan -119 -51 -699 -80 -1,563 -88 -2,454 -90
HL Kemungkau -1,188 -18 -1,830 -44 -2,985 -35 -5,154 -34
HL KH. G. Naning/G. Burung/Lubuk Lintang -3,772 -4 -1,258 -8 -1,802 -6 -2,733 -6
HL Konar 0 0 -176 -76 -541 -76 -2,001 -66
HL Lembuding -246 -25 -1,464 -87 -3,214 -86 -6,290 -72
HL Mentakeh -48 -86 -1,502 -92 -4,233 -93 -7,958 -91
HL Menyumbung -388 -3 -460 -6 -1,128 -8 -2,086 -8
HL P. Berembang -195 -7 -698 -15 -1,500 -12 -2,929 -12
HL P. Beruan, Simpang Cabai -240 -6 -633 -9 -1,965 -11 -4,323 -12
HL P. Betingah Tengah -1,270 -34 -589 -20 -1,760 -28 -2,890 -27
HL P. Karunia -102 -10 -301 -36 -1,087 -41 -2,015 -37
HL P. Limbung -37 -3 -1,084 -45 -2,404 -46 -4,096 -37
HL P. Maya -13,076 -43 -7,289 -48 -13,720 -50 -21,171 -51
HL P. Nyamuk - Parit Kelabau -74 -5 -957 -25 -2,670 -28 -5,708 -32
HL P. Panjang I - P. Panjang II -84 -2 -150 -4 -499 -5 -1,044 -6
HL P. Panjang III - P. Panjang IV -86 -2 -245 -5 -950 -8 -3,013 -12
HL P. Periling -80 -6 -261 -11 -444 -7 -1,226 -9
HL P. Pinang Luar 1-1 -264 -72 -537 -98 -841 -97 -1,789 -94
HL P. Pinang Luar 1-2 -124 -100 -252 -84 -1,162 -90 -2,087 -79
HL P. Pinang Luar 2 -817 -39 -2,336 -89 -4,691 -80 -7,411 -77
HL Padang Tikar -4,046 -15 -2,291 -25 -4,866 -30 -7,069 -28
HL Padu Ampat - Lebak Kerawang -3,539 -33 -10,108 -44 -26,902 -48 -57,823 -53
HL Pawan Hulu - Jelai Hulu -0 -42 -179 -27 -607 -23 -1,030 -14
HL S. Ambawang Kecil -435 -23 -2,810 -89 -4,881 -71 -7,396 -65
HL S. Bumbun -17 -100 -973 -96 -3,049 -90 -6,599 -80
HL S. Durian Sebatang - S. Mendawak - S. Dawak -140 -7 -1,716 -53 -3,002 -47 -5,514 -46
HL S. Jelai -5,212 -36 -2,770 -49 -5,097 -48 -8,316 -48
HL S. Jenuh -997 -17 -804 -13 -1,841 -13 -2,792 -11
HL S. Kapar Kecil -2,594 -61 -2,492 -66 -4,628 -53 -7,883 -54
HL S. Kerabai 0 0 0 0 0 0 -39 -0
HL S. Lebak - S. Kerawang -347 -17 -163 -5 -1,308 -14 -5,267 -25
HL S. Mendawak dsk -197 -1 -763 -7 -2,708 -14 -5,546 -18
HL S. Tebedak -111 -9 -596 -20 -1,787 -26 -2,876 -21
HL S. Tengar - S. Pesaguan -580 -13 -868 -27 -1,608 -25 -4,585 -33
HL S. Tikus -15 -2 -347 -17 -675 -13 -1,575 -15
HL Seruat - P. Tiga -1,682 -14 -1,882 -26 -3,874 -31 -7,540 -38
HL Teluk Batang -538 -9 -1,821 -34 -3,224 -34 -4,526 -32
HL Temenggung -76 -30 -254 -29 -1,536 -62 -3,122 -62
HL Timahobe -455 -48 -1,141 -56 -2,460 -53 -6,673 -57
HL Tj. Prapat Muda -291 -5 -577 -11 -1,199 -12 -2,178 -13
HL Tukul -65 -7 -202 -8 -586 -9 -2,190 -18
1.5km
HL (outside)
3km 5kmHL (inside)

Indonesia-Japan Project for Development of REDD+ Implementation Mechanism (REDD+ Planning Study) Final Report
- 90 -
Green colored cell indicate “low deforestation in protection forest” and red colored cell indicate “high
deforestation in neighboring area”. To sum up, colored cell shall be candidate of REDD+ potential site. Figure 52 is mapping of potential site selection result.
Figure 52 Forest change from 2000 to 2013 on HL and neighboring area.
Indonesia-Japan Project for Development of REDD+ Implementation Mechanism (REDD+ Planning Study) Final Report
- 91 -
Red color shows top 20 of high remaining forest within protection area and gray color shows the others. About neighbor area of protection forest, orange color shows top 20 of high deforestation area and gray color shows the others. As a result, protection forest with green color and/or neighbor are with orange color could be high potential site of REDD+ implementation. Above mentioned methodology and process of REDD+ potential site selection was carried out only focus on forest resource dynamics. To take shape of potential site and more practical, socio economic condition also shall be taking into account in selection process.
Activity 1-8 Identify areas of strategic cooperation other than RL/REL and carbon monitoring.
(Not addressed by REDD+ planning study team)
Activity 1-9 Provide policy and technical assistance for the execution of strategic cooperation.
(Not addressed by REDD+ planning study team)