Indonesia Cotton and Products Annual Indonesia Cotton … GAIN Publications/Cotton and...Increases...
12
THIS REPORT CONTAINS ASSESSMENTS OF COMMODITY AND TRADE ISSUES MADE BY USDA STAFF AND NOT NECESSARILY STATEMENTS OF OFFICIAL U.S. GOVERNMENT POLICY Date: GAIN Report Number: Approved By: Prepared By: Report Highlights: Indonesian importers report that anticipated increases in fossil fuel prices will drive down synthetic fiber demand, pushing up Indonesia’s expected cotton imports in MY 2016/17. Indonesian cotton production remains nominal at an estimated 5,000 bales. The Indonesian government is contemplating new programs to incentivize textile manufacturing in Indonesia. Thom Wright, Sugiarti Meylinah Ali Abdi Indonesia Cotton and Products Annual Report 2017 Cotton and Products Annual Indonesia ID1706 3/31/2017 Required Report - public distribution
Transcript of Indonesia Cotton and Products Annual Indonesia Cotton … GAIN Publications/Cotton and...Increases...
THIS REPORT CONTAINS ASSESSMENTS OF COMMODITY AND TRADE ISSUES MADE BY
USDA STAFF AND NOT NECESSARILY STATEMENTS OF OFFICIAL U.S. GOVERNMENT
POLICY
Date:
GAIN Report Number:
Approved By:
Prepared By:
Report Highlights:
Indonesian importers report that anticipated increases in fossil fuel prices will drive down synthetic
fiber demand, pushing up Indonesia’s expected cotton imports in MY 2016/17. Indonesian cotton
production remains nominal at an estimated 5,000 bales. The Indonesian government is contemplating
new programs to incentivize textile manufacturing in Indonesia.
Thom Wright, Sugiarti Meylinah
Ali Abdi
Indonesia Cotton and Products Annual Report 2017
Cotton and Products Annual
Indonesia
ID1706
3/31/2017
Required Report - public distribution

I. Situation and Outlook
Executive Summary
Post estimates that Indonesian cotton imports are expected to reach 3.05 bales in MY 2016/17 and 3.1
bales in MY 2017/18. Increases are expected based on importer’s anticipation of rising fossil fuel prices,
which will drive down demand for synthetic fabrics. Despite expected increases of Indonesian cotton
imports, Indonesian textile and textile product exports are declining as international demand softens.
The Indonesian Textile Association (API, Asosiasi Pertekstilan Indonesia) reported that the value of
Indonesian textiles and product exports to the United States declined 3.7 percent from $3.98 billion (Jan
- Sept 2015) to $3.84 billion (Jan-Sept 2016). Indonesia’s major export destinations for textiles are the
United States (32.1 percent market share), the European Union (14.6 percent), and Japan (9.8 percent).
Indonesian demand for locally made textiles is also declining due to competition from low cost imports
and weakening consumer purchasing power, attributable to the weak rupiah. (The Indonesian rupiah
continues to fluctuate, ranging from Rp. 13,084/$1 on November 9, 2016 to Rp. 13,360/$1 on February
23, 2017).
Production
Indonesian cotton production is very low, as farmers continue to face better incentives to grow alternates
such as rice or corn. The few Indonesian farmers that do grow cotton have limited access to high
yielding varieties and cultivation practices. Increased land conversion to nonagricultural uses also
reduces the area dedicated to cotton. The Directorate General for Estate Crops of the Indonesian
Ministry of Agriculture (DGEC, MOA) reported that in MY 2015/16, most cotton was grown on
marginal lands, mostly in South Sulawesi. Farmers in Central Java no longer grow cotton. Based on the
DGEC report, Post estimates that Indonesian cotton production will remain stagnant at 5,000 bales in
MY 2016/17. MY 2017/18 Indonesia’s cotton production is forecast to decline to 3,000 bales, as Post
expects farmers will continue to convert cotton production to corn and other crops. The volume of
domestic cotton production contributes to less than 0.25 percent of Indonesia’s total cotton demand.
Consumption
MY 2016/17 USDA’s Indonesian cotton consumption estimate is increased to 3.05 million bales from
the previous MY 2015/16 of 3.0 million bales. MY 2017/18 Indonesian cotton consumption is forecast
to reach 3.1 million bales. Increasing cotton consumption is based on industry expectations of increasing
fossil fuel prices, thus driving down synthetic fiber demand. The Government of Indonesia has also
announced its intentions to implement programs which will discourage textile imports as well as provide
producer incentives.
Indonesia’s Ministry of Industry (MOI) reported that the Indonesian fabric subsector ran at 50 percent
capacity in 2015, compared to 58.76 percent in 2014. Additionally, the Indonesia Statistics Agency
(BPS, Badan Pusat Statistik) reported that imports of woven fabrics, knitted fabrics, twine, and synthetic
fibers during the period of January to August 2016 increased by 34.39 percent, 2.99 percent, 11.81
percent, and 13.62 percent respectively, compared to the same period of 2015. In response to falling
fabric production and growing fabric imports, the GOI is considering measures to restrict imports of
yarn and fabrics into Indonesia by limiting imports to “producer-importers,” with the stipulation that

producer-importers may only use imported yarn and fabrics for further production. MOI will also
require pre-shipment inspections in the loading country, impose an anti-dumping duty, and enforce the
Indonesian National Standard (SNI) on imported yarn and fabrics. Additionally, in order to improve
Indonesian textile and textile products competitiveness, MOI will provide a flat electricity tariff to
textile manufacturers during the peak hours of 11:00 PM to 8:00 AM and expand textile manufacturer’s
operational hours from 40 hours per week to 48 hours per week. MOI has targeted implementation of
these regulation changes for 2017.
Indonesia’s textile industry, as of 2015, can be broken down as follows: cotton fiber production (0.58
percent), spinning (5.37 percent), weaving and knitting (27.58 percent), garments (52.77 percent), and
other textiles (13.71 percent). Industry sources report that Indonesian spun yarn and sewing thread
spinners consumed a total of 1.842 million metric tons of fiber as raw material in 2016. This consists of
cotton (34.9 percent), man-made fiber (65.1 percent), and others (0.1 %). In CY2015 Indonesia
exported approximately 45 percent of its yarn production. The spinning sector is slowly expanding,
having grown from 286 companies in CY 2014 to 288 companies in CY 2015. In CY 2016, Indonesian
spinning mills ran at 79 percent capacity, with a total of 12.10 million spindles, an increase from total
installed capacity of 11.92 million spindles and 65.38 percent running capacity in 2015.
Trade
Falling international demand has reduced Indonesian textile exports. The Indonesian Textile Association
(API, Asosiasi Pertekstilan Indonesia) reported that Indonesian textile and clothing exports to the United
States, European Union, and Japan declined by 3.7 percent, 2.2 percent, and 10.2 percent, respectively,
during the period of January to September 2016 compared to the same period of 2015. Mills have thus
faced an over-supply of finished fabrics since the middle of 2015.
Despite low demand for Indonesian textile and textile products, some Indonesian mills are switching
from synthetic fibers to cotton as crude oil prices increase. Growing cotton production in exporting
countries may offset the trend of increasing cotton prices supporting increasing cotton consumption.
Given the anticipated switch from synthetics to cotton, post expects MY 2016/17 cotton imports to reach
3.05 million bales, up from the previous MY 2015/16 of 2.941 million bales. MY 2017/18 Indonesian
cotton imports are forecast to slightly increase to 3.1 million bales due to the same reason.
Brazil has overtaken the US as lead supplier to Indonesia during the second half of 2016. Importers note
that Brazil edged the US out due to its shorter lead times and more consistent product. Brazil’s market
share in the second half of 2016 was 32.03 percent, compared to the United States (31.01), Australia
(16.24), and Argentina (5.06). Indonesia’s primary yarn export destinations in CY 2016 were China (70
percent), Japan (14 percent), and South Korea (7 percent).
Stocks
Indonesian spinners rely heavily on imported cotton. Operational practices require cotton spinners to
maintain two months of stocks on hand plus one month of on the way stocks in order to maintain
uninterrupted production. (This contrasts with manmade fiber spinners who typically hold two weeks of
stocks on hand plus one week of on the way stocks). Spinners report an advantage from importing cotton
from suppliers with shorter shipping times. As a result, compared with South American, Australian and
African shipping times, US exports to Indonesia remain at a disadvantage.
Rising storage costs prevent Indonesian spinners from maintaining large inventories. As a result,
spinners prefer to source raw materials on an as-needed basis. Therefore, Post estimates MY 2016/17
Indonesian ending stocks to remain on par with that of the previous MY2015/16 of 528,000 bales.
Stock is forecast to slightly decline to 526,000 bales in MY2017/18 in line with expectation of further
increase of cotton consumption.
Marketing
Large and export-oriented manufacturers with stronger cash flows are expanding their capacity through
the procurement and installment of new machinery. Unlike smaller mills using 20 year old technology,
these larger mills are using newer and more efficient cotton spinning technology.
Indonesian importers have access to commercial credit for the financing of imports. In the past, GSM
102 was competitive compared to local creditors. However, under current terms, importers have little
interest in the program.
II. Statistical Tables
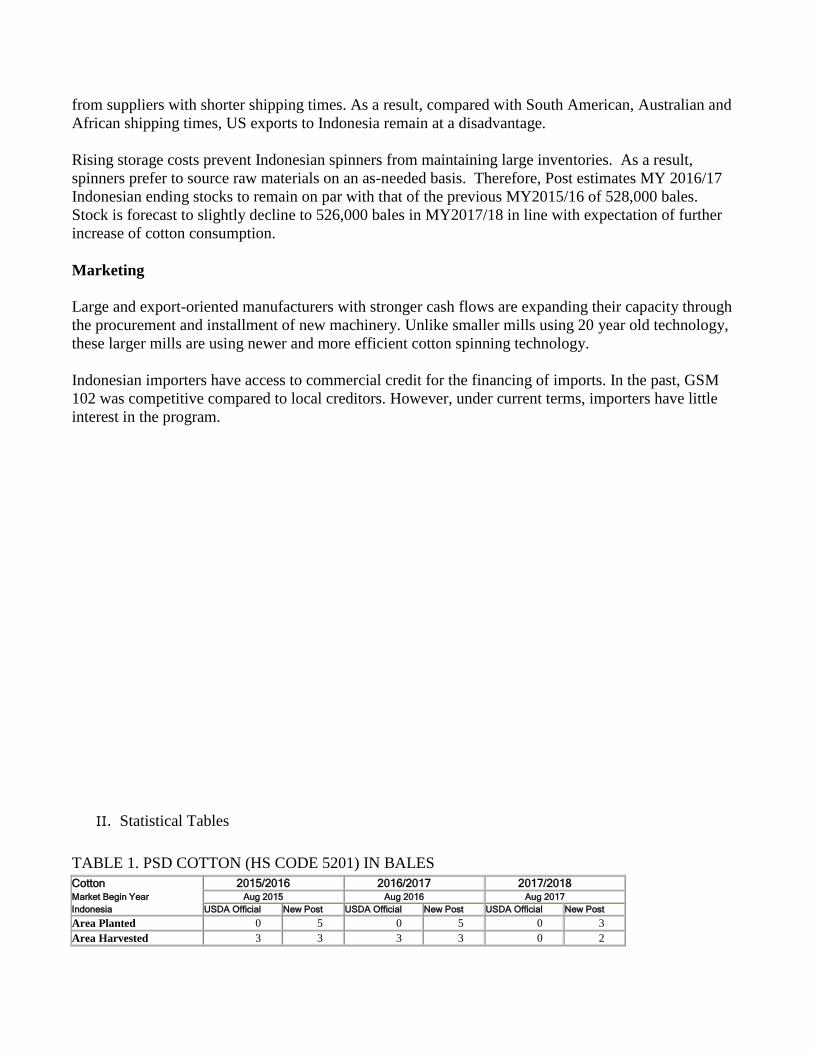
TABLE 1. PSD COTTON (HS CODE 5201) IN BALES
Cotton 2015/2016 2016/2017 2017/2018 Market Begin Year Aug 2015 Aug 2016 Aug 2017
Indonesia USDA Official New Post USDA Official New Post USDA Official New Post
Area Planted 0 5 0 5 0 3
Area Harvested 3 3 3 3 0 2
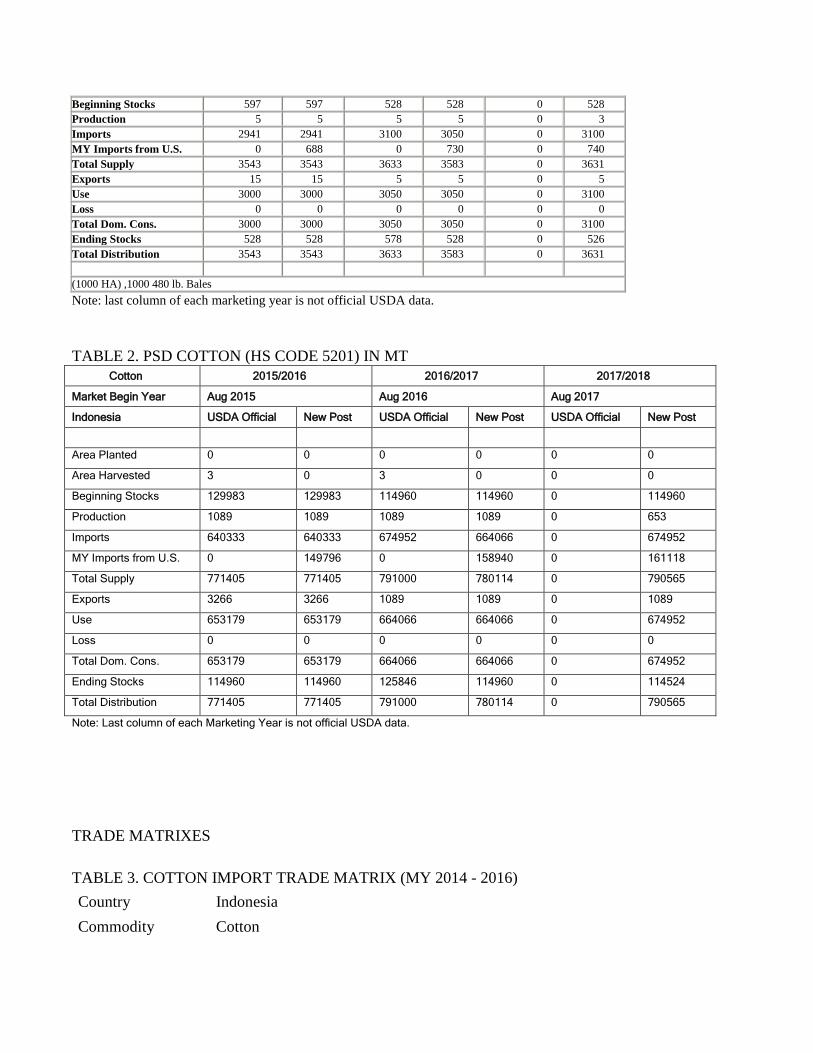
Beginning Stocks 597 597 528 528 0 528
Production 5 5 5 5 0 3
Imports 2941 2941 3100 3050 0 3100
MY Imports from U.S. 0 688 0 730 0 740
Total Supply 3543 3543 3633 3583 0 3631
Exports 15 15 5 5 0 5
Use 3000 3000 3050 3050 0 3100
Loss 0 0 0 0 0 0
Total Dom. Cons. 3000 3000 3050 3050 0 3100
Ending Stocks 528 528 578 528 0 526
Total Distribution 3543 3543 3633 3583 0 3631
(1000 HA) ,1000 480 lb. Bales
Note: last column of each marketing year is not official USDA data.
TABLE 2. PSD COTTON (HS CODE 5201) IN MT
Cotton 2015/2016 2016/2017 2017/2018
Market Begin Year Aug 2015 Aug 2016 Aug 2017
Indonesia USDA Official New Post USDA Official New Post USDA Official New Post
Area Planted 0 0 0 0 0 0
Area Harvested 3 0 3 0 0 0
Beginning Stocks 129983 129983 114960 114960 0 114960
Production 1089 1089 1089 1089 0 653
Imports 640333 640333 674952 664066 0 674952
MY Imports from U.S. 0 149796 0 158940 0 161118
Total Supply 771405 771405 791000 780114 0 790565
Exports 3266 3266 1089 1089 0 1089
Use 653179 653179 664066 664066 0 674952
Loss 0 0 0 0 0 0
Total Dom. Cons. 653179 653179 664066 664066 0 674952
Ending Stocks 114960 114960 125846 114960 0 114524
Total Distribution 771405 771405 791000 780114 0 790565
Note: Last column of each Marketing Year is not official USDA data.
TRADE MATRIXES
TABLE 3. COTTON IMPORT TRADE MATRIX (MY 2014 - 2016)
Country Indonesia
Commodity Cotton
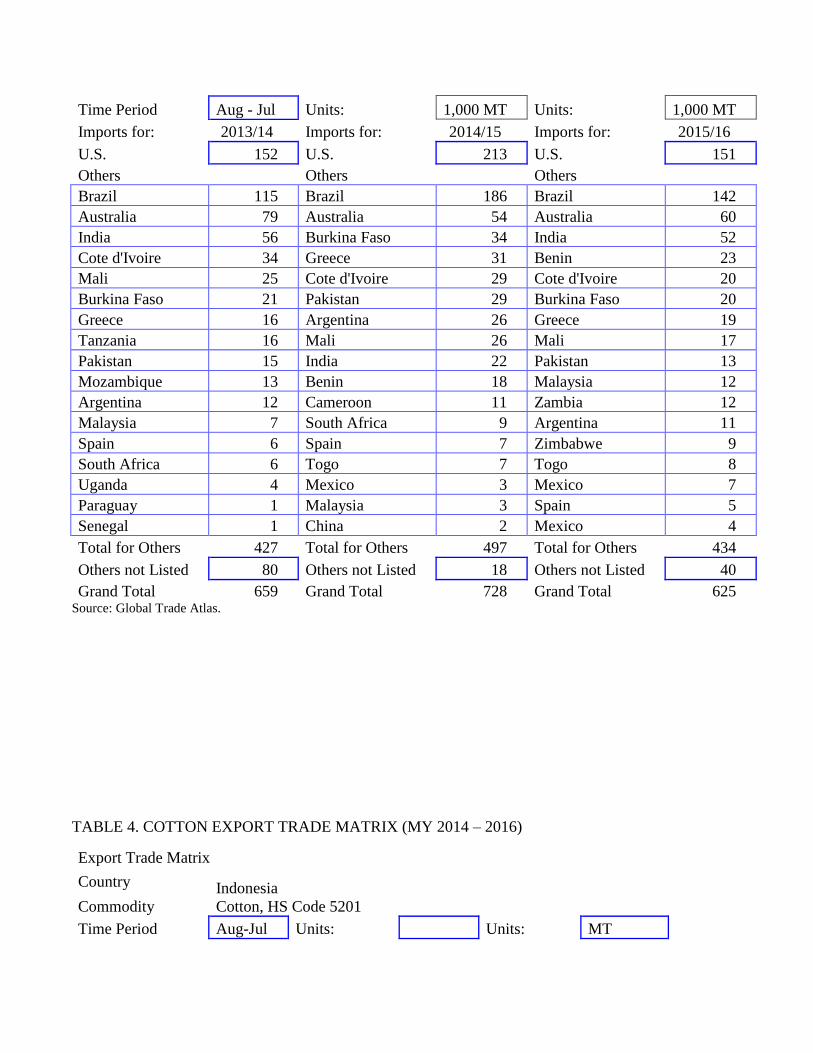
Time Period Aug - Jul Units: 1,000 MT Units: 1,000 MT
Imports for: 2013/14 Imports for: 2014/15 Imports for: 2015/16
U.S. 152 U.S. 213 U.S. 151
Others
Others
Others
Brazil 115 Brazil 186 Brazil 142
Australia 79 Australia 54 Australia 60
India 56 Burkina Faso 34 India 52
Cote d'Ivoire 34 Greece 31 Benin 23
Mali 25 Cote d'Ivoire 29 Cote d'Ivoire 20
Burkina Faso 21 Pakistan 29 Burkina Faso 20
Greece 16 Argentina 26 Greece 19
Tanzania 16 Mali 26 Mali 17
Pakistan 15 India 22 Pakistan 13
Mozambique 13 Benin 18 Malaysia 12
Argentina 12 Cameroon 11 Zambia 12
Malaysia 7 South Africa 9 Argentina 11
Spain 6 Spain 7 Zimbabwe 9
South Africa 6 Togo 7 Togo 8
Uganda 4 Mexico 3 Mexico 7
Paraguay 1 Malaysia 3 Spain 5
Senegal 1 China 2 Mexico 4
Total for Others 427 Total for Others 497 Total for Others 434
Others not Listed 80 Others not Listed 18 Others not Listed 40
Grand Total 659 Grand Total 728 Grand Total 625 Source: Global Trade Atlas.
TABLE 4. COTTON EXPORT TRADE MATRIX (MY 2014 – 2016)
Export Trade Matrix
Country Indonesia
Cotton, HS Code 5201
Commodity
Time Period Aug-Jul Units: Units: MT
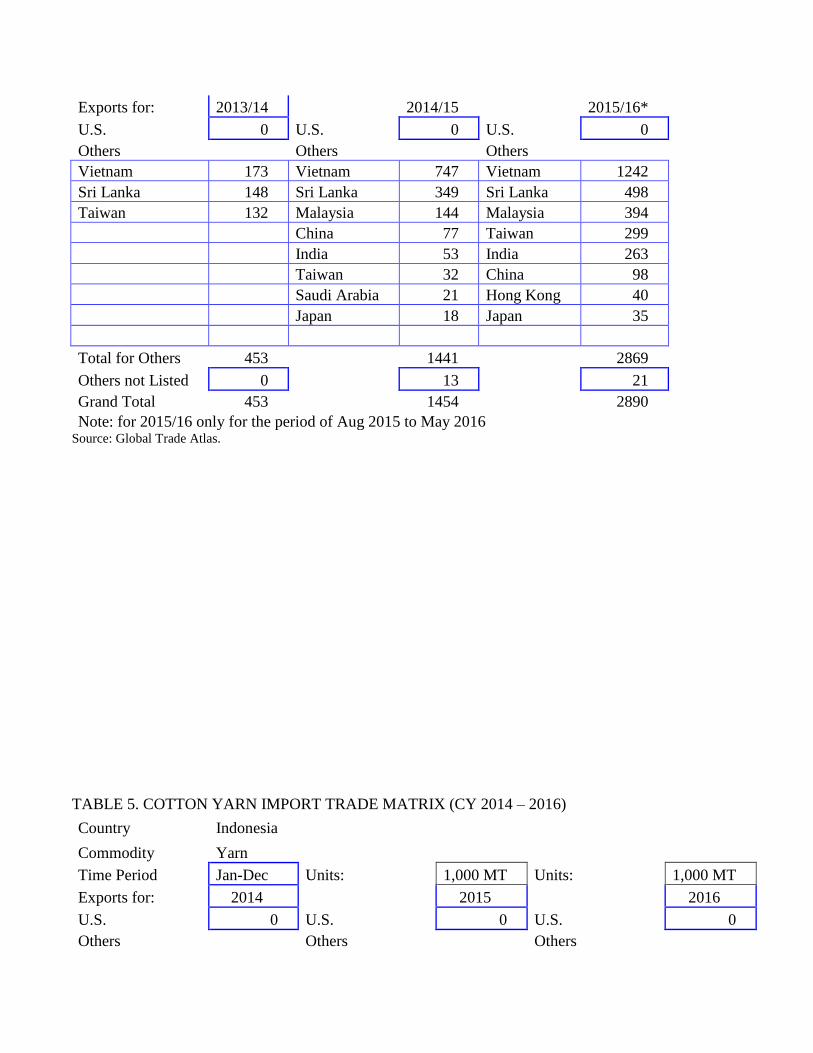
Exports for: 2013/14
2014/15
2015/16*
U.S. 0 U.S. 0 U.S. 0
Others
Others
Others
Vietnam 173 Vietnam 747 Vietnam 1242
Sri Lanka 148 Sri Lanka 349 Sri Lanka 498
Taiwan 132 Malaysia 144 Malaysia 394
China 77 Taiwan 299
India 53 India 263
Taiwan 32 China 98
Saudi Arabia 21 Hong Kong 40
Japan 18 Japan 35
Total for Others 453
1441
2869
Others not Listed 0
13
21
Grand Total 453
1454
2890
Note: for 2015/16 only for the period of Aug 2015 to May 2016 Source: Global Trade Atlas.
TABLE 5. COTTON YARN IMPORT TRADE MATRIX (CY 2014 – 2016)
Country Indonesia
Commodity Yarn
Time Period Jan-Dec Units: 1,000 MT Units: 1,000 MT
Exports for: 2014
2015
2016
U.S. 0 U.S. 0 U.S. 0
Others
Others
Others
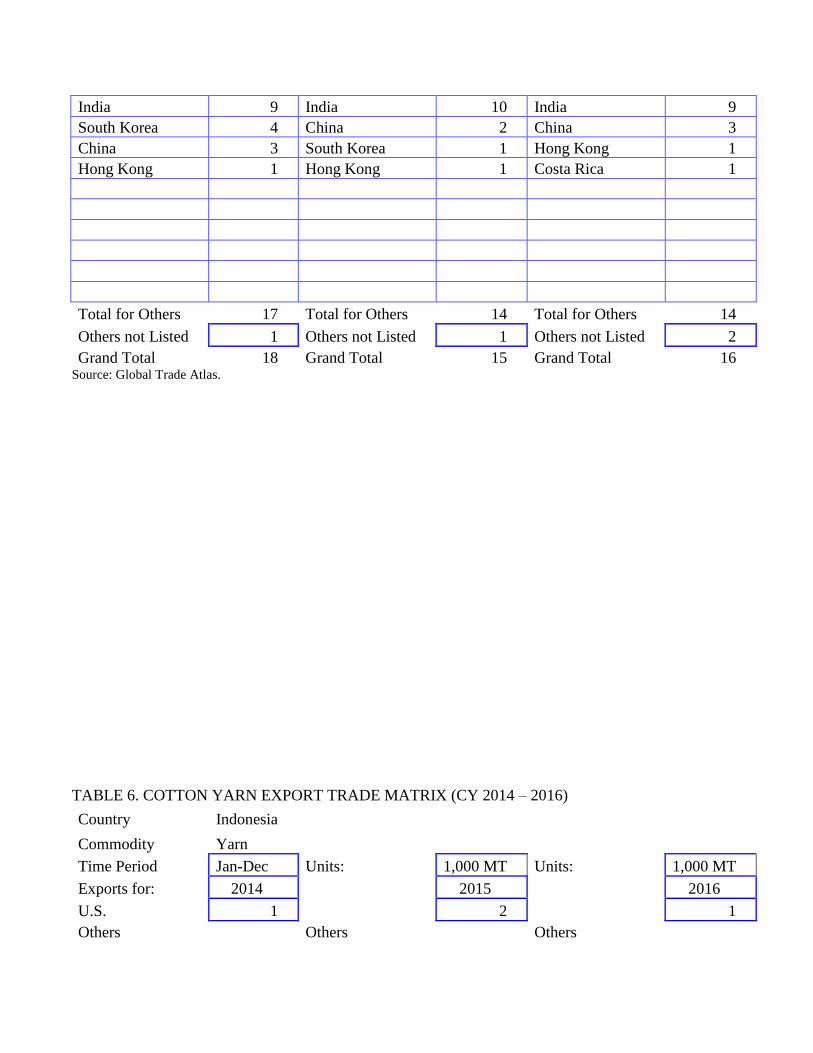
India 9 India 10 India 9
South Korea 4 China 2 China 3
China 3 South Korea 1 Hong Kong 1
Hong Kong 1 Hong Kong 1 Costa Rica 1
Total for Others 17 Total for Others 14 Total for Others 14
Others not Listed 1 Others not Listed 1 Others not Listed 2
Grand Total 18 Grand Total 15 Grand Total 16 Source: Global Trade Atlas.
TABLE 6. COTTON YARN EXPORT TRADE MATRIX (CY 2014 – 2016)
Country Indonesia
Commodity Yarn
Time Period Jan-Dec Units: 1,000 MT Units: 1,000 MT
Exports for: 2014
2015
2016
U.S. 1
2
1
Others
Others
Others

China 93 China 104 China 106
Japan 21 Japan 19 Japan 21
South Korea 7 South Korea 9 South Korea 10
Hong Kong 6 Hong Kong 5 Hong Kong 5
Malaysia 2 Bangladesh 4
Germany 1 South Africa 1
Guatemala 1 Vietnam 1
Turkey 1
Total for Others 132 Total for Others 143 Total for Others 142
Others not Listed 4 Others not Listed 10 Others not Listed 7
Grand Total 137 Grand Total 155 Grand Total 150 Source: Global Trade Atlas.
TABLE 7. COTTON FABRIC IMPORT TRADE MATRIX (CY 2014 - 2016)
Country Indonesia
Commodity Fabric
Units: 1,000 MT Units: Units:
Time Period Jan-Dec Time Period Jan - Dec Time Period Jan - Dec
Exports for: 2014 Exports for: 2015 Exports for: 2016
U.S. 2 U.S. 0 U.S. 0
Others
Others
Others

China 229 China 191 China 35
Korea, Rep. of 78 Korea, Rep. of 56 Korea, Rep. of 12
Hong Kong 61 Hong Kong 53 Hong Kong 9
Pakistan 12 Pakistan 9 Pakistan 2
Malaysia 10 Taiwan 9 Taiwan 2
Vietnam 9 India 9 India 2
Japan 8 Vietnam 5
Taiwan 8 Japan 2
India 7 Turkey 2
Italy 2 Thailand 2
Macau 2 Malaysia 1
Turkey 2
Thailand 1
Belgium 1
Total for Others 430 Total for Others 339 Total for Others 62
Others not Listed 5 Others not Listed 3 Others not Listed 2
Grand Total 437 Grand Total 342 Grand Total 64 Source: Global Trade Atlas.
TABLE 8. COTTON FABRIC EXPORT TRADE MATRIX (CY 2014 - 2016)
Country
Indonesi
a
Commodity Fabric
Units:
1,000
MT
Time Period Jan-Dec
Jan-
Dec
Jan-
Dec
2014
2015
2016
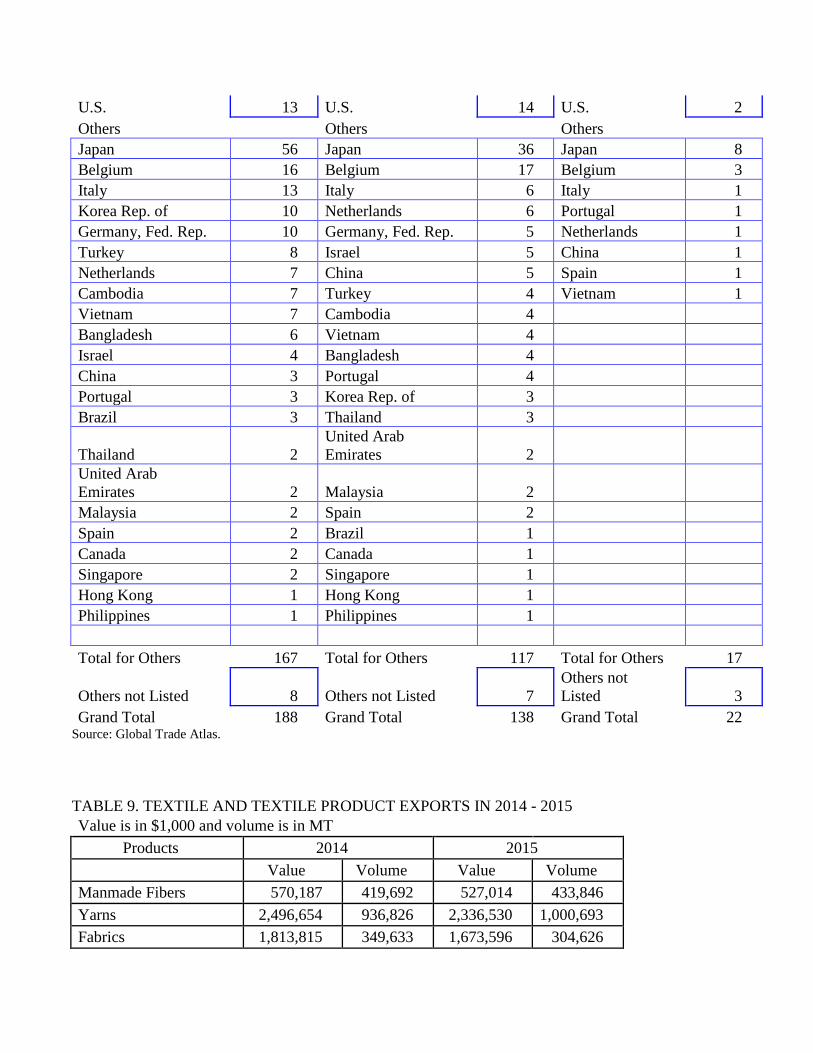
U.S. 13 U.S. 14 U.S. 2
Others
Others
Others
Japan 56 Japan 36 Japan 8
Belgium 16 Belgium 17 Belgium 3
Italy 13 Italy 6 Italy 1
Korea Rep. of 10 Netherlands 6 Portugal 1
Germany, Fed. Rep. 10 Germany, Fed. Rep. 5 Netherlands 1
Turkey 8 Israel 5 China 1
Netherlands 7 China 5 Spain 1
Cambodia 7 Turkey 4 Vietnam 1
Vietnam 7 Cambodia 4
Bangladesh 6 Vietnam 4
Israel 4 Bangladesh 4
China 3 Portugal 4
Portugal 3 Korea Rep. of 3
Brazil 3 Thailand 3
Thailand 2
United Arab
Emirates 2
United Arab
Emirates 2 Malaysia 2
Malaysia 2 Spain 2
Spain 2 Brazil 1
Canada 2 Canada 1
Singapore 2 Singapore 1
Hong Kong 1 Hong Kong 1
Philippines 1 Philippines 1
Total for Others 167 Total for Others 117 Total for Others 17
Others not Listed 8 Others not Listed 7
Others not
Listed 3
Grand Total 188 Grand Total 138 Grand Total 22 Source: Global Trade Atlas.
TABLE 9. TEXTILE AND TEXTILE PRODUCT EXPORTS IN 2014 - 2015
Value is in $1,000 and volume is in MT
Products 2014 2015
Value Volume Value Volume
Manmade Fibers 570,187 419,692 527,014 433,846
Yarns 2,496,654 936,826 2,336,530 1,000,693
Fabrics 1,813,815 349,633 1,673,596 304,626
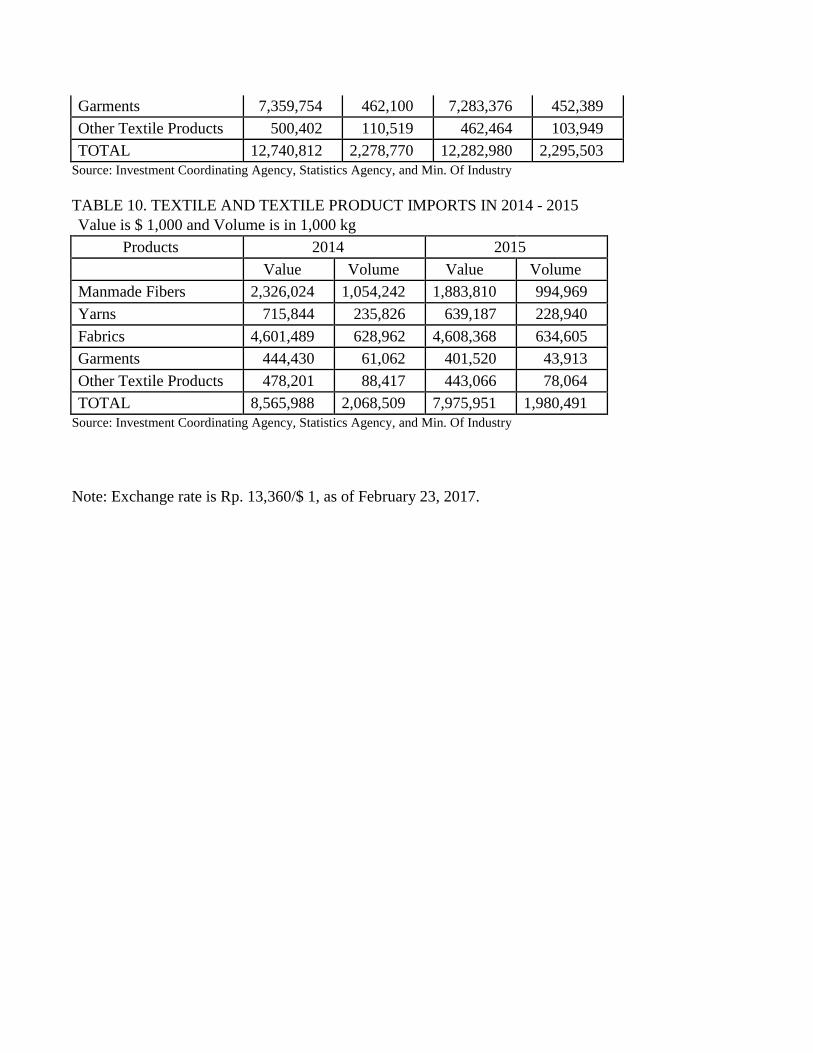
Garments 7,359,754 462,100 7,283,376 452,389
Other Textile Products 500,402 110,519 462,464 103,949
TOTAL 12,740,812 2,278,770 12,282,980 2,295,503
Source: Investment Coordinating Agency, Statistics Agency, and Min. Of Industry
TABLE 10. TEXTILE AND TEXTILE PRODUCT IMPORTS IN 2014 - 2015
Value is $ 1,000 and Volume is in 1,000 kg
Products 2014 2015
Value Volume Value Volume
Manmade Fibers 2,326,024 1,054,242 1,883,810 994,969
Yarns 715,844 235,826 639,187 228,940
Fabrics 4,601,489 628,962 4,608,368 634,605
Garments 444,430 61,062 401,520 43,913
Other Textile Products 478,201 88,417 443,066 78,064
TOTAL 8,565,988 2,068,509 7,975,951 1,980,491
Source: Investment Coordinating Agency, Statistics Agency, and Min. Of Industry
Note: Exchange rate is Rp. 13,360/$ 1, as of February 23, 2017.