INDIVIDUAL TEACHER INCENTIVES AND STUDENT PERFORMANCE … · Individual Teacher Incentives And...
28
NBER WORKING PAPER SERIES INDIVIDUAL TEACHER INCENTIVES AND STUDENT PERFORMANCE David N. Figlio Lawrence Kenny Working Paper 12627 http://www.nber.org/papers/w12627 NATIONAL BUREAU OF ECONOMIC RESEARCH 1050 Massachusetts Avenue Cambridge, MA 02138 October 2006 We have benefitted from comments from John Krieg, Heather Rose and Hanna Skandera and seminar participants at the University of Florida and the American Education Finance Association. We appreciate the helpful comments from Jim Poterba and two anonymous reviewers. We are very grateful for Jin Jeon's help in coding the surveys and alerting us to various inconsistencies in the responses. We appreciate the financial support of the National Science Foundation and the Warrington College of Business Administration. All errors are our own. The views expressed herein are those of the author(s) and do not necessarily reflect the views of the National Bureau of Economic Research. © 2006 by David N. Figlio and Lawrence Kenny. All rights reserved. Short sections of text, not to exceed two paragraphs, may be quoted without explicit permission provided that full credit, including © notice, is given to the source.
Transcript of INDIVIDUAL TEACHER INCENTIVES AND STUDENT PERFORMANCE … · Individual Teacher Incentives And...

NBER WORKING PAPER SERIES
INDIVIDUAL TEACHER INCENTIVES AND STUDENT PERFORMANCE
David N. FiglioLawrence Kenny
Working Paper 12627http://www.nber.org/papers/w12627
NATIONAL BUREAU OF ECONOMIC RESEARCH1050 Massachusetts Avenue
Cambridge, MA 02138October 2006
We have benefitted from comments from John Krieg, Heather Rose and Hanna Skandera and seminarparticipants at the University of Florida and the American Education Finance Association. We appreciatethe helpful comments from Jim Poterba and two anonymous reviewers. We are very grateful for JinJeon's help in coding the surveys and alerting us to various inconsistencies in the responses. We appreciatethe financial support of the National Science Foundation and the Warrington College of Business Administration.All errors are our own. The views expressed herein are those of the author(s) and do not necessarilyreflect the views of the National Bureau of Economic Research.
© 2006 by David N. Figlio and Lawrence Kenny. All rights reserved. Short sections of text, not toexceed two paragraphs, may be quoted without explicit permission provided that full credit, including© notice, is given to the source.

Individual Teacher Incentives And Student PerformanceDavid N. Figlio and Lawrence KennyNBER Working Paper No. 12627October 2006JEL No. I2
ABSTRACT
This paper is the first to systematically document the relationship between individual teacher performanceincentives and student achievement using United States data. We combine data from the NationalEducation Longitudinal Survey on schools, students, and their families with our own survey conductedin 2000 regarding the use of teacher incentives. This survey on teacher incentives has unique dataon frequency and magnitude of merit raises and bonuses, teacher evaluation, and teacher termination.We find that test scores are higher in schools that offer individual financial incentives for good performance.Moreover, the estimated relationship between the presence of merit pay in teacher compensation andstudent test scores is strongest in schools that may have the least parental oversight. The associationbetween teacher incentives and student performance could be due to better schools adopting teacherincentives or to teacher incentives eliciting more effort from teachers; it is impossible to rule out theformer explanation with our cross sectional data.
David N. FiglioDepartment of EconomicsUniversity of FloridaGainesville, FL 32611-7140and [email protected]
Lawrence KennyDepartment of EconomicsUniversity of FloridaGainesville, FL [email protected]

I. Introduction
Education reform advocates in the United States and elsewhere frequently argue that, other
than the intrinsic rewards of teaching, there exists little or no incentive for teachers to do a good job.
It is very difficult to fire a poorly performing teacher after that teacher has been in a typical public
school for a brief probationary period. And most public school teachers are paid on a salary scale,
in which a district’s salaries are determined entirely by teachers’ educational attainment and
experience.
The practice of uniform pay for teachers of similar educational and experience levels,
however, has not always been the norm in the United States. A century ago, incentive systems for
teachers were much more common, but the percent of U.S. school districts using merit pay fell from
48 percent in 1918 to 20 percent in 1939 and just 4 percent in 1953 (Murnane and Cohen 1986).
Amid recent calls for greater use of incentives in government, merit pay plans have spread again.
Ballou (2001) reports that they were found in 10 percent of school districts in 1984 and in 12 percent
in 1993. In recent years, some states have begun to mandate some notion of merit pay. For example,
Florida now requires school districts to earmark a minimum of five percent of the total salary pool
to be used for teacher performance awards, and its state board of education recently approved a
statewide system of student performance-based merit pay. And recently the Denver school district
overhauled their salary schedule to incorporate a large merit pay system.
While there exists considerable research on the factors underlying schools’ decisions to
implement teacher merit pay plans (e.g., Ballou and Podgursky, 1997; Ballou, 2001) and the stability
of these plans (e.g., Johnson, 1986; Murnane and Cohen, 1986; Hatry, Greiner, and Ashford, 1994),
this increased use of teacher merit pay in American education is occurring with virtually no evidence
on its potential effectiveness. The closest the empirical literature has come to evaluating the

2
effectiveness of teacher performance incentives in the United States involves school-based incentive
systems. Clotfelter and Ladd (1996) and Ladd (1999) studied Dallas’s school-based program by
comparing the gain in student pass rates in Dallas with those in five other large Texas cities. They
found that pass rates increased in Dallas relative to other cities. But the fact that a positive difference
for Dallas was estimated for the year before the scheme was initiated raises questions about these
findings. Lavy (2002) carefully matched Israeli schools eligible for a school-based incentive
program with schools in similar small communities and found that this program was associated with
higher test scores. Glewwe, Ilias and Kremer (2003) studied the effects of a school-based teacher
incentive experiment in rural Kenya, where every teacher in grades 4 to 8 in a winning school got
the same bonus. The authors show that the specific teacher incentive program introduced in this
experiment led to the manipulation of short-run test scores, but no long-term achievement gains
among students, suggesting that participating teachers may have attempted to “game the system.”
Although the literature has focused on school-based incentives, most classroom settings
involve one teacher, which makes it possible to reward more effective teachers. We know of just one
published paper that studied incentive programs for individual teachers. Eberts, Hollenbeck, and
Stone (2002), comparing means across two schools, found that individual incentive programs for
teachers were associated with a significant fall in drop out rates but were unrelated to student
achievement. The only evidence of a correlation between individual incentive programs and student
learning is reported in a working paper by Lavy (2003), who found that large teacher incentives in
Israel were associated with increases in the tests directly rewarded by the program. In summary,
there is no U.S. evidence of a positive correlation between individual incentive systems for teachers
and student achievement, and there has been no research at all on the program features and school

3
settings in which this association is strongest.
The major reason why we know so little about the relation between teacher performance
incentives in the United States and student performance is that the large micro education data sets
have gathered very little information about schools’ personnel practices. Typically, large data sets
survey schools about union status, and acquire one or two points on the salary schedule. But these
types of questions provide no direct information about the use of teacher incentives. To remedy this
problem, we conducted our own survey of personnel practices in 2000 of the schools represented in
the National Education Longitudinal Survey (NELS), first administered nationally in 1988 to a set
of eighth-graders (with follow-ups in 1990 and 1992) in 1,052 schools. Because there is an eight-
year gap between the NELS data and our own survey data, we also match NELS data to
contemporaneous but less detailed information on the use of merit pay in the 1993 Schools and
Staffing Survey (SASS).
We find a positive association between the use of individual teacher incentives and student
achievement. We recognize, however, that there are two interpretations of this finding. Under the
first, teacher incentives elicit more effort from teachers, resulting in higher test scores. Alternatively,
schools that are more effective in other difficult-to-measure ways are more likely to adopt individual
teacher incentives, implying that the result is spurious. While we conduct several analyses in an
attempt not to confound our estimated relationship between salary incentives and student
performance with other phenomena, our use of a cross-sectional identification strategy means that
we cannot be certain whether the positive relationship that we report is due to the incentives
themselves or to unobserved school quality. Ultimately an experiment will be needed to reach a
definitive conclusion about whether teacher incentive programs cause teachers, and thus schools,

4
1The Schools and Staffing Survey (SASS) of 1993, also collected by the U.S. Department of Education, asksone question about teacher merit pay. Because the SASS is a large national survey, district respondents overlap withthe NELS in 526 schools. We utilize the SASS as a cross-check of our findings as well as to investigate the potentialeffects of sample selection bias.
2The number of schools is greater than the initial school count because students from sampled middle schoolswent to multiple followed high schools in the NELS.
to be more effective.
II. Description of Data
The NELS, with its rich set of student, family and school attributes, provides an excellent
opportunity for studying many educational policies and practices in a nationally-representative
context. However, as mentioned above, NELS does not include any meaningful variables on teacher
incentives. To remedy this situation, we conducted a survey of the high schools included in the
NELS twelfth grade sample. While our survey data were collected eight years after the last wave
of NELS, they still go a long way toward filling a substantial gap in the existing data.1
In the summer of 2000, we mailed our Survey of School Teacher Personnel Practices to the
1,319 public and private schools in the United States that were included in the twelfth grade round
of the NELS.2 We mailed a second copy of the survey to those who did not respond two weeks
following the initial survey. Eventually 534 schools returned a survey, representing a 40 percent
response rate. Around eighty percent of these schools (390) completely filled out the survey and had
students who continued through twelfth grade in the NELS.
Since teacher financial incentives are common to all the schools in a public school district,
we applied the responding schools’ financial incentive measures to non-responding schools in the
same district. This raised our sample size by about twenty percent to 502 eligible schools in total.

5
In the handful of school districts where two or more schools completed our survey, there is high
correlation between schools’ responses to our basic questions, suggesting that this approach is
appropriate. However, we have also estimated models in which we only use information from the
specific schools that responded; the results are very similar and are, in fact, slightly stronger than
those reported herein. These results are available on request.
Because we still received fewer than half of the surveys we mailed out, one might be
concerned about sample selectivity. It turns out that the respondents to our survey differ in some
important respects from non-respondent NELS high schools. Private schools were more likely to
respond than public schools, perhaps because private school administrators were more interested in
teacher performance incentives. Twenty percent of the students in responding schools attend some
private school, in contrast to 14 percent for the complete NELS sample. As a result of the
differential public-private response rates, we find in Table 1 that responding schools tended to have
significantly (at the ten percent level) higher test scores, and better educated parents than did non-
responding schools. In addition, responding schools tended to be larger and to have students who
took more high school mathematics courses. None of the other variables included in our regressions
(and described below) significantly differ between our survey respondents and non-respondents. All
but one of these differences between respondents and non-respondents disappear when we control
for public/private school sector in Table 1; responding public schools are larger than non-responding
public schools. To allay concerns about sample selectivity, regressions based only on public schools,
where sample selectivity is much less an issue, are reported later in the paper in Table 5. However,
despite the fact that within the public sector respondents and non-respondents are observationally
equivalent across many dimensions, one might still be concerned about sample selectivity. We also

6
will report in Table 5 another specification in which we use weaker, but contemporaneous, merit pay
measures from the Schools and Staffing Survey (SASS) of 1993, with a better than 80 percent
response rate. The SASS in both rounds asked a sample of teachers whether they had received a
merit bonus or some other performance pay in the previous year. A public school district or a
private school is counted as having a merit pay plan if at least one of its teachers in this sample
reported having received a merit bonus, and otherwise is counted as not having a merit pay plan. As
shown below, we find that the results from the merged SASS-NELS analysis are very similar to
those presented based on our survey. In addition, we can compare the SASS-NELS results for the
set of schools that responded to our survey and the set of schools that did not respond; the results
the results are quite similar. Taken together, these results indicate that our estimates of the
correlation between test scores and merit pay are not driven by differential non-response of schools.
Another potentially significant concern with the use of our survey data is that our survey was
conducted eight years after the students were tested in the NELS. It is certainly possible that teacher
compensation practices changed dramatically in the schools considered during this period. We use
the SASS, conducted in successive rounds at almost the identical time as the 1992 round of the
NELS (1993/94) and our 2000 survey (1999/2000), both to help gauge the stability of the merit pay
system as well as to provide a contemporaneous measure of merit pay in the NELS analysis.
We take two alternative tacks to gauge the stability of merit pay programs. Under the first,
we match SASS schools in 1993/94 and 1999/2000, and compare the use of merit pay programs in
these two years. We find that private schools with a merit pay program in the 1993/94 round of the
SASS were twice as likely as those that did not have such a program to have one in the 1999/2000
round of the SASS (a difference that is statistically significant at the one percent level) and that
7
3There was an insufficient number of private schools that overlapped these two surveys to permit any reasonablestatistical analysis.
public school districts with a merit pay plan in 1993/94 were 80 percent more likely to have such a
program in 1999/2000. Therefore, while having a merit pay program in 1993/94 is no guarantee that
such a program will have persisted to 1999/2000, there does appear to be substantial persistence in
these programs.
The second source of information about the stability of merit pay programs comes from
approximately fifty public schools that were in the 1993/94 round of the SASS and that answered
a broad question about the use of merit pay in our 2000 survey.3 Our question asked “Does this
school use [a monetary reward] to reward teacher performance?” The correlation between the
1993/94 SASS measure of the presence of merit pay and the measure of merit pay based on our 2000
survey is high–about 0.4–and statistically significant at the one percent level. This evidence, in
conjunction with that presented in the previous paragraph, suggests that the eight-year time lag
between our survey collection and the NELS study administration is not a major flaw in the research
design. In addition, we will present evidence in Table 5 that the estimated relationship between test
scores and merit pay policies is similar regardless of whether one measures merit pay using our
survey conducted in 2000 or using the SASS measure collected in 1993.
Non-Incentive Variables Included in Estimation
The NELS data set has twelfth grade student test scores for reading, mathematics, science,
and history. We report education production functions for the sum of scores on all four tests because
measurement error is smaller with the sum than with the component tests.
We include a rich set of variables to control for other influences on learning, and thus to

8
minimize the omitted variable bias in the estimated relation between the use of teacher incentives
and test scores. We control for the student’s eighth grade test score to account for unmeasured
ability. To the degree to which teacher incentive programs are time invariant, some of the relation
between student performance and the use of merit pay could be absorbed in the prior test score
coefficient. The number of mathematics courses taken in high school and the average number of
days absent per year in high school also capture student ability and motivation. We recognize that
these last two control variables also may be endogenous; when these variables are excluded from the
model, our estimated teacher incentives coefficients are larger in magnitude and statistical
significance than those reported in the paper. Those reported herein are more conservative estimates
of the relation between teacher incentives and student achievement.
We control for other student background characteristics as well. The student’s sex, race, and
ethnic background, as well as an indicator for whether the student speaks a language other than
English at home, are included in the model. We also control for number of siblings, maternal and
paternal education (using dummies that indicate whether the parent has attained a GED, high school
degree, four year college degree, master’s degree, or a Ph.D. or other terminal degree), and whether
parents provide weekly or daily homework help to their students.
In addition, we control for various school inputs. Specifically, we include measures of the
average length of the school year (in days) and school day (in instructional minutes) over the
student’s high school career, the school’s pupil-teacher ratio, the average school enrollment per grade
in the student’s school, the percent of teachers with master’s degrees in the school, and the minimum
teacher’s salary. Because teacher incentive variables could influence the attributes of teachers in a
school as well as these other school inputs, we have estimated models that exclude these variables

9
from the regression analysis, and our teacher incentive coefficients are unchanged in terms of
magnitudes and statistical significance levels.
Finally, we control for the school’s sector (Catholic, non-Catholic private, or public) and
whether the student’s school in eighth grade (the only year this information is known) was covered
by a collective bargaining agreement. Teacher unionization and school sector could influence the
likelihood that a school employs teacher incentive measures; therefore, these factors are included to
reduce the likelihood that productivity differences across these types of schools are influencing our
policy estimates.
Incentive Variables
We created several indicators to capture key elements of the financial incentives that a school
provides its teachers. For one, the use of financial incentives should result in some salary variation
for those who otherwise would have the same salary under a schooling-experience salary schedule.
We asked principals to provide the maxima and minima in the range in teacher salaries for each of
two schooling and experience mixes for experienced teachers: a) Master’s degree and 10 years
experience, and b) Master’s degree and 20 years experience. For each response, the per cent wage
variation was calculated as
100×[maximum salary (MA, exp) - minimum salary (MA, exp)] minimum salary (MA, exp)
where exp = 10, 20.
We also asked principals to describe the characteristics of any bonus and raise programs that
reward good teaching. As noted in the introduction, there are a number of “merit pay” systems that
give raises or bonuses to virtually everyone or to a large enough fraction of teachers that the

10
incentives are greatly weakened. In our sample, schools with merit raises on average gave them to
43 percent of the teachers (with a median value of 10 percent), and on average 36 percent of teachers
(with a median value of 14 percent) received bonuses in schools that offered bonuses. Teachers in
schools with no merit pay or in schools that award merit pay to all or most of their teachers have no
or little incentive to be better teachers. On the other hand, merit programs that offer merit pay to
a small fraction of teachers likely provide teachers with a stronger incentive to do well.
The salary range, merit raise, and merit bonus responses together describe the school’s use
of financial incentives to reward individual teachers. Evidence of high wage variation, selective
bonuses, or selective raises suggests that teachers face relatively strong financial incentives to be
more effective. We construct three alternative indices of merit pay that measure different levels of
the strength of merit pay. These indices are based on the response values that would place the school
among the top 20 percent, 40, percent, and 60 percent of “merit-indicating”schools that on that
question indicated some use of financial incentives. We chose these thresholds for convenience, but
our results are not sensitive to marginal changes in these thresholds. We identified three separate
indices of merit pay strength in order to determine the degree to which the estimated correlation
between merit pay and test scores is sensitive to changes in the definition of merit pay. We conclude
below that the results are similar across different measures of merit pay strength.
The top 20 percent of merit-indicating schools had at least one of the following indicators
of high salary incentives: a) at least a 20 percent salary range, b) merit raises that are given to no
more than 5 percent of teachers, or c) merit bonuses that are received by no more than 7 percent of
the teaching staff. We construct two indices of high salary incentives: an indicator for whether any
of these three attributes are true, and an index of the number of these three attributes that are true.

11
As can be seen in Table 2, 91 of our 502 schools fall into one of these categories, 6 meet two of these
criteria, and none meet all three.
We also construct similar indices where we define merit pay variables at the 40th and 60th
percentiles of the distribution of schools with that incentive measure. The medium-strength merit
pay index counts a school as having merit pay if the salary range is at least 13 percent, if fewer than
10 percent of teachers receive a merit raise, and/or if fewer than 12 percent of teachers receive a
merit bonus. One hundred and twenty-eight schools meet one of these criteria, 10 satisfy two, and
1 meets all three. The lower-strength merit pay index counts a school as having merit pay if the
salary range is at least 10 percent, if fewer than 20 percent of teachers receive a merit raise, and/or
if fewer than 20 percent of teachers receive a merit bonus. One hundred and fifty-nine schools meet
one of these criteria, 15 satisfy two, and 1 meets all three. These three indices represent three
alternative thresholds for defining merit pay for teachers. The relatively small number of schools
with a well designed incentive system precludes the use of more complex incentive variables.
Other variables capture incentives that may result from teacher evaluation and dismissal.
Half the schools evaluate experienced teachers annually instead of less frequently. More frequent
performance review is expected to improve teacher performance. The threat of dismissal may be a
powerful incentive for teachers to do a good job. Therefore, we also measure whether at least one
teacher with three or fewer years of experience was dismissed or counseled to leave over the last
three academic years; this was true for 66 percent of schools. In addition, we measure whether at
least one more experienced teacher was dismissed or counseled to leave over the last three academic
years; this was true for 34 percent of schools despite the fact that there are many more experienced
teachers than there are novice teachers. We experimented with including the fraction of teachers

12
dismissed over three years, but since typically only one or two teachers were dismissed, there was
very limited variation to exploit in the data; as such, we utilize dichotomous variables for dismissal
instead of more continuous measures of dismissal rates.
III Empirical Results
Public/Private Differences in the Utilization of Teacher Incentives
Table 3 provides evidence on whether private schools are indeed more likely to utilize the
various incentives that were described above. Catholic schools are more than twice as likely to
dismiss novice teachers and three times as likely to dismiss experienced teachers than are public
schools but do not differ significantly in any other way from public schools. Non-Catholic private
schools are significantly different from public schools in nearly every measured dimension of teacher
incentives. These figures support prior research (e.g., Ballou and Podgursky, 1997) that has found
that private schools are more likely to rely on teacher performance incentives. Because public and
private schools differ so dramatically in their utilization of performance incentives, we estimate the
relationship between merit pay and student achievement separately for public schools.
Estimated Relation between Teacher Incentives and Student Performance
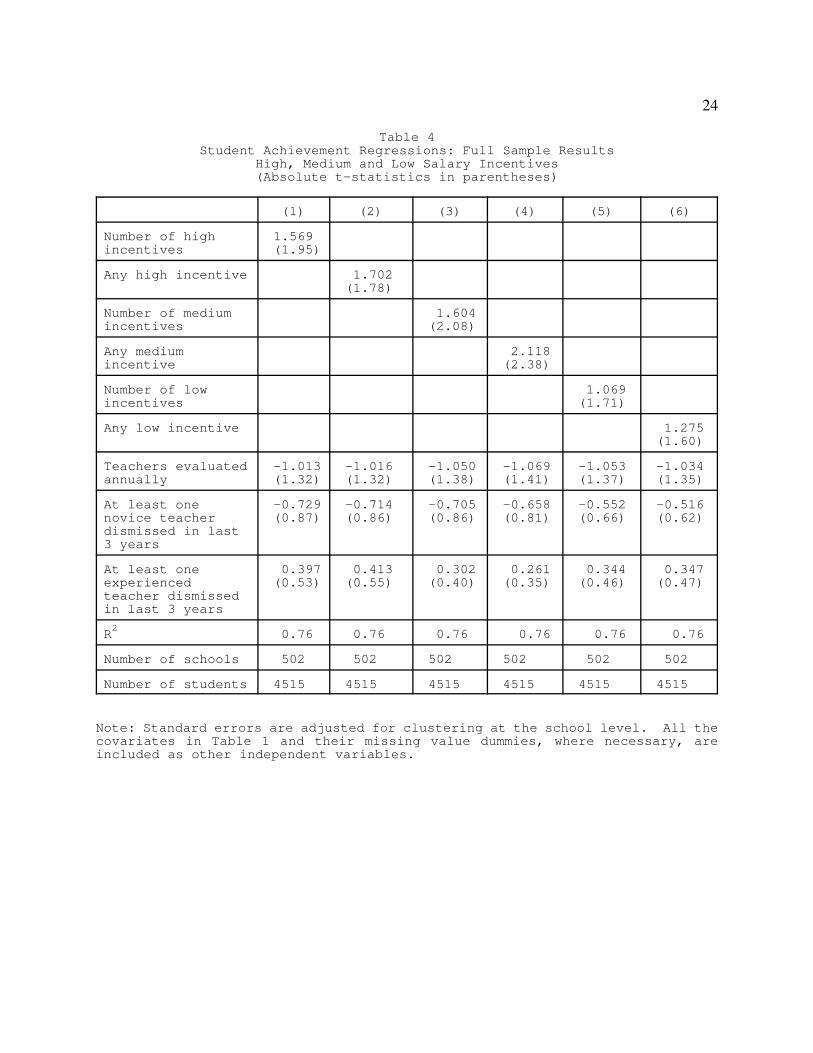
Table 4 reports six regressions estimating an education production function for the summed
test scores using two variants apiece of each of the three merit pay indices described earlier: an
indicator for whether any of the three component measures of merit pay met the requisite threshold
and an index of the number of these component measures that met the threshold, for each of the three
different merit pay threshold levels. Beneath each coefficient estimate is a t-statistic reflecting
standard errors that have been adjusted for clustering at the school level. The regressions are based
on 4515 students from 502 schools and include all of the variables listed in Table 1 as well as

13
missing value flags for all variables except the school sector and teacher incentive variables. The
coefficient estimates on the control variables conform to expectations and prior research results using
the NELS, but are excluded from this paper due to space constraints. The full set of coefficient
estimates is available on the web as a supplemental file.
We find evidence that the use of teacher salary incentives is associated with higher levels of
student performance, all else equal. Regardless of the measure of teacher financial incentives (i.e.,
whether the school offers relatively high levels or relatively low levels of incentives, as well as the
ways in which the incentives are cumulated) the incentive coefficients are positive and at least
marginally significant. For example, having any high salary incentive (column 2) is associated with
a 1.7 point increase in test scores, all else equal, while column 1 indicates that having one high salary
incentive is associated with a 1.6 point increase and two high salary incentives is accompanied by
a 3.2 point increase in test scores. Regressions 2, 4 and 6 indicate that having any salary incentive
is associated with a 1.3 to 2.1 point rise in test scores, depending on how the incentive program is
characterized. These are small changes when compared to the 33 point standard deviation in test
scores, but are comparable in magnitude to increasing maternal education by approximately 3 years.
All three of the merit pay definitions employed in Table 4 imply a reasonably high degree
of selectivity in the distribution of financial incentives. In results not shown but available on request,
we find that if indiscriminately-administered merit pay plans are treated equivalently to more
selective plans, merit pay per se is not associated with test score improvements - the coefficients
associated with the merit pay categorization that includes both selective and unselective plans are
not statistically significant. This suggests that while selectively-administered merit pay programs
are associated with increased student test scores, those that award bonuses to very large fractions of

14
teachers are apparently not associated with student outcomes.
At the same time, the regressions in Table 4 also suggest that non-financial incentives for
teaching performance are unrelated to student learning. The coefficients on more frequent teacher
evaluation and firing teachers are not statistically significant. This lack of finding for the teacher-
dismissal variables is robust to different characterizations of teacher dismissal rates. The coefficients
on annual evaluation are never statistically significant.
In Table 1 we showed that in the full sample there were significant differences between
responding schools and all schools for several variables. However, these differences are almost
entirely driven by school sector, as responding and non-responding public schools are statistically
indistinguishable in terms of observables for all but one variable. Table 5 therefore reports our basic
findings for the set of all 502 schools (column 1) and the subsample of 392 public schools (column
2). In the public school subsample, there is a positive and marginally significant correlation between
student achievement and the various salary incentive index variables. The coefficients in the public
school subsample are about one third smaller than the coefficients based on the full sample.
However, the fundamental conclusion that teacher incentives are associated with higher student test
scores continues to hold in a public-only sample.
A Contemporaneous Measure of Teacher Incentives
The question from the 1993 SASS data set on whether a teacher received a merit bonus is
used to create a contemporaneous measure of the use of incentives in our NELS schools. This SASS
incentive variable equals one if at least one teacher in a NELS public school district in 1993 reported
in the SASS data set receiving a merit bonus and equals zero otherwise. With this variable, changes
over time in incentive policies are no longer an issue. The results of a regression using this variable

15
in the sample of 526 schools in public school districts in both the NELS and SASS data sets are
reported in column 3 in Table 5. The coefficient is significant at the 5 percent level and implies that
test scores are 1.0 points higher in public schools that have merit bonuses. The finding of a smaller
(though significant) merit pay coefficient using the SASS instead of our survey may be due to the
fact that the SASS variable includes both judiciously-administered and indiscriminate merit pay
systems.
Selectivity and Endogeneity Biases
The SASS analysis also helps shed additional light on the question of sample selection bias.
In regressions not reported in the table, we repeat this analysis for the subsamples that responded to
our survey and that did not. The estimated coefficient on the SASS incentive variable was 0.9 points
for public schools that responded to our survey and 1.0 points for public schools that did not respond.
This result provides additional evidence supportive of the notion that sample selection bias is not
responsible for our findings.
It is also potentially the case that schools with teacher incentives face different twelfth grade
populations than do schools without such programs. To investigate this possibility, we estimated
identical regression models to those used in columns 1 and 2 in Table 5, but with high school
dropout or sample attrition as the dependent variable. We found that our merit pay measures are not
related to either the probability of high school dropout or of leaving the sample for other reasons.
These results are available on request from the authors. Therefore, schools with merit pay programs
are not facing differentially selectively-sampled students in the twelfth grade of the NELS data.
Despite having a rich set of covariates, there may still be some endogeneity bias. As is
shown in Table 3, private schools are considerably more likely than are public schools to have

16
teacher salary incentive programs. In the public school regressions we control for sector differences
in the propensity to have merit pay and still find that teacher incentives are significantly correlated
with test scores. Within the public sector there also exists considerable differences between schools
in their likelihood of offering teacher incentive programs. Specifically, non-unionized schools are
more than twice as likely as are unionized schools to offer teacher incentive programs. But our
regressions control for union status, and we still find a positive association between teacher incentive
programs and test scores. We also discovered that schools in states with active school reform
agendas in the early 1990s were also more likely to have teacher incentive programs. One measure
of this reflects the timing of a state’s charter school law. Schools in the eight states that legalized
charter schools first, between 1991 and 1993, are two-thirds more likely than are schools in the rest
of the United States to have teacher incentives, by our measures. While these policies, like union
status and school sector, are not good candidates for instrumental variables because of their potential
independent correlation with the dependent variable, we can still stratify our sample on the basis of
these policies to get a handle on the potential endogeneity problem. Columns 4 and 5 in Table 5
present the results of this analysis. The coefficients on our incentive variables are of similar size in
both subsamples of schools. Accordingly, a positive association between the use of teacher
incentives and student performance remains even after controlling for three potential sources of
heterogeneity in the use of individual teacher incentives - school sector, unionization, and state
reform activity.
Parental monitoring provides schools with some pressure to be more efficient. Many teachers
complain that lower-income parents often are uninvolved in their children’s education. This
complaint is substantiated by the findings that parental income is strongly positively correlated with

17
PTA activity and the likelihood of having frequent parent-teacher contact in the NELS, and that
SASS principals of higher-income schools report dramatically higher levels of parental involvement
than do SASS principals of lower-income schools, as measured by the fraction of a school’s student
receiving free or reduced-price lunches. Since there appears to be less parental monitoring in schools
serving poorer families, these schools may have a greater potential for improvement when merit pay
plans are instituted. To test whether financial incentives have a stronger relationship with test scores
in schools serving low-income families, we divided the full sample into thirds based on mean family
income for the students in our sample from the school. The resulting regressions using the three
salary indices are summarized in Table 6. Individual financial incentives for teachers are unrelated
to student achievement in schools serving higher-income families, but the teacher incentive
coefficients in the schools drawing students from lower- and middle-income families are large (1.8
to 2.7 points) and statistically significant. This result is consistent with the notion that merit pay
could be most effective in settings where parental monitoring of schools is weaker, but it could also
be the case that these schools are the places where more innovative teachers and principals – perhaps
the same educators more likely to experiment with merit pay systems – have the most latitude for
positive change. In cross-section it is impossible to disentangle these two competing explanations
for the relationship that we observe.
IV Conclusions
This paper is the first to systematically document the relationship between individual teacher
performance incentives and student achievement using United States data. We demonstrate that
students learn more in schools in which individual teachers are given financial incentives to do a
better job, though we cannot discern whether this relationship is due to the incentives themselves or

18
to better schools also choosing to implement merit pay programs. Several different indicators were
combined to ascertain whether schools offer these financial incentives. Other things equal, students
apparently learn more in schools in which there is a wide range in wages for teachers with a specified
mix of schooling and experience or in which small numbers of teachers receive targeted bonuses or
raises, and this relationship is strongest in schools serving lower-income populations. The estimated
gains in test scores associated with the judicious use of salary incentives are modest but are as large
as those associated with other prominent variables in the education production function literature.
The evidence of a positive association between merit pay and student performance should
be interpreted with caution. It could reflect students learning more in schools in which the use of
merit pay is correlated with more innovation in teaching, for example, and in which higher student
achievement is due to the innovation in teaching but not to the use of merit pay. We have shown that
the positive correlation between teacher incentives and test scores persists even after we control for
three sources of heterogeneity in the use of merit pay - teacher unionization, school sector, and
educational reform in the state. These efforts, however, are unable to remove all doubt that the
estimated association between teacher incentives and student performance in our cross sectional
identification strategy is due to unobserved school quality rather to the teacher incentives themselves.
A controlled experiment would be necessary to obtain estimates of the effect of the use of individual
teacher incentives on student achievement that could truly be considered causal. Randomized
experiments like the U.S. Department of Education-funded studies set to take place beginning in
2008 will provide valuable evidence on the causal effects of teacher incentives.
School districts or states conducting such an experiment would be well advised to note that
merit pay per se is by no means a silver bullet. Principals, who themselves have little financial

19
incentive to do a better job, often find it easier to praise most of their teachers. In the 1993-94 SASS,
principals reported that four out of five of their teachers rated a “good” or “excellent,” and in 2000
an even greater percentage of Florida teachers were identified by their principals as worthy of
receiving state-funded merit pay. Doling out merit pay to most teachers provides them with little
incentive to do a better job. Our evidence, which is unique to the incentives literature, suggests that
there is a relation between test scores and merit pay targeted to a few but no association between
student performance and indiscriminate merit pay. In this light, Glewwe et al.’s (2003) finding that
merit pay effects are illusory when all get the same reward is unsurprising.

20
References
Ballou, D. “Pay for Performance in Public and Private Schools.” Economics of Education Review
20 (February 2001): 51-61.
Ballou, D. and M. Podgursky. Teacher Pay and Teacher Quality, Upjohn Institute (1997).
Clotfelter, C. and H. Ladd. “Recognizing and Rewarding Success in Public Schools.” in H. Ladd,
editor, Holding Schools Accountable: Performance-Based Reform in Education.
Washington, D.C., Brookings Institution: 1996.
Eberts, R., K. Hollenbeck, and J. Stone. “Teacher Performance Incentives and Student Outcomes.”
Journal of Human Resources 37 (Fall 2002): 913-27.
Glewwe, P., N. Ilias, and M. Kremer. “Teacher Incentives.” (2003) NBER working paper 9671.
Hatry, H., J. Greiner and B. Ashford. Issues and Case Studies in Teacher Incentive Plans, Urban
Institute, 1994.
Johnson, S. “Incentives for Teachers: What Motivates, What Matters.” Educational Administration
Quarterly 22 (Summer 1986): 54-79.
Ladd, H. “The Dallas School Accountability and Incentive Program: an Evaluation of its Impacts
on Student Outcomes.” Economics of Education Review 18 (February 1999): 1-16.
Lavy, V. “Evaluating the Effect of Teachers’ Group Performance Incentives on Pupil Achievement.”
Journal of Political Economy 110 (December 2002): 1286-1317.
Lavy, V. “Paying for Performance: The Effect of Financial Incentives on Teachers’ Effort and
Students’ Scholastic Outcomes.” (2003) Hebrew University working paper.
Murnane, R. and D. Cohen. “Merit Pay and the Evaluation Problem: Why Most Merit Pay Plans
Fail and a Few Survive.” Harvard Educational Review 56 (February 1986): 1-17.

21
Table 1: Summary Statistics of Variables Included in Regression Analysis
Full NELS Sample Public Schools
Respondingschools
Allschools
Respondingschools
Allschools
Number of students with scores 4523 12830 3617 10578
Sum of 12th grade test scores 144.7 142.8* 141.0 139.0*
Sum of 8th grade test scores 117.3 115.3* 114.4 113.3
Male .507 .486 .499 .488
Other language spoken .160 .141 .168 .139
Asian .073 .061 .076 .062
Hispanic .129 .113 .146 .120
Black .098 .095 .102 .099
Native American .029 .033 .033 .035
Avg. days absent from school 4.46 4.27 4.65 4.64
Number of siblings 2.13 2.18 2.21 2.22
Weekly homework help provided .411 .418 .412 .417
Daily homework help provided .102 .101 .103 .100
Mother high school grad .623 .637 .648 .666
Mother college grad .162 .141* .134 .118
Mother has master’s degree .074 .063* .060 .051
Father high school grad .501 .535* .542 .574
Father college grad .183 .158 .171 .159
Father has master’s degree .105 .091 .092 .079
Number of math credits taken 3.255 3.147* 3.127 3.108
School pupil/teacher ratio 17.19 16.73 17.63 17.11
School percent w/ masters 52.54 51.22 53.69 51.42
School minimum salary 21569 21530 22177 21873
Teachers are unionized .533 .545 .642 .626
Enrollment in student’s grade 282 247* 327 274*
Length of school year (days) 178 179 179 179
Length of school day (minutes) 335 336 337 337
* Mean significantly different from public school mean at 5% level, using 2tailed test. No unmarked differences are significant at the 10% level.
Regressions also control for whether the mother or father has a PhDdegree or a GED, as well as whether the student has 6+ siblings. Theseare omitted from the table for space reasons, but are not different acrossthe columns.

22
Table 2Frequency Distribution of Salary Incentive Variables
502 Schools
Schoolprovidesnone oftheseincentives
Number of incentivesthat school provides
Schoolprovidesat leastoneincentive
0 1 2 3 1
High salary incentives: 20+ percent salary range;merit raises for <5percent of teachers; ormerit bonuses for <7percent of teachers
405 91 6 0 97
Medium salary incentives: 13+ percent salary range;merit raises for <10percent of teachers; ormerit bonuses for <12percent of teachers
363 128 10 1 139
Low salary incentives: 10+ percent salary range;merit raises for <20percent of teachers; ormerit bonuses for <20percent of teachers
327 159 15 1 175

23
Table 3Public/private differences in the utilization of teacher incentives
Catholic(n=70)
OtherPrivate(n=40)
Public(n=392)
Number of high incentives .111 .225* .143
Number of medium incentives .200 .575* .214
Number of low incentives .289 .700* .289
Any high incentive .089 .225* .137
Any medium incentive .133 .475* .204
Any low incentive .222 .575* .260
Teachers evaluated annually .578 .400 .501
At least one novice teacherdismissed in last 3 years
.632* .305 .271
At least one experiencedteacher dismissed in last 3years
.518* .296* .152
* Mean significantly different from public school mean at 5% level, using 2tailed test.
Note: no unmarked differences are significant at the 10% level.
24
Table 4Student Achievement Regressions: Full Sample Results
High, Medium and Low Salary Incentives(Absolute t-statistics in parentheses)
(1) (2) (3) (4) (5) (6)
Number of highincentives
1.569 (1.95)
Any high incentive 1.702 (1.78)
Number of mediumincentives
1.604 (2.08)
Any mediumincentive
2.118 (2.38)
Number of lowincentives
1.069 (1.71)
Any low incentive 1.275 (1.60)
Teachers evaluatedannually
-1.013 (1.32)
-1.016 (1.32)
-1.050 (1.38)
-1.069 (1.41)
-1.053 (1.37)
-1.034 (1.35)
At least onenovice teacherdismissed in last3 years
-0.729 (0.87)
-0.714 (0.86)
-0.705 (0.86)
-0.658 (0.81)
-0.552 (0.66)
-0.516 (0.62)
At least oneexperiencedteacher dismissedin last 3 years
0.397 (0.53)
0.413 (0.55)
0.302 (0.40)
0.261 (0.35)
0.344 (0.46)
0.347 (0.47)
R2
0.76 0.76 0.76 0.76 0.76 0.76
Number of schools 502 502 502 502 502 502
Number of students 4515 4515 4515 4515 4515 4515
Note: Standard errors are adjusted for clustering at the school level. All thecovariates in Table 1 and their missing value dummies, where necessary, areincluded as other independent variables.

25
Table 5Student Achievement Regressions:
Results for High, Medium and Low Salary IncentivesUsing Various Subsamples
Results for SASS Incentive Measure(Absolute t-statistics in parentheses)
(1) (2) (3) (4) (5)
FullSample
PublicSample
SASS-NELSPublicSample
EarlyCharterState
LaterCharterState
Any high incentive 1.702(1.78)R2 =0.76
1.074(1.69)R2 =0.76
1.422(0.89)R2 =0.77
1.759(1.56)R2 =0.76
Any mediumincentive
2.118(2.38)R2 =0.76
1.373(1.77)R2 =0.76
2.434(1.88)R2 =0.77
1.184(1.77)R2 =0.76
Any low incentive 1.275(1.60)R2 =0.76
1.080(1.79)R2 =0.76
2.238(1.66)R2 =0.77
1.079(1.19)R2 =0.76
Salary incentivevariable from SASS
0.985(1.96)R2 =0.75
Number of schools 502 392 526 120 382
Number of students 4515 3617 5517 1038 3477
Note: Standard errors are adjusted for clustering at the school level. All thecovariates in Table 1 and their missing value dummies, where necessary, areincluded as other independent variables.

26
Table 6Student Achievement Regressions: by School’s Average Family Income
High, Medium and Low Salary Incentives(Absolute t-statistics in parentheses)
School’s Average Family Income
Sample Lowest Third Middle Third Highest Third
(1) (2) (3)
Any high incentive 2.442 (1.91) R
2 = 0.75
2.727 (1.29) R
2 = 0.75
0.853 (0.54) R
2 = 0.75
Any medium incentive 2.787 (2.45) R
2 = 0.75
2.540 (1.52) R
2 = 0.75
1.406 (0.65) R
2 = 0.75
Any low incentive 1.782 (1.60) R
2 = 0.75
2.528 (1.76) R
2 = 0.75
0.538 (0.41) R
2 = 0.75
Number of schools 184 146 172
Number of students 1452 1513 1550
Note: Standard errors are adjusted for clustering at the school level. All thecovariates in Table 1 and their missing value dummies, where necessary, areincluded as other independent variables.