Indirect Treatment Comparison/Network Meta-Analysis … · · 2014-03-19Available online at...
17
Available online at www.sciencedirect.com journal homepage: www.elsevier.com/locate/jval Indirect Treatment Comparison/Network Meta-Analysis Study Questionnaire to Assess Relevance and Credibility to Inform Health Care Decision Making: An ISPOR-AMCP-NPC Good Practice Task Force Report Jeroen P. Jansen, PhD 1,2, *, Thomas Trikalinos, MD, PhD 3 , Joseph C. Cappelleri, PhD, MS, MPH 4 , Jessica Daw, PharmD, MBA 5 , Sherry Andes, BSPharm, PharmD, BCPS, BCPP, PAHM 6 , Randa Eldessouki, MBBCH, MSc, MD 7 , Georgia Salanti, PhD 8 1 Redwood Outcomes, Boston, MA, USA; 2 Tufts University School of Medicine, Boston, MA, USA; 3 Program in Public Health, Center for Evidence-based Medicine, Brown University, Providence, RI, USA; 4 Pfizer, Inc., New London, CT, USA; 5 Clinical Pharmacy, UPMC Health Plan, Pittsburgh, PA, USA; 6 Catamaran, Louisville, KY, USA; 7 Scientific & Health Policy Initiatives, ISPOR, Lawrenceville, NJ, USA; 8 Department of Hygiene and Epidemiology, School of Medicine University Campus, University of Ioannina, Ioannina, Greece ABSTRACT Despite the great realized or potential value of network meta-analysis of randomized controlled trial evidence to inform health care decision making, many decision makers might not be familiar with these techniques. The Task Force developed a consensus-based 26-item questionnaire to help decision makers assess the relevance and credibility of indirect treatment comparisons and network meta- analysis to help inform health care decision making. The relevance domain of the questionnaire (4 questions) calls for assessments about the applicability of network meta-analysis results to the setting of interest to the decision maker. The remaining 22 questions belong to an overall credibility domain and pertain to assessments about whether the network meta-analysis results provide a valid answer to the question they are designed to answer by examining 1) the used evidence base, 2) analysis methods, 3) reporting quality and transparency, 4) interpretation of findings, and 5) conflicts of interest. The questionnaire aims to help readers of network meta-analysis opine about their confidence in the credibility and applicability of the results of a network meta-analysis, and help make decision makers aware of the subtleties involved in the analysis of networks of randomized trial evidence. It is anticipated that user feedback will permit periodic evaluation and modification of the questionnaire. Keywords: bias, checklist, credibility, decision making, indirect comparisons, mixed treatment comparisons, multiple treatment comparison, network meta-analysis, questionnaire, relevance, validity. Copyright & 2014, International Society for Pharmacoeconomics and Outcomes Research (ISPOR). Published by Elsevier Inc. Introduction Four Good Practices task forces developed a consensus-based set of questionnaires to help decision makers evaluate 1) prospective and 2) retrospective observational studies, 3) network meta- analysis (indirect treatment comparison), and 4) decision analytic modeling studies with greater uniformity and transparency [1,2]. The primary audiences of these questionnaires are assessors and reviewers of health care research studies for health technology assessment, drug formulary, and health care services decisions requiring varying levels of knowledge and expertise. This report focuses on the questionnaire to assess the relevance and credi- bility of network meta-analysis (including indirect treatment comparison). Systematic reviews of randomized controlled trials (RCTs) are considered a key summary of evidence for informing clinical practice guidelines, formulary management, and reimbursement policies. Many systematic reviews use meta-analysis to synthesize evidence from several RCTs addressing the same question [3]. Sound comprehensive decision making requires comparisons of all relevant competing interventions. Ideally, well-designed and conducted RCTs would simultaneously com- pare all interventions of interest. Such studies are almost never available, thereby complicating decision making [4–7]. New drugs are often compared with placebo or standard care, but not against each other, in trials aiming to contribute toward obtain- ing approval for drug licensing; there may be no commercial incentive to compare the new treatment with an active control treatment. Even if there was an incentive to incorporate compet- ing interventions in an RCT, the interventions of interest may vary by country or have changed over time because of new evidence and treatment insights. Finally, for some indications, the relatively large number of competing interventions makes a trial incorporating all of them impractical. In the absence of trials involving a direct comparison of treatments of interest, an indirect comparison can provide useful 1098-3015/$36.00 – see front matter Copyright & 2014, International Society for Pharmacoeconomics and Outcomes Research (ISPOR). Published by Elsevier Inc. http://dx.doi.org/10.1016/j.jval.2014.01.004 E-mail: [email protected]; [email protected]. * Address correspondence to: Jeroen Jansen, Redwood Outcomes, Boston, MA 02108. VALUE IN HEALTH 17 (2014) 157 – 173
Transcript of Indirect Treatment Comparison/Network Meta-Analysis … · · 2014-03-19Available online at...
Avai lable onl ine at www.sc iencedirect .com
journal homepage: www.elsevier .com/ locate / jva l
Indirect Treatment Comparison/Network Meta-Analysis StudyQuestionnaire to Assess Relevance and Credibility to InformHealth Care Decision Making: An ISPOR-AMCP-NPC GoodPractice Task Force ReportJeroen P. Jansen, PhD1,2,*, Thomas Trikalinos, MD, PhD3, Joseph C. Cappelleri, PhD, MS, MPH4,Jessica Daw, PharmD, MBA5, Sherry Andes, BSPharm, PharmD, BCPS, BCPP, PAHM6,Randa Eldessouki, MBBCH, MSc, MD7, Georgia Salanti, PhD8
1Redwood Outcomes, Boston, MA, USA; 2Tufts University School of Medicine, Boston, MA, USA; 3Program in Public Health, Center forEvidence-based Medicine, Brown University, Providence, RI, USA; 4Pfizer, Inc., New London, CT, USA; 5Clinical Pharmacy, UPMCHealth Plan, Pittsburgh, PA, USA; 6Catamaran, Louisville, KY, USA; 7Scientific & Health Policy Initiatives, ISPOR, Lawrenceville, NJ,USA; 8Department of Hygiene and Epidemiology, School of Medicine University Campus, University of Ioannina, Ioannina, Greece
A B S T R A C T
Despite the great realized or potential value of network meta-analysisof randomized controlled trial evidence to inform health care decisionmaking, many decision makers might not be familiar with thesetechniques. The Task Force developed a consensus-based 26-itemquestionnaire to help decision makers assess the relevance andcredibility of indirect treatment comparisons and network meta-analysis to help inform health care decision making. The relevancedomain of the questionnaire (4 questions) calls for assessments aboutthe applicability of network meta-analysis results to the setting ofinterest to the decision maker. The remaining 22 questions belong toan overall credibility domain and pertain to assessments aboutwhether the network meta-analysis results provide a valid answerto the question they are designed to answer by examining 1) the usedevidence base, 2) analysis methods, 3) reporting quality and
transparency, 4) interpretation of findings, and 5) conflicts of interest.The questionnaire aims to help readers of network meta-analysisopine about their confidence in the credibility and applicability of theresults of a network meta-analysis, and help make decision makersaware of the subtleties involved in the analysis of networks ofrandomized trial evidence. It is anticipated that user feedback willpermit periodic evaluation and modification of the questionnaire.Keywords: bias, checklist, credibility, decision making, indirectcomparisons, mixed treatment comparisons, multiple treatmentcomparison, network meta-analysis, questionnaire, relevance,validity.
Copyright & 2014, International Society for Pharmacoeconomics andOutcomes Research (ISPOR). Published by Elsevier Inc.
Introduction
Four Good Practices task forces developed a consensus-based setof questionnaires to help decision makers evaluate 1) prospectiveand 2) retrospective observational studies, 3) network meta-analysis (indirect treatment comparison), and 4) decision analyticmodeling studies with greater uniformity and transparency [1,2].The primary audiences of these questionnaires are assessors andreviewers of health care research studies for health technologyassessment, drug formulary, and health care services decisionsrequiring varying levels of knowledge and expertise. This reportfocuses on the questionnaire to assess the relevance and credi-bility of network meta-analysis (including indirect treatmentcomparison).
Systematic reviews of randomized controlled trials (RCTs) areconsidered a key summary of evidence for informing clinicalpractice guidelines, formulary management, and reimbursementpolicies. Many systematic reviews use meta-analysis to
synthesize evidence from several RCTs addressing the samequestion [3]. Sound comprehensive decision making requirescomparisons of all relevant competing interventions. Ideally,well-designed and conducted RCTs would simultaneously com-pare all interventions of interest. Such studies are almost neveravailable, thereby complicating decision making [4–7]. New drugsare often compared with placebo or standard care, but notagainst each other, in trials aiming to contribute toward obtain-ing approval for drug licensing; there may be no commercialincentive to compare the new treatment with an active controltreatment. Even if there was an incentive to incorporate compet-ing interventions in an RCT, the interventions of interest mayvary by country or have changed over time because of newevidence and treatment insights. Finally, for some indications,the relatively large number of competing interventions makes atrial incorporating all of them impractical.
In the absence of trials involving a direct comparison oftreatments of interest, an indirect comparison can provide useful
1098-3015/$36.00 – see front matter Copyright & 2014, International Society for Pharmacoeconomics and Outcomes Research (ISPOR).
Published by Elsevier Inc.
http://dx.doi.org/10.1016/j.jval.2014.01.004
E-mail: [email protected]; [email protected].* Address correspondence to: Jeroen Jansen, Redwood Outcomes, Boston, MA 02108.
V A L U E I N H E A L T H 1 7 ( 2 0 1 4 ) 1 5 7 – 1 7 3
evidence for the difference in treatment effects between com-peting interventions (which otherwise would be lacking) and forjudiciously selecting the best choice(s) of treatment. For example,we can indirectly compare two treatments, which have neverbeen compared against each other in an RCT, if each has beencompared against the same comparator [7–14].
Although it is often argued that indirect comparisons areneeded only when direct comparisons are not available, it isimportant to realize that to use all available evidence, one shouldcombine information from both direct and indirect comparisons.A collection of RCTs informing on several treatments constitutesa network of evidence, in which each RCT directly compares asubset, but not necessarily all, of treatments. Such a networkinvolving treatments compared directly, indirectly, or both can besynthesized by means of network meta-analysis [10–14]. In tradi-tional meta-analysis, all included studies compare the sameintervention with the same comparator. Network meta-analysisextends this concept by including multiple pairwise comparisonsacross a range of interventions and provides estimates of relativetreatment effects on multiple treatment comparisons for com-parative effectiveness purposes based on direct and/or indirectevidence. Even when results of the direct evidence are conclu-sive, combining them with results of similar indirect estimates ina mixed treatment comparison may yield a more precise esti-mate for the interventions directly compared [4,5,12]. When weuse the term “network meta-analysis” in this report, we includeindirect treatment comparisons as well.
Despite the great realized and potential value of networkmeta-analysis to inform health care decision making and itsincreasing acceptance (e.g., Canadian Agency for Drugs andTechnologies in Health, National Institute for Health and CareExcellence in the United Kingdom, Institute for Quality andEfficiency in Health Care in Germany, and Haute Autorité deSanté in France], it is not commonly used to inform health caredecisions, and many decision makers are not familiar with it.There is a critical need for education on network meta-analysis,as well as transparent and uniform ways to assess the quality ofreported network meta-analyses to help inform decision making.
In creating a questionnaire for health care decision makers toassess network meta-analyses, the Task Force was asked to worktoward two goals. The first was to provide a guide for gaugingone’s confidence in the findings of a network meta-analysis. Theaim was to create a questionnaire for use by individuals withunderstanding of principles of clinical research, but without
in-depth knowledge of design and statistics. The second goalwas for the questionnaire to have educational and instructionalvalue to prospective users of network meta-analyses. We antici-pate modifications to the structure, content, or wording of thequestionnaire based on the feedback, after it has been put to use.
Questionnaire Development
One issue in creating questionnaires for decision makers iswhether they should be linked to scorecards, annotated score-cards, or checklists. Concerns were raised by the Task Force thata scorecard with an accompanying scoring system may bemisleading; it may not have adequate validity and measurementproperties. Scoring systems may also provide users with a falsesense of precision and have been shown to be problematic in theinterpretation of randomized trials [15].
An alternative to a scorecard is a checklist. However, it wasdeemed by the Task Force that checklists might mislead users intheir assessments because a network meta-analysis may satisfyall the elements of a checklist and still harbor “fatal flaws” in themethods applied in the publication. Moreover, users might havethe tendency to count up the number of elements present,convert it into an implicit score, and then apply that implicitscoring to their overall assessment of the evidence. In addition,the applicability of a network meta-analysis may depend onevidence external to the meta-analysis and specific to the settingof interest. In general, a decision maker should be aware of thestrengths and weaknesses of each piece of information available(one of which is a network meta-analysis) and apply his or herown reasoning. Furthermore, a checklist format may underminethe educational potential of the questionnaire.
The Task Force decided to develop a questionnaire charac-terized by two principal concepts: relevance and credibility.Relevance is the extent to which results of a network meta-analysis, if trustworthy, apply to the setting of interest. Therelevance domain includes questions related to the population,comparators, end points, time frame, and other policy-relevantdifferences. Credibility is the extent to which the network meta-analysis provides valid answers to the question it is designed toanswer. To generate questions for the credibility domain, theTask Force relied on the expertise of its members and thescientific literature including the reports of the ISPOR Task Forceand other pertinent publications on indirect treatment
Background to the Task Force
On May 21, 2011, the Board of Directors approved, in principle,ISPOR’s participation with the Academy of Managed CarePharmacy (AMCP) and the National Pharmaceutical Council(NPC) in the Comparative Effectiveness Research CollaborativeInitiative (CER-CI) for advancing appropriate use of outcomesresearch evidence to improve patient health outcomes. ISPOR’scontribution to the CER-CI was to develop articles on how toassess prospective and retrospective observational studies,indirect treatment comparison (network meta-analysis), anddecision analytic modeling studies to inform health caredecision making. Good Practice task forces were created todevelop these articles. Task Force Chairs were identified fromleaders of ISPOR Good Research Practices task forces. Each TaskForce consisted of two members from the AMCP, the NPC, andthe ISPOR.
Each Task Force met independently via teleconference. Inaddition, the Task Force Chairs met via teleconferences andface-to-face meetings held on April 20, 2012 (San Francisco, CA,
USA), June 3, 2012 (Washington, DC, USA), June 28-29, 2012(Boston, MA, USA), November 4, 2012 (Berlin, Germany), andMay 21, 2013 (New Orleans, LA, USA), to coordinate a commonoutline and format for these articles. A focus group representingthe US formulary decision-making community (22 participants)was convened April 19, 2012, at the AMCP Meeting, SanFrancisco, CA, USA, for feedback on the draft outline, format,and content of the assessment articles. The content of thesereports was presented for comment at the ISPOR AnnualInternational Meetings held June 10, 2012, and May 22, 2013,and during the European Congress held November 5 and 6, 2012.
A draft indirect treatment/network meta-analysis Task Forcereport was sent for comment to the Task Force review group onAugust 5, 2013. Written comments were considered, and a finaldraft report was sent for comment to the ISPOR membership onSeptember 24, 2013. A total of 54 written comments werereceived. All written comments are published on the ISPORWebsite, which can be accessed via the Research menu on ISPOR’shome page: http://www.ispor.org. The final report was sub-mitted to Value in Health.
V A L U E I N H E A L T H 1 7 ( 2 0 1 4 ) 1 5 7 – 1 7 3158
comparisons and network meta-analysis [9–14]. Items and sug-gested wording were also informed by earlier or recent effortsthat provided guidance to evidence reviewers [16,17]. Questionsguiding the assessment of credibility were grouped into fivesubdomains: evidence base used for the indirect comparison ornetwork meta-analysis, analysis, reporting quality and trans-parency, interpretation, and conflict of interest.
The developed questionnaire has 26 questions guiding thereader in assessing the relevance (4 questions) and credibility (22questions) of a network meta-analysis. Each question can beanswered with “Yes,” “No,” and “Can’t Answer.” “Can’t Answer”can be used if the item is not reported in sufficient detail or at all,or if the assessor does not have sufficient training to answer thequestion. For one question (“Were statistical methods used thatpreserve within-study randomization? (No naive comparisons)”),a “No” will imply a fatal flaw. This fatal flaw suggests thatfindings can be misleading and that the decision maker shoulduse caution in applying the findings to inform decisions. How-ever, the occurrence of the fatal flaw neither prevents a user fromcompleting the questionnaire nor does it mandate that suchresults are deemed inappropriate for decision making.
On the basis of how questions are answered, the user wouldmake an overall judgment about each credibility subdomain. Adesignation of “Strength” implies confidence that the networkmeta-analysis was conducted well and without influential short-comings. A designation of “Neutral” suggests that potentiallyimportant concerns are raised, but the user deemed them unlikelyto affect their credibility, as applicable. A designation of “Weakness”suggests that the findings are likely to be biased and misleadingbecause of numerous or important shortcomings in the design orconduct of the meta-analysis. Finally, a designation of “Fatal flaw”
implies that the user believes that findings of the network meta-analysis are likely to be biased and conclusions misleading.
Following on, the user will consider the domain judgments toopine about the overall relevance and credibility of the networkmeta-analysis for decision making, as either “sufficient” or “insuffi-cient.”Wewould like to remind that the questionnaire is not a scoreor a checklist, in which one would count the frequency of eachdesignation to reach an overall judgment. We consider suchmechanistic approaches simplistic to say the least. The user willjudge whether and how to incorporate results from a network meta-analysis in the decision-making process, after considering all inputs.
Following internal testing by the Task Force members duringSeptember and October of 2012 and subsequent modification ofthe questionnaire, the revised questionnaire was further testedby volunteers not involved in its development. Each volunteerwas asked to evaluate three published network meta-analysiswith the questionnaires being developed during April and May of2013. Based on the feedback received, the current version of thequestionnaire was found helpful in assisting users systematicallyopine about the relevance and credibility of network meta-analysis studies to their setting of interest. The questionnaire isprovided in Appendix 1 in Supplemental Materials found athttp://dx.doi.org/10.1016/j.jval.2014.01.004.
Questionnaire Items
This section provides detailed information to facilitate answeringthe 26 questions. A glossary is provided in Appendix 2 inSupplemental Materials found at http://dx.doi.org/10.1016/j.jval.2014.01.004.
Relevance
Relevance addresses the extent to which the results of the networkmeta-analysis apply to the setting of interest to the decision
maker. A relative term, relevance has to be determined by eachdecision maker and the respective judgment determined by onedecisionmaker will not necessarily apply to other decisionmakers.
1. Is the population relevant?This question addresses whether the populations of the RCTsthat form the basis for the network meta-analysis sufficientlymatch the population of interest to the decision maker (i.e., thereis no clinical reason to assume that the relative treatment effectsobtained with the network meta-analysis would not translate tothe population of interest to the decision maker). Relevantpopulation characteristics are not only limited to the specificdisease of interest but also pertinent to disease stage, severity,comorbidities, treatment history, race, age, sex, and possiblyother demographic characteristics. Typically, RCTs included inthe network analysis are identified by means of a systematicliterature search with the relevant studies in terms of populationpredefined by study selection criteria. If these criteria arereported, this is a good starting point to judge relevance in termsof population. Evidence tables with inclusion criteria and base-line patient characteristics for each study provide the mostrelevant information to judge population relevance; exclusioncriteria are also noteworthy. For example, if a decision involvescovering a Medicare Part D population (e.g., those aged 65 years orolder), studies with few patients at or above 65 years of age maybe less relevant.
2. Are any relevant interventions missing?This question gets at whether the intervention(s) included in thenetwork meta-analysis matches the one(s) of interest to thedecision maker and whether all relevant comparators have beenconsidered. Depending on the included RCTs, the network meta-analysis may include additional interventions not necessarily ofinterest for the decision maker. This does not, however, com-promise relevance. Aspects to consider when judging the rele-vance of included biopharmaceuticals are dose and schedule of adrug, mode of administration, and background treatment. Aquestion whether the drug is used as induction or maintenancetreatment can be of relevance as well. For other medical tech-nologies, one can consider whether the procedure or technique inthe trials is the same as the procedure or technique of interest tothe decision maker.
3. Are any relevant outcomes missing?This question asks what outcomes are assessed in the networkmeta-analysis and whether the outcomes are meaningful to thedecision maker. There has been increasing emphasis on out-comes that are directly meaningful to the patient or the healthsystem such as cardiovascular events (e.g., myocardial infarctionand stroke) or patient functioning or health-related quality of life(e.g., short-form 36 health survey and EuroQol five-dimensionalquestionnaire) and decreasing emphasis on surrogate outcomes(e.g., cholesterol levels) unless validated. Other considerationsinclude the feasibility of measuring relevant (i.e., final) outcomes,the predictive relationship between surrogate outcomes and finaloutcomes, and what kind of evidence will be considered “good-enough,” given the patient population, the burden of the con-dition, and the availability of alternative treatments (along withthe evidence supporting those treatments). Not only are theoutcomes themselves of interest, the timing of their assessmentis of interest as well. For example, a network meta-analysis thatincluded RCTs with a longer follow-up may be more relevant tohelp inform treatment decisions for a chronic disease than anetwork meta-analysis limited to studies with a short follow-up(if follow-up is related to treatment effect).
V A L U E I N H E A L T H 1 7 ( 2 0 1 4 ) 1 5 7 – 1 7 3 159
4. Is the context (settings and circumstances) applicable?This question addresses whether there are any differences betweenthe RCTs included in the network meta-analysis versus the settingand circumstances the decision maker is interested in. Thesesituations may not necessarily concern the population, interven-tions, and outcomes but may still render the findings not appli-cable. For example, the year when the studies included in thenetwork meta-analysis were performed can be of interest whenbackground medical care of a certain disease has dramaticallychanged over time as when the standard treatment changes overtime. Many of the RCTs underlying network meta-analyses compar-ing biopharmaceuticals are often designed for efficacy (can it work?)purposes and therefore the setting or circumstances may be differ-ent from the real-world intent (does it work?). A relevant questionto ask, therefore, is whether the relative treatment effects and theirrank ordering of interventions as obtained with the network meta-analysis would still hold if real-world compliance or adherencewould have been taken into consideration. The answer might be“no” if some of the interventions are associated with a much lowercompliance in the real-world setting than other interventions.
Credibility
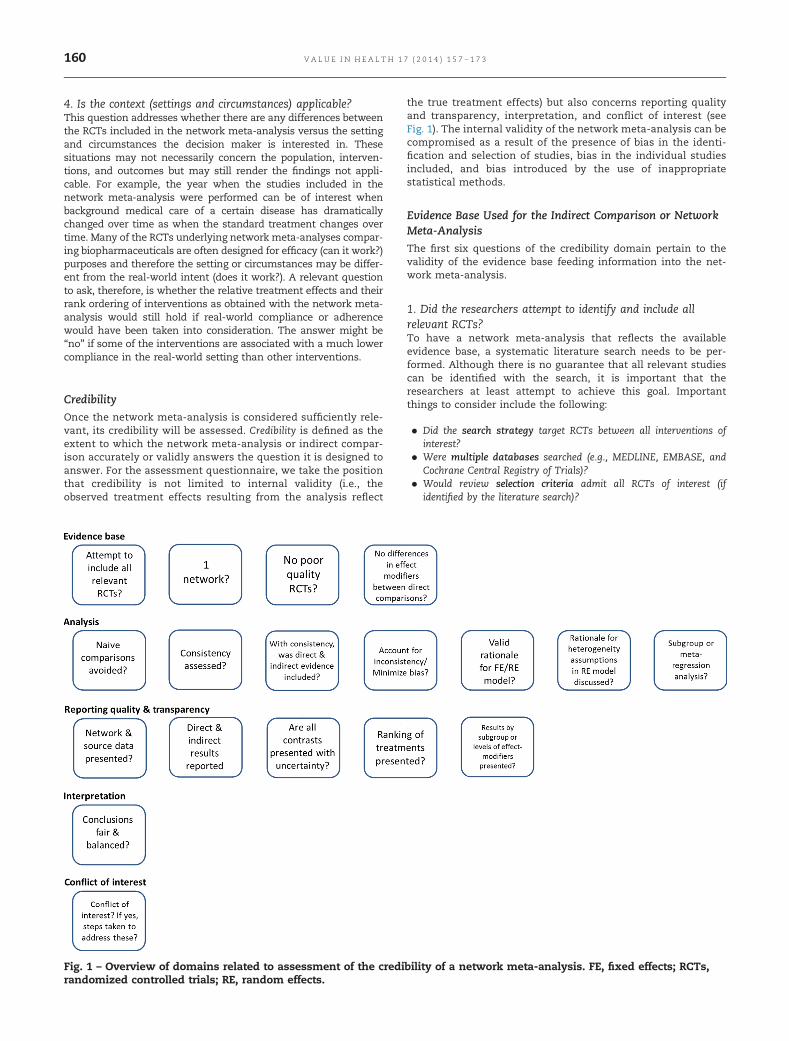
Once the network meta-analysis is considered sufficiently rele-vant, its credibility will be assessed. Credibility is defined as theextent to which the network meta-analysis or indirect compar-ison accurately or validly answers the question it is designed toanswer. For the assessment questionnaire, we take the positionthat credibility is not limited to internal validity (i.e., theobserved treatment effects resulting from the analysis reflect
the true treatment effects) but also concerns reporting qualityand transparency, interpretation, and conflict of interest (seeFig. 1). The internal validity of the network meta-analysis can becompromised as a result of the presence of bias in the identi-fication and selection of studies, bias in the individual studiesincluded, and bias introduced by the use of inappropriatestatistical methods.
Evidence Base Used for the Indirect Comparison or NetworkMeta-Analysis
The first six questions of the credibility domain pertain to thevalidity of the evidence base feeding information into the net-work meta-analysis.
1. Did the researchers attempt to identify and include allrelevant RCTs?To have a network meta-analysis that reflects the availableevidence base, a systematic literature search needs to be per-formed. Although there is no guarantee that all relevant studiescan be identified with the search, it is important that theresearchers at least attempt to achieve this goal. Importantthings to consider include the following:
� Did the search strategy target RCTs between all interventions ofinterest?
� Were multiple databases searched (e.g., MEDLINE, EMBASE, andCochrane Central Registry of Trials)?
� Would review selection criteria admit all RCTs of interest (ifidentified by the literature search)?
Fig. 1 – Overview of domains related to assessment of the credibility of a network meta-analysis. FE, fixed effects; RCTs,randomized controlled trials; RE, random effects.
V A L U E I N H E A L T H 1 7 ( 2 0 1 4 ) 1 5 7 – 1 7 3160
A “yes” to the above inquiries probably implies a good effort to in-clude all available relevant published RCTs (of course one would haveto review the syntax of the actual search strategies to authoritativelydiscuss their adequacy). An additional step to identify missing orunpublished key studies would be to search clinical trial databases,such as http://dx.doi.org/clinicaltrials.gov. Systematic reviews thatfollow the Preferred Reporting Items for Systematic Reviews andMeta-Analyses reporting guidelines are easier to assess [18].
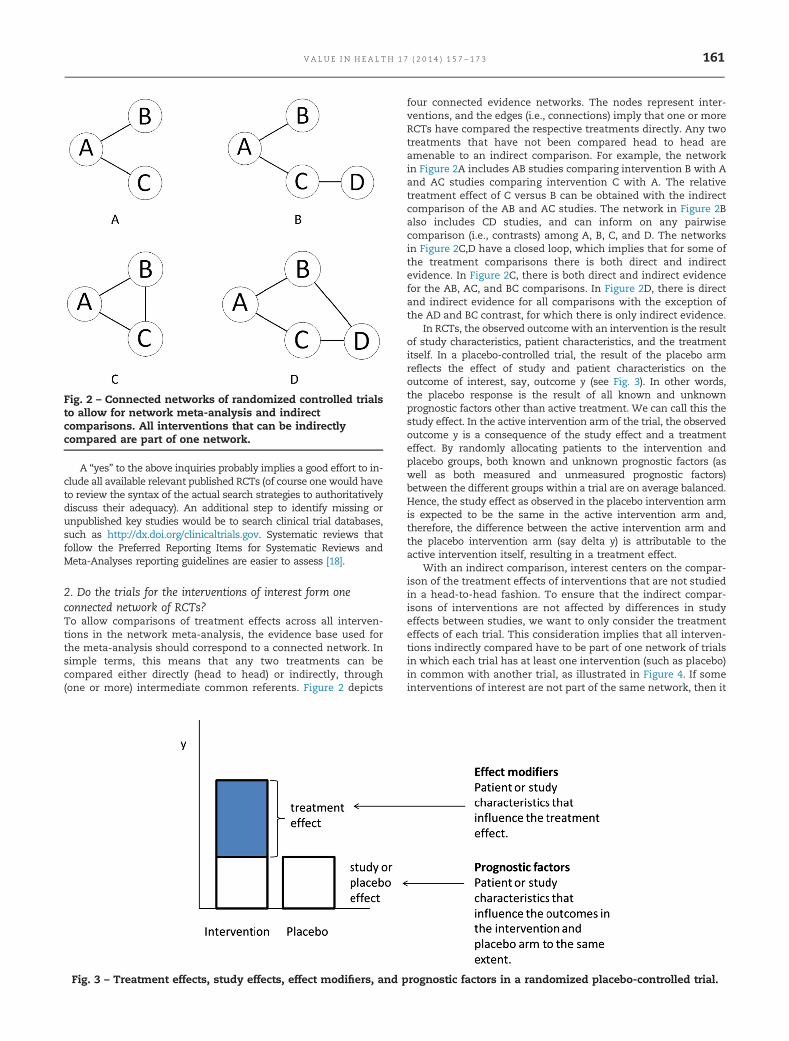
2. Do the trials for the interventions of interest form oneconnected network of RCTs?To allow comparisons of treatment effects across all interven-tions in the network meta-analysis, the evidence base used forthe meta-analysis should correspond to a connected network. Insimple terms, this means that any two treatments can becompared either directly (head to head) or indirectly, through(one or more) intermediate common referents. Figure 2 depicts
four connected evidence networks. The nodes represent inter-ventions, and the edges (i.e., connections) imply that one or moreRCTs have compared the respective treatments directly. Any twotreatments that have not been compared head to head areamenable to an indirect comparison. For example, the networkin Figure 2A includes AB studies comparing intervention B with Aand AC studies comparing intervention C with A. The relativetreatment effect of C versus B can be obtained with the indirectcomparison of the AB and AC studies. The network in Figure 2Balso includes CD studies, and can inform on any pairwisecomparison (i.e., contrasts) among A, B, C, and D. The networksin Figure 2C,D have a closed loop, which implies that for some ofthe treatment comparisons there is both direct and indirectevidence. In Figure 2C, there is both direct and indirect evidencefor the AB, AC, and BC comparisons. In Figure 2D, there is directand indirect evidence for all comparisons with the exception ofthe AD and BC contrast, for which there is only indirect evidence.
In RCTs, the observed outcome with an intervention is the resultof study characteristics, patient characteristics, and the treatmentitself. In a placebo-controlled trial, the result of the placebo armreflects the effect of study and patient characteristics on theoutcome of interest, say, outcome y (see Fig. 3). In other words,the placebo response is the result of all known and unknownprognostic factors other than active treatment. We can call this thestudy effect. In the active intervention arm of the trial, the observedoutcome y is a consequence of the study effect and a treatmenteffect. By randomly allocating patients to the intervention andplacebo groups, both known and unknown prognostic factors (aswell as both measured and unmeasured prognostic factors)between the different groups within a trial are on average balanced.Hence, the study effect as observed in the placebo intervention armis expected to be the same in the active intervention arm and,therefore, the difference between the active intervention arm andthe placebo intervention arm (say delta y) is attributable to theactive intervention itself, resulting in a treatment effect.
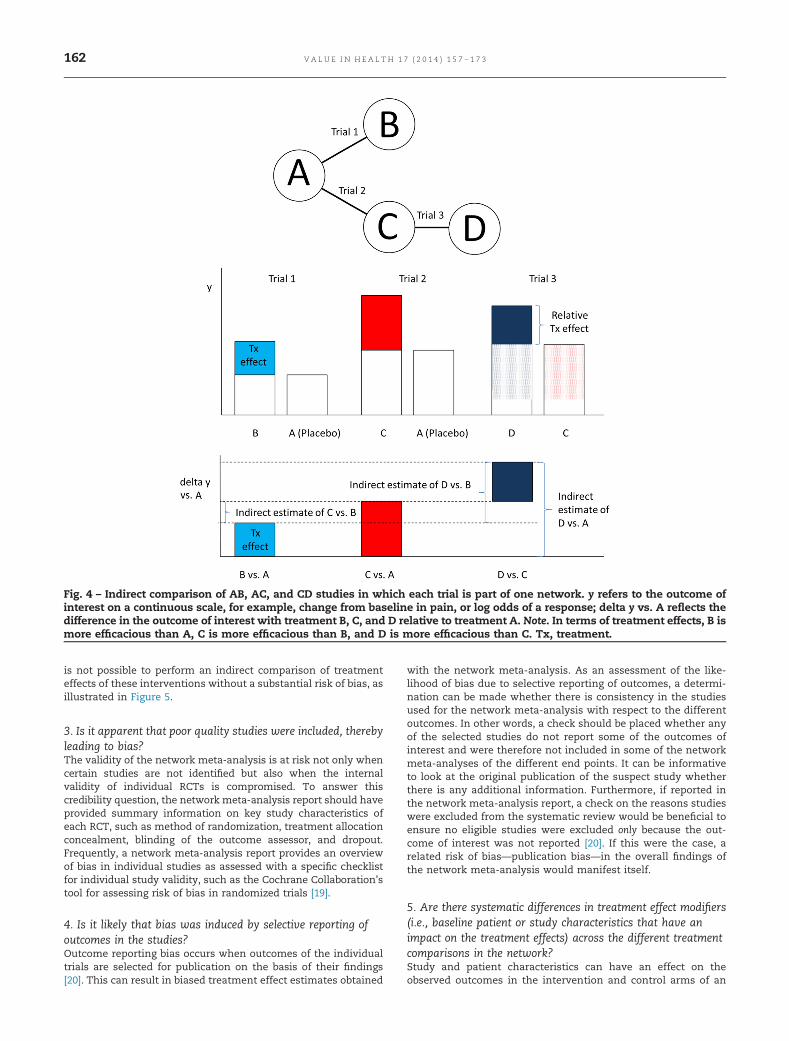
With an indirect comparison, interest centers on the compar-ison of the treatment effects of interventions that are not studiedin a head-to-head fashion. To ensure that the indirect compar-isons of interventions are not affected by differences in studyeffects between studies, we want to only consider the treatmenteffects of each trial. This consideration implies that all interven-tions indirectly compared have to be part of one network of trialsin which each trial has at least one intervention (such as placebo)in common with another trial, as illustrated in Figure 4. If someinterventions of interest are not part of the same network, then it
Fig. 2 – Connected networks of randomized controlled trialsto allow for network meta-analysis and indirectcomparisons. All interventions that can be indirectlycompared are part of one network.
Fig. 3 – Treatment effects, study effects, effect modifiers, and prognostic factors in a randomized placebo-controlled trial.
V A L U E I N H E A L T H 1 7 ( 2 0 1 4 ) 1 5 7 – 1 7 3 161
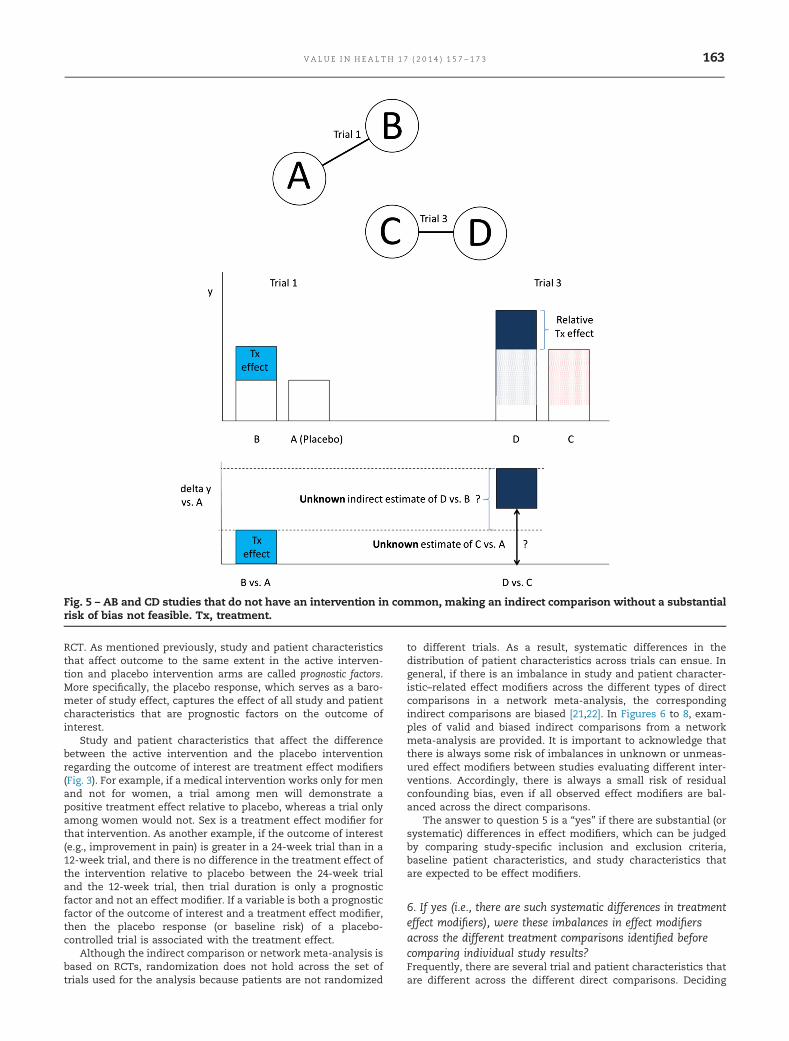
is not possible to perform an indirect comparison of treatmenteffects of these interventions without a substantial risk of bias, asillustrated in Figure 5.
3. Is it apparent that poor quality studies were included, therebyleading to bias?The validity of the network meta-analysis is at risk not only whencertain studies are not identified but also when the internalvalidity of individual RCTs is compromised. To answer thiscredibility question, the network meta-analysis report should haveprovided summary information on key study characteristics ofeach RCT, such as method of randomization, treatment allocationconcealment, blinding of the outcome assessor, and dropout.Frequently, a network meta-analysis report provides an overviewof bias in individual studies as assessed with a specific checklistfor individual study validity, such as the Cochrane Collaboration’stool for assessing risk of bias in randomized trials [19].
4. Is it likely that bias was induced by selective reporting ofoutcomes in the studies?Outcome reporting bias occurs when outcomes of the individualtrials are selected for publication on the basis of their findings[20]. This can result in biased treatment effect estimates obtained
with the network meta-analysis. As an assessment of the like-lihood of bias due to selective reporting of outcomes, a determi-nation can be made whether there is consistency in the studiesused for the network meta-analysis with respect to the differentoutcomes. In other words, a check should be placed whether anyof the selected studies do not report some of the outcomes ofinterest and were therefore not included in some of the networkmeta-analyses of the different end points. It can be informativeto look at the original publication of the suspect study whetherthere is any additional information. Furthermore, if reported inthe network meta-analysis report, a check on the reasons studieswere excluded from the systematic review would be beneficial toensure no eligible studies were excluded only because the out-come of interest was not reported [20]. If this were the case, arelated risk of bias—publication bias—in the overall findings ofthe network meta-analysis would manifest itself.
5. Are there systematic differences in treatment effect modifiers(i.e., baseline patient or study characteristics that have animpact on the treatment effects) across the different treatmentcomparisons in the network?Study and patient characteristics can have an effect on theobserved outcomes in the intervention and control arms of an
Fig. 4 – Indirect comparison of AB, AC, and CD studies in which each trial is part of one network. y refers to the outcome ofinterest on a continuous scale, for example, change from baseline in pain, or log odds of a response; delta y vs. A reflects thedifference in the outcome of interest with treatment B, C, and D relative to treatment A. Note. In terms of treatment effects, B ismore efficacious than A, C is more efficacious than B, and D is more efficacious than C. Tx, treatment.
V A L U E I N H E A L T H 1 7 ( 2 0 1 4 ) 1 5 7 – 1 7 3162
RCT. As mentioned previously, study and patient characteristicsthat affect outcome to the same extent in the active interven-tion and placebo intervention arms are called prognostic factors.More specifically, the placebo response, which serves as a baro-meter of study effect, captures the effect of all study and patientcharacteristics that are prognostic factors on the outcome ofinterest.
Study and patient characteristics that affect the differencebetween the active intervention and the placebo interventionregarding the outcome of interest are treatment effect modifiers(Fig. 3). For example, if a medical intervention works only for menand not for women, a trial among men will demonstrate apositive treatment effect relative to placebo, whereas a trial onlyamong women would not. Sex is a treatment effect modifier forthat intervention. As another example, if the outcome of interest(e.g., improvement in pain) is greater in a 24-week trial than in a12-week trial, and there is no difference in the treatment effect ofthe intervention relative to placebo between the 24-week trialand the 12-week trial, then trial duration is only a prognosticfactor and not an effect modifier. If a variable is both a prognosticfactor of the outcome of interest and a treatment effect modifier,then the placebo response (or baseline risk) of a placebo-controlled trial is associated with the treatment effect.
Although the indirect comparison or network meta-analysis isbased on RCTs, randomization does not hold across the set oftrials used for the analysis because patients are not randomized
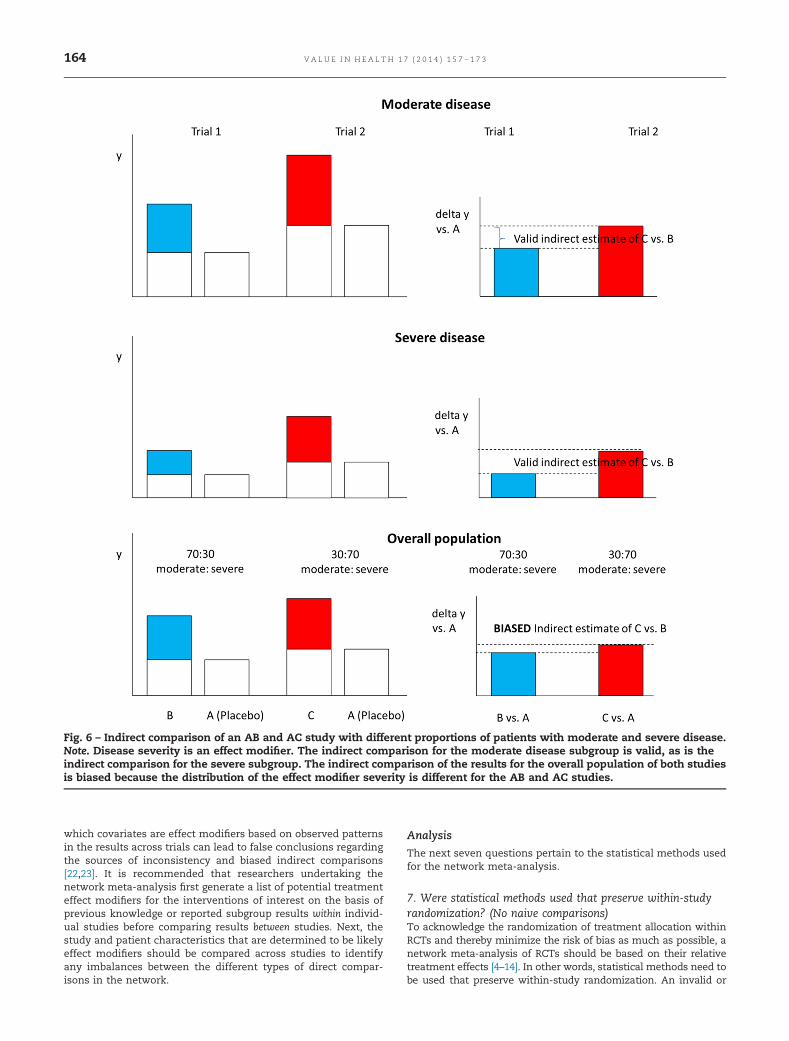
to different trials. As a result, systematic differences in thedistribution of patient characteristics across trials can ensue. Ingeneral, if there is an imbalance in study and patient character-istic–related effect modifiers across the different types of directcomparisons in a network meta-analysis, the correspondingindirect comparisons are biased [21,22]. In Figures 6 to 8, exam-ples of valid and biased indirect comparisons from a networkmeta-analysis are provided. It is important to acknowledge thatthere is always some risk of imbalances in unknown or unmeas-ured effect modifiers between studies evaluating different inter-ventions. Accordingly, there is always a small risk of residualconfounding bias, even if all observed effect modifiers are bal-anced across the direct comparisons.
The answer to question 5 is a “yes” if there are substantial (orsystematic) differences in effect modifiers, which can be judgedby comparing study-specific inclusion and exclusion criteria,baseline patient characteristics, and study characteristics thatare expected to be effect modifiers.
6. If yes (i.e., there are such systematic differences in treatmenteffect modifiers), were these imbalances in effect modifiersacross the different treatment comparisons identified beforecomparing individual study results?Frequently, there are several trial and patient characteristics thatare different across the different direct comparisons. Deciding
Fig. 5 – AB and CD studies that do not have an intervention in common, making an indirect comparison without a substantialrisk of bias not feasible. Tx, treatment.
V A L U E I N H E A L T H 1 7 ( 2 0 1 4 ) 1 5 7 – 1 7 3 163
which covariates are effect modifiers based on observed patternsin the results across trials can lead to false conclusions regardingthe sources of inconsistency and biased indirect comparisons[22,23]. It is recommended that researchers undertaking thenetwork meta-analysis first generate a list of potential treatmenteffect modifiers for the interventions of interest on the basis ofprevious knowledge or reported subgroup results within individ-ual studies before comparing results between studies. Next, thestudy and patient characteristics that are determined to be likelyeffect modifiers should be compared across studies to identifyany imbalances between the different types of direct compar-isons in the network.
Analysis
The next seven questions pertain to the statistical methods usedfor the network meta-analysis.
7. Were statistical methods used that preserve within-studyrandomization? (No naive comparisons)To acknowledge the randomization of treatment allocation withinRCTs and thereby minimize the risk of bias as much as possible, anetwork meta-analysis of RCTs should be based on their relativetreatment effects [4–14]. In other words, statistical methods need tobe used that preserve within-study randomization. An invalid or
Fig. 6 – Indirect comparison of an AB and AC study with different proportions of patients with moderate and severe disease.Note. Disease severity is an effect modifier. The indirect comparison for the moderate disease subgroup is valid, as is theindirect comparison for the severe subgroup. The indirect comparison of the results for the overall population of both studiesis biased because the distribution of the effect modifier severity is different for the AB and AC studies.
V A L U E I N H E A L T H 1 7 ( 2 0 1 4 ) 1 5 7 – 1 7 3164
naive indirect comparison of RCTs that does not preserve random-ization is presented in Figure 9. The naive indirect comparison doesnot take any differences in study effects (as represented with thewhite boxes representing placebo) across trials into account. WithRCTs available that are part of one evidence network, the naiveindirect comparison can be considered a fatal flaw.
8. If both direct and indirect comparisons are available forpairwise contrasts (i.e., closed loops), was agreement intreatment effects (i.e., consistency) evaluated or discussed?If a network has a closed loop, there is both direct evidence andindirect evidence for some treatment contrasts (Fig. 10). For
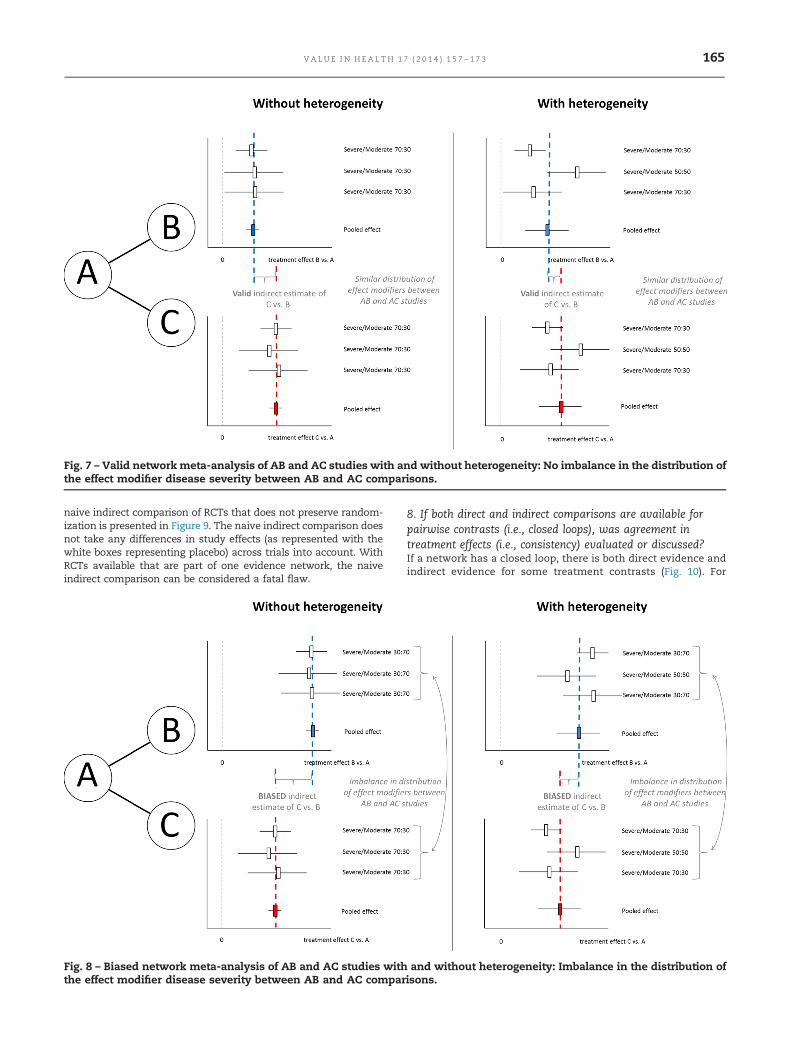
Fig. 7 – Valid network meta-analysis of AB and AC studies with and without heterogeneity: No imbalance in the distribution ofthe effect modifier disease severity between AB and AC comparisons.
Fig. 8 – Biased network meta-analysis of AB and AC studies with and without heterogeneity: Imbalance in the distribution ofthe effect modifier disease severity between AB and AC comparisons.
V A L U E I N H E A L T H 1 7 ( 2 0 1 4 ) 1 5 7 – 1 7 3 165

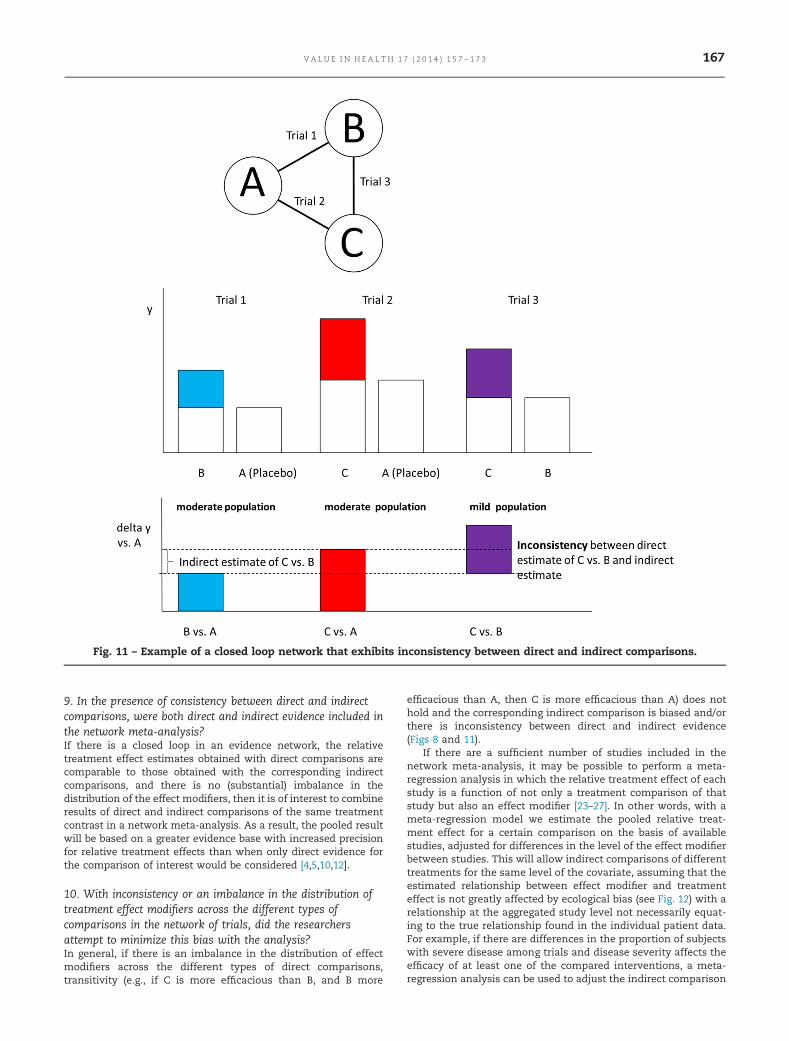
example, in an ABC network that consists of AB trials, AC trials,and BC trials, direct evidence for the BC contrast is provided bythe BC trials and indirect evidence for the BC contrast is providedby the indirect comparison of AC and AB trials. If there are nosystematic differences in treatment effect modifiers across thedifferent direct comparisons that form the loop, then there will beno systematic differences in the direct and indirect estimate foreach of the contrasts that are part of the loop [4,10,22]. Combiningdirect estimates with indirect estimates is valid, and the pooled(i.e., mixed) result will reflect a greater evidence base and onewith increased precision regarding relative treatment effects.However, if there are systematic differences in effect modifiersacross the different direct comparisons of the network loop, thedirect estimates will be different from the corresponding indirectestimates and combining these may be inappropriate (Fig. 11).Hence, it is important that in the presence of a closed loop anydirect comparisons are compared with the corresponding indirectcomparisons regarding effects size or distribution of treatmenteffect modifiers. However, statistical tests for inconsistencyshould not be overinterpreted and should include knowledge ofthe clinical area.
Fig. 9 – Naive indirect comparison that is invalid becausedifferences in study effects are not acknowledged. Note. Inthis example, the difference in the treatment effect of Cversus B is overestimated. Tx, treatment.
Fig. 10 – Example of a closed loop network that exhibits consistency between direct and indirect comparisons.
V A L U E I N H E A L T H 1 7 ( 2 0 1 4 ) 1 5 7 – 1 7 3166
9. In the presence of consistency between direct and indirectcomparisons, were both direct and indirect evidence included inthe network meta-analysis?If there is a closed loop in an evidence network, the relativetreatment effect estimates obtained with direct comparisons arecomparable to those obtained with the corresponding indirectcomparisons, and there is no (substantial) imbalance in thedistribution of the effect modifiers, then it is of interest to combineresults of direct and indirect comparisons of the same treatmentcontrast in a network meta-analysis. As a result, the pooled resultwill be based on a greater evidence base with increased precisionfor relative treatment effects than when only direct evidence forthe comparison of interest would be considered [4,5,10,12].
10. With inconsistency or an imbalance in the distribution oftreatment effect modifiers across the different types ofcomparisons in the network of trials, did the researchersattempt to minimize this bias with the analysis?In general, if there is an imbalance in the distribution of effectmodifiers across the different types of direct comparisons,transitivity (e.g., if C is more efficacious than B, and B more
efficacious than A, then C is more efficacious than A) does nothold and the corresponding indirect comparison is biased and/orthere is inconsistency between direct and indirect evidence(Figs 8 and 11).
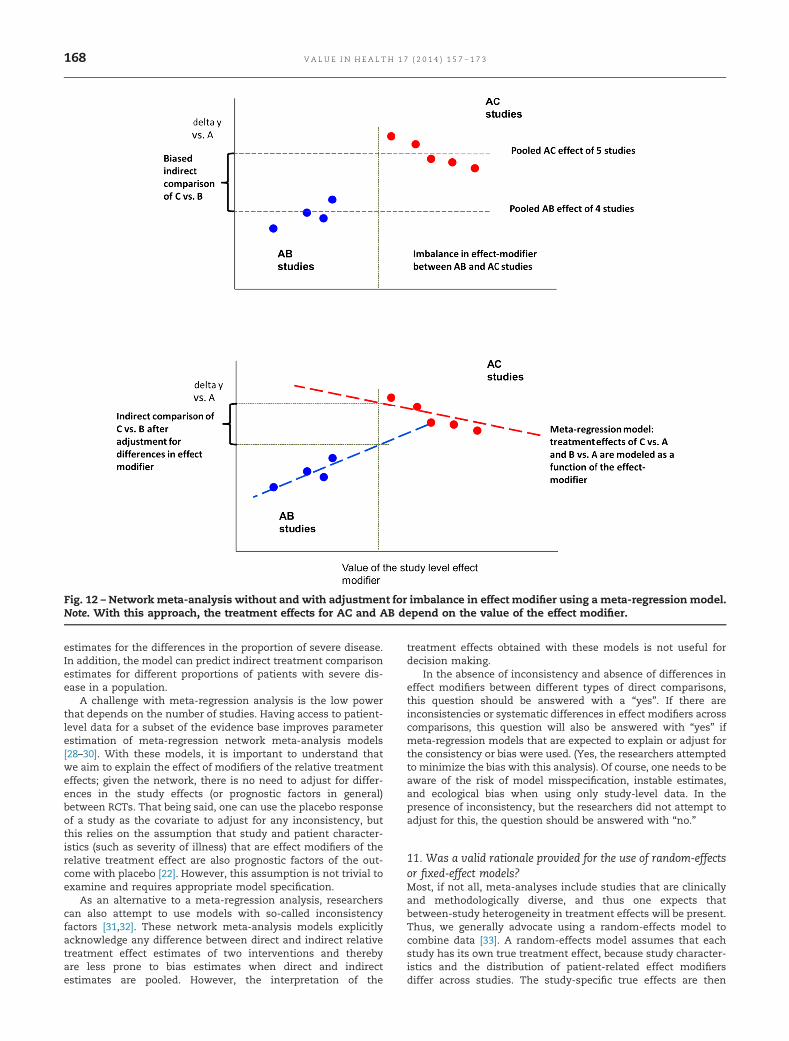
If there are a sufficient number of studies included in thenetwork meta-analysis, it may be possible to perform a meta-regression analysis in which the relative treatment effect of eachstudy is a function of not only a treatment comparison of thatstudy but also an effect modifier [23–27]. In other words, with ameta-regression model we estimate the pooled relative treat-ment effect for a certain comparison on the basis of availablestudies, adjusted for differences in the level of the effect modifierbetween studies. This will allow indirect comparisons of differenttreatments for the same level of the covariate, assuming that theestimated relationship between effect modifier and treatmenteffect is not greatly affected by ecological bias (see Fig. 12) with arelationship at the aggregated study level not necessarily equat-ing to the true relationship found in the individual patient data.For example, if there are differences in the proportion of subjectswith severe disease among trials and disease severity affects theefficacy of at least one of the compared interventions, a meta-regression analysis can be used to adjust the indirect comparison
Fig. 11 – Example of a closed loop network that exhibits inconsistency between direct and indirect comparisons.
V A L U E I N H E A L T H 1 7 ( 2 0 1 4 ) 1 5 7 – 1 7 3 167
estimates for the differences in the proportion of severe disease.In addition, the model can predict indirect treatment comparisonestimates for different proportions of patients with severe dis-ease in a population.
A challenge with meta-regression analysis is the low powerthat depends on the number of studies. Having access to patient-level data for a subset of the evidence base improves parameterestimation of meta-regression network meta-analysis models[28–30]. With these models, it is important to understand thatwe aim to explain the effect of modifiers of the relative treatmenteffects; given the network, there is no need to adjust for differ-ences in the study effects (or prognostic factors in general)between RCTs. That being said, one can use the placebo responseof a study as the covariate to adjust for any inconsistency, butthis relies on the assumption that study and patient character-istics (such as severity of illness) that are effect modifiers of therelative treatment effect are also prognostic factors of the out-come with placebo [22]. However, this assumption is not trivial toexamine and requires appropriate model specification.
As an alternative to a meta-regression analysis, researcherscan also attempt to use models with so-called inconsistencyfactors [31,32]. These network meta-analysis models explicitlyacknowledge any difference between direct and indirect relativetreatment effect estimates of two interventions and therebyare less prone to bias estimates when direct and indirectestimates are pooled. However, the interpretation of the
treatment effects obtained with these models is not useful fordecision making.
In the absence of inconsistency and absence of differences ineffect modifiers between different types of direct comparisons,this question should be answered with a “yes”. If there areinconsistencies or systematic differences in effect modifiers acrosscomparisons, this question will also be answered with “yes” ifmeta-regression models that are expected to explain or adjust forthe consistency or bias were used. (Yes, the researchers attemptedto minimize the bias with this analysis). Of course, one needs to beaware of the risk of model misspecification, instable estimates,and ecological bias when using only study-level data. In thepresence of inconsistency, but the researchers did not attempt toadjust for this, the question should be answered with “no.”
11. Was a valid rationale provided for the use of random-effectsor fixed-effect models?Most, if not all, meta-analyses include studies that are clinicallyand methodologically diverse, and thus one expects thatbetween-study heterogeneity in treatment effects will be present.Thus, we generally advocate using a random-effects model tocombine data [33]. A random-effects model assumes that eachstudy has its own true treatment effect, because study character-istics and the distribution of patient-related effect modifiersdiffer across studies. The study-specific true effects are then
Fig. 12 – Network meta-analysis without and with adjustment for imbalance in effect modifier using a meta-regression model.Note. With this approach, the treatment effects for AC and AB depend on the value of the effect modifier.
V A L U E I N H E A L T H 1 7 ( 2 0 1 4 ) 1 5 7 – 1 7 3168
assumed to follow a distribution around an overall mean (themeta-analysis mean), and with a variance (between-study heter-ogeneity) that reflects how different the true treatment effectsare between them. Especially for the network meta-analysis case,several random-effect model variants have been proposed. Incontrast, a fixed-effect (equal-effect) model assumes that the truetreatment effect is common in all studies comparing the sametreatments. This implies that there are no effect modifiers, orthat they have the same distribution across all studies in themeta-analysis. The plausibility of model assumptions shouldguide model choice, and, in general, we deem that the assump-tions of random-effects models are much more plausible than offixed-effect models.
Often, model fit criteria are invoked for choosing betweenmodels, where the model with the better trade-off between fit andparsimony (the fixed-effect model being the most parsimonious)is preferred. However, model fit is not a proxy for the plausibilityof model assumptions. Model fit criteria have a role in choosingbetween variants of random-effects models, but even in thesecases they represent an operationalization. Solely relying on astatistical test for homogeneity to argue the use of the fixed-effectmodel instead of the random-effects model cannot be consideredsufficient, either.
An argument for the use of a fixed-effect model instead of arandom-effects model should include a judgment about thesimilarity of studies according to important effect modifiers andthe prior belief, based on experience with the relevant clinicalfield, that the intervention is likely to have a fixed relative effectirrespective of the populations studied.
If it is technically not feasible to estimate the heterogeneityparameter of a random-effects model, which is, for example, thecase in a star-shaped evidence network with only one study foreach direct comparison, one may have used a fixed-effect model.However, it is important that the effect of ignoring heterogeneityon the findings is acknowledged. In such a situation, it is arguablystill preferable to use a random-effects model and make assump-tions about the extent of heterogeneity (i.e., assuming a value forthe heterogeneity parameter).
12. If a random-effects model was used, were assumptionsabout heterogeneity explored or discussed?With random-effects models, the between-study variation intreatment effects for the direct comparisons is explicitly takeninto consideration. In a network meta-analysis, variants of therandom-effects model exist. Two common variants differ in theirassumptions about between-study heterogeneity for each com-parison among treatments. One assumes that between-studyheterogeneity is the same for all comparisons, and anotherallows between-study heterogeneity to differ by comparison.Exploration or, at least, a discussion of the choice betweenrandom-effects variants is desirable.
This question is not applicable if the network meta-analysisused a fixed-effect model.
13. If there are indications of heterogeneity, were subgroupanalyses or meta-regression analysis with prespecifiedcovariates performed?Heterogeneity in relative treatment effects (i.e., true variation inrelative treatment effects across studies comparing the sameinterventions) can be captured with random-effects models, butthe analysis will provide the average relative treatment effectacross the different levels of the responsible effect modifier(s).This finding may not be very informative for decision making,especially if there are great differences in relative treatmenteffects for the different levels of the effect modifiers [33]. It is
more informative to estimate relative treatment effects for thedifferent levels of the effect modifier, either with subgroupanalysis or with a meta-regression analyses in which treatmenteffects are modeled as a function of the covariate, as illustrated inFigure 12.
Often there are a limited number of trials in a networkmeta-analysis, but many trial and patient characteristics maybe different across studies. Deciding which covariates to includein the meta-regression models used for the network meta-analysis based on observed patterns in the data of the trialscan lead to false conclusions regarding the sources of hetero-geneity [23,24]. To avoid data dredging, it is strongly recom-mended to prespecify the potential treatment effect modifiersthat will be investigated.
This question is not applicable if the network meta-analysisused a fixed-effect model or if there was no indication ofbetween-study heterogeneity.
Reporting Quality and Transparency
The next six questions pertain to the transparency in thepresentation of the evidence base and the results of the networkmeta-analysis. With a sufficiently transparent presentation, thecredibility of the findings given the available studies can beaccurately assessed and, if desired, replicated.
14. Is a graphical or tabular representation of the evidencenetwork provided with information on the number of RCTs perdirect comparisonTo help understand the findings of a network meta-analysis, anoverview of the included RCTs is required. The evidence base canbe summarized with an evidence network in which the availabledirect comparisons are reflected with edges (i.e., connections)between the different interventions along with the number ofRCTs per direct comparison. It is recommended that any trial thatcompares more than two interventions (i.e., more than two arms)is highlighted. With such a network, it is immediately clear forwhich treatment contrasts there is direct evidence, indirectevidence, or both [34]. A table in which studies are presented inthe rows, the interventions in the columns, and observed resultswith each intervention of each study in the cells can proveinformative as well.
15. Are the individual study results reported?To assess the (face) validity of the results of the network meta-analysis, the individual study results need to be provided,either in the publication or in an online supplement. Morespecifically, presentation of the individual study results allowsreviewers to compare these with the results of the networkmeta-analysis. It will also facilitate replication of the analysis,if desired.
16. Are results of direct comparisons reported separately fromresults of the indirect comparisons or network meta-analysis?To judge whether the assumption of consistency between directand indirect evidence holds, estimates of (pooled) direct compar-isons can be compared with estimates obtained from the corre-sponding indirect comparisons [32]. However, this is not a trivialtask. A more pragmatic approach is to present (pooled) directevidence separately from results of the network meta-analysis inwhich direct and indirect evidence for some comparisons (i.e.,presence of closed loops) are combined. Although the absence ofa difference between these two sets of results does not guaranteethere is no inconsistency, the opposite does hold: If the resultsbased on direct evidence are systematically different from resultsbased on the combination of direct and indirect evidence, then
V A L U E I N H E A L T H 1 7 ( 2 0 1 4 ) 1 5 7 – 1 7 3 169
the indirect evidence has to be inconsistent with the directevidence.
17. Are all pairwise contrasts between interventions as obtainedwith the network meta-analysis reported along with measuresof uncertainty?With a network meta-analysis, relative treatment effect esti-mates between all the interventions included in the analysiscan be obtained. For decision making it is very informative whenall these possible contrasts are presented. Equally important, forevery relative treatment effect that is estimated, measures ofuncertainty need to be presented (i.e., 95% confidence intervals(CI) or 95% credible intervals (CrI), which will be defined in thenext section).
18. Is a ranking of interventions provided given the reportedtreatment effects and its uncertainty by outcome?A network meta-analysis can be performed in a frequentist or aBayesian framework. The result of a frequentist network meta-analysis comparing treatments is an estimate of the relativetreatment effect along with a P value and 95% CI. The P valueindicates whether the results are statistically “significant” or“nonsignificant.” The P value reflects the probability of having atest statistic at least as extreme as the one that was actuallyobserved assuming that the null hypotheses (e.g., no differencebetween treatments) are true [35]. The usefulness of the P value,though, is limited for decision making because it does not provideinformation on the probability that a hypothesis (e.g., one treat-ment is better than the other) is true or false. Moreover, when thedecision maker is faced with a choice between more than twotreatments, the interpretation of a P value associated with eachpairwise comparison in a network meta-analysis becomes evenmore difficult because it does not provide information about theranking of treatments. The 95% CIs corresponding to the effectestimate as obtained within a frequentist framework cannot beinterpreted in terms of probabilities either; the 95% CI does notmean that there is a 95% probability that the true value isbetween the boundaries of the interval.
Within the Bayesian framework, the belief regarding thetreatment effect size before looking at data can be conveyed witha probability distribution: the prior distribution. This probabilitydistribution will be updated after having observed the data,resulting in the posterior distribution summarizing the updatedbelief regarding the likely values for this effect size [36]. Theoutput of the Bayesian network meta-analysis is a joint posteriordistribution of all relative treatment effects between interven-tions included in the network. The posterior distribution for eachrelative treatment effect can be summarized with a mean ormedian to reflect the most likely value for the effect size, as wellas the 2.5th and 97.5th percentile: the 95% CrI. In Figure 13, theoutput obtained with a frequentist and Bayesian network meta-analysis is summarized. In the frequentist framework, we obtainrelative treatment effects of each intervention relative to acontrol, along with a 95% CI (and P value). In the Bayesianframework, however, we obtain posterior probability distribu-tions summarizing the likely values for the treatment effect ofeach intervention relative to a control, which are typicallyreported as a “point estimate” and a 95% CrI.
Because the posterior distribution is a probability distribution,it allows for probability statements. Unlike the 95% CI obtainedwith the frequentist framework, the 95% CrI can be interpreted interms of probabilities: there is a 95% chance that the true effectsize falls between the boundaries of the CrI. Consequently, in anetwork meta-analysis fitted within a Bayesian framework, themultiple inferences based on CIs or P values can be replaced with
probability statements (see Fig. 14). For example, “ there is x%probability that treatment C is better than B,” or “there is a y%probability that treatment D is the most efficacious out of treat-ment A, B, C, D, and E regarding this outcome,” or “there is z%probability that intervention E is the least efficacious” [37].
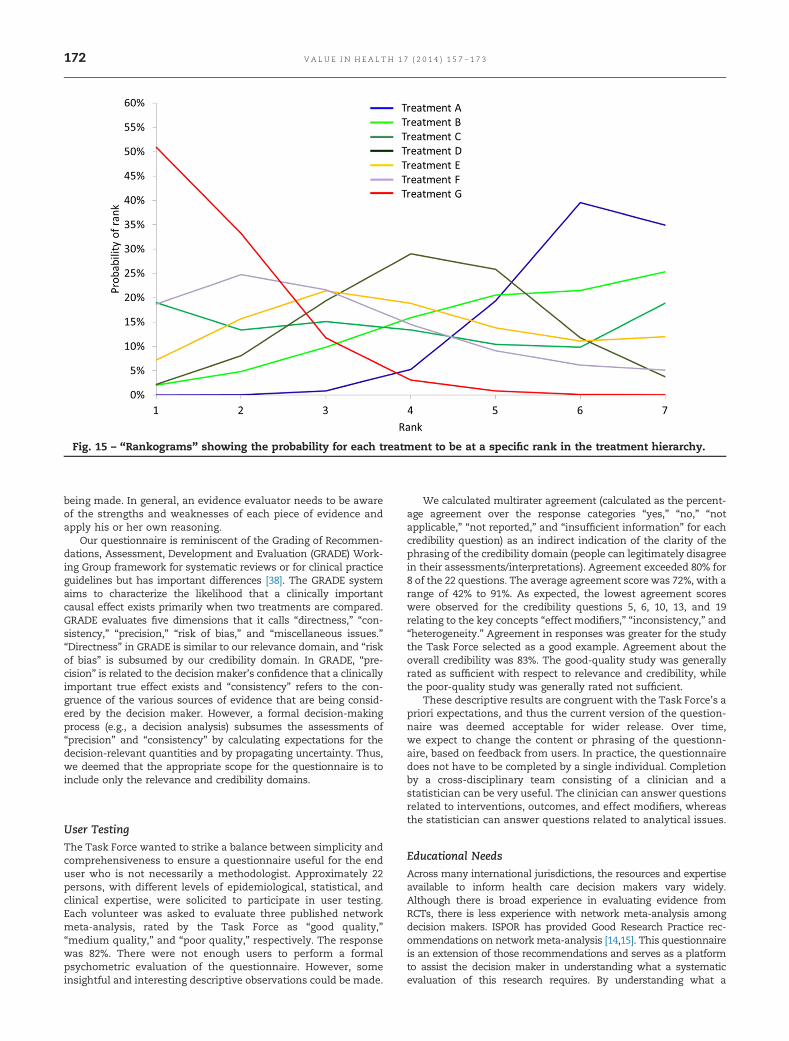
For each outcome of interest, the probability that each treat-ment ranks first, second, third, and so on out of all interventionscompared can be called rank probabilities and are based on thelocation, spread, and overlap of the posterior distributions of therelative treatment effects. Rank probabilities can be summarizedwith a graph in which on the horizontal axis the rank from 1 tothe number of treatments in the analysis is provided, and thevertical axis reflects a probability. Now, for each treatment theprobability against the rank is plotted and these dots connectedby treatment: a rankogram as illustrated in Figure 15 [37].Alternatively, the ranking probabilities can be presented withbar charts. Note that solely presenting the probability of being thebest can result in erroneous conclusions regarding the relativeranking of treatments because interventions for which there is alot of uncertainty (i.e., wide CrI) are more likely to be ranked best.The benefit of having rank probabilities is that these “summa-rize” the distribution of effects, thereby acknowledging bothlocation and uncertainty. Alternative summary measures of rankprobabilities, such as the surface under the cumulative rankingcurve, have also been proposed [37].
Technically, one can approximate the results of a Bayesiananalysis that has uninformative priors using the numerical resultsfrom a model fit with maximum likelihood in a frequentist setting.This slight of hand corresponds to interpreting the likelihoodfunction as a probability distribution and implies a Bayesianinterpretation of a frequentist analysis. Thus, one could “obtain”approximations of rank probabilities even from a network meta-analysis performed in a frequentist framework, assuming non-informative priors.
19. Is the effect of important patient characteristics on treatmenteffects reported?If it has been determined that certain patient characteristics areeffect modifiers and differ across studies, then it is of interest toreport relative treatment effects for different levels of the effectmodifier as obtained with meta-regression analysis or subgroupanalyses. Factors of interest can include sex, severity of disease,distribution of biomarkers, and treatment history, for example.
Interpretation
20. Are the conclusions fair and balanced?If the conclusions are in line with reported results of the networkmeta-analysis, the available evidence base, credibility of theanalysis methods, and any concerns of bias, then the conclusionscan be considered to be fair and balanced.
Conflict of Interest
21. Were there any potential conflicts of interest?Conflicts of interest may exist when an author (or author’sinstitution or employer) has financial or personal relationshipsor affiliations that could affect (or bias) the author’s decisions,work, or manuscript.
22. If yes, were steps taken to address these?To address potential conflicts of interest, all aspects of conflicts ofinterest should be noted (including the specific type and relation-ship of the conflict of interest), and the publication should be peerreviewed. The contribution of each author should be clearlynoted to document full disclosure of activities. Also, a fair and
V A L U E I N H E A L T H 1 7 ( 2 0 1 4 ) 1 5 7 – 1 7 3170

balanced exposition, including the breadth and depth of thestudy’s limitations, should be accurately discussed.
Discussion
The objective of this study was to develop a questionnaire to helpevidence evaluators form their opinions on the relevance andcredibility of a network meta-analysis to help inform health caredecision making. Relevance has to do with the extent to whichthe network meta-analysis is applicable to the problem faced bythe decision maker. Credibility has to do with the extent to whichthe findings of the network meta-analysis are valid and trust-worthy. The questionnaire also has an educational purpose: toraise awareness that evidence evaluation can be challenging andimportant elements may not be obvious to all potential users.Furthermore, the questionnaire may provide guidance toresearchers when performing a network meta-analysis.
The developed questionnaire, building upon earlier work[13,16,17], assists evidence evaluators in applying a structuredand consistent approach. The questionnaire does not determinean overall impression or summary score. Although some may beinterested in such scores to facilitate overall evidence synthesis,the use of such scores can be misleading. In addition, theapplicability of a study may depend on whether there is anyother evidence that addresses the specific issue or the decision
Fig. 13 – Frequentist versus Bayesian output of a network meta-analysis.
Fig. 14 – Probabilistic interpretation of posterior distributionwith Bayesian framework.
V A L U E I N H E A L T H 1 7 ( 2 0 1 4 ) 1 5 7 – 1 7 3 171
being made. In general, an evidence evaluator needs to be awareof the strengths and weaknesses of each piece of evidence andapply his or her own reasoning.
Our questionnaire is reminiscent of the Grading of Recommen-dations, Assessment, Development and Evaluation (GRADE) Work-ing Group framework for systematic reviews or for clinical practiceguidelines but has important differences [38]. The GRADE systemaims to characterize the likelihood that a clinically importantcausal effect exists primarily when two treatments are compared.GRADE evaluates five dimensions that it calls “directness,” “con-sistency,” “precision,” “risk of bias,” and “miscellaneous issues.”“Directness” in GRADE is similar to our relevance domain, and “riskof bias” is subsumed by our credibility domain. In GRADE, “pre-cision” is related to the decision maker’s confidence that a clinicallyimportant true effect exists and “consistency” refers to the con-gruence of the various sources of evidence that are being consid-ered by the decision maker. However, a formal decision-makingprocess (e.g., a decision analysis) subsumes the assessments of“precision” and “consistency” by calculating expectations for thedecision-relevant quantities and by propagating uncertainty. Thus,we deemed that the appropriate scope for the questionnaire is toinclude only the relevance and credibility domains.
User Testing
The Task Force wanted to strike a balance between simplicity andcomprehensiveness to ensure a questionnaire useful for the enduser who is not necessarily a methodologist. Approximately 22persons, with different levels of epidemiological, statistical, andclinical expertise, were solicited to participate in user testing.Each volunteer was asked to evaluate three published networkmeta-analysis, rated by the Task Force as “good quality,”“medium quality,” and “poor quality,” respectively. The responsewas 82%. There were not enough users to perform a formalpsychometric evaluation of the questionnaire. However, someinsightful and interesting descriptive observations could be made.
We calculated multirater agreement (calculated as the percent-age agreement over the response categories “yes,” “no,” “notapplicable,” “not reported,” and “insufficient information” for eachcredibility question) as an indirect indication of the clarity of thephrasing of the credibility domain (people can legitimately disagreein their assessments/interpretations). Agreement exceeded 80% for8 of the 22 questions. The average agreement score was 72%, with arange of 42% to 91%. As expected, the lowest agreement scoreswere observed for the credibility questions 5, 6, 10, 13, and 19relating to the key concepts “effect modifiers,” “inconsistency,” and“heterogeneity.” Agreement in responses was greater for the studythe Task Force selected as a good example. Agreement about theoverall credibility was 83%. The good-quality study was generallyrated as sufficient with respect to relevance and credibility, whilethe poor-quality study was generally rated not sufficient.
These descriptive results are congruent with the Task Force’s apriori expectations, and thus the current version of the question-naire was deemed acceptable for wider release. Over time,we expect to change the content or phrasing of the questionn-aire, based on feedback from users. In practice, the questionnairedoes not have to be completed by a single individual. Completionby a cross-disciplinary team consisting of a clinician and astatistician can be very useful. The clinician can answer questionsrelated to interventions, outcomes, and effect modifiers, whereasthe statistician can answer questions related to analytical issues.
Educational Needs
Across many international jurisdictions, the resources and expertiseavailable to inform health care decision makers vary widely.Although there is broad experience in evaluating evidence fromRCTs, there is less experience with network meta-analysis amongdecision makers. ISPOR has provided Good Research Practice rec-ommendations on network meta-analysis [14,15]. This questionnaireis an extension of those recommendations and serves as a platformto assist the decision maker in understanding what a systematicevaluation of this research requires. By understanding what a
Fig. 15 – “Rankograms” showing the probability for each treatment to be at a specific rank in the treatment hierarchy.
V A L U E I N H E A L T H 1 7 ( 2 0 1 4 ) 1 5 7 – 1 7 3172
systematic structured approach to the appraisal of network meta-analysis entails, it is hoped that this will lead to a general increase insophistication by decisionmakers in the use of this evidence. To thatend, we anticipate additional educational efforts and promotion ofthis questionnaire and that it will be made available to an increasingnumber of health care decision makers. In addition, an interactive(i.e., web-based) questionnaire has been developed at https://www.healthstudyassessment.org/ that will facilitate uptake and supportthe educational goal of the questionnaire.
Conclusions
The Task Force developed a consensus-based questionnaire tohelp decision makers assess the relevance and credibility ofmeta-analysis to help inform health care decision making. Thequestionnaire aims to provide a guide for assessing the degree ofconfidence that should be placed in a network meta-analysis, andenables decision makers to gain awareness of the subtletiesinvolved in evaluating these kinds of studies. It is anticipatedthat user feedback will permit periodic evaluation and modifica-tion to the questionnaires, with the ensuing improvement to it.The goal is to make these questionnaires as useful as possible tothe health care decision-making community.
Source of financial support: The authors have no otherfinancial relationships to disclose.
Supplemental Materials
Supplementary Materials accompanying this article can be foundin the online version as a hyperlink at http://dx.doi.org/10.1016/j.jval.2014.01.004 or, if a hard copy of article, at www.valueinhealthjournal.com/issues (select volume, issue, and article).
R E F E R E N C E S
[1] Berger M, Martin B, Husereau D, et al. A questionnaire to assess therelevance and credibility of observational studies to inform health caredecision making: an ISPOR-AMCP-NPC Good Practice Task Force Report.Value Health 2014;17:143–156.
[2] Caro JJ, Eddy DM, Kan H, et al. A modeling study questionnaire to assessstudy relevance and credibility to inform health care decision making:an ISPOR-AMCP-NPC Good Practice Task Force report. Value Health2014;17: 174–182.
[3] Higgins JPT, Green S, eds. Cochrane Handbook for Systematic Reviewsof Interventions Version 5.1.0 [updated March 2011]. Baltimore, MD:The Cochrane Collaboration, 2011. Available from: http://www.cochrane-handbook.org. [Accessed February 11, 2013].
[4] Caldwell DM, Ades AE, Higgins JPT. Simultaneous comparison of multipletreatments: combining direct and indirect evidence. BMJ 2005;331:897–900.
[5] Ioannidis JPA. Indirect comparisons: the mesh and mess of clinicaltrials. Lancet 2006;368:1470–2.
[6] Sutton A, Ades AE, Cooper N, Abrams K. Use of indirect and mixedtreatment comparisons for technology assessment.Pharmacoeconomics 2008;26:753–67.
[7] Wells GA, Sultan SA, Chen L, et al. Indirect Evidence: IndirectTreatment Comparisons in Meta-Analysis. Ottawa, Canada: CanadianAgency for Drugs and Technologies in Health, 2009.
[8] Bucher HC, Guyatt GH, Griffith LE, Walter SD. The results of direct andindirect treatment comparisons in meta-analysis of randomizedcontrolled trials. J Clin Epidemiol 1997;50:683–91.
[9] Song F, Altman DG, Glenny A, Deeks JJ. Validity of indirect comparisonfor estimating efficacy of competing interventions: empirical evidencefrom published meta-analyses. BMJ 2003;326:472.
[10] Lu G, Ades AE. Combination of direct and indirect evidence in mixedtreatment comparisons. Stat Med 2004;23:3105–24.
[11] Mills E, Thorlund K, Ioannidis J. Demystifying trial networks andnetwork meta-analysis. BMJ 2013;346:f2914.
[12] Dias S, Sutton AJ, Ades AE, Welton NJ. Evidence synthesis for decisionmaking, 2: a generalized linear modeling framework for pairwise andnetwork meta-analysis of randomized controlled trials. Med DecisMaking 2013;33:607–17.
[13] Jansen JP, Fleurence R, Devine B, et al. Interpreting indirect treatmentcomparisons & network meta-analysis for health care decision making:report of the ISPOR Task Force on Good Research Practices—part 1.Value Health 2011;14:417–28.
[14] Hoaglin DC, Hawkins N, Jansen JP, et al. Conducting indirect treatmentcomparison and network meta-analysis studies: report of the ISPORTask Force on Indirect Treatment Comparisons Good ResearchPractices—part 2. Value Health 2011;14:429–37.
[15] Jüni P, Witschi A, Bloch R, Egger M. The hazards of scoring the qualityof clinical trials for meta-analysis. JAMA 1995;282:1054–60.
[16] Ades AE, Caldwell DM, Reken S, et al. Evidence synthesis for decisionmaking, 7: a reviewer’s checklist. Med Decis Making 2013;33:679–91.
[17] Donegan S, Williamson P, Gamble C, Tudur-Smith C. Indirectcomparisons: a review of reporting and methodological quality. PLoSOne 2010;5:e11054.
[18] Moher D, Liberati A, Tetzlaff J, Altman DG, the PRISMA Group. Preferredreporting items for systematic reviews and meta-analyses: the PRISMAstatement. Ann Intern Med 2009;151:264–9:W64.
[19] Higgins JP, Altman DG, Gøtzsche, et al; Cochrane Bias Methods Group;Cochrane Statistical Methods Group. The Cochrane Collaboration’s toolfor assessing risk of bias in randomised trials. BMJ 2011;343:d5928.
[20] Dwan K, Gamble C, Kolamunnage-Dona R, et al. Assessing thepotential for outcome reporting bias in a review: a tutorial. Trials2010;11:52.
[21] Jansen JP, Crawford B, Bergman G, Stam W. Bayesian meta-analysis ofmultiple treatment comparisons: an introduction to mixed treatmentcomparisons. Value Health 2008;11:956–64.
[22] Jansen JP, Schmid CH, Salanti G. Direct acyclic graphs can helpunderstand bias in indirect and mixed treatment comparisons. J ClinEpidemiol 2012;65:798–807.
[23] Thompson SG, Higgins JP. How should meta-regression analyses beundertaken and interpreted? Stat Med 2002;21:1559–73.
[24] Schmid CH, Stark PC, Berlin JA, et al. Meta-regression detectedassociations between heterogeneous treatment effects and study-level,but not patient-level, factors. J Clin Epidemiol 2004;57:683–97.
[25] Cooper NJ, Sutton AJ, Morris D, et al. Addressing between-studyheterogeneity and inconsistency in mixed treatment comparisons:application to stroke prevention treatments in individuals with non-rheumatic atrial fibrillation. Stat Med 2009;28:1861–81.
[26] Salanti G, Marinho V, Higgins JP. A case study of multiple-treatmentsmeta-analysis demonstrates that covariates should be considered. JClin Epidemiol 2009;62:857–64.
[27] Dias S, Welton N, Marinho VCC, et al. Estimation and adjustment ofbias in randomised evidence using mixed treatment comparison meta-analysis. J Royal Stat Soc A 2010;173:613–29.
[28] Jansen JP. Network meta-analysis of individual and aggregate leveldata. Res Synth Meth 2012;3:177–90.
[29] Saramago P, Sutton AJ, Cooper NJ, Manca A. Mixed treatmentcomparisons using aggregate and individual participant level data. StatMed 2012;31:3516–36.
[30] Donegan S, Williamson P, D’Alessandro U, Tudur Smith C. Assessingthe consistency assumption by exploring treatment by covariateinteractions in mixed treatment comparison meta-analysis: individualpatient-level covariates versus aggregate trial-level covariates. StatMed 2012;31:3840–57.
[31] Lu G, Ades AE. Assessing evidence inconsistency in mixed treatmentcomparisons. J Am Stat Assoc 2006;101:447–59.
[32] Dias S, Welton NJ, Caldwell DM, Ades AE. Checking consistency inmixed treatment comparison meta-analysis. Stat Med 2010;29:932–44.
[33] Ades AE, Lu G, Higgins JP. The interpretation of random-effects meta-analysis in decision models. Med Dec Making 2005;25:646–54.
[34] Salanti G, Kavvoura FK, Ioannidis JPA. Exploring the geometry oftreatment networks. Ann Intern Med 2008;148:544–53.
[35] Goodman SN. Towards evidence based medical statistics, 1: the P valuefallacy. Ann Intern Med 1999;120:995–1004.
[36] Gelman AB, Carlin JS, Stern HS, Rubin DB. Bayesian Data Analysis (2nded.). Boca Raton: Chapman and Hall–CRC, 2003.
[37] Salanti G, Ades AE, Ioannidis JP. Graphical methods and numericalsummaries for presenting results from multiple-treatment meta-analysis: an overview and tutorial. J Clin Epidemiol 2011;64:163–71.
[38] Guyatt GH, Oxman AD, Vist, et al; for the GRADE Working Group.GRADE: an emerging consensus on rating quality of evidence andstrength of recommendations. BMJ 2008;336:924–6.
V A L U E I N H E A L T H 1 7 ( 2 0 1 4 ) 1 5 7 – 1 7 3 173