Indirect Rate Analysis - Institute for Supply Management · Indirect Compensation Overhead An...
30
Indirect Spend Analysis Prashanth Kallat Manager Professional and Technical Services United States Postal Service 1
-
Upload
nguyenminh -
Category
Documents
-
view
215 -
download
1
Transcript of Indirect Rate Analysis - Institute for Supply Management · Indirect Compensation Overhead An...

Indirect Spend Analysis
Prashanth Kallat Manager Professional and Technical Services
United States Postal Service
1

‹#›
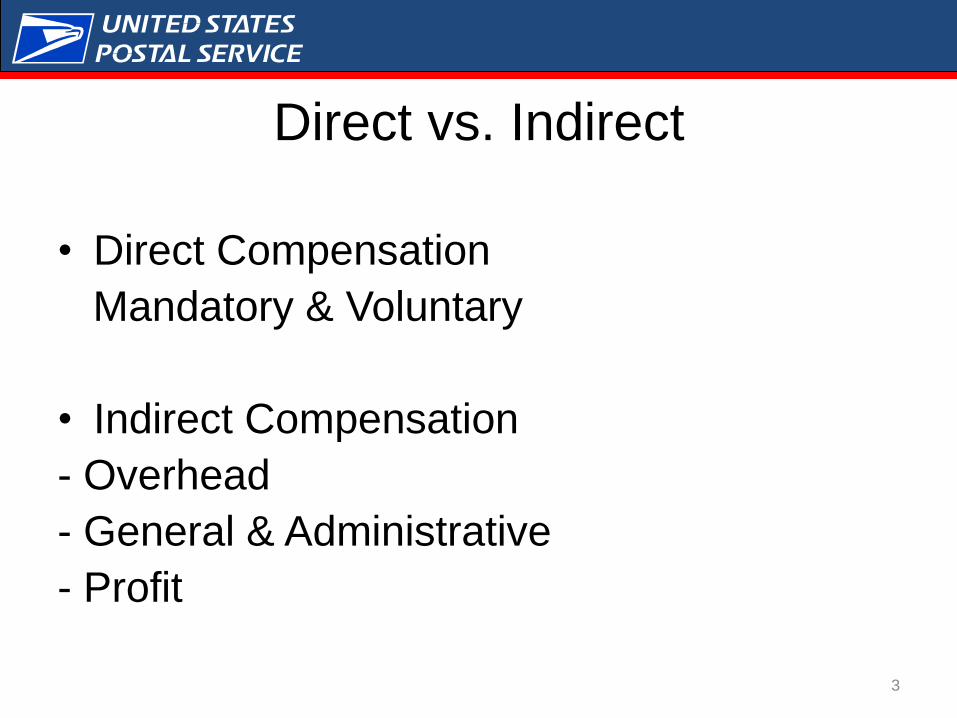
Direct vs. Indirect
• Direct Compensation
Mandatory & Voluntary
• Indirect Compensation
- Overhead
- General & Administrative
- Profit
3

Indirect Compensation
Overhead
An accounting term that refers to all ongoing business expenses not including or related to direct labor, direct materials or third-party expenses that are billed directly to customers. Overhead must be paid for on an ongoing basis, regardless of whether a company is doing a high or low volume of business. It is important not just for budgeting purposes, but for determining how much a company must charge for its products or services to make a profit.
4
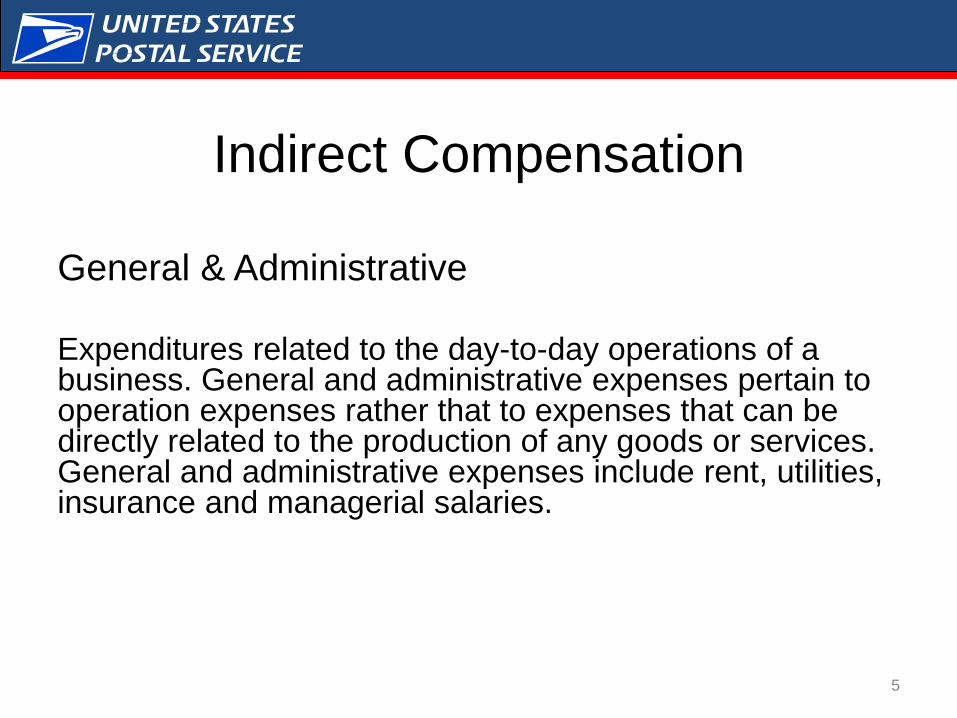
Indirect Compensation
General & Administrative Expenditures related to the day-to-day operations of a business. General and administrative expenses pertain to operation expenses rather that to expenses that can be directly related to the production of any goods or services. General and administrative expenses include rent, utilities, insurance and managerial salaries.
5

Indirect Compensation
Profit
A financial benefit that is realized when the amount of revenue gained from a business activity exceeds the expenses, costs and taxes needed to sustain the activity.
6
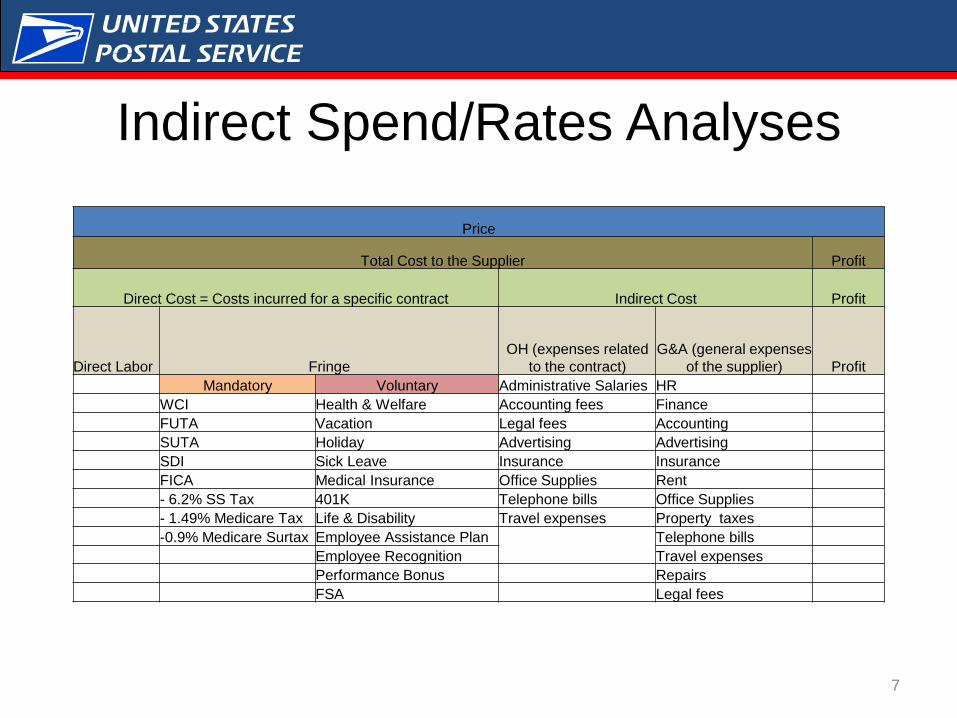
Indirect Spend/Rates Analyses
7
Price
Total Cost to the Supplier Profit
Direct Cost = Costs incurred for a specific contract Indirect Cost Profit
Direct Labor Fringe
OH (expenses related
to the contract)
G&A (general expenses
of the supplier) Profit
Mandatory Voluntary Administrative Salaries HR
WCI Health & Welfare Accounting fees Finance
FUTA Vacation Legal fees Accounting
SUTA Holiday Advertising Advertising
SDI Sick Leave Insurance Insurance
FICA Medical Insurance Office Supplies Rent
- 6.2% SS Tax 401K Telephone bills Office Supplies
- 1.49% Medicare Tax Life & Disability Travel expenses Property taxes
-0.9% Medicare Surtax Employee Assistance Plan Telephone bills
Employee Recognition Travel expenses
Performance Bonus Repairs
FSA Legal fees

Multiplier • Fully Loaded Labor Rate – $147
Direct Compensation - $100
Indirect Compensation - $47
Direct Compensation * Multiplier = Fully Loaded Labor Rate
$100*X=$147
Multiplier is 1.47
$100*1.47=$147
8
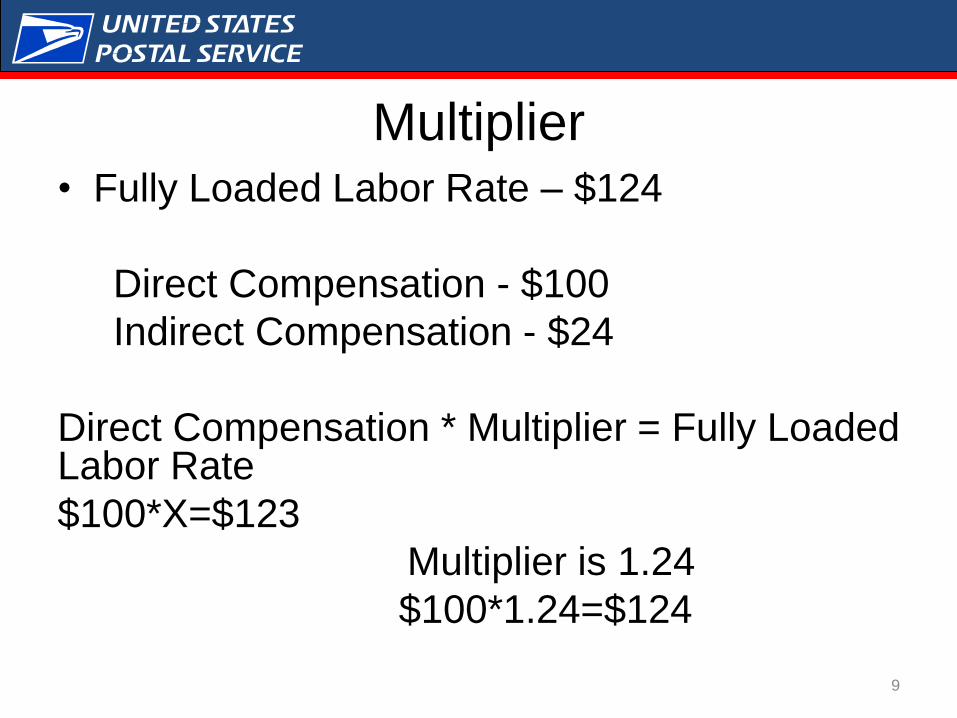
Multiplier • Fully Loaded Labor Rate – $124
Direct Compensation - $100
Indirect Compensation - $24
Direct Compensation * Multiplier = Fully Loaded Labor Rate
$100*X=$123
Multiplier is 1.24
$100*1.24=$124
9

‹#›

Select Free Salary Data from the options below.
11
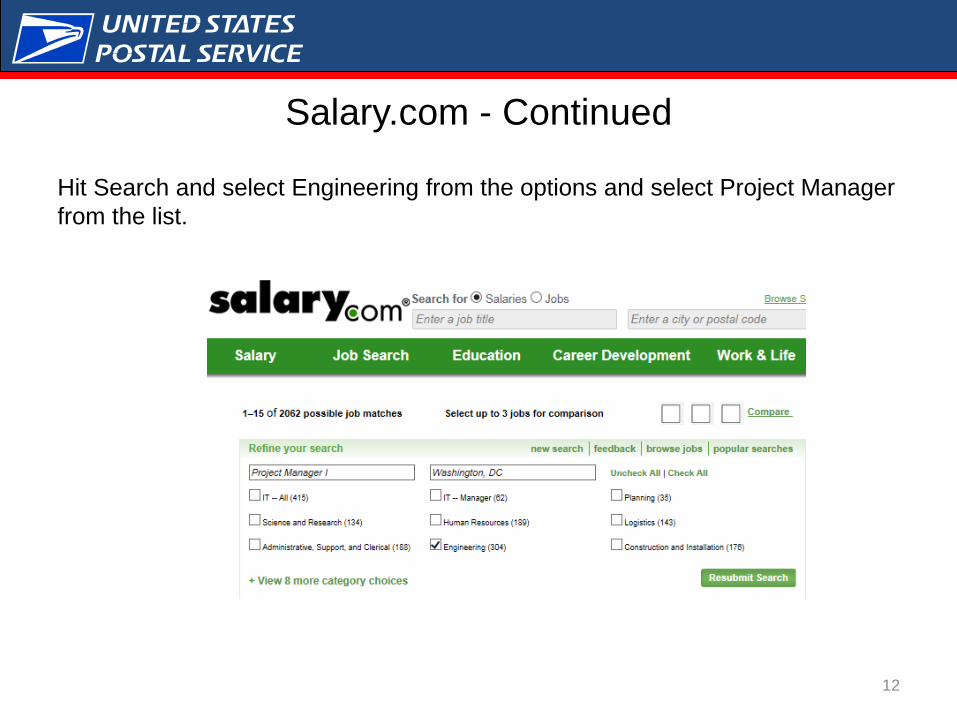
Salary.com - Continued
Hit Search and select Engineering from the options and select Project Manager
from the list.
12
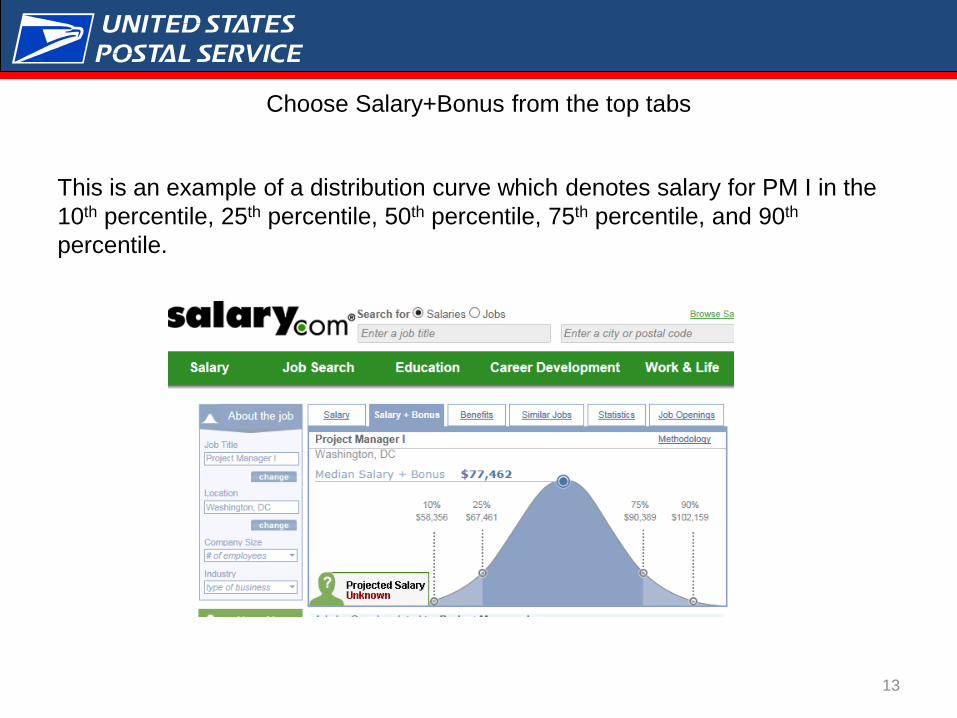
Choose Salary+Bonus from the top tabs
This is an example of a distribution curve which denotes salary for PM I in the
10th percentile, 25th percentile, 50th percentile, 75th percentile, and 90th
percentile.
13
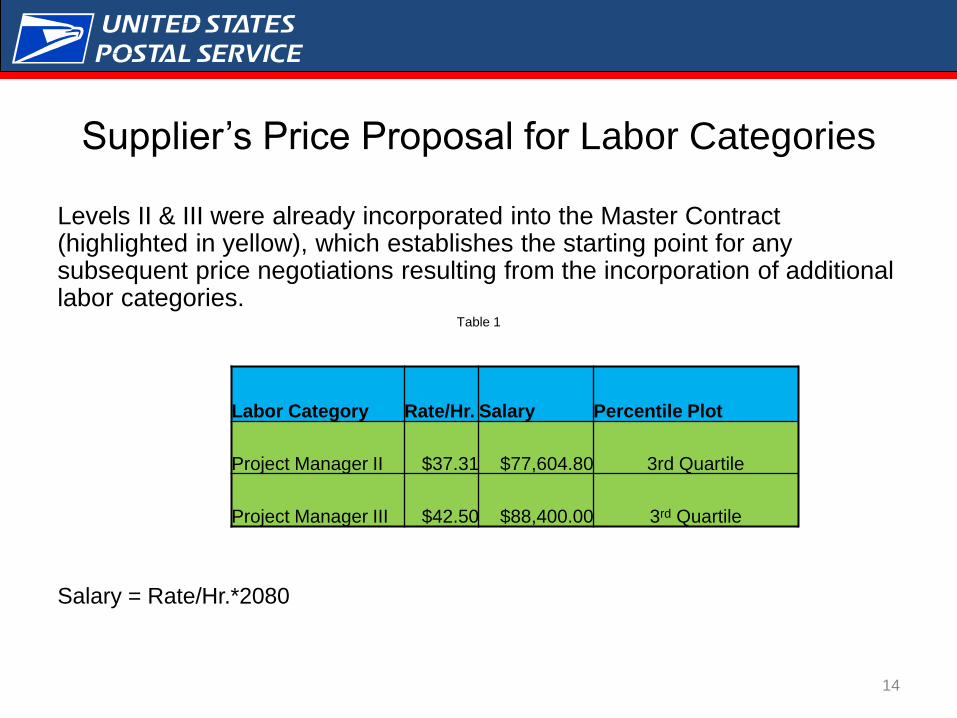
Supplier’s Price Proposal for Labor Categories
Levels II & III were already incorporated into the Master Contract (highlighted in yellow), which establishes the starting point for any subsequent price negotiations resulting from the incorporation of additional labor categories.
Table 1
Salary = Rate/Hr.*2080
14
Labor Category Rate/Hr. Salary Percentile Plot
Project Manager II $37.31 $77,604.80 3rd Quartile
Project Manager III $42.50 $88,400.00 3rd Quartile

Direct Compensation Labor Categories
Salary.com (Range)
Project Manager 2 - Existing
Project Manager 3 - Existing
Project Manager 1 - New
Project Manager 4 - New
Project Manager 5 - New
15
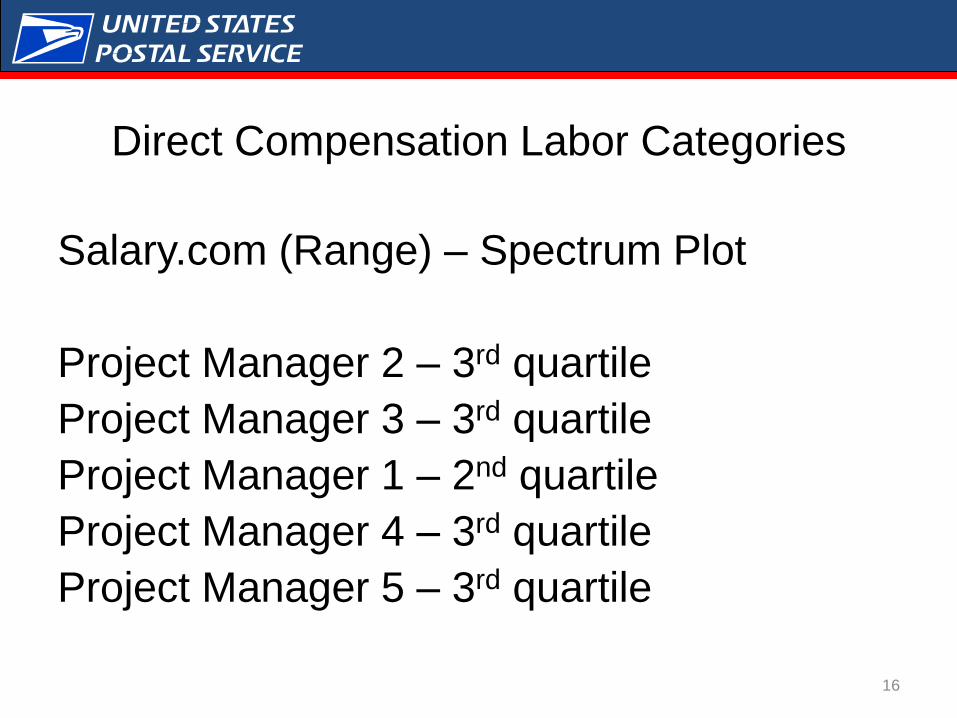
Direct Compensation Labor Categories
Salary.com (Range) – Spectrum Plot
Project Manager 2 – 3rd quartile
Project Manager 3 – 3rd quartile
Project Manager 1 – 2nd quartile
Project Manager 4 – 3rd quartile
Project Manager 5 – 3rd quartile
16
Cost Analysis
For the scenario at hand
• Review the pricing methodology previously incorporated
in the Master Contract
• Review the agreed upon Multiplier and Option Escalation
Rate
• Determine annual proposed salary for the new labor
categories and how that compare to the market using:
o Salary.com and/or
o Payscale.com
17
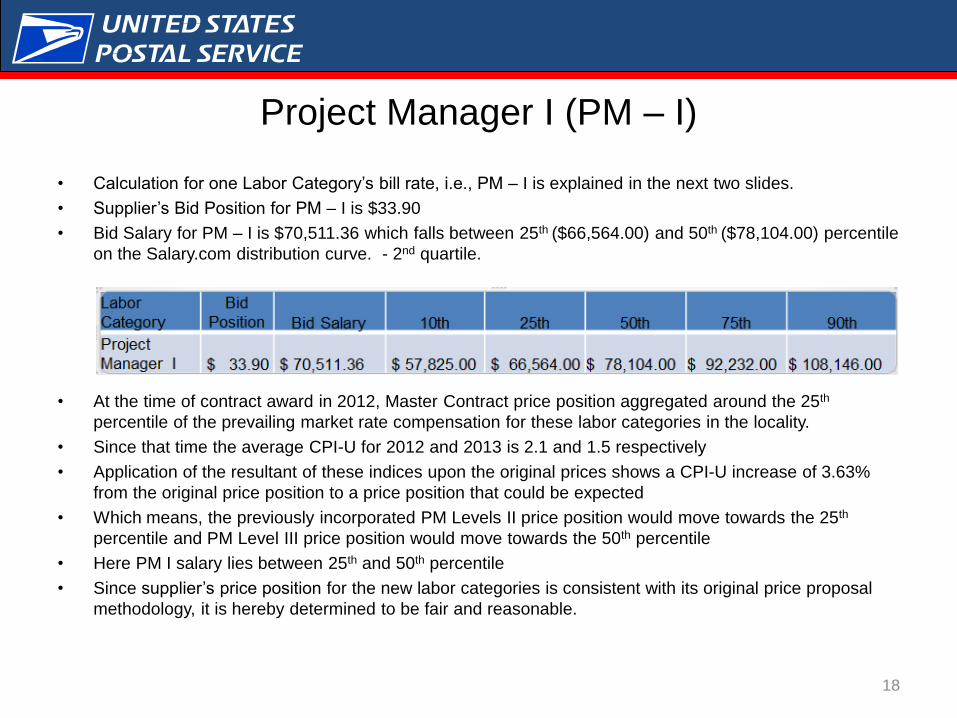
Project Manager I (PM – I)
• Calculation for one Labor Category’s bill rate, i.e., PM – I is explained in the next two slides.
• Supplier’s Bid Position for PM – I is $33.90
• Bid Salary for PM – I is $70,511.36 which falls between 25th ($66,564.00) and 50th ($78,104.00) percentile
on the Salary.com distribution curve. - 2nd quartile.
• At the time of contract award in 2012, Master Contract price position aggregated around the 25th
percentile of the prevailing market rate compensation for these labor categories in the locality.
• Since that time the average CPI-U for 2012 and 2013 is 2.1 and 1.5 respectively
• Application of the resultant of these indices upon the original prices shows a CPI-U increase of 3.63%
from the original price position to a price position that could be expected
• Which means, the previously incorporated PM Levels II price position would move towards the 25th
percentile and PM Level III price position would move towards the 50th percentile
• Here PM I salary lies between 25th and 50th percentile
• Since supplier’s price position for the new labor categories is consistent with its original price proposal
methodology, it is hereby determined to be fair and reasonable.
18

Total Billable & Option Period Bill Rates for PM - I
• Total Billable for PM – I (Full-Time) is calculated by multiplying Bid Salary with the FT Multiplier.
$70,511.36*1.4655=$103,334.40 and Total Billable for PM – I (Part-Time) is calculated by
multiplying Bid Salary with the PT Multiplier. $70,511.36*1.2363
• Bill Rate for Base Period = Total Billable 2080 = $103,334.40 2080=49.68
• Bill Rate for Option Period (Full-Time) is calculated by multiplying Bill Rate for Base Period with
Option Escalation Rate 2.34% = ($49.68*2.34%)+$49.68=$50.84
• Bill Rate for Option Period (Part-Time) is calculated by multiplying Bill Rate for Base Period Option
Escalation Rate 2.34% = ($41.91*2.34%)+$41.91=$42.89
19
Cost Analysis
• Scenario:
Project Manager (PM) levels II & III were already incorporated into the
Master Contract either through a previous modification or as part of the
contract award. Supplier has provided new price proposal for additional
levels of labor categories, e.g., PM I, IV, & V. These labor categories need
to be authorized and incorporated into the Master Contract.
20
Supplier’s Price Proposal for additional labor
categories
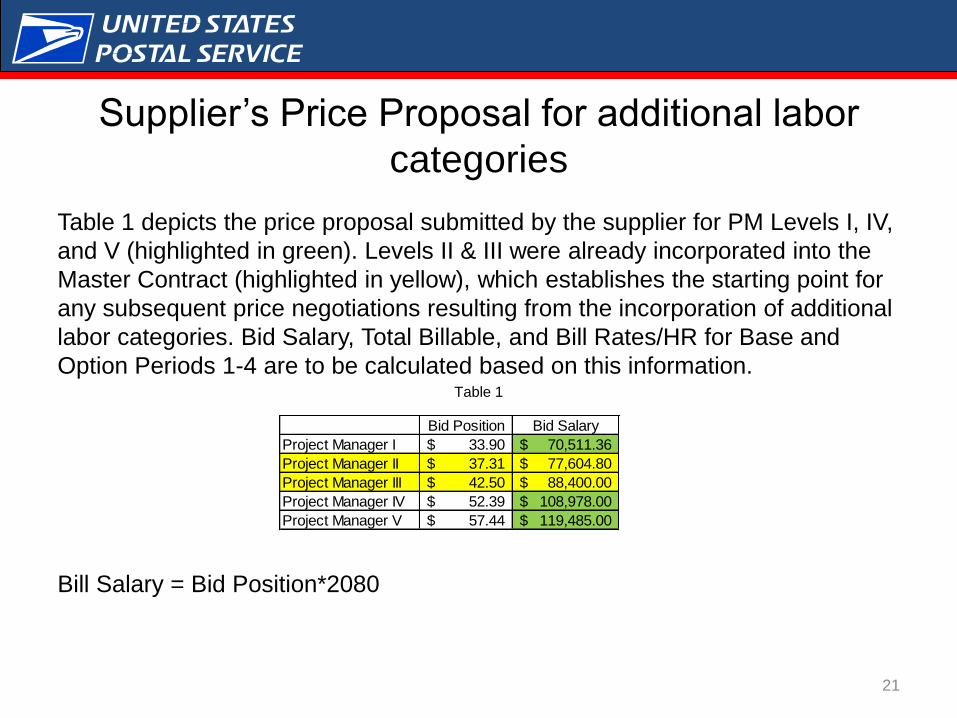
Table 1 depicts the price proposal submitted by the supplier for PM Levels I, IV,
and V (highlighted in green). Levels II & III were already incorporated into the
Master Contract (highlighted in yellow), which establishes the starting point for
any subsequent price negotiations resulting from the incorporation of additional
labor categories. Bid Salary, Total Billable, and Bill Rates/HR for Base and
Option Periods 1-4 are to be calculated based on this information. Table 1
Bill Salary = Bid Position*2080
Bid Position Bid Salary
Project Manager I 33.90$ 70,511.36$
Project Manager II 37.31$ 77,604.80$
Project Manager III 42.50$ 88,400.00$
Project Manager IV 52.39$ 108,978.00$
Project Manager V 57.44$ 119,485.00$
21
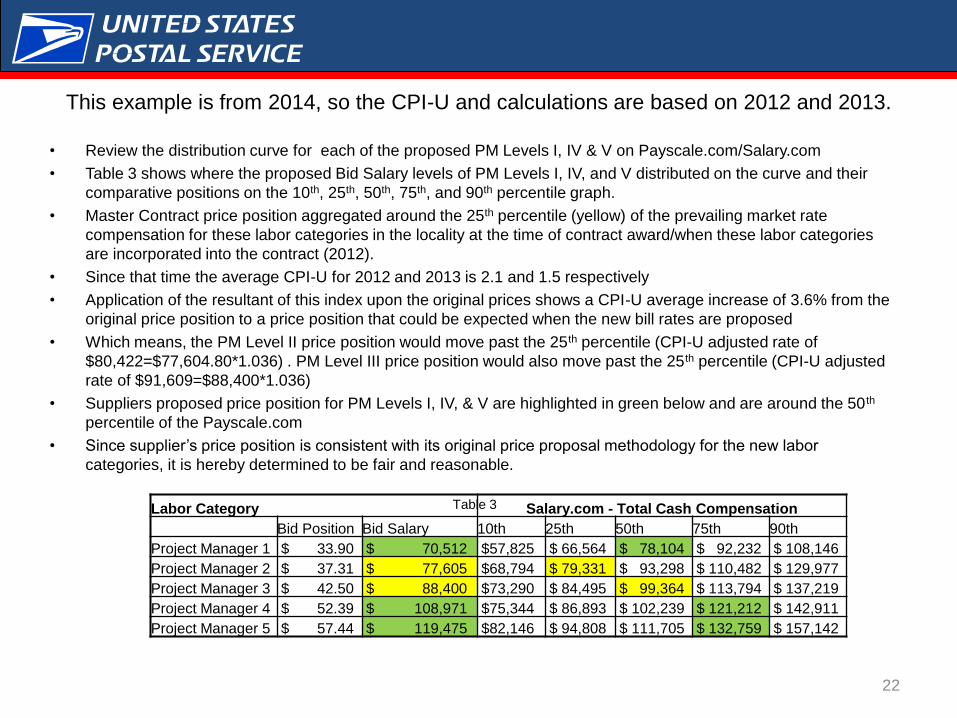
This example is from 2014, so the CPI-U and calculations are based on 2012 and 2013.
• Review the distribution curve for each of the proposed PM Levels I, IV & V on Payscale.com/Salary.com
• Table 3 shows where the proposed Bid Salary levels of PM Levels I, IV, and V distributed on the curve and their
comparative positions on the 10th, 25th, 50th, 75th, and 90th percentile graph.
• Master Contract price position aggregated around the 25th percentile (yellow) of the prevailing market rate
compensation for these labor categories in the locality at the time of contract award/when these labor categories
are incorporated into the contract (2012).
• Since that time the average CPI-U for 2012 and 2013 is 2.1 and 1.5 respectively
• Application of the resultant of this index upon the original prices shows a CPI-U average increase of 3.6% from the
original price position to a price position that could be expected when the new bill rates are proposed
• Which means, the PM Level II price position would move past the 25th percentile (CPI-U adjusted rate of
$80,422=$77,604.80*1.036) . PM Level III price position would also move past the 25th percentile (CPI-U adjusted
rate of $91,609=$88,400*1.036)
• Suppliers proposed price position for PM Levels I, IV, & V are highlighted in green below and are around the 50 th
percentile of the Payscale.com
• Since supplier’s price position is consistent with its original price proposal methodology for the new labor
categories, it is hereby determined to be fair and reasonable.
Table 3
22
Labor Category Salary.com - Total Cash Compensation
Bid Position Bid Salary 10th 25th 50th 75th 90th
Project Manager 1 $ 33.90 $ 70,512 $57,825 $ 66,564 $ 78,104 $ 92,232 $ 108,146
Project Manager 2 $ 37.31 $ 77,605 $68,794 $ 79,331 $ 93,298 $ 110,482 $ 129,977
Project Manager 3 $ 42.50 $ 88,400 $73,290 $ 84,495 $ 99,364 $ 113,794 $ 137,219
Project Manager 4 $ 52.39 $ 108,971 $75,344 $ 86,893 $ 102,239 $ 121,212 $ 142,911
Project Manager 5 $ 57.44 $ 119,475 $82,146 $ 94,808 $ 111,705 $ 132,759 $ 157,142
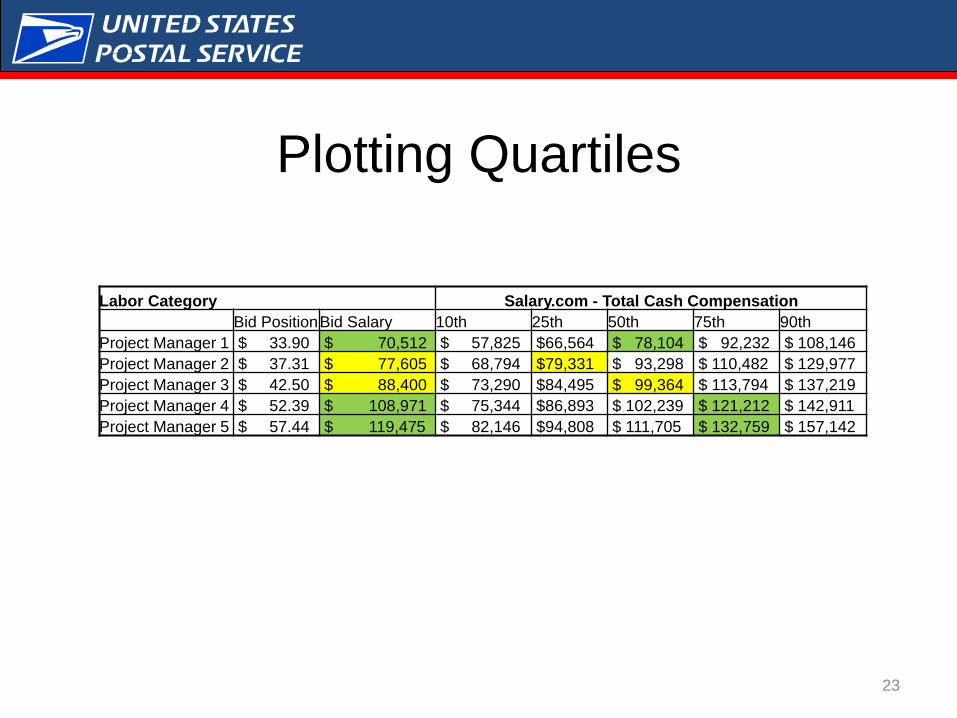
Plotting Quartiles
23
Labor Category Salary.com - Total Cash Compensation
Bid Position Bid Salary 10th 25th 50th 75th 90th
Project Manager 1 $ 33.90 $ 70,512 $ 57,825 $66,564 $ 78,104 $ 92,232 $ 108,146
Project Manager 2 $ 37.31 $ 77,605 $ 68,794 $79,331 $ 93,298 $ 110,482 $ 129,977
Project Manager 3 $ 42.50 $ 88,400 $ 73,290 $84,495 $ 99,364 $ 113,794 $ 137,219
Project Manager 4 $ 52.39 $ 108,971 $ 75,344 $86,893 $ 102,239 $ 121,212 $ 142,911
Project Manager 5 $ 57.44 $ 119,475 $ 82,146 $94,808 $ 111,705 $ 132,759 $ 157,142

Multiplier & Option Escalation Rate
See Table 3 below:
Total Billable = Bid Salary*Multiplier (Part-Time – 1.2363 & Full-Time – 1.4655)
Bill Rate for Option Period = Bill Rate for Base Period * Option Escalation Rate
In order to establish the Bill Rate per labor category, the normalized multiplier (supplier’s
Indirect Costs of OH, G&A, and Fee) has been applied to the total compensation and
then divided by 2080 hours to determine the Bill Rate/HR for Full-Time & Part-Time.
For the Option Period, the proposed escalation rate of 2.34%, was used to determine the
Option Period price point.
Table 3
24

Option Periods
Labor Category Multiplier Total Billable Base Opt 1 Opt 2 Opt 3 Opt 4
Project Manager 1 FT 1.47 $ 103,334.40 $49.68 $50.84 $52.03 $53.25 $54.50
Project Manager 1 PT 1.24 $ 87,173.20 $41.91 $42.89 $43.89 $44.92 $45.97
Project Manager 4 FT 1.47 $ 159,707.26 $76.78 $78.58 $80.42 $82.30 $84.23
Project Manager 4 PT 1.24 $ 134,729.50 $64.77 $66.29 $67.84 $69.43 $71.05
Project Manager 5 FT 1.47 $ 175,105.27 $84.19 $86.16 $88.17 $90.23 $92.35
Project Manager 5 PT 1.24 $ 147,719.31 $71.02 $72.68 $74.36 $76.12 $77.90
25
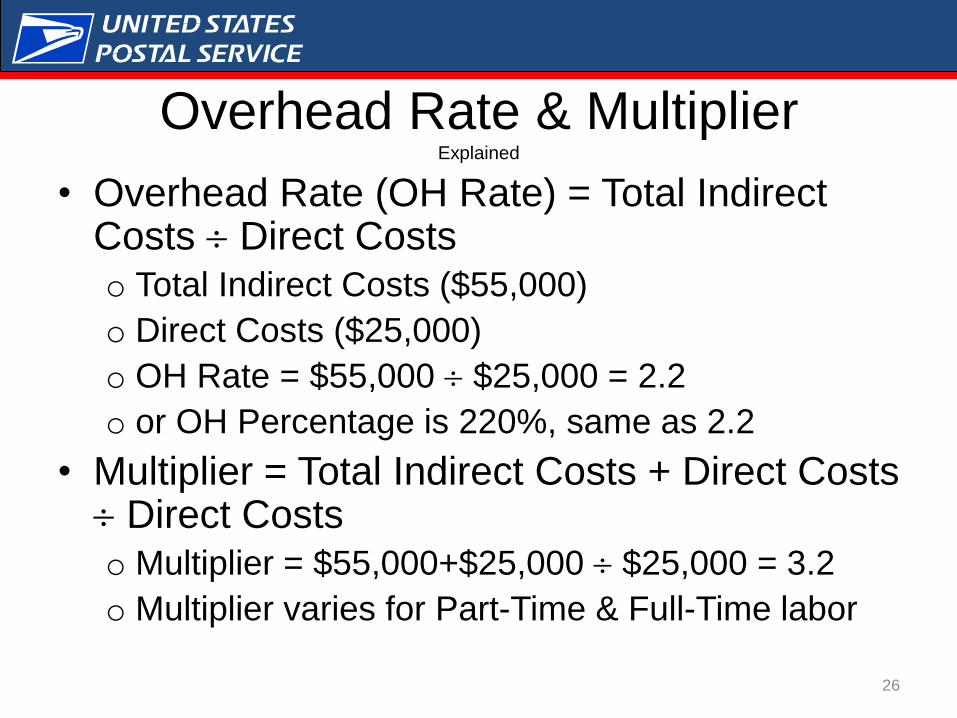
Overhead Rate & Multiplier Explained
• Overhead Rate (OH Rate) = Total Indirect Costs Direct Costs o Total Indirect Costs ($55,000)
o Direct Costs ($25,000)
o OH Rate = $55,000 $25,000 = 2.2
o or OH Percentage is 220%, same as 2.2
• Multiplier = Total Indirect Costs + Direct Costs Direct Costs o Multiplier = $55,000+$25,000 $25,000 = 3.2
o Multiplier varies for Part-Time & Full-Time labor
26

Overhead Rate
• Overhead rates vary based on industry
• Overhead rates can be negotiated
• Sometimes higher overhead rates indicates business inefficiencies
o $55,000 $25,000 = 2.2
o $100,000 $25,000 = 4 (higher OH rate and same Direct Labor - $25,000 – purchasing should negotiate OH rate based on the industry average
27

‹#›

Cost Analysis Exercise
• Spend - $1,000,000 at Multiplier of 2.0
• Spend - $735,000 at Multiplier of 1.47
• Spend - $50,000,000 at Multiplier of 2.0
• Spend - $36,750,000 at Multiplier of 1.47
• Savings is $13,250,000
• Savings for 10 years is $132,500,000
29

30
This document is proprietary and confidential – FOR INTERNAL USE ONLY
ANY QUESTIONS?


![How to Start a Computer Consulting Business with Low Overhead Expenses [Slides]](https://static.fdocuments.us/doc/165x107/546fd97cb4af9faa0b8b4611/how-to-start-a-computer-consulting-business-with-low-overhead-expenses-slides.jpg)