Indirect costs of disease; an international comparison
15
ELSEVIER k~~h-i pdiiy Health Policy 33 (1995) 15-29 Indirect costs of disease; an international comparison Leona van Roijen* a*b, Marc A. KoopnanschagaVb, Frans F.H. Ruttena, Paul J. van der Maas 8Institute for Medical Technology Assessment, Erasmus University, P. 0. Box 1738, 3ooO DR Rotterdam. The Netherlands bDepartment of Public Health, Erasmus University, Rotterdam. The Netherlandr Accepted 4 October 1994 Results of economic evaluations areoften strongly influenced by estimates of indirect costs. International comparabilityof these estimates may contribute to rational decision-making in health care policy. Hence,estimates shouldbe international comparable. Comparability of theseresults between countries may be hampered due to variation in methodology, data sources, valuation of production losses, and social security arrangements. Furthermore differ- ences in epidemiology, demography and economic environmentmay cause variation in the leveland the distribution by diagnosis of indirect costs. In this study indirect costs of disease for the Netherlands arecompared with estimates for Sweden and the United States. Wefound largedifferences: both in the share of indirect costs in GDP asin the constituting elements, absence from work, disability and mortality. The level of indirect costs due to absence from work and the distribution according to diagnosis arequite similar for the two European coun- tries.Thecosts of disability areparticularly high for the Netherlands. Comparison of disabili- ty costs between the three countries is hampered due to lack of quantitative information on the influence of social insurance arrangements on the level of indirect costs and the distribu- tion by diagnosis. The largenumberof deaths at youngagein the U.S. is responsible for the higher mortality costs compared to the two European countries. Keywords: Indirect costs;International comparison; Economic evaluation; Human capital method l Corresponding author. 0168-8510/95/$09.50 0 1995 Elsevier Science Ireland Ltd. All rights reserved SSDI 0168-8510(94)00704-I CORE Metadata, citation and similar papers at core.ac.uk Provided by Erasmus University Digital Repository
Transcript of Indirect costs of disease; an international comparison

ELSEVIER
k~~h-i pdiiy
Health Policy 33 (1995) 15-29
Indirect costs of disease; an international comparison
Leona van Roijen* a*b, Marc A. KoopnanschagaVb, Frans F.H. Ruttena, Paul J. van der Maas
8Institute for Medical Technology Assessment, Erasmus University, P. 0. Box 1738, 3ooO DR Rotterdam. The Netherlands
bDepartment of Public Health, Erasmus University, Rotterdam. The Netherlandr
Accepted 4 October 1994
Results of economic evaluations are often strongly influenced by estimates of indirect costs. International comparability of these estimates may contribute to rational decision-making in health care policy. Hence, estimates should be international comparable. Comparability of these results between countries may be hampered due to variation in methodology, data sources, valuation of production losses, and social security arrangements. Furthermore differ- ences in epidemiology, demography and economic environment may cause variation in the level and the distribution by diagnosis of indirect costs. In this study indirect costs of disease for the Netherlands are compared with estimates for Sweden and the United States. We found large differences: both in the share of indirect costs in GDP as in the constituting elements, absence from work, disability and mortality. The level of indirect costs due to absence from work and the distribution according to diagnosis are quite similar for the two European coun- tries. The costs of disability are particularly high for the Netherlands. Comparison of disabili- ty costs between the three countries is hampered due to lack of quantitative information on the influence of social insurance arrangements on the level of indirect costs and the distribu- tion by diagnosis. The large number of deaths at young age in the U.S. is responsible for the higher mortality costs compared to the two European countries.
Keywords: Indirect costs; International comparison; Economic evaluation; Human capital method
l Corresponding author.
0168-8510/95/$09.50 0 1995 Elsevier Science Ireland Ltd. All rights reserved SSDI 0168-8510(94)00704-I
CORE Metadata, citation and similar papers at core.ac.uk
Provided by Erasmus University Digital Repository

16 L. van Rotjen et al. /Health Policy 33 (1995) IS-29
1. Introduction
The economic costs of disease generally are divided into direct costs and indirect costs. Direct costs represent the value of resources used to prevent, detect and treat a health impairment‘or its effect. Indirect costs represent the value of output lost due to illness or premature death. Indirect costs bear a more implicit relation to illness because they do not directly influence expenditures from treating disease and they are not easily measurable. Nevertheless production losses due to illness and produc- tion gains due to health care influence the wealth of society and should therefore be incorporated in economic evaluations of health care programmes. Indirect costs are often substantial compared to direct costs and strongly influence the cost effec- tiveness. A literature review on studies considering indirect costs of diseases in- dicated that on average indirect costs represented 52% of the total disease costs or total costs saved by health care interventions [l]. Comparability of results of economic evaluations between countries may be hampered due to variation in methodology, data sources, valuation of production losses and social security ar- rangements. If these aspects are comparable, it is possible to analyse the contribution of differences in epidemiology, demography and economic environment to the level of indirect costs and the distribution by diagnosis. In this study indirect costs of disease are calculated for the Netherlands and compared with estimates for Sweden and the United States. The total costs are divided into costs of absence from work, disability and mortality, because different processes and causes are at the root of each of these cost components. We will attempt to trace the contribution of each of the factors mentioned to differences in results across the countries. Finally, we will give recommendations to extend comparability, allowing for a better interpretation of international differences in indirect costs.
2. Metbods and data
Indirect costs of disease are defined as the value of production lost to society due to absence from work and disability and death. It should be emphasized that we do not value human life itself, but we analyse only the economic effects of disease. Other important aspects of illness, like pain and suffering are not dealt with here and should preferably be measured in terms of quality of life. We estimate indirect costs for the Netherlands in 1988, and compare these with Sweden in 1983 [2] and the U.S. in 1980 [3], the most recently published estimates of indirect costs for these countries.
The three studies use the human capital approach to estimate indirect costs. This method calculates the potential indirect costs of diseases. If, for example, someone dies at the age of 35, it is assumed the total earnings from that age until the age of retirement represent the value of production lost. So, the human capital method assumes that all potential years of life lost, short-term absence and long-term disability would have been spent in full productivity. This concept of indirect costs in the economic appraisal in health care is not uncontroversial. Many authors have suggested that the production losses for society are overestimated due to the current

L. van Rogen et al. /Health Policy 33 (1995) 15-29 11
methodology used due to economic circumstances [2,4,5]. For short-term absentee- ism, work may be taken over or postponed. For long-term absences, work can be taken over by unemployed or by reallocation of employees over jobs. An alternative approach called the friction cost method takes into account these economic cir- cumstances that limit production losses to disease. According to this approach production losses are assumed to be confined to the period needed to replace a sick worker: the friction period. The length of this period and the resulting indirect costs depend on the situation on the labour market [6]. Estimates of the indirect costs ac- cording to the friction costs method are only available for the Netherlands. So, for reasons of comparison with the studies of Rice and Lindgren we only present the estimates based on the human capital approach. The share of absence from work, disability and mortality in the total indirect costs and the distribution according diagnosis may be useful tools in health care decision making.
In most studies the production loss of paid and unpaid labour is valued at average market earnings and imputed values of housekeeping services. The estimates of indi- rect costs are the result of average earnings by age and sex and the number of days from work days lost, disabled and death by diagnosis, age and sex. The indirect costs are distributed according to the 17 chapters of the International Classification of Diseases, Injuries and Causes of Death [7]. All studies made a distinction between absence from work, disability and mortality. The study of Lindgren is based on the costs of the incidence of illness in 1 year. Rice used the prevalence method; for the Netherlands we will present results of both methods. The prevalence approach estimates the indirect costs due to the total number of days of absence, disabled and deaths in a year. The incidence method includes only the indirect costs of new cases but takes into account the present and future indirect costs during the expected course of disease. Hence, here this will only make a difference for the costs of disability because absence is defined as a period of sickness shorter than 1 year.
2.1. The Netherlands Table 1 presents an overview of data sources used in the studies. We have used
national disease-specific statistics on absence from work, disability and mortality for 1988. Data on absence from work by diagnosis, age and sex were derived from the Central Office for Statistics 181. This register covers over 50% of the labour force, except for the self-employed and a part of the public employees. Costs of absence from work are based on numbers of days of sickness for periods of absence less than 1 year. Unfortunately, in 70% of the cases of short-term illness the diagnosis is un- known because the patient had no contact with a doctor.
The Mutual Medical Service 191 provided data on incidence and prevalence of disabled employees and early disabled persons by diagnosis, age and between the sexes. There is not much difference in the duration of the disability period between diagnoses and sex [lo]. The average disability period amounts to 15 years and decreases with age. Data on the number of deaths before the age of 65 in the entire population by primary diagnoses, age and sex are also provided by the Central Statistics Bureau [l 11. The average number of days of household production lost per person due to sickness is derived from a Time Use Survey on a representative sample

18 L. van Roijen et al. /Health Policy 33 (1995) 15-29
Table 1 Overview of data used for estimates of indirect costs for the Netherlands 1988, Sweden 1983 and the United States 1980
Netherlands Sweden United States
Absence paid labour Absence non-paid labour Disability Mortality Value production loss due to
morbidity
Value production loss due to mortality
Value household production loss due to morbidity
National Registry Survey National Registry National Registry Average earning per worker by age and Sex
Life time earnings per person by age and sex, disc. 5%
Weighed average eam- Average earnings ings of corresponding per worker by age occupations and sex
National Registry National Registry National Registry National Registry Average earnings per worker by age and sex Life time earnings per person by age and sex, disc, 5%
Survey Survey National Registry National Registry Average earnings per worker by age and sex Life time earnings per person by age and sex, disc. 4% and 6% Weighed average earnings of corres- ponding occupat-
of the Dutch non-institutionalised population [12]. There was no information avail- able about the underlying diagnosis, therefore we have assumed the distribution by diagnosis to be equal to paid labour. Household production years lost are based on the number of deaths before the age of average life expectancy (74 for men and 80 for women). We used the market alternative approach, assuming the value of household production to be equal to the costs of hiring personnel to do the housework [ 131. This is valued at the weighed average gross earnings of occupations that correspond to the main household tasks [ 141. We valued the production loss of paid labour by using the gross average earnings per worker by sex and age taking into account the proportion of full-time and part-time labour [15]. Future earnings per person, based on average earnings and labour force participation rates by sex and age plus imputed household values, are discounted at 5% per year.
2.2. Sweden The National Social Swedish Insurance Board provided data on the number of
sickness days for periods less than 1 year by diagnoses, age and sex. In Sweden nearly all persons in the productive age range are entitled to a sickness benefit cash transfer. So, the estimates do not only refer to employed people but also include people without paid jobs. For periods less than one working week, the recorded illness may be based on either a self-reported diagnosis or a doctor’s diagnosis; if absence from work lasts longer than 6 days, a doctor’s examination is required for receiving sickness benefits. Data on disabled by diagnosis, age and sex were derived from the National Social Swedish Insurance Board. Lindgren assumed that none of the disabled returns to the labour force, so they stay disabled until the age of retirement (65 years). The Swedish National Bureau of Statistics provided data on the number

L. van Roijen et al. /Health Policy 33 (1995) IS-29 19
of deaths before the age of retirement by primary diagnosis, age and sex. The average gross earnings per worker in the relevant age and sex groups were used to estimate the value of production loss due to absence, permanent disability and mortality. Lin- dgren assumed the value of household production to be equal to the gross average earnings in market employment. The future earnings are discounted at 5% per year and labour force participation rates are taken into account.
2.3. United States Rice calculated the costs of absence from work, disability and mortality by diag-
nosis, age and sex for the U.S. in 1980. The number of sickness days by diagnosis of currently employed and housewives is based upon estimates by the National Health Interview Survey (NHIS). The NHIS is a household sample survey of the civilian non-institutionalized population. The number of persons unable to work due to long-term physical or mental illness is based on the publication of the Bureau of Labour Statistics and the number of persons in institutions. The number of persons in institutions is reported by the U.S. Bureau of Census and is allocated to diagnoses according to the type of institution. Rice excluded the influence of the duration of the disability. So, this estimate calculates the loss in 1 year, based on the prevalence of disability during that year. Production losses due to morbidity are valued by the gross earnings for men and women by age and sex. The value of housekeeping was imputed by multiplying hours spent in each kind of domestic task by the wages for corresponding occupations by age and sex. The present value of life time earnings is discounted at 4% and 6%. For our comparison we used the mean unweighed estimates of mortality costs discounted at 4% and 6%, which comes close to 5%.
Table 2 Direct and Indirect costss as share in GDP in % and indirect costs of disease due to absence from works, disability and mortalitya (annual discount rate 5%) as % of total indirect costs, for the Netherlands 1988, Sweden 1983 and U.S. 1980
Netherlands 1988 (%) Sweden 1983 (%) U.S. 1980 (%)
Share in GDP Direct costs Indirect costs absence disability mortality Total costs
Share in indirect costs 1988 1990 1975 1983 1970 1980
Absence from work 20 19 40 38 28 15 Disability 57 58 35 31 15 Mortality 23 22 25 25 71 70 Total indirect costs loo 100 100 100 loo 100
8.9 9.0 1.9 19.2 13.8 8.3 3.8 5.2 1.2
10.9 5.1 1.2 4.4 3.5 5.8
28.1 22.8 16.2
aIncluding the indirect costs due to production losses of unpaid labour.

20 L. van Roijen et al. /Health Policy 33 (1995) 15-29
3.Result.9
3.1. Total indirect costs For reasons of comparison we present direct costs and indirect costs as share of
the GDP. For the Netherlands the total costs of illness in 1988, direct and indirect, amounted to 126 billion Dutch guilders, 28% of the GDP. For Sweden and the U.S. the total costs of illness accounted for 23% and 16% of GDP, respectively (see Table 2). Note that this does not imply that GDP would be increased by this percentage if all diseases would be eracidated. It only indicates the potential loss of GDP due to illness.
The relatively high total cost of illness in the Netherlands is mainly due to indirect costs, which are more than twice the size of the direct costs. For Sweden this ratio is 1.5 and for the U.S. slightly more than one. Expressed as a percentage of the GDP indirect costs due to mortality show the smallest differences between the three coun- tries. Table 3 shows that the distribution of indirect costs according to disease is very similar for the two European countries; non-fatal diseases (mental disorders and lo-
Table 3 Distribution of indirect costs by main disease categories (17 RX-chapters) in the United States, Sweden and the Netherlands in percentages of total indirect costs.
Rice/US. 1980
LindgrenBweden 1983
Netherlands 1988
Discount rate 4% 5% 5%
Infection diseases Neoplasms Endocrinejmetab. dis. Diseases of the blood Mental disorders Disease, nervous system Cardiovascular diseases Respiratory diseases Disease, digestive system Genito-urinary diseases Pregnancy and delivery Diseases of the skin Locomotory diseases Congenital anomalies Perinatal diseases Symptoms Accident, poison and violence Other diseases Unallocated Total
2.4 15.4 2.3 0.4 4.5 2.4
21.5 6.8 4.1 1.3
0.3 3.1 2.0
2.8 26.4 3.8’ 0.0
100.0
1.6 0.9 8.0 4.3 1.9 1.3 0.2 0.1
14.9 18.7 3.9 4.0
12.2 10.2 10.3 3.8 3.6 2.7 1.3 0.9 0.7 I.1 1.0 0.7
21.8 23.5 1.3 1.4 0.5 0.3 3.6 8.4
13.2 7.6 0.0 0.0 0.0 10.3
100.0 100.0
BIncludes complications of pregnancy, childbirth, and puerperium and certain conditions originating during the perinatal.
L. van Rotjen et al. /Health Policy 33 (1995) 15-29 21
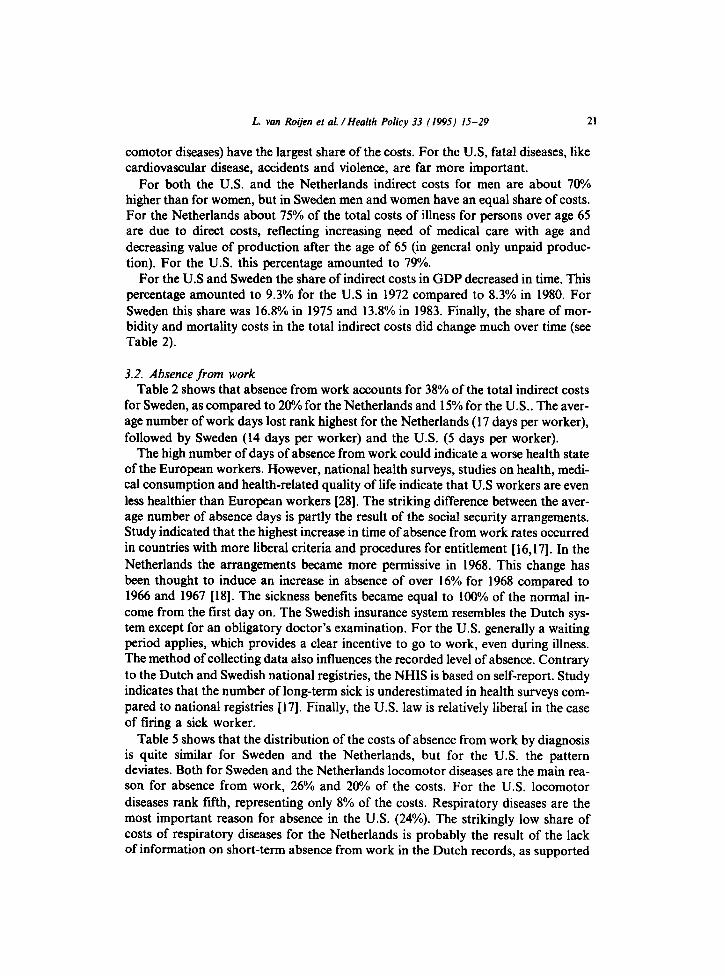
comotor diseases) have the largest share of the costs. For the U.S, fatal diseases, like cardiovascular disease, accidents and violence, are far more important.
For both the U.S. and the Netherlands indirect costs for men are about 70% higher than for women, but in Sweden men and women have an equal share of costs. For the Netherlands about 75% of the total costs of illness for persons over age 65 are due to direct costs, reflecting increasing need of medical care with age and decreasing value of production after the age of 65 (in general only unpaid produc- tion). For the U.S. this percentage amounted to 79%.
For the U.S and Sweden the share of indirect costs in GDP decreased in time. This percentage amounted to 9.3% for the U.S in 1972 compared to 8.3% in 1980. For Sweden this share was 16.8% in 1975 and 13.8% in 1983. Finally, the share of mor- bidity and mortality costs in the total indirect costs did change much over time (see Table 2).
3.2. Absence from work Table 2 shows that absence from work accounts for 38% of the total indirect costs
for Sweden, as compared to 20% for the Netherlands and 15% for the U.S.. The aver- age number of work days lost rank highest for the Netherlands (17 days per worker), followed by Sweden (14 days per worker) and the U.S. (5 days per worker).
The high number of days of absence from work could indicate a worse health state of the European workers. However, national health surveys, studies on health, medi- cal consumption and health-related quality of life indicate that U.S workers are even less healthier than European workers [28]. The striking difference between the aver- age number of absence days is partly the result of the social security arrangements. Study indicated that the highest increase in time of absence from work rates occurred in countries with more liberal criteria and procedures for entitlement [ 16,171. In the Netherlands the arrangements became more permissive in 1968. This change has been thought to induce an increase in absence of over 16% for 1968 compared to 1966 and 1967 [18]. The sickness benefits became equal to 100% of the normal in- come from the first day on. The Swedish insurance system resembles the Dutch sys- tem except for an obligatory doctor’s examination. For the U.S. generally a waiting period applies, which provides a clear incentive to go to work, even during illness. The method of collecting data also influences the recorded level of absence. Contrary to the Dutch and Swedish national registries, the NHIS is based on self-report. Study indicates that the number of long-term sick is underestimated in health surveys com- pared to national registries [17]. Finally, the U.S. law is relatively liberal in the case of firing a sick worker.
Table 5 shows that the distribution of the costs of absence from work by diagnosis is quite similar for Sweden and the Netherlands, but for the U.S. the pattern deviates. Both for Sweden and the Netherlands locomotor diseases are the main rea- son for absence from work, 26% and 20% of the costs. For the U.S. locomotor diseases rank fifth, representing only 8% of the costs. Respiratory diseases are the most important reason for absence in the U.S. (24%). The strikingly low share of costs of respiratory diseases for the Netherlands is probably the result of the lack of information on short-term absence from work in the Dutch records, as supported
22 L. van Roijen et al. /Health Policy 33 (1995) 15-29
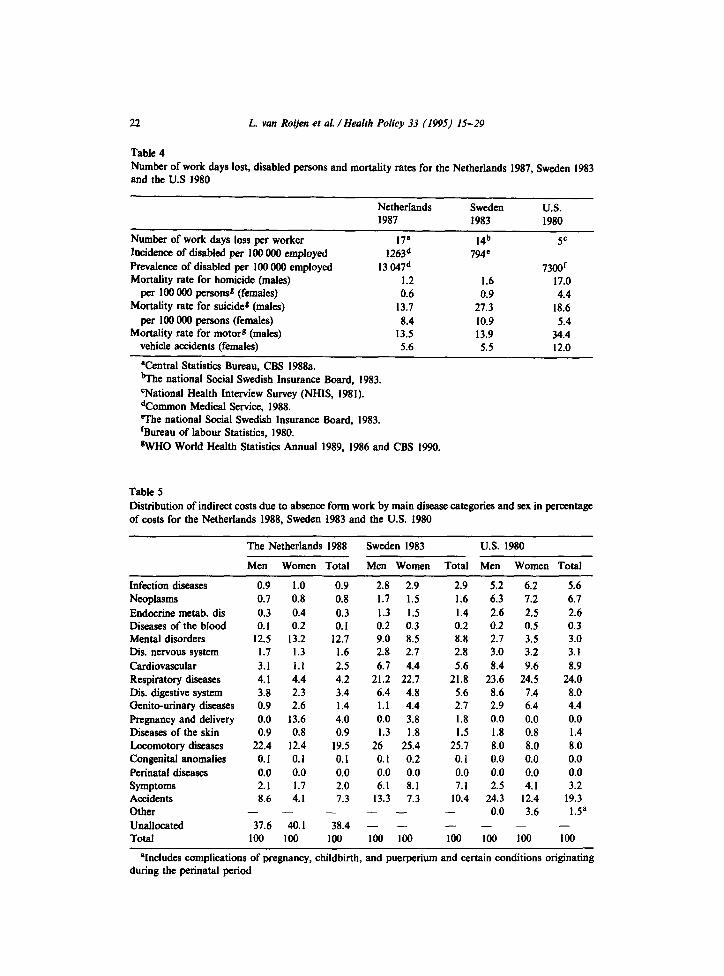
Table 4 Number of work days lost, disabled persons and mortality rates for the Netherlands 1987, Sweden 1983 and the US 1980
Netherlands Sweden U.S.
Number of work days loss per worker 17p Incidence of disabled per 100 000 employed 1263* Prevalence of disabled per 100 000 employed 13 047* Mortality rate for homicide (males) 1.2
per 100 000 persons* (females) 0.6 Mortality rate for suicide* (males) 13.7
per 100 000 persons (females) 8.4 Mortality rate for motors (males) 13.5
vehicle accidents (females) 5.6
1987 1983 1980
14b 794c
5c
1.6 0.9
27.3 10.9 13.9 5.5
73OOr 17.0 4.4
18.6 5.4
34.4 12.0
Ventral Statistics Bureau, CBS 1988a. tithe national Social Swedish Insurance Board, 1983. cNational Health Interview Survey (NHIS, 1981). *Common Medical Service, 1988. me national Social Swedish Insurance Board, 1983. ‘Bureau of labour Statistics, 1980. *WHO World Health Statistics Annual 1989, 1986 and CBS 1990.
Table 5 Distribution of indirect costs due to absence form work by main disease categories and sex in percentage of costs for the Netherlands 1988, Sweden 1983 and the U.S. 1980
The Netherlands 1988 Sweden 1983 U.S. 1980
Men Women Total Men Women Total Men Women Total
Infection diseases Neoplasms Endocrine metab. dis Diseases of the blood Mental disorders Dis. nervous system Cardiovascular Respiratory diseases Dir.. digestive system Genito-urinary diseases Pregnancy and delivery Diseases of the skin Locomotory diseases Congenital anomalies Perinatal diseases Symptoms Accidents Other Unallocated Total
0.9 1.0 0.9 0.7 0.8 0.8 0.3 0.4 0.3 0.1 0.2 0.1
12.5 13.2 12.7 1.7 1.3 1.6 3.1 I.1 2.5 4.1 4.4 4.2 3.8 2.3 3.4 0.9 2.6 1.4 0.0 13.6 4.0 0.9 0.8 0.9
22.4 12.4 19.5 0.1 0.1 0.1 0.0 0.0 0.0 2.1 1.7 2.0 8.6 4.1 1.3
- - - 37.6 40.1 38.4
100 loo 100
2.8 2.9 2.9 5.2 6.2 1.7 1.5 1.6 6.3 7.2 1.3 1.5 1.4 2.6 2.5 0.2 0.3 0.2 0.2 0.5 9.0 8.5 8.8 2.7 3.5 2.8 2.7 2.8 3.0 3.2 6.7 4.4 5.6 8.4 9.6
21.2 22.7 21.8 23.6 24.5 6.4 4.8 5.6 8.6 7.4 1.1 4.4 2.7 2.9 6.4 0.0 3.8 1.8 0.0 0.0 1.3 1.8 1.5 1.8 0.8
26 25.4 25.7 8.0 8.0 0.1 0.2 0.1 0.0 0.0 0.0 0.0 0.0 0.0 0.0 6.1 8.1 7.1 2.5 4.1
13.3 7.3 10.4 24.3 12.4 - - - 0.0 3.6 - - - - - 100 loo loo loo 108
5.6 6.7 2.6 0.3 3.0 3.1 8.9
24.0 8.0 4.4 0.0 1.4 8.0 0.0 0.0 3.2
19.3 1.5a
- 100
%cludes complications of pregnancy, childbirth, and puerperium and certain conditions originating during the perinatal period

L. van Roqen et al. /Health Policy 33 (1995) 15-29 23
by the Swedish data on short-term illness. Accidents, poisoning and violence are the second reason for short-term illness in the U.S. (23%), which is partly the result of the much higher incidence rate of violence and motor vehicle accidents in the U.S. (see Table 4). For Sweden and the Netherlands, the cost share of accidents, poison- ing and violence are in third place, 10% and 7% of the costs. Nearly 13% of the costs of absence from work is due to mental diseases for the Netherlands, for Sweden men- tal illness is responsible for 9% and for the U.S. only 3%. The U.S. data are based on self report and because mental illness is a less socially accepted disease, this could influence the distribution by disease [19]. For all three countries cardiovascular diseases, accidents, poisoning and violence and locomotor diseases are relatively more important for men than women. In both the U.S and the Netherlands, men are responsible for the main share of the costs( 72% and 70%, respectively), although the share of men in the number of work-loss days is only 54% for the U.S. and 59% for the Netherlands. This difference is the result of the higher average income of men compared to women in these two countries. In Sweden both sexes are responsible for about half of the number of days lost as well as the costs.
The loss of unpaid production due to sickness is of minor significance for the U.S (6.7 billion U.S. $) and the Netherlands (1.6 billion DFL.), 3% and 2%, respectively of the total indirect costs. Data of the Dutch Time Use Survey shows that people feeling ill still spend time on household activities. In some age categories, especially for persons having a paid job, household production even increased due to illness. The Swedish estimates incorporates the costs of unpaid production loss but the data did not allow us to estimate these costs.
3.3. Disability The share in the total indirect costs based on the prevalence of disability is 15%
for the US and 57% for the Netherlands. The strikingly high share in the Netherlands is due to a high prevalence of disability, which is the result of high inci- dence and long average duration of disability (see Table 4). Both the level and the length of the period of receiving disability benefits are relatively attractive in the Netherlands. As a consequence, a disability benefit is often preferred to an unemp- loyment benefit. Dutch studies indicate that 15-20% of the persons receiving a disability benefit should actually be considered as unemployed [20,21]. In the U.S. a benefit is only paid in the case of invalidity, i.e. persons unfit for any other job [22]. In addition, the waiting period of 5 months is a clear incentive to continue working. Although, the distribution of the costs by diagnosis may be influenced by the level of indirect costs, some striking differences can be observed. For the Netherlands mental illnesses (29%) and locomotory diseases (24%) rank highest. For the U.S. cardiovascular diseases are the main reason for disability (25%) followed by mental diseases (24%).
Women have a relatively low share of the costs of disability, 25% for the U.S. and 16% for the Netherlands. This reflects the low labour force participation rates for women, 60% for the U.S.and 41% for the Netherlands and the lower average income of women compared to men for both countries [23].
We compared the estimates for the Netherlands with the estimates for Sweden using the incidence method. For the Netherlands 63% of the indirect costs are due

24 L. van Rooen et al. /Health Policy 33 (1995) IS-29
Table 6 Distribution of indirect costs due to disability by main disease categories and sex in percentage of costs for the Netherlands 1988, Sweden 1983 and the U.S. 1980.
The Netherlands 1988 Sweden 1983 U.S. 1980
Men Women Total Men Women Total Men Women Total
Infection diseases 0.7 0.8 0.8 0.9 I Neoplasms 1.4 3.0 2.0 2.8 4.2 Endocrine metab.dis 1.5 1.9 1.6 2.6 2.7 Diseases of the blood 0.1 0.2 0.1 0.1 0.1 Mental disorders 22.3 31.7 24.3 31.7 27.5 Disease, nervous system 5.2 6.2 5.4 6.1 6.6 Cardiovascular 12.4 5.9 11.0 15.8 7 Respiratory diseases 4.3 2.3 3.9 3.2 2.7 Disease, digestive system 2.4 1.7 2.3 1.4 1.4 Genito-urinary diseases 0.6 1.3 0.7 0.6 0.6 Pregnancy and delivery 0.0 0.2 0.0 0 0 Diseases of the skin 0.7 0.8 0.8 0.9 1.4 Locomotory diseases 30.0 25.3 29.0 26.8 38 Congenital anomalies 1.6 1.9 1.7 1.2 1.6 Perinataf diseases 0.0 0.0 0.0 0 0 Symptoms 10.7 13.7 11.3 0.7 1.8 Accidents 5.8 3.3 5.3 5.2 3.5 Other - - - - - Unallocated 0.0 0.0 0.0 - - Total 100 100 100 100 100
1 6.4 7.4 6.5 3.4 10.2 12.1 10.5 2.7 4.1 4.2 4.1 0.1 0.5 0.6 0.5
29.7 23.0 28.8 23.8 6.3 4.6 5.0 4.7
11.7 26.4 Ii.7 25.3 3 5.9 2.8 5.5 1.4 1.9 2.2 1.9 0.6 0.7 0.8 0.7 0 0.0 0.0 0.0 1.1 0.2 0.0 0.2
32 12.5 13.6 12.6 1.4 0.0 0.0 0.0 0 0.0 0.0 0.0 1.2 2.2 2.4 2.2 4.4 1.5 2.4 1.6
- - - - - - - - 100 100 100 100
to disability compared to 37% for Sweden. The Swedish government pursues an ac- tive policy against disability, towards preventive arrangements as substitutes. The distribution of disability costs by diagnosis is quite similar for the two European countries. Locomotor diseases and mental illnesses rank highest, see Table 6. Diseases of the circulatory system are the third main reason for disability in Sweden (12%) and the Netherlands (8%). Neoplasms account for 3.4% of the costs for Sweden and only 1.7% for the Netherlands. The latter difference is partly implied by the method used. In our calculation we have made corrections for the average duration of disability by diagnosis, age and sex. The average duration of disability for neoplasms is relatively short (6 years), compared to the mean duration of 15 years. The share of cancer in these costs for the Netherlands would amount to 3.1% applying the method comparable to Lindgren [2]. He assumed that disability will proceed until the age of 65, irrespective of diagnosis. This caused an over-estimation of the Swedish costs of disability due to cancer.
Contrary to the Dutch situation the share of both sexes in the costs of disability is not significantly different in Sweden, 47% for women. On the other hand, men are responsible for 58% of early retirements. This is caused by the fact that women on average retire earlier than men and consequently the total number of work years lost for women is higher. Besides the participation rate of women is relative high in Sweden, 78% [23].

L. van Roijen et al. /Health Policy 33 (1995) 15-29 25
600
400
200
0 I I I I I
15-24 25-34 35-44 45-54 55-64
-+- netherlands -+- Sweden --t- u. s.
Fig. 1. Death rates per 100 000 persons for the Netherlands (1988), Sweden (1983) and the U.S (1980). source: [11,24,25].
3.4. Mortality Mortality costs are responsible for 23% of the total indirect costs in the
Netherlands, 25% for Sweden and nearly 70% for the U.S. The comparison of the mortality costs clearly demonstrates the’influence of expected lifetime earnings on the results. Fig. 1 presents the number of deaths per 100 000 inhabitants by age and sex for the Netherlands, Sweden and the U.S. [ 11,24,25]. The high share of mortality costs for the U.S. is due to the high mortality in the younger age groups, accounting for considerably higher expected life-time earnings forgone.
The patterns of the costs distributed to diseases due to mortality for Sweden and the Netherlands are less similar than for short-term illness and disability (Table 7). For the Netherlands the main share of the costs of mortality is caused by cancer (28%), followed by cardiovascular disease (24%), also responsible for the highest in- cidence of deaths before the age of 65. Accidents, poisoning and violence come third with 22% of the mortality costs. Both for the U.S. and Sweden, accidents, poisoning and violence rank highest, 32% and 31%, respectively of the costs of mortality.
The high costs of accidents, poisoning and violence in the U.S. are mainly caused by the high incidence of deaths due to violence and traffic accidents compared to European countries (see Table 4). These victims are relatively young and have high expected lifetime earnings. The number of reported suicides is relatively high for

26 L. van Roijen et al. /Health Policy 33 (1995) 15-29
Table I Distribution of indirect costs due to mortality by main disease categories and sex in percentage of costs for the Netherlands 1988, Sweden 1983 and the U.S. 1980
The Netherlands 1988 Sweden 1983 U.S. 1980
Men Women Total Men Women Total Men Women Total
Infection diseases Neoplasms Endocrine metab.dis Diseases of the blood Mental disorders Disease, nervous system Cardiovascular Respiratory diseases Disease, digestive system Genito-urinary diseases Pregnancy and delivery Diseases of the skin Locomotory diseases Congenital anomalies Perinatal diseases Symptoms Accidents Other Unallocated Total
2.1 0.9 2.0 0.9 1.2 26.3 40.3 27.8 18 39.3 2.3 2.0 2.3 1.6 2.3 0.2 0.3 0.2 0.2 0.2 0.7 0.5 0.7 3 I.2 2.6 3.3 2.1 2 2.8
25.0 13.1 23.1 26.1 14.1 1.7 1.9 1.7 3.4 3.7 3.5 3.1 3.4 3.8 3.2 0.3 0.5 0.3 0.4 0.5 0.0 0.6 0.1 0 0 0.0 0.0 0.0 0 0 0.3 0.6 0.3 0.1 0.8 2.6 6.2 3.0 2.4 3.8 2.3 3.8 2.4 1.6 3.1 1.4 5.2 1.2 1.4 1.7
22.8 17.6 22.2 34.5 21.5 - - 100
- - 100
- - 100
- -
100 loo
1 0.9 1.3 1.0 24.4 15.5 26.5 18.8
1.8 1.5 2.9 1.9 0.3 0.3 0.5 0.3 2.5 1.3 0.8 1.1 2.2 1.6 2.1 1.8
23.1 24.5 24.6 24.5 3.5 3.4 4.2 3.6 3.6 4.7 4.8 4.7 0.4 0.6 1.1 0.8 0 0.0 0.0 0.0 0 0.1 0.1 0.1 0.3 0.1 0.7 0.3 2.8 2.1 3.3 2.5 2 0.0 0.0 0.0 1.5 2.6 2.9 2.1
30.6 37.1 18.7 31.7 - 3.7 5.5 4.2a - - - - 100 100 100 100
sIncludes complications of pregnancy, childbirth, and puerperium and certain conditions originating during the perinatal period
Sweden. The average number of suicides per million decreased for Sweden in the last decade, for the Dutch population it increased [26]. This indicates an increase in the fraction of reported suicides in the Netherlands.
For both men and women the mortality costs due to neoplasms rank highest in the Netherlands (26.3% and 40.3%). For Sweden neoplasms also rank highest for women and account for 40% of the mortality costs for women. Cardiovascular diseases and accidents, poisoning and violence are relatively more important for men in all three countries. For the Netherlands men account for 60°/ of the mortality costs. For both the U.S. and Sweden this share is 70%.
4. Discussion
In comparing the estimates of indirect costs for the Netherlands, Sweden and the U.S. the following remarks can be made. Health care costs rose significantly more rapidly than the average earnings in the U.S between 1980 and 1988 [27]. Thus the distribution of direct and indirect costs in 1988 may be expected to be quite different from that in 1980. However, when comparing the share of absence from work, disability and mortality in the total of indirect costs and the distribution of the indi-

L. van Ro&en et al. /Health Policy 33 (1995) 15-29 21
rect costs according to diagnosis, there is no indication of major changes in this re- spect for this period.
In estimating life-time earnings all three studies assumed that people will be work- ing during their expected life-time in accordance with the pattern of labour force par- ticipation rates for their age and sex group for the base year. There is evidence of changes in employment rates for women during time. However, in absence of infor- mation on future developments we assumed constant rates.
Changes in age-, sex- and diagnosis-specific death rates, especially before the age of retirement, may partly explain the differences observed for the different base years across countries. For the U.S. and Sweden death rates for cardiovascular disease for men and women aged 35-74 decreased between 1979 and 1989. However, for other diagnosis, like homicide, these rates increased. Consequently, it is difficult to predict what kind of influence these changes will have on the indirect costs.
We have assumed that the costs of loss of unpaid production are similarly distri- buted by diagnosis as in the case of paid labour. The composition by age and sex of non-professionally employed is quite different from that of the paid workers. Fur- ther study should indicate whether the distribution by diagnosis differs between the two groups. Data on the number of persons incapable of performing household production are lacking for all three studies. These costs are probably low because it has been shown that in general people still spend time on productive activities like household work, childcare and shopping, even when they are ill [9].
Lindgren assumed that the value of household production losses is equal to the gross average earnings. This may be an overestimation of these costs for Sweden, be- cause the average earnings of paid work are higher than the average production value of unpaid work. However, the household production losses for the US and the Netherlands account for only a small amount of the total indirect costs. This in- dicates that both the number of days of absence and the valuation of these losses are low. Therefore, it would probably make a relatively small difference in the total indirect costs for Sweden when valuing these losses at a lower rate.
Finally, the present estimates ignore production losses without absence. These ef- ficiency losses are difficult to quantify but may play an important role in morbidity costs, especially in case of relatively rigid social insurance systems.
5. Coacluslons and recommendations
Our analysis illustrates the possibilities and limitations of comparing indirect cost of disease across countries.
Estimates of morbidity costs should be treated with caution. The costs of absence from work and the distribution by diagnosis are quite similar for the Netherlands and Sweden. A comparison with the U.S. is complicated due to differences in social security arrangements and because the U.S. data on absence are based on interviews, whereas data for the Netherlands and Sweden are registry based.
The costs of disability are high for the Netherlands, which is presumably not caus- ed by differences in morbidity, but is mainly due to the favourable social insurance arrangements. Comparison of disability costs between the three countries is

28 L. van Roijen et al. /Health Policy 33 (1995) 15-29
hampered due to insufficient quantitative information on the influence of these ar- rangements on the level of indirect costs and the distribution by diagnosis. Estimates on mortality costs are comparable and express potential years of life lost, weighed by country-specific differences in labour costs and participation rates. The large number of deaths at young age in the U.S. is responsible for the high mortality costs as compared to the two European countries.
The following recommendations can be made for making estimates of indirect costs more uniform. First, valuation of production losses and discount rates used should be similar. In addition, because the influence in social insurance systems on absence and disability appears to be considerable, longitudinal study is required to quantify its impact on morbidity costs. Study is also required on the interaction be- tween unemployment and absence from work and disability.
Estimates of indirect costs should preferably be based on national registries. For the Netherlands the registration of diagnosis on short-term illness should be im- proved. A national registry on absence from work for the U.S. would increase the reliability of the estimates of indirect costs. After correcting for differences mention- ed above, the remaining variation in absence, disability and mortality costs should be analysed in relation to economic, demographic, epidemiological or cultural dif- ferences.
Our calculations are based on estimated potential production losses. We would prefer comparing estimates of indirect costs which really occur in society, for in- stance based on the friction cost method. Additional data for Sweden and the U.S. is needed to calculate indirect costs according to this method. Very likely there will remain differences in the contribution of the different diagnosis groups to the direct and indirect costs between countries.
Acknowledgement
We thank professor D. Rice for her comments on early versions of this article and professor B. Lindgren for providing additional details on his study.
References
[I] Koopmanschap, M.A. and Rutten, F.F.H., Indirect costs in Economic Studies, Pharmaco Econo- mics 4(6) (1993) 1-9.
[2] Lindgren, B., The economic impact of illness. In U. Abshagen and F.E. Munnich (Eds.), Cost of Illness and Benefit of Drug Treatment, Springer-Verlag, Munich, 1990.
[3] Rice, D.P., Hodgson, T.A. and Kopstein A.N., The economic cost of ilness: a replication and up- date, Health Care Financing Review 7 (1985) 61-80.
[4] Drummond, M., Cost of illness study: a major headache?, Pharmaco Economics 2( 1) (1992) l-4,. (51 Gerard, K., Donaldson, C. and Maynard K.A., 1989, The cost of diabetes, Diabetec-Medicine 6(2)
(1989) 164-170. [6] Koopmanschap, M.A. and Ineveld van, B.M., Towards a new approach for estimating indirect
costs of disease, Social Science and Medicine, 34(9) (1992) 1005-1010. [7] W.H.O., World Health Organisation, International Statistical Classification of Diseases, Injuries
and Causes of Death, Geneva, 1977. [8] CBS, Central Statistics Bureau, Diagnose Statistics (on absence from work) 1987 (in Dutch), The
Hague, 1988a.

L. van Rotjen et al. /Health Policy 33 (1995) 15-29 29
[9] GMD, Mutual Medical Service, Number of Incidence of Disabled by Diagnosis, Age and Sex for 1988, Mutual Medical Service (GMD), Amsterdam, 1990.
[lo] van Eck, M.A.A. and Zijlstra G.J., The Expected Duration of Disability Benefits (in Dutch), Amsterdam, 1986.
[ll] CBS, Central Statistics Bureau, Deaths by Cause of Death by Age and Sex 1988, Health Month Statistics, The Hague, 1989.
(121 CBS, Central Statistics Bureau, Time Use Survey, Time Use Survey for 1987 and 1988, The Hague, 1992.
[13] Harwryslyshyn 0.. Toward a definition of non-market activities, Review of Income and Wealth, 23 (1977) 79-96.
[14] LTD. Development of Terms of Employment in 1990 in the Market Sector (in Dutch), Department of Social Affairs and Employment, The Hague, April 1992.
[15] CBS, Central Statistics Bureau, Social Economic Month Statistics 1988 (in Dutch), The Hague, 1988b.
1161 Enterline Philip E. PhD., Social causes of sick absence, Archives of Environmental Health, 12 (1966) 467-743.
[17] Prim R., Sickness Absence in Belgium, Germany (fr) and the Netherlands; A comparative study, Dutch Institute for Working Conditions (NIA), Amsterdam, 1990.
[I81 Taylor, P.J. International Comparison of sickness absence, Prov. Roy. Social Medicine, 65, June 1972.
[19] Rubin R.J., Gold W.A., Kelley D.K. and Sher J.P., The Cost of Disorder of the Brain, Report of the National Foundation for Brain Research, Washington, 1992, pp. 7.
[20] Roodenburg H.J. and Wong W., The Labour Market Component in the Disablement Benefit (in Dutch), Central Oftice for Planning, The Hague, 1985.
[21] Vrooman J.C. and de Kemp A.A., Disablement and labour market (in Dutch), Economic Statistical News, 3778 (1990) 942-943.
[22] Social Security Bulletin, Social security programs in the United States, 52(7) July 1989. [23] OECD, Organisation for Economic Cooperation and Development, Employment Outlook, Credes,
Paris, September 1988. [24] W.H.O., World Health Organisation,.Annual 1983, Injuries and Causes of Death, Geneva, 1986. (251 W.H.O., World Health Organisation, Annual 1980, Injuries and Causes of Death, Geneva, 1983. [26] W.H.O., World Health Organisation, Annual 1988, Injuries and Causes of Death, Geneva, 1991. [27] OECD, Organisation for Economic Cooperation and Development, OECD Health Data. [28] Adams P.F. and Benson V., Current estimates from the national health interview survey. The na-
tional center for health statistics, Vital Health Statistics 10 (181), 1991.