Indices Used to Assess RMS Voltage...
24
-
Upload
duongkhanh -
Category
Documents
-
view
214 -
download
0
Transcript of Indices Used to Assess RMS Voltage...
D. Sabin - 18 July 2000 - Page 2
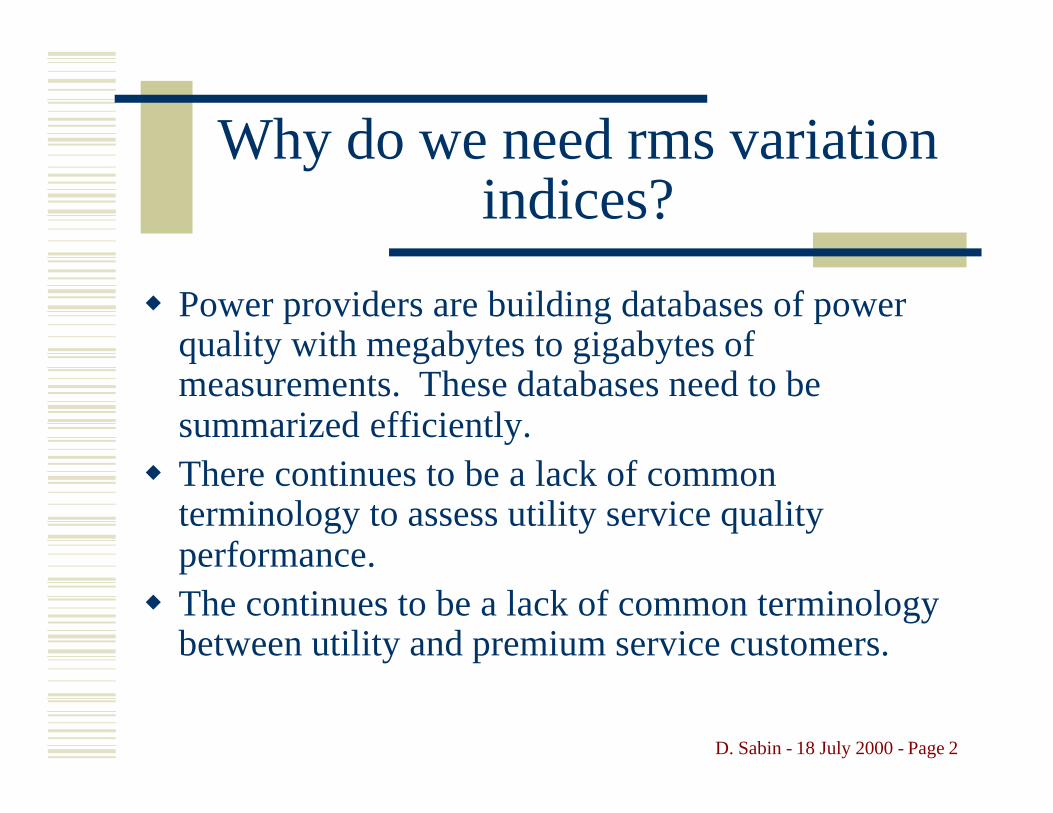
Why do we need rms variation indices?
w Power providers are building databases of power quality with megabytes to gigabytes of measurements. These databases need to be summarized efficiently.w There continues to be a lack of common
terminology to assess utility service quality performance.w The continues to be a lack of common terminology
between utility and premium service customers.

D. Sabin - 18 July 2000 - Page 3
Intent of Indices
w Individual customer leveln serve as a specific metric of compatibility
between customer processes and the electrical environment
w Utility system leveln serve as a general quality metric to be used by
the power provider for proactive planning and maintenance

D. Sabin - 18 July 2000 - Page 4
RMS Voltage Variations
Voltage Sag Voltage Swell
Voltage Interruption
Short Duration: System FaultsLoad Inrush
Long Duration: Regulation Problems

Magnitude-Duration Characterization of RMS Voltage Variations
-100%
-80%
-60%
-40%
-20%
0%
20%
40%
60%
80%
100%
Vol
tage
(%
)
Minimum rmsvalue = 45%
Duration = 5 cycles
Most power quality monitoringinstruments and software packages report rms variationswith a magnitude and a duration.

D. Sabin - 18 July 2000 - Page 6
Compliance with ITIC Curves - 1997
ITIC: Information Technology Industry Council
Total Events: 24Events Violating ITIC Lower Curve: 10Events Violating ITIC Upper Curve: 0
0
0.5
1
1.5
2
2.5
0.001 0.01 0.1 1 10 100 1000
Duration (seconds)
Vol
tage
Mag
nitu
de (p
u)
Magnitude-Duration Scatter Plot

D. Sabin - 18 July 2000 - Page 7
Compliance with SEMI Curve - 1998
SEMI: Semiconductor Equipment and Materials International group
Total Events: 24
Events Violating SEMI Curve: 7
0
0.2
0.4
0.6
0.8
1
1.2
0.001 0.01 0.1 1 10 100 1000
Duration (seconds)
Vol
tage
Mag
nitu
de (p
u)
Magnitude-Duration Scatter Plot
D. Sabin - 18 July 2000 - Page 8
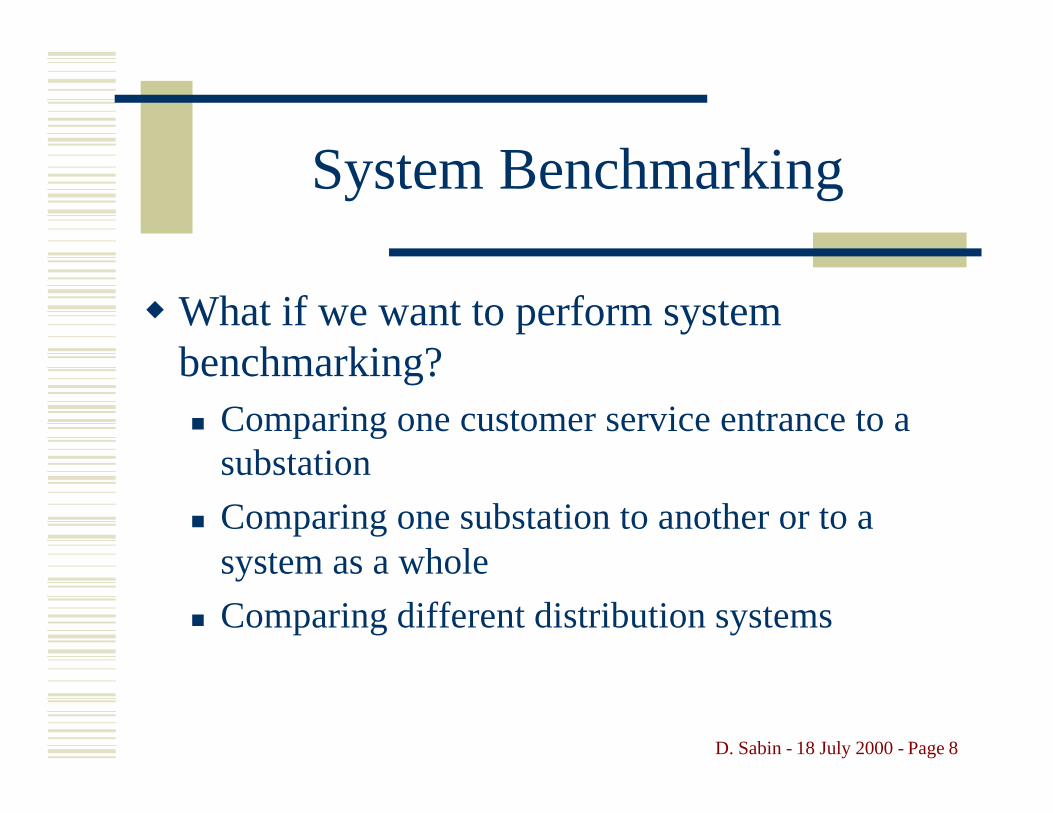
System Benchmarking
wWhat if we want to perform system benchmarking?n Comparing one customer service entrance to a
substation
n Comparing one substation to another or to a system as a whole
n Comparing different distribution systems

D. Sabin - 18 July 2000 - Page 9
SARFIX Index
w System Average RMS Variation Frequency Index
w Research sponsored by EPRIw Number of specified short-
duration rms variation per system customer
w Voltage threshold allows assessment of compatibility for voltage-sensitive devices
w First use came about because of EPRI R&D project
T
iV N
NSARFI ∑=%
%V ≡ rms voltage threshold140, 120, 110, 90, 80, 70, 50, 10
Ni ≡ # customers experiencingrms < %V for variation i(rms > %V for %V >100)
NT ≡ total # system customers
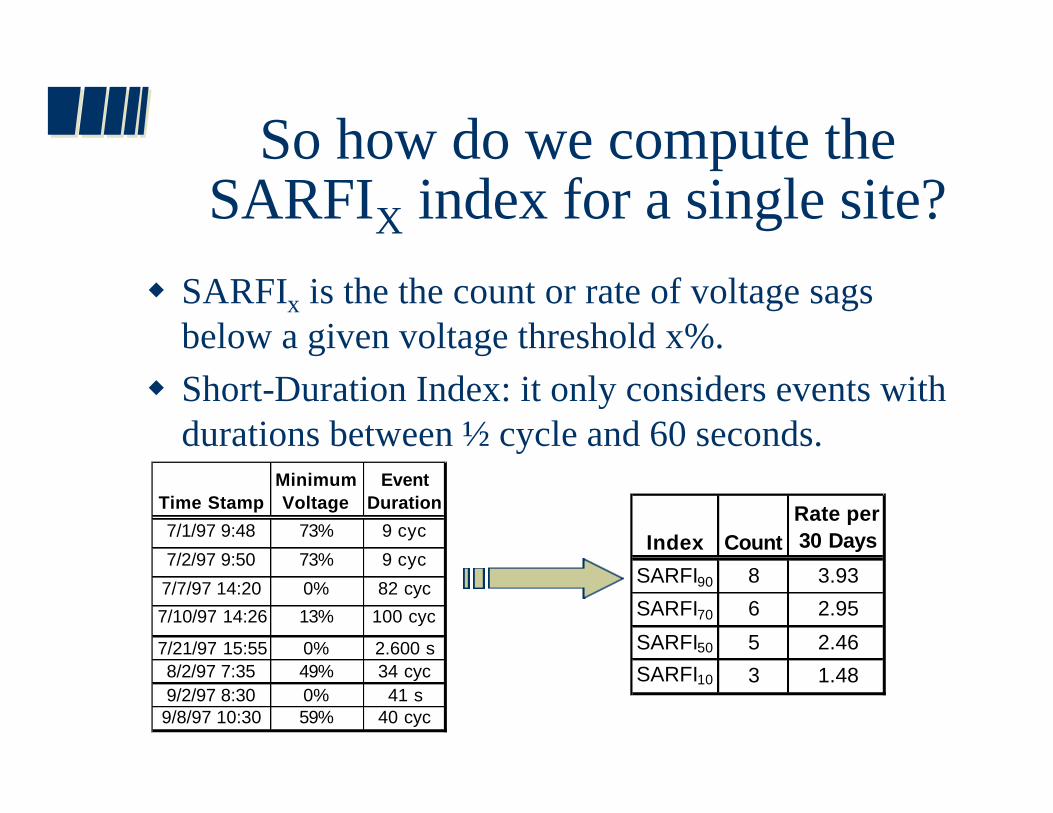
So how do we compute the SARFIX index for a single site?
w SARFIx is the the count or rate of voltage sags below a given voltage threshold x%.
w Short-Duration Index: it only considers events with durations between ½ cycle and 60 seconds.
Time StampMinimum Voltage
Event Duration
7/1/97 9:48 73% 9 cyc
7/2/97 9:50 73% 9 cyc
7/7/97 14:20 0% 82 cyc
7/10/97 14:26 13% 100 cyc
7/21/97 15:55 0% 2.600 s8/2/97 7:35 49% 34 cyc9/2/97 8:30 0% 41 s9/8/97 10:30 59% 40 cyc
Index CountRate per 30 Days
SARFI90 8 3.93
SARFI70 6 2.95
SARFI50 5 2.46
SARFI10 3 1.48

D. Sabin - 18 July 2000 - Page 11
SARFI Indices with Magnitude and Duration
w SARFICBEMA
n Rate of voltage sags below lower CBEMA curve
w SARFIITIC
n Rate of voltage sags below lower ITIC curve
w SARFISEMI
n Rate of voltage sags below SEMI curve
w SARFICustomCurve

D. Sabin - 18 July 2000 - Page 12
SARFI Statisticsfrom EPRI DPQ Project
SARFI90 SARFI80 SARFI70 SARFI50 SARFI10 SARFICBEMA SARFIITIC SARFISEMI
Minimum 0.000 0.000 0.000 0.000 0.000 0.000 0.000 0.000CP05 11.887 5.594 0.000 0.000 0.000 5.316 2.791 2.362CP50 43.987 22.813 12.126 5.165 1.525 25.465 18.765 13.619Mean 56.308 28.729 18.422 8.926 3.694 33.293 25.390 18.535CP95 135.185 66.260 51.000 27.037 13.519 71.413 51.500 38.238Maximum 207.644 103.405 70.535 56.311 35.689 149.488 140.768 140.768
SARFI Rates for Substation Locations of EPRI DPQ Project,from 6/1/93 to 6/1/95, rates in events per 365 days, 60-sec temporal aggregation, treated using sampling weights

D. Sabin - 18 July 2000 - Page 13
What utilities are using SARFI as part of their power quality assessment efforts?
w American Electric Powerw Baltimore Gas and Electricw Consolidated Edison Company of New Yorkw Public Service Electric and Gasw San Diego Gas and Electricw Southern California Edisonw Tennessee Valley Authorityw United Illuminating Company

D. Sabin - 18 July 2000 - Page 14
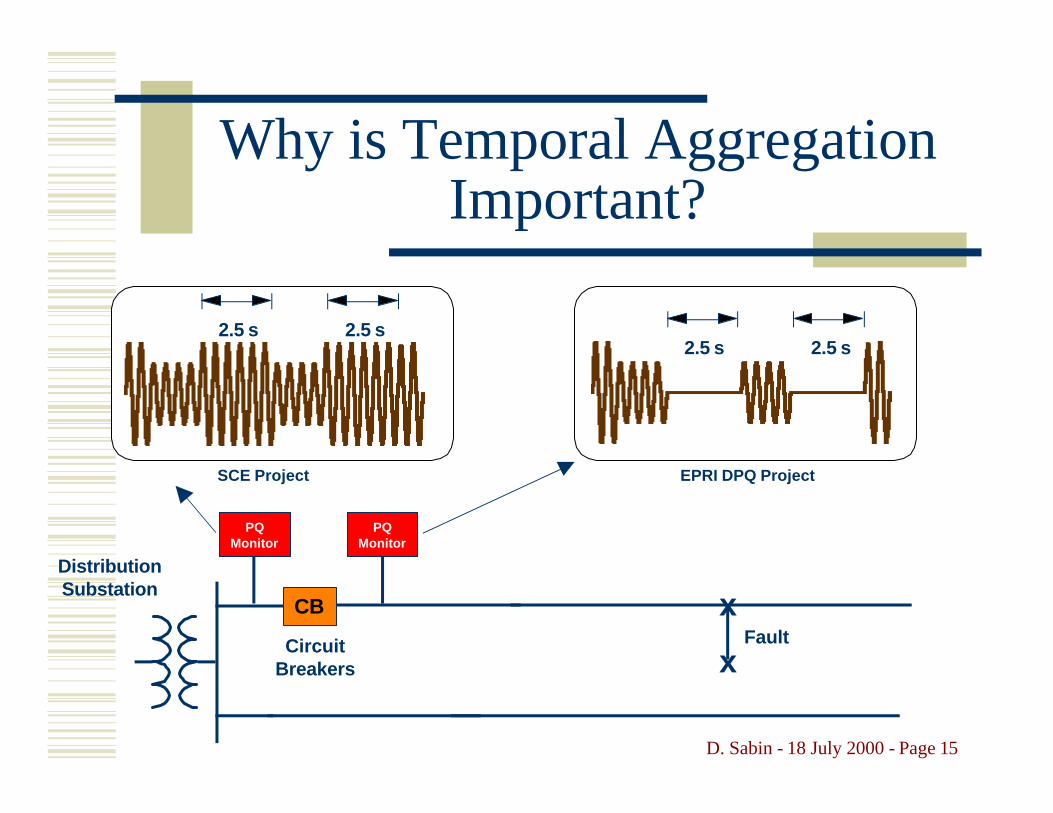
RMS Variation Aggregation
w Allows us to combine the measurements taken from different phases, trigger times, or locations into one aggregate event n Measurement aggregation
l multiple phases or channels per measurement
n Temporal Aggregationl breaker reclosing
n Spatial Aggregationl multiple monitors per location
D. Sabin - 18 July 2000 - Page 15
Why is Temporal Aggregation Important?
CircuitBreakers
CB
DistributionSubstation
Fault
2.5 s 2.5 s2.5 s 2.5 s
x
x
PQMonitor
PQMonitor
EPRI DPQ ProjectSCE Project
D. Sabin - 18 July 2000 - Page 16
What Else is Available?
w DISDIP Tablen Popular in IEC communities
w DECO SMC Sag Score
w ESKOM Table
w IEEE 1159.2 Characterization

D. Sabin - 18 July 2000 - Page 17
( )CBA VVVScoreSag ++−=3
11
Sag Score
w Detroit Edison’s uses a “sag score” to administer its voltage sag contracts with its automotive customers.
w Sag score is the average per unit voltage lost.
w Spatial and temporal aggregationn Sag agreements only consider the worst sag each 15-minute
period per location

D. Sabin - 18 July 2000 - Page 18
ESKOM Voltage Dip Table
w Count number of voltage sags in rectangular magnitude-duration bins
Compatibility levelCompatibility level
100%
60%
20%
10%
20ms 150ms 600ms 3s
Y
X SZ
T

D. Sabin - 18 July 2000 - Page 19
S T X ( Y ) Z
6.6 kV to 44 kV
>44 kV to 132 kV
>44 kV to 132 kV (rural)
>132 kV to 765 kV
30 30 100 150 20
69 54 215 314 49
25 25 80 120 16
11 6 45 88 5
S T X ( Y ) Z
6.6 kV to 44 kV
>44 kV to 132 kV
>44 kV to 132 kV (rural)
>132 kV to 765 kV
10 8 50 75 10
25 15 100 150 20
10 10 50 80 5
3 3 33 40 2
ESKOM Voltage Sag Indices
w Voltage Sag Performance Requirements
w Indicative levels for ESKOM System
D. Sabin - 18 July 2000 - Page 20
IEEE Task Force P1159.2Waveform Characteristics
w What’s New?n Point-in-Wave Characteristics
l point of initiation, point of recovery, apparent duration
n Transition Anglesl initial transition angle, final transition angle, maximum phase
angle during the event, post-event angle
n Missing Voltage, Unbalance Ratio, Harmonic Distortion during Disturbance
n Magnitude of three-phase diode rectifier bridge
w Will require a relatively more sophisticated power quality meter as characteristics as waveforms are needed, not just rms.
D. Sabin - 18 July 2000 - Page 21
2 4 2 4 . 5 2 5 2 5 . 5 2 6 2 6 . 5 2 7 2 7 . 5 2 80
0 . 2
0 . 4
0 . 6
0 . 8
1
1 . 2
1 . 4
t i m e ( m s e c )
vo
lta
ge
p
.u
V o l t a g e1 0 % e n v e l o p e5 % e n v e l o p e
P o i n t o fI n i t i a t i o n
0 5 0 1 0 0 1 5 0 2 0 0- 1
- 0 . 5
0
0 . 5
1
1 . 5
t i m e ( m s e c )
vo
lta
ge
p
.u
V o l t a g eV i d e a l
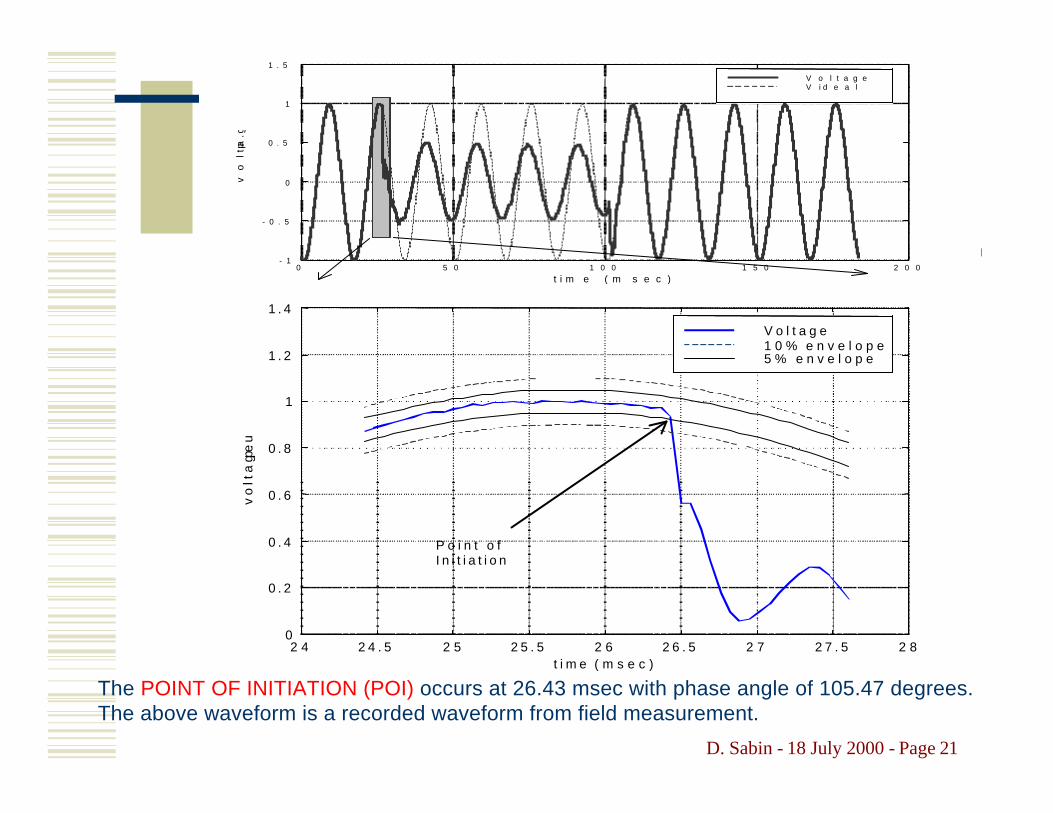
The POINT OF INITIATION (POI) occurs at 26.43 msec with phase angle of 105.47 degrees. The above waveform is a recorded waveform from field measurement.
D. Sabin - 18 July 2000 - Page 22
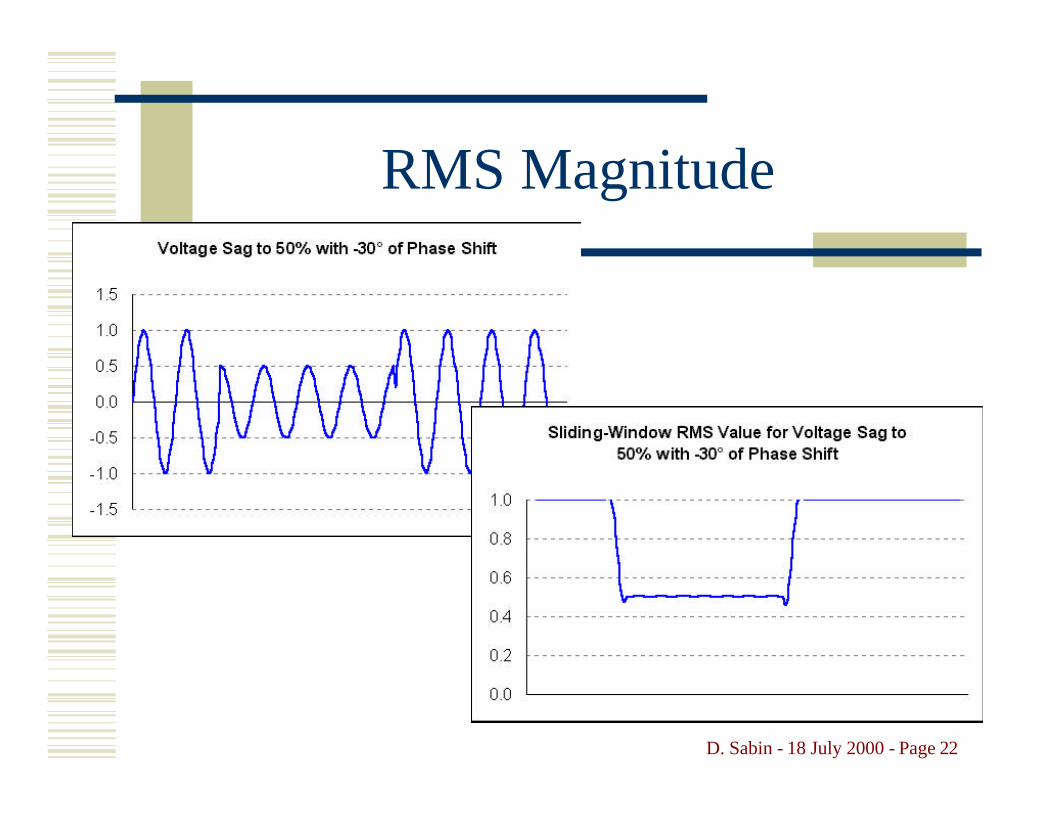
RMS Magnitude
D. Sabin - 18 July 2000 - Page 23
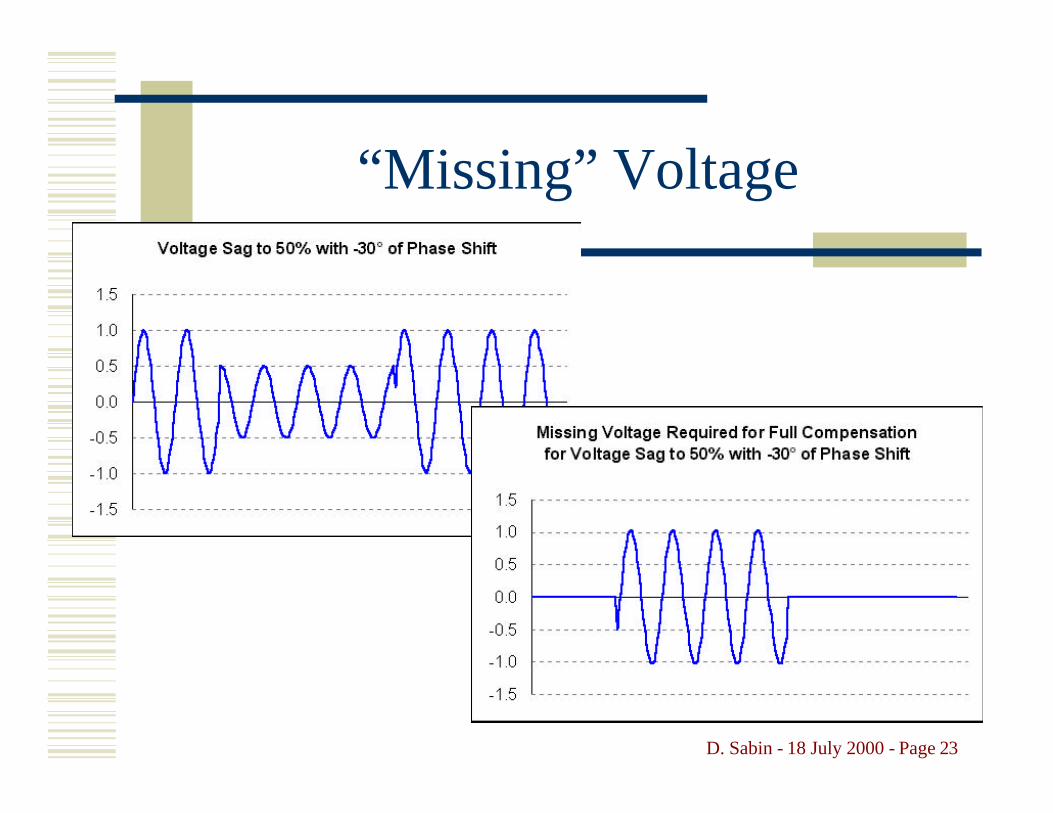
“Missing” Voltage

D. Sabin - 18 July 2000 - Page 24
Conclusions
w Indices are needed for standardization of terminology.
w Indices should be compatibility-based.
w Indices should allow for general planning or specific evaluation.
w Indices should be feasible to compute based on the data available. Simplicity!