Indicators_2016.pdf · Inequality Even though poverty has declined to a greater extent at national...
4
Poverty Indicators Department of Census and Statistics Household Income and Expenditure Survey - 2016 Ministry of National Policies and Economic Affairs Sri Lanka Special points of interest In 2016 poverty headcount index was 4.1 percent and it was declined from 6.7 per- cent in 2012/13 The highest Headcount Index reported from Kilino- chchi district and the lowest from Colombo district. The highest number of poor people who were below the poverty line were reported in Kandy district and the lowest reported in Mannar district. In 2016, 843,913 people were in poverty The highest inequality of real per capita expenditure has been reported from Kurune- gala district and the lowest reported from Ampara dis- trict Average shorall is Rs.620 in real term per month per poor person Inside this issue Poverty disparies ...................2 Inequality .................................2 Poverty shorall .....................3 Severity of the poverty.............3 Impact of social protecon pro- grams on poverty………………………4 Simulaon of poverty………………..4 Introduction The Household Income and Expenditure Survey (HIES) is the main data source use to calculate poverty indices for Sri Lanka. This survey is con- ducted by Department of Census and Stascs once in three years and the latest survey was conducted in 2016. This bullen provides informaon on poverty in Sri Lanka for 2016. The changes of poverty status over the survey periods based on the official poverty line which was established in 2004 and updated to allow the price changes using Colombo Consumer Price Index (CCPI) over the survey periods from 2002 to 2016. The method uses to calculate official poverty line is called Cost of Basic Need (CBN) method. This poverty line is considered as an abso- lute poverty line and does not vary geographically. The Official Poverty Line (OPL) for 2016 is Rs.4,166. That is the real per capita expenditure per month for a person fixed at a specific welfare level with the consumpon expenditure of food and non-food items. . ISSN 1391 - 4693 October 2017 Figure 1 : Distribuon of poverty headcount index by district -2016 Figure 2 : Poverty headcount index by survey period Determination of poverty Poverty status is determined by comparing the monthly real per capita expenditure to official poverty line. If the per capita monthly real ex- penditure is less than the value of the official pov- erty line, then that individual is considered to be in poverty. The poverty headcount index for 2016 was 4.1 and it has decreased from 6.7 in 2012/13. From 2002 to 2016, the long term overall poverty index has shown a downward trend. In 2016 approximately 843,913 individuals were in poverty. For the previ- ous survey year 2012/13 it was 1.3 million. This represents a 0.5 million decline from 2012/13 to 2016. The total poor households were 3.1 percent of the total households and it was approximately 169,392 households in 2016 Real per capita expenditure – Adjusted per capita expendi- ture for the price differences using spaal price indices which were calculated for each district is defined as real per capita expenditure . The Figure 2 shows how poverty is changing over the survey periods in percentage points with respect to the total populaon. Page 1-4
Transcript of Indicators_2016.pdf · Inequality Even though poverty has declined to a greater extent at national...

Poverty Indicators Department of Census and Statistics Household Income and Expenditure Survey - 2016
Ministry of National Policies and Economic Affairs Sri Lanka
Special points of interest
In 2016 poverty headcount index was 4.1 percent and it was declined from 6.7 per-cent in 2012/13
The highest Headcount Index reported from Kilino-chchi district and the lowest from Colombo district.
The highest number of poor people who were below the poverty line were reported in Kandy district and the lowest reported in Mannar district.
In 2016, 843,913 people were in poverty
The highest inequality of real per capita expenditure has been reported from Kurune-gala district and the lowest reported from Ampara dis-trict
Average shortfall is Rs.620 in real term per month per poor person
Inside this issue
Poverty disparities ...................2
Inequality .................................2
Poverty shortfall .....................3
Severity of the poverty.............3
Impact of social protection pro-grams on poverty………………………4
Simulation of poverty………………..4
Introduction The Household Income and Expenditure Survey
(HIES) is the main data source use to calculate
poverty indices for Sri Lanka. This survey is con-
ducted by Department of Census and Statistics once
in three years and the latest survey was conducted
in 2016.
This bulletin provides information on poverty in Sri
Lanka for 2016. The changes of poverty status over
the survey periods based on the official poverty
line which was established in 2004 and updated to
allow the price changes using Colombo Consumer
Price Index (CCPI) over the survey periods from
2002 to 2016. The method uses to calculate official
poverty line is called Cost of Basic Need (CBN)
method. This poverty line is considered as an abso-
lute poverty line and does not vary geographically.
The Official Poverty Line (OPL) for 2016 is Rs.4,166.
That is the real per capita expenditure per month
for a person fixed at a specific welfare level with the
consumption expenditure of food and non-food
items. .
ISSN 1391 - 4693 October 2017
Figure 1 : Distribution of poverty headcount index
by district -2016
Figure 2 : Poverty headcount index by survey period
Determination of poverty Poverty status is determined by comparing the
monthly real per capita expenditure to official
poverty line. If the per capita monthly real ex-
penditure is less than the value of the official pov-
erty line, then that individual is considered to be in
poverty.
The poverty headcount index for 2016 was 4.1 and
it has decreased from 6.7 in 2012/13. From 2002 to
2016, the long term overall poverty index has
shown a downward trend. In 2016 approximately
843,913 individuals were in poverty. For the previ-
ous survey year 2012/13 it was 1.3 million. This
represents a 0.5 million decline from 2012/13 to
2016. The total poor households were 3.1 percent
of the total households and it was approximately
169,392 households in 2016
Real per capita expenditure –
Adjusted per capita expendi-
ture for the price differences
using spatial price indices which
were calculated for each district
is defined as real per capita
expenditure .
The Figure 2 shows how poverty is changing over the
survey periods in percentage points with respect to
the total population.
Page 1-4
Inequality
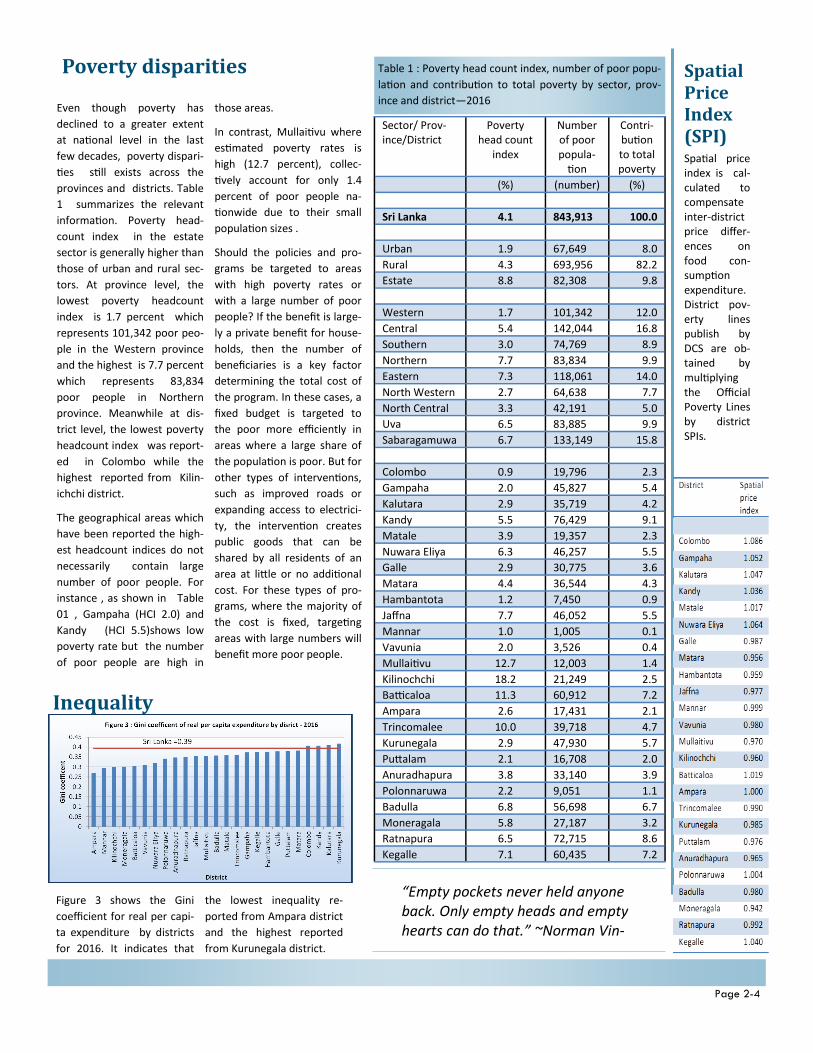
Even though poverty has
declined to a greater extent
at national level in the last
few decades, poverty dispari-
ties still exists across the
provinces and districts. Table
1 summarizes the relevant
information. Poverty head-
count index in the estate
sector is generally higher than
those of urban and rural sec-
tors. At province level, the
lowest poverty headcount
index is 1.7 percent which
represents 101,342 poor peo-
ple in the Western province
and the highest is 7.7 percent
which represents 83,834
poor people in Northern
province. Meanwhile at dis-
trict level, the lowest poverty
headcount index was report-
ed in Colombo while the
highest reported from Kilin-
ichchi district.
The geographical areas which
have been reported the high-
est headcount indices do not
necessarily contain large
number of poor people. For
instance , as shown in Table
01 , Gampaha (HCI 2.0) and
Kandy (HCI 5.5)shows low
poverty rate but the number
of poor people are high in
those areas.
In contrast, Mullaitivu where
estimated poverty rates is
high (12.7 percent), collec-
tively account for only 1.4
percent of poor people na-
tionwide due to their small
population sizes .
Should the policies and pro-
grams be targeted to areas
with high poverty rates or
with a large number of poor
people? If the benefit is large-
ly a private benefit for house-
holds, then the number of
beneficiaries is a key factor
determining the total cost of
the program. In these cases, a
fixed budget is targeted to
the poor more efficiently in
areas where a large share of
the population is poor. But for
other types of interventions,
such as improved roads or
expanding access to electrici-
ty, the intervention creates
public goods that can be
shared by all residents of an
area at little or no additional
cost. For these types of pro-
grams, where the majority of
the cost is fixed, targeting
areas with large numbers will
benefit more poor people.
“Empty pockets never held anyone back. Only empty heads and empty hearts can do that.” ~Norman Vin-
Poverty disparities Table 1 : Poverty head count index, number of poor popu-
lation and contribution to total poverty by sector, prov-
ince and district—2016
Figure 3 shows the Gini
coefficient for real per capi-
ta expenditure by districts
for 2016. It indicates that
the lowest inequality re-
ported from Ampara district
and the highest reported
from Kurunegala district.
Page 2-4
Sector/ Prov-ince/District
Poverty head count
index
Number of poor popula-
tion
Contri-bution to total poverty
(%) (number) (%)
Sri Lanka 4.1 843,913 100.0
Urban 1.9 67,649 8.0
Rural 4.3 693,956 82.2
Estate 8.8 82,308 9.8
Western 1.7 101,342 12.0
Central 5.4 142,044 16.8
Southern 3.0 74,769 8.9
Northern 7.7 83,834 9.9
Eastern 7.3 118,061 14.0
North Western 2.7 64,638 7.7
North Central 3.3 42,191 5.0
Uva 6.5 83,885 9.9
Sabaragamuwa 6.7 133,149 15.8
Colombo 0.9 19,796 2.3
Gampaha 2.0 45,827 5.4
Kalutara 2.9 35,719 4.2
Kandy 5.5 76,429 9.1
Matale 3.9 19,357 2.3
Nuwara Eliya 6.3 46,257 5.5
Galle 2.9 30,775 3.6
Matara 4.4 36,544 4.3
Hambantota 1.2 7,450 0.9
Jaffna 7.7 46,052 5.5
Mannar 1.0 1,005 0.1
Vavunia 2.0 3,526 0.4
Mullaitivu 12.7 12,003 1.4
Kilinochchi 18.2 21,249 2.5
Batticaloa 11.3 60,912 7.2
Ampara 2.6 17,431 2.1
Trincomalee 10.0 39,718 4.7
Kurunegala 2.9 47,930 5.7
Puttalam 2.1 16,708 2.0
Anuradhapura 3.8 33,140 3.9
Polonnaruwa 2.2 9,051 1.1
Badulla 6.8 56,698 6.7
Moneragala 5.8 27,187 3.2
Ratnapura 6.5 72,715 8.6
Kegalle 7.1 60,435 7.2
Spatial Price Index (SPI) Spatial price index is cal-culated to compensate inter-district price differ-ences on food con-sumption expenditure. District pov-erty lines publish by DCS are ob-tained by multiplying the Official Poverty Lines by district SPIs.
Poverty shortfall
Poverty headcount index is
the common indicator use to
measure poverty. But it does
not take into account the
depth and the severity of pov-
erty among the poor. But for
better targeting for reduction
of poverty, it is important to
consider the depth and the
inequality among the poor.
Squared Poverty Gap Index
(SPGI) measures poverty tak-
ing into account the degree of
inequality among the poor
themselves where keeping
more weight to the poorer
individual falls well below the
poverty line. In other words,
when calculating SPGI by
squaring the Poverty Gap and
then gives a greater weight to
the poorest individuals since
there Poverty Gap is larger
than the others.
Sixth column of Table 2 pre-
sents the distribution of SPGI
by district in 2016 .
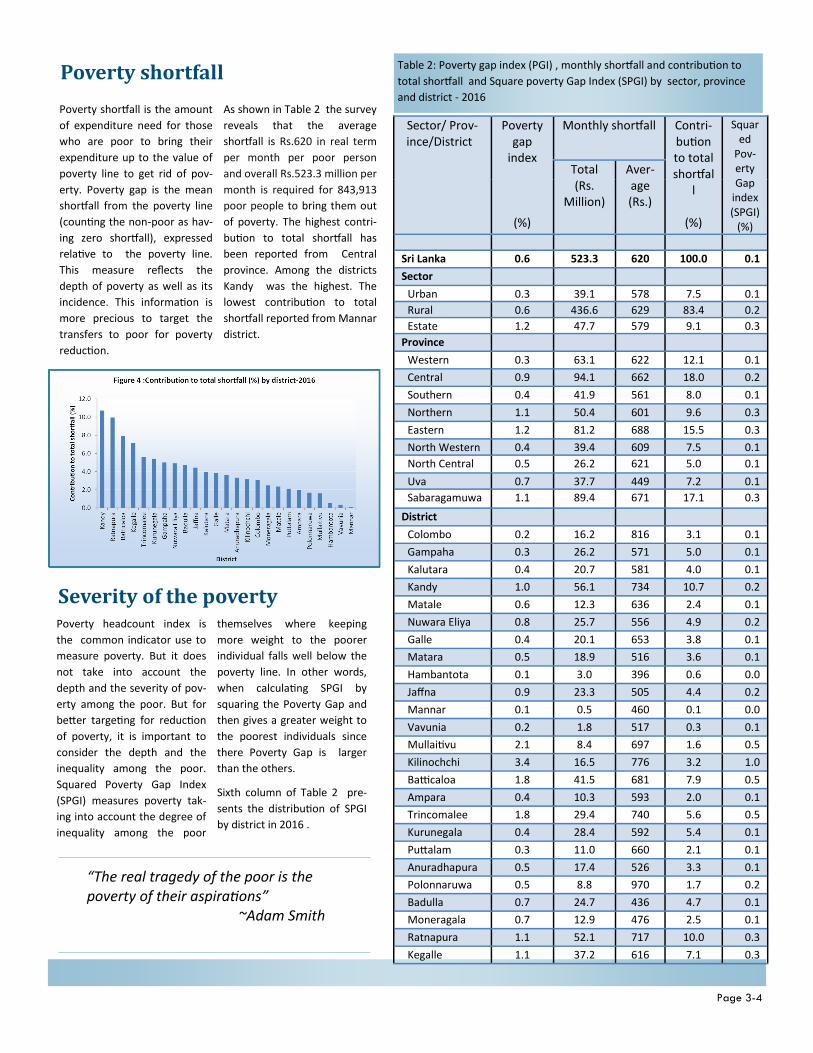
Poverty shortfall is the amount
of expenditure need for those
who are poor to bring their
expenditure up to the value of
poverty line to get rid of pov-
erty. Poverty gap is the mean
shortfall from the poverty line
(counting the non-poor as hav-
ing zero shortfall), expressed
relative to the poverty line.
This measure reflects the
depth of poverty as well as its
incidence. This information is
more precious to target the
transfers to poor for poverty
reduction.
As shown in Table 2 the survey
reveals that the average
shortfall is Rs.620 in real term
per month per poor person
and overall Rs.523.3 million per
month is required for 843,913
poor people to bring them out
of poverty. The highest contri-
bution to total shortfall has
been reported from Central
province. Among the districts
Kandy was the highest. The
lowest contribution to total
shortfall reported from Mannar
district.
Table 2: Poverty gap index (PGI) , monthly shortfall and contribution to
total shortfall and Square poverty Gap Index (SPGI) by sector, province
and district - 2016
Severity of the poverty
“The real tragedy of the poor is the poverty of their aspirations” ~Adam Smith
Page 3-4
Sector/ Prov-ince/District
Poverty gap
index
(%)
Monthly shortfall Contri-bution to total shortfal
l
(%)
Squared
Pov-erty Gap
index (SPGI)
(%)
Total (Rs.
Million)
Aver-age (Rs.)
Sri Lanka 0.6 523.3 620 100.0 0.1
Sector
Urban 0.3 39.1 578 7.5 0.1
Rural 0.6 436.6 629 83.4 0.2
Estate 1.2 47.7 579 9.1 0.3
Province
Western 0.3 63.1 622 12.1 0.1
Central 0.9 94.1 662 18.0 0.2
Southern 0.4 41.9 561 8.0 0.1
Northern 1.1 50.4 601 9.6 0.3
Eastern 1.2 81.2 688 15.5 0.3
North Western 0.4 39.4 609 7.5 0.1
North Central 0.5 26.2 621 5.0 0.1
Uva 0.7 37.7 449 7.2 0.1
Sabaragamuwa 1.1 89.4 671 17.1 0.3
District
Colombo 0.2 16.2 816 3.1 0.1
Gampaha 0.3 26.2 571 5.0 0.1
Kalutara 0.4 20.7 581 4.0 0.1
Kandy 1.0 56.1 734 10.7 0.2
Matale 0.6 12.3 636 2.4 0.1
Nuwara Eliya 0.8 25.7 556 4.9 0.2
Galle 0.4 20.1 653 3.8 0.1
Matara 0.5 18.9 516 3.6 0.1
Hambantota 0.1 3.0 396 0.6 0.0
Jaffna 0.9 23.3 505 4.4 0.2
Mannar 0.1 0.5 460 0.1 0.0
Vavunia 0.2 1.8 517 0.3 0.1
Mullaitivu 2.1 8.4 697 1.6 0.5
Kilinochchi 3.4 16.5 776 3.2 1.0
Batticaloa 1.8 41.5 681 7.9 0.5
Ampara 0.4 10.3 593 2.0 0.1
Trincomalee 1.8 29.4 740 5.6 0.5
Kurunegala 0.4 28.4 592 5.4 0.1
Puttalam 0.3 11.0 660 2.1 0.1
Anuradhapura 0.5 17.4 526 3.3 0.1
Polonnaruwa 0.5 8.8 970 1.7 0.2
Badulla 0.7 24.7 436 4.7 0.1
Moneragala 0.7 12.9 476 2.5 0.1
Ratnapura 1.1 52.1 717 10.0 0.3
Kegalle 1.1 37.2 616 7.1 0.3

DEPARTMENT OF CENSUS AND STATISTICS—SRI LANKA SANKYANA MANDIRAYA
NO. 306/71 POLDUWA ROAD BATTARAMULLA
Tel: +94 11 2147000, +94 112147445 E-mail : [email protected]
Web : www.statistics.gov.lk
Page 4-4
Impact of social protection programs on poverty Household Income and Expendi-
ture Survey in 2016 collected
the social protection infor-
mation of 13 social protection
programs launched by the gov-
ernment mainly under the
social assistance and social in-
surance. The areas of the social
protection covered by HIES in
2016 are given in Table 3.
Table 3 shows the simulation
points of the poverty if social
protection transfers were elimi-
nated. The table indicates that
the total social protection trans-
fer (sum of total social insur-
ance and social assistance trans-
fers) reduced the poverty from
6.7 percent to 4.1 percent. That
is the social protection transfer
lifted 2.6 percent poor people
above the poverty line. The
most contributory significant
factor for this changers was the
pension scheme. In the absence
of pension, poverty headcount
index would increase to 5.7
percent and Poverty Gap index
would be increased to 1.6. Pov-
erty Severity index might be
increased to 1.0. This result
evidence that the social protec-
tion programs in Sri Lanka are
progressing however, those
programs should be rigorously
focused to reduce poverty in
the country.
Simulation of poverty
Table 3: Impact of selected social protection programs on poverty
measures - (simulating the absence of the program – 2016)
According to the Survey data of
2016, the estimated total poor
population in Sri Lanka was
843,913 (4.1%). However, as
shown in Figure 5, there is a high
concentration of non-poor popu-
lation just beyond the poverty
lines and this group stays in a
highly vulnerable situation. Even
if there is a small negative im-
pact on their consumption can
cause many of them to fall back
in poverty that results increasing
the poverty incidence. For exam-
ple, if the value of poverty line is
increased by 10 percent (from Rs.
4,166 to Rs.4,582.6) then the
poverty head count index in-
creases up to 6.1 percent. That
means number of people who
are in poverty increases from
843,913 to 1,255,702 . Further, if
real per capita monthly expendi-
ture is decreased by Rs.100 then
poverty headcount index will be
increased up to 4.5 percent
(933,087 individuals).
The Figure 5 depicts the
consumption growth of
individuals by facilitating to
cross the poverty line from
2016, 2012/13 and 2009/10
by moving the distribution
toward to the right by
reducing the height of the
peak of the graph.
Selected Social protection pro-gram
Poverty Head-count Index( HCI)
Poverty Gap In-
dex (PGI)
Squared Pov-
erty Gap
Index (SPGI)
(%) (%) (%)
Indicator with listed transfer 4.1 0.6 0.1
Indicators without listed transfer
All social protection 6.7 2.1 1.3
A. All social insurance 5.9 1.8 1.1
i. Pension 5.7 1.6 1.0
Ii. Compensation 4.2 0.7 0.3
B. All social assistance 4.8 0.9 0.4
i. Disability 4.1 0.6 0.2
Ii. Adult 4.3 0.7 0.2
iii. Tuberculosis 4.1 0.6 0.2
iv. Scholarships 4.1 0.6 0.2
V. School food 4.1 0.6 0.2
Vi.Triposha_food 4.1 0.6 0.2
Vii.Samurdhi 4.3 0.7 0.2
Viii Medical aids 4.1 0.6 0.2
ix. Other_ commendations 4.2 0.7 0.2
X. Disaster relief 4.1 0.6 0.2
Xi. Fertilizer subsides 4.1 0.6 0.1
Figure 5 : Distribution of population by monthly household
real per capita expenditure –2016,2012/13 and 2009/10