Indicators of Financial Condition: A Comparison of the ... Federation... · Indicators of Financial...
56
Indicators of Financial Condition: A Comparison of the City of Chicago to 12 Other U.S. Cities November 8, 2013
Transcript of Indicators of Financial Condition: A Comparison of the ... Federation... · Indicators of Financial...

Indicators of Financial Condition:
A Comparison of the City of Chicago to 12 Other U.S. Cities
November 8, 2013

2
Table of Contents
EXECUTIVE SUMMARY ......................................................................................................................................... 3
USER GUIDE .............................................................................................................................................................. 8
RANKINGS ................................................................................................................................................................. 8 INDICATOR TRENDS ................................................................................................................................................... 9 LIMITATIONS ............................................................................................................................................................. 9
INTRODUCTION ..................................................................................................................................................... 10
VALUE OF FINANCIAL INDICATORS ......................................................................................................................... 10 DATA AND METHODOLOGY ..................................................................................................................................... 11
Significance of GASB Statement 34 ................................................................................................................... 11 Financial Statements .......................................................................................................................................... 12 Fiscal Years ....................................................................................................................................................... 13 Financial Indicators ........................................................................................................................................... 14
AN ECONOMIC SNAPSHOT ................................................................................................................................. 17
FINDINGS.................................................................................................................................................................. 19
CASH SOLVENCY ..................................................................................................................................................... 19 Working Capital to Expenses Ratio ................................................................................................................... 19
BUDGETARY SOLVENCY .......................................................................................................................................... 23 Continuing Services Ratio .................................................................................................................................. 23 Fund Balance Ratio ........................................................................................................................................... 26 Operating Deficit Ratio ...................................................................................................................................... 31
LONG-RUN SOLVENCY ............................................................................................................................................ 34 Net Worth Ratio ................................................................................................................................................. 35 Debt Service Expenditure Ratio ......................................................................................................................... 37
SERVICE-LEVEL SOLVENCY .................................................................................................................................... 40 Expenses per Capita ........................................................................................................................................... 41 Liabilities per Capita ......................................................................................................................................... 42 Taxes and Fees per Capita ................................................................................................................................. 43
APPENDIX A: GLOSSARY .................................................................................................................................... 45
APPENDIX B: CITY OF CHICAGO NET ASSETS ............................................................................................. 48
APPENDIX C: SUMMARY OF FINANCIAL INDICATORS ............................................................................. 49
APPENDIX D: LIMITATIONS OF FINANCIAL INDICATOR ANALYSIS .................................................... 50
APPENDIX E: ECONOMIC DATA FOR THE 13 U.S. CITIES ANALYZED .................................................. 51
POPULATION CHANGE ............................................................................................................................................. 51 GROWTH IN UNEMPLOYMENT.................................................................................................................................. 52 GROWTH IN INFLATION ............................................................................................................................................ 53 GROSS DOMESTIC PRODUCT (GDP) ........................................................................................................................ 54

3
EXECUTIVE SUMMARY
This report compares the relative fiscal performance of the City of Chicago to 12 other major
U.S. cities using financial indicators compiled from audited financial statements from FY2007
through FY2011, the most recent years for which audited data were available for all of the cities
when we compiled the report. In order to measure financial condition, it is important to assess
the direction and magnitude of changing ratios over time.1 The focus of the analysis is therefore
on the City of Chicago’s relative performance in four areas of financial condition: cash solvency,
budgetary solvency, long-run solvency and service-level solvency relative to the other cities. For
definitions of these and other financial terms used in this report, see the Glossary on page 45.
The report analyzes the five most recent audited financial statements of 13 major U.S. cities,
most of which have also been the subject of analysis by the Pew Charitable Trusts’ Philadelphia
Research Initiative.2 In addition to Chicago, the 12 other U.S. cities analyzed were Baltimore,
Boston, Columbus, Detroit, Houston, Kansas City (MO), Los Angeles, New York, Philadelphia,
Phoenix, Pittsburgh and Seattle. According to the Philadelphia Research Initiative, the group of
cities combined the largest cities in the U.S., early industrial cities, geographically diverse cities
and cities hit particularly hard by the recession.
The intention of this report is to add to a body of financial data on these cities that will examine
their fiscal condition from many angles. The data in this report reflect a specific time frame that
encompasses the Great Recession and its aftermath. As such, a majority of the cities experienced
deteriorating financial condition during the five-year period. For an introduction to the economic
conditions of the cities from 2007 to 2011, see page 17 and Appendix E on page 51.
It is also important to note that data in this report are compiled from each city’s audited financial
statements. These statements offer a comprehensive look at a government’s obligations over the
long-term, which is different from the government’s budget. The budget is a short-term, cash-
based document that reflects the government’s policy decisions for the upcoming year. For in
depth analysis of the City of Chicago’s budgetary actions to address its financial challenges see
the Civic Federation’s website for annual analyses of the Chicago’s proposed budgets.3
In order to provide a comparative analysis in the simplest and most consistent manner, this report
examines the relative outcome of each indicator by ranking the 13 U.S. cities by largest five-year
change in each ratio.4 The table below shows each city’s relative trend in financial condition
based on all nine indicators. The City of Chicago ranked eleventh of the 13 cities with an average
rank of 7.4. Columbus ranked first with an average rank of 5.1 and Detroit ranked thirteenth with
an average rank of 11.2. It is important to note that the top eleven cities’ average ranks were
within a close range between 5.1 and 7.4. In other words, the cities’ rankings varied significantly
1 Stephen J. Gauthier, An Elected Official’s Guide to the New Governmental Financial Reporting Model (Chicago:
Government Finance Officers Association, 2000). 2 Pew Charitable Trusts Philadelphia Research Initiative, “Tough Decisions and Limited Options: How Philadelphia
and Other Cities are Balancing Budgets in a Time of Recession” (May 18, 2009). Due to a change in the fiscal year
for the City of Atlanta in 2006 that led to inconsistent trend analyses, this report substitutes the City of Houston for
Atlanta. 3 See www.civicfed.org for annual analyses of the City’s proposed budgets, as well as the Federation’s
Recommendations for a Financially Sustainable City of Chicago

4
with no city consistently out-performing the others. The exceptions are Boston and Detroit which
had trends that were relatively poor more consistently. For example, Pittsburgh, which ranked
second overall, ranked first with three financial indicators, but also ranked ninth, eleventh and
twelfth with other financial indicators.
The next exhibit further illustrates the rankings presented above in order to show the close
proximity of rankings for the top eleven cities.
4 A higher rank reflects improved performance for all indicators. For five indicators, the cities are ranked by largest
positive change so that a high rank is considered improved performance. For four indicators, the cities are ranked by
the largest negative change so that a high rank is considered improved performance. For more information, see the
Rankings section of this report on page 8.
Rank City
Average
Indicator Rank
1 Columbus 5.1
2 Pittsburgh 5.4
3 Philadelphia 6.0
3 Phoenix 6.0
3 Seattle 6.0
6 Los Angeles 6.1
7 Kansas City (MO) 6.2
8 Baltimore 7.3
8 Houston 7.3
8 New York 7.3
11 Chicago 7.4
12 Boston 9.4
13 Detroit 11.2
Financial Indicator Average Ranking
of 13 U.S. Cities: FY2007-FY2011
0
2
4
6
8
10
12
Ave
rag
e I
nd
ica
tor
Ra
nk
Financial Indicator Average Ranking of 13 U.S. Cities: FY2007-FY2011
(on a scale of 1-12, 1= favorable)

5
Based on six financial indicators, the City of Chicago ranked in the less favorable half of the 13
cities over the five-year period. Those six indicators are the continuing services ratio (8th
),
operating deficit ratio (9th
), net worth ratio (8th
), expenses per capita (10th
), liabilities per capita
(11th
) and taxes and fees per capita (9th
). Chicago performed in the more favorable half of the 13
cities based on three of the indicators: working capital ratio (5th
), unreserved fund balance ratio
(1st) and debt service expenditure ratio (6
th). It is important to note that for all but one of the
indicators, the debt service expenditure ratio, financial condition for a majority of the cities
deteriorated over the five-year period. This is most likely due to the recession and its aftermath.
However, despite an overall negative trend for all of the cities, Chicago’s financial condition
relative to the other cities was poor.
The working capital to expenses ratio indicator is a measure of cash solvency, which
demonstrates a government’s ability to generate sufficient financial resources to pay its current
liabilities. The working capital to expenses ratio compares net current government-wide assets to
monthly expenses and approximates how many months the government is able to pay for
operations. A higher ratio and an increasing trend are considered favorable. The City of
Chicago’s working capital to expenses ratio averaged 4.0 months and decreased by nearly 0.2
months over the five-year period, placing it fifth among the 13 cities. At its lowest point in
FY2008, Chicago’s government-wide working capital to expenses ratio dropped to 3.3 months.
In other words, at any point during the fiscal year 2008, Chicago had enough working capital to
fund approximately three months and one week of operations.
The three indicators of budgetary solvency demonstrate a government’s financial ability to
maintain current or desired service levels. The continuing services ratio examines unrestricted
net assets as a percentage of governmental expenses. Over the five-year period, Chicago’s
continuing services ratio experienced a decline which placed it eighth of the 13 cities. Chicago
had the third lowest average continuing services ratio over five years. More troubling was the
steady downward trend over five years, which means that Chicago was accumulating liabilities
without maintaining offsetting assets. The fund balance ratio compares unrestricted general
Indicator Rank Five-Year Average
Working Capital to Expenses Ratio 5 (0.2) (0.1)
Continuing Services Ratio 8 -20.2% -5.1%
Unreserved Fund Balance Ratio* 1 9.3% 0.8%
Operating Deficit Ratio 9 -3.9% -1.1%
Net Worth Ratio 8 -11.1% -2.8%
Debt Service Expenditure Ratio 6 -1.9% -0.3%
Expenses Per Capita 10 232.68$ 58.17$
Liabilities Per Capita 11 3,296.08$ 824.02$
Taxes and Fees Per Capita 9 113.45$ 28.36$
Average Rank 7.4
City of Chicago
Relative Financial Condition Trends: FY2007-FY2011
*The unreserved fund balance ratio trend reflects a four-year change because of a revision
to GASB reporting standards for FY2011 statements. For more information see the Fund
Balance Ratio section of this report.
Note: For all indicators, a higher rank is favorable.
Source: City of Chicago Comprehensive Annual Financial Reports, FY2007-FY2011.

6
fund fund balance to general fund expenditures and reflects the government’s budgetary savings.
Although the City of Chicago’s fund balance ratio experienced the largest growth of the 13 cities
over the four-year period,5 placing it first in rank, Chicago’s actual ratio of unrestricted fund
balance to operating expenditures is among the lowest and is a cause for concern.6 The
operating deficit ratio shows general fund operating surplus or deficit as a percentage of total
operating expenses. The large size and consistent downward trend (9th
among the 13 cities) of
Chicago’s operating deficit ratio is a cause for concern because it indicates that operating
expenses consistently and significantly exceeded revenues. In addition, Chicago ran an operating
deficit each of the past five fiscal years. These indicators reveal low levels of budgetary
solvency, suggesting that Chicago was experiencing difficulty in maintaining current services
with the existing revenue structure.
Indicators of long-run solvency assess the availability of future resources to pay for existing
long-term obligations. The net worth ratio measures restricted and unrestricted net assets as a
percentage of total assets. Chicago’s net worth ratio has declined from a deficit of 4.5% in
FY2007 to a deficit of 15.6% in FY2011, a downward trend that ranks it eighth of the 13 cities.
The deficits in net worth indicate a lack of available restricted and unrestricted net assets for
governmental activities and the steady decline suggests that Chicago has leveraged its assets. The
debt service expenditure ratio measures the portion of governmental expenditures allocated to
debt service. Chicago’s debt service expenditure ratio trend placed it sixth of the 13 cities.
Although the indicator generally decreased over the five-year period indicating better fiscal
performance, it reveals that a high proportion of governmental expenditures are being allocated
to debt service. Chicago’s average debt service expenditure ratio over the five years was the
fourth highest of the 13 cities.
Lastly, the report considers service-level solvency by using per capita indicators that reflect a
government’s ability to sustain existing services at levels required by citizens. All indicators are
adjusted for inflation and reflect 2011 dollars. Chicago’s five-year growth in real expenses per
capita ($232.68 per person) and total real liabilities per capita ($3,296.08 per person) have
given it a ranking of tenth place and eleventh place, respectively. High rates of expenses per
capita and liabilities per capita suggest an expensive government and a lower ability to maintain
those services long-term. From FY2007 to FY2011, Chicago’s real taxes and fees per capita
have grown by $113.45 per person, placing it in ninth place of the 13 cities. Chicago’s growth in
taxes and fees per capita reflect a moderate growth in tax burden on residents, relative to the
other cities.
5 Due to the implementation of GASB 54 in FY2011, a five-year trend analysis of fund balance ratio is not available
so FY2007 to FY2010 is used for ranking. For more information about GASB 54, see the Fund Balance Ratio
section on page 26 of this report. 6 The City’s unrestricted fund balance to operating expenditures ratio does not include approximately $500 million
that the City holds in long-term reserves from asset leases. For more details on the fund balance ratio and the City’s
long-term reserves, see page 26.

7
The following table shows the performance of the City of Chicago using the six financial
indicators and three per capita indicators.
During the five-year period, the City of Chicago’s relative financial condition has worsened
compared to most of the twelve other cities in all four areas of solvency. Chicago’s ability to
generate financial resources in the short-term has declined, indicating a weakened cash solvency.
Its budgetary solvency is declining as well, with growing deficits in unrestricted net assets and in
its Corporate Fund, which is its general operating fund. Also, although Chicago’s fund balance
levels have increased over the five-year period, they were well below the GFOA’s recommended
levels. The long-run solvency indicators expose significant challenges for the City to meet its
existing long-term obligations. Despite the decline in the debt service expenditure ratio, the
average over the five years for Chicago is among the highest of the 13 cities. For more
information about the drivers of Chicago’s weakened budgetary and long-run solvency,
particularly Chicago’s growing deficit of net assets, see Appendix B on page 48 of this report.
Finally, with larger increases in real expenses and liabilities versus real taxes and fees, Chicago’s
service-level solvency indicators suggest that Chicago is experiencing a growing imbalance
between the demands of its citizens and the means to fund them.
Indicator FY2007 FY2008 FY2009 FY2010 FY2011
Working Capital Ratio 4.12 3.29 4.16 4.40 3.88
Continuing Services Ratio -64.6% -71.7% -94.4% -96.3% -84.8%
Unreserved Fund Balance Ratio* 0.2% 0.0% 0.1% 2.7% -
Unrestricted Fund Balance Ratio* - - - - 10.2%
Operating Deficit Ratio -4.2% -7.5% -15.0% -13.9% -8.5%
Net Worth Ratio -4.5% -7.7% -10.3% -12.5% -15.6%
Debt Service Expenditure Ratio 10.5% 15.1% 12.5% 11.9% 9.3%
Real Expenses Per Capita 2,918$ 2,823$ 2,849$ 3,170$ 3,150$
Real Liabilities Per Capita 8,926$ 9,028$ 9,997$ 11,637$ 12,222$
Real Taxes and Fees Per Capita 1,842$ 1,834$ 1,780$ 1,920$ 1,955$
City of Chicago
Financial Indicators: FY2007-FY2011
*The unreserved fund balance ratio trend reflects a four-year change because of a change to GASB reporting
standards for FY2011 statements. For more information see the Fund Balance Ratio section of this report.
Source: City of Chicago Comprehensive Annual Financial Reports, FY2007-FY2011.

8
USER GUIDE
The following report presents nine indicators of financial health and compares the City of
Chicago to twelve other United States cities. In order to measure financial condition, it is
important to assess the direction and magnitude of changing ratios over time.7 The focus of the
analysis therefore is on the City of Chicago’s relative financial performance from FY2007 to
FY2011, the most recent years for which audited data were available for all of the cities when we
compiled the report.
When possible, the report will include benchmarks for the financial indicators. However, it is
important to note that due to the wide range of governmental operations and demographics for
the selected cities, not all of the indicators have universally-accepted standards. Therefore, the
analysis focuses on the trends over the five-year period and underlying reasons for significant
fluctuations. An analysis of each city’s individual performance was not made, but in addition to
the City of Chicago, the analysis does include discussion of the highest and lowest ranked cities
for each indicator.
Rankings
The data used in this report are obtained from the audited financial statements and can reflect
vastly different areas of the government’s finances. In order to provide a comparative analysis in
the simplest and most consistent manner, this report ranks the 13 U.S. cities by largest five-year
change. For all indicators, a higher rank is favorable. With five indicators, an increase in the ratio
over time – or a positive trend – tends to show sound financial performance. For example,
growth in the net worth ratio may reflect a government’s increasing ability to pay off existing
long-term liabilities. With the other four indicators, a decrease in the ratio over time – or a
negative trend – tends to show sound financial performance. For example, a declining debt
service expenditures ratio may reflect a government’s waning need to allocate operating
expenditures to debt service.
The indicator rankings create a caveat with the presentation of data: a high rank does not
necessarily reflect sound fiscal condition. The reverse of this point is also true: It is important to
remember a poor trend does not indicate poor financial condition. For example, the reader should
examine the fund balance ratio – where a high rank is favorable but does not necessarily reflect
sound fiscal condition – in the following way:
Chicago ranks high because from FY2007 to FY2010, the fund balance ratio increased
by 0.6 percentage points, whereas most of the other 12 cities experienced a negative four-
year change.8Although a positive trend is favorable, Chicago’s low fund balance is a
cause for concern. Meanwhile, despite a four-year decline in fund balance levels, Seattle,
7 Stephen J. Gauthier, An Elected Official’s Guide to the New Governmental Financial Reporting Model (Chicago:
Government Finance Officers Association, 2000). 8 Due to the implementation of GASB 54 in FY2011, a five-year trend analysis of fund balance ratio is not available.
For more information about GASB 54, see the Fund Balance Ratio section on page 26 of this report.

9
which is ranked 12th
, has a healthy level of fund balance at 14.2% that nearly meets the
GFOA recommended level.9
Additionally, what may indicate an improved trend on its face – for example, a declining debt
service expenditures ratio – may also indicate a lack of investment in infrastructure, which could
be costly in the long-term. All trends should be thoroughly examined and caution should be
taken before reading too much into any one indicator.
Indicator Trends
Each indicator analysis includes a chart that ranks the 13 cities by largest five-year change. Also
included in the chart is the average annual change for each city over the five years,10
the average
ratio for each city over the five years, the average ratio of all 13 cities for each year and the
indicator trend. The indicator trend is identified as increased, decreased or mixed. The indicator
trend is determined by the following method:
Increased: When the ratio increased over three out of four years, or when the indicator
increased over two years and decreased over two years and a five-year increase is of
greater magnitude than the average annual change;
Decreased: When the ratio decreased over three out of four years, or when the indicator
increased over two years and decreased over two years and the five-year decrease is of
greater magnitude than the average annual change; and
Mixed: When the indicator increased over two years, decreased over two years and the
five-year change is not of greater magnitude than the average annual change.
Limitations
Due to a number of factors, the analysis presented in this report has certain limitations. First, it is
important to note that this report does not prescribe the way in which all governments ought to
be examined to determine financial condition. There is a universe of hundreds of possible
indicators of financial condition. The Civic Federation strove in this report to select useful,
familiar financial indicators that make intuitive sense to present the City of Chicago’s relative
financial condition. Another analysis using different indicators could possibly come to a different
conclusion.
The 13 cities selected in the analysis represent vastly different governments and demographics.
As such, each city has unique governmental operations, social and demographic compositions
and local and state laws, all of which could influence the indicators but are not accounted for in
the analysis. In addition, cities may implement accounting changes for any given fiscal year.
These changes can have a significant impact on how financial data is reported and, when
examining financial indicators based on this data over time, can create a misleading trend.
9 The Government Finance Officers’ Association recommends an unrestricted operating fund balance of
approximately 17% for general-purpose governments. For more information, see the Fund Balance Ratio section on
page 26 of this report. 10
Since year-to-year fluctuation is normal for many of these indicators and their individual components, the trends
are presented as both an average annual change and a five-year change in order to give an idea of the level of year-
to-year change and to avoid the distorted impression that a simple snapshot between two fiscal years could leave.

10
Additional limitations of this report are presented in Appendix D on page 50 of this report.
INTRODUCTION
The purpose of this report is to compare the fiscal health of 13 major U.S. cities using financial
indicators compiled from audited financial statements. The focus is on how the City of Chicago
ranks in comparison to the other cities.
Value of Financial Indicators
In assessing the financial health of local governments, much academic research has focused on
developing measures of financial condition. Although there is no strict consensus on these
measures, there is agreement that the financial condition of local governments is important to the
effective, efficient and economical delivery of public services.11
The Civic Federation draws
from a number of studies where financial indicators were developed to create different measures
of fiscal condition for states and local governments. This report uses those indicators to assess
the relative fiscal condition of the City of Chicago and compare it to 12 other U.S. cities.
One commonly used study is Kenneth Brown’s The 10-Point Test of Financial Condition:
Toward an Easy-to-Use Assessment Tool for Smaller Cities. The article, published in 1993, was
based on pre-GASB 3412
data from 1989. Although the ten indices used were extremely useful
for their simplicity and accessibility,13
the data only provided a snapshot from one year and
focused exclusively on governmental funds rather than the overall government, which can
provide a more comprehensive and comparable look at government operations.
In October 2009, the Government Finance Review published Revisiting Kenneth Brown’s “10-
Point Test” which aimed to build on Brown’s strengths by providing indicators of financial
condition that could “help a jurisdiction develop a better understanding of its financial condition,
identify hidden or emerging problems, present a picture of strengths and weaknesses, introduce
long-term considerations and provide a starting point for cities to consider financial policies that
pertain to their particular city government.”14
The report used audited financial data from 2003 to
2006 for municipalities throughout the country. Ten indicators provided measures of cash
solvency, budgetary solvency and long-run solvency, including a general fund fund balance ratio
and debt service ratio.15
The article provided an overview of each of the indicators used and
11
Xiaohu Wang, Lynda Dennis and Yuan Sen (Jeff) Tu, “Measuring Financial Condition: A Study of U.S. States,”
Public Budgeting & Finance, Summer 2007, p. 4. 12
In 1999, the Governmental Accounting Standards Board (GASB) published its Statement 34, Basic Financial
Statements—and Management’s Discussion and Analysis—for State and Local Governments. Statement 34 requires
governments to present information in the first two financial statement exhibits using full accrual accounting
encompassing all funds, as in the private sector. For more information, see Significance of GASB Statement 34 on
page 11 of this report. 13
Brown provided 10 indices to evaluate municipal financial condition and to compare with national benchmarks
based on population size. The data used for calculating ratios were available from audited financial reports. 14
Craig S. Maher and Karl Nollenberger, “Revisiting Kenneth Brown’s ‘10-Point Test,’” Government Finance
Review; October 2009. 15
For more information on indicators and measures of solvency, see the Data and Methodology section of this report
or the Glossary on page 45.

11
presented the data in a way that allows municipalities to assess their financial condition relative
to national samples (in quartiles) based on population and median scores over time.
A number of indicators used in this report are drawn from another frequently cited report
“Measuring Financial Condition: A Study of U.S. States” by Xiaohu Wang et al. published in
Public Budgeting and Finance in 2007. The study constructed 11 indicators from the
government-wide Statement of Net Assets and Statement of Activities that assess four
dimensions of financial solvency: cash, budget, long-run and service-level. The study tested the
reliability and validity of the indicators as a good measure of financial condition. The results of
the statistical analyses showed that the indicators are relatively reliable and valid in measuring
financial condition and that government-wide information, as required by GASB 34, provides a
useful reporting framework to evaluate the fiscal health of a government.16
In addition to the studies noted above, this report draws upon the research on local government
financial condition by Woods Bowman, who has identified 100 unduplicated financial
indicators.17
The indicators chosen for this report are relatively common and accessible in an attempt to
present the data in a way that makes intuitive sense to a non-academic audience. This however,
does not mean that the indicators not included here are not relevant to the discussion of financial
condition.
Data and Methodology
The following sections describe the sources of the data used and how data are analyzed in this
report.
Significance of GASB Statement 34
The report uses data from exhibits presented in the financial statements in each government’s
Comprehensive Annual Financial Report (CAFR). The financial statements are prepared using
Generally Accepted Accounting Principles (GAAP) for governments, which are set by the
Governmental Accounting Standards Board (GASB). In 1999 GASB published its Statement 34,
Basic Financial Statements—and Management’s Discussion and Analysis—for State and Local
Governments. Statement 34 requires governments to present information in the first two financial
statement exhibits using full accrual accounting encompassing all funds, as in the private sector.
These first two exhibits are called the government-wide Statement of Net Assets and the
Statement of Activities. Most of the information presented in the government-wide financial
statements must be calculated the same way by each government, so they provide more
comparable data than were available before Statement 34.18
In addition, by requiring
16
Xiaohu Wang, Lynda Dennis and Yuan Sen (Jeff) Tu, “Measuring Financial Condition: A Study of U.S. States,”
Public Budgeting & Finance, Summer 2007, p. 20. 17
Woods Bowman, “Indicators of Financial Condition in Theory and Practice” (unpublished, DePaul University,
2011). 18
For more information on Statement 34 see the summary of Statement 34 at http://www.gasb.org or Stephen J.
Gauthier, An Elected Official’s Guide to the New Governmental Financial Reporting Model (Chicago: Government
Finance Officers Association, 2000).

12
government-wide financial statements as opposed to specific fund statements, which can vary
significantly in type and number from government to government, financial data is more
comprehensive and comparable. GASB required governments to implement the financial
reporting changes between the fiscal years beginning 2001 and 2003, depending on the size of
the government based on annual revenues.
Financial Statements
The government-wide financial statements report the activities of the primary government, which
include governmental activities that are normally supported by taxes and intergovernmental
revenues and business-type activities that are normally supported by user fees and charges for
services. These statements use the full accrual basis of accounting19
and have an “economic
resources” measurement focus, meaning that they take into account all assets (including capital
assets) and most liabilities, even long-term liabilities that will come due only in the future.
Government-wide financial statements do not include fiduciary funds so actuarially accrued
pension liabilities are not included. However, since the implementation of GASB Statement No.
27, governments report net pension obligations, which are the cumulative difference between
annual pension costs and the employer’s contributions to its plans. The long-term focus provides
a backdrop against which to evaluate the government’s fiscal health and the sustainability of its
financial practices. It allows readers of financial statements to assess the impact of fiscal
decisions that may create liabilities to be paid in the future.20
The government-wide financial statements used in this report include:
Statement of Net Assets: reports all financial and capital resources by measuring assets
less liabilities resulting from exchange and exchange-like transactions when the exchange
took place; and
Statement of Activities: reports the operations of the government by measuring the net
(expense) revenue of its individual functions (such as general revenues, program fees,
intergovernmental aid, etc.).21
In contrast to the “economic resources” measurement focus, the financial statements of the
governmental funds use a “current financial resources” measurement focus. The goal of these
financial statements is to report additional, more detailed information about the primary
government. The current financial resources measurement focus shows near-term inflows and
outflows using modified accrual accounting.22
It does not include the value of capital assets or
long-term liabilities due in future years. According to GASB, governmental fund assets are
generally expected to be liquidated within a year and liabilities are expected to be satisfied with
current resources.
19
The full accrual basis of accounting is a method that attempts to recognize revenues when they are earned and
expenses when they are incurred, not when cash changes hands. 20
For more on full accrual and accountability see GASB’s “Interperiod Equity and What it Means to You”
http://www.gasb.org/newsletter/inter-period_equity_june2009.html. 21
Governmental Accounting Standards Series Statement No. 34 (June 1999) p. 14 and 17. 22
The modified accrual basis of accounting recognizes revenues as those collected within the year or soon enough
thereafter that can be used to finance current-year expenditures. Expenditures represent the use or expected use of
current financial resources.

13
The governmental funds’ financial statements used in this report include:
Balance Sheet: reports information about the current assets, liabilities and fund balances
for each major fund and aggregated nonmajor funds; and
Statement of Revenues, Expenditures and Changes in Fund Balances: reports information
about the inflows, outflows and balances of current financial resources of each major
fund and aggregated nonmajor funds.23
All data are for the primary government only and do not include discretely-presented component
units.24
Government-wide data include tax-supported governmental functions and business-like
activities such as city-owned utilities or airports. Population data are taken from population
estimates by the United States Census Bureau for fiscal years 2007 through 2009 and 2011, and
from the 2010 Census.
The following table illustrates the general structure of the audited financial statements contained
in a government’s Comprehensive Annual Financial Report:
Fiscal Years
The addition of government-wide financial statements was one of the more significant changes
brought about by Statement 34, and large U.S. cities have since published several years of
CAFRs using Statement 34.25
This report analyzes the five most recent CAFRs of 13 large U.S.
cities, most of which have also been the subject of analysis by the Pew Charitable Trusts’
Philadelphia Research Initiative.26
In addition to Chicago, the 12 other U.S. cities analyzed were
23
Governmental Accounting Standards Series Statement No. 34 (June 1999) p. 30 and 31. 24
Note 1 in the “Notes to Financial Statements” included in each government’s CAFRs describes the reporting
entity and any discretely-presented component units. For the City of Chicago, the City’s financial statements do not
include related organizations for which no fiscal dependence exists. These related organizations are the Chicago
Park District, Chicago Public Schools, Community College District No. 508, Chicago Housing Authority and the
Chicago Transit Authority. The City’s financial statements include the following entities as fiduciary trust funds: the
Municipal Employees’ Annuity and Benefit Fund of Chicago, the Laborers’ and Retirement Board Employees’
Annuity and Benefit Fund of Chicago, The Policemen’s Annuity and Benefit Fund of Chicago and The Firemen’s
Annuity and Benefit Fund of Chicago. 25
See GASB’s “Statement 34, 10 years later” at
http://www.gasb.org/newsletter/10th_anniversary_st34_june2009.html. Governments with annual revenues over
$100 million were required to implement Statement 34 for the fiscal year beginning after June 15, 2001. 26
Pew Charitable Trusts Philadelphia Research Initiative, “Tough Decisions and Limited Options: How
Philadelphia and Other Cities are Balancing Budgets in a Time of Recession” (May 18, 2009) and “Layoffs,
Furloughs and Union Concessions: The Prolonged and Painful Process of Balancing City Budgets” (September 22,
2009) http://www.pewtrusts.org/our_work_detail.aspx?id=953. Due to a change in the fiscal year for the City of
Governmental Funds Proprietary Funds Fiduciary FundsStatement of
Net Assets Balance Sheet
Statement of
Fund Net Assets
Statement of
Fiduciary Net Assets
Statement of
Activities
Statement of Revenues,
Expenditures and Changes
in Fund Balance
Statement of Revenues,
Expenses and Changes in
Fund Net Assets
Statement of Changes in
Fiduciary Net Assets
Accounting Basis: Full accrual Modified accrual Full accrual Full accrual
Measurement Focus: Economic resources Financial resources Economic resources Economic resourcesSource: City of Baltimore, FY2011 Comprehensive Annual Financial Report, p. 4 and Governmental Accounting Standards Board, Summary of Statement No. 34.
Fund StatementsGovernment-wide
Statements
Financial Statement:
Comprehensive Annual Financial Statements

14
Columbus, Pittsburgh, Philadelphia, Phoenix, Seattle, Los Angeles, Kansas City (MO),
Baltimore, Houston, New York, Boston and Detroit. According to the Philadelphia Research
Initiative, the group of cities combined the largest cities in the U.S., early industrial cities,
geographically diverse cities and cities hit particularly hard by the recession. The intention of
this report is to add to a body of financial data on these cities that will examine their fiscal
condition from many angles. For an introduction to the economic conditions of the cities from
2007 to 2011, see page 17 and Appendix E on page 51of this report.
The fiscal year 2007-2011 financial statements were used for all governments, since they were
the most recent years for which audited data were available for all of the cities when we
compiled the report. It should be noted that not every city uses the same fiscal year calendar. The
fiscal years for each of the cities examined are below:
Financial Indicators
This report measures financial condition using a number of conventional yardsticks, or financial
indicators. Financial condition can be observed as a government’s “ability to maintain existing
service levels, withstand economic disruption and meet the demands of growth and decline.”27
To make some compensation for differences in size and scope of the different municipal
governments, the indicators are expressed as ratios. For example, the continuing services ratio
shows unrestricted net assets relative to expenses of the same government. A government with
$200 million in unrestricted net assets and $400 million in expenses would have the same 0.5
ratio as a government with $500 million in unrestricted net assets and $1 billion in expenses.
For most indicators used in this report, there are no objective standards of what ratios are “good”
or “bad” for any one year. However, analysis of trends can provide context as to whether a city’s
performance is improving or declining. The addition of other cities also provides a relative trend
measure.
Atlanta in 2006 that led to inconsistent trend analyses, the Civic Federation substitutes the City of Houston for
Atlanta. 27
Craig S. Maher and Karl Nollenberger, “Revisiting Kenneth Brown’s ‘10-Point Test,’” Government Finance
Review (October 2009). There are many definitions of financial condition in the literature, but most focus on the
ability to maintain service levels over time.
May 1 to April 30 July 1 to June 30 January 1 to December 31
Kansas City (MO) Baltimore Chicago
Boston Columbus
Detroit Pittsburgh
Houston Seattle
Los Angeles
New York
Philadelphia
Phoenix
Fiscal Years of 13 U.S. Cities

15
The indicators used in the report reflect four dimensions of solvency28
associated with the
concept of financial condition. Each dimension of solvency is explained below, along with the
coordinating financial indicators and the formulas used to calculate each indicator. Descriptions
of the financial indicators used in this report are also consolidated into Appendix C on page 49 of
this report.
Cash solvency demonstrates a government’s ability to generate sufficient financial resources to
pay its current liabilities. The working capital to expenses ratio indicator, a measure of liquidity,
compares net current government-wide assets to monthly expenses and assesses approximately
how many months the government is able to pay for operations using its resources on hand. An
increase in the working capital to expenses ratio over time may reflect increasing current net
assets or decreasing annual expenses, both of which can generally be considered fiscally sound
outcomes. As such, a higher ratio and an increasing trend are considered favorable.
1) Working Capital to Expenses Ratio:
Current Assets – Current Liabilities 1/12 Expenses
Source of Data: Government-Wide Statement of Net Assets
Budgetary solvency is related to a government’s financial ability to maintain current or desired
service levels within the budget period by sufficiently funding operating expenses. The
continuing services ratio indicator examines unrestricted net assets as a percentage of expenses
for all funds government-wide. This indicator measures the degree to which unrestricted net
assets can support continuing government services. An increase in the continuing services ratio
over time may reflect increasing unrestricted net assets or decreasing government-wide expenses,
both of which can lead to more readily available resources for the government. Therefore, a
higher ratio and an increasing trend are considered favorable.
2) Continuing Services Ratio:
Unrestricted Net Assets
Total Expenses Sources of Data: Government-Wide Statement of Net Assets and Government-Wide Statement of
Activities
The fund balance ratio compares unrestricted general fund fund balance to general fund
expenditures, reflecting the operating savings that a government has accumulated relative to the
government’s operating expenditures for that fiscal year. The Government Finance Officers
Association (GFOA) recommends that general-purpose governments maintain approximately
16.7% of their operating expenditures or revenues as fund balance. A government that meets the
GFOA recommendation or has an increasing trend can be considered relatively fiscally sound
with regard to fund balance levels. The fund balance ratio examines data reported with the
modified accrual basis of accounting and could pose some comparability issues since it only
examines the general fund, which can vary significantly between governments with regard to
operational activities.
28
Xiaohu Wang, Lynda Dennis and Yuan Sen (Jeff) Tu, “Measuring Financial Condition: A Study of U.S. States,”
Public Budgeting & Finance, Summer 2007.

16
3) Fund Balance Ratio:
Unrestricted General Fund Fund Balance
General Fund Expenditures Sources of Data: Governmental Funds Balance Sheet and Governmental Funds Statement of Revenues,
Expenditures and Changes in Fund Balance
The operating deficit ratio shows the general fund operating surplus or deficit as a percentage of
total operating expenses on an actual basis. This indicator reflects the difference between
revenues and expenditures in completed fiscal years. Generally, a larger ratio reflects excess
operating revenues over expenditures. Therefore, a higher ratio and an increasing trend are
considered favorable. The operating deficit ratio examines data reported with the modified
accrual basis of accounting and thus could pose the same issues of comparability as the fund
balance ratio.
4) Operating Deficit Ratio:
General Fund Surplus or Deficit
Net Operating Expenditures Source of Data: Governmental Funds Statement of Revenues, Expenditures and Changes in Fund Balance
Long-run solvency assesses the availability of future resources to pay for existing long-term
obligations. The net worth ratio measures restricted and unrestricted net assets as a percentage of
total assets. It is a measure of the net worth of a government and signifies the government’s
ability to pay off existing long-term liabilities. A larger ratio indicates more accessible resources
for the government and therefore, a higher ratio and an increasing trend are considered favorable.
5) Net Worth Ratio:
Restricted and Unrestricted Net Assets
Total Assets Source of Data: Government-Wide Statement of Net Assets
The debt service expenditure ratio is the percentage of debt service expenditures out of total
governmental fund expenditures. The indicator can be used to assess service flexibility by
determining the amount of expenses committed to annual debt service. With a higher debt
service expenditure ratio, a larger portion of expenditures is being allocated to paying for debt
issued by the government rather than regular government services. As such, a lower ratio and
decreasing trend are considered favorable. The debt expenditures ratio examines data reported
with the modified accrual basis of accounting.
6) Debt Service Expenditure Ratio:
Debt Service Expenditure
Total Expenditures Source of Data: Governmental Funds Statement of Revenues, Expenditures and Changes in Fund Balance
Lastly, by using per capita indicators, the report considers service-level solvency which reflects
a government’s ability to maintain services at the quality and level required to ensure the safety
and welfare of citizens and to meet their expectations and desires. Expenses per capita divides

17
the total expenses of the primary government, which include governmental activities and
business-type activities, by population. Higher expenses per capita reveal a more expensive
government and lower solvency to sustain that expense level.29
Therefore, a lower ratio and
decreasing trend are considered favorable.
7) Expenses per Capita:
Total Primary Government Expenses
Population Source of Data: Government-Wide Statement of Activities
Similarly, liabilities per capita divides the total liabilities of the primary government by
population and represents the government’s relative indebtedness with regard to future taxpayers.
Liabilities, as reported in the government-wide Statement of Activities, do not include unfunded
pension liabilities. Since high or increasing liabilities can be a cause for concern, a lower ratio
and decreasing trend are considered favorable.
8) Liabilities per Capita:
Total Liabilities
Population Source of Data: Government-Wide Statement of Activities
Taxes and fees per capita divides all taxes and charges for services for primary government
activities by population. Higher taxes and fees per capita reflect a higher tax burden for residents
and a lesser ability of the government to raise taxes or fees further to sustain current service
levels. As such, a lower ratio and decreasing trend are considered favorable.
9) Taxes and Fees per Capita:
Total Primary Government Taxes and Charges for Services
Population Source of Data: Government-Wide Statement of Activities
AN ECONOMIC SNAPSHOT
When analyzing the financial condition of the cities in this report, it is helpful to keep in mind
the economic climate during the same period. Economic indicators offer a more comprehensive
look at the cities’ financial condition by providing the context needed to help explain systemic
trends or to help explain individual components of indicators. To provide an economic snapshot
of the City of Chicago, this section examines population, unemployment, inflation and gross
domestic product (GDP) data. With three of the four indicators, Chicago performed in the less
favorable half of the 13 cities.
It is important to remember that the following indicators of economic condition represent data
from calendar years 2007 through 2011, whereas the financial indicators presented later in this
report represent data from fiscal years 2007 through 2011. Nine of the 13 cities studied do not
have calendar year fiscal years. For complete economic data, see Appendix E of this report on
29
Xiaohu Wang, Lynda Dennis and Yuan Sen (Jeff) Tu, “Measuring Financial Condition: A Study of U.S. States,”
Public Budgeting & Finance, Summer 2007, p. 9.

18
page 5151 which ranks the 13 cities by largest nominal or percentage increase over five years,
and presents the top five and bottom five cities. The appendix also includes a presentation of all
economic indicators by city.
From 2007 to 2011 the City of Chicago experienced a significant drop in population, placing it in
11th
place for percent growth in population among the 13 cities.30
Chicago shrank by 4.4%,
losing 125,388 residents. The city that grew by the largest percentage was Columbus at 6.8%, or
50,573 residents, while the city that declined the most was Detroit at -23.0%, or a loss of 210,649
residents.
During the same time period, Chicago’s unemployment rate increased from 5.7% in 2007 to
11.3% in 2011.31
The 5.6 percentage point increase places Chicago in 3rd
place for growth in
unemployment among the 13 cities. The unemployment rate grew the most in Los Angeles (8.0
percentage points) and grew the least in Pittsburgh (2.4 percentage points).
Between 2007 and 2011, the inflation rate in the City of Chicago fell from 3.3% to 2.7%.32
The
inflation rate increased the most in Kansas City (from 2.3% to 4.0%) and fell the most in Seattle
(from 3.9% to 2.7%). In 2009 all 13 cities experienced disinflation from the previous year from
between 2.9 percentage points (Detroit) to 5.0 percentage points (Chicago). Additionally, eight
of the 13 cities experienced deflation in 2009.
30
Population data come from the U.S. Department of Commerce, Bureau of the Census. Population estimates are
annual estimates of resident population as of July 1st of each year for city areas only.
31 Unemployment data for all cities except Pittsburgh comes from the U.S. Department of Labor, Bureau of Labor
Statistics. Pittsburgh’s unemployment data comes from its FY2011 Comprehensive Annual Financial Report, p. 126.
Unemployment data represent the annual average unemployment rates for city areas only. 32
Inflation data for all cities come from the U.S. Department of Labor, Bureau of Labor Statistics. The annual
average consumer price indexes (CPI) is not seasonally adjusted, has a 1982-84 reference base and, for all cities
except Columbus, represents the city’s metropolitan statistical area (MSA). CPI data for Columbus represents the
Midwest Urban region because an MSA is not available. Inflation data produced in this report reflect percent
changes in CPI from the previous year.

19
Finally, Chicago’s gross domestic product (GDP) grew by 4.9%, or $25.6 billion between 2007
and 2011, placing it in 10th
place among the 13 cities.33
Houston experienced the largest percent
growth in GDP at 12.5%, or $46.5 billion. Detroit experienced the largest decline in GDP with a
2.6% decline, or a loss of $5.3 billion.
FINDINGS
The following sections provide descriptions and rankings for each financial indicator.
Cash Solvency
Cash solvency demonstrates a government’s ability to generate sufficient financial resources to
pay its current liabilities using its resources on hand. To measure cash solvency, this report
examines the working capital to expenses ratio. Over the five-year period, the average annual
change for all cities combined was -0.3. In other words, on average the cities lost 0.3 months of
working capital per year while Chicago lost 0.1 months. Only three of the 13 cities experienced
increases in the ratio while ten decreased. Though the downward trend signals an overall decline
in operational liquidity, it does not necessarily mean that the cities are in poor financial
condition.
Working Capital to Expenses Ratio
Working capital is a measure of operational liquidity and assesses whether a government has the
means available to cover its existing obligations in the short run. The ratio assesses government-
wide assets, liabilities and expenses which are all reported using the full accrual method of
accounting.
Working capital can be thought of as a budgetary buffer if there are fluctuations in cash flow.
When divided by monthly expenses, the working capital to expenses ratio can approximate how
many months the government is able to maintain normal operations with its current level of
resources. An increase in the working capital to expenses ratio over time may reflect increasing
33
GDP data come from the U.S. Department of Commerce, Bureau of Economic Analysis. GDP data for each city
represents the city’s metropolitan statistical area (MSA).
2007 2008 2009 2010 2011
5-Year
Change
%
Change
Population 2,832,508 2,853,114 2,851,268 2,695,598 2,707,120 -125,388 -4.4% Percent Growth in Population: 11th
Unemployment 5.7% 6.9% 10.9% 11.7% 11.3% 5.6% 98.2% Growth in Unemployment Rate: 3rd
Inflation 3.3% 3.8% -1.2% 1.4% 2.7% -0.6% -16.9% Growth in Inflation: 10th
GDP (in $ billions) 522.0$ 525.9$ 516.8$ 532.3$ 547.6$ 25.6$ 4.9% Percent Growth in GDP: 10th
Rank
City of Chicago
Note: Population and unemployment rate data account for city areas only; inflation data account for metropolitan areas per the BLS; GDP data account for metropolitan statistical
areas per the BEA. Unemployment rates are based on CPI data with base period 1982-84=100 and are not seasonally adjusted.
Source: United States Census Bureau; United States Department of Labor, Bureau of Labor Statistics; United States Department of Commerce, Bureau of Economic Analysis.
Ratio
Average Annual
Change - All Cities
Average Annual
Change - Chicago
Working Capital to Expenses (0.3) (0.1)
Cash Solvency
Source: Local Government Comprehensive Annual Financial Reports, FY2007-FY2011.

20
current net assets or decreasing annual expenses, both of which can generally be considered
fiscally sound outcomes.34
The formula for the indicator is the following:
Current Assets – Current Liabilities 1/12 Expenses
Source: Government-Wide Statement of Net Assets and Statement of Activities
The working capital to expenses ratio formula uses the current assets of a municipality,
including:
Cash and cash equivalents: assets that are cash or can be converted into cash
immediately, including petty cash, demand deposits and certificates of deposit;
Investments: any investments that the government has made that will expire within one
year, including stocks and bonds that can be liquidated quickly;
Receivables: monetary obligations owed to the government including property taxes and
interest on loans;
Internal balances: monies due from the government (positive) or due to the government
(negative); and
Inventories: government-wide inventories.
Current liabilities are financial obligations that must be satisfied within one year. These may
include items categorized as long-term liabilities due within one year, or the current portion of
long-term liabilities.35
The working capital to expenses ratio formula uses the following current
liabilities of a municipality:
Payables: monies owed to vendors for goods and services;
Short-Term Debt: loans taken out in anticipation of revenues that are paid back within 12
months or fewer;
Accrued Interest: includes interest due on deposits payable by the government in the next
fiscal year; and
Accrued and Other Liabilities: includes self insurance funds, unclaimed property and
other unspecified liabilities.
The chart below compares the working capital to expenses ratio for 13 U.S. cities between
FY2007 and FY2011. The City of Chicago’s working capital to expenses ratio averaged 4.0
34
Although the Government Finance Officers Association (GFOA) does not discuss working capital benchmarks for
the primary government as an aggregate of governmental and proprietary activities, the GFOA does recommend
appropriate levels of working capital in the enterprise or business-like funds. The GFOA recommends that a
government’s target for working capital be no less than 45 days worth of annual operating expenses, or
approximately 1.5 months. See Government Finance Officers Association, “Appropriate Levels of Working Capital
in Enterprise Funds,” 2011. 35
The current portion of long-term debt is the portion of a long-term obligation that will be settled during the next
year by using current assets. Steven M. Bragg, Interpretation and Application of Generally Accepted Accounting
Principles (New Jersey: Wiley, 2011), 39.

21
months and decreased by nearly 0.2 months over the five-year period. At its lowest point in
FY2008, Chicago’s government-wide working capital to expenses ratio dropped to 3.3 months.
In other words, at any point during the fiscal year 2008, Chicago had enough working capital to
fund approximately three months and one week of operations.
The working capital to expenses ratio reveals that only three of the 13 cities experienced
increases in the ratio over the five-year period while ten decreased. Additionally, New York and
Detroit experienced working capital deficits for at least two fiscal years. Chicago’s five-year
average working capital to expenses ratio of 4.0 months was above the five-year average for all
cities of 3.4 months.
To help explain some of the fluctuations in the working capital to expenses ratios above, the
exhibit below shows each of the components of the ratio for Chicago and the highest and lowest
ranked cities from FY2007 to FY2011. The dip in Chicago’s ratio in FY2008 can be attributed to
a $553.4 million, or 10.5%, decrease in unrestricted current assets from FY2007 to FY2008. This
includes a decrease of nearly $200.0 million in cash and cash equivalents and a loss of $351.3
million in investments government-wide.36
These losses are in part a result of debt financing
used to support the capital improvement program in 2008.37
Baltimore’s working capital to expenses ratio increased by 0.7 months from FY2007 to FY2011,
ranking it first among the 13 cities. The ratio increased because while Baltimore’s current assets
grew by $70.3 million, its current liabilities decreased by $107.4 million, or 14.1%. Much of the
overall decline in liabilities is due to falling accounts payable and accrued liabilities (down $71.6
million), unearned revenue (down $92.7 million) and compensated absences (down $25.0
million).38
However it is important to note that between FY2007 and FY2011, estimated claims
36
City of Chicago, Comprehensive Annual Financial Reports, FY2007 and FY2008, p. 29. 37
City of Chicago, FY2008 Comprehensive Annual Financial Report, p. 16. 38
City of Baltimore, Comprehensive Annual Financial Reports, Statements of Net Assets, FY2010 and FY2011.
Rank FY2007 FY2008 FY2009 FY2010 FY2011 Average
Five-Year
Change
Average
Annual
Change
Indicator
Trend
1 Baltimore* 2.5 3.1 2.3 1.4 3.2 2.5 0.7 0.1 Increased
2 Houston 5.5 5.6 4.6 4.9 5.7 5.2 0.3 0.1 Increased
3 Los Angeles 6.5 5.7 5.8 6.5 6.7 6.2 0.2 0.1 Increased
4 Seattle 3.1 2.4 2.3 2.2 3.0 2.6 (0.1) (0.0) Decreased
5 Chicago 4.1 3.3 4.2 4.4 3.9 4.0 (0.2) (0.1) Decreased
6 New York 0.2 0.3 (0.0) (0.2) (0.5) (0.1) (0.7) (0.2) Decreased
7 Columbus 6.8 4.3 4.2 5.5 6.0 5.4 (0.8) (0.2) Decreased
8 Philadelphia 2.5 1.8 1.5 1.0 1.4 1.6 (1.1) (0.1) Decreased
9 Pittsburgh 1.9 1.1 0.9 0.2 0.7 1.0 (1.2) (0.3) Decreased
10 Boston 4.7 4.1 4.1 3.6 3.4 4.0 (1.3) (0.3) Decreased
11 Phoenix 8.9 6.2 4.3 5.0 5.6 6.0 (3.3) (0.8) Decreased
12 Kansas City 4.7 4.9 4.0 4.1 1.0 3.7 (3.7) (0.3) Decreased
13 Detroit 6.4 4.8 2.7 (0.7) (0.9) 2.5 (7.3) (1.8) Decreased
Average 4.5 3.7 3.1 2.9 3.0 3.4 (1.4) (0.3)
Working Capital to Expenses Ratio
Net Current Assets to Monthly Expenses: FY2007-FY2011
*Baltimore's current liabilities include estimated claims in progress, which represent estimates of personal injury, workers' compensation, unemployment and
medical claims for the fiscal year. The FY2007 CAFR presents all estimated claims in progress as current liabilities. In FY2008-FY2011, the CAFR categorizes
estimated claims in progress into current claims and claims due in more than one year. Claims due in more than one year are not included as current liabilities.
Source: Local government Comprehensive Annual Financial Reports, Statements of Net Assets and Statements of Activities, FY2007-FY2011.
Note: Minimal differences in averages may occur due to rounding. Cities are ranked in order of largest five-year change.

22
in progress – which represent estimates of personal injury, workers’ compensation,
unemployment and medical claims – decreased by $98.9 million largely due to a difference in
the way Baltimore reported the claims from FY2008 through FY2011.39
In the City of Detroit, the working capital to expenses ratio fell significantly from FY2007 to
FY2011. In FY2010 the ratio dropped to a deficit of 0.7 months and fell further to a deficit of 0.9
months in FY2011. These deficits occurred because Detroit experienced significant declines in
current assets and increases in current liabilities. Over the five-year period, current assets fell by
$1.0 billion, or 40.7%, from $2.5 billion in FY2007 to $1.5 billion in FY2011. Much of this loss
is attributable to a $101.1 million decrease in cash and cash equivalents and an $898.2 million
decrease in investments. At the same time, current liabilities grew by $609.2 million, or 56.2%,
from $1.1 billion to nearly $1.7 billion. Some of this increase in current liabilities is due to the
inclusion of the present value of the city’s interest rate swap liabilities.40
Detroit attributes these
trends to a weak economy and resulting high unemployment and depressed property values that
have slowed revenue growth.41
39
The FY2007 CAFR presents all estimated claims in progress as current liabilities. In FY2008-FY2011, the CAFR
categorizes estimated claims in progress into current claims and claims due in more than one year. Claims due in
more than one year are not included as current liabilities. 40
In FY2010, Detroit implemented GASB Statement No. 53 which requires that derivative instruments be recorded
on the Statement of Net Assets at present value. Detroit has entered into interest rate swap agreements to manage the
variable interest rates risk for its pension obligation certificates. For more information, see the City of Detroit’s
FY2010 Comprehensive Annual Financial Report. 41
City of Detroit, Comprehensive Annual Financial Reports, FY2007-FY2011.
Rank FY2007 FY2008 FY2009 FY2010 FY2011
Five-Year
Change
Baltimore 2.5 3.1 2.3 1.4 3.2 0.7
Current Assets 1,189.3$ 1,279.4$ 1,110.2$ 1,030.9$ 1,259.5$ 70.3$
Current Liabilities* 760.2$ 696.4$ 671.7$ 766.4$ 652.8$ (107.4)$
Monthly Expenses 169.3$ 190.2$ 189.4$ 189.0$ 188.6$ 19.3$
Chicago 4.1 3.3 4.2 4.4 3.9 (0.2)
Current Assets 5,277.2$ 4,723.8$ 5,427.3$ 5,835.4$ 5,897.6$ 620.4$
Current Liabilities 2,619.8$ 2,575.8$ 2,724.9$ 2,784.6$ 3,137.4$ 517.6$
Monthly Expenses 645.0$ 652.3$ 650.0$ 693.3$ 710.7$ 65.7$
Detroit 6.4 4.8 2.7 (0.7) (0.9) (7.3)
Current Assets 2,508.5$ 2,348.8$ 1,880.3$ 1,621.8$ 1,488.0$ (1,020.5)$
Current Liabilities 1,083.4$ 1,209.2$ 1,234.6$ 1,780.1$ 1,692.6$ 609.2$
Monthly Expenses 224.0$ 236.9$ 242.4$ 228.1$ 229.7$ 5.7$
Working Capital to Expenses Ratio Components: FY2007-FY2011
(in $ millions)
Note: Minimal differences may occur due to rounding. Cities are ranked in order of largest five-year change.
Source: Local government Comprehensive Annual Financial Reports, Statements of Net Assets and Statements of Activities, FY2007-
FY2011.
1
5
13
*Baltimore's current liabilities include estimated claims in progress, which represent estimates of personal injury, workers' compensation,
unemployment and medical claims for the fiscal year. The FY2007 CAFR presents all estimated claims in progress as current liabilities. In
FY2008-FY2011, the CAFR categorizes estimated claims in progress into current claims and claims due in more than one year. Claims due
in more than one year are not included as current liabilities.

23
Budgetary Solvency
Budgetary solvency is related to a government’s financial ability to maintain current or desired
service levels within the budget period by sufficiently funding operating expenses. To measure
budgetary solvency, this report examines the continuing services ratio, the fund balance ratio and
the operating deficit ratio. For all three ratios, at least nine of the 13 cities experienced downward
trends over the five-year period, suggesting an overall decline in budgetary solvency not only in
the general fund, but government-wide.
Continuing Services Ratio
The continuing services ratio examines both governmental funds and business-type enterprise
funds, presenting a comprehensive look at the government’s operations. The ratio assesses
government-wide net assets and expenses, which are reported using the full accrual method of
accounting.
Though the general fund is the government’s main operating fund, a fiscally stressed general
fund may appear to be healthy due to transfers or loans from other funds.42
There could also be
fiscal distress in a city’s other significant funds. As such, it is useful to examine both the
continuing services ratio, which includes a government-wide view and the general fund fund
balance ratio, which only looks at the general fund and is introduced in the next section.
The continuing services ratio financial indicator examines unrestricted net assets for all funds as
a percentage of expenses for all funds. This indicator measures the degree to which unrestricted
net assets can support continuing government services.43
The difference between a government’s
assets – the resources it can use to operate the government – and its liabilities – its obligations to
turn over resources to other individuals and organizations – is called its net assets. Net assets are
reported in three categories: invested in capital assets (net of related debt), restricted and
unrestricted. The first category shows the value of capital assets minus the outstanding debt that
was incurred to build the assets and accumulated depreciation. Restricted net assets are limited to
a specific purpose, such as activities funded by grants from other governments or revenues set
aside for payment of debt service. Unrestricted net assets are the net assets not included in the
other two categories and can generally be used for any purpose. They are not necessarily cash
assets and may in fact be a negative number, or deficit, because they include offsetting liabilities.
For example, large debt obligations may contribute to an unrestricted net assets deficit even
42
Tina Plerhoples and Eric Scorsone, An Assessment of Michigan’s Local Government Fiscal Indicator System,
Senate Fiscal Agency Issue Paper, September 2010. 43
Judith A. Kamnikar, Edward G. Kamnikar, and Keren H. Deal, “Assessing a State’s Financial Condition,” The
Journal of Government Financial Management, Fall 2006.
Ratio
Average Annual
Change - All Cities
Average Annual
Change - Chicago
Continuing Services -2.8% -5.1%
Fund Balance -1.9% 0.8%
Operating Deficit 0.6% -1.1%
Budgetary Solvency
Source: Local Government Comprehensive Annual Financial Reports, FY2007-FY2011.

24
though those long-term liabilities are not all due in the current year. The formula for the
continuing services ratio is the following:
Unrestricted Net Assets
Total Expenses Source: Government-Wide Statement of Net Assets and Statement of Activities
A higher continuing services ratio, or an increasing trend, can be considered favorable. Having
negative unrestricted net assets in one fiscal year does not mean that a government is insolvent or
in financial crisis, but rather that it has accumulated long-term liabilities that are greater than the
current value of its assets. Negative unrestricted net assets demonstrate the extent to which future
taxing power has already been committed to payment of liabilities.44
Multiple consecutive
deficits are a cause for concern. This brings up the issue of intergenerational equity because
liabilities have been incurred in providing services, but not enough assets have been set aside to
cover them. In other words, future generations of taxpayers will need to pay for liabilities
incurred in the past.
The chart below compares the continuing services ratio between FY2007 and FY2011. Over the
five-year period, four of the 13 cities experienced increasing continuing services ratios. Nine
cities, including Chicago, decreased.
Chicago experienced continuing services deficits in all five fiscal years, with the largest deficit
of 96.3% in FY2010. This means that long-term commitments exceed available resources by the
equivalent of nearly one year of expenditures. This is primarily driven by inadequate budgeting
for long-term liabilities including cumulative pension funding shortfalls of $4.1 billion, as well
as other post employment benefits, or retiree health insurance ($380.9 million),45
and future
liability claims driven from personnel, property, pollution and casualty claims ($656.0 million).
Another factor is a deferred inflow46
of $1.6 billion that is to be amortized into income over the
life of Chicago’s concession service agreements, which include transactions of its metered
parking system, downtown parking garage system and Chicago Skyway.47
The $1.6 billion
unreserved, undesignated deficit, which is reported in the Service Concession Agreement Fund,
represents the net resources of Chicago’s concession and lease transactions and will be amortized
and recognized as revenue as far into the future as the year 2105.48
New York City had the lowest continuing services ratio of the 13 cities; or a deficit of 151.0% in
FY2011, which means its long-term commitments exceed its available resources by the
equivalent of over a year and a half of expenditures. The City of Phoenix had a continuing
services ratio of 62.0% in FY2011. Its available resources were in excess of its commitments,
44
Stephen J. Gauthier, An Elected Official’s Guide to the New Governmental Financial Reporting Model (Chicago:
Government Finance Officers Association, 2000), p. 34. 45
Pension and OPEB obligations are not unfunded liabilities or total pension liabilities, but instead represent the
cumulative difference between the employer’s annual required contributions (ARC) and actual contributions plus
interest. 46
Deferred inflows represent amounts to be recognized as revenue over the life of the related long-term lease and
concession agreements. 47
City of Chicago, FY2010 Comprehensive Annual Financial Report, pp. 19 and 91. 48
City of Chicago, FY2010 Comprehensive Annual Financial Report, pp. 24 and 91.

25
which indicate it is better able to maintain services with its current revenue structure than those
cities with negative ratios.
Pittsburgh had the second lowest five-year average continuing services ratio at -124.9%, but
improved the most over the time period examined. The majority of the cities experienced
decreasing ratios over five years consistent with the overall economic climate while Pittsburgh,
Phoenix, Columbus and Los Angeles showed steady improvements.
Rank City FY2007 FY2008 FY2009 FY2010 FY2011 Average
Five-Year
Change
Average
Annual
Change
Indicator
Trend
1 Pittsburgh -131.3% -134.7% -127.2% -118.4% -113.0% -124.9% 18.3% 4.6% Increased
2 Phoenix 45.6% 44.8% 61.4% 62.0% 62.0% 55.2% 16.4% 4.1% Increased
3 Columbus 23.9% 18.0% 22.2% 36.6% 37.7% 27.7% 13.8% 3.4% Increased
4 Los Angeles 10.4% 9.3% 8.4% 13.0% 13.1% 10.9% 2.7% 0.7% Increased
5 Seattle 21.5% 13.8% 9.4% 6.6% 4.0% 11.1% -17.5% -4.4% Decreased
6 New York -133.1% -138.7% -146.0% -142.2% -151.0% -142.2% -17.9% -4.5% Decreased
7 Philadelphia -15.0% -19.1% -29.7% -32.2% -33.8% -25.9% -18.8% -4.7% Decreased
8 Chicago -64.6% -71.7% -94.4% -96.3% -84.8% -82.3% -20.2% -5.1% Decreased
9 Boston 21.3% 12.7% 6.3% -3.7% -3.9% 6.5% -25.2% -6.3% Decreased
10 Houston -24.2% -29.9% -39.8% -48.9% -52.5% -39.1% -28.3% -7.1% Decreased
11 Kansas City 40.3% 45.4% 16.9% 12.9% 10.7% 25.2% -29.6% -7.4% Decreased
12 Baltimore 12.3% -6.6% -12.7% -6.9% -18.7% -6.5% -31.1% 0.0% Decreased
13 Detroit -15.9% -17.6% -31.6% -58.9% -57.7% -36.3% -41.8% -10.5% Decreased
Average -16.0% -21.1% -27.5% -29.0% -29.8% -24.7% -13.8% -2.8%
Continuing Services Ratio
Ratio of Unrestricted Net Assets to Expenditures: FY2007-FY2011
Note: Minimal differences in averages may occur due to rounding. Cities are ranked in order of largest five-year change.
Source: Local government Comprehensive Annual Financial Reports, Statements of Net Assets and Statements of Activities, FY2007-FY2011.

26
To further examine some of the fluctuations in the continuing services ratios above, the exhibit
below shows each of the components of the ratio for Chicago and the highest and lowest ranked
cities from FY2007 to FY2011. Chicago ranked eighth of the 13 cities with a steady downward
trend over five years. Chicago’s deficit of unrestricted net assets grew from $5.0 billion in
FY2007 to $7.2 billion in FY2011. This means that it was accumulating liabilities without
maintaining offsetting assets. At the same time, expenses of the primary government grew from
$7.7 billion to $8.5 billion. This indicates that Chicago’s fiscal structure and level of services
may not be sustainable in the long-term. In comparison, although Pittsburgh also maintained
significant continuing services deficits, its unrestricted net assets increased by $78.8 million
while expenses grew by only $7.3 million over the five-year period. Detroit’s unrestricted net
assets declined $1.2 billion, or by 272.5%, while expenses grew by $69.0 million, or 2.6%.
Fund Balance Ratio
Fund balance is a term commonly used to describe the net assets of a governmental fund and is
an important indicator of fiscal health. This section examines the unrestricted fund balance levels
of the general fund – the government’s main operating fund – which is reported using the
modified accrual method of accounting. It is important to note that the services provided under
the general fund can differ greatly between cities. For example, in New York City schools are
funded from the General Fund whereas in Chicago they are funded in a legally separate unit of
government. As such, it is useful to examine both the general fund singularly and the
government as a whole.
The Government Finance Officers Association (GFOA) recommends that general-purpose
governments maintain unrestricted fund balance in their general fund of no less than two months
of regular general fund operating revenues or regular general fund operating expenditures, which
is approximately 17%. The GFOA statement adds that each unit of government should adopt a
formal policy that considers its own specific circumstances and that a smaller fund balance ratio
may be appropriate for the largest governments.49
49
Government Finance Officers Association, “Appropriate Level of Unrestricted Fund Balance in the General
Fund,” 2002 and 2009.
Rank FY2007 FY2008 FY2009 FY2010 FY2011
Five-Year
Change
Pittsburgh -131.3% -134.7% -127.2% -118.4% -113.0% 18.3%
Unrestricted Net Assets (623.5)$ (640.6)$ (640.9)$ (603.7)$ (544.7)$ 78.8$
Expenses 474.7$ 475.5$ 503.7$ 509.7$ 482.0$ 7.3$
Chicago -64.6% -71.7% -94.4% -96.3% -84.8% -20.2%
Unrestricted Net Assets (4,997.1)$ (5,610.3)$ (7,359.3)$ (8,014.4)$ (7,232.7)$ (2,235.6)$
Expenses 7,740.2$ 7,827.1$ 7,799.8$ 8,319.0$ 8,528.3$ 788.1$
Detroit -15.9% -17.6% -31.6% -58.9% -57.7% -41.8%
Unrestricted Net Assets (426.9)$ (501.3)$ (920.2)$ (1,612.6)$ (1,590.4)$ (1,163.6)$
Expenses 2,688.0$ 2,842.8$ 2,908.7$ 2,737.5$ 2,757.0$ 69.0$
Source: Local government Comprehensive Annual Financial Reports, Statements of Net Assets and Statements of Activities, FY2007-
FY2011.
Continuing Services Ratio Components: FY2007-FY2011
(in $ millions)
1
8
13
Note: Minimal differences may occur due to rounding. Cities are ranked in order of largest five-year change.

27
In order to address the sometimes inconsistent application of reporting standards for fund
balance by governments, the Governmental Accounting Standards Board (GASB) issued GASB
Statement No. 54: Fund Balance Reporting and Governmental Fund Type Definitions in
February 2009. GASB Statement No. 54 shifts the focus of fund balance reporting from the
availability of fund resources for budgeting purposes to the “extent to which the government is
bound to honor constraints on the specific purposes for which amounts in the fund can be
spent.”50
GASB required that governments implement the new reporting standards with their
FY2011 financial statements. Due to the new classifications of fund balance per the GASB 54
implementation, a complete analysis of the fund balance ratio from FY2007 to FY2011 is not
possible. The following section will compare fund balance ratios from FY2007-FY2010 and
FY2011 separately.
The formula for the indicator is the following:
Prior to GASB 54 (FY2007-FY2010)
Unreserved General Fund fund balance
General Fund Expenditures
After GASB 54 (FY2011)
Unrestricted51
General Fund fund balance
General Fund Expenditures Sources: Governmental Funds Balance Sheet and Governmental Funds Statement of Revenues, Expenditures and
Changes in Fund Balance
Previous Components of Fund Balance
Previously, the categories for fund balance focused on whether resources were available for
appropriation by governments. A variety of external and internal constraints may prevent
portions of the fund balance from being available for budgeting. The unreserved fund balance
thus referred to resources that did not have any external legal restrictions or constraints. The
unreserved fund balance was able to be further categorized as designated and undesignated. A
designation was a limitation placed on the use of the fund balance by the government itself for
planning purposes or to earmark funds.52
New Components of Fund Balance
GASB Statement No. 54 creates five components of fund balance, though not every government
or governmental fund will report all components. The fund balance ratio examines unrestricted
fund balance, which includes the committed, assigned and unassigned fund balance components.
The five GASB components are described as the following:
50
Stephen J. Gauthier, Fund Balance: New and Improved (Chicago: Government Finance Officers Association,
2009). 51
Unrestricted fund balance includes assigned, unassigned and committed fund balance. 52
Stephen J. Gauthier, Fund Balance: New and Improved (Chicago: Government Finance Officers Association,
2009).

28
Nonspendable fund balance – resources that inherently cannot be spent such as pre-paid
rent or the long-term portion of loans receivable. In addition, this category includes
resources that cannot be spent because of legal or contractual provisions, such as the
principal of an endowment.
Restricted fund balance – net fund resources subject to legal restrictions that are
externally enforceable, including restrictions imposed by constitution, creditors or laws
and regulations of non-local governments.
Committed fund balance – net fund resources with self-imposed limitations set at the
highest level of decision-making which remain binding unless removed by the same
action used to create the limitation.
Assigned fund balance – the portion of fund balance reflecting the government’s intended
use of resources, with the intent established by government committees or officials in
addition to the governing board. Appropriated fund balance, or the portion of existing
fund balance used to fill the gap between appropriations and estimated revenues for the
following year, would be categorized as assigned fund balance.
Unassigned fund balance – in the general fund, the remaining surplus of net resources
after funds have been identified in the four categories above.53
The following chart outlines the unreserved general fund balance level from FY2007 to FY2010
as a ratio of expenditures. It is important to be aware that the fund structure and use of the
general fund can differ significantly among local units, impacting the fund balance ratios. For
example, some governments transfer out significant amounts of general fund resources to
subsidize other governmental funds, which would not be accounted for as expenditures. The mix
of services provided under the general fund also differs greatly. For example, in New York City
schools are funded from the General Fund whereas in Chicago they are funded in a legally
separate unit of government.
Over the four-year period, only two cities – Chicago and Kansas City – experienced growth in
fund balance levels. One city experienced mixed fluctuations and ten cities decreased. In
FY2009 the average level of fund balance for all cities was 6.7%, the lowest over the four-year
period. In all four years, the average fund balance level for all cities never met the range of the
GFOA standard. There was a significant change over the four-year period with the average fund
balance level for all cities declining from 13.4% in FY2007 to 7.5% in FY2010. Fund balance
levels ranged from a negative balance of 28.7% in Detroit to a high of 35.2% in Boston.
Although Chicago ranked first in growth of the fund balance ratio, it had the fifth lowest level in
FY2010 at 2.7%. Detroit continued to have the lowest level in FY2010 with a fund balance
deficit of 14.6%, while Boston had the highest level at 27.7%.
It is important to note that although trend analysis identifies Seattle and Phoenix as having the
most significant negative trends in the fund balance ratio, they still exhibited sound financial
condition by maintaining healthy levels of reserves. Seattle and Phoenix, which ranked twelfth
and thirteenth respectively, maintained a relatively large amount of reserves in FY2007. During
the economic recession, these cities drew down their reserves to maintain services. Seattle’s
53
Stephen J. Gauthier, Fund Balance: New and Improved (Chicago: Government Finance Officers Association,
2009).

29
reserves fell from a peak of 31.2% in FY2007 to a low of 14.2% in FY2010. Similarly,
Phoenix’s reserves fell from a peak of 37.2% in FY2007 to a low of 18.0% in FY2009, which is
still above the GFOA’s recommendation of 17%.54
While there was a clear downward trend in average fund balance for this group of cities in total,
some cities experienced somewhat different patterns. For instance, the fund balance of Pittsburgh
and Phoenix had significant fluctuations. Pittsburgh has experienced steady increases in General
Fund expenditures, and it also transfers out resources to its debt service fund, which may have
contributed to the large changes. In FY2010 while General Fund expenditures increased by $63.9
million, Pittsburgh transferred $84.9 million from its General Fund to its debt service fund,
leaving approximately $42.6 million in unreserved fund balance. Kansas City and Columbus
experienced slight improvements in fund balance between FY2009 and FY2010 after previous
declines.55
Detroit continued to have a deficit in FY2010, but the size of the deficit shrank
considerably from the previous year.
In FY2010 Chicago had only a nominal unreserved Corporate Fund fund balance equal to 2.7%
of Corporate Fund expenditures. Not considered in this analysis are legally restricted reserves
from the leases of the Skyway toll road and parking meters because they are not unreserved fund
balance.56
At the end of 2011, after depleting much of the parking meter reserves, the aggregate
principal balance in the Skyway and parking meter asset lease reserve funds was approximately
54
Government Finance Officers Association, “Appropriate Level of Unrestricted Fund Balance in the General
Fund,” 2002 and 2009. 55
Columbus implemented a new fund balance reporting system starting in FY2009 consistent with GASB Statement
No. 54. For FY2009 and FY2010, the ratio includes assigned and unassigned balances. 56
In 2005 the City of Chicago leased the Skyway toll road to a private operator for 99 years for $1.83 billion. In
2009 the City leased its parking meters to a private operator for 75 years for $1.15 billion.
Rank City FY2007 FY2008 FY2009 FY2010 Average
Four-Year
Change
Average
Annual
Change
Indicator
Trend
1 Chicago 0.2% 0.0% 0.1% 2.7% 0.7% 0.6% 0.8% Increased
2 Kansas City 5.6% 8.6% 2.5% 5.9% 5.7% 0.1% 0.1% Increased
3 New York 0.8% 0.8% 0.8% 0.8% 0.8% 0.0% 0.0% Decreased*
4 Boston 33.5% 35.2% 35.2% 27.7% 32.9% -0.6% -1.9% Mixed
5 Houston 16.9% 19.3% 16.3% 11.4% 16.0% -0.9% -1.8% Decreased
6 Baltimore 4.8% 2.7% 2.8% 2.2% 3.2% -1.7% 0.0% Decreased
7 Los Angeles 10.9% 10.1% 7.4% 6.6% 8.7% -2.1% -1.4% Decreased
8 Columbus** 15.4% 8.6% 8.7% 14.2% 11.7% -3.7% -0.4% Decreased
9 Detroit -12.2% -18.6% -28.7% -14.6% -18.5% -6.3% -0.8% Decreased
10 Philadelphia 4.2% -0.6% -7.2% -7.0% -2.7% -6.9% -3.8% Decreased
11 Pittsburgh 26.1% 13.9% 15.9% 10.3% 16.6% -9.6% -5.3% Decreased
12 Seattle 31.2% 18.3% 14.6% 14.2% 19.6% -11.6% -5.7% Decreased
13 Phoenix 37.2% 18.7% 18.0% 23.3% 24.3% -12.9% -4.6% Decreased
Average 13.4% 9.0% 6.7% 7.5% 9.2% -4.3% -1.9%
Fund Balance Ratio
Unreserved General Fund Fund Balance as a Percent of General Fund Expenditures: FY2007-FY2010
Note: Minimal differences in averages may occur due to rounding. Cities are ranked in order of largest five-year change.
Source: Local government Comprehensive Annual Financial Reports, Statements of Revenues, Expenditures and Changes in Fund Balances,
Governmental Funds, FY2007-FY2010.
**Columbus implemented reporting changes to fund balance per GASB 54 in FY2009.
*The fund balance ratio for New York decreased from 0.8046% in FY2007 to 0.7509% in FY2010.

30
$624.0 million.57
Chicago has since made efforts to replenish some of the parking meter reserves
as part of its FY2012 and FY2013 budgets. Although rating agencies upgraded Chicago’s
general obligation bond ratings in response to the creation of the Skyway reserve,58
the use of
other lease reserves to maintain operating expenses over time has driven rating agencies to
downgrade its bonds.59
Since the long-term asset lease reserves are legally restricted, they are not
considered unreserved or unrestricted fund balance.
Though Chicago’s fund balance ratio increased over the four-year period, its low level during
those years is an indicator of fiscal distress and must continue to be monitored. New York’s fund
balance level was just as low between FY2007 and FY2010 at 0.8% of expenditures, but it
completely drew down its General Fund fund balance in FY2011.60
The following chart shows the FY2011 fund balance ratio for each of the cities ranked by largest
ratio. Due to the new classifications of fund balance per the GASB 54 implementation, a
complete analysis of the fund balance ratio from FY2007 to FY2011 is not possible. The FY2011
fund balance levels reflect unrestricted General Fund fund balance, which includes committed,
assigned and unassigned General Fund fund balance.
The next chart presents the fund balance components for the City of Chicago and the cities with
the highest and lowest ranked levels of General Fund fund balance in FY2011. Although a five-
57
City of Chicago, 2011 Annual Financial Analysis, pp. 36-40. 58
Yvette Shields, “Skeptical Chicago Eyes P3s,” The Bond Buyer, March 20, 2012. 59
Yvette Shields, “Chicago’s Mayor Takes Aim at Deficit,” The Bond Buyer, October 12, 2011. 60
City of New York, FY2011 Comprehensive Annual Financial Report, p. 71.
Rank City FY2011
1 Phoenix 30.9%
2 Boston 26.5%
3 Seattle 18.7%
4 Columbus 17.4%
5 Pittsburgh 16.9%
6 Baltimore 15.4%
7 Los Angeles 12.6%
8 Chicago 10.2%
9 Houston 8.3%
10 Kansas City 8.0%
11 New York 0.0%
12 Philadelphia -1.3%
13 Detroit -15.9%
Average 11.4%
Source: Local government Comprehensive Annual Financial
Reports, Statements of Revenues, Expenditures and Changes in
Fund Balances, Governmental Funds, FY2007-FY2011.
Fund Balance Ratio
Unrestricted General Fund Fund Balance as a
Percent of General Fund Expenditures: FY2011
Note: Minimal differences in averages may occur due to rounding.

31
year trend analysis of the ratio itself is not possible due to the reclassification of fund balance
components, the following chart shows both the General Fund unreserved and unrestricted fund
balance levels, as well as General Fund expenditures for the fiscal years 2007 through 2011.
Chicago’s level of Corporate Fund expenditures has not fluctuated much over the five-year
period, showing relative stability in its spending. In contrast, the City of Detroit has decreased
government expenditures by $207.9 million and still had fund balance deficits in all five years.
Phoenix on the other hand has maintained healthy levels of reserves, with its unreserved fund
balance dropping to its lowest level at 18.0% in FY2009. Although analysts like credit rating
agencies, which regularly monitor the size of governmental fund balances, prefer large reserves
so that there is a degree of assurance that debt service payments will be made, a government
consistently maintaining excessive reserves may raise concerns from taxpayers and citizens’
groups about whether the government is taxing too much and hoarding the proceeds.
Despite a general decline in fund balance levels between FY2007 and FY2011 among the 13
municipal governments, many governments maintained healthy levels of budgetary reserves.
Many units came close to reaching the GFOA standard with GASB reclassifications in FY2011,
with five cities exceeding 15.0% of fund balance and eight cities, including Chicago, exceeding a
10.0% fund balance ratio.
Operating Deficit Ratio
The operating deficit ratio shows the general fund operating surplus or deficit as a percentage of
total operating expenditures on an actual basis and not a budgeted basis. A positive ratio occurs
when an operating surplus exists, or when revenues exceed expenditures. A negative ratio occurs
when an operating deficit exists, of when expenditures exceed revenues. The ratio examines the
general fund revenues and expenditures, which are reported using the modified accrual method
of accounting.
Governments and the media often report the projected deficit or budget shortfall for the
upcoming fiscal year as they are developing a budget, but they do not report how much money
has actually been received and spent. The projected deficit provides a framework for the
FY2011
Rank FY2007 FY2008 FY2009 FY2010 FY2011*
Five-Year
Change
Phoenix 37.2% 18.7% 18.0% 23.3% 30.9% -
General Fund Unreserved Fund Balance 362.9$ 205.3$ 190.3$ 231.2$ -$ -
General Fund Unrestricted Fund Balance -$ -$ -$ -$ 291.0$ -
General Fund Expenditures 976.4$ 1,097.8$ 1,056.9$ 991.1$ 943.1$ (33.4)$
Chicago 0.2% 0.0% 0.1% 2.7% 10.2% -
Corporate Fund Unreserved Fund Balance 4.6$ 0.2$ 2.7$ 81.2$ -
Corporate Fund Unrestricted Fund Balance -$ -$ -$ -$ 311.5$ -
Corporate Fund Expenditures 3,063.0$ 3,107.3$ 3,014.1$ 3,033.9$ 3,040.4$ (22.6)$
Detroit -12.2% -18.6% -28.7% -14.6% -15.9% -
General Fund Unreserved Fund Balance (155.6)$ (219.2)$ (331.9)$ (155.7)$ -$ -
General Fund Unrestricted Fund Balance -$ -$ -$ -$ (169.7)$ -
General Fund Expenditures 1,278.1$ 1,181.4$ 1,155.9$ 1,068.9$ 1,070.2$ (207.9)$
Source: Local government Comprehensive Annual Financial Reports, Statement of Revenues, Expenditures and Changes in Fund Balances, Governmental
Funds, FY2007-FY2011.
1
*The components of the fund balance ratio changed in FY2011 due to a reporting change per GASB 54.
Fund Balance Ratio Components: FY2007-FY2011
(in $ millions)
8
13
Note: Minimal differences may occur due to rounding.

32
government to determine how much expenditures need to be reduced, revenues increased or
reserves used in developing its budget. In contrast, the operating deficit ratio examined here is
rarely widely reported. It reflects the difference between revenues and expenditures in completed
fiscal years. The formula for the operating deficit ratio is the following:
General Fund Surplus or Deficit
Net Operating Expenditures Sources: Governmental Funds Statement of Revenues, Expenditures and Changes in Fund Balance
A higher operating deficit ratio, or an increasing trend, can be considered favorable. A deficit in
one year does not necessarily indicate financial difficulty. A government may have had an
unusually large expenditure in the current year, but prudently planned for such an event by
conserving resources in previous periods. Credit ratings agencies are generally concerned when
there are two or more consecutive years of deficits, when the size of deficits is increasing or
when there is an abnormally large deficit (5% to 10%).61
In addition, the continuous recurrence
of deficits may exhaust a government’s reserves.
The chart below compares the general fund operating deficit ratio between FY2007 and FY2011.
Over the five-year period, only four cities experienced increasing trends in the operating deficit
ratio, meaning that surpluses grew, deficits shrank or deficits became surpluses. The other nine
cities, including Chicago, experienced decreasing trends, meaning that deficits grew, surpluses
shrank or surpluses became deficits. Two cities – Chicago and Philadelphia – experienced
deficits in each of the five years.
In FY2011 the City of Chicago had an operating deficit of 8.5% of expenditures, a significant
increase from its operating deficit of 4.2% in FY2007. The shift is largely due to a loss of $158.1
million in Corporate Fund revenues and an increase of $131.7 million in Corporate Fund
expenditures over the five-year period.62
Chicago’s largest deficit during this time was in
FY2009, of 15.0%. Much of the lost revenue that fiscal year occurred in elastic or economically
sensitive revenues including sales, income and transaction taxes.63
The large size and consistent nature of Chicago’s operating deficit ratio is a cause for concern
because it indicates that operating expenses consistently and significantly exceeded revenues. In
addition, Chicago ran an operating deficit ratio each of the past five fiscal years, a strong
indication that it has a structural deficit. A structural deficit is a condition characterized by
annual expenditure increases that consistently outpace recurring revenue increases over time.
Philadelphia was the only other city in this study to run an operating deficit each of the five
years.
During the five-year period, none of the 13 cities’ deficit situations steadily improved, although
Phoenix appears to have experienced a significant improvement in FY2011. However, the
61
Craig S. Maher and Karl Nollenberger, “Revisiting Kenneth Brown’s ‘10-Point Test’,” Government Finance
Review, October 2009. 62
City of Chicago, Comprehensive Annual Financial Reports, Statements of Revenues, Expenditures and Changes
in Fund Balances for Governmental Funds, FY2007-FY2011. 63
City of Chicago, FY2009 Comprehensive Annual Financial Reports, p. 19.

33
increase in General Fund excess revenues is due to an accounting change that does not reflect the
aggregate deficiency of revenues for all of the governmental funds.64
It is important to note that
although trend analysis identifies Pittsburgh and Seattle as having the most significant negative
trends in the operating deficit ratio, they still exhibited sound financial condition by running
General Fund surpluses each year.
64
Per GASB 54, as of FY2011, the City of Phoenix no longer reports its Excise Tax Special Revenue Fund as a
separate major governmental fund. Rather, it reports the balances and activities of the fund directly into the
individual governmental funds used to expend those excise tax revenues. See City of Phoenix, FY2011
Comprehensive Annual Financial Report, p. 1.
Rank City FY2007 FY2008 FY2009 FY2010 FY2011 Average
Five-Year
Change
Average
Annual
Change
Indicator
Trend
1 Phoenix -69.3% -71.8% -71.5% -69.1% 7.0% -55.0% 76.3% 19.1% Increased
2 Kansas City 7.1% 12.8% 9.5% 9.8% 13.8% 10.6% 6.7% 1.7% Increased
3 Columbus 2.8% -3.2% 1.4% 9.7% 6.8% 3.5% 3.9% 1.0% Increased
4 Los Angeles 3.6% 3.0% 1.9% 1.0% 6.8% 3.3% 3.2% 0.8% Decreased
5 Philadelphia -2.8% -11.0% -14.7% -6.5% -2.3% -7.5% 0.4% 0.1% Increased
6 Baltimore 8.3% 5.8% 5.1% 6.0% 7.0% 6.4% -1.3% -0.3% Decreased
7 New York 10.6% 9.7% 3.4% 6.1% 8.4% 7.6% -2.2% -0.5% Decreased
8 Detroit 16.4% 10.3% 9.7% 11.1% 14.0% 12.3% -2.4% -0.6% Decreased
9 Chicago -4.2% -7.5% -15.0% -13.9% -8.5% -9.8% -4.4% -1.1% Decreased
10 Houston 9.0% 10.3% 7.3% 1.7% 1.4% 6.0% -7.6% -1.9% Decreased
11 Boston 2.3% 1.3% -0.6% -7.2% -7.0% -2.2% -9.3% -2.3% Decreased
12 Pittsburgh 40.6% 34.9% 25.3% 5.3% 31.2% 27.5% -9.5% -2.4% Decreased
13 Seattle 51.3% 27.9% 27.8% 29.3% 29.0% 33.1% -22.2% -5.6% Decreased
Average 5.8% 1.7% -0.8% -1.3% 8.3% 2.8% 2.4% 0.6%
Operating Deficit Ratio
General Fund Surplus (Deficit) as a Percentage of Expenditures: FY2007-FY2011
Note: Minimal differences in averages may occur due to rounding. Cities are ranked in order of largest five-year change.
Source: Local government Comprehensive Annual Financial Reports, Statements of Revenues, Expenditures and Changes in Fund Balances, Governmental
Funds, FY2007-FY2011.

34
To further examine the fluctuations in the operating deficit ratios above, the exhibit below shows
each of the components of the ratio for Chicago and the highest and lowest ranked cities from
FY2007 to FY2011. As noted above, the fluctuation in Phoenix’s excess revenues in the General
Fund is due to a reporting change in FY2011 and does not reflect the overall deficit of revenues
for all of Phoenix’s governmental funds. Although Seattle ranked 13th
due to its significant
decline in operating surplus, it maintained a healthy level of General Fund revenues over
expenditures throughout the five-year period. Chicago’s operating deficit ratio has declined over
the five-year period, though it has improved since its lowest point in FY2009. Much of the
increased deficit of Corporate Fund revenues is due to fewer economically sensitive revenues
received in FY2009 and FY2010, reflecting the difficulty of maintaining a budget balance in
those years.
Long-Run Solvency
Long-run solvency assesses the availability of future resources to pay for existing long-term
obligations. To measure long-run solvency, this report examines the net worth ratio and the debt
service expenditure ratio. The indicators of long-run solvency returned mixed results: an overall
declining trend in the net worth ratio suggests that fewer available resources became available
over the five year period, while a slightly declining trend in the debt service expenditure ratio
suggests that an increasingly smaller proportion of spending was allocated to debt services over
the same period.
Rank FY2007 FY2008 FY2009 FY2010 FY2011
Five-Year
Change
Phoenix -69.3% -71.8% -71.5% -69.1% 7.0% 76.3%
General Fund Revenues Over (Under)
Expenditures (676.6)$ (788.5)$ (756.2)$ (684.8)$ 65.7$ 742.3$
General Fund Expenditures 976.4$ 1,097.8$ 1,056.9$ 991.1$ 943.1$ (33.4)$
Chicago -4.2% -7.5% -15.0% -13.9% -8.5% -4.4%
Corporate Fund Revenues Over (Under)
Expenditures (127.6)$ (231.5)$ (452.5)$ (423.1)$ (259.3)$ (131.7)$
Corporate Fund Expenditures 3,063.0$ 3,107.3$ 3,014.1$ 3,033.9$ 3,040.4$ (22.6)$
Seattle 51.3% 27.9% 27.8% 29.3% 29.0% -22.2%
General Fund Revenues Over (Under)
Expenditures 325.0$ 199.8$ 204.8$ 216.3$ 225.1$ (99.8)$
General Fund Expenditures 633.8$ 714.9$ 737.6$ 737.7$ 775.2$ 141.5$
Source: Local government Comprehensive Annual Financial Reports, Statements of Revenues, Expenditures and Changes in Fund Balances,
Governmental Funds, FY2007-FY2011.
Operating Deficit Ratio Components: FY2007-FY2011
(in $ millions)
1
5
13
Note: Minimal differences may occur due to rounding. Cities are ranked in order of largest five-year change.
Ratio
Average Annual
Change - All Cities
Average Annual
Change - Chicago
Net Worth -1.4% -2.8%
Debt Service Expenditure -0.2% -0.3%
Long-Run Solvency
Source: Local Government Comprehensive Annual Financial Reports, FY2007-FY2011.

35
Net Worth Ratio
The difference between a government’s assets, the resources it can use to operate the
government, and its liabilities, its obligations to turn over resources to other individuals and
organizations, is called its net assets. It is the broadest single number included in the financial
statements. It is a measure of the net worth of a government and signifies the government’s
ability to pay off existing long-term liabilities.65
The net worth ratio measures government-wide
restricted and unrestricted net assets as a percentage of its total assets, which are reported using
the full accrual method of accounting. A larger net worth ratio indicates a higher level of long-
term solvency. The formula for the net worth ratio is the following:
Restricted and Unrestricted Net Assets
Total Assets
Source: Government-Wide Statement of Net Assets and Statement of Activities
Net assets “invested in capital” are excluded because governments cannot generally use these
assets to pay off long-term obligations.66
Restricted net assets are net assets with constraints
placed on their use either by external groups (such as creditors, laws or regulations of other
governments) or by enabling legislation. Unrestricted net assets are all other net assets: those
without constraints or invested in capital assets.
65
Stephen J. Gauthier, An Elected Official’s Guide to the New Governmental Financial Reporting Model (Chicago:
Government Finance Officers Association, 2000), p. 34. 66
Xiaohu Wang, Lynda Dennis and Yuan Sen (Jeff) Tu, “Measuring Financial Condition: A Study of U.S. States,”
Public Budgeting & Finance, Summer 2007.

36
The net worth ratio varied considerably among the 13 cities, though the average of all the cities
generally declined from FY2007 with a slight improvement in FY2011. In FY2011 Chicago had
a net worth ratio of -15.6% meaning there were no available restricted and unrestricted net
assets. In five years, Chicago’s net worth decreased by 11.1 percentage points, due largely to a
$3.6 billion decline in restricted and unrestricted net assets. Phoenix had a positive balance with
restricted and unrestricted net assets representing 19.1% of total net assets, meaning that 19.1%
of Phoenix assets are owned free and clear whereas Chicago has leveraged its assets.
To further examine the fluctuations in the net worth ratios above, the exhibit below shows each
of the components of the ratio for Chicago and the highest and lowest ranked cities from FY2007
to FY2011.
From FY2007 to FY2011, Chicago’s deficit of restricted and unrestricted net assets steadily
grew, ultimately reflecting a decline of $3.6 billion over the five-year period despite an overall
increase of $5.2 billion in assets. Pittsburgh’s net worth ratio has fluctuated between -135.9%
and -164.4%. Over the five-year period, liabilities have consistently exceeded assets at the close
of each fiscal year. The deficits, which range from a low of $526.5 million in FY2011 to a peak
of $619.9 million in FY2007, result primarily from outstanding general obligation bonds that
were issued to finance projects that do not result in regular assets recorded in the financial
statements. Such funding includes payments toward pensions, financing economic development
efforts and infrastructure maintenance expenditures.67
In contrast, despite a significant reduction
of $740.3 million in restricted and unrestricted net assets, Boston maintained a positive net worth
ratio each fiscal year.
67
City of Pittsburgh, FY2010 Comprehensive Annual Financial Report, p. i.
Rank City FY2007 FY2008 FY2009 FY2010 FY2011 Average
Five-Year
Change
Average
Annual
Change
Indicator
Trend
1 Pittsburgh -151.8% -144.1% -151.5% -164.4% -135.9% -149.5% 15.9% 4.0% Increased
2 Phoenix 17.1% 14.4% 17.2% 18.6% 19.1% 17.3% 1.9% 0.5% Increased
3 Los Angeles 14.3% 14.2% 14.9% 15.7% 14.8% 14.8% 0.5% 0.1% Increased
4 Houston -0.3% -1.0% -3.6% -5.1% 0.0% -2.0% 0.3% 0.1% Mixed
5 Columbus 10.8% 8.5% 9.7% 9.9% 10.8% 9.9% 0.1% 0.0% Increased
6 Seattle 9.4% 7.8% 6.1% 4.6% 6.1% 6.8% -3.3% -0.8% Decreased
7 Kansas City 10.5% 10.8% 4.5% 3.9% 3.8% 6.7% -6.8% -1.7% Decreased
8 Chicago -4.5% -7.7% -10.3% -12.5% -15.6% -10.1% -11.1% -2.8% Decreased
9 Detroit 0.0% -0.4% -4.1% -11.9% -11.7% -5.6% -11.7% -2.9% Decreased
10 Baltimore 8.5% 1.2% -0.2% 0.7% -3.4% 1.4% -11.8% 0.0% Decreased
11 Philadelphia 3.8% -0.2% -5.6% -11.1% -9.9% -4.6% -13.7% -3.4% Decreased
12 New York -120.1% -125.2% -128.1% -135.7% -138.0% -129.4% -17.9% -4.5% Decreased
13 Boston 29.1% 19.9% 13.0% 4.2% 2.2% 13.7% -26.9% -6.7% Decreased
Average -13.3% -15.5% -18.3% -21.8% -19.8% -17.8% -6.5% -1.4%
Net Worth Ratio
Restricted and Unrestricted Net Assets to Total Assets: FY2007-FY2011
Note: Minimal differences in averages may occur due to rounding. Cities are ranked in order of largest five-year change.
Source: Local government Comprehensive Annual Financial Reports, Statements of Net Assets, FY2007-FY2011.

37
Over time, consistent or increasing deficits of restricted and unrestricted net assets suggest lower
long-run solvency. Chicago’s trend, in particular, is a major concern as it indicates deterioration
in the City’s financial condition. Specifically, the City has growing long-term liabilities and is
not generating adequate additional resources to meet those demands.
Debt Service Expenditure Ratio
Many cities across the United States have a large and increasing direct debt load, which can be a
major indicator of financial risk. Long-term debt consists of tax-supported debt components such
as general obligation bonds and notes as well as bond premium and issuance costs. Credit rating
agencies take into account a government’s debt load when deciding that government’s bond
rating. They regard debt service that exceeds 20% of operating revenues as a potential problem;
10% and below is considered acceptable.68
The debt service expenditure ratio examines debt service expenditures in the governmental
funds, which are reported using the modified accrual method of accounting. The formula for the
debt service ratio is the following:
Debt Service Expenditure
Total Expenditures
Sources: Governmental Funds Statement of Revenues, Expenditures and Changes in Fund Balance
Debt service expenditures include principal retirement, interest and other fiscal charges made in
the current fiscal year. The ratio of debt service expenditures as a percentage of total
governmental fund expenditures can be used to assess service flexibility with the amount of
expenses committed to annual debt service. As the ratio increases, service flexibility decreases
because more operating resources are being committed to a required financial obligation. In other
words, the more a government spends on financing its debt, the less it will have available to fund
68
Craig S. Maher and Karl Nollenberger, “Revisiting Kenneth Brown’s “10-Point Test,” Government Finance
Review, October 2009. See also Standard & Poor’s, “U.S. State Ratings Methodology,” January 3, 2011.
Rank FY2007 FY2008 FY2009 FY2010 FY2011
Five-Year
Change
Pittsburgh -151.8% -144.1% -151.5% -164.4% -135.9% 15.9%
Restricted and Unrestricted
Net Assets (619.9)$ (590.3)$ (589.9)$ (598.3)$ (526.5)$ 93.4$
Total Assets 408.4$ 409.7$ 389.5$ 364.0$ 387.3$ (21.1)$
Chicago -4.5% -7.7% -10.3% -12.5% -15.6% -11.1%
Restricted and Unrestricted
Net Assets (1,135.0)$ (1,988.2)$ (2,802.3)$ (3,612.0)$ (4,761.5)$ (3,626.5)$
Total Assets 25,285.0$ 25,865.2$ 27,107.8$ 28,964.6$ 30,477.8$ 5,192.8$
Boston 29.1% 19.9% 13.0% 4.2% 2.2% -26.9%
Restricted and Unrestricted
Net Assets 803.4$ 589.8$ 395.7$ 128.0$ 63.0$ (740.3)$
Total Assets 2,762.8$ 2,962.6$ 3,035.4$ 3,041.8$ 2,923.2$ 160.3$
Source: Local government Comprehensive Annual Financial Reports, Statements of Net Assets, FY2007-FY2011.
Net Worth Ratio Components: FY2007-FY2011
(in $ millions)
1
8
13
Note: Minimal differences may occur due to rounding. Cities are ranked in order of largest five-year change.

38
ongoing services. Therefore, a decreasing trend with the debt service expenditure ratio is
favorable.
The chart below compares debt service expenditures between FY2007 and FY2011. In FY2011
the City of Chicago had a debt service expenditure ratio of 9.3%, which continues a steady
decrease from its peak of 15.1% in FY2008. In FY2008 debt service expenditures increased by
$393.1 million, or 61.4%, from the prior fiscal year, while total governmental expenditures
increased by $740.9 million, or 12.1%. From FY2008 to FY2010, debt service expenditures
decreased by $277.1 million while total expenditures decreased by $505.0 million.69
Although
Chicago’s debt service expenditure ratio has declined in recent years, its five-year average of
11.9% is greater than the five-year average for all 13 cities at 9.7%. The relatively large size of
the ratio is a cause for concern because it indicates that a large portion of Chicago’s operating
expenses are being designated for long-term obligations.
None of the 13 cities experienced a consistent decline in its debt service expenditure ratio,
although many cities generally declined over the five-year period. Kansas City, which ranked
last, experienced a steady increase in debt service expenditure until FY2011, when it dropped to
12.6% from its peak of 13.1% in FY2010.
69
City of Chicago, FY2007 to FY2010 Comprehensive Annual Financial Report, Statement of Revenues,
Expenditures, and Changes in Fund Balances, Governmental Funds.

39
Seattle experienced one of the largest declines between FY2008 and FY2010, with debt service
expenditures dropping from its peak of 8.4% of total governmental expenditures to its low of
4.7%. Much of this decline can be attributed to a $55.4 million, or 44.9%, drop in debt service
expenditures in FY2009 from the previous fiscal year, while total governmental expenditures
increased by $50.7 million, or 3.4%.70
The drop in debt service is due in part to advance
refunding payments made to escrow in FY2007 and FY2008. In order to lower interest costs,
Seattle refunded and defeased certain bonds by issuing new refunding bonds, the proceeds of
which are placed in escrow.71
To further examine the fluctuations in the debt service ratios above, the exhibit below shows
each of the components of the ratio for Chicago and the highest and lowest ranked cities from
FY2007 to FY2011. As the ratio increases – as either debt service expenditures increase or total
governmental expenditures decrease – service flexibility decreases because more operating
resources are being committed to a required financial obligation. Therefore, a decreasing trend
with the debt service expenditure ratio is favorable.
70
City of Seattle, FY2008 and FY2009 Comprehensive Annual Financial Report, Statement of Revenues,
Expenditures, and Changes in Fund Balances, Governmental Funds. 71
City of Seattle, FY2008 Comprehensive Annual Financial Report, pp. 99-100.
Rank FY2007 FY2008 FY2009 FY2010 FY2011 Average
Five-Year
Change
Average
Annual
Change
Indicator
Trend
1 Phoenix 15.3% 7.9% 8.4% 9.8% 9.8% 10.3% -5.5% -1.4% Decreased
2 Columbus 12.4% 10.9% 11.9% 11.2% 9.8% 11.2% -2.6% -0.7% Decreased
3 Seattle 7.4% 8.4% 5.9% 4.7% 5.1% 6.3% -2.4% -0.6% Decreased
4 New York 8.9% 7.2% 6.2% 6.5% 7.3% 7.2% -1.7% -0.4% Decreased
5 Pittsburgh 20.6% 20.1% 18.7% 17.2% 19.1% 19.1% -1.6% -0.4% Decreased
6 Chicago 10.5% 15.1% 12.5% 11.9% 9.3% 11.9% -1.2% -0.3% Decreased
7 Baltimore 5.5% 5.1% 4.6% 5.2% 5.2% 5.1% -0.3% 0.0% Decreased
8 Philadelphia 3.6% 3.6% 3.3% 3.7% 3.5% 3.5% -0.1% 0.0% Decreased
9 Houston 12.8% 13.2% 20.1% 12.0% 13.0% 14.2% 0.2% 0.1% Increased
10 Boston 4.4% 4.2% 4.3% 4.6% 4.6% 4.4% 0.2% 0.1% Increased
11 Detroit 12.5% 13.3% 13.8% 10.6% 12.9% 12.6% 0.4% 0.1% Increased
12 Los Angeles 8.0% 8.7% 9.5% 8.1% 8.4% 8.5% 0.4% 0.1% Increased
13 Kansas City 8.7% 10.7% 11.5% 13.1% 12.6% 11.3% 3.9% 1.0% Increased
Average 10.0% 9.9% 10.0% 9.1% 9.3% 9.7% -0.8% -0.2%
Source: Local government Comprehensive Annual Financial Reports, Statements of Revenues, Expenditures and Changes in Fund Balances, Governmental
Funds, FY2007-FY2011.
Debt Service Expenditure Ratio
Governmental Funds Debt Service to Expenditures: FY2007-FY2011
Note: Minimal differences in averages may occur due to rounding. Cities are ranked in order of largest five-year change.

40
Phoenix’s debt service ratio decreased 5.5 percentage points between FY2007 and FY2011. A
closer examination of the components of the ratio show that while debt service expenditures
decreased by $160.2 million, total governmental expenditures decreased by a more significant
$258.8 million. In contrast, Kansas City’s debt service expenditure ratio increased 3.9 percentage
points because debt service expenditures increased by $29.4 million over the five-year period,
while total governmental expenditures steadily declined by $148.4 million, inflating the debt
service ratio. The City of Chicago’s ratio has declined steadily, largely due to total governmental
expenditures increasing by $523.1 million, while debt service expenditures decreased by a more
modest $21.6 million.
Service-Level Solvency
Service-level solvency reflects a government’s ability to maintain services at the quality and
level required to ensure the safety and welfare of citizens and to meet their expectations and
desires. Expenses per capita, liabilities per capita and taxes and fees per capita are measures of a
government’s service-level solvency. Generally, higher indicators reveal lower levels of
solvency. Expenses and governmental liabilities per capita assess the cost of services. Taxes and
fees per capita reflect the tax burden placed on residents. As such, declining trends are favorable
for all these indicators. Although some cities experienced declines in the service-level indicators
over the five-year period, the average annual change for all cities reveals systemic growth in
expenses, liabilities and taxes and fees per capita.
All of the data for the following indicators have been adjusted for inflation to reflect 2011
dollars. Financial data come from the government-wide Statement of Net Assets and Statement
Rank FY2007 FY2008 FY2009 FY2010 FY2011
Five-Year
Change
Phoenix 15.3% 7.9% 8.4% 9.8% 9.8% -5.5%
Debt Service Expenditures 376$ 206$ 203$ 229$ 215$ (160.2)$
Total Expenditures 2,448$ 2,599$ 2,414$ 2,333$ 2,189$ (258.8)$
Chicago 10.5% 15.1% 12.5% 11.9% 9.3% -1.2%
Debt Service Expenditures 640$ 1,033$ 786$ 756$ 618$ (21.6)$
Total Expenditures 6,099$ 6,839$ 6,269$ 6,334$ 6,622$ 523.1$
Kansas City 8.7% 10.7% 11.5% 13.1% 12.6% 3.9%
Debt Service Expenditures 108$ 130$ 130$ 142$ 137$ 29.4$
Total Expenditures 1,239$ 1,213$ 1,128$ 1,085$ 1,090$ (148.4)$
Source: Local government Comprehensive Annual Financial Reports, Statements of Revenues, Expenditures and Changes in Fund
Balances, Governmental Funds, FY2007-FY2011.
Debt Service Ratio Components: FY2007-FY2011
(in $ millions)
1
6
13
Note: Minimal differences may occur due to rounding. Cities are ranked in order of largest five-year change.
Ratio
Average Annual
Change - All Cities
Average Annual
Change - Chicago
Real Expenses per Capita 37.11$ 58.17$
Real Liabilities per Capita 319.77$ 824.02$
Real Taxes and Fees per Capita 9.10$ 28.36$
Source: Local Government Comprehensive Annual Financial Reports, FY2007-FY2011.
Service-Level Solvency

41
of Activities, which use the full accrual method of accounting. Population data come from the
United States Census Bureau’s annual estimates as of July 1 for each year and the 2010 Census.
During the five-year period, the City of Chicago’s population declined by 125,388 residents.72
Expenses per Capita
Expenses per capita divides the total expenses of the primary government, which include
governmental activities and business-type activities, by population. Higher expenses per capita
generally reveal a more expensive government and lower solvency to sustain that expense
level.73
However, it is important to note that higher expenses do not necessarily translate to a
higher burden on taxpayers since business-type activities include expenses funded by user fees.
For example, expenses per capita in Chicago include expenses incurred by O’Hare and Midway
Airports even though those activities are funded by airport fees and not property or consumer
taxes.
The exhibit below ranks each of the 13 U.S. cities by their five-year average annual change and
five-year change in expenses per capita. From FY2007 to FY2011, Chicago’s real expenses grew
by an average of $58.17 per person annually, the tenth highest average increase of the 13 cities.
Over the five-year period, real expenses grew by $232.68 per person.
72
See Appendix E on page 51 of this report for other cities’ populations. 73
Xiaohu Wang, Lynda Dennis and Yuan Sen (Jeff) Tu, “Measuring Financial Condition: A Study of U.S. States,”
Public Budgeting & Finance, Summer 2007, p. 9.

42
Real expenses for Chicago’s primary government increased by $76.2 million from FY2007 to
FY2011. Over the five-year period, budgeted appropriations for governmental activities have
increased significantly, including for infrastructure services and transportation, public safety and
the city’s General Financing Requirements, which include pension contributions, long-term debt
payments and other cross-department expenses.74
Liabilities per Capita
Liabilities per capita divides the total liabilities of the primary government by population and
represents the government’s relative indebtedness with regard to future taxpayers. The exhibit
below ranks each of the 13 U.S. cities by their five-year average annual change and five-year
change in liabilities per capita. From FY2007 to FY2011, Chicago’s real liabilities grew by an
average of $824.02 per person annually, the eleventh highest average annual increase. Over the
five-year period, liabilities grew by $3,296.08 per person.
74
For more details on the City’s appropriations trends from FY2007 to FY2011, see the Civic Federation’s City of
Chicago FY2011 Proposed Budget: Analysis and Recommendations, November 3, 2010.
Average
Rank Annual Rank Five-Year
1 Philadelphia (106.54)$ 1 Philadelphia (426.14)$
2 Kansas City (55.61)$ 2 Kansas City (222.45)$
3 Seattle (38.87)$ 3 Seattle (155.49)$
4 Pittsburgh (32.57)$ 4 Pittsburgh (130.27)$
5 Columbus 14.97$ 5 Columbus 59.89$
6 Los Angeles 32.28$ 6 Los Angeles 129.14$
7 Houston 34.10$ 7 Houston 136.41$
8 Baltimore 39.55$ 8 Baltimore 158.20$
9 Boston 52.50$ 9 Boston 210.00$
10 Chicago 58.17$ 10 Chicago 232.68$
11 Phoenix 84.72$ 11 Phoenix 338.89$
12 New York 199.44$ 12 New York 797.77$ 13 Detroit 200.24$ 13 Detroit 800.96$
$ 37.11 $ 148.43
Source: Local Government Comprehensive Annual Financial Reports, FY2007-FY2011.
Real Expenses Per Capita (in 2011 dollars)
Average Annual Change and Five-Year Change: 2007-2011
Average Average

43
Chicago’s real liabilities grew by $7.8 billion from FY2007 to FY2011. Over the five-year
period, real long-term debt (bonds, notes and certificates payable) rose by 13.4%, from $7.9
billion to nearly $9.0 billion. Of its long-term liabilities, the single largest percentage and dollar
increase over the five-year period was for cumulative pension funding shortfalls, which
increased by 112.0% or $2.8 billion after depreciation.75
The steady increases in long-term
obligations, particularly the large increase in pension funding shortfalls, are a cause for concern.
Taxes and Fees per Capita
Taxes and fees per capita divides all taxes and charges for services for primary government
activities by population. Higher taxes and fees per capita reflect a higher tax burden for residents.
The exhibit below ranks each of the 13 U.S. cities by their five-year average annual change and
five-year change in real taxes and fees per capita. From FY2007 to FY2011, Chicago’s taxes and
fees grew by an average of $28.36 per person annually, the ninth highest average annual
increase. Over the five-year period, taxes and fees grew by $113.45 per person.
75
City of Chicago, Comprehensive Annual Financial Reports, FY2007-FY2011, Note 10 Long-Term Obligations.
For budgetary trends, see also the Civic Federation’s City of Chicago FY2012 Proposed Budget: Analysis and
Recommendations, November 2, 2011. The cumulative pension funding shortfalls reported in the City’s audited
financial statements do not represent total unfunded pension liabilities. Reported net pension obligations are the
cumulative difference between annual pension costs and the employer’s contributions to its plans since 1998 when
reporting standards were modified per GASB Statement No. 27.
Average
Rank Annual Rank Five-Year
1 Pittsburgh (187.14)$ 1 Pittsburgh (748.54)$
2 Philadelphia (46.57)$ 2 Philadelphia (186.29)$
3 Kansas City 16.78$ 3 Kansas City 67.14$
4 Baltimore 79.81$ 4 Baltimore 319.23$
5 Columbus 128.27$ 5 Columbus 513.08$
6 Phoenix 220.33$ 6 Phoenix 881.32$
7 Seattle 226.53$ 7 Seattle 906.10$
8 Boston 262.28$ 8 Boston 1,049.10$
9 Houston 282.04$ 9 Houston 1,128.18$
10 Los Angeles 393.92$ 10 Los Angeles 1,575.68$
11 Chicago 824.02$ 11 Chicago 3,296.08$
12 Detroit 899.02$ 12 Detroit 3,596.08$
13 New York 1,057.69$ 13 New York 4,230.78$
$ 319.77 $ 1,279.07
Real Liabilities Per Capita (in 2011 dollars)
Average Annual Change and Five-Year Change: 2007-2011
Source: Local Government Comprehensive Annual Financial Reports, FY2007-FY2011.
Average Average

44
The City of Chicago’s real taxes and fees increased by $76.2 million, or 1.5%. Over the five-year
period, real actual resources for Chicago have increased by $479.8 million, or 7.9%. This
includes $195.0 million, or 28.5%, in increased property tax revenues and $146.8 million, or
26.3%, in sewer and water revenue.76
While Chicago’s expenses and liabilities per capita were increasing by an average of $58.17 and
$824.02 annually, the City’s primary sources of revenue per capita was increasing by
significantly less at an average of $28.36 annually. This suggests that Chicago is experiencing a
growing imbalance between the demands of its citizens, particularly with long-term liabilities,
and the means to fund them.
76
For more details on the City’s budgetary trends in resources from FY2007 to FY2011, see the Civic Federation’s
City of Chicago FY2011 Proposed Budget: Analysis and Recommendations, November 3, 2010.
Average
Rank Annual Rank Five-Year
1 Seattle (91.08)$ 1 Seattle (364.32)$
2 Philadelphia (48.49)$ 2 Philadelphia (193.94)$
3 New York (31.38)$ 3 New York (125.51)$
4 Kansas City (21.41)$ 4 Kansas City (85.63)$
5 Pittsburgh (15.88)$ 5 Pittsburgh (63.51)$
6 Los Angeles 1.84$ 6 Los Angeles 7.37$
7 Phoenix 16.94$ 7 Phoenix 67.74$
8 Columbus 19.63$ 8 Columbus 78.51$
9 Chicago 28.36$ 9 Chicago 113.45$
10 Houston 30.50$ 10 Houston 122.01$
11 Boston 51.39$ 11 Boston 205.58$
12 Baltimore 88.57$ 12 Baltimore 354.28$
13 Detroit 89.30$ 13 Detroit 357.18$
$ 9.10 $ 36.40
Source: Local Government Comprehensive Annual Financial Reports, FY2007-FY2011.
*Fees are "Charges for Services" shown for all primary government in the government-wide Statement of Activities.
Average Average
Real Taxes and Fees* Per Capita (in 2011 dollars)
Average Annual Change and Five-Year Change: 2007-2011

45
APPENDIX A: GLOSSARY77
Accrual Basis of Accounting (or Full Accrual): An accounting method that attempts to
recognize revenues when they are earned and expenses when they are incurred, not when cash
changes hands. The Governmental Accounting Standards Board (GASB) requires this
accounting method for governments. Contrast this term to “modified accrual basis of
accounting.”
Accrued Interest: Interest due on deposits payable by the government in the next fiscal year.
Accrued and Other Liabilities: Self insurance funds, unclaimed property and other unspecified
liabilities.
Assets: Resources a government owns or controls that can be used in the provision of services or
the generation of other resources to support service provision.
Balance Sheet: The financial statement for the governmental funds that focuses on the balances
of spendable resources available at the end of the fiscal year.
Budgetary Solvency: The ability to maintain current or desired service levels within the budget
period by sufficiently funding operating expenses.
Cash and Cash Equivalents: Assets that are cash or can be converted into cash immediately,
including petty cash, demand deposits and certificates of deposit.
Cash Solvency: The ability to generate sufficient financial resources to pay its current liabilities.
Comprehensive Annual Financial Report (CAFR): A set of government financial statements
comprising the financial report of a state, municipal or other governmental entity that complies
with the generally accepted accounting principles (GAAP) set by the Governmental Accounting
Standards Board (GASB).
Corporate Fund: The City of Chicago’s General Fund, or main operating fund.
Current Assets: Assets that are reasonably expected to be converted into cash within one year.
Current Liabilities: Obligations that are due within one year, including accounts payable,
accrued liabilities and liabilities due to other units of government.
Debt Service Expenditure: The amount that a local government must pay each year for
principal and interest on debt. Expenditures are made from the major governmental operating
funds and the debt service fund and are recorded in accordance with prescribed accounting
principles.
77
All definitions are from various audited financial statements and Investopedia.

46
Deflation: Deflation occurs when the general price level of goods and services decline, shown
by a negative inflation rate.
Disinflation: Disinflation occurs when the inflation rate, or the growth in the general price level
of goods and services, slows.
Expenditures: Outflows of resources, under modified accrual, that occur when resources are
consumed or goods and services are purchased and received.
Expenses: Outflows of resources, under full accrual, that occur when assets are consumed or
costs are incurred.
Financial Solvency: The ability to finance expected services on a continuing basis with
recurring resources.
Full Accrual Basis of Accounting: An accounting method that attempts to recognize revenues
when they are earned and expenses when they are incurred, not when cash changes hands. The
Governmental Accounting Standards Board (GASB) requires this accounting method for
governments. Contrast this term to “modified accrual basis of accounting.”
Fund: A grouping of related accounts that is used to maintain control over resources
that have been segregated for specific activities or objectives. Governmental funds can be
divided into three categories: governmental funds, proprietary funds and fiduciary funds.
Fund Balance: The difference between fund assets and fund liabilities accumulated over the life
of the fund.
General Fund: A government’s main operating fund. The City of Chicago’s General Fund is
called the Corporate Fund.
Generally Accepted Accounting Principles (GAAP): Uniform minimum standards and
guidelines for financial accounting and reporting that serve to achieve some level of
standardization.
Governmental Accounting Standards Board (GASB): A private non-profit body responsible
for establishing and improving accounting and financial reporting standards for governmental
units in the United States. Although they do not have the force of law, governments are required
to follow GASB standards in order to obtain clean opinions from their auditors and failure to
comply with GASB standards can adversely affect a state or local government’s attempts to issue
bonds.
Governmental Fund: A fund that accounts for the basic, typically tax-supported activities of a
government; governmental fund types include general, special revenue, debt service, capital
projects and permanent funds.
Internal balances: Monies due from (positive) or due to (negative) the government.

47
Inventories: Government-wide inventories that are included as current liabilities.
Investments: Any investments that the government has made that will expire within one year,
including stocks and bonds that can be liquidated quickly.
Liabilities: Amounts a government owes to others.
Long-Run Solvency: The ability to pay for existing long-term obligations. Long-run solvency
assesses the impact of existing long-term obligations on future resources.
Modified Accrual Basis of Accounting: A basis of accounting that recognizes revenues as those
collected within the year or soon enough thereafter that can be used to finance current-year
expenditures. Expenditures represent the use or expected use of current financial resources.
Net Pension Obligations: Net pension obligations as reported in the audited financial statements
are the cumulative difference between annual pension costs and the employer’s contributions to
its plans since 1998 when reporting standards were modified per GASB Statement No. 27.
Payables: Monies owed to vendors for goods and services
Receivables: Monetary obligations owed to the government including property taxes and interest
on loans.
Revenues: Inflows of resources that are measurable and collectible; under modified accrual, they
are also available to finance current-period expenditures.
Service-Level Solvency: The ability to maintain services at the quality and level required to
ensure the safety and welfare of citizens and to meet their expectations and desires.
Short-Term Debt: Loans taken out in anticipation of revenues that are paid back within 12
months or less.
Statement of Activities: The government-wide financial statement that presents information
showing how the government's net assets changed during each fiscal year.
Statement of Net Assets: The government-wide financial statement that presents information on
all of the government’s assets, deferred outflows, liabilities and deferred inflows with the
difference reported as net assets.
Statement of Revenues, Expenditures and Changes in Fund Balance: The financial statement
for the governmental funds which focuses on near-term inflows and outflows of spendable
resources.

48
APPENDIX B: CITY OF CHICAGO NET ASSETS
Over the past five years, Chicago’s net assets have plummeted by 262.6%, due in part to an $8.9
billion increase in its long-term (non-current) liabilities.78
The City’s total net assets have fallen
from a surplus of $1.6 billion in FY2007 to a deficit of $2.6 billion in FY2011. Unrestricted net
assets – net assets that are not invested in capital assets or restricted for specific use – reached a
deficit of $7.2 billion in FY2011. It is important to note that the City’s long-term obligations
include debt issued for capital projects on behalf of Chicago Public Schools and the Chicago
Park District, which may not be reported as net assets invested in capital since those capital
assets are owned by the separate units of government. The significant decline in net assets is
driven by a $9.4 billion, or 39.7% increase in total liabilities over the five-year period.
78
The cumulative pension funding shortfalls reported in the City’s audited financial statements do not represent total
unfunded pension liabilities. Reported net pension obligations are the cumulative difference between annual pension
costs and the employer’s contributions to its plans since 1998 when reporting standards were modified per GASB
Statement No. 27.
FY2007 FY2008 FY2009 FY2010 FY2011 $ Change % Change
Total Assets 25,285.0$ 25,865.2$ 27,107.8$ 28,964.6$ 30,477.8$ 5,192.8$ 20.5%
Total Liabilities 23,680.5$ 25,035.1$ 27,372.3$ 30,535.3$ 33,087.3$ 9,406.8$ 39.7%
Net Investment in Capital 2,739.5$ 2,818.3$ 2,537.8$ 2,041.2$ 2,151.9$ (587.6)$ -21.4%
Restricted Net Assets 3,862.1$ 3,622.0$ 4,557.0$ 4,402.4$ 2,471.2$ (1,390.9)$ -36.0%
Unrestricted Net Assets (4,997.1)$ (5,610.3)$ (7,359.3)$ (8,014.4)$ (7,232.7)$ (2,235.6)$ 44.7%
Total Net Assets 1,604.5$ 830.1$ (264.5)$ (1,570.8)$ (2,609.6)$ (4,214.0)$ -262.6%
City of Chicago Net Assets: FY2007-FY2011
(in $ millions)
Source: City of Chicago Comprehensive Annual Financial Reports, FY2007-FY2011

49
APPENDIX C: SUMMARY OF FINANCIAL INDICATORS
Financial Indicator Formula Source Method of Accounting
Current Assets - Current Liabilities 1/12 Expenses
Unrestricted Net Assets Statement of Net Assets Full Accrual
Total Expenses Statement of Activities Full Accrual
Unrestricted General Fund Fund Balance Balance Sheet Modified Accrual
General Fund Expenditures Statement of Revenues, Expenditures
and Changes in Fund Balance
Modified Accrual
General Fund Surplus or Deficit
Net Operating Expenditures
Restricted and Unrestricted Net Assets
Total Assets
Debt Service Expenditure
Total Expenditures
Total Primary Government Expenses
Population
Total Liabilities
Population
Total Primary Government Taxes and
Charges for Services
Population
Statement of Activities
Statement of Net Assets
Statement of ActivitiesTaxes and Fees per
Capita
Full Accrual
Full Accrual
Full Accrual
Summary of Financial Indicators
Cash Solvency: The ability to generate sufficient financial resources to pay current liabilities.
Budgetary Solvency: The ability to maintain current or desired service levels within the budget period by sufficiently funding
operating expenses
Long-Run Solvency: The availability of future resources to pay for existing long-term obligations.
Expenses per Capita
Governmental Liabilities
per Capita
Service-Level Solvency: The ability to maintain services at the quality and level required to ensure the safety and welfare of
citizens and to meet their expectations and desires.
Working Capital to
Expenses Ratio
Fund Balance Ratio
Continuing Services
Ratio
Operating Deficit Ratio
Net Worth Ratio
Debt Expenditure Ratio
Full Accrual
Modified Accrual
Full Accrual
Modified Accrual
Statement of Net Assets
Statement of Revenues, Expenditures
and Changes in Fund Balance
Statement of Net Assets
Statement of Revenues, Expenditures
and Changes in Fund Balance

50
APPENDIX D: LIMITATIONS OF FINANCIAL INDICATOR ANALYSIS
Due to a number of factors, the analysis presented in this report has certain limitations including
the following:
This report does not prescribe the way in which all governments ought to be examined to
determine financial condition. There is a universe of hundreds of possible indicators of
financial condition. The Civic Federation strove in this report to select useful, familiar
financial indicators that make intuitive sense to present the City of Chicago’s relative
financial condition to a non-academic audience;
The 13 cities selected in the analysis represent vastly different governments and
demographics. Each city has unique governmental operations, social and demographic
compositions and local and state laws, all of which could influence the indicators but are
not accounted for in the analysis;
Primary government operations for each of the cities can include vastly different services.
For example, the New York City public school system is a branch of the municipal
government, whereas Chicago’s public school system is a separate district governed by
the Board of Education. In FY2011 over 31.5% of New York’s General Fund
expenditures were allocated to education.79
The City of Chicago, however, does not fund
public education with its General Fund since public education is funded through Chicago
Public Schools (CPS);80
In addition to varying services, the report does not examine differences in the
responsibilities of each government or compare capital condition;
Although all cities are for the same time period (2007-2011 fiscal years) and include the
economic recession and aftermath, regional differences can affect the indicators and are
not accounted for in the analysis;
Cities may implement accounting changes for any given fiscal year. These changes can
have a significant impact on how financial data is reported and, when examining financial
indicators over time, can create a misleading trend;
The report uses pre-GASB 68 audited financial statements and therefore do not include a
consistently applied measurement of unfunded actuarial accrued pension liabilities;81
and
An indicator that appears to have a negative trend may reflect a planned service choice by
a government. For example, a city may have increasing debt service expenditures as a
result of a major capital or infrastructure project. Conversely, a government with falling
debt service expenditures could be neglecting its capital condition.
79
City of New York, FY2011 Comprehensive Annual Financial Report, p. 46. 80
Although the City of Chicago does not fund public education directly, it does make pension contributions on
behalf of non-teacher CPS employees, has issued debt on behalf of CPS and has funded school construction through
tax increment financing. 81
GASB Statement 68 requires governments providing defined benefit pensions to recognize their long-term
obligation for pension benefits as a liability on the balance sheet and to more comprehensively measure the annual
costs of pension benefits. The provisions of Statement 68 are effective after June 15, 2014.

51
APPENDIX E: ECONOMIC DATA FOR THE 13 U.S. CITIES ANALYZED
Population Change82
From 2007 to 2011, Columbus experienced the largest percent growth in population of the 13
cities at 6.8%, reflecting an increase of 50,573 residents. Detroit experienced the largest
population decline both by percent and number, losing 210,649 residents, or 23.0% of its 2007
population. Of the 13 cities, Chicago ranked eleventh with a 4.4% loss in population, or
approximately 125,388 residents.
82
Population data come from the U.S. Department of Commerce, Bureau of the Census. Population estimates are
annual estimates of resident population as of July 1st of each year for city areas only.
0
500,000
1,000,000
1,500,000
2,000,000
2,500,000
3,000,000
3,500,000
4,000,000
4,500,000
Columbus Philadelphia Seattle Los Angeles Boston
2007
2008
2009
2010
2011
Percent Growth (Decline) in Population from FY2007-FY2011: Top Five Cities
6.1%
6.8% 5.3%
1.1%
0.4%
0
500,000
1,000,000
1,500,000
2,000,000
2,500,000
3,000,000
Houston Baltimore Chicago Phoenix Detroit
2007
2008
2009
2010
2011
-2.8%
-4.4%
-4.5%
-23.0%
-3.2%
Percent Growth (Decline) in Population from FY2007-FY2011: Bottom Five Cities

52
Growth in Unemployment83
From 2007 to 2011, Los Angeles experienced the largest increase in unemployment, with its
unemployment rate growing by 8.0 percentage points from 5.6% in 2007 to 13.6% in 2011.
Pittsburgh experienced the smallest increase in unemployment, growing 2.4 percentage points
from 4.2% in 2007 to 6.6% in 2011. Of the 13 cities, Chicago ranked third with its
unemployment rate growing 5.6 percentage points from 5.7% in 2007 to 11.3% in 2011. For
each of the cities, the unemployment rate grew by more in 2009 than any other year.
Additionally, the unemployment rate declined in all cities in 2011 except for Pittsburgh where it
grew by 0.1 percentage point and Philadelphia where it remained flat.
83
Unemployment data for all cities except Pittsburgh comes from the U.S. Department of Labor, Bureau of Labor
Statistics. Pittsburgh’s unemployment data comes from its FY2011 Comprehensive Annual Financial Report, p. 126.
Unemployment data represent the annual average unemployment rates for city areas only.
0.0%
5.0%
10.0%
15.0%
20.0%
25.0%
30.0%
Los Angeles Detroit Chicago Phoenix Baltimore
2007
2008
2009
2010
2011
Growth (Decline) in Unemployment Rate from FY2007-FY2011: Top Five Cities
5.6 points 5.2 points5.0 points
8.0 points
5.8 points
0.0%
2.0%
4.0%
6.0%
8.0%
10.0%
12.0%
Houston Columbus Kansas City Boston Pittsburgh*
2007
2008
2009
2010
2011
Growth (Decline) in Unemployment Rate from FY2007-FY2011: Bottom Five Cities
2.9 points3.9 points
2.8 points
2.7 points2.4 points

53
Growth in Inflation84
From 2007 to 2011, the inflation rate in Kansas City rate increased by 1.7 percentage points, the
largest increase among the 13 cities, from 2.3% in 2007 to 4.0% in 2011. Seattle’s inflation rate
decreased the most, falling by 1.2 percentage points from 3.9% in 2007 to 2.7% in 2011. Of the
13 cities, Chicago ranked tenth with its inflation rate decreasing 0.6 percentage points from 3.3%
in 2007 to 2.7% in 2011. In 2009 all 13 cities experienced disinflation from the previous year
from between 2.9 percentage points (Detroit) to 5.0 percentage points (Chicago).85
Additionally,
eight of the 13 cities experienced deflation in 2009.86
84
Inflation data for all cities come from the U.S. Department of Labor, Bureau of Labor Statistics. The annual
average consumer price index (CPI) is not seasonally adjusted, has a 1982-84 reference base and, for all cities
except Columbus, represents the city’s metropolitan statistical area (MSA). CPI data for Columbus represents the
Midwest Urban region because an MSA is not available. Inflation data produced in this report reflect percent
changes in CPI from the previous year. 85
Disinflation occurs when the inflation rate, or the growth in the general price level of goods and services, slows. 86
Deflation occurs when the general price level of goods and services decline, shown by a negative inflation rate.
-1.0%
0.0%
1.0%
2.0%
3.0%
4.0%
5.0%
6.0%
Kansas City Pittsburgh Houston Detroit Boston
2007
2008
2009
2010
2011
Growth (Decline) in Inflation Rate from FY2007-FY2011: Top Five Cities
1.5 points
1.7 points
1.5 points 1.5 points0.8 points
-2.0%
-1.0%
0.0%
1.0%
2.0%
3.0%
4.0%
5.0%
Baltimore Chicago Los Angeles Phoenix Seattle
2007
2008
2009
2010
2011
(0.3) points
(0.6) points (0.6)
points(0.6)
points
(1.2) points
(0.3) points
(0.6) points (0.6)
points(0.6)
points
(1.2) points
Growth (Decline) in Inflation Rate from FY2007-FY2011: Bottom Five Cities
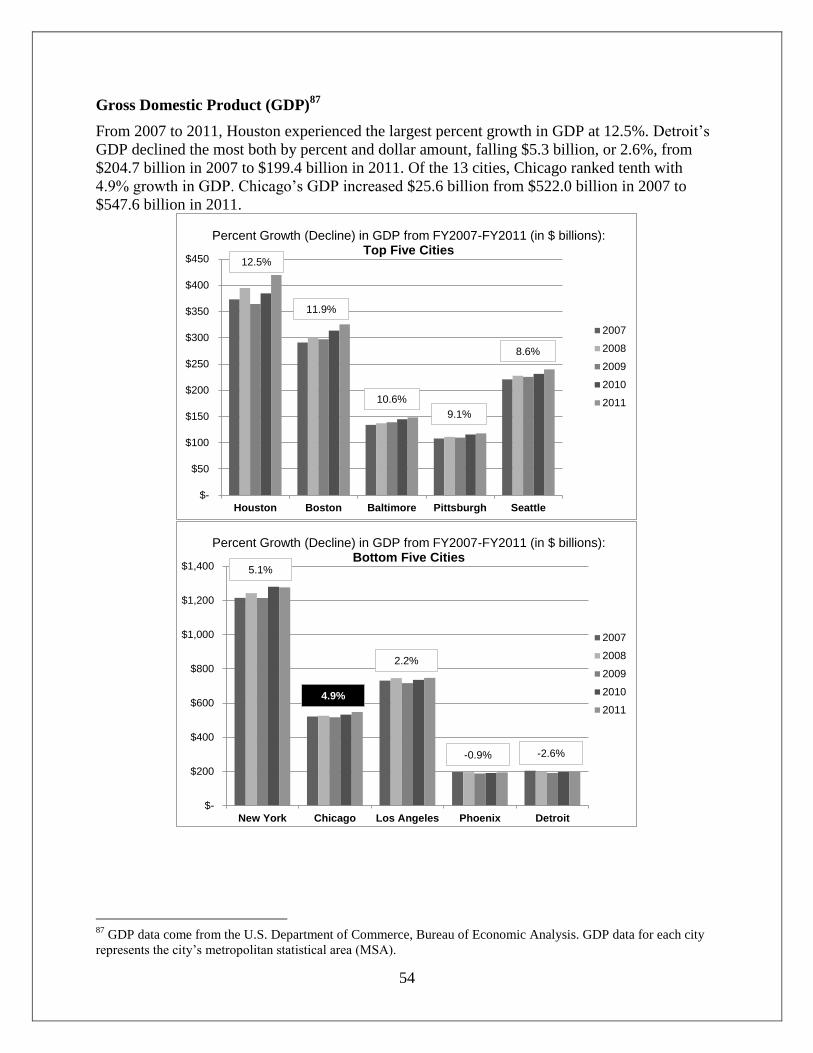
54
Gross Domestic Product (GDP)87
From 2007 to 2011, Houston experienced the largest percent growth in GDP at 12.5%. Detroit’s
GDP declined the most both by percent and dollar amount, falling $5.3 billion, or 2.6%, from
$204.7 billion in 2007 to $199.4 billion in 2011. Of the 13 cities, Chicago ranked tenth with
4.9% growth in GDP. Chicago’s GDP increased $25.6 billion from $522.0 billion in 2007 to
$547.6 billion in 2011.
87
GDP data come from the U.S. Department of Commerce, Bureau of Economic Analysis. GDP data for each city
represents the city’s metropolitan statistical area (MSA).
$-
$50
$100
$150
$200
$250
$300
$350
$400
$450
Houston Boston Baltimore Pittsburgh Seattle
2007
2008
2009
2010
2011
Percent Growth (Decline) in GDP from FY2007-FY2011 (in $ billions): Top Five Cities
12.5%
11.9%
10.6%
9.1%
8.6%
$-
$200
$400
$600
$800
$1,000
$1,200
$1,400
New York Chicago Los Angeles Phoenix Detroit
2007
2008
2009
2010
2011
5.1%
2.2%
-0.9% -2.6%
4.9%
Percent Growth (Decline) in GDP from FY2007-FY2011 (in $ billions): Bottom Five Cities

55
Complete data on the four economic indicators for each of the 13 cities follows:
2007 2008 2009 2010 2011 5-Yr Change % Change
Population 640,150 638,091 637,418 620,961 619,493 -20,657 -3.2%
Unemployment 5.5% 6.6% 10.8% 11.9% 10.5% 5.0% 90.9%
Inflation 3.6% 4.5% 0.2% 1.7% 3.3% -0.3% -7.6%
GDP (in $ billions) 134.1$ 137.2$ 139.1$ 144.8$ 148.3$ 14.2$ 10.6%
2007 2008 2009 2010 2011 5-Yr Change % Change
Population 622,748 636,748 645,169 617,594 625,087 2,339 0.4%
Unemployment 4.4% 5.1% 7.6% 8.0% 7.1% 2.7% 61.4%
Inflation 3.6% 4.5% 0.2% 1.7% 3.3% -0.3% -7.6%
GDP (in $ billions) 291.0$ 300.7$ 297.2$ 313.7$ 325.6$ 34.6$ 11.9%
2007 2008 2009 2010 2011 5-Yr Change % Change
Population 2,832,508 2,853,114 2,851,268 2,695,598 2,707,120 -125,388 -4.4%
Unemployment 5.7% 6.9% 10.9% 11.7% 11.3% 5.6% 98.2%
Inflation 1.9% 3.5% -0.7% 1.6% 2.7% 0.8% 40.3%
GDP (in $ billions) 522.0$ 525.9$ 516.8$ 532.3$ 547.6$ 25.6$ 4.9%
2007 2008 2009 2010 2011 5-Yr Change % Change
Population 746,861 754,885 769,332 787,033 797,434 50,573 6.8%
Unemployment 4.7% 5.5% 8.3% 8.6% 7.6% 2.9% 61.7%
Inflation* 3.3% 3.8% -1.2% 1.4% 2.7% -0.6% -16.9%
GDP (in $ billions) 89.1$ 89.8$ 90.3$ 93.4$ 94.0$ 4.9$ 5.5%
2007 2008 2009 2010 2011 5-Yr Change % Change
Population 917,234 912,632 910,921 713,777 706,585 -210,649 -23.0%
Unemployment 14.1% 15.9% 24.9% 23.1% 19.9% 5.8% 41.1%
Inflation 2.7% 3.7% -0.6% 2.0% 3.2% 0.6% 21.3%
GDP (in $ billions) 204.7$ 197.2$ 190.8$ 197.8$ 199.4$ (5.3)$ -2.6%
2007 2008 2009 2010 2011 5-Yr Change % Change
Population 2,206,573 2,238,183 2,257,926 2,099,451 2,145,146 -61,427 -2.8%
Unemployment 4.3% 4.8% 7.2% 8.5% 8.2% 3.9% 90.7%
Inflation 1.8% 2.3% -0.6% 0.8% 3.3% 1.5% 81.3%
GDP (in $ billions) 373.2$ 394.8$ 364.2$ 384.6$ 419.7$ 46.5$ 12.5%
2007 2008 2009 2010 2011 5-Yr Change % Change
Population 475,830 480,129 482,299 459,787 463,202 -12,628 -2.7%
Unemployment 4.3% 4.8% 7.2% 8.5% 8.2% 3.9% 90.7%
Inflation 1.8% 2.3% -0.6% 0.8% 3.3% 1.5% 81.3%
GDP (in $ billions) 101.2$ 104.3$ 103.5$ 106.0$ 108.1$ 7.0$ 6.9%
Baltimore
Boston
Chicago
Columbus
Detroit
Houston
Kansas City

56
2007 2008 2009 2010 2011 5-Yr Change % Change
Population 3,778,658 3,801,576 3,831,868 3,792,621 3,819,702 41,044 1.1%
Unemployment 5.6% 8.3% 12.8% 13.9% 13.6% 8.0% 142.9%
Inflation 3.3% 3.5% -0.8% 1.2% 2.7% -0.6% -19.0%
GDP (in $ billions) 731.3$ 745.7$ 717.2$ 735.7$ 747.3$ 16.0$ 2.2%
2007 2008 2009 2010 2011 5-Yr Change % Change
Population 8,310,212 8,346,794 8,391,881 8,175,133 8,244,910 -65,302 -0.8%
Unemployment 4.9% 5.5% 9.2% 9.5% 9.0% 4.1% 83.7%
Inflation 2.8% 3.9% 0.4% 1.7% 2.8% 0.0% 0.6%
GDP (in $ billions) 1,215.2$ 1,242.8$ 1,214.2$ 1,280.5$ 1,277.2$ 62.1$ 5.1%
2007 2008 2009 2010 2011 5-Yr Change % Change
Population 1,448,631 1,447,395 1,547,297 1,526,006 1,536,471 87,840 6.1%
Unemployment 6.0% 7.1% 9.6% 10.8% 10.8% 4.8% 80.0%
Inflation 2.2% 3.4% -0.4% 2.0% 2.7% 0.5% 22.3%
GDP (in $ billions) 325.9$ 333.0$ 335.6$ 346.9$ 353.3$ 27.5$ 8.4%
2007 2008 2009 2010 2011 5-Yr Change % Change
Population 1,538,431 1,569,917 1,593,659 1,445,632 1,469,471 -68,960 -4.5%
Unemployment 3.7% 6.2% 10.6% 11.2% 8.9% 5.2% 140.5%
Inflation 3.4% 3.5% -1.4% 0.6% 2.8% -0.6% -18.8%
GDP (in $ billions) 196.6$ 196.3$ 188.2$ 190.6$ 194.8$ (1.8)$ -0.9%
2007 2008 2009 2010 2011 5-Yr Change % Change
Population 312,322 312,119 311,647 305,704 307,484 -4,838 -1.5%
Unemployment** 4.2% 6.0% 8.8% 6.5% 6.6% 2.4% 57.1%
Inflation 3.0% 4.9% 0.4% 1.5% 4.5% 1.5% 52.0%
GDP (in $ billions) 108.0$ 111.2$ 109.8$ 115.8$ 117.8$ 9.8$ 9.1%
2007 2008 2009 2010 2011 5-Yr Change % Change
Population 589,304 598,541 617,334 608,660 620,778 31,474 5.3%
Unemployment 3.5% 4.2% 8.0% 8.4% 7.5% 4.0% 114.3%
Inflation 3.9% 4.2% 0.6% 0.3% 2.7% -1.2% -31.0%
GDP (in $ billions) 220.7$ 227.8$ 225.4$ 231.2$ 239.7$ 19.0$ 8.6%
Note: Population and unemployment rate data account for city areas only; inflation data account for metropolitan areas per the BLS;
GDP data account for metropolitan statistical areas per the BEA. Unemployment rates are based on CPI data with base period
1982-84=100 and are not seasonally adjusted. Source: United States Census Bureau; United States Department of Labor, Bureau
of Labor Statistics; United States Department of Commerce, Bureau of Economic Analysis.
*Midwest urban data used for Columbus CPI, since Columbus Metropolitan Statistical Area is not available.
**Source: City of Pittsburgh, Comprehensive Annual Financial Report FY2007-FY2011.
Seattle
Pittsburgh
Phoenix
Philadelphia
New York City
Los Angeles