Indicators for monitoring and evaluation of the Kala-azar ... · 1 Indicators for monitoring and...
40
Indicators for monitoring and evaluation of the kala-azar elimination programme August 2010 Bangladesh, India and Nepal
Transcript of Indicators for monitoring and evaluation of the Kala-azar ... · 1 Indicators for monitoring and...

Indicators for monitoring and evaluation of
the kala-azar elimination programme
August 2010
Bangladesh, India and Nepal

WHO Library Cataloguing-in-Publication Data
Indicators for monitoring and evaluation of the kala-azar elimination programme.
1.Leishmaniasis, Visceral - prevention and control. 2.Program evaluation - meth-ods. 3.Indicators. 4.Mosquito control. 5.Bangladesh. 6.India. 7.Nepal. I.World Health Organization. Regional Office for South-East Asia. II.UNICEF/UNDP/World Bank/WHO Special Programme for Research and Training in Tropical Diseases.
ISBN 978 92 4 150037 1 (NLM classification: WC 715)
Copyright © World Health Organization on behalf of the Special Programme for Research and Training in Tropical Diseases 2010
All rights reserved.
The use of content from this health information product for all non-commercial education, training and information purposes is encouraged, including transla-tion, quotation and reproduction, in any medium, but the content must not be changed and full acknowledgement of the source must be clearly stated. A copy of any resulting product with such content should be sent to TDR, World Health Organization, Avenue Appia, 1211 Geneva 27, Switzerland. TDR is a World Health Organization (WHO) executed UNICEF/UNDP/World Bank/World Health Organiza-tion Special Programme for Research and Training in Tropical Diseases.
This information product is not for sale. The use of any information or content what-soever from it for publicity or advertising, or for any commercial or income-generat-ing purpose, is strictly prohibited. No elements of this information product, in part or in whole, may be used to promote any specific individual, entity or product, in any manner whatsoever.
The designations employed and the presentation of material in this health informa-tion product, including maps and other illustrative materials, do not imply the ex-pression of any opinion whatsoever on the part of WHO, including TDR, the authors or any parties cooperating in the production, concerning the legal status of any country, territory, city or area, or of its authorities, or concerning the delineation of frontiers and borders.
Mention or depiction of any specific product or commercial enterprise does not imply endorsement or recommendation by WHO, including TDR, the authors or any parties cooperating in the production, in preference to others of a similar nature not mentioned or depicted.
The views expressed in this health information product are those of the authors and do not necessarily reflect those of WHO, including TDR. WHO, including TDR, and the authors of this health information product make no warranties or representa-tions regarding the content, presentation, appearance, completeness or accuracy in any medium and shall not be held liable for any damages whatsoever as a result of its use or application. WHO, including TDR, reserves the right to make updates and changes without notice and accepts no liability for any errors or omissions in this regard. Any alteration to the original content brought about by display or ac-cess through different
media is not the responsibility of WHO, including TDR, or the authors. WHO, includ-ing TDR, and the authors accept no responsibility whatsoever for any inaccurate advice or information that is provided by sources reached via linkages or references to this health information product.
Web version only.

1
Indicators for monitoring and evaluation of the kala-azar elimination programme Kala-azar elimination in Bangladesh, India and Nepal August 2010

2
Contents Abbreviations 3 Introduction 4 PART 1. CASE DETECTION AND MANAGEMENT 5 1.1 Case definitions 5
1.1.1 Case definition of kala-azar (KA) 5 1.1.2 Treatment outcomes in KA 6 1.1.3 Case definition of post kala-azar dermal leishmaniasis (PKDL) 5 1.1.4 Treatment outcomes in PKDL 6
1.2 Definitions of KA case-detection activities 7 1.3 Key indicators for the KA elimination initiative 8 1.4 Monitoring clinical outcomes 9 1.5 Pharmacovigilance 9 1.6 Framework of indicators for monitoring and evaluation (M&E) of the KA elimination initiative 13 PART 2. VECTOR MANAGEMENT 19 2.1 Definitions and sources of information 19
2.1.1 Definitions 19 2.1.2 Sources of information 19 2.2 Key indicators for vector management 19 2.3 Framework of indicators for vector management 20
Acknowledgements 26 Bibliography 27 Glossary 28 Appendix 1: Pictorial for PKDL screening (macular and popular forms) 31 Appendix 2: M&E tool kit for vector control 32

3
Abbreviations ACD active case detection ECG electrocardiogram HH household IEC information, education and communication IRS indoor residual spraying ITN insecticide-treated net IVM integrated vector management KA kala-azar LN long-lasting insecticide-treated net M&E monitoring and evaluation OR operational research PCD passive case detection PHC primary health centre PKDL post kala-azar dermal leishmaniasis PP private practitioner RDT rapid diagnostic test rK39 rK39 antigen rK39RDT rK39 antigen-based rapid diagnostic test SAG sodium antimony gluconate SSS slit-skin smear UHC upazila health centre VL visceral leishmaniasis
4
Introduction This document contains the WHO Regional Office for South-East Asia's and The Special Programme for Research and Training in Tropical Diseases' (TDR) recommended indicators for monitoring and evaluation of the kala-azar elimination programme. The document is presented in two parts:
• Part 1 covers case detection and management. • Part 2 covers vector management.
The indicators outlined in this document were developed by representatives from Bangladesh, India and Nepal at a WHO-TDR sponsored workshop on kala-azar held in Dhaka, Bangladesh 8–16 June 2009 and were endorsed by the regional technical advisory committee (RTAG) in Dhaka, Bangladesh 7–10 December 2009. Department of Communicable Diseases WHO Regional Office for South-East Asia World Health House Indraprastha Estate Mahatma Gandhi Marg New Delhi 110 002 India
Special Programme for Research and Training in Tropical Diseases World Health Organization Avenue Appia 20 1211 Geneva 27 Switzerland
We are grateful to The Federal Ministry for Economic Cooperation and Development (BMZ) and The Deutsche Gesellschaft für Technische Zusammenarbeit (GTZ) for their support and cooperation in the production of this document.
5
PART 1. CASE DETECTION AND MANAGEMENT Kala-azar (KA), also known as visceral leishmaniasis (VL), is an infectious disease caused by the Leishmania parasite when it is transmitted by the bite of an infected sandfly. KA is fatal when untreated. There are approximately 500 000 new cases every year worldwide, the majority of which occur in Bihar, India, followed by the border regions of Bangladesh and Nepal. These figures do not reflect the true social impact of this disease because KA has a focal distribution that affects primarily the poorest communities. Although no vaccine is available, important recent advances have made it possible to eliminate KA from the Indian subcontinent. This document provides definitions and indicators that will be useful for those involved in KA elimination. 1.1 Case definitions 1.1.1 Case definition of KA A person from an endemic area with a fever of more than two weeks duration and with splenomegaly should be tested for KA:
• using a standard, quality-assured rapid diagnostic test (RDT) based on the rK39 antigen at the primary health centre (PHC)/upazila health centre (UHC) level
or • by biopsy for parasitology at hospitals with appropriate training.
These are the case definitions presented in the country guidelines of Bangladesh, India and Nepal; the elimination initiative documents use only one case definition for KA (see Box 1).
1.1.2 Treatment outcomes in KA Treatment outcomes in KA have to be assessed twice: (i) at the last day of drug treatment (initial outcome) and (ii) six months after the last drug was taken (final outcome). The KA elimination initiative has trained health workers to distinguish four main outcomes in KA treatment (see Box 2).
Box 1. Case definition of KA A case of KA is defined as: a person from an endemic area with fever of more than two weeks duration and with splenomegaly, who is confirmed by an RDT or a biopsy

6
There are more possible outcomes at each time point. These are listed below. At initial assessment, at the last day of drug treatment
• Initial cure: a full course of drugs has been completed AND the patient has clinically improved. Clinical criteria for cure should be assessed as no fever + regression of enlarged spleen + return of appetite and/or gain in body weight.
• Non-response: signs and symptoms persist or recur. Switch to a second-line drug because of no response to the first-line drug.
• Side-effects related switch: side-effects necessitate a change of treatment. • Death: any death, whether or not related to KA. • Default: the patient does not complete treatment and/or does not present for
assessment after treatment. At final assessment, six months after the last drug taken
• Final cure: an initial cure patient who is symptom-free at six months after the end of treatment.
• Relapse: any reappearance of KA symptoms within a period of six months after the end of treatment.
• Death: any death, whether or not related to KA. • Loss to follow-up: patient does not present for assessment at six months.
1.1.3 Case definition of post kala-azar dermal leishmaniasis (PKDL) Surveillance of PKDL is important since such cases can serve as reservoirs for disease transmission during the interepidemic period. The programme will include the search for PKDL in active case-detection strategies. The reporting of cases of PKDL should be an integral part of the surveillance and monitoring system. It is essential to make special efforts to trace these cases in the community because patients with PKDL have only skin manifestations and therefore often consult only skin specialists. PKDL can be confused with paucibacillary or multibacillary leprosy and the skin lesions may also mimic other skin conditions (see Appendix 1. Pictorial for PKDL screening). Box 3 shows the recommended case definitions for reporting.
Box 2. Treatment outcomes in KA 1. Cure: a patient is considered clinically cured if he/she has completed full
treatment and there are no signs and symptoms of KA 2. Non-response: signs and symptoms persist or recur despite satisfactory
treatment for more than two weeks 3. Relapse: any reappearance of KA signs and symptoms within a period of six
months after the end of treatment 4. Treatment failure: non-response or relapse

7
1.1.4 Treatment outcomes in PKDL Treatment outcomes in PKDL are also clinically assessed at PHC/UHC level and are not so well-standardized. A drastic improvement can mean, for example, at least 80% resolution in the number of macules and/or a decrease in erythema and flattening of lesions. Box 4 gives the suggested definitions.
1.2 Definitions of KA case-detection activities Passive case detection (PCD): patients are detected through regular health service activities in health centres and clinics. Health providers then manage the cases and notify authorities at district level. Active case detection (ACD)/active case search: health-care personnel go to the community and screen the population to find cases of KA. ACD is an essential component of the elimination strategy. Several possible approaches are defined below.
• House-to-house search (or blanket screening): a medical team visits every house
in a community in an endemic area and screens every household member for KA/PKDL.
• Index-case approach (also called snowballing): an index case is defined as a
person who is currently suffering or has suffered from KA or PKDL during the past 12 months. A focused search in which all households in a certain perimeter around an index case are visited and screened for KA/PKDL.
Box 3. Case definitions for PKDKL Probable PKDL: a patient from a KA-endemic area with multiple hypopigmented macules, papules, plaques or nodules, who is RDT positive Confirmed PKDL: a patient from a KA-endemic area with multiple hypopigmented macules, papules, plaques or nodules, who is parasite positive in slit-skin smear (SSS) or biopsy
Box 4. Treatment outcome in PKDL Initial cure: clinical improvement at the end of treatment – defined as a considerable reduction in the number and size of skin lesions Final cure: clinical cure 12 months after the end of treatment – defined as a complete resolution of macules, papules, plaques and nodules

8
• Camp-based approach: a medical camp is organized in a central place in an endemic village and the community is actively encouraged to participate. It is particularly important that patients with fever of more than two weeks duration or with skin lesions after past KA treatment present for a simple medical check-up that screens for KA/PDKL.
• Incentive-based approach: a financial or other incentive/award is provided to
health volunteers or village health workers who detect suspected cases of KA and motivate these cases to report to health facilities where they are then diagnosed with KA/PKDL.
1.3 Key indicators for the KA elimination initiative The target of KA elimination is to reduce KA incidence below 1 per 10 000 persons per year at (sub)district and upazila level by 2015. Box 5 shows three key indicators that each district and subdistrict should monitor closely and compute on an annual basis. The first indicator is the detection rate – tracking all new cases of KA in an area within a given year. Many KA cases are not recorded in the surveillance system and therefore the programme will make efforts to involve the private sector and obtain reports of relevant cases. The second indicator is the treatment completion rate. Without adherence to treatment, patients will not benefit from it but will continue to spread the disease with the risk that the parasites may become resistant to the drugs. The target for treatment completion rate in any district should be above 90%. The third indicator includes vector control for coverage rate by indoor residual spraying (IRS) (see Part 2 on vector management).
Box 5. Key indicators in the KA elimination initiative
Detection rate (%): Number of new cases of KA detected per year in the district, UHC or subdistrict x 100 Total population in the same area Treatment completion rate (%): Number of patients that took a full course of first-line drugs x100 All new KA cases that started treatment in a given period Coverage rate of vector control (%): Number of households protected x100 All households at risk

9
1.4 Monitoring clinical outcomes Monitoring the final clinical outcomes of KA treatment is complex and not retained as a key indicator. It requires an assessment six months after the last day of treatment and few patients return for such a late follow-up visit. Moreover, either the data need to be organized in cohorts, or groups of patients must be recruited in a given time period and patient registers examined at an appropriate time, i.e. AT LEAST six months after the cohort finishes treatment. Such an approach is known as retrospective cohort monitoring and is applied by tuberculosis control programmes. If done correctly, it allows computing of the: • final cure rate (%): Number of patients with final cure x 100 Total number who started treatment • treatment failure rate (%): Total number of non-responses + relapses + KA-related deaths x 100 Total number who started treatment • loss to follow-up rate (%): Number of defaulters + number of losses to follow-up x 100 Total number who started treatment • mortality (%): Number of deaths x 100 Total number who started treatment
In the district programmes it is easier and recommended to keep track of the initial cure rate, computed as a percentage: Number with initial cure x 100 Total number who started treatment 1.5 Pharmacovigilance The purpose of pharmacovigilance is to detect, assess, understand and prevent any adverse effects or other medicine-related problems and to monitor drug unresponsiveness/ resistance. Pharmacovigilance is important to ensure the safety of the medicines used in the treatment of KA. It should be the responsibility of the national programme to ensure pharmacovigilance. This can provide very useful information but requires appropriate protocols and strong supervision to avoid any compromise in quality. Each medicine used in the programme has some side-effects. These may be looked for in the form of signs and symptoms. Laboratory tests can help with early recognition of the occurrence of the side-effects. For example, haemograms, liver and kidney function tests, tests for electrolytes and electrocardiograms (ECGs) are recommended for monitoring a patient but it can be difficult to include such tests in the programme. This information can be complemented by regular reporting of major and minor adverse events.

10
The following measures will help with early recognition of the occurrence of adverse events:
• Monitor patient regularly for signs and symptoms indicative of adverse events of drugs. Any signs and symptoms should be classified as major or minor.
• If possible, perform tests in treatment sites and monitor the results. This can facilitate
timely measures even before any signs appear. • Organize periodic meetings to review reports of major and minor adverse events
submitted from the different levels. This will help guide the programme in recommending the tests necessary to monitor patients that are on treatment.
• Use reporting forms to report any adverse events to higher levels once a month for
review and feedback. For miltefosine, special attention should be given in cases of PREGNANCY and in cases of HIV/KA or tuberculosis/KA coinfection. Table 1 shows the known side-effects of KA drugs that should be monitored. Each reporting form used by national services should also allow unanticipated effects to be recorded. Other drugs (e.g. paromomycin) can be added to the list according to national drug policies and approval by technical advisory committees.

11
Table 1. Known side-effects of KA drugs and how to recognize them Medicine Side-effects Symptoms and clinical
signs Laboratory tests and ECG
Gastrointestinal effects
Abdominal pain, vomiting, diarrhoea
Nephrotoxicity Dehydration, oedema, decreased urine output
Creatinine
Hepatotoxicity Jaundice Bilirubin, liver enzymes
Miltefosine
Any other, unanticipated
Cardiotoxicity Arrhythmia, heart failure ECG Osteomuscular effects
Arthralgia, myalgia
Nephrotoxicity Oedema, decreased urine output
Creatinine
Hepatotoxicity Jaundice Bilirubin, liver enzymes
Sodium antimony gluconate (SAG)
Any other, unanticipated
Drug reaction Fever with chills and rigors
Nephrotoxicity Oedema, decreased urine output
Check renal function, electrolytes, hypokalaemia
Cardiotoxicity Arrhythmias Ototoxicity Hearing loss, vertigo
Amphotericin B
Any other, unanticipated
Based on Table 1, the following checklist is proposed for pharmacovigilance of miltefosine in a district (Table 2). Such a checklist should be part of the patient’s clinical chart and adapted if other drugs are used.

12
Table 2. Checklist for adverse events reported during outpatient miltefosine treatment First visit Second visit Third visit Fourth visit Last visit Adverse events Yes No Yes No Yes No Yes No Yes No
Vomiting
Diarrhoea
Abdominal pain
Rash
Jaundice
Suspected renal failure
Other (add brief notes here)
Hospitalization? If yes, give reason for admission (add brief notes here)

13
1.6 Framework of indicators for monitoring and evaluation (M&E) of the KA elimination initiative This section shows a larger toolbox with indicators that programmes can use to monitor and evaluate KA elimination activities at district (Table 3) and country level (Table 4). They are organized within the input-process-output-outcome framework.
• Input: describes the resources allocated to an activity. • Process: describes the activities and performance within the services.
• Output: measures the direct products (deliverables) of an activity. • Outcome: describes the effect of these activities in terms of behavioural change
and health outcomes (impact). It is not necessary to measure every single cell in this framework table (Table 3). The purpose of district-level monitoring is to improve the quality of KA elimination operations at that level; indicators should therefore be computed and analysed at district level. Country-level monitoring has a similar purpose and indicators should therefore be computed and analysed at country level (Table 4). The overview table suggests a number of relevant indicators, the most important of which are shown in bold. Most indicators are expressed as percentages. Those that show numbers only are intended for trend analysis (i.e. examining their evolution over time).
14
Table 3. Indicators for monitoring KA elimination activities at district level Service delivery area
Input Process Output Outcome Source of data
Passive case detection (PCD)
Number of facilities providing KA and PKDL diagnostic services/number of all facilities Number of providers trained in KA and PKDL diagnosis/total number of providers
Number of KA and PKDL cases registered by PCD
KA detection rate: number of KA cases detected by health facility per 10 000 population in (sub)district or UHC PKDL detection rate: number of PKDL cases detected by health facility per 10 000 population in (sub)district or UHC % KA cases treated/all cases diagnosed by health facility
Monthly reports by PHC/UHC to district level
Active case detection (ACD)
Number of screening teams trained and deployed for ACD/number of screening teams planned
Number of ACD training sessions done/number of training sessions planned Number of screening sessions (camps, index-case search) done/number of screening sessions planned Number of villages screened by any method/planned number of villages for screening
Number of KA cases diagnosed by ACD Number of PKDL cases diagnosed by ACD Coverage: % of target population screened Yield: average number of KA cases detected by ACD/number of all KA cases detected
% KA cases treated/all those confirmed in screening % PKDL cases treated/all those confirmed in screening
Screening register and report

15
Service delivery area
Input Process Output Outcome Source of data
Diagnosis Number of rK39RDT kits supplied to PHC level/number of rK39 RDT kits required for the month
Number of facilities with uninterrupted rK39RDT supply (not a single day of stockout in the past month)/number of all facilities with diagnostic services Number of rK39RDTs done per month Number of PHCs doing rK39RDTs/all PHCs Number of lab technicians trained to use rK39RDTs/number of all lab technicians Number of EQA sessions on rK39RDTs done/number of EQA sessions planned
Number of rK39 positive RDTs/total number of rK39 RDTs per month
Laboratory register at PHC/UHC and monthly report to district level Immediate phone alert to programme manager if there are any stockouts in district Requisition form sent on time.
Treatment 1. Starting treatment
Number of miltefosine or other drug courses supplied to PHC or UHC level/number of drug courses requested Number of pregnancy-test kits supplied to PHC level
Number of facilities without interruption of miltefosine (or other drug) supply (not a single day of stockout in the past month)/number of facilities with KA treatment Number of pregnancy tests done/number of women of childbearing age starting miltefosine treatment
Number of treated KA cases/number of all confirmed KA cases
Patient register Laboratory register

16
Service delivery area
Input
Process
Output
Outcome
Source of data
2. Evaluating treatment results Safety
Number of patients treated per month
Treatment completion rate
Initial outcomes: • initial cure rate (%):
number with initial cure/total number who started treatment
• defaulter rate (%): number of defaulters/total number who started treatment
• case fatality rate (%) Final outcomes (six months) • % final cure • % treatment failure • % serious adverse
events reported by type of drug
Patient register
Social mobilization
Total amount of information, education and communication (IEC) materials – leaflets, posters, videos Number of IEC staff
Number of IEC sessions done/number of sessions planned Amount of IEC materials used/total amount of IEC materials supplied
Coverage: number of population reached with IEC/target population
Behavioural change: acceptance rate of preventive measures (vector control and others)
Behavioural survey

17
Table 4. Indicators for monitoring KA elimination activities at country-level (additional)* Service delivery area
Input Process Output Outcome Source of data
Strategy formulation
Policy and strategy guideline published Advocacy plans available Coordination mechanisms in place
Number of health facilities offering standard KA diagnosis and treatment/number of all facilities % at-high-risk population covered by active case search
% of subdistricts/UHCs/districts reaching elimination target1
Guidelines Meeting reports Monthly and annual reports Community surveys
Epidemiological surveillance
Case definitions made available Teams employed for investigation of any alerts on KA cases in new areas provided by health service, newspapers, politicians Response mechanisms defined
Number of public sector units notifying KA regularly/all units Number of investigations done for KA in previously non-endemic areas
Number of new endemic areas reported
Surveillance reports
* Additional to the district level indicators as they also will be aggregated at the country level
1 To reduce KA incidence below 1 per 10 000 per year in all (sub)districts and UHCs by 2015
18
Service delivery area
Input Process Output Outcome Source of data
Private sector involvement through awareness raising
Sessions training private practitioners (PPs) in standard KA care Incentive mechanisms for PPs
Number of sessions training PPs in standard KA care/number of planned sessions
Number of PPs actively involved/all PPs
Number of PPs notifying KA for trend analysis % KA patients accessing quality care with trained PPs
Health-seeking behaviour studies
Drug and diagnostics supply
Supply mechanisms defined Quality assurance mechanisms in place
% health facilities reporting stock status on monthly basis
% health facilities reporting no shortage in rK39RDTs and miltefosine supply
% target population with access to diagnostics
Stock register and physical verification
Human resources
Number of dedicated staff for programme/number of planned staff
Number of training sessions Number of target areas covered by trained staff
Funds Annual budget allocated Spending rate
M&E Indicator toolbox developed
Annual review meeting Number of WHO Regional Office for South-East Asia independent review missions conducted/number of review missions planned
Response given to M&E information
% subdistricts/upazila/districts reaching elimination target (< 1 cases/10 000 population/year)
Monthly report Annual report Decision-support system
Operational research (OR)
Funds allocated to OR Number of OR studies conducted/number of OR studies planned
Number of OR studies contributing to strategic decisions
WHO Regional Office for South-East Asia/WHO documents

19
PART 2. VECTOR MANAGEMENT 2.1 Definitions and sources of information 2.1.1 Definitions/ acronyms Environmental management for vector control (EVM): the planning, organization, execution and monitoring of activities for the modification and/or manipulation of environmental factors or their interaction with humans with a view to preventing or minimizing vector propagation and reducing human-vector-pathogen contact. Integrated vector management (IVM): a rational decision-making process for the optimal use of resources for vector control. IVM seeks to improve the efficacy, cost-effectiveness, ecological soundness and sustainability of disease vector control. Indoor residual spraying (IRS): application of insecticides by spraying Long-lasting insecticide-treated net (LN): net treated with slow release chemicals 2.1.2 Sources of information2
• WHO Regional Office for South-East Asia documents on IVM. • WHO Pesticides Evaluation Scheme (WHOPES) documents on:
- Guidelines for testing mosquito adulticides - Guidelines for testing LNs - Manual for IRS.
2.2 Key indicators for vector management The use of coverage of vector control operations (mainly IRS and/or LNs) as a key indicator in the elimination strategy is mentioned in Section 1.3 above. However, reduction of vector densities depends not only on the coverage of houses or structures (rooms) but also on the quality of treatment. Quality indicators include:
• performance of spray persons (or dippers, where nets are dipped in slow-release chemicals)
• accuracy of spraying: % of chemical concentration achieved on treated
materials out of the target concentration – filter paper technique for IRS; analysis of net samples for insecticide-treated nets (ITNs).
2 For details see bibliography.
20
2.3 Framework of indicators for vector management The indicators for monitoring vector management at national, district and operational level are presented below (Tables 5–7). National-level information is generally the aggregation of information from the operational level received via district level activities. For this reason, the national (Table 5) and district (Table 6) tables show only those additional indicators that are to be collected for each level. The list of indicators to be used for IRS at the operational (i.e. spraying squad) level is presented in Table 7. These indicators (as well as the check list information presented in Appendix 2) are more detailed as they form the basis for the overall information system and will be aggregated initially at district level and subsequently at national level. The electronic information system will facilitate information flow and the construction of indicators at district and national level.

21
Table 5. Country-level indicators for vector management Service delivery area
Input Process Output Out-come
Source of data
Strategy formulation
Annual national action plan developed Risk stratification of KA-affected areas completed Choice of insecticides completed Documentation on efficacy of insecticide obtained from manufacturer Human resource plans established
M&E Number of endemic districts with plans for vector management & resistance monitoring/number of all endemic districts Number of endemic districts with M&E tool kit/number of all endemic districts Number of endemic districts with risk stratification/number of all endemic districts
Number of endemic districts using M&E tool kit/number of all endemic districts
Number of endemic districts responding to problems identified/number of all endemic districts
M&E reporting system
IRS (see detailed operational M&E tool kit )
Number of endemic districts with annual action plan/number of all endemic districts
Number of endemic districts implementing annual action plan/number of all endemic districts
Number of districts with spraying cycles completed/number of districts with spraying cycles planned Number of districts with M&E tool kit completed/number of districts with spraying cycles Number of districts with household (HH) coverage above 80% in spray areas/number of districts with spraying cycles
M&E reporting system
LN
Number of endemic districts with stratification plan for LN implementation/number of endemic districts
Number of endemic districts with LNs distributed/number of districts with LN plan. Number of districts with LN coverage above 80% in LN areas/number of districts with LN activities
M&E reporting system

22
Table 6. District-level indicators for IRS1 Service delivery area Input Process Output Outcome Source of
data Supplies (guidelines/action plans; insecticides; spraying pumps; IEC materials)*
Availability of guidelines and action plans in subdistricts/number of endemic subdistricts Logistics of insecticide distribution in place? (descriptive) Insecticides in stock/insecticides requested Protective clothing to operational level distributed/protective clothing needed Number of pumps available/number of pumps needed Number of IEC materials distributed/number of IEC materials planned
Number of functional pumps/number of existing pumps
M&E reporting system
Human resources (spraypersons; supervisors; managers)
Number of available spraypersons/number of spraypersons required Number of supervisors needed/number of supervisors planned
Number of training sessions done/number of training sessions planned Number of supervisions conducted/number of supervisions planned
Number of teams with correct performance/total number of spray teams Average concentration of insecticide on wall/target concentration Number of houses sprayed/number of houses targeted (coverage**) g/m2 insecticide compared to expected
Sandfly density (before, one month and six months after IRS)
M&E reporting system

23
value
M&E (use of M&E tool kit; performance monitoring; output/outcome monitoring)
M&E tool kit available in subdistricts/number of endemic subdistricts Bioassay testing in place (descriptive) Bioassays available (contracted out?) Light trapping available (contracted out?) Chemical analysis of filter papers organized? (descriptive)
Number of subdistricts applying M&E tool kit/number of subdistricts with IRS Number of houses sprayed/number of houses targeted (coverage)* Number of bioassays done/number of bioassays planned Number of HHs with light traps done/number of HHs with traps planned
Responses to issues identified by tool kit (descriptive)
Sandfly density (before, one month and six months after IRS)
M&E reporting system
1 For a number of indicators, information will be collected at operational level and then aggregated at district level. * Other supplies are related to "storage facilities for insecticides", "people's satisfaction with IRS", IRS coverage reported in HH surveys as compared to coverage reported by sprayers. ** Coverage can also be expressed as number of HHs sprayed/population.

24
Table 7 Operational indicators to be used at IRS operational level (corresponds to FORM 3.3 in the M&E toolkit; see bibliography) Identity Name of country: ……………… Name of district (state)/PHC/upazila/VDC:…………………………… State/regional code: /___/___/(00 for Bangladesh) Spray year:…………Spray cycle: /____/ (1= 1st
cycle, 2 = 2nd) Date dd /mm/yyyy:……………… Name of responsible officer: …………………
No Component Indicator Construction of indicator A. Information below will be collected before IRS
3301 Functional pumps
available % of functional pumps available
No. functional pumps x 100 = No. all pumps
3302 Insecticides % available quantity Kg or tonnes available x 100 =
Kg or tonnes needed 3303 Spare parts for
pumps
% available spare parts (by type) e.g. nozzle tips, leather cups, washer spring
No. spare parts available x 100 = No. spare parts needed
3304 Personal protective equipment (PPE)
% available of PPE required e.g. caps, goggle masks, overalls, full sleeve shirts and pants, gloves, boots
No. PPE available x 100 = No. PPE needed
3305 Spraying squad % available squads No. squads available x 100 = No. squads needed
3306 Training for spray squads before start of IRS cycle
% training sessions Number of training days
No. sessions done x 100 = No. sessions planned No. training days/session

25
Note: the numerator and denominator values can be noted in the indicator column and the percentage calculated later. Verified by: _____________________ Date: ____________________
B. Information collected after IRS 3307 IRS supervision % IRS villages
supervised No. villages supervised x100 = No. villages sprayed
3308 How many monitoring visits have been made?
% visit for monitoring No. visits made x 100 = No. visits planned
3309 Filter papers analysed for chemical concentration
Number of filter papers sent for analysis
No. papers sent for analysis x100 = No. papers installed
3310 HHs covered by IRS (reported by spraying squads)
% targeted HHs with IRS according to reports
No. HHs sprayed (reported) x 100 = No. HHs targeted
3311 HHs covered by IRS
(according to HH survey)
% targeted HHs with IRS according to HH survey
No. HHs sprayed (HH survey) x 100 = No. HHs targeted
3312 Performance of squads (see Form 4.1)
% squads with overall acceptable quality score
No. squads with quality score x 100 = No. squads observed
3313 Personal protection (see Form 4.1)
% squads with adequate protective clothing
No. squads with protection x100 = No. squads
3314 Information for HHs % HHs that received adequate information
No. HHs informed x100 = No. HH surveyed
3315 HHs satisfied with IRS (per survey)
% satisfied HHs No. HHs satisfied x 100 No. HH surveyed
3316 Insecticide susceptibility
Vector mortality above 70 %
% mortality in exposure test =
3317 Reduction of vector density
Reduction percentage
(No. before) - (No. after) x 100 = No. vectors before
3318 Adequate bio-efficacy
% mortality and knock-down in bioassays >80%
Bioassay mortality and knock-down

26
Acknowledgements This document was prepared under the coordination of Dr SK Bhattacharya, WHO Regional Office for South-East Asia, India; with the active participation of:
• Dr J Alvar, Control of Neglected Tropical Diseases, WHO, Switzerland • Dr B Arana, WHO/TDR, Switzerland • Dr M Banerjee, Epidemiology and Disease Control Division (EDCD), Ministry
of Health, Nepal • Professor Dr M Boelaert, Institute of Tropical Medicine (ITM), Belgium • Mr R Chowdhury, WHO Regional Office for South-East Asia, India • Dr P Das, Indian Council of Medical Research (ICMR), India • Professor A Kroeger, TDR, Switzerland • Mr NP Maheswary, National Institute of Preventive and Social Medicine
(NIPSOM), Bangladesh • Professor G Matlashewski, TDR, Switzerland
• Dr D Mondal, International Centre for Diarrhoeal Disease Research, Bangladesh (ICDDR,B)
• Dr A Shamsuzzaman, CDC, Directorate General of Health Services (DGHS), Bangladesh
• Dr AR Sharif, DGHS, Ministry of Health & Family Welfare, Bangladesh • Dr SN Sharma, National Vector Borne Disease Control Programme
(NVBDCP), India • Dr S Rijal, BP Koirala Institute of Health Sciences (BPKIHS), Nepal • Department of Control of Neglected Tropical Diseases, WHO, Switzerland

27
Bibliography Framework for implementing integrated vector management (IVM) at district level in the South-East Asia Region. A step-by-step approach. SEA-MAL-255. New Delhi, World Health Organization Regional Office for South-East Asia, 2008. Guidelines for testing mosquito adulticides for indoor residual spraying and treatment of mosquito nets. WHO/CDS/NTD/WHOPES/GCDPP/2006.3. Geneva, World Health Organization, 2006. Guidelines on situation analysis for public health pesticide management. WHO/CDS/WHOPES/GCDPP/2005.12. Geneva, World Health Organization, 2005. Manual for indoor residual spraying. Application of residual sprays for vector control, 3rd ed. WHO/CDS/NTD/WHOPES/GCDPP/2007.3. Geneva, World Health Organization, 2005. National guideline and training module for kala-azar elimination in Bangladesh. Ministry of Health and Family Welfare, Dhaka, 2008. National strategic guideline on kala-azar elimination in Nepal. Ministry of Health and Population, Kathmandu, 2009. Training modules:
- Decision-making for the judicious use of insecticides. Facilitator's guide and participants guide. WHO/CDS/WHOPES/2004.9b. Geneva, World Health Organization, 2004.
- Kala-azar elimination in the South-East Asia Region. Training module,
Facilitator Guide. SEA-CD-183. New Delhi, World Health Organization Regional Office for South-East Asia, 2008.
- Kala-azar elimination in the South-East Asian region. Training module. SEA-
CD-182. New Delhi, World Health Organization Regional Office for South-East Asia, 2008.
- Training modules for quality assured VL vector control and L case detection.
WHO Regional Office for South-East Asia, 2009 and 2010 (unpublished)
- Monitoring and evaluation toolkit for indoor residual spraying. WHO Special Programme for Research and Training in Tropical Diseases, WHO Regional Office for South-East Asia, 2010 (unpublished)

28
Glossary Note: all terms refer to KA unless specified otherwise Active case detection (or active case search, sometimes also called active
surveillance): health-care personnel go to the community to and screen the population to find cases of KA. Several methods possible – house-to-house search; index-case based (also called snowballing), camp-based and incentive-based approaches.
Confirmed KA: person from an endemic area with fever of more than two weeks
duration and splenomegaly, who is confirmed by an RDT or a biopsy.
Coverage rate of vector control (%): number of households protected/ all
households at risk. Defaulter: patient who does not present for assessment at end of treatment. Defaulter rate (%): number of defaulters/total number who started treatment. Detection rate (%): number of new cases detected per year in the district, UHC or subdistrict/total population in the same area. Elimination target: to reduce KA incidence below 1 per 10 000 per year in all (sub)districts and UHCs by 2015. External quality assurance (EQA): process by which an independent laboratory certifies the quality of laboratory tests. Final cure: when patient exhibits no signs and symptoms at six months after the last drug was taken. Final cure rate (%): number of patients with final cure/total number who started
treatment. Final cure in PKDL: clinical cure 12 months after end of treatment – defined as complete resolution of macules, papules, plaques and nodules. Final outcome: outcome of treatment six months after the last drug taken. Can be final cure, relapse, loss to follow-up, death. Hotspot for KA: community with at least five cases over the past year. Incentive-based approach: active case detection strategy in which a financial
or other incentive/award is provided to health volunteers or village health workers who take suspected cases of KA to health facilities
Index case: person currently suffering or who has suffered from KA or PKDL During the last 12 months. Used as the starting point for index-case based active search.

29
Index-case approach: active case detection strategy in which all households in a certain perimeter around an index case are visited and screened for KA or PKDL. Initial cure: when a patient has completed the full drug course and has clinically improved, i.e. exhibits no signs and symptoms of KA at last day of treatment. Initial cure in PKDL: clinical improvement at end of treatment – defined as a
considerable reduction in the number and size of skin lesions (e.g. at least 80% resolution of macules and/or decrease in erythema and flattening of lesions).
Initial cure rate (%): number with initial cure/total number who started treatment. Initial outcome: outcome of treatment on last day of drug course. Can be initial cure,
non-response, default, treatment switch because of side-effects, death.
Input: resources allocated to an activity. KA: chronic fatal disease caused by a parasite – Leishmania donovani. Causes fever, splenomegaly, wasting and anaemia. Also known as visceral leishmaniasis (VL). KA death: death related to KA. KA death rate (%): number of KA-related deaths/total number who started treatment. Loss to follow-up: patient who does not present for assessment at six months. Non-response: when, at the assessment at the end of treatment, signs and
symptoms persist or recur despite satisfactory treatment for more than two weeks.
Output: measures what a health programme produces (deliverables) – services, products, etc. Outcome: the effect that programme activities have on a problem. Passive case detection: patients are detected through regular health service
activities in health centres and clinics. Pharmacovigilance: surveillance of side-effects of a drug when used in routine
practice. PKDL, probable: patient from KA-endemic area with multiple hypopigmented
macules, papules, plaques or nodules, who is RDT positive.
30
PKDL, confirmed: patient from KA-endemic area with multiple hypopigmented macules, papules, plaques or nodules, who is parasite positive in SSS or biopsy.
Process: activities of the programme. Relapse: any reappearance of signs and symptoms within a period of six months after the end of treatment. Treatment completion rate (%): number of patients who took a full course of first-line drugs/all new cases who started treatment in a given period. Treatment failure: non-response or relapse cases or death. Treatment failure rate: (numbers non-response + numbers relapse + numbers KA-related deaths)/total number who started treatment. Treatment switch: patient changed from first- to second-line treatment because of non-response or side-effects.

31
Appendix 1. Pictorial for PKDL screening (macular and papular forms)
Pictures kindly provided by S Uranw, A Rijal, J Alvar.

32
Appendix 2. M&E tool kit for vector control Example of checklists taken from the M&E tool kit for the IRS programme at district level (to be applied once per spraying cycle or per year) District: …………………………… Reviewer: …………………………………………….. Date: ……………… DISTRICT LEVEL Yes No Comments Input Guidelines/action plan Guidelines available to all users? Need for update? Annual action plan in place? Insecticides Authorized certificate for chemical quality received from national level?
Insecticide requirements calculated/requested for one cycle?
Insecticide in stock/insecticide requested (kg)?
__/__ __ %
District/upazila storage in place? Protective clothing supplied to operational level? (cap, shirt, pants, rubber shoes, goggles)
Spray pumps Number of functional pumps/number of existing pumps
__/__ __ %
Number of new pumps required Number of and type(s) of spares required
Spraypersons Number of persons available/number of persons needed
__/__ __ %
Last training/retraining date
Is payment timely?
For how many days? days IEC material/communications IEC material developed (poster, leaflet, others)?
Other promotional activities developed?

33
Process Supervision Supervision of spraying activities in subdistrict?
At end of cycle: Number of supervisions conducted/number of supervisions planned
__/__
__ %
Level of supervisors • district heath officers • vector control officers • malaria inspectors • others (specify)
Comments about performance
Logistics of insecticide distribution to operational level in place? (description of limitations)
Output Achievements/coverage Number of HH sprayed/number of HH targeted
__/__ __ %
Bioassays Number of bioassays done Number of bioassays below threshold/total number of bioassays
__/__ __ %
Chemical concentration achieved Number of filter papers analysed Results of chemical analysis (average concentration of insecticide: mg/m2 and standard deviation)
Acceptance of IRS Number of HHs accepting IRS/number of HHs interviewed
Outcome/impact Sandfly density (measured through light traps): number of sandflies/100 houses: • in sprayed houses • in sentinel houses • in control houses
Before spraying After spraying Six months later Annual KA incidence (% reduction or increase)

34
M&E tool kit for the IRS programme at PHC/UHC and operational level (to be applied once per spraying cycle or per year) PHC/UHC: ………………………………… Reviewer: …………………………..………… Date: ……………………………………….. OPERATIONAL LEVEL (PHC, UHC, etc)
Yes No Comments
Input Guidelines/action plan Guidelines available to all users? Need for update? Annual action plan available? Insecticides Insecticide requirements calculated/requested?
Insecticide in stock/insecticide requested (kgs)
__/__ __ %
Insecticide storage in place? Protective clothing supplied to operational level? (cap, shirt, pants, rubber shoes, goggles)
Spray pumps Number of functional pumps/number of existing pumps
__/__ __ %
Number of new pumps required Number of and type(s) of spares required
Spraypersons Number of persons available/number of persons needed
__/__ __ %
Last training/retraining date For how many days? days IEC material/communications IEC material (printed, radio, TV) released or applied?
Other promotional activities developed? Process Supervision Supervision of spraying activities in subdistrict?
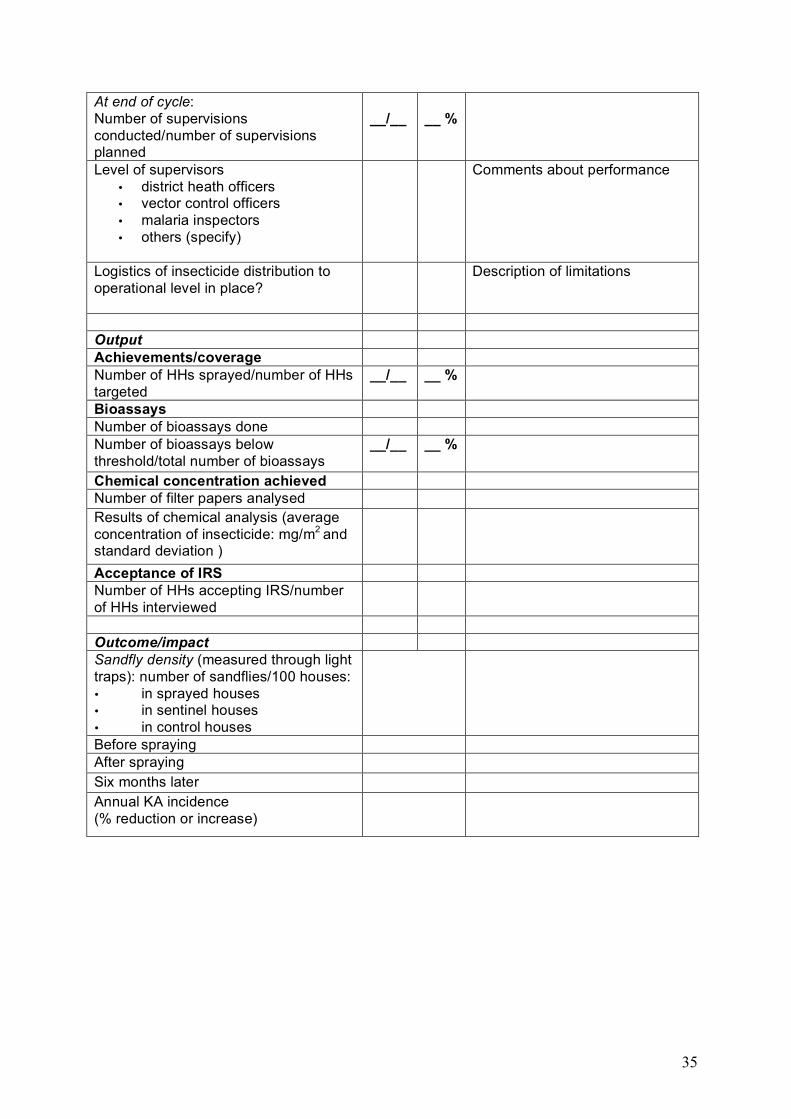
35
At end of cycle: Number of supervisions conducted/number of supervisions planned
__/__
__ %
Level of supervisors • district heath officers • vector control officers • malaria inspectors • others (specify)
Comments about performance
Logistics of insecticide distribution to operational level in place?
Description of limitations
Output Achievements/coverage Number of HHs sprayed/number of HHs targeted
__/__ __ %
Bioassays Number of bioassays done Number of bioassays below threshold/total number of bioassays
__/__ __ %
Chemical concentration achieved Number of filter papers analysed Results of chemical analysis (average concentration of insecticide: mg/m2 and standard deviation )
Acceptance of IRS Number of HHs accepting IRS/number of HHs interviewed
Outcome/impact Sandfly density (measured through light traps): number of sandflies/100 houses: • in sprayed houses • in sentinel houses • in control houses
Before spraying After spraying Six months later Annual KA incidence (% reduction or increase)


DOI 10.2471/TDR.10.978-924-1500371
TDR/World Health Organization20, Avenue Appia1211 Geneva 27Switzerland
Fax: (+41) 22 [email protected]/tdr
The Special Programme for Research and Training in Tropical Diseases (TDR) is a global programme of scientific collaboration established in 1975. Its focus is research into neglected diseases of the poor, with the goal of improving existing approaches and developing new ways to prevent, diagnose, treat and control these diseases. TDR is sponsored by the following organizations:
World Bank
ISBN 978 92 4 150037 1