Indicator 3-2.1 Continuum of Knowledgetoolboxforteachers.s3.amazonaws.com/Standards/math/... ·...
89
Number and Operations Third Grade 1 Standard 3-2: The student will demonstrate through the mathematical processes an understanding of the representation of whole numbers and fractional parts; the addition and subtraction of whole numbers; accurate, efficient, and generalizable methods of multiplying whole numbers; and the relationships among multiplication, division, and related basic facts. Indicator 3-2.1 Compare whole-number quantities through 999,999 by using the terms is less than, is greater than, and is equal to and the symbols <, >, and =. Continuum of Knowledge: In second grade, students compared whole-number quantities through 999 by using the terms is less than, is greater than, and is equal to and symbols <, >, and = (2-2.4). In third grade, students compare whole-number quantities through 999,999 by using the terms is less than, is greater than, and is equal to and the symbols <, >, and = (3-2.1) In fourth grade, students will compare decimals through the hundredths using the terms is less than, is greater than, and is equal to and symbols <, >, and = (4-2.7). Taxonomy Level Cognitive Dimension: Understand Knowledge Dimension: Conceptual Key Concepts • Digit • Ten thousands • Hundred thousands • Compare • Is greater than • Is less than • Is equal to • Place value • < Math Notation/Symbols • > • =
Transcript of Indicator 3-2.1 Continuum of Knowledgetoolboxforteachers.s3.amazonaws.com/Standards/math/... ·...

Number and Operations Third Grade
1
Standard 3-2: The student will demonstrate through the mathematical processes an understanding of the representation of whole numbers and fractional parts; the addition and subtraction of whole numbers; accurate, efficient, and generalizable methods of multiplying whole numbers; and the relationships among multiplication, division, and related basic facts.
Indicator 3-2.1
Compare whole-number quantities through 999,999 by using the terms is less than, is greater than, and is equal to and the symbols <, >, and =. Continuum of Knowledge:
In second grade, students compared whole-number quantities through 999 by using the terms is less than, is greater than, and is equal to and symbols <, >, and = (2-2.4).
In third grade, students compare whole-number quantities through 999,999 by using the terms is less than, is greater than, and is equal to and the symbols <, >, and = (3-2.1)
In fourth grade, students will compare decimals through the hundredths using the terms is less than, is greater than, and is equal to and symbols <, >, and = (4-2.7).
Taxonomy Level
Cognitive Dimension: Understand Knowledge Dimension: Conceptual
Key Concepts
• Digit • Ten thousands • Hundred thousands • Compare • Is greater than • Is less than • Is equal to • Place value
• <
Math Notation/Symbols
• > • =

Number and Operations Third Grade
2
Instructional Guidelines
For this indicator, it is essential
• Recognize the place value of digits through 999,999
for students to:
• Understand the magnitude of digits • Compare the place value of digits through 999,999 • Recognize mathematical symbols <, >, and = and their meanings • Read whole numbers using appropriate terminology • Compare numbers that do not have the same number of digits •
For this indicator, it is not essential
• Represent these quantities with concrete materials
for students to:
Student Misconceptions/Errors
• It is difficult for students to conceptual such large numbers. Using real world illustrations of these quantities give them meaning and a lasting point of reference.
• To deepen student’s conceptual understanding of comparison, let students create inequalities or equivalent relationships. For example, each student rolls their die four times and records the digit they rolled. Student A creates a four digit number and records it then the teacher tell Student B to create either a number that is less than or greater than that number. Student should record their four digit numbers and the appropriate relationship. Switch roles and continue to play for at least five rounds. So if student A creates 3213 and student B creates 5361 then they should write on their paper 5361 > 3213.
• Another misconception is for students to begin in the ones place to compare numbers. A student may state that 113,975 < 103,459 because 9 > 5.
Assessment Guidelines
The objective of this indicator is to compare which is in the “understand conceptual” knowledge cell of the Revised Taxonomy. To understand is to construct meaning therefore, students should are not just learning procedural strategies for comparing numbers but they are also building number sense. The learning progression to compare requires students to compare the place value of digits through 999,999, compare the place value of digits through 999,999, recognize mathematical symbols <, >, and = and their meanings. Students analyze place value patterns (3-1.4), construct arguments (3-1.2) and exchange mathematical ideas with classmates about which symbol is appropriate. Students use
correct, complete and clearly written and oral language communicate these ideas.

Number and Operations Third Grade
3
Standard 3-2: The student will demonstrate through the mathematical processes an understanding of the representation of whole numbers and fractional parts; the addition and subtraction of whole numbers; accurate, efficient, and generalizable methods of multiplying whole numbers; and the relationships among multiplication, division, and related basic facts. Indicator 3-2.2
Represent in word form whole numbers through nine hundred ninety-nine thousand.
Continuum of Knowledge:
In kindergarten, students translate between numeral and quantity through 31 (K-2.2). In first grade, students represent quantities in word form through ten (1-2.3). In second grade, students represent quantities in word form through twenty (2-2.2).
In third grade, students will represent in word form whole numbers through nine hundred ninety-nine thousand. (3-2.2)
In fourth grade, students recognize the period in the place-value structure of whole numbers: units, thousands, millions and billions (4-2.1) and analyze the magnitude of digits through hundredths on the basis of their place value (4-2.6). They also compare decimals through hundredths by using the terms is less than, is greater than, and is equal to and the symbols <, > and = (4-2.7)
Taxonomy Level
Cognitive Dimension: Understand Knowledge Dimension: Factual knowledge
Key Concepts
• Place value • Hundreds • Hundred thousand
Instructional Guidelines
For this indicator, it is essential
• Connect the word form to the numeral
for students to:
• Translate between and among words, quantities and numeral • Understand place value

Number and Operations Third Grade
4
• Write numbers in expanded form • Correctly read word representations of numbers
For this indicator, it is not essential
None noted
for students to:
Student Misconceptions/Errors
• When writing large numbers, it is important to note that a common student misconception is that two thousand five is written as 20005. This can be avoided by writing numbers within a labeled grid. The student will immediately observe that there is not the physical space to record the number when beginning with the thousands place.
• Students sometime to forget to use a zero to represent the value of a place that is not named in word names. For example, a student would write 23,46 for twenty-three thousand forty-six, omitting the zero for the hundreds place.
• Another common mistake is to say “and” where commas occur in a number.
Instructional Resources and Strategies
For assessment purposes, students should be able to translate words to numbers and numbers to words.
Although not essential, using concrete representations at this stage will help students continue to build connecting between the word, number and quantity; thereby, deepen their number sense about the magnitude of numbers.
Assessment Guidelines
The objective of this indicator is to represent which is in the “understand factual” knowledge cell of the Revised Taxonomy. Although this indicator requires student to represent a finite set of number, this is not a simple memorization task because to understand means to construct meaning. The learning progression to represent requires students to understand the place value system for whole numbers. Students write numbers in expanded form and use multiple informal representations (3-1.7) such concrete models and pictorial models to bridge the gap between whole number and word. Students examine the word, whole number and representation simultaneously and analyze the relationship among the word, the numeral and the representation to construct a deeper understanding. Students use this understanding to represent quantities as words and vice-versa. Students explain and justify their answers on the basis of mathematical properties, structures and relationships (3-1.3).

Number and Operations Third Grade
5
Standard 3-2: The student will demonstrate through the mathematical processes an understanding of the representation of whole numbers and fractional parts; the addition and subtraction of whole numbers; accurate, efficient, and generalizable methods of multiplying whole numbers; and the relationships among multiplication, division, and related basic facts Indicator 3-2.3
Apply an algorithm to add and subtract whole numbers fluently.
Continuum of Knowledge:
In second grade, students generated strategies to add and subtract pairs of two-digit whole numbers with regrouping (2-2.7) and generated addition and subtraction strategies to find missing addends and subtrahends in number combination through 20 (2-2.8).
In third grade, students apply an algorithm to add and subtract whole numbers fluently. They also analyze the effect that adding, subtracting or multiplying odd and/or even numbers has on the outcome (3-2.9).
In fourth grade, students will apply an algorithm to multiply whole numbers fluently (4-2.3) and generate strategies to divide whole numbers by single-digit divisors (4-2.5)
Taxonomy Level
Cognitive Dimension: Apply Knowledge Dimension: Procedural
Key Concepts
• Addend • Sum • Difference • Estimate • Trade • Regroup • Rounding
Instructional Guidelines
For this indicator, it is essential
• Understand place value
for students to:
Number and Operations Third Grade
6
• Connect concrete and pictorial models from second grade with symbolic (number only) strategies
• Understand the process of regrouping • Add and subtract number with and without regrouping • Using rounding strategies to estimate their answers • Use an appropriate strategy to verify their answers
For this indicator, it is not essential
None noted
for students to:
Student Misconceptions/Errors
None noted
Instructional Resources and Strategies
• The focus is for students to apply an algorithms in order to gain computational fluency; therefore, students should select a strategy and engage in repeated practice.
• Have students estimate answer before computing the answer and after
• Students may use the properties related to odd + odd, even + even, odd + even, etc… to analyze their answers
• Story problems may be used to observe the student’s generated strategies for adding and subtracting whole numbers before beginning direct instruction
Assessment Guidelines
The focus of the indicator is for students apply which is in the “apply procedural” knowledge cell of the Revised Taxonomy. Although, the focus of the indicator is procedural, the learning progression should integrate strategies that encourage students to balance procedural knowledge with their conceptual knowledge. The learning progression to apply requires student to recall and understand their generated strategy for addition and subtraction. Student should use estimation strategies prior to applying their chosen strategy. Students use their understanding of place value and regrouping to find sum and difference. They should use correct, complete and clearly spoken or written language (3-1.5) to explain and justify
their answers to their classmates and teacher on the basis of properties and relationships (3-1.3).
Number and Operations Third Grade
7
Standard 3-2: The student will demonstrate through the mathematical processes an understanding of the representation of whole numbers and fractional parts; the addition and subtraction of whole numbers; accurate, efficient, and generalizable methods of multiplying whole numbers; and the relationships among multiplication, division, and related basic facts.
Indicator 3-2.4
Apply procedures to round any whole number to the nearest 10, 100, or 1,000.
Continuum of Knowledge:
In second grade, students generated strategies to round numbers through 90 to the nearest 10 (2-2.9) and analyzed the magnitude of digits through 9,999 on the basis of their place values (2-2.10)
In third grade, students apply procedures to round any whole number to the nearest 10, 100, or 1,000 (3-2.4) In fourth grade, students will use these rounding strategies to estimate answers to whole number multiplication. Taxonomy Level
Cognitive Dimension: Apply Knowledge Dimension: Procedural
Key Concepts
• Round • Tens • Hundreds • Thousands • Place value
Instructional Guidelines
For this indicator, it is essential
• Locate the specified place value
for students to:
• Round any whole number to the nearest ten, hundred or thousand

Number and Operations Third Grade
8
• Understand that rounding is not replacing the value but just substituting it with a nice numbers that can be used more easily during computation or problem solving
• Determine between which to numbers the value is located
For this indicator, it is not essential
• Round to the nearest 10,000 or 100,000. Although students have compared and written numbers 999,999, they do not need to explore rounding to those place values.
for students to:
Student Misconceptions/Errors
Students often misapply rules for rounding because they lack a conceptual understanding related to why they should round up or round down. Rules should be accompanied by concept building activities that allow students to explore and discovery these rules.
Instructional Resources and Strategies
• A number line can be used to help students understand the relationships between numbers.
• Give each student a set of number cards - 0-9. Then, write on the board something for them to show you by selecting and arranging these cards on their desk. Ask things like, "Fill in 7_ with a number that will make the 7 round up." Or, "Round 6,349 to the hundreds place....to the tens place...to the thousands place."
• Have a group of preprinted numbers to give to the students. Have another set of numbers to place around the room that would be what the numbers are rounded to. If I wanted them to round to the nearest hundred I would have 100, 200, 300, 400, 500, 600, 700, 800, 900 and 1000 placed around the room. They would take their numbers and put them in the right spot. #467 would go to 500 spot.
You could also have a blank BINGO board and let them fill in a list of numbers randomly and then you could call out 300 and if they had a number that would be rounded to 300 they would cover that spot. Doesn't require movement, but it's another approach.
• We always underlined the number to be rounded and circle the number next to it. Then we ask does it round up to stay the same. Using a balloon, grip it with all five fingers. Release one finger at a time, then ask does the balloon go up with 1 finger, the reply is no it stays the same. This continues until you

Number and Operations Third Grade
9
release the fifth finger. Then the balloon goes up. Therefore 0-4 stays the same, then 5-9 rounds up.
Assessment Guidelines
The objective of this indicator is to apply which is in the “apply procedural” knowledge cell of the Revised Taxonomy. Although the focus of indicator is to apply, the learning progression should include experiences that balance conceptual and procedural knowledge in order to support retention. The learning progression to apply requires students to locate the specified place value. Students use an appropriate rounding strategy to find the answer. Students generalize the connection (3-1.6) between the rounded value and the actual number. Students use correct, complete and clearly written and oral language (3-1.5) to explain and justify
their answers on the basis of mathematical relationships (3-1.3) such as determining two numbers that the value is between.
Number and Operations Third Grade
10
Standard 3-2: The student will demonstrate through the mathematical processes an understanding of the representation of whole numbers and fractional parts; the addition and subtraction of whole numbers; accurate, efficient, and generalizable methods of multiplying whole numbers; and the relationships among multiplication, division, and related basic facts. Indicator 3-2.5
Understand fractions as parts of a whole
Continuum of Knowledge:
Third grade is the first time students are expected to develop an understanding of the meanings and uses of fractions. Students understand fractions as parts of a whole (3-2.5) and represent fractions that are greater than or equal to 1 (3-2.6).
In fourth grade, students apply strategies and procedures to find equivalent forms of fractions (4-2.8), compare the relative size of fraction to the benchmarks 0, ½ and 1 (4-2.9) and identify common fraction/decimal equivalents (4-2.10). Students also represent improper fraction, mixed numbers and decimals (4-2.11).
Taxonomy Level
Cognitive Dimension: Understand Knowledge Dimension: Conceptual
Key Concepts
• Fraction • Numerator • Denominator • Equal parts • Part • Whole
Instructional Guidelines
For this indicator, it is essential
• Understand that the denominator (bottom number) of the fraction tells into how many pieces the item has been cut/divided
for students to:
• Understand that the numerator (top number) tells how many of those pieces you have.
• Understand that a whole can be a set of items such as 5 people or 8 marbles

Number and Operations Third Grade
11
• Understand the distinction between fraction of a set, fraction of a region (area model) and fractions on a number line (linear model)
For this indicator, it is not essential
• Convert fractions to improper form or mixed number form
for students to:
• State that a fraction is the same as the operation of division. For example, ½ is the same as 1 divided by 2.
Student Misconceptions/Errors
Students may believe that when dividing into parting that the parts do not have to be equal i.e. that parts should have equal area. However, when dividing a set of objects like toys or pattern blocks, equal division depends on the number of items in the set, not the area of each item. When working with linear models, equal division depends on the distance from one point to another. Students need experiences with all three forms.
Instructional Resources and Strategies
• Using only geometric representations such as circle and rectangles limit the student’s ability to develop a deep conceptual understanding; therefore, students should be given sufficient experiences with a variety of concrete and pictorial models.
• Students should work with a single item (concrete and pictorial) that can be cut/divided into smaller, equal parts. This includes drawing, coloring, using tiles, number lines, etc. to show the part/ whole relationship. The emphasis is on the relationship of the part to the whole. Therefore, identifying the whole before cutting/dividing and then having an identical whole for comparison once discussion begins is critical. The notion of fractional parts being equal size portions/pieces needs to be stressed.
Assessment Guidelines
The objective of this indicator is to understand which is in the “understand conceptual” knowledge cell of the Revised Taxonomy. To understand means to construct meaning; therefore, students construct the meaning of the concept of fractions through a variety of learning experiences. The learning progression to understand requires students to identify the numerator and denominator of a fraction and explain what each means in the context of a variety of examples. Students then explore the part-whole relationship in the form pictorial, concrete materials, fraction of a set, fraction of a region (area model) and fractions on a

Number and Operations Third Grade
12
number line (linear model). Students analyze information (3-1.1) to construct arguments about part-whole relationships (3-1.2) and generalize connections (3-1.6) between the various forms (set, region and number line). Student use correct, complete and clearly written and oral language to communicate
their ideas to their classmates and their teacher (3-1.5).

Number and Operations Third Grade
13
Standard 3-2: The student will demonstrate through the mathematical processes an understanding of the representation of whole numbers and fractional parts; the addition and subtraction of whole numbers; accurate, efficient, and generalizable methods of multiplying whole numbers; and the relationships among multiplication, division, and related basic facts Indicator 3-2.6
Represent fractions that are greater than or equal to 1.
Continuum of Knowledge:
Third grade is the first time students are expected to develop an understanding of the meanings and uses of fractions. Students understand fractions as parts of a whole (3-2.5) and represent fractions that are greater than or equal to 1 (3-2.6).
In fourth grade, students apply strategies and procedures to find equivalent forms of fractions (4-2.8), compare the relative size of fraction to the benchmarks 0, ½ and 1 (4-2.9) and identify common fraction/decimal equivalents (4-2.10). Students also represent improper fraction, mixed numbers and decimals (4-2.11).
Taxonomy Level
Cognitive Dimension: Understand Knowledge Dimension: Conceptual
Key Concepts
• Fraction • Numerator • Denominator • Equal parts • Part • Whole
Instructional Guidelines
For this indicator, it is essential
• Understand that the denominator (bottom number) of the fraction tells into how many pieces the item has been cut/divided
for students to:
• Understand that the numerator (top number) tells how many of those pieces you have.
• Recognize a fraction as being greater than one based on the a) numerator vs denominator and b) mixed + fractional part
• Understand that a whole can be a set of items such as 5 people or 8 marbles
Number and Operations Third Grade
14
• Understand the distinction between fraction of a set, fraction of a region (area model) and fractions on a number line (linear model)
For this indicator, it is not essential
• Convert fraction from improper form to mixed fraction form
for students to:
Student Misconceptions/Errors
None noted
Instructional Resources and Strategies
Given a concrete or pictorial representation of a fraction, have students express the fraction greater than one as a mixed fraction and as an improper fraction based on the set up of the representation. Students do not need to convert between forms. They only need to understand that they can describe the fraction using both forms.
For example, if the representation is given as one whole and one-half then student should write 1 ½ but if both representations are divided into halves student should write 3/2.
Assessment Guidelines
The objective of this indicator is represent which is in the “understand conceptual” knowledge cell of the Revised Taxonomy. To understand means to construct meaning; therefore, students build conceptual understand through discovery. The learning progression to represent requires students to recall the meaning of the numerator and denominator of a fraction and explain what each means in the context of a variety of examples. Students identify the whole and/or fractional part component of each representation. Students understand how to count in fractional increments such as ¼, 2/4, ¾, 4/4. Students then explore the fractions in pictorial form, concrete materials, fraction of a set, fraction of a region (area model) and fractions on a number line (linear model). Students analyze information (3-1.1) to construct arguments (3-1.2) about what are the characteristics of fractions that are greater than one and generalize connections (3-1.6) between the various forms (set, region and number line). Student use correct, complete and clearly written and oral language to communicate
their ideas to their classmates and their teacher (3-1.5).

Number and Operations Third Grade
15
Standard 3-2: The student will demonstrate through the mathematical processes an understanding of the representation of whole numbers and fractional parts; the addition and subtraction of whole numbers; accurate, efficient, and generalizable methods of multiplying whole numbers; and the relationships among multiplication, division, and related basic facts. Indicator 3-2.7
Recall basic multiplication facts through 12 x 12 and the corresponding division facts. Continuum of Knowledge:
In second grade, students interpreted models of equal grouping (multiplication) as repeated addition and arrays as well as interpreting models of sharing equally (division) in as repeated subtraction and arrays.
In third grade, students recall basic multiplication facts through 12 x 12 and the corresponding division facts (3-2.7) and compare the inverse relationship between multiplication and division (3-2.8). Students also generate strategies to multiply whole numbers by suing one single-digit factor and one multidigit factor (3-2.10)
In fourth grade, students apply an algorithm to multiply whole numbers fluently (4-2.3), explain the effect on the product when one of the factors is changed (4-2.4) and generate strategies to divide whole numbers by single-digit divisors (4-2.5).
Taxonomy Level
Cognitive Dimension: Remember Knowledge Dimension: Factual
Key Concepts
• Factors • Product • quotient • divisor • dividend
Instructional Guidelines
For this indicator, it is essential
• Understand that multiplication is repeated addition
for students to:
• Understand that division is repeated subtraction

Number and Operations Third Grade
16
• Use the concept of the commutative property to understand multiplication facts
• Understand the relationship between multiplication and division
For this indicator, it is not essential
None noted
for students to:
Student Misconceptions/Errors
None noted
Instructional Resources and Strategies
Some students may need additional time to fully retain these facts; therefore, instruction should incorporate periodic review. Although the focus is to recall, activities that build conceptual knowledge through the use concrete and/or pictorial models will support retention.
Assessment Guidelines
The objective of this indicator is to recall which is in the “remember factual” knowledge cell of the Revised Taxonomy. Although the focus of the indicator is to recall factual knowledge, learning experience should integrate both memorization and concept building strategies to support retention. The learning progression to recall requires student to recall that equal grouping (multiplication) is repeated addition and arrays and that sharing equally (division) is repeated subtraction and arrays. Students explore multiplication and division problems in context then analyze information (3-1.1) to generate mathematical statements (3-1.4) related to multiplication and division facts. They should use correct, complete and clearly written and oral language (3-1.5) to communicate their understanding. Students use their understanding the meaning of the terms divisor, factors, product, quotient and dividend to develop multiplication and division facts and develop
strategies to help them remember and retain these facts.

Number and Operations Third Grade
17
Standard 3-2: The student will demonstrate through the mathematical processes an understanding of the representation of whole numbers and fractional parts; the addition and subtraction of whole numbers; accurate, efficient, and generalizable methods of multiplying whole numbers; and the relationships among multiplication, division, and related basic facts. Indicator 3-2.8
Compare the inverse relationship between multiplication and division.
Continuum of Knowledge:
In second grade, students interpreted models of equal grouping (multiplication) as repeated addition and arrays as well as interpreting models of sharing equally (division) in as repeated subtraction and arrays.
In third grade, students compare the inverse relationship between multiplication and division (3-2.8) and recall basic multiplication facts through 12 x 12 and the corresponding division facts (3-2.7). Students also generate strategies to multiply whole numbers by suing one single-digit factor and one multidigit factor (3-2.10)
In fourth grade, students apply an algorithm to multiply whole numbers fluently (4-2.3), explain the effect on the product when one of the factors is changed (4-2.4) and generate strategies to divide whole numbers by single-digit divisors (4-2.5).
Taxonomy Level
Cognitive Dimension: Understand Knowledge Dimension: Conceptual
Key Concepts
Inverse
Instructional Guidelines
For this indicator, it is essential
• Apply basic multiplication and division facts
for students to:
• Use concrete representations of multiplication and division facts to build conceptual understanding of the inverse relationship
• Understand that multiplication can be used to check division problems and division can be used to check multiplication

Number and Operations Third Grade
18
For this indicator, it is not essential
None noted
for students to:
Student Misconceptions/Errors
Students have explored inverse relationships in 2nd
Instructional Resources and Strategies
grade with addition and subtraction. They may confuse those operations with the inverse relationship between multiplication and division.
The emphasis of the indicator is to build conceptual understanding of inverse relationships beyond knowing the multiplication and division are opposites. Students explore the inverse relationships using concrete models and reinforce that understanding by representing those relationships symbolically (numbers only).
Assessment Guidelines
The objective of this indicator is to compare which is in the “understand conceptual” knowledge cell of the Revised Taxonomy. To compare means to determine relationship between two ideas. The learning progression to compare requires students to understand the meaning of multiplication and division. Students explore concrete representations and analyze information (3-1.1) to construct arguments (3-1.2) about the relationship between multiplication and division. As students explore these relationships, they explain and justify their answers (3-1.3) to their classmates and their teachers. As students make comparisons, they use
correct, complete and clearly written and oral language to communicate their understanding of this relationship (3-1.5).

Number and Operations Third Grade
19
Standard 3-2: The student will demonstrate through the mathematical processes an understanding of the representation of whole numbers and fractional parts; the addition and subtraction of whole numbers; accurate, efficient, and generalizable methods of multiplying whole numbers; and the relationships among multiplication, division, and related basic facts.
Indicator 3-2.9
Analyze the effect that adding, subtracting, or multiplying odd and/or even numbers has on the outcome
Continuum of Knowledge
In second grade, students explore even and odd numbers through patterns as they analyzed numeric patterns in skip counting that uses the numerals 1 through 10 (2-3.1)
In third grade, students analyze the effect that adding, subtracting, or multiplying odd and/or even numbers has on the outcome (3-2.9) Students use these effects explore operations with whole numbers. Taxonomy Level
Cognitive Dimension: Analyze Knowledge Dimension: Conceptual
Key Concepts
• Odd • Even
Instructional Guidelines
For this indicator, it is essential
• Understand the characteristics of even numbers
for students to:
• Understand the characteristics of odd numbers

Number and Operations Third Grade
20
• Explore the following odd-even relationships
even + even = even even – even = even even even = even
odd + odd = even odd – odd = even odd odd = odd
even + odd = odd even – odd = odd even odd = even
odd +even = odd odd – even = oddd odd even = even
For this indicator, it is not essential
• Recite the odd-even relationships
for students to:
Student Misconceptions/Errors
Students may be confused when exploring these even-odd relationships; therefore, students should be give sufficient opportunities to explore these relationships over time.
Instructional Resources and Strategies
These relationships can be revisited throughout the year by asking students questions about these relationships when performing operations (multiplication, subtraction and additions). Ask question such as “Is this number even or odd? Can these two numbers result in an even (odd) answer? Does this answer make sense?”
Assessment Guidelines
The objective of the indicator is to analyze which is in the “analyze conceptual” knowledge cell of the Revised Taxonomy. To analyze means to determine relevant features and relationships. The learning progression to analyze requires students to recall the characteristics of even and odd numbers. Students explore even-odd relationships by examining these relationships in contexts. They analyze information (3-1.1) from these explorations, generalize connections (3-1.6) between even and odd numbers then explain and justify their answers (3-1.3) to their classmates and their teachers. They use correct, complete and clearly written and oral language to communicate their ideas (3-1.5) and generate mathematical statements (3-1.4) about these even-odd relationships.

Number and Operations Third Grade
21
Standard 3-2: The student will demonstrate through the mathematical processes an understanding of the representation of whole numbers and fractional parts; the addition and subtraction of whole numbers; accurate, efficient, and generalizable methods of multiplying whole numbers; and the relationships among multiplication, division, and related basic facts. Indicator 3-2.10
Generate strategies to multiply whole numbers by using one single-digit factor and one multi-digit factor Continuum of Knowledge
In second grade, students interpret models of equal grouping (multiplication) as repeated addition and array (2-2.5).
In third grade, students generate strategies to multiply whole numbers by using one single-digit factor and one multi-digit factor (3-2.10). Student use basic number combinations to compute related multiplication problems that involve multiples of ten (3-2.11). In fourth grade, students apply an algorithm to multiply whole numbers fluently (4- 2.3) and explain the effect on the product when one of the factors is changed (4-2.4). Taxonomy Level
Cognitive Dimension: Create Knowledge Dimension: Conceptual
Key Concepts
• Factor • multiple • product
Instructional Guidelines
For this indicator, it is essential
• develop their own strategies
for students to:
• understand place value • compose and decompose numbers • use concrete and pictorial models to generate strategies

Number and Operations Third Grade
22
For this indicator, it is not essential
• Gain computational fluency
for students to:
• Generate these strategies without concrete or pictorial models • Use multi-digits beyond four digits
Student Misconceptions/Errors
Although students have decomposed numbers (tens and ones) they may not connect this idea and will believe that they can only find the answer using repeated addition.
Instructional Resources and Strategies
The focus is for students to build conceptual knowledge of operations by generating their own strategies; therefore, the emphasis in not on computational fluency. That will be addressed in fourth grade.
Since students are to generate their own strategies, questions should promote and encourage students to think about how they can use prior knowledge to create their own process. Samples questions are “How is this problem different from multiplication problems we have done before? How can we decompose this number to make it easier to work with? How can we use what we know about tens and ones to break down this problem?”
Most of the generated strategies will be rooted in the traditional algorithm to some degree. Having students compare strategies and discuss similarities will bring out some of the commonalities.
Assessment Guidelines
The objective of this indicator is to generate which is in the “create conceptual” knowledge cell of the Revised Taxonomy. To create means to put ideas together into a new structure; therefore, students use prior knowledge to generate new strategies. The learning progression to generate requires students to recall basic multiplication facts and understand place value. Using concrete and/or pictorial models, students apply their understanding of number relationships to determine how to solve story problems. As students analyze information (3-1.1) from these experiences, they generate mathematical statements (3-1.4) about the relationships they observe then explain and justify their strategies (3-1.3) to their classmates and their teachers. Students recognize the limitations of various strategies and representations (3-1.8) and use
correct, complete and clearly written and oral language to communicate their ideas (3-1.5).

Number and Operations Third Grade
23
Standard 3-2: The student will demonstrate through the mathematical processes an understanding of the representation of whole numbers and fractional parts; the addition and subtraction of whole numbers; accurate, efficient, and generalizable methods of multiplying whole numbers; and the relationships among multiplication, division, and related basic facts. Indicator 3-2.11
Use basic number combinations to compute related multiplication problems that involves multiples of 10. Continuum of Knowledge:
In second grade, students interpret models of equal grouping (multiplication) as repeated addition and array (2-2.5).
In third grade, students use basic number combinations to compute related multiplication problems that involve multiples of ten (3-2.11) and generate strategies to multiply whole numbers by using one single-digit factor and one multi- digit factor (3-2.10). In fourth grade, students apply an algorithm to multiply whole numbers fluently (4- 2.3) and explain the effect on the product when one of the factors is changed (4-2.4).
Taxonomy Level
Cognitive Dimension: Apply Knowledge Dimension: Procedural
Key Concepts
• Multiples • Combinations
Instructional Guidelines
For this indicator, it is essential
• Recall basic facts
for students to:
• Skip count by tens • Understand that skip counting by tens is creating multiples of ten

Number and Operations Third Grade
24
• Solve problems where only one factor is a power of ten up to the thousands place. For example, 12 x 7000. Students use their multiplication fact 12 x 7 and their understanding of multiples of ten to solve this problem.
For this indicator, it is not essential
• Use basic combinations with multiples of ten beyond 1000
for students to:
• Use basic combination where both factor are powers of ten such as 30 x 400. Students have only multiplied single-digit factor by one multi-digit factor.
Student Misconceptions/Errors
None noted
Instructional Resources and Strategies
Although the focus of the indicator is to use procedures, students should explore the concept of multiply with multiples of ten through inquiry. Students build conceptual knowledge of these relationships through the use of concrete models and generating and analyzing patterns.
Students may need access to a calculator to explore patterns. The calculator is simply used to quickly compute answers so that students can explore and analyze the patterns.
Assessment Guidelines
The objective of this indicator is to use which is in the “apply procedural” knowledge cell of the Revised Taxonomy. To use is to carry out a procedure to a given situation (familiar or unfamiliar); therefore, students should understand how to use their procedure in a variety of situation. The learning progression to use requires students to recall basic multiplication facts and understand multiples of ten. Students explore number patterns and construct arguments (3-1.2) about what happens as the multiples of 10 increase. Students generalize these connections (3-1.6) and use correct, complete and clearly written and oral language to communicate their ideas (3-1.5). Student use
this understanding to develop procedures that can be used to compute number combinations.

Number and Operations Third Grade
25
Standard 3-2: The student will demonstrate through the mathematical processes an understanding of the representation of whole numbers and fractional parts; the addition and subtraction of whole numbers; accurate, efficient, and generalizable methods of multiplying whole numbers; and the relationships among multiplication, division, and related basic facts Indicator 3-2.12
Analyze the magnitude of digits through 999,999 on the basis of their place value.
Continuum of Knowledge:
In second grade, students compared whole number quantities through 999 by using the terms is less than, is greater than and is equal to and the symbols <, > and = (2-2.4). Students also analyzed the magnitude of digits through 9,999 on the basis of their place value (2-2.10)
In third grade, students analyze the magnitude of digits through 999,999 on the basis of their place value (3-2.12) and compare whole number quantities through 999,999 by using the terms is less than, is greater than and is equal to using the symbols <, > and = (3-2.1).
In fourth grade, students analyze the magnitude of digits through hundredths on the basis of their place value (4-2.6)
Taxonomy Level
Cognitive Dimension: Analyze Knowledge Dimension: Conceptual
Key Concepts
• Magnitude • Place value
Instructional Guidelines
For this indicator, it is essential
• Understand place value
for students to:
• Understand that each place value ten times greater than the position to the right.
• Model place value relationships i.e. what does ten times one place look like, what does ten times the hundreds place look like, etc…
• Expand number in order to analyze place value

Number and Operations Third Grade
26
For this indicator, it is not essential
None noted
for students to:
Student Misconceptions/Errors
• As students write large numbers in expanded form to represent the magnitude of the digits, they should translate between number and expanded form. Some students can write the expanded form of a number but have difficulty writing the standard form of a number when given the expanded form. A common error is for students to forget to use zero to represent the value of a particular place. For example: students may write 34,56 for 30,000 + 4,000 + 50 + 6. This can be avoided through the use of a Place Value Chart with marked columns.
• Another common error occurs when students are given representations such as 2 ten-thousands 4 thousands 13 hundreds 7 tens and 6 ones. Students will write the standard form as 241376 because they are only looking at the digits instead of considering the value of the digits. Students should have plenty of experiences using base ten blocks as they decompose 4-digit numbers so that they can extend the concept of decomposed numbers to 5- and 6-digit numbers.
Instructional Resources and Strategies
This is difficult to do because physical models are not commonly available. One idea that should be extended is the idea that each place value position is ten times greater than the position to the right.
Assessment Guidelines
The objective of this indicator is to analyze which is in the “analyze conceptual” knowledge cell of the Revised Taxonomy. To analyze means to determine relevant features and relationships. The learning progression to analyze requires students to understand place value and be able to locate the correct place value. Students represent the place value using concrete and/or pictorial models and generalize the connections (3-1.6) between place value and the multiple of ten. They compare the magnitude of digit and use these connections to generate statements (3-1.4) about the magnitude of numbers. Students explain and justify their answers (3-1.3) and use correct, complete and clearly written and oral language to communicate their ideas (3-1.5).

Algebra Third Grade
1
Standard 3-3: The student will demonstrate through the mathematical processes an understanding of numeric patterns, symbols as representations of unknown quantity, and situations showing increase over time.
Indicator 3-3.1
Create numeric patterns that involve whole number operations
Continuum of Knowledge:
In second grade, students analyzed numeric patterns in skip counting that used the numerals 1 through 10 (2-3.1) and analyzed relationships to complete and extend growing and repeating patterns with numbers, symbols and objects (2-3.3)
Third grade is the first time students are formally introduced to patterns involving operations. They create numeric pattern involving whole number operations (3-3.1) and apply procedures to find the missing number in numeric patterns that involve whole number operations (3-3.2).
In fourth grade, students analyze numeric, nonnumeric and repeating patterns involving all operations and decimal patterns through hundredths (4-3.1). They also generalize a rule for numeric, nonnumeric and repeating patterns involving all operations.
Taxonomy Level
Cognitive Dimension: Create Knowledge Dimension: Conceptual
Key Concepts
• Whole number operation • Numeric pattern • Term
Instructional Guidelines
For this indicator, it is essential
• Create numeric patterns involving addition and subtraction. An example is 5, 8, 7, 10, 9, ____. Students add 3 for the next term then subtract 1 for the next term then they repeat.
for students to:
• Create numeric pattern involving basic multiplication (see 3-2.7) • Communicate their pattern in written and oral form • Use concrete and/or pictorial models to explore patterns

Algebra Third Grade
2
For this indicator, it is not essential
• Combine operations to get the next term. An example is 5, 11, 23, ____. The pattern is to multiply by 2 and add 1 to get to the next term then they repeat.
for students to:
Student Misconceptions/Errors
None noted
Instructional Resources and Strategies
Having student create pictorial models not only incorporates the multiple representations but gives an additional entry point for students who may struggle with addition, subtraction and multiplication.
Assessment Guidelines
The objective of this indicator is to create which is in the “create conceptual” knowledge cell of the Revised Taxonomy. To create means to put ideas together into a new structure; therefore, students use prior knowledge to create new numeric patterns. The learning progression to create requires students to recall basic addition, subtraction and multiplication facts and understand what a pattern is. Where appropriate, students use concrete and/or pictorial models to explore number relationships in order to develop a pattern. As students analyze information (3-1.1) from these experiences, they generate mathematical statements (3-1.4) about the relationships they observe then explain and justify their pattern (3-1.3) to their classmates and their teachers. Students recognize the limitations of various strategies and representations (3-1.8) and use
correct, complete and clearly written and oral language to communicate their ideas (3-1.5).

Algebra Third Grade
3
Standard 3-3: The student will demonstrate through the mathematical processes an understanding of numeric patterns, symbols as representations of unknown quantity, and situations showing increase over time.
Indicator 3-3.2
Apply procedures to find missing numbers in numeric pattern that involve whole-number operations
Continuum of Knowledge:
In second grade, students analyzed numeric patterns in skip counting that used the numerals 1 through 10 (2-3.1) and analyzed relationships to complete and extend growing and repeating patterns with numbers, symbols and objects (2-3.3).
Third grade is the first time students are formally introduced to patterns involving operations. They create numeric pattern involving whole number operations (3-3.1) and apply procedures to find the missing number in numeric patterns that involve whole number operations (3-3.2). In third grade, students become fluent in the addition and subtract of whole numbers (3-2.2) and must recall basic multiplication fact through 12 x 12 (3-2.7).
In fourth grade, students analyze numeric, nonnumeric and repeating patterns involving all operations and decimal patterns through hundredths (4-3.1). They also generalize a rule for numeric, nonnumeric and repeating patterns involving all operations.
Taxonomy Level
Cognitive Dimension: Apply Knowledge Dimension: Procedural
Key Concepts
• Missing term • Numeric pattern
Instructional Guidelines
For this indicator, it is essential
• Analyze relationships between and among numbers to determine a pattern
for students to:
• Determine the missing terms within a sequence of numbers • Determine the missing term at the end of a sequence of numbers

Algebra Third Grade
4
• Be fluent in addition and subtraction • Recall basic multiplication facts
For this indicator, it is not essential
• To apply procedures that involve the multiplication of numbers beyond the basic multiplication facts
for students to:
• Combine operations to get the next term. An example is 5, 11, 23, ____. The pattern is to multiply by 2 and add 1 to get to the next term then they repeat.
Student Misconceptions/Errors
Students may not understand that the pattern has to be consistent between adjacent numbers.
Instructional Resources and Strategies
This indicator can be combined with indicator 3-3.1 by putting students in pairs. Student A will create a pattern then Student B must determine what the pattern is and apply that procedure to find the missing term.
Assessment Guidelines
The focus of the indicator is for students apply which is in the “apply procedural” knowledge cell of the Revised Taxonomy. Although, the focus of the indicator is procedural, the learning progression should integrate strategies that encourage students to balance procedural knowledge with their conceptual knowledge. The learning progression to apply requires student to recall and understand the meaning of pattern. Students analyze information (3-1.1) from the pattern and use their understanding of whole number operations to determine the relationship between numbers. They should use correct, complete and clearly spoken or written language (3-1.5) to explain and justify
their answers to their classmates and teacher on the basis of properties and relationships (3-1.3).

Algebra Third Grade
5
Standard 3-3: The student will demonstrate through the mathematical processes an understanding of numeric patterns, symbols as representations of unknown quantity, and situations showing increase over time.
Indicator 3-3.3
Use symbols to represent an unknown quantity in a simple addition, subtraction or multiplication equation
Continuum of Knowledge:
In second grade, students had experiences generating strategies for addition and subtraction pairs of two-digit whole numbers with regrouping. In third grade, students use symbols to represent unknown quantities in addition, subtraction, and multiplication equations. In fourth grade, students translate among letters, symbols and words to represent quantities in simple mathematical expression or equations (4 -3.4). They also apply procedures to find the value of an unknown letter or symbol in a whole number equation (4-3.5) Taxonomy Level
Cognitive Dimension: Apply Knowledge Dimension: Conceptual
Key Concepts
• Equation • Balance • Equivalency
Instructional Guidelines
For this indicator, it is essential
• Understand that the symbol is a placeholder for an unknown quantity
for students to:
• Understand that the symbol represents a different number each equation or problem situation
• Understand that the equation sign represent balance between the two sides of the equation
• Explore these symbols in the context of story problems.

Algebra Third Grade
6
• Write number sentences • Use the symbol to represent the unknown quantity in different positions. For
example, o x 3 = 6 o 3 + = 5 o 7 – 2 =
For this indicator, it is not essential
• Use inverse operations to solve for the unknown quantity
for students to:
Student Misconceptions/Errors
Students often have a common misunderstanding with regard to the concept of equivalence. Prior to the third grade, students may have simply written an answer after the equal sign. Now, students must clearly understand that the equal sign does not mean “perform an operation”. It means that there is a relationship of equivalence between the two expressions on either side of that equal sign.
Students typically view the equals sign as a symbol that separates the problem from the answer. It is important that students see and understand that there is a relationship between the expressions on each side of an equals sign. Instead of viewing = as meaning an answer is coming, help students view the equals sign as meaning “is the same as.” A good starting point to develop this understanding is to explore equations as true or false. Example: 4 + 1 = 6 8 = 10 – 1 5 + 4 = 9
Instructional Resources and Strategies
Students should start with simple story problems and number sentences to ensure understanding. Assessment Guidelines
The objective of the indicator is to use which is in the “apply conceptual” knowledge cell of the Revised Taxonomy. Applying conceptual goes beyond replacing a missing number with a symbol. Conceptual knowledge is not bound by specific examples; therefore, students should apply their understanding of unknown quantity in a variety of situations. The learning progression to use requires students to explore real world problems and analyze information (3-1.1) from the problem to determine known and unknown quantities in the problem. Students generate descriptions or mathematical statements (3-1.4) about the relationship between the known and unknown quantities. They explain and justify their answers (3-1.3) to their classmates and their teacher. Students explore the use of the

Algebra Third Grade
7
same symbols in different problems to build a foundational understanding of the concept of variables.
Standard 3-3: The student will demonstrate through the mathematical processes an understanding of numeric patterns, symbols as representations of unknown quantity, and situations showing increase over time.
Indicator 3-3.4
Illustrate situations that show change over time as increasing
Continuum of Knowledge:
First grade students classified change over time as qualitative or quantitative (1-3.6). Second grade students identified (2-3.4) and analyzed (2-3.5) qualitative and quantitative change over time.
In third grade, students illustrate situation that show change over time as increasing (3-3.4). Students also interpret data in tables, bar graph, pictographs and dot plots (3-6.3).
In fourth grade, students illustrate situation that show change over time as either increasing, decreasing or varying (4-3.6)
Taxonomy Level
Cognitive Dimension: Understand Knowledge Dimension: Conceptual
Key Concepts
Increasing
Instructional Guidelines
For this indicator, it is essential
• Understand change over time
for students to:
• Determine if change has occurred • Understand the concept of increasing change • Use their understanding of change over time to find example of increasing
change • Describe observed change in words • Recognize counter examples (change that does not increase)

Algebra Third Grade
8
For this indicator, it is not essential
None noted
for students to:
Student Misconceptions/Errors
None noted
Instructional Resources and Strategies
The emphasis here is on understanding that the change is increasing over the time period. For example, students may record the temperature when they arrive at school and again at two-hour intervals during the day. The next day students could examine the data in light of the increase of temperature (change) over time.
An important strategy to support students as they find examples is providing non examples. Although students do not have label other types of change using mathematical terminology, they should be able to state that a given example is not showing increasing change and why.
Assessment Guidelines
The objective of this indicator is to illustrate which is in the “understand conceptual“ knowledge cell of the Revised Taxonomy. To illustrate means to find specific examples of a concept; therefore, students should explore a variety of example to build understanding of the concept of increasing change. The learning progression to illustrate requires students to understand change over time and meaning of increasing. Students explore teacher generated examples and analyze information (3-1.1) from those examples to determine if change has occurred. They generate descriptions (3-1.4) of the observed change then explain and justify their answer on the basis of mathematical relationships (3-1.3). Student use this understanding to find other examples of increasing change and analyze
non examples to support conceptual understanding.

Geometry Grade Three
1
Standard 3-4: The student will demonstrate through the mathematical processes an understanding of the connection between the identification of basic attributes and the classification of two-dimensional shapes.
Indicator 3-4.1
Identify the specific attributes of circles: center, radius, circumference, and diameter Continuum of Knowledge:
In first grade, students analyzed the two-dimensional shapes circle, square, triangle, and rectangle (1-4.2).
In third grade, students identify the specific attributes of a circle: center, radius, circumference, and diameter (3-4.1). In sixth grade, students explain the relationships among the circumference, diameter, and radius of a circle (6-5.1) and apply strategies and formulas with an approximation of pi (3.14, or 22/7) to find the circumference and area of a circle (6-5.2). Taxonomy Level
Cognitive Dimension: Recognize Knowledge Dimension: Factual
Key Concepts
• Center
Vocabulary
• Circle • Circumference • Diameter • Radius
Instructional Guidelines
For this indicator, it is essential
• Understand that the diameter of a circle is a straight line which passes through the center of the circle and ends at the circle's edge.
for students to:
• Understand that the radius is the distance from the center of the circle to one of its edges.
• Understand that the center is the middle of the circle

Geometry Grade Three
2
• Understand that circumference is defined as the distance around a closed curve such as a circle.
• Recognize the center, diameter, radius, and circumference of the circle such as:
What would you call the distance if you walked along the edge of a circle one time? The circumference
• Recognize the center, diameter, radius, and circumference of the circle to solve to solve increasingly more sophisticated problems such as:
Name the diameter in the circle. BS
For this indicator, it is not essential
• Calculate the circumference of a circle. However, they are expected to understand that circumference is the distance around a circle.
for students to:
Student Misconceptions/Errors Students may sometimes identify the radius as the diameter and the diameter as the radius. Ample opportunities for students to explore each attribute should be provided as well as definitions/explanations.
Instructional Resources and Strategies
Circumference is defined as the distance around a closed curve such as a circle. The diameter of a circle is a straight line which passes through the center of the circle and ends at the circle's edge. The radius is the distance from the center of the circle to one of its edges.
Assessment Guidelines
The objective of this indicator is identify, which is in the “remember conceptual” knowledge cell of the Revised Taxonomy. Conceptual knowledge is not bound by
A
D M
S B

Geometry Grade Three
3
specific examples. Therefore, the student’s conceptual knowledge of identifying the radius, diameter, center, and the circumference of a circle should be assessed using a variety of examples. The learning progression to identify requires students to recall what the radius, diameter, center, and the circumference of a circle are, and use that understanding to label those parts correctly on a circle. Students generate descriptions and mathematical statements about relationships between and among classes of these properties of a circle (3-1.4). They explain and justify their understanding on the basis of mathematical properties, structures, and relationships (3-3.3). Students use correct, complete, and clearly written and oral mathematical language to pose questions, communicate ideas, and extend problem situations (3-1.5) with their classmates and teacher. Students also analyze
information to solve increasingly more difficult problems (3-3.1) to build a deeper conceptual understanding of these properties.

Geometry Grade Three
4
Standard 3-4: The student will demonstrate through the mathematical processes an understanding of the connection between the identification of basic attributes and the classification of two-dimensional shapes.
Indicator 3-4.2
Classify polygons as either triangles, quadrilaterals, pentagons, hexagons, or octagons according to the number of their sides. Continuum of Knowledge:
In first grade, students classified two-dimensional shapes as polygons or nonpolygons (1-4.3).
In third grade, students classify polygons as either triangles, quadrilaterals, pentagons, hexagons, or octagons according to the number of their sides (3-4.2). In fourth grade, students represent points, lines, line segments, rays, angles, and polygons (4-4.6) Taxonomy Level
Cognitive Dimension: Understand Knowledge Dimension: Conceptual
Key Concepts
• Hexagons
Vocabulary
• Octagons • Pentagons • Polygons • Quadrilaterals • Triangles
Instructional Guidelines
For this indicator, it is essential
• Recall the characteristics of a polygons
for students to:
• Understand that polygons are named based on its number of sides • Understand the meaning of the prefixes: tri, quad, penta, hexa and octa. • Understand that polygons with the same number of sides may look quite
different, but are still classified the same way. For example, all four sided polygons are quadrilaterals regardless of their side lengths.

Geometry Grade Three
5
• Classify polygons as either triangles, quadrilaterals, pentagons, hexagons, or
octagons according to the number of their sides such as:
What is the name of the figure below? D
A. Triangle B. Pentagon C. Hexagon D. Octagon
• Analyze polygons to solve increasingly more sophisticated problems such as:
The pieces of a puzzle are shown below. Which piece is a hexagon? 2
For this indicator, it is not essential
• Classify heptagons, decagons, and nonagons.
for students to:
Student Misconceptions/Errors
• Students may think that polygons with the same number of sides must look exactly the same but the polygons may look quite different, but are still classified the same way
Instructional Resources and Strategies

Geometry Grade Three
6
Assessment Guidelines
The objective of this indicator is classify, which is in the “understand conceptual” knowledge cell of the Revised Taxonomy. Conceptual knowledge is not bound by specific examples. Therefore, the student’s conceptual knowledge of classifying triangles, quadrilaterals, pentagons, hexagons, and octagons should be assessed using a variety of examples. The learning progression to classify requires students to sort polygons based on their number of sides. Students generate descriptions and mathematical statements about relationships between and among classes of polygons. Based on these descriptions, students relate the number of sides to the prefix (quad, penta, hexa and octa) to form the names for group of polygons generate mathematical statements (3-1.4) to describe each category. Students explain and justify answers on the basis of mathematical properties, structures, and relationships (3-3.3) they observe, and use correct, complete, and clearly written and oral mathematical language to pose questions and communicate ideas (3-1.5) with their classmates and teacher. Students then classify
other examples of polygons.

Geometry Grade Three
7
Standard 3-4: The student will demonstrate through the mathematical processes an understanding of the connection between the identification of basic attributes and the classification of two-dimensional shapes.
Indicator 3-4.3
Classify lines and line segments as either parallel, perpendicular, or intersecting.
Continuum of Knowledge:
Third grade is the first time students classify lines and line segments as either parallel, perpendicular, or intersecting (3-4.3). Students in third grade also exemplify points, lines, line segments, rays, and angles (3-4.6) In fourth grade, students represent points, lines, line segments, rays, angles, and polygons (4-4.6) Taxonomy Level
Cognitive Dimension: Understand Knowledge Dimension: Factual
Key Concepts
• Lines
Vocabulary
• Line segments • Intersecting lines • Parallel lines • Perpendicular lines
Instructional Guidelines
For this indicator, it is essential
• Understand that a line goes on forever in both directions.
for students to:
• Understand that a line segment is part of a line and has two endpoints • Understand that parallel lines or parallel line segments never cross each
other • Understand that intersecting lines or intersecting line segments meet or cross
each other at one point • Understand that perpendicular lines cross or meet to form right angles • Explore these concepts using real world examples
Geometry Grade Three
8
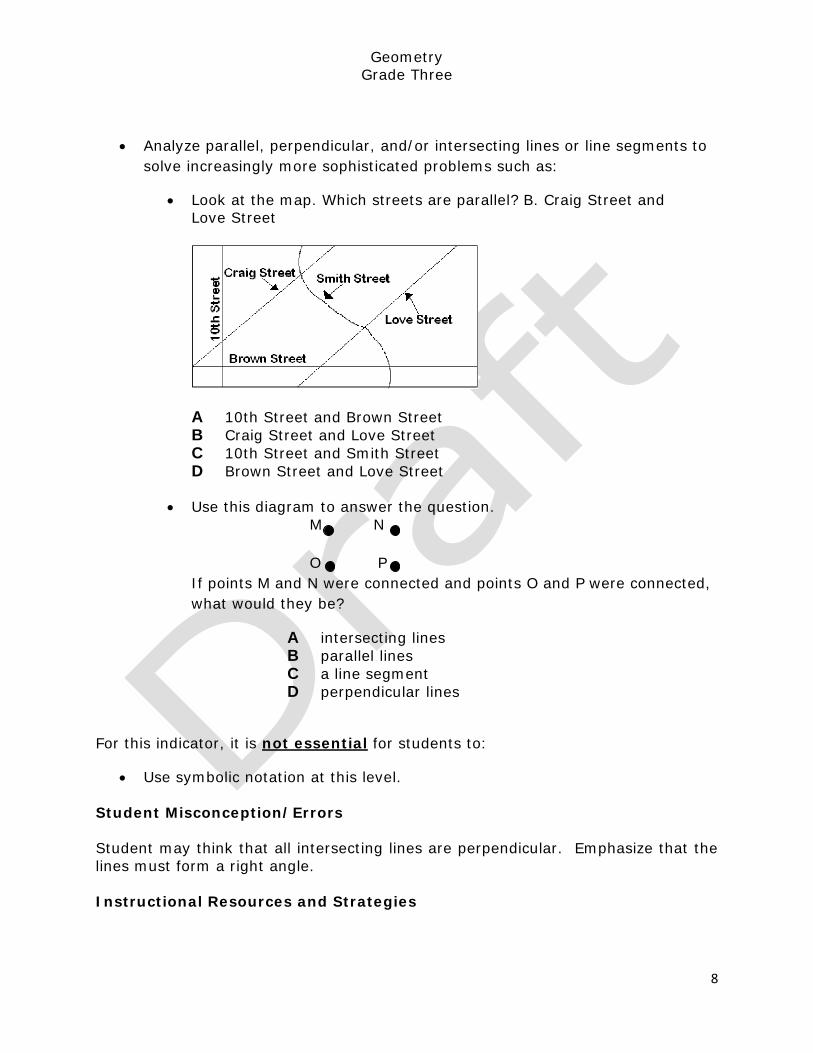
• Analyze parallel, perpendicular, and/or intersecting lines or line segments to solve increasingly more sophisticated problems such as:
• Look at the map. Which streets are parallel? B. Craig Street and Love Street
A 10th Street and Brown Street B Craig Street and Love Street C 10th Street and Smith Street D Brown Street and Love Street
• Use this diagram to answer the question.
M N O P If points M and N were connected and points O and P were connected, what would they be?
A intersecting lines B parallel lines C a line segment D perpendicular lines
For this indicator, it is not essential
• Use symbolic notation at this level.
for students to:
Student Misconception/Errors Student may think that all intersecting lines are perpendicular. Emphasize that the lines must form a right angle. Instructional Resources and Strategies

Geometry Grade Three
9
An in-depth understanding will require many examples/models of each type of parallel, perpendicular, and intersecting lines and/or line segments along with emphasis placed on explanations and vocabulary. It is important to show parallel, perpendicular, and intersecting lines and/or line segments, in a variety of ways so the students do not memorize one type of example.
Assessment Guidelines
The objective of this indicator is classify, which is in the “understand factual” knowledge cell of the Revised Taxonomy. To understand factual goes beyond rote memorization of definition and extends to applying that fact to a variety of examples. The learning progression to classify requires students to sort examples of lines into categories. Students generate descriptions (3-1.4) about the relationships among examples in each category. They explain and justify how they sorted their examples on the basis of mathematical properties, structures and relationships (3-3.3). Students relate the examples in each category to the term parallel, perpendicular and intersecting generate mathematical statements (3-1.4) to describe each category. Students use that understanding to classify other examples as and use correct, complete, and clearly written and oral mathematical language to pose questions and communicate ideas (3-1.5) with their classmates and teacher. Students explore
real world examples of these relationships to gain a deeper understanding of this factual knowledge.

Geometry Grade Three
10
Standard 3-4: The student will demonstrate through the mathematical processes an understanding of the connection between the identification of basic attributes and the classification of two-dimensional shapes.
Indicator 3-4.4
Classify angles as either right, acute, or obtuse.
Continuum of Knowledge:
Third grade is the first time students classify angles as either right, acute, or obtuse (3-4.4). Students in third grade also exemplify points, lines, line segments, rays, and angles (3-4.6) In fourth grade, students represent points, lines, line segments, rays, angles, and polygons (4-4.6). In fifth grade, the students compare the angles, side lengths, and perimeters of congruent shapes (5-4.2) Taxonomy Level
Cognitive Dimension: Understand Knowledge Dimension: Factual
Key Concepts
• Angle
Vocabulary
• Acute Angle • Obtuse Angle • Right Angle
Instructional Guidelines
For this indicator, it is essential
• Recall that an angle is where two rays meet with a common endpoint.
for students to:
• Recall that a right angle measures 90º and is shaped like an L. • Recall that an acute angle is smaller than a right angle • Understand that an obtuse angle is larger a right angle • Classify angles as either right, acute, or obtuse such as:
Which angle is a right angle? A. A. B. C. D.

Geometry Grade Three
11
• Analyze angles to solve increasingly more sophisticated problems such as:
Which type of angle best describes angle J? C. acute
A right B obtuse C acute D parallel
For this indicator, it is not essential
• Use a protractor to find the measures of acute and obtuse angles.
for students to:
Instructional Resources and Strategies
An in-depth understanding will require many examples/models of each type of angle along with emphasis placed on explanations and vocabulary. It is important to show right, acute, and obtuse angles in a variety of ways so the students do not memorize one type of example.
Assessment Guidelines
The objective of this indicator is classify, which is in the “understand factual” knowledge cell of the Revised Taxonomy. To understand factual goes beyond rote memorization of definition and extends to applying that fact to a variety of examples. The learning progression to classify requires students to sort examples of angles into categories. Students generate descriptions (3-1.4) about the relationships among examples in each category. They explain and justify how they sorted their examples on the basis of mathematical properties, structures and relationships (3-3.3). Students relate the examples in each category to the term acute, right and obtuse and generate mathematical statements (3-1.4) to describe each category. Students use that understanding to classify other examples as and use correct, complete, and clearly written and oral mathematical language to pose questions and communicate ideas (3-1.5) with their classmates and teacher. Students explore
real world examples of these relationships to gain a deeper understanding of this factual knowledge.

Geometry Grade Three
12
Standard 3-4: The student will demonstrate through the mathematical processes an understanding of the connection between the identification of basic attributes and the classification of two-dimensional shapes.
Indicator Number 3-4.5
Classify triangles by the length of their sides as either scalene, isosceles, or equilateral according and by the sizes of their angles as either acute, right, or obtuse. Continuum of Knowledge: In third grade, students classify triangles by the length of their sides as either scalene, isosceles, or equilateral according and by the sizes of their angles as either acute, right, or obtuse (3-4.5). This is their first encounter with this vocabulary so ample practice and review may be needed for mastery of these terms. Taxonomy Level
Cognitive Dimension: Understand Knowledge Dimension: Factual
Key Concepts
• Equilateral Triangle
Vocabulary
• Isosceles Triangle • Scalene Triangle • Acute Angle • Obtuse Angle • Right Angle
Instructional Guidelines
For this indicator, it is essential
• Understand that an equilateral triangle is a triangle with three equal sides and three equal angles
for students to:
• Understand that an isosceles triangle has two equal sides and opposite angles are equal
• Understand that a scalene triangle has no equal sides and no equal anlges • Recall that an acute angle is smaller than a right angle • Recall that a right angle measures 90º and can be shaped like an L. • Recall that an obtuse angle is larger than a right angle

Geometry Grade Three
13
• Classify triangles by the length of their sides as either scalene, isosceles, or equilateral according and by the sizes of their angles as either acute, right, or obtuse such as:
What type of triangle is below? Acute
• Classify triangles by the length of their sides as either scalene, isosceles, or equilateral according and by the sizes of their angles as either acute, right, or obtuse to solve increasingly more sophisticated problems such as:
Mrs. Jackson asked that John pick two names to describe this triangle.
What two names should he use? D. right and isosceles
A acute and scalene B obtuse equilateral C right scalene D right and isosceles
Student Misconceptions/Errors
Students often confuse scalene and isosceles triangles.
Instructional Resources and Strategies
• Once the students have an understanding that all three sided polygons are classified as triangles, they can begin classifying triangles by their side lengths and angle measures. Again, the students will need many different visual examples/models for this indicator. The vocabulary is new for 3rd
grade students, so ample practice and review will be needed for mastery of these terms. Activities that require students to sort a set of triangles by the length of the sides (scalene, isosceles, equilateral) or by sizes of the angles (acute, obtuse, right) will help students master this indicator.
Y
Z
X

Geometry Grade Three
14
Assessment Guidelines
The objective of this indicator is classify, which is in the “understand factual” knowledge cell of the Revised Taxonomy. To understand factual goes beyond rote memorization of definition and extends to applying that fact to a variety of examples. The learning progression to classify requires students to sort examples of triangles into categories. Students generate descriptions (3-1.4) about the relationships among examples in each category. They explain and justify how they sorted their examples on the basis of mathematical properties, structures and relationships (3-3.3). Students relate the examples in each category to the term scalene, isosceles or equilateral. They continue to examine these categories based on their angles. Students generate mathematical statements (3-1.4) to describe each category. Students use that understanding to classify other examples and use correct, complete, and clearly written and oral mathematical language to pose questions and communicate ideas (3-1.5) with their classmates and teacher. Students explore
real world examples of these relationships to gain a deeper understanding of this factual knowledge.
Geometry Grade Three
15
Standard 3-4: The student will demonstrate through the mathematical processes an understanding of the connection between the identification of basic attributes and the classification of two-dimensional shapes.
Indicator 3-4.6
Exemplify points, lines, line segments, rays, and angles
Continuum of Knowledge:
Third grade is the first time students exemplify points, lines, line segments, rays, and angles (3-4.6). Students are asked to classify lines and line segments as parallel, perpendicular, or intersecting (3-4.3) . They are also asked to classify angles as right, acute, or obtuse (3-4.4). In fourth grade, students represent points, lines, line segments, rays, angles, and polygons (4-4.6). In fifth grade, the students compare the angles, side lengths, and perimeters of congruent shapes (5-4.2) Taxonomy Level
Cognitive Dimension: Understand Knowledge Dimension: Conceptual
Key Concepts
• Angle
Vocabulary
• Line • Line Segments • Point • Ray
Instructional Guidelines
For this indicator, it is essential
• Understand that an angle is where two rays meet with a common endpoint.
for students to:
• Understand that a line goes on forever in both directions • Understand that a line segment is part of a line and has two endpoints • Understand that a ray is part of a line that has one endpoint and continues
without end in the other direction • Understand that a point is a location in space

Geometry Grade Three
16
For this indicator, it is not essential
• Students are not expected to use symbolic notation at this level.
for students to:
Student Misconceptions/Errors
Students may think that angles are made up of two lines. Using concrete materials to illustrate the joining of rays may help with this misconception.
Instructional Resources and Strategies
In order for students to exemplify points, lines, line segments, rays, and angles, they should be able to give an example or illustration that shows their understanding of each. Again, many examples/models must be provided for the students to gain this knowledge. Guiding the students to explain the differences between this terminology such as a line segment and a ray will help solidify their understanding.
Assessment Guidelines
The objective of this indicator is to illustrate which is in the “understand conceptual“ knowledge cell of the Revised Taxonomy. To illustrate means to find specific examples of a concept; therefore, students should explore a variety of examples to build understanding of these concepts. The learning progression to illustrate requires students to recall the characteristics of points, lines, line segments and rays. Students analyze and compare these characteristics to generalize connections between these related concepts (3-1.6). Students explore teacher generated problems and explain and justify their answer on the basis of mathematical relationships (3-1.3) and share their understanding with their classmates and their teacher. Student use
this understanding to find other examples of these concepts.

Geometry Grade Three
17
Standard 3-4: The student will demonstrate through the mathematical processes an understanding of the connection between the identification of basic attributes and the classification of two-dimensional shapes.
Indicator 3-4.7
Analyze the results of combining and subdividing circles, triangles, quadrilaterals, pentagons, hexagons, and octagons. Continuum of Knowledge: In second grade, the students predicted the results of combining and subdividing polygons and circles (2-4.3). In third grade, students analyze the results of combining and subdividing circles, triangles, quadrilaterals, pentagons, hexagons, and octagons (3-4.7) In fourth grade, students analyze the relationship between three-dimensional geometric shapes in the form of cubes, rectangular prisms, and cylinders and their two-dimensional nets (4-4.2). Taxonomy Level
Cognitive Dimension: Analyze Knowledge Dimension: Conceptual
Key Concepts
• Circles
Vocabulary
• Combine • Hexagons • Octagons • Pentagons • Quadrilaterals • Subdivide • Triangles
Instructional Guidelines
For this indicator, it is essential
• Understand that two or more polygons can be combined to create other polygons
for students to:
• Understand that polygons can be subdivided into two or more figures • Understand how to divide a polygon into familiar figures.

Geometry Grade Three
18
• Understand concept of half • Recall properties of the circles, triangles, quadrilaterals, pentagons,
hexagons, and octagons • Analyze the results of combining and subdividing circles, triangles, quadrilaterals, pentagons, hexagons, and octagons such as:
Look at the shapes below to answer the next question.
If you put the two shapes together, what new shape would you make? (B. square)
A circle B square C triangle D hexagon
• Analyze the results of combining and subdividing circles, triangles,
quadrilaterals, pentagons, hexagons, and octagons to solve increasingly more sophisticated problems such as:
Which figures could be combined to form a pentagon? C.
A. B. C.
For this indicator, it is not essential
• Students are not required to use the two-dimensional shapes to build three-dimensional shapes. That transition will be made in fourth grade
for students to:
Student Misconceptions/Errors
None noted
Instructional Resources and Strategies
In order to analyze the results, the students will need experiences in combining and subdividing these shapes. Using manipulatives, such as Geoboards, can help students see these results. The emphasis in third grade is on students seeing the relationship between various two-dimensional shapes. By analyzing the results of
A
B

Geometry Grade Three
19
combining and subdividing the specified shapes in third grade, students will have the foundational knowledge for fourth grade when they analyze the relationship between three-dimensional shapes and two-dimensional nets.
Assessment Guidelines
The objective of this indicator is analyze,knowledge cell of the Revised Taxonomy. Conceptual knowledge is not bound by
which is in the “analyze conceptual”
specific examples; therefore, the student’s conceptual knowledge of analyzing the results of combining and subdividing circles, triangles, quadrilaterals, pentagons, hexagons, and octagons should be explored using a variety of examples. The learning progression to analyze requires students to recall the characteristics of circles, triangles, quadrilaterals, pentagons, hexagons, and octagons and the number of sides of these figures. Students use manipulatives to investigate combining and subdividing various shapes. Students analyze the results and generate descriptions about the relationships they observe. They explain and justify answers to their classmates and teacher on the basis of mathematical properties, structures, and relationships (3-3.3). Students then use
these descriptions to analyze other problems without the use of concrete models.

Geometry Grade Three
20
Standard 3-4: The student will demonstrate through the mathematical processes an understanding of the connection between the identification of basic attributes and the classification of two-dimensional shapes.
Indicator 3-4.8
Predict the results of one transformation—either slide, flip, or turn—of a geometric shape. Continuum of Knowledge: In third grade, students predict the results of one transformation—either slide, flip, or turn—of a geometric shape (3-4.7). This is their first encounter with transformations (slide, flip, or turn) of shapes. In fourth grade, students predict the results of multiple transformations of the same type- translation, reflection, or rotation- on a two-dimensional geometric shape (4- 4.3). In fifth grade, students predict the results of multiple transformations on a geometric shape when combinations of translations, reflections, and rotations are used (5-4.5). Taxonomy Level
Cognitive Dimension: Understand Knowledge Dimension: Conceptual
Key Concepts
• Flip (Reflection)
Vocabulary
• Predict • Slide (Translation) • Turn (Rotation) • Transformation
Instructional Guidelines
For this indicator, it is essential
• Understand that a turn is when a figure is turned a certain angle and direction around a point
for students to:
• Understand that a flip is creating a mirror image of a figure on the opposite side of a line (line of reflection)

Geometry Grade Three
21
• Understand that a slide is a transformation that slides a figure a given distance in a given direction
• Understand the difference between a flip, slide, and turn. • Predict the results of one transformation—either slide, flip, or turn—of a
geometric shape such as: Which picture represents a flip?
For this indicator, it is not essential
• Students are not required to predict the results of multiple transformations.
for students to:
Student Misconceptions/Errors
None noted
Instructional Resources and Strategies
Using geometric shaped manipulatives for the students to perform a transformation such as a slide, flip, or turn will help them conceptually understand the results. After many opportunities, the students should visualize the changes and be able to predict the result of one transformation.
Assessment Guidelines
The objective of this indicator is predict,knowledge cell of the Revised Taxonomy. Conceptual knowledge is not bound by
which is in the “understand conceptual”
specific examples; therefore, the student’s conceptual knowledge of predicting the results of one transformation—either slide, flip, or turn—of a geometric shape should be explored using a variety of examples. The learning progression to predict requires students to recall(translation) and turn (rotation). Student
the meaning of flip (reflection), slide use concrete models to visualize and
create transformations of their own. They construct
Figure A
arguments (3-1.2) about what
Figure B
Figure C
Figure D

Geometry Grade Three
22
will be the result of a transformation. They explain and justify their answers to their classmates and their teacher (3-1.3) using correct, complete, and clearly written and oral mathematical language communicate their ideas.

Measurement Third Grade
1
Standard 3-5: The student will demonstrate through the mathematical processes an understanding of length, time, weight, and liquid volume measurements; the relationships between systems of measure; accurate, efficient, and generalizable methods of determining the perimeters of polygons, and the values and combinations of coins required to make change.
Indicator 3-5.1
Use the fewest possible number of coins when making change
Continuum of Knowledge:
In second grade, students used counting procedure s to determine the value of a collection of coins and bills (2-5.1) used coins to make change up to one dollar (2-5.2).
In third grade, students use the fewest possible number of coins when making change (3-5.1).
Taxonomy Level
Cognitive Dimension: Apply Knowledge Dimension: Conceptual
Key Concepts
• Fewest possible • Changes
Instructional Guidelines
For this indicator, it is essential
• Recall coins and their value
for students to:
• Add coins • Understand the meaning of fewest • Understand the concept of making change • Understand cent notation • Represent the change using appropriate notation
For this indicator, it is not essential
• Make change using dollar bill
for students to:
Student Misconceptions/Errors

Measurement Third Grade
2
Students may lose track of their combinations of coins. They will need to keep a record of their combinations
Instructional Resources and Strategies
Set up little “Mini-Marts” in the classroom. Have students take turns being the salesperson and the customer. Tell the customer that they need to check to make sure the salesperson gives them the correct change. The customers should have only dollar bills to pay with. If the salesperson gives the correct change but coins that equal another coin, then the customer says “Presto Change-O” and exchanges the coins for another one. Ex. 2 dimes and a nickel for a quarter
Assessment Guidelines
The objective of the indicator is to use which is in the apply conceptual knowledge cell of the Revised Taxonomy. To apply conceptual is to understand how the interrelationships among basic elements (coins) within a larger structure enable them to function together (making change). The learning progression to use requires students to recall coins and their value. Students explore real world situations to generalize connections between these concepts and their real life. As students create different combinations of coins, they explain and justify their answers (3-1.3). They analyze
their combinations to solve increasingly more difficult problems (3-1.1) and use correct, complete and clearly written and oral language to communicate their understanding (3-1.5).

Measurement Third Grade
3
Standard 3-5: The student will demonstrate through the mathematical processes an understanding of length, time, weight, and liquid volume measurements; the relationships between systems of measure; accurate, efficient, and generalizable methods of determining the perimeters of polygons, and the values and combinations of coins required to make change.
Indicator 3-5.2
Use appropriate tools to measure objects to the nearest unit: measuring length in meters and half inches, measuring liquid volume in fluid ounces, pints and liters; and measuring mass in grams.
Continuum of Knowledge:
In second grade, students use appropriate tools to measure objects to the nearest whole unit: measuring length in centimeters, feet, and yards; measuring liquid volume in cups, quarts, and gallons; measuring weight in ounces and pounds; and measuring temperature on Celsius and Fahrenheit thermometers (2-5.3). They also generate common measurement referents for feet, yards, and centimeters (2-5.4) and use common measurement referent to make estimates in feet, yards and centimeters (2-5.5).
In third grade, students use appropriate tools to measure objects to the nearest unit: measuring length in meters and half inches, measuring liquid volume in fluid ounces, pints and liters; and measuring mass in grams (3-5.2).
In fourth grade, students use appropriate tools to measure objects to the nearest unit; measuring length in quarter inches, centimeters and millimeters; measuring liquid volume in cups, quarts and liters; and measuring weight and mass in pounds, milligrams and kilograms (4-5.1). They also use equivalencies to convert units to measure within the US Customary System (4-5.3).
Taxonomy Level
Cognitive Dimension: Apply Knowledge Dimension: Procedural
Key Concepts
• Meters • Fluid ounces • Pints • Liters • Grams • Estimate

Measurement Third Grade
4
• Nearest (closest) • Half inches
Instructional Guidelines
For this indicator, it is essential
• Understand which unit of measure is most appropriate for length, volume and mass
for students to:
• Locate the nearest unit • Use other words synonymous with nearest such as “closest to” • Understand that their measurement is an approximation in some cases • Understand half inches • Use appropriate abbreviations for measurements (meters is m, pounds is lb,
etc..) • Measure using actual tools • Read a measurement from a pictorial representation
For this indicator, it is not essential
None noted
for students to:
Student Misconceptions/Errors
Student may have difficulty understanding the concept of nearest or closest.
When using rulers to measure length, students need to be careful to notice where the first tick mark is located on different rulers.
Instructional Resources and Strategies
While students have worked with liquid volume and weight in second grade, the concepts of metric liquid volume and mass are new for third grade students
Assessment Guidelines
The objective of the indicator is to use which is in the “apply procedural” knowledge cell of the Revised Taxonomy. To apply procedural knowledge is to know how to do something and the criteria for determining when to use those procedures. The learning progression to use requires students to understand the concepts of length, volume and mass. They use their understanding of these concepts to select appropriate measuring tools and units of measure. They explore a variety of real world situations to generalize connections between new mathematical ideas and other related measurements they learned in previous grades (3-1.6). To deepen conceptual understanding, they generate descriptions and mathematical statement

Measurement Third Grade
5
about the relationship between measurements (3-1.4). Students estimate the measure using appropriate units. As students measure, they explain and justify
their answers (3-1.3) using correct, complete and clearly written and oral mathematical language (3-1.5)

Measurement Third Grade
6
Standard 3-5: The student will demonstrate through the mathematical processes an understanding of length, time, weight, and liquid volume measurements; the relationships between systems of measure; accurate, efficient, and generalizable methods of determining the perimeters of polygons, and the values and combinations of coins required to make change.
Indicator 3-5.3
Recognize the relationship between meters and yards, kilometers and miles, liters and quarts and kilograms and pounds.
Continuum of Knowledge:
In second grade, students use appropriate tools to measure objects to the nearest whole unit: measuring length in centimeters, feet, and yards; measuring liquid volume in cups, quarts, and gallons; measuring weight in ounces and pounds; and measuring temperature on Celsius and Fahrenheit thermometers (2-5.3). They also generate common measurement referents for feet, yards, and centimeters (2-5.4) and use common measurement referent to make estimates in feet, yards and centimeters (2-5.5).
In third grade, students recognize the relationship between meters and yards, kilometers and miles, liters and quarts and kilograms and pounds (3-5.3).
In fourth grade, students use appropriate tools to measure objects to the nearest unit; measuring length in quarter inches, centimeters and millimeters; measuring liquid volume in cups, quarts and liters; and measuring weight and mass in pounds, milligrams and kilograms (4-5.1). They also use equivalencies to convert units to measure within the US Customary System (4-5.3).
Taxonomy Level
Cognitive Dimension: Remember Knowledge Dimension: Factual
Key Concepts
• Kilometers • Miles • Liters • Quarts • Kilograms • Pounds • Equivalent

Measurement Third Grade
7
Instructional Guidelines
For this indicator, it is essential
• Understand that a meter is a slightly more than yard
for students to:
• Understand that a kilometer is a little over half a mile • Understand that a mile is about one and half kilometer • Understand that a liter is slightly more than a quart • Understand that a kilogram is slightly more than two pounds
For this indicator, it is not essential
• Know exact equivalencies
for students to:
Student Misconceptions/Errors
None noted
Instructional Resources and Strategies
Understanding should extend beyond rote memorization of these relationships. As students explore hands-on experiences, they are building conceptual understanding that supports retention.
Assessment Guidelines
The objective of this indicator is to recognize which is in the “remember factual” knowledge cell of the Revised Taxonomy. To recognize is to locate knowledge in long term memory. The learning progression to recognize requires students to demonstrate flexibility in the use of mathematical representations (3-1.7) by understanding that each relationship represents the same quantity using different units of measure. They engage in learning experiences that build conceptual understanding of these relationships. Students generate
descriptions and mathematical statements about these relationships (3-1.4) using correct, complete and clearly written and oral language (3-1.5).

Measurement Third Grade
8
Standard 3-5: The student will demonstrate through the mathematical processes an understanding of length, time, weight, and liquid volume measurements; the relationships between systems of measure; accurate, efficient, and generalizable methods of determining the perimeters of polygons, and the values and combinations of coins required to make change.
Indicator 3-5.4
Use common referents to make comparisons and estimates associated with length, liquid volume, and mass and weight: meters compared to yards, kilometers to miles, liters to quarts and kilograms to pounds.
Continuum of Knowledge:
In second grade, students use appropriate tools to measure objects to the nearest whole unit: measuring length in centimeters, feet, and yards; measuring liquid volume in cups, quarts, and gallons; measuring weight in ounces and pounds; and measuring temperature on Celsius and Fahrenheit thermometers (2-5.3). They also generate common measurement referents for feet, yards, and centimeters (2-5.4) and use common measurement referent to make estimates in feet, yards and centimeters (2-5.5).
In third grade, students use common referents to make comparisons and estimates associated with length, liquid volume, and mass and weight: meters compared to yards, kilometers to miles, liters to quarts and kilograms to pounds (3-5.4).
In fourth grade, students use appropriate tools to measure objects to the nearest unit; measuring length in quarter inches, centimeters and millimeters; measuring liquid volume in cups, quarts and liters; and measuring weight and mass in pounds, milligrams and kilograms (4-5.1). They also use equivalencies to convert units to measure within the US Customary System (4-5.3).
Taxonomy Level
Cognitive Dimension: Apply Knowledge Dimension: Conceptual
Key Concepts
• Common referent • Estimate

Measurement Third Grade
9
Instructional Guidelines
For this indicator, it is essential
• Understand standard and nonstandard measurements
for students to:
• Understand length, liquid volume, mass and weight • Recognize standard units such as meters, liters, pounds, etc… • Generate a common referent • Understand that their referent is an estimate • Compare their referent to the actual measurement • Develop strategies for making comparisons such as when measuring weights
of object, students can hold one object in each hand, extend their arms and feel the relative downward pull of each.
For this indicator, it is not essential
None noted
for students to:
Student Misconceptions/Errors
It may be difficult for students to create common referents for volume because of the concept of the amount of space occupied. It is especially difficult when the shapes of the containers are different.
Instructional Resources and Strategies
It is important for students to generate their own common referents. Although it may be easily to give students relationships to remember, retention is best support through concept building learning experiences where students explore a variety of examples.
One possible strategy to address the difficulty that students may have with volume, is to have students select a smaller units that they are familiar with such as cubes and think about how many cubes would it take to cover just the bottom of the container. Then they think about how many more layers they would need to get to the top of the container.
Assessment Guidelines
The objective of this indicator is to use which is in the “apply conceptual” cell of the Revised Taxonomy. Conceptual knowledge is not bound by specific examples; therefore, students should explore a variety of common referents and apply those referents to make comparisons and estimates. The learning progression to use requires students to understand the concepts of length, liquid volume, mass and weight. Students explore a variety of examples to find approximations of these measurements. Once their find a possible common referent, they explain and justify their answers (3-1.3) with their classmates and their teachers. As students

Measurement Third Grade
10
examine their referent, they generalize connections between mathematics and the environment (3-1.6). Students verify that their common referent is reasonable using an appropriate problem strategy such as comparing to other referent, measuring using a ruler, etc… They use these referents and analyze
information (3-1.1) to make comparisons and estimates.
Measurement Third Grade
11
Standard 3-5: The student will demonstrate through the mathematical processes an understanding of length, time, weight, and liquid volume measurements; the relationships between systems of measure; accurate, efficient, and generalizable methods of determining the perimeters of polygons, and the values and combinations of coins required to make change.
Indicator 3-5.5
Generate strategies to determine the perimeters of polygons
Continuum of Knowledge:
Third grade is the first time students are introduced to the concept of perimeter.
In fourth grade, students analyze the perimeter of polygon (4-5.4). In fifth grade, students apply formulas to determine the perimeters and areas of triangles, rectangles and parallelograms (5-5.4).
Taxonomy Level
Cognitive Dimension: Create Knowledge Dimension: Conceptual
Key Concepts
• Perimeter • Sides • Polygons
Instructional Guidelines
For this indicator, it is essential
• Recall the types of polygons they have learned (triangles, quadrilaterals, pentagons, etc..)
for students to:
• Understand that perimeter is the distance around a closed figure • Understand that perimeter is related to length • Generate their own strategies • Use appropriate units
For this indicator, it is not
• Develop a formula using variables such as P = 2L + 2W
for students to:

Measurement Third Grade
12
• Examine perimeter of circles (circumference)
Student Misconceptions/Errors
Although students are not formally introduced to the concept of area, students still think that the perimeter is related to how much space is covered by the shape.
Instructional Resources and Strategies
One possible strategy to address students’ misconceptions about perimeter is to examine real world situations such as fencing or border. Having student act out these situations will also support understanding such as having them walk around the perimeter of a room or use their finger to go around the border (perimeter) of an object. Incorporating movement creates an additional pathway in the brain related to perimeter.
Assessment Guidelines
The objective of this indicator is to generate which is in the “create conceptual” knowledge cell of the Revised Taxonomy. To create means to put ideas together into a new structure; therefore, students use prior knowledge to generate new strategies. The learning progression to generate requires students to recall polygons and their properties. Using concrete and/or pictorial models, students apply their understanding of polygons to determine how to compute the distance around the shape. As students analyze information (3-1.1) from these experiences, they generate mathematical statements (3-1.4) about the relationships they observe then explain and justify their strategies (3-1.3) to their classmates and their teachers. They then generalize connections (3-1.6) between these statements and the concept of “perimeter’. Students recognize the limitations of various strategies and representations (3-1.8) and use
correct, complete and clearly written and oral language to communicate their ideas (3-1.5).

Measurement Third Grade
13
Standard 3-5: The student will demonstrate through the mathematical processes an understanding of length, time, weight, and liquid volume measurements; the relationships between systems of measure; accurate, efficient, and generalizable methods of determining the perimeters of polygons, and the values and combinations of coins required to make change.
Indicator 3-5.6
Use analog and digital clocks to tell time to the nearest minute
Continuum of Knowledge:
In second grade, students used analog and digital clocks to tell and record time to the nearest quarter hour and to the nearest five-minute interval (2-5.7). They also matched a.m. and p.m. to familiar situations (2-5.8) and recall equivalencies associated with length and time (2-5.9).
In third grade, students use analog and digital clocks to tell time to the nearest minute (3-5.6) and recall equivalencies associated with time and length: 60 seconds = 1 minute and 36 inches = 1 yard (3-5.7).
In fourth grade, students apply strategies and procedures to determine the amount of elapsed time in hours and minutes within a 12-hour period, either a.m. or p.m. (4-5.6)
Taxonomy Level
Cognitive Dimension: Apply Knowledge Dimension: Conceptual
Key Concepts
• Analog • Digital • Nearest Minute (closest, almost)
Instructional Guidelines
For this indicator, it is essential
• Understand that a digital clock shows the current time only
for students to:
• Understand that a analog clock shows past, present and future times • Understand that five minutes intervals contain five individual marks – each
representing one minute • Understand the meaning of “closest to” or “nearest to”

Measurement Third Grade
14
• Match a time given on a digital clock with the time on an analog clock and vice-versa
For this indicator, it is not essential
• Determine elapsed time
for students to:
Student Misconceptions/Errors
Students may struggle with the idea of nearest to when using a digital clock because it only shows current time. For example, it may be difficult for them to know that 7:58 is almost 8:00. This requires them to know that there are 60 minutes in an hour, 58 is close to 60 and that 2 minutes isn’t a long time.
Instructional Resources and Strategies
One strategy that may be used to work with analog time is to use two real clock, one with only an hour hand and one with two hands (break the minute hand off). Cover the two-handed clock and throughout the day, direct their attention to the one-handed clock. Discuss the concept of closest to and give them a time. Have students predict where the minute hand should be. Uncover the clock and check.
Assessment Guidelines
The objective of this indicator is to use which is in the “apply conceptual” knowledge cell of the Revised Taxonomy. To apply conceptual knowledge is use your knowledge of the relationship between analog and digital clocks to tell time. The learning progression to use requires students to understand the difference between digital and analog time. Students understand what each type of clock reveals about time and they recognize the limitations of each (3-1.8). They understand the meaning of nearest, closest and almost. When telling time, students show flexibility in mathematical representation (3-1.7) by changing from analog to digital time and vice-versa. They explain and justify
their answers (3-1.3) using correct, complete and clearly written and oral language (3-1.5).

Measurement Third Grade
15
Standard 3-5: The student will demonstrate through the mathematical processes an understanding of length, time, weight, and liquid volume measurements; the relationships between systems of measure; accurate, efficient, and generalizable methods of determining the perimeters of polygons, and the values and combinations of coins required to make change.
Indicator 3-5.7
Recall equivalencies associated with time and length: 60 seconds = 1 minute and 36 inches = 1 yard
Continuum of Knowledge:
In second grade, students used analog and digital clocks to tell and record time to the nearest quarter hour and to the nearest five-minute interval (2-5.7). They also matched a.m. and p.m. to familiar situations (2-5.8) and recall equivalencies associated with length and time (2-5.9).
In third grade, students recall equivalencies associated with time and length: 60 seconds = 1 minute and 36 inches = 1 yard (3-5.7) and use analog and digital clocks to tell time to the nearest minute (3-5.6).
In fourth grade, students apply strategies and procedures to determine the amount of elapsed time in hours and minutes within a 12-hour period, either a.m. or p.m. (4-5.6)
Taxonomy Level
Cognitive Dimension: Remember Knowledge Dimension: Factual
Key Concepts
• Second • Minute • Inches • Yard
Instructional Guidelines
For this indicator, it is essential
• Recall 60 seconds = 1 minute and 36 inches = 1 yard
for students to:

Measurement Third Grade
16
For this indicator, it is not essential
• Perform unit conversions to prove these equivalencies
for students to:
Student Misconceptions/Errors
None noted
Instructional Resources and Strategies
Although the focus is on recalling equivalencies, retention of these facts is enhanced by concept building activities that enable students to discover these relationships.
Assessment Guidelines
The objective of this indicator is to recall which is in the “remember factual” knowledge cell of the Revised Taxonomy. Although the focus of the indicator is to recall factual knowledge, learning experience should integrate both memorization and concept building strategies to support retention. The learning progression to recall requires student to understand the relationship between hours, minutes and second. They also understand the relationship between feet, yards and inches. Students explore these measurements in context with concrete and/or pictorial models then analyze information (3-1.1) to generate mathematical statements (3-1.4) about the relationship between seconds and minutes and inches and yards. They should use
correct, complete and clearly written and oral language (3-1.5) to communicate their understanding.

Data and Probability Grade Three
1
Standard 3-6: The student will demonstrate through the mathematical processes an understanding of organizing, interpreting, analyzing and making predictions about data, the benefits of multiple representations of a data set, and the basic concepts of probability.
Indicator 3-6.1
Apply a procedure to find the range of a data set Continuum of Knowledge:
In third grade, students apply a procedure to find the range of a data set (3-6.1). This is the first time students are introduced to the concept of range of a data set. In fifth grade, students calculate the measures of central tendency (mean, median, and mode) (5-6.3) and interpret the meaning of the measures of central tendency (5-6.4) Taxonomy Level
Cognitive Dimension: Apply Knowledge Dimension: Procedural
Key Concepts
• Data
Vocabulary
• Range
Instructional Guidelines
For this indicator, it is essential
• Understand that range is the difference between the highest number and the lowest number in a set of data
for students to:
• Subtract fluently • Find the greatest and least value in a set of data • Apply a procedure to find the range of a data set such as:
Kelly made the following grades on Math Tests during the nine weeks: 90, 85, 80, 100, 75, 80, 90, 80. What is the range for this set of test scores? (A)
A 25 C 80 B 75 D 100

Data and Probability Grade Three
2
• Apply a procedure to find the range of a data set in more sophisticated problems such as:
What is the range of temperatures during the week in this dot plot? 15º
X
X X X
X X X X
60º 65º 70º 75º 80º
Temperatures
For this indicator, it is not essential
• Calculate the mean, median, and the mode. That will be dealt with in fifth grade.
for students to:
Instructional Resources and Strategies
Third grade is the first time students are introduced to the concept of range of a data set. Therefore, students will need many learning experiences on that topic. Determining range (distance between the highest and lowest data values) helps students recognize how spread out the data are. Students can use this information to make conjectures about the data.
Assessment Guidelines
The objective of this indicator is to apply, which is in the “apply procedural knowledge cell of the Revised Taxonomy. Procedural knowledge is knowledge of
”
specific steps or strategies that can be used to solve a problem. The learning progression to apply requires students to understandStudents
the concept of range. analyze
They subtract these values to determine the range. They the data (3-1.1) to determine the greatest and least value.
explain and justifyanswers (3-3.3), and
their use
mathematical language to their communicate ideas to their classmates and teacher. correct, complete, and clearly written and oral

Data and Probability Grade Three
3
Standard 3-6: The student will demonstrate through the mathematical processes an understanding of organizing, interpreting, analyzing and making predictions about data, the benefits of multiple representations of a data set, and the basic concepts of probability.
Indicator 3-6.2
Organize data in tables, bar graphs, and dot plots Continuum of Knowledge:
In first grade, students organize data in picture graphs, object graphs, bar graphs, and tables (1-6.2). In second grade, students organize data in charts, pictographs and tables (2-6.2) In third grade, students organize data in tables, bar graphs, and dot plots (3-6.2). They also interpret data in tables, bar graphs, pictographs, and dot plots (3-6.3). In fourth grade, students organize data in tables, line graphs, and bar graphs whose scale increments are greater than or equal to 1(4-6.3). They also interpret data in tables, line graphs, and bar graphs whose scale increments are greater than or equal to 1(4-6.2). Taxonomy Level
Cognitive Dimension: Analyze Knowledge Dimension: Conceptual
Key Concepts
• Bar graphs
Vocabulary
• Dot plots • Label • Scales • Title • Horizontal axis • Vertical axis

Data and Probability Grade Three
4
Instructional Guidelines
For this indicator, it is essential
• Understand that a bar graphs use bars to show data and have titles, labels, scales, and bars
for students to:
• Understand that a dot plot is a graph for displaying data, and each numerical value is represented by an x or dot placed over a horizontal number line
• Understand that data can be used to create tables, bar graphs, and dot plots • Organize data in tables, bar graphs, and dot plots such as:
Look at table below and answer the following question.
Favorite Ice Cream Flavors of 3rd
Favorite Ice Cream Flavor
Graders
Number of Students
Chocolate 4
Vanilla 5
Banana 2
Butterscotch 2
Which bar graph shows the information in the table above? B. A.
Favorite Ice Cream
Num
ber o
f
Stud
ents
B. Favorite Ice Cream
Num
ber o
f St
uden
ts

Data and Probability Grade Three
5
For this indicator, it is not essential
• Use scale increments greater than 1 at this level.
for students to:
Student Misconception /Errors
None noted
Instructional Resources and Strategies
A dot plot is made by making a horizontal line and placing an “x” or “dot” above the corresponding value on the line for every data element (ex. Color of eyes, favorite food items, etc). Every piece of data is thus shown on a dot plot. When organizing data in tables, bar graphs, and dot plots, the scale should be limited to one. Students will progress to scales greater than one in fourth grade.
Lemonade for Sale
by Stuart Murphy: Students can create a bar graph to match the data while the teacher reads the story. The students can describe what is happening with the data (more Tuesday than Monday, etc.), why it is important to increase the vertical axis by tens instead of ones, and how the bar graph informed the kids about their goal. This allows students to understand the benefits of organizing data.
Assessment Guidelines
The objective of this indicator is to organize which is in the “analyze conceptual knowledge cell of the Revised Taxonomy. Conceptual knowledge is not
”
bound by specific examples. Therefore, the student’s conceptual knowledge of organizing data in tables, bar graphs, and dot plots should be explored using a variety of examples. The learning progression to organize requires students to understand the characteristics of tables, bar graphs, and dot plots. Students analyze data and determineStudents should
how the data should be categorized or sorted. recognize
and the limitations of each type of representation (3-1.8)
usethe data. They
that understanding to select the most appropriate method for organizing explain and justify
structures, and relationships (3-3.3), and answers on the basis of mathematical properties,
useand oral mathematical language to pose questions, communicate ideas, and
correct, complete, and clearly written
extend problem situations (3-1.5) with their classmates and teacher.

Data and Probability Grade Three
6
Standard 3-6: The student will demonstrate through the mathematical processes an understanding of organizing, interpreting, analyzing and making predictions about data, the benefits of multiple representations of a data set, and the basic concepts of probability.
Indicator 3-6.3
Interpret data in tables, bar graphs, and dot plots Continuum of Knowledge:
In first grade, students organize data in picture graphs, object graphs, bar graphs, and tables (1-6.2). In second grade, students organize data in charts, pictographs and tables (2-6.2) In third grade, students organize data in tables, bar graphs, and dot plots (3-6.2). They also interpret data in tables, bar graphs, pictographs, and dot plots (3-6.3). Students also illustrate situations that show change over time as increasing (3-3.4). In fourth grade, students organize data in tables, line graphs, and bar graphs whose scale increments are greater than or equal to 1(4-6.3). They also interpret data in tables, line graphs, and bar graphs whose scale increments are greater than or equal to 1(4-6.2). Taxonomy Level
Cognitive Dimension: Understand Knowledge Dimension: Conceptual
Key Concepts
• Bar graphs
Vocabulary
• Dot plots • Key • Label • Scales • Symbols • Title • Horizontal axis • Vertical axis

Data and Probability Grade Three
7
Instructional Guidelines
For this indicator, it is essential
• Understand that a bar graphs use bars to show data and have titles, labels, scales, and bars
for students to:
• Understand that a dot plot is a graph for displaying data, and each numerical value is represented by an x or dot placed over a horizontal number line
• Understand that a pictograph is a graph that uses pictures or symbols to show data and has a title, symbols, key, and labels
• Analyze data to determine patterns • Recognize change in the data • Interpret data in tables, bar graphs, pictographs, and dot plots such as:
Use the bar graph below to answer the next question.
Which restaurant had the most votes? C. Paul’s Pizza A Big Burger B Tasty Tacos C Paul’s Pizza D Sub Shoppe
Ms. Collier’s class caught butterflies for their class butterfly farm. The
graph represents the butterflies four students caught from the farm. How many more butterflies did Ashley and Teresa catch than Rolando and James? (5)
Each represents 2 butterflies
15
10
5
0
Votes
BigBurger
TastyTacos
Paul'sPizza
SubShoppe
Favorite Restaurant

Data and Probability Grade Three
8
Student Misconceptions/Errors
None noted
Instructional Resources and Strategies
To reinforce understanding, students may examine tables and bar graphs from the newspaper or other media. Students should examine the scale, key, label, axes, title, etc…
Assessment Guidelines
The objective of this indicator is to interpret,
interpreting data in tables, bar graphs, pictographs and dot plots should be
which is in the “understand conceptual” knowledge cell of the Revised Taxonomy. Conceptual knowledge is not bound by specific examples; therefore, the student’s conceptual knowledge of
explored using a variety of examples. The learning progression to interpret requires students to understand the characteristics of each type of representation and recognize the limitations of each (3-1.8). Students analyze the representation (3-3.1) to detect changes in the data. Students generate descriptions and mathematical statements based on their observations and explain and justify
their interpretation (3-3.3) using correct, complete, and clearly written and oral mathematical language (3-1.5).

Data and Probability Grade Three
9
Standard 3-6: The student will demonstrate through the mathematical processes an understanding of organizing, interpreting, analyzing and making predictions about data, the benefits of multiple representations of a data set, and the basic concepts of probability.
Indicator 3-6.4
Analyze dot plots and bar graphs to make predictions about populations Continuum of Knowledge: In first grade, students organize data in picture graphs, object graphs, bar graphs, and tables (1-6.2). In second grade, students organize data in charts, pictographs and tables (2-6.2) In third grade, students analyze dot plots and bar graphs to make predictions about populations (3-6.4). They compare the benefits of using tables, bar graphs, and dot plots as representations of a given data set (3-6.5). Third grade students organize data in tables, bar graphs, and dot plots (3-6.2). They also interpret data in tables, bar graphs, pictographs, and dot plots (3-6.3). In fourth grade, students organize data in tables, line graphs, and bar graphs whose scale increments are greater than or equal to 1(4-6.3). They also interpret data in tables, line graphs, and bar graphs whose scale increments are greater than or equal to 1(4-6.2). Taxonomy Level
Cognitive Dimension: Analyze Knowledge Dimension: Conceptual
Key Concepts
• Bar graphs
Vocabulary
• Dot plots • Label • Scales • Table • Title • Horizontal axis • Vertical axis • Population
Instructional Guidelines
For this indicator, it is essential for students to:

Data and Probability Grade Three
10
• Understand that a bar graphs use bars to show data and have titles, labels, scales, and bars
• Understand that a dot plot is a graph for displaying data, and each numerical value is represented by an x or dot placed over a horizontal number line
• Understand that they are analyzing a representative sample • Analyze dot plots and bar graphs to make predictions about populations such
as: Here are the scores from Ken’s last six spelling tests.
X
X
X X X X
80 85 90 95 100
What is the best prediction for the score for Ken’s next spelling test? C
A. Ken is definitely going to get a 100. B. Ken will make less than an 80. C. Ken most likely make 90 or above. D. Ken will get either an 80 or 85.
Instructional Resources and Strategies
Third grade students should analyze dot plots and bar graphs to make predictions about populations. Analyzing data from a representative sample of a population allows students to make predictions about that population.
Assessment Guidelines
The objective of this indicator is to analyze, which is in the “analyze conceptual” knowledge cell of the Revised Taxonomy. Analyze conceptual break down data into its parts and determine how the parts relate to one another and to the overall structure (population); therefore, the student’s conceptual knowledge of analyzing dot plots and bar graphs to make predictions about populations should be explored using a variety of examples. The learning progression to analyze requires students to understand the characteristics of each type of representation. Students interpret the data and generate descriptions and mathematical statements about relationships they observe (3-1.4). They explain and justify their observations (3-1.3) to their classmates and their teacher. They use this information make
predictions about given populations.

Data and Probability Grade Three
11
Standard 3-6: The student will demonstrate through the mathematical processes an understanding of organizing, interpreting, analyzing and making predictions about data, the benefits of multiple representations of a data set, and the basic concepts of probability.
Indicator 3-6.5
Compare the benefits of using tables, bar graphs, and dot plots as representations of a given data set. Continuum of Knowledge: In first grade, students organize data in picture graphs, object graphs, bar graphs, and tables (1-6.2). In second grade, students organize data in charts, pictographs and tables (2-6.2) In third grade, students compare the benefits of using tables, bar graphs, and dot plots as representations of a given data set (3-6.5). Third grade students organize data in tables, bar graphs, and dot plots (3-6.2). They also interpret data in tables, bar graphs, pictographs, and dot plots (3-6.3). In fourth grade, students organize data in tables, line graphs, and bar graphs whose scale increments are greater than or equal to 1(4-6.3). They also interpret data in tables, line graphs, and bar graphs whose scale increments are greater than or equal to 1(4-6.2). Taxonomy Level
Cognitive Dimension: Understand Knowledge Dimension: Conceptual
Key Concepts
• Bar graphs
Vocabulary
• Dot plots • Label • Scales • Table • Title • Horizontal axis • Vertical axis
Instructional Guidelines
For this indicator, it is essential for students to:

Data and Probability Grade Three
12
• Understand that a bar graphs use bars to show data and have titles, labels, scales, and bars
• Understand that a dot plot is a graph for displaying data, and each numerical value is represented by an x or dot placed over a horizontal number line
• Understand that a table can be used to gather and organize data • Compare the benefits of using tables, bar graphs, and dot plots as
representations of a given data set such as: When is it better to use a bar graph than a dot plot to show data? B.
A. When showing a small amount of data B. When showing a large amount of data C. When collecting numerical data D. When showing an increase over time
Student Misconceptions/Errors
None noted
Instructional Resources and Strategies
When comparing the benefits of using different forms of representation, students should recognize that the various forms of representation give different levels of the depth of information about the data set. Therefore, students should not only deal with tables, bar graphs and dot plots they create but should examine those forms of representation in newspapers, magazine, etc. in order to experience how representation impacts interpretation and can thus be misleading.
Assessment Guidelines
The objective of this indicator is to compare,
The learning progression to compare requires students to
which is in the “understand conceptual” knowledge cell of the Revised Taxonomy. To compare means to determine relationship between and among ideas. Conceptual knowledge is not bound by specific examples; therefore, the student’s understanding of the benefits of each representation should be explored using a variety of examples.
understandcharacteristics of each type of representations. Students should
the use
understanding to that
create different representations of the same data and discussadvantages and/or disadvantages of using one representation over another.
the
Students generatebetween and among the representations (3-1.4) and
descriptions and mathematical statements about relationships recognize
each representation (3-1.8). They the limitations of
explain and justifymathematical properties, structures, and relationships (3-3.3), and
answers on the basis of use
complete, and clearly written and oral mathematical language to pose correct,
questions, communicate ideas, and extend problem situations (3-1.5) with their classmates and teacher.

Data and Probability Grade Three
13
Standard 3-6: The student will demonstrate through the mathematical processes an understanding of organizing, interpreting, analyzing and making predictions about data, the benefits of multiple representations of a data set, and the basic concepts of probability.
Indicator 3-6.6
Predict on the basis of data whether events are likely, unlikely, certain, or impossible to occur. Continuum of Knowledge:
In first grade, students predict on the basis of data whether events are likely or unlikely to occur (1-6.4). In second grade, students predict on the basis of data whether events are more likely or less likely to occur (2-6.4)
In third grade, students predict on the basis of data whether events are likely, unlikely, certain, or impossible to occur (3-6.6). Third grade students also understand when the probability of an event is 0 or 1(3-6.7). In fourth grade, students predict on the basis of data whether events are likely, equally likely, unlikely, certain, or impossible to occur (4-6.6), and analyze possible outcomes for a simple event (4-6.7). In fifth grade, students represent the probability of a single-stage event in words and fractions (5-6.1) and conclude why the sum of the probabilities of the outcomes of an experiment must equal 1(5- 6.6). Taxonomy Level
Cognitive Dimension: Understand Knowledge Dimension: Conceptual
Key Concepts
• Certain
Vocabulary
• Event • Experiment • Likely • Impossible • Predict • Probability • Unlikely

Data and Probability Grade Three
14
Instructional Guidelines
For this indicator, it is essential
• Understand that probability is the chance that a given event will occur
for students to:
• Understand that an event is something that might happen • Understand that an outcome is a possible result of an experiment • Understand that an event that is likely has a good chance of happening • Understand that an event that is unlikely does not have a good chance of
happening • Understand that an event that is impossible will never happen • Understand that an event that is certain will always happen • Predict on the basis of data whether events are likely, unlikely, certain, or
impossible to occur such as:
Kim has 5 cards face-down on a table. She is going to pick one card.
What is the probability that she will select a card with a 3 on it? Certain
• Predict on the basis of data whether events are likely, unlikely, certain, or impossible to occur to solve increasingly more sophisticated problems such as:
Create an event where you are likely to choose a heart:
For this indicator, it is not essential
• Predict events that are equally likely to occur.
for students to:
Student Misconceptions/Errors
Students generally have difficulty grasping the concepts of likely and unlikely.
Instructional Resources and Strategies
Third grade students generally grasp the concept of certain and impossible quickly, but have trouble understanding the difference between likely and unlikely. Therefore, when introducing the four terms, begin with outcomes that are certain
3 3 3 3 3

Data and Probability Grade Three
15
(the sun will rise everyday, I will pull a piece of gum out of a package of bubble gum) or impossible (pigs will fly, I will pull a piece of candy out of a package of bubble gum). Afterwards, the focus should move toward outcomes that are likely (I will eat sometime today, I will pull out a green marble out of my pocket filled with nine green and two yellow marbles) and unlikely (It will snow in July in South Carolina, I will pull out a yellow marble out of my pocket filled with nine green and two yellow marbles).
Assessment Guidelines
The objective of this indicator is to predict, which is in the “understand conceptual” knowledge cell of the Revised Taxonomy. To predict is to draw conclusions from presented information. Conceptual knowledge is not bound by specific examples; therefore, students use a variety of examples to make predications. The learning progression to predict requires students to recall the meaning of likely, unlikely, certain, and impossible. Students explore teacher generated examples and construct arguments (3-1.2) about whether the event is likely, unlikely, certain or impossible. They explain and justify their arguments (3-1.3) with their classmates and their teacher. Students generalize connections among examples of each event and deepen their conceptual understanding by generating examples of events that are likely, unlikely, certain or impossible. Students use
correct, complete, and clearly written and oral mathematical language to explain and justify their examples.

Data and Probability Grade Three
16
Standard 3-6: The student will demonstrate through the mathematical processes an understanding of organizing, interpreting, analyzing and making predictions about data, the benefits of multiple representations of a data set, and the basic concepts of probability.
Indicator 3-6.7
Understand when the probability of an event is 0 or 1. Continuum of Knowledge:
In first grade, students predict on the basis of data whether events are likely or unlikely to occur (1-6.4). In second grade, students predict on the basis of data whether events are more likely or less likely to occur (2-6.4)
In third grade, students understand when the probability of an event is 0 or 1(3- 6.7). Third grade students also predict on the basis of data whether events are likely, unlikely, certain, or impossible to occur (3-6.6). In fourth grade, students predict on the basis of data whether events are likely, equally likely, unlikely, certain, or impossible to occur (4-6.6), and analyze possible outcomes for a simple event (4-6.7). In fifth grade, students represent the probability of a single-stage event in words and fractions (5-6.1) and conclude why the sum of the probabilities of the outcomes of an experiment must equal 1(5- 6.6). Taxonomy Level
Cognitive Dimension: Understand Knowledge Dimension: Conceptual
Key Concepts
• Probability
Vocabulary
• Event • Impossible • Certain
Instructional Guidelines
For this indicator, it is essential
• Understand that probability is the chance that a given event will occur
for students to:
• Recall the definition of event • Understand that an outcome is a possible result of an experiment

Data and Probability Grade Three
17
• Understand that an event with the probability of 0 is impossible to happen • Understand that an event with the probability of 1 is certain to happen • Understand when the probability of an event is 0 or 1 such as:
Which is an example of an event with a probability of 1? D. A. Tossing a coin heads up B. Rolling a 6 on a dice numbered 1-5 C. Pulling a blue sock from a drawer with white, black, and blue socks D. Pulling a red crayon from a box of red crayons
Instructional Resources and Strategies
Students need to understand when the probability of an event is 1 or 0. The requirements of this indicator mean more than simply reciting that “1 means certain” and “0 means impossible”. As the verb “Understand” implies, students should be able to explain and give examples of events that fit each probability. This is laying a foundation for their work with probability and the fact that the sum of event must be one.
Assessment Guidelines
The objective of this indicator is to understand,conceptual” knowledge cell of the Revised Taxonomy. To understand is to construct
which is in the “understand
meaning; therefore, students understanding of the concepts should go beyond rote memorization and extend to a variety of examples. The learning progression to understand requires students to recall the characteristics of certain and impossible events. Students connect 0 and 1 with their understanding of these events. Students analyze a variety of problems situations and generalize connections among characteristics of each problem. They use this understanding to find examples of events that have a probability of 0 or 1. They explain and justify their examples (3-1.3) using
correct, complete, and clearly written and oral mathematical language (3-1.5).