
INDIA’S VOCATIONAL EDUCATION CAPACITY TO...
57
Contracted Research BHP Billiton, Singapore INDIA’S VOCATIONAL EDUCATION CAPACITY TO SUPPORT THE ANTICIPATED ECONOMIC GROWTH Queensland University for Technology Lead Researcher: Prof. Hitendra Pillay Research Assistant: Dr. Abraham Ninan APRIL 2014
-
Upload
vuongxuyen -
Category
Documents
-
view
222 -
download
2
Transcript of INDIA’S VOCATIONAL EDUCATION CAPACITY TO...

Contracted Research BHP Billiton, Singapore
INDIA’S VOCATIONAL EDUCATION CAPACITY TO SUPPORT THE ANTICIPATED ECONOMIC GROWTH
Queensland University for Technology Lead Researcher: Prof. Hitendra Pillay Research Assistant: Dr. Abraham Ninan APRIL 2014

2

3
Table of Contents
LIST OF ACRONYNMS ........................................................................................................ 4
SECTION ONE: THE INDIAN ECONOMY AND ITS LABOUR DEMANDS .................................. 5 Overview of the Indian economy today ................................................................................................................... 5 Indian Economy and skilled employment situation ........................................................................................... 8
SECTION TWO: INDIA’S EDUCATION AND VOCATIONAL TRAINING – WHERE IS IT TODAY? 11 General Education trends as inputs to vocational education and training ............................................. 11 Quality of Education as foundational requirement for a robust labor force- ........................................ 13 School dropouts before secondary education ..................................................................................................... 14
SECTION THREE: VOCATIONAL EDUCATION PERFORMANCE BENCHMARKS FOR INDIA..... 16 Comparing secondary school vocational education to international benchmarks ............................. 16 Lack of appreciation of the role of VET in national economic development .......................................... 17
SECTION FOUR: REALIGNING INDIAN VOCATIONAL EDUCATION FROM AGRICULTURE TO AN INDUSTRIALISED ECONOMY ...................................................................................... 19 Industry specific demand for rapid expansion of quality vocational education................................... 21 Industry and Service sectors ...................................................................................................................................... 23 Lack of formal skill training to meet the demand .............................................................................................. 24
SECTION FIVE: INDIA’s RESPONSE TO VOCATIONAL EDUCATION DEMAND....................... 27 The National Skill Development Corporation ..................................................................................................... 27 Benchmarking with International Standard ........................................................................................................ 32 Appropriate Remuneration can Incentivise Participation in the VET ...................................................... 35 The Skills Gap Challenge .............................................................................................................................................. 36
SECTION SIX: GOVERNMENT OF INDIA’S SKILL DEVELOPMENT......................................... 37
AND VOCATIONAL TRAINING ORGANISATION REFORM ................................................... 37 The National Vocational Educational Qualification Framework ................................................................. 40 Skill Sector Councils ....................................................................................................................................................... 40 Regional Imbalances ...................................................................................................................................................... 41
SECTION SEVEN: TRACKING VOCATIONAL EDUCATION REFORM TO TRANSFORM THE INDIAN ECONOMY TO AN INDUSTRIALISED ECONOMY: A MONITORING FRAMEWORK ... 42 Secondary Education Drivers to Support Industrialisation of the Indian Economy ........................... 42 Vocational Education Drivers to Support Industrialisation of the Indian Economy ........................... 43
REFERENCES ................................................................................................................... 47
APPENDIX ....................................................................................................................... 50

4
LIST OF ACRONYNMS
ADB Asian Development Bank ASER Annual Status of Education Report ATI Advanced Training Institutes BFSI Banking and Financial Services Industry BRICS Brazil, Russia, India, China and South Africa BVTEC The Bureau of Vocational Education and Training Collaboration CAGR Compounded Annual Growth Rate CIDC Construction Industry Development Council CII Confederation of Indian Industry CIRM Central Industrial Relations Machinery CoE Centre of Excellence CPD Continuous Professional Development DGE&T Directorate General of Employment & Training, Govt. of India FICCI Federation of Indian Chambers of Commerce and Industry GDP Gross Domestic Product IDFC Infrastructure Development Finance Company, India ILO International Labor Organisation IL & FS Infrastructure Leasing and Financial Services Limited, India IMC Institute Management Committee IMP Instructional Media Packagers ITC Industrial Training Centre ITI Industrial Training Institute ITW Instructor Training Wings LFPR The Labor Force Participation Rate MOLE Ministry of Labour & Employment NASSCOM National Association of Software and Services Companies NBFC Non Banking Finance Companies NSDB National Skill Development Board NSDC National Skill Development Corporation NSSO National Sample Survey Organisation, Govt. of India NVEQF National Vocational Education Qualification Framework NVETF National Vocational Education and Training Framework OECD Organisation for Economic Cooperation and Development PISA Programme for International Student Assessment RPL Recognition of Prior Learning SC Scheduled Castes SSC Sector Skill Councils ST Scheduled Tribes UKISF United Kingdom India Skills Forum UT Union Territory VET Vocational Education and Training VTI Vocational Training Institute WB World Bank

5
SECTION ONE: THE INDIAN ECONOMY AND ITS LABOUR DEMANDS
Overview of the Indian economy today
The buoyancy that the Indian economy experienced between 2000 and 2010, in spite of the global downturn of 2008, is no longer a reality. Growth projections for 2012-13 have been reassessed to 6.5 per cent. This is still higher than most other developed economies of the world (see Figure 1.1), however the growth rate is slowing. The World Bank in its recent forecasts1 expects India’s growth rates not to extend beyond 7.2 % and 7.4 % in the years 2013-14 and 2014-15, respectively. Similarly, the Planning Commission has scaled down the growth target for the 12th Five Year Plan (2012-17) from 9% to 8%. Different reports note different rates, but the consistent message is that the projection of India’s economy is on a downward trend. Figure 1.1 Economic growth rates for India
These projected growth rate figures, though lower than before, are still way ahead of the rest of the world, barring China. Although the projected growth rates are still higher than global rates (see Figure 1.2), there is no room for complacency, because if these growth rates continue to slow they will seriously curb the economy's potential to generate increased employment opportunities, which remains the pre-requisite2 for achieving faster and more inclusive growth 3.
1 The World Bank. (October, 2013). India Development Update, Economic Policy And Poverty Team, South Asia Region. 2 Government of India, Ministry of Labour and Emploment. (2012). Quarterly Newsletter, Volume 2, Numbers 1 and 2. 3 Lai. R.Z., Maturu, N., Stamberger, E., Stephens, N & Sze, P. (2011). Vocational Education and Training in China, Gerald R Ford of Public Policy, University of Michigan, U.S.A.

6
Figure 1.24 Economic growth of BRIC countries
As indicated in Figure 1.2, China was always ahead of India, but since 2011 Indonesia has also out preformed India in economic growth. An analysis of sector-wise economic growth trajectories was examined by the Indian Central Statistics Office (see Figure 1.3). This analysis suggests that, with the exception of the utilities sector (gas, electricity and water supply) and community personal and social services, growth in all other sectors will drop in line with the overall economic growth forecast. The anticipated growth in the utilities is approximately 4.9%, whereas the largest decline is in the mining and quarrying sector, which is 5.9%. It is also interesting to note that the agriculture sector growth is slowing at a rate of 4.2%, whereas construction; trade, hotels, transport and communication; and finance and business, are all slowing at half the rate of the agriculture sector. The anomaly in this analysis is the manufacturing sector, which has taken a serious hit and slowed by 5.1 %. This is surprising given that high-end manufacturing such as turbines and large heavy engineering has grown during the same period.
4 The World Bank. (2014). Data Table GDP Growth (Annual%). Retrieved from: Http://Data.Worldbank.Org/Indicator/NY.GDP.MKTP.KD.ZG

7
Figure 1.3 Sector wise GDP growth
The World Bank5 reports, that since the economic boom of the last decade a growth in wealth creation occurred without a corresponding increase in employment creation. The NSSO report6 highlights the need to move towards a situation where increased employment can become part of an inclusive growth strategy in itself. In order to make employment a growth strategy the Government of India need to seriously consider the following issues—not just give “lip-service”.
1. Develop capacity to adopt and engage with a data lead policy and strategy formulation rather than lobby-group driven (which can lead to favoritism and nepotism). This will require capacity to develop informative and reliable mechanisms for collection and compilation of employment/unemployment data on an annual basis , giving due emphasis to skills, productivity and earnings—creating a transparent and credible Labor Market Information System accessible to private and public stakeholders.
2. Increased and more targeted investment in social sectors, like quality and relevance of education and not just access to improve the quality of life, and better paying employment which will support greater reliance on creating new productive employment for sustained poverty reduction rather than short term employment for alleviation of current poverty.
3. Assigning a greater role to States in implementing active labor market policies. In this perspective, labor market policies need to be seen as instruments of employment promotion - both of the wage and self-employment categories - improving the human capital content of the labor force, raising productivity and use of technologies towards that end, ensuring decent working conditions, employment security and creating a safe and health work environment.
5 The World Bank. (2012, December). Report, Special Focus: Creating Jobs, Edition No. 7 6 Government of India, Ministry Of Statistics And Programme Implementation, Reports and Publications. (2012). National Sample Survey Organisation Survey Report.

8
4. Implementing well-focused policy as well as programs for the development of private sector training enterprises ensuring access to input, credit, technology, business services and markets.
5. Adopt an inclusive agenda to engage the currently under-utilized sections of the population—focus on inclusion of youth, women and vulnerable groups with their specific needs of training and skill development.
6. Exploring possibilities of securing additional jobs in the service sectors, increased investment to mechanize and enhance the performance of the agriculture sector and increased productivity and linking of trade and investment policy with employment
Indian Economy and skilled employment situation
India’s large population can be viewed as a resource rather than a constraint for growth. T Through education and the creation of sustainable employment opportunities, the demographic bulge around the 15-35 years age group can translate into a demographic dividend, depending on the ability to develop this human resource into a productive quality workforce through investment in education and creation of sustainable employment opportunities. The 3rd Annual Report by MOLE, Government of India7 identifies that the year 2011-12 saw the unfolding of many new challenges in the global economic environment. As noted earlier, one of the challenges is to use employment creation as a strategy to sustain the current levels of inclusive economic growth. Figure 1.4 Labor Force participation rates LFPR analysis by age and gender cohorts
Figure 1.4 shows that the Labor Force Participation Rate (LFPR) has declined for the age group 15-34 years8, from 79.6% among males and 40.5% among females in 2004-05 to 72.9% and 29% respectively in 2009-10. Collectively, the decline in LFPR is about 11% and most of this is drop is in female participation.
7 Government of India, Ministry Of Labour And Employment. (2012). Third Annual Report To People On Employment.
8 Defined by NSSO as the Youth Cohort with potential for future Workforce.

9
Unfortunately, the sector classifications used by NSSO for its Labor Force Participation Rate analysis and the Indian Central Statistics office do not fully align. Figure 1.5 for LFPR analysis of the youth cohort by sector
Nevertheless, the classifications that do match provide interesting correlations; the utility sector9 that has the highest projected GDP growth, also has the biggest increase in LFPR. The biggest decline in LFPR is in the agriculture sector, which also had the second highest decline in projected economic performance. The community social and personnel services activity sector declined marginally in LFPR, but was projected to grow by 1.3%. The current LFPR analysis needs to be disaggregated so the employment growth areas may be better monitored and supported. This is particularly relevant given the size of each of the currently aggregated sectors in the country. In the above NSSO analysis and supported by the World Bank (2013) reports10, India’s manufacturing sector, a sector which tends to create large employment opportunities, remains underdeveloped and has grown more slowly than expected. Accounting for just 15 percent of GDP, which is very small compared with that of the other BRICS. In comparison, China’s manufacturing sector accounts for 34 percent of that nation’s GDP. Under the Government of India’s (GOI) 11th Plan, annual manufacturing growth was only 7.7 percent, far below the target of 11 percent. Inadequate infrastructure, which disproportionately penalize small- and medium-scale enterprises, is one of the main constraints to growth in the sector.
9
In the NSSO classification construction is added to the utilities sector
10 The World Bank. (2012, December). Report, Special Focus: Creating Jobs, Edition No. 7

10
The size distribution of manufacturing firms in India is characterized by missing Small Medium Enterprises (SME) that, in most developing countries, account for a significant share of wage employment. Whereas large firms can internalize the costs of dedicated infrastructure and human resource development, small and medium-size firms have no access to the financing that would make it possible to develop their own dedicated infrastructure and programs for human resource development colleges. The scale of their operations does not make it economically feasible. Outdated labor laws in the sector, inadequate access to land, and a dearth of skilled workers all have contributed to slow growth in the manufacturing sector. Further, the manufacturing entities that are trapped in the informal sector have difficulty raising finance and attracting qualified employees. This forms a viscous cycle that constrains productivity. The plethora of necessary forms, licenses, inspections, and clearances also hinders the growth of small and medium-size enterprises. Removing such impediments could be a key driver to India’s economic growth and an important source of jobs. Korea serves as an example of turning around its economy based on its manufacturing sector and now China is doing the same. Literature indicates that poor quality education is a key factor in India’s slow economic growth.

11
SECTION TWO: INDIA’S EDUCATION AND VOCATIONAL TRAINING – WHERE IS IT TODAY?
General Education trends as inputs to vocational education and training
The World Bank report (2013) indicates that education remains an area of concern, particularly the poor quality of elementary education, which lays a weak academic foundation and makes it difficult for students to cope at higher levels. This in turn has a direct effect on the quality of human resources available to develop and sustain economic growth. The current education sector structure, with the vocational education embedded within, is illustrated in Figure 2.1. Figure 2.1 Academic, Technical and Vocational parallel training structure/system in India-a flowchart
Figure 2.1 shows the supply of potential candidates to the vocational education section starts from lower secondary as students proceed to enroll in either the secondary VET program or exit the education system and engage in informal employment. The formal vocational education training system of India starts from grade eight. According to a report from the ILO, the quality of DGE&T’s skills development programs compete with other programs, such as high vocational schools (10 plus 2 stream), colleges, polytechnics, etc. The share of ITI-based training seems to capture around 10-12% of the total number of school students who exit the school education system at grade 10 level.

12
The tables in Appendix 1 show that the biggest dropout in the schooling system is during the transition from primary to lower secondary school grades, accounting for almost 50% attrition of enrolment across the country. Appendix 1 contains a series of class enrolment across grades 1 to 10. The figures indicate that while the enrolment from grades 1 to 10 is 212,748,064, the enrolment of students between grades 9 and 10 combined is only 101,440,471 accounting for about a 47.68% dropout rate between grade 1 and grade 10. It is unclear where these dropout students end up. Some reports state that the dropout students join the informal workforce, but given the paucity of data and/or reports on the informal training and employment it is difficult to comment. Given that the supply of potential candidates into the vocational education system started around lower secondary this report will concentrate on the flow-on effect of the education system from this level and will only refer to primary education when there is a direct link to the supply of candidates to the vocational education and training. After modeling various scenarios the best-case scenario would be for grades 8 to 9 to improve their annual enrolment attrition rate to 7.60%, grades 9 to 10 to 5%, grades 10 to 11 to 5% and grades 11 to 12 to 7.39%. If this occurred, the supply of potential candidates for VET training, to meet the project demand by 2022, could be achieved. These attrition figures are annual year on year until 2022. These attrition figures are achievable by either increasing the enrolment rate and/or decreasing the attrition rate. If the above attrition target at achieved then the top 10 States for assuring supply chain when rank ordered to target VET training are as follows:
1st West Bengal, 2nd Madhya Pradesh, 3rd Maharashtra, 4th Bihar, 5th Tamil Nadu, 6th Karnataka, 7th Gujarat, 8th Orissa, 9th Assam and 10th Jharkhand.
The above projection assumes all students in respective grades will go to the VET sector. We know that this is not the case; only about 10% of secondary students enroll in the formal VET program. If we include this variable, then the projections become meaningless due to the enormity of the challenge. The above analysis provides a snap shot of the supply side requirement if NSDC is to meet its projected demands. The above attrition analysis also does not take into consideration any attrition that may occur with the VET program therefore caution must be exercised when interpreting the modeling. Comparing the secondary enrolment rates of other similar economies shows that Indian enrolment is above Bangladesh and just below that of Malaysia. Other countries like China, Indonesia and Brazil are well above the Indian secondary enrolment rate--see Figure 2.2. The World Bank (2013) notes in its report on the massive shortage of skilled labor in India, that the bottleneck in the system may be at the secondary school level. Less than 10 percent of the working population has completed secondary education or above.

13
Figure 2.2: Secondary School enrolment data for selected Asian countries and Brazil.
Source: World Bank, 2012. The data is Gross Enrolment Rates.
Quality of Education as foundational requirement for a robust labor force-
Human resource development, and in particular poor skills development is associated with early declines in Indian schooling. The ASER (2013)11 reports that in 2008, the proportion of children in grade 3 who could read a grade 1 text was under 50%, which had dropped by about 16 percentage points to 34%. The report notes that barring three States (Andhra Pradesh, Karnataka and Kerala), every major state shows signs of a substantial drop in arithmetic learning levels12. This has serious implications for the students who come through to lower secondary and then progress to vocational education. While access to primary education may have improved in India, the quality and performance of the primary school sub-sector has declined. According to the ASER analysis, Kerala is the only State in the country that has shown an improvement in arithmetic. Unfortunately India does not participate in PISA or TIMMS international testing therefore international bench marking is not possible. However, India did a one-off participation in a PISA trial in 2009 where 2 better performing States, Tamil Nadu and Himachal Pradesh were involved13. India performed abysmally indicating huge room for improvement. The response for the Indian government regarding how to improve the quality of its education system has been very slow and is still very unclear.
11 Pratham Education Foundation, New Delhi, India. Annual Status of Education Report. (2012). 12 Comparing the cohort of children who were in government schools in Std. V in 2011 with the cohort in Std. V in 2012, there is evidence of a more than 10 percentage point drop in the ability to do basic subtraction in almost all states. Exceptions are Bihar, Assam and Tamil Nadu where the drop is less; and Andhra Pradesh, Karnataka and Kerala where there has been either improvement or no change from 2011. 13 Reuters U.S.A. (2011, December 15). ACER Releases Tamil Nadu India Results of PISA 2009+ Participant Economies. Retrieved from: http://www.reuters.com/article/2011/12/15/idUS242972+15-Dec-2011+BW20111215
14
As noted by Hanushek and Wossmann (2010) there is a strong correlation between students’ academic performance in basic education and national economic growth. Improving the quality of basic education (elementary education in India) is pivotal to preparing an appropriate workforce to sustain Indian economic growth. Considering the PISA examination scores14, countries like Brazil, Indonesia, Mexico, and Thailand fall around a low 400 score. An aggressive education reform plan would typically seek to close half the gap with the average OECD15 countries, an improvement of half a standard deviation. As noted by the World Bank, achieving the change of 0.5 standard deviations for an entire nation, particularly one as complex and diverse as India, may take 20 to 30 years—time which India cannot afford. To achieve this change, the World Bank also suggests an equivalent of 3.5% GDP allocation to the education sector. India seems to be already doing this, but still lags behind in education sector performance and quality improvement. To date, India’s education reform initiatives have placed all emphasis on access and equity and seem to have neglected quality. This is unlike countries like Indonesia and Korea which have adopted a two-pronged approach to deal with both access and equity, and quality simultaneously. Faster reforms, which have larger impacts on the economy, are possible. This is because the better workers become a dominant part of the workforce sooner—a case in point is countries like Korea and to some extend China. As illustrated in Figure 3.3, Korea invests significantly in its general education and VET sector and as a result enjoys the enviable position of becoming one of the world’s leading manufacturing countries within a very short time.
School dropouts before secondary education
The dropout problem is pervasive in the Indian education system. Many children, who enter school are unable to complete secondary education. The 2008/9 data16 illustrates the progressive decline in enrolment from 87.04% in primary to 73.79% in lower secondary to 65.62% in secondary/ higher secondary. This suggests that almost 38.4% of the students are out of school by the time they are 16-18 years old. This is accounting for only those who were enrolled in the system, but there are others who have never enrolled. Therefore the exact number of students out of schools, who are approximately 14-18 years, might be higher. Multiple factors are responsible for children dropping out of school. Risk factors begin17 to add up even before students enroll in school. These include poverty, low educational level of parents, the weak family structure, pattern of schooling of sibling, and opportunity costs. Family background and domestic problems create an environment, which negatively affects the value of education. Studies18 have indicated that family background such as low socio-economic and educational status of the parents is significantly correlated
14 The World Bank. (2007, April). Education Quality And Economic Growth. 15
OECD. (2006). Measuring The Effects Of Education On Health And Civic Engagement: Proceedings Of The Copenhagen Symposium, Copenhagen, Denmark. 16 Mehta, A.C. ( 2012). Elementary Education In India: Analytical Table 2008-2009. National University Of Educational Planning And Administration, Government Of India, New Delhi. 17
Sunita Chugh (2011). Dropout in Secondary Education: A Study of Children Living in Slums of Delhi, New Delhi: NUEPA 18 Robert, O.E.D. (2011, April). Parents’ Socio-Economic Status And Pupils Education Attainment In Malaba Town Council, Africa. Retrieved from: http://www.academia.edu/552340/Parents_socio-economic_status_and_pupils_education_attainment_in_selected_primary_schools

15
with the phenomenon of dropping out (vicious cycle of poverty) with about one fifth of the sample children dropping out due to financial constraints. For those who do not proceed beyond lower secondary education there is very little data on if and how they get any VET training. It is suggested that they tend to get absorbed in the non-formal VET programs. Completing secondary education does not guarantee access to a high paying job; it represents a promise of greater access to further opportunities and is fast becoming a prerequisite to remain employable and re-trainable; highly valued qualities in today’s labor market. Considering the transition rates from primary to lower secondary and then to secondary noted above, it represents a huge loss to the potential pool of human resources in the country. This makes a strong case in favor of investing more resources to tackle this issue of dropouts and increasing enrolment in lower secondary education and following through to higher secondary education. These investments must be part of an integral approach to education policies, combining supply and demand measures, and providing clear pathways for school to work transition.

16
SECTION THREE: VOCATIONAL EDUCATION PERFORMANCE BENCHMARKS FOR INDIA
Comparing secondary school vocational education to international benchmarks
An Ernst & Young report19 indicates that vocational education and training in India suffers from a poor perception vis- -vis mainstream higher education programs. This is marred by a lack of pathways between VET and mainstream education. Due to the perceived difference in potential job opportunities, status and wages students in grade 11 and grade 12 typically want to proceed to further education rather than undertake vocational training. Only 3% of students in upper secondary schools (grades 11 &12) enroll in secondary school vocational education programs. Currently there are 6 800 upper secondary schools in the country offering 100 VET subjects that provide orientation to selected jobs. Whilst there are places for 400 000 students in these subjects, currently only 40% of these places are filled—presenting a very inefficient system and illustrating the effect of the poor perception of the VET sector. Figure 3.1 Demand for education as a factor of public perception
Figure 3.1 puts this in international perspective when comparing the percentage of workforce in India receiving VET training in secondary schools. Russia, China, Chile and Korea have ten times more secondary students taking VET subjects and all these countries have a robust and qualified workforce. Through this over-emphasis on university graduates as the desired outcome of the education sector, India has neglected the opportunity to develop
19
Ernst & Young, India. (2009). Making the Indian Higher Education System Future Ready. Federation of Indian Chambers of Commerce and Industry Higher Education Summit.

17
respectable VET programs with formalized pathways to vocational careers from the lower secondary level. Figure 3.2 provides a summary of secondary students enrolled in VET programs in Australia by state. In 2012, approximately 35% of the students in grade 11 and 12 were enrolled in some type of VET subject. There are 20 different VET areas in which students may enroll and for a small country like Australia 252 600 students enrolled in the VET programs presents a very healthy prospect for the VET sector. Perhaps a significant difference between the Australian and the Indian VET schools program is that in Australia, VET subjects earn full credits toward either the VET or the academic pathway lifting the status for the VET in school subjects. If one chooses the VET pathway, they can achieve high levels of competencies and become team leaders or supervisors—there is a career pathway. The restructure of the VET programs in the ITI and ITC needs to be cognizant of this new approach to avoid reinforcing the poor perception of VET as a dead end career.
Figure 3.2: Number of VET in school students by age group and state or territory, 2012 (’000)
NSW Vic. QLD SA WA Tas.3 NT5 ACT6 Australia
14 years and under 0.2 1.0 6.4 0.1 0.2 0.0 0.1 0.0 8.1
15 to 19 years 60.9 48.4 83.3 11.6 24.6 7.0 1.6 4.9 242.3 20 years and over 0.7 0.5 0.2 0.5 0.1 0.3 0.0 0.0 2.1
Not known
-
- 0.0
-
- 0.0
-
- 0.0
Total 61.8 49.8 89.9 12.2 24.9 7.3 1.8 4.9 252.6
Source: National VET in Schools. NCVER 2013, Australian vocational education and training statistics: VET in Schools 2012 data tables Queensland, NCVER, Adelaide. Collection, 2012 As can be seen from the above discussions, the share of VET in secondary education enrolment in India is much lower compared to other comparable countries. Underutilization of VET capacity at the secondary school level is indicative of the clear preference for formal academic education over vocational training and a serious policy failure. The neglect of the VET sector and better quality of investment (physical and human resources) as well as higher recognition and acceptability of mainstream education are cited as primary reasons for this perception divide. It is also widely regarded that Government resources have not been adequately channeled towards supporting the VET sector and providing information about the availability and effectiveness of various training programs. Lack of appreciation of the role of VET in national economic development
The academic elitist policy of the Indian education system treats the vocational education sector as a ‘second grade” option20. Figure 3.3 below illustrates the impact of the low perception of VET careers in India compared to other countries and the consequent low
20 Unlike other countries such as USA, UK and Australia, in India, the vocational and higher education sectors are almost completely segregated with little mobility from the vocational to the higher education sector. Thus students face barriers while transferring between the two sectors. Many countries have an easy transfer from vocational to academic stream. In the US, community colleges award associate degrees, after which students can transfer to a university. In the UK, the Higher National Diplomas (HND) offered by polytechnics get full credit towards a bachelor’s degree. Similarly, in Australia one can readily progress from the TAFE system to University programs. Globally, governments are seeing merit in simplifying the regulatory structure, involving the industry and granting greater autonomy to public VET institutes as well as increasing relevance of training and providing support to specific sectors.
18
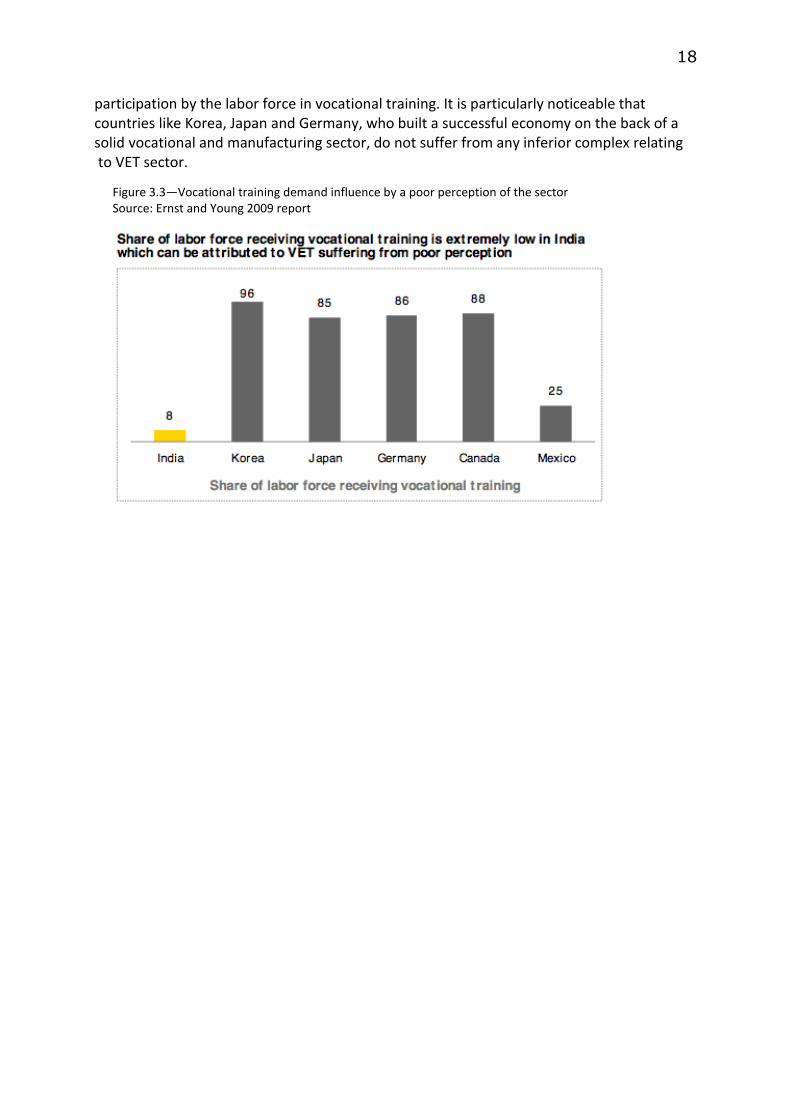
participation by the labor force in vocational training. It is particularly noticeable that countries like Korea, Japan and Germany, who built a successful economy on the back of a solid vocational and manufacturing sector, do not suffer from any inferior complex relating to VET sector.
Figure 3.3—Vocational training demand influence by a poor perception of the sector Source: Ernst and Young 2009 report

19
SECTION FOUR: REALIGNING INDIAN VOCATIONAL EDUCATION FROM AGRICULTURE TO AN INDUSTRIALISED ECONOMY
Realignment of the Employment demand The Institute of South Asian Studies Special Report21 indicates that structural changes in the Indian economy have precipitated changes in the patterns of demand for industrial labor. Recent trends in the composition of employment indicate that the Indian workforce is migrating from the agriculture sector to the industry-and-services sectors. This is a key pre-requisite for India to become an industrialized economy and sustain the current high level economic growth. Similarly, the ILO22 report captures India’s position in transforming itself into an industrialized economy and also notes that India has to transform its labor intensive agriculture sector into a highly mechanized sector and reallocate its development focus to industry and service sectors. Further, it has to actively support the growth in new-age industries such as communication and technology and the service sectors, with a shift away from the traditional, low productivity, employing large numbers of low skilled labor (agricultural sector) to highly productive industrial and/or service sectors which require a skilled workforce. A summary of the Vision 2020 and progressive adjustments to meet the target is presented in Figure 4.1 below. Figure 4.1: Indian Workforce: Past, Present and Future
21 Srinivasan, S., Institute of South Asian Studies and National University of Singapore. (2013, July 11). ISAS Special Report. Skill Development Initiatives in India. 22 International Labour Office (ILO), Geneva. (2010, November). G20, A Skilled Workforce for Strong, Sustainable and Balanced Growth. Retrieved from: http://www.oecd.org/g20/topics/employment-and-social-policy/G20-Skills-Strategy.pdf

20
However, correlating the above Vision 2020 projection, which was developed in 2002, with the ILO 2012 employment analysis, shows that India still has the agricultural sector as the major source of employment. The employment by the Industry sector is just above South East Asian countries. The interesting feature of the ILO study is that the Indian Service sector has the lowest employment among all the regions including South Asia (Figure 4.2) despite a growing large middle class in the country with more disposable income. Despite adopting the Indian Government’s Planning Commission’s Vision 2020 in 2002 the readjustment of employment opportunities among the three sectorial classifications noted by the ILO and the Planning Commission, has been very slow. Figure 4.2 International comparison of employment by sector
Vocational Training Demand Forecast for VET Planning McKinsey Global Institute (2012)23 identified forces of demand and supply that are shaping a global labor force and suggest that it will grow to 3.5 billion by 2030. In India and younger developing countries, there could be as many as 58 million surplus low skilled workers in 2020. These include employment in agriculture, traditional crafts and some low-level manufacturing. The report also notes that there will be a shortage of 45 million mid-level skilled workers in developing economies. As noted earlier in this report, because of low rates of high school enrolment and completion, India alone could have 13 million too few such skilled workers; younger developing economies could have 31 million too few skilled workers. The report also notes that industrialization will raise demand for workers with secondary education and vocational training in India and the developing economies of South Asia and Africa. Hence, there is a need to urgently reform the secondary education and the VET sector.
23 McKinsey Global Institute, McKinsey & Company.(2012, June). The World At Work: Jobs, Pay, And Skills For 3.5 Billion People.

21
A FICCI study24 states that India is one of the top countries globally struggling to supply suitably trained workers. This is ironic given that the potential supply of workers is so huge. The difficulty to fill up the jobs in India is 48%, which is above the global standard of 34% in 2012. The lack of available applicants, unattractive or lack of any national wage accord for VET employees, family mobility and geographic challenges, shortage of hard skills and shortage of suitable employment, are some of the key reasons why finding a suitable candidate for available jobs in the country is so difficult. The above situation is a consequence of supply-side driven planning by VET program designers which results in a mismatch between the skills acquired through the available VET program and what is required by the industry. The highly rigid and bureaucratic procedure required for changing programs of course in the VET sector and the reluctance of the old fashioned instructors to innovate and upgrade themselves ( adopt lifelong learning practices) contribute to this mismatch matter. For instance, many of the construction VET training does not provide training in essential job trades critical to construction, such as skilled construction supervisors, bar binders, concrete formworks, building plumbers and electricians, drivers and building machine operators. It was also found that all sectors are moving away from traditional methods towards higher technology platforms hence would need specialized skills across trades, such as, machine operators, welders, supervisors, technical/ engineers among others. As the industry increasingly moves towards the adoption of technology and global best practices, the need for skilled talent will also increase proportionally. This will place a huge challenge to the Indian VET sector. According to the International Labor Organization, the difficulty to fill up jobs in India is 48%, far higher than the global average of 34%. The problem is particularly acute for small and medium sized firms. This is because they require fewer employees, it is expensive for them to invest heavily in recruitment processes, and it is not feasible for them to set up captive skill-training institutes. Should the low availability of skilled labor persist, employers are likely to substitute labor with technology by automating processes. Hence, the lack of skill development will prevent inclusive growth for the economy in the long run. Figure 4.3 depicts the sectorial composition of employment across the world. India’s employment patterns mirror those in other developing regions. 52% of the total workforce is engaged in the agriculture sector. However, agriculture only accounted for 14.5% of India’s GDP in 2010-11 (ISAS Special Report, 2013). Recent trends in the composition of employment indicate that the Indian workforce is migrating from the agriculture sector to the industry-and-services sectors. This trend, as illustrated in Figures 4.3 and 4.4 below, is expected to continue over the next decade. However, for India, change is not happening fast enough. Industry specific demand for rapid expansion of quality vocational education
Figure 4.3 shows current employment by key occupational areas and Figure 4.4 shows the projected labor demand by 2022, for key occupational areas. The data in Figure 4.3 also
24 Federation of Indian Chambers of Commerce and Industry, New Delhi and Ernst & Young, India. (2012, September). Knowledge paper on skill development in India Learner First.

22
presents the difference in employment between the formal and non-formal employment, the non-formal has the larger share of the employment.
Figure 4.3: Indian employment pattern in 2010
Projections for labor demand made by the National Skill Development Corporation suggest there will be a huge gap between demand and supply. If we use Figure 4.3 data as a baseline attaining the projected numbers of trained workers by 2020, as noted in Figure 4.4 will be a very ambitious task. Further, attaining enough skilled workers will not happen by doing more of what is currently being done—it requires some very innovative thinking. Figure 4.4: Projected labor demand by 2022 by sector

23
The following section has focused on construction as an industry area to provide detailed analysis of the issues confronting the industry in recruiting suitably trained workers. According to NSDC’s analysis, the Indian construction sector employs more than a 44.28 million workforce, only for blue collared jobs. Out of this, about 80% or 32 million of the workforce are employed within the infrastructure construction sector alone. The industry is highly disorganized and unregulated with ad-hoc sourcing of manpower, and ad hoc training techniques. NSDC reports that as per the Construction Industry Development Council (CIDC), it is estimated that only 3%-5% of the total blue collared workforce employed by the sector, has some formal training or are certified. Skills training initiatives - both public and private including the ITI (Industrial Training Institute), ITC (Industrial Training Center) and VTI (Vocational Training Institute), among others, and do not currently cater adequately to the skills demands of the construction industry. Out of 1.2 million seats25 offered by ITI / ITC 0.74 million seats are for trades that cater to the construction industry. However, these trades are not exclusive for construction and most of them like electricians, foremen and the like can be employed in the light engineering and manufacturing sectors also. As can be seen from the above data, the current, collective capacity of training institutes fall far short off the estimated demand of 32 million skilled workers needed in the construction sector. NSDC26 reports that while analyzing the demand side, apart from the current 44.28 million blue-collar workers engaged in the industry it was observed that 84.90 million of blue collared workforce would be needed by the construction related activities of the infrastructure sector only, by 2022. This includes workforce for infrastructure maintenance of existing as well as new infrastructure. The infrastructure sectors would require a 37.6 million skilled workforce (includes Skilled & semi-Skilled), for construction and maintenance in 2022 and the demand of the unskilled workforce would be approximately 49.42 million in 2022. Industry and Service sectors
Although the Indian economy is changing as it transforms from an agricultural to one of industry and service, it has been very slow. Figure 4.4 depicts the 14 subsectors of the economy that account for approximately 55% of total employment in the industry-and-services sectors. The highest demand for the services sector is expected to be generated by subsectors such as construction (real estate), transportation, hospitality and the Banking and Financial Services Industry. In the industry sector, the highest labor demand is expected to be generated by the automobile, textile and food processing and construction subsectors. However, this shift is not currently reflected in the VET investments to support the transition. The ITI and ITC programs are still focusing on traditional subjects. There is a need to not just have new programs but also suitably qualified instructors that are familiar with the required new skills in the emerging industry and service sectors. The level of formalization in a specific subsector displays a strong positive correlation with the level of skill required for performing tasks within that subsector. Sectors requiring more complex skills have a higher proportion of formal employment, as opposed to sectors that employ a
25 The Capacity of ITC and ITI’s are reported differently in different reports; caution must be exercised when using these figures. 26
Government of India. National Skills Development Corporation. (2012). Infrastructure Sector Report, Talent Projections & Skills Gap Analysis (2022)

24
high proportion of unskilled or semi-skilled labor. With the changing economic environment, the demand for better-quality products and services has given rise to huge demand for skilled labor. Since the launch of the Indian Government’s Vision 2020 the major concerns of the employers regarding the VET is summarized in Figure 4.5. As can be seen, the most significant factor is the mismatch between what is actually required at the cold face and what the training institutions can provide. This is linked to the next biggest concern, which is the curriculum content and their appropriateness to contemporary work practices. This in turn is linked to lack of vision including the importance of international benchmarking for quality and demand areas. Unfortunately, many of these concerns have not changed much in recent years, hence the malaise in the VET sector. Figure 4.5: Employers concern with the VET sector performance
Lack of formal skill training to meet the demand
The Government of India estimates, 93% of the workforce is employed in the unorganized or informal sector, which is not supported by a structured skill development system. Despite the informal sector being perhaps the larger of the two in regards to number of people employed, there is very little rigorous/evidenced base information on the informal sector. This creates difficulties in targeting the population for skill development. It is assumed that the majority of the workers are often skilled informally or on-the-job. The information channels and skilling processes in the unorganized sector are not understood and to date there is no Recognition f Prior Learning (RPL) mechanism in India that can assess and provide an equivalence of the non-formal skills to the formal programs. Furthermore, the opportunity cost of skilling, in the form of loss of employment and wages for the duration of the skill-training program, also acts as a disincentive for employers to support formal skill acquisition programs and for the employees to participate in training. More contemporary training approaches such as the formalized industry based training used in Australia and the

25
USA may provide alternatives to counter the opportunity cost dilemma. According to the Eleventh Five Year Plan;
Only 10%27 of the Indian workforce has received skill training in the form of technical or vocational training, which is very low compared to international norms.
Of the 10 %, only 2% received formal training and 8% received informal training of various types28.
Further, 80% of the entrants into the workforce do not have the opportunity for skill training.
If the Indian economy is to be developed on the back of a strong industry and service sector, the high quality specialized vocation education training will be essential. As shown in Figure 4.6, the percentage of the workforce that receives formal skill training is 68% in the United Kingdom, 75% in Germany, 80% in Japan and 96% in Korea. In India only 10 % of their workforce receives formal training, which is very low by any standards. This is despite the fact that in 2008-09, India had an annual skilling capacity of 4.3 million, against 12.8 million youth joining the workforce annually. Figure 4.6 Comparison of people receiving skills training in industrialized economies.
India’s investment in training generally and in the VET sector in particular is poor. While the whole of South Asia seems to suffering from the same reluctance to embrace training as part of the requisite for economic and social growth, when compared with selected developing countries around the world India has the third lowest participation in training, just above Pakistan and Morocco. The data in Figure 4.8, shows a comparison between Indian and other developing country firms that provide formal training for their workers. The formal training incidence with other developing countries shows that India is 3rd lowest and China and Brazil are in the top 3 countries.29 This lack of engagement with VET in India is also
27 This number varies from report to report and can range from 2% to 10 % 28 Federation of Indian Chambers of Commerce and Industry, New Delhi and Ernst & Young, India. (2012, September). Knowledge paper on skill development in India Learner First. 29 Tan And Savchenko. (2005). In-Service Training In India: Evidence From The India Firm-Level Investment Climate Survey, Word Bank Working Paper, Washington D.C.

26
reflected in Figure 3.3, which shows the secondary school level data compared to other countries with an industrialized economy. Figure 4.8 Formal training by region and by selected developing countries
The stand out example in both school VET participation and overall formal skills training participation is Korea and we know this country turned its national economy around, on the back of a manufacturing sector. The consistent lack of engagement by India with the VET sector needs to change significantly and quickly if expectations such as, transforming the Indian economy from agriculture to industrialized to materialize. Further, the notion of in-service training and continuous professional development training is also very low for the Indian workforce—see Figure 4.7. Bangladesh and Sri Lanka place more emphasis on providing formal in-service training than India. The growing garment, aquaculture, pharmaceutical and the export of skilled workforce have influenced the Bangladesh and Sri Lankan vocational education sector to recognize the need for continuous upgrading of skills in order to stay competitive. Figure 4.7 Investment in In-service training by the South Asian countries

27
SECTION FIVE: INDIA’s RESPONSE TO VOCATIONAL EDUCATION DEMAND
The National Skill Development Corporation
In response to reports from (IDFC)30 (2012), the World Bank, the FICCI and the Government of India revised its skill development strategy and launched a restructured NSDC in 2009, with a significant role for the industry stakeholders. The NSDC acts as an investment manager for the National Skills Development Fund. The idea was to have a system that enabled the government to have an oversight on VET training but delinking it from financing and managing training activities. Lessons from international practices were adopted and training were more industry lead and focused on output (demand) rather than input (supply); stressed on competencies and not specific skills; was flexible; based on periodic labor market surveys; and addressed the issues of affordability and accessibility. Other factors that contributed to the reform was consideration of the Public Private Partnership (PPP) approach with a business governance/accountability model to overcome the issues of; (i) lobby groups receiving funding based on equity and favoritism rather than on outcomes and (ii) the slow progress within the complex Indian bureaucracy and the lack of autonomy of the training providers to be responsive to the changing demands. NSDC was given the mandate to skill 150 million people by 2022 in 20 focus sectors identified by the government and the informal segment through a multi-approach model revolving around creating, funding and enabling sustainable skills training initiatives in the private space. These initiatives were to be structured as a PPP with government-ownership restricted to 49 per cent of the equity capital, majority ownership of the NSDC rests with the private sector with the shareholdings equally dispersed among 10 chambers of commerce and sector-specific industry organizations. Several key lending institutions, including the World Bank and the Asian Development Bank, are participating in the Indian skills development initiative through the NSDF. The challenge here, however, is that as a country India would have to decide how it would like to prioritize and allocate the funds. The NSDC has developed a 10-year plan and until September 2012, the NSDC Board had committed funds to 77 projects, of which 61 are pure training proposals and 16 are State Skills Council initiatives. As of August 2012, NSDC partners had trained 257 000 people across India and of these found jobs for over 194 000 of the young boys and girls who enrolled to pursue skill development courses. However, given the size of the demand, the above figures are insignificant. The above policy and strategy is commendable, but vagueness around the new initiatives still exists. For instance, it is unclear if the above (PPP) projects are in addition to the previously funded ITI and ITC programs or just a revision of the existing program with better quality due to greater involvement of the industry partners. The latter outcome is good and urgently needed but the demand for additional outcomes should not be ignored. The NSDC reports do not say how the capacity will be increased.
30 Infrastructure Development Finance Company, India

28
Public Sector supported vocational education There are two types of vocational training available in India31: a) Formal, and b) Non- Formal. Formal vocational training follows a structured training program and leads to formal qualifications recognized by State/Central Government, public and private sector employers. Most of the formal skills training happens through the Industrial Training Institutes (ITIs) and the Industrial Training Centers (ITCs), which come under the Ministry of Labor and Employment32. Non-Formal vocational training helps in acquiring some marketable expertise, which enables a person to carry out her/his ancestral trade or occupation. The agriculture sector and some traditional crafts perhaps have the highest levels of non-formal training. A NSSO report33 which was subsequently confirmed by the FICCI (2012), state that vocational training is received by only 10% of persons aged between 15-29 years. Out of this only 2% receive formal training, while non-formal training constitutes the remaining 8%. Out of the formal training received by this particular age group, only 3% are employed while they receive training—in-service or continuous professional development training. Figure 5.1 Formal vocational education and training capacity in India
31 Government of India, Ministry of Statistics and Programme Implementation, National Sample Survey Organization (NSSO). (2004). Report: Status Of Education And Vocational Training In India 2004-2005 (Report No.517, 61/10/03).

29
The major provider of formal vocational training is the public sector funded by the Central and State governments. Public sector training infrastructure is coordinated at the Central Government by the Directorate General of Employment and Training (DGET) under the Ministry of Labor. In each state, the Department of Employment and Training coordinates and implements state-level training initiatives. There are approximately 9 400 ITIs and ITCs in India with a combined capacity to train 1.3 million people. The top five States with the highest number of formal vocational education institutions are Kerala, Karnataka, Goa followed by Himachal Pradesh and Tamil Nadu. It must be cautioned that the number of institutions in a State and the number of places in each of the institutions are different issues—Figure 5.2 provides a summary of number of places available at ITI and ITC in each State. Also, since these intuitions were established well before the Indian economic boom and the desire to transform the economy to an industrialized one, it is unclear if the current VET capacity matches the current states with highest economic growth. If not then the states with the highest economic growth are those that are experiencing higher demands for skilled workforce. Such an analysis will help understand the Indian Government’s strategy for improving the supply of the skill labor force at the local State levels—whether the strategy is demand and market driven or equity based. Figure 5.2 shows the number of places available in ITC and ITI by State. The courses in ITC and ITI have a varied duration ranging from a few weeks to three years. The courses also vary in complexity from basic skills to specialized courses.
Nationally, there are about 5 114 Industrial Training Institutes (ITIs) imparting training in 57 engineering and 50 non-engineering trades.
Of these, 1 896 are State Government-run ITIs while 3 218 are private.
The total seating capacity in these ITIs is 742 000 (400 000 seats in government ITIs and the remaining 342 000 in private ITCs)34.
At the last published count by the Planning Commission of India (2010), the total number of ITIs and ITCs across India was 8 039 with a total seating capacity of 1 115 628.
A Planning Commission35 report noted that a 10% annual increase in ITI/ITC capacity is anticipated but whether this will actually be achieved or not is not known.
It may be assumed that the recent government of India led interventions have contributed to the improved capacity figures however, the inconsistency of data reported in various reports warrant caution and further investigation through actual field work. See Section Seven for projection of capacity to meet the demand by 2020. A review of the number of places available in ITI and ITC by State shows that Goa has the highest number of places followed Kerala and Gujarat States. The anomaly between the number of Institutions and the actual number of places is due to the varying sizes of the ITI and ITC. While Figure 5.2 presents the capacity of ITI and ITC, it is unclear if these are currently being fully utilized are, then the nature of the programs offered and how they fit
34
Planning Commission Report for the 11th Five Year Plan. These numbers are often reported differently. 35 National Skill Development Corporation, India. (2009). Sector Skills Reports, 2009-10.

30
with the forecasted labor force demand is unclear and should be analyzed. Currently, most of the literature report on supply side issues. Even though the Vision 2020 was adopted in 2004 there are very few report that actual talk about tangible outcomes. There is a need for more studies focusing on actual outcomes data to help better plan subsequent supply side interventions. Figure 5.2 Number of places available in ITI and ITC by State.
Partnership with Industry sector to improve quality In 1998, the Central Government recognized and acknowledged the importance of industries and particularly the private sector in the creation of a suitably trained workforce for the country’s labor force requirement—after all they are eventual employers of the graduates from these training programs. The Directorate General of Employment and Training (DGET) of the Ministry of Labor initiated a pilot program ‘Formation of Institute Managing Committee’ (IMC). The IMC were formed in collaboration with the Confederation of Indian Industry (CII) to improve cooperation between Industry and ITIs. Under the reform of the NSDC in 2007-08 the Central Government revisited this arrangement and initiated PPP arrangement with 1 396 ITI to upgrade them and make then more responsive to demand for vocational education. Under the scheme, an Institute Management Committee (IMC), headed by an industry partner, is constituted and registered as a Society. An interest-free loan of up to Rs. 2.50 crore36 is provided by the Central Government directly to the IMC, which is given financial and academic autonomy. The interest free loan is repayable by the
36 Converts to USD 408991.28 as on 25 April 2014

31
IMC with a moratorium of 10 years and thereafter in equal annual installments over a period of 20 years. During the 11th Five Year Plan (2007-08 to 2011-12), a total of 1 227 Government ITIs were supported through this PPP arrangement. This initiative also strengthened the infrastructural facilities of Advance Training Institutes (ATIs) to impart training to instructors from ITIs. The training program included courses under multi-skilling and modernization with latest tools, equipment and machinery. More than 9 000 instructors have been trained from States/Union Territories during the implementation of the project. Most reports describe and discuss input regarding the VET reform but little is said about the impact of these reforms. Related to the above reforms, the Planning Commission of India reports37 that the Government of India with assistance from multinational development agencies such as the World Bank is supporting, existing 100 ITIs to be upgraded into "Centres of Excellence (CoE)38" for producing a multi-skilled workforce of world standard. Under the scheme, multi-skilling courses are offered during the first year, followed by advanced and specialized modular courses in the second year by adopting an industry wise cluster approach. The World Bank further through the Vocational Training Improvement Project assisted upgrading of 400 ITIs throughout the country in 33 States/Union Territories and introduced the multi-skilling courses developed and implemented by the Center of Excellence. In Nine States, Instructor Training Wings were established to produce trained instructors, and development of Instructional Media Packages for 21 sectors of multi-skilling CoE courses. These claims were not verifiable but will be useful if that can be done through State level data or procurement reports. All these investments are great but what was achieved from these investments is not reported—a return on investment analysis is urgently needed before further investments in these initiatives. Private Sector Industry Initiatives for training ( non-government supported) About 75 % of India’s GDP growth comes from the private sector and, therefore, the private sector has an important role to play in setting social wrongs right [including equal opportunities to appropriately paying jobs] 39. The slow progress made by the public sector and the numerous red tape involved in securing training places for employees led the private sector into taking various initiatives on their own and some in collaboration with the government and international entities. This has led to the development of in-house training facilities to provide training to potential employees to make them job ready. Companies, such as T a t a S t e e l , Larsen & Toubro, Bharti Group, Hero Group, Maruti, Infrastructure Leasing & Finance Services Ltd. etc., have established training facilities that offer world class training programs and also create an environment for adopting e-learning and other innovation40. Since the majority of these training institutes are designed to serve the workforce demand of respective companies they do develop a culture of international
37 Government of India, Planning Commission, New Delhi. (2007). Report On The Task Force On Skill Development. 38 Directorate General of Employment & Training, Ministry of Labour, Government of India. (2014). List of 100 it is to be upgraded into Centres of Excellence. Retrieved from: http://dget.nic.in/coe/main/100ITIs.htm 39 Menon, S. (2013, July). Personal interview with Mr. B. Muthuraman, Ex President, Confederation of Indian Industries (CII), Chairman, National Council on Affirmative Action, Vice Chairman and Head of Tata Steel Affirmative Action Forum. 40
Federation of Indian Chambers of Commerce and Industry, New Delhi, India. (2010). Skills Development Sector Profile Report.

32
benchmarking as their clients and services are global. For example, Larsen & Toubro has set up Construction Skill Training Institute at Chennai41 to up-skill field workers such as masons, plumbers, bar-benders, carpenters, fitters, welders, turners, wiremen and electricians with contemporary tools, procedures and practices. Initiative like these helps benchmark the Indian skills development with international partners. Apart from the in-house training, private VET training providers are also emerging particularly in the soft skill areas that do not require intensive capital investments. Some of the large private VET providers are IL and FS Culture Development centers who provide skills training in textile, leather, agro/food and pharmaceutical; B-Able provide training in management and business soft skills through 70 centers, 300 micro centers and in 2009 provided training to 30 000 students; IndiaSkill and IndiaCan are also totally private business providing VET skills development through a mix of online and face to face programs. The capacity (number of seats and types of courses) and the actual number of graduates that come out of these private providers are difficult to account hence the need for a robust VET data system. It will be prudent for NSDC to commission the development of an inventory of all private VET providers as part of its planning for skills development in the country. Benchmarking with International Standard
In 2008, around 140 Indian institutions and 156 foreign education providers were involved in academic collaborations. The total number of collaborations was 225, and each collaboration having more than one program delivery, the total number of programs delivered was 635.The highest number of collaborations was in management and business administration, 168 of the total of 635, or 26%. The next most offered discipline for collaboration was engineering and technology/computer application/information technology, having 144 or over 22% of such programs, followed by hotel management and housekeeping, with 132 or over 20%. Incidentally, these foreign collaborations are highly concentrated, in Maharashtra and Delhi, followed by Tamil Nadu. International players have shown interest in the Indian skill development space at the government-to-government level as well as the institution-to-institution level. International players often collaborate with local partners due to the complexity of the Indian socio-economic and political environment. Some of the larger players are as follows.
▪ Germany: The Indo-German Joint Working Group on Vocational Education and Training saw consensus on creating a Public Private Partnership on the pattern of the German Dual system. Efforts are on, with the Government of Karnataka, to develop multi-skills development centers of an international standard.
▪ Australia: The Bureau for Vocational Education and Training Collaboration was established by Australia and India in 2010. Courses are being delivered in India with local partners.
▪ United Kingdom: The UK India Skills Forum was established in April 2002 to provide a platform for organizations across the technical and vocational education sectors in
41
Larsen & Toubro Limited, India. Training to Upgrade the Skills. Retrieved from: http://www.larsentoubro.com/lntcorporate/common/ui_templates/HtmlContainer.aspx?res=P_ECC_BABT_GCTN

33
UK and India. The UK has also worked with NSDC to develop the Sector Skills Council concept for India.
▪ Singapore: A Memorandum of Understanding has been signed between Singapore's Institute of Technical Education and the state government of the National Capital Territory of Delhi's Department of Training and Technical Education on the establishment of a world-class Skills Centre in Delhi
Anticedents of Vocational Education Social perception and stigma Historically, social stigma has been attached to vocational education and training as manual or industrial jobs was perceived as low paying and meant for low-caste communities. Furthermore, skills development acquired a negative perception due to the prevalent notion that skill-training courses are only meant for those who were not academically smart and could not make it in the formal education system. Parents push their children to become university graduates. This results in enrolments at vocational courses skilling centers remaining low. This, in turn, leads to a lower number of skilled people emerging out of these institutions. With no prestige or aspiration built into skill development and consequently people staying away from it, there is a huge skills gap created in diverse spheres, ranging all the way from plumbers and electricians, to nurses and teachers. The academic elitism started during the colonial days when, to be educated and get a job in the government bureaucracy with its pension and other perks was considered better than other options. Even now, a general degree and work at a call center is considered more prestigious than becoming a tradesperson. The challenge of evolving a healthy and positive skills culture has not been helped by the industry’s own reluctance to encourage skilling by hiring skilled workers at all levels or creating an adequate salary differential between skilled and unskilled or semi-skilled workers so that people are encouraged to get themselves skilled. As noted in the World Bank report (2012) the misplaced perception has distorted the wage system in the country. For example, a secondary school qualification can attract a higher wage than someone completing the vocational training. Figure 5.3 Average wage against main salary classifications in India

34
The current wage classification does not recognize a need for the vocational qualification to have a separate classification—it’s not perceived as a special category of knowledge and skill acquired after several years of studying. It is not surprising that secondary education is valued more than vocational qualifications because it has a salary classification in India. Due to the above discussed attitudes and circumstances, the vocational education and training segment has suffered from poor enrolment. Further, the low perception of vocational education is also evidenced in the quality of instructors. Attracting good trainers has always been an issue with vocational education in India. Teachers in general are poorly paid in India and the salaries of teachers in the VET sector have been at the lower end of the teacher salary spectrum. In many cases, in rural polytechnics or technical institutes, the teachers themselves have had only basic education and are not well trained. The industry has also been lukewarm in skilling its own workforce with the incidence of in-service skilling in the region being the lowest in India. Quality of programs Quality of the Indian VET programs has been a perennial problem. Despite all the good intentions and innovative reforms, in some states, the course curriculum has not been updated for 20 or more years, so even if students have completed VET qualifications, they may not be employable in modern day industry—the start of the mismatch concern. Most of the vocational education programs are time based rather than demand driven and/or targeting specific industry sector contemporary knowledge and skills. Of the formally trained candidates to date, the labor market outcomes as seen from placement/ absorption rates are reported as very low. The Knowledge Commission Report to the Nation42 states that in the states of Orissa, Andhra Pradesh and Maharashtra, the percentages of graduates found to be in wage employment/self-employment upon graduation from ITIs were 16.2%, 41% and 35% respectively. The corresponding percentages for those graduating from ITCs were 21.3%, 22.8% and 35.6% respectively. Many larger companies such as Tata Industries have lost confidence in the public sector VET programs ability to train and supply a skilled workforce and consequently started their own in-house training. The rigid bureaucratic processes of course revision, driven by supply side agenda supported by out-of-touch VET planners (who often are from the government public service cadre instead of people from the industry) hinder the public sector VET providers from becoming responsive. Inflexible Approach and links with Industry The current formal vocational education framework in India rely exclusively on a few training courses of long duration (2-3 years) covering around 100 skills—the system is not capable of responding to changing demands. In China, on the other hand, there exist about 4 000 short-duration modular courses, which provide skills more closely tailored to employment requirements43. There is an urgent need for India to diversify and modernize its VET course offerings, with continuous improvement in mind to match skill and capacity gaps thereby improving the chances of the trainees’ employability. There is not enough emphasis on short
42 Government of India. (2009, March). Knowledge Commission Report to the Nation, 2006-09.
43 Government of India. (2005). National Knowledge Commission Report 2005-08

35
continuous professional development training courses designed to impart new skills to match the innovations in work practices. Additionally, once an individual leaves mainstream education for vocational training, there is no provision for him/her to return to the academic stream at a later stage. This not only encourages a general view of work and study being mutually exclusive options, it also increases the perceived risk of taking up vocational training as a dead-end career. Unlike the Australian and UK system that has multiple pathways to higher education including via the vocational education, the Indian system is very rigid and exclusive. While there is a provision for the participation of industry representatives/ experts in the setting of curriculum and recruitment of apprentices, there is still a significant mismatch between industry skill requirements and the talent pool emerging from ITIs/ITCs. This is partly because representatives in many of the key curriculum development boards are appointed on seniority rather than their contemporary knowledge in respective disciplines. The balance in favor of government bureaucrats over industry experts in these key curriculum boards has contributed to low success in the labor market for VET graduates. Appropriate Remuneration can Incentivise Participation in the VET
As noted earlier in this report, secondary education can attract a higher salary then undertaking a vocational education after completing secondary education (see Figure 5.3). The lost opportunity cost for 2-3 years when undertaking vocational education training seems to be a deterrent to participating in VET programs, particularly when you are unable to achieve any career advancement or remuneration advantage. The recently developed Indian National Vocational Education and Training Framework (NVETF) should be used to index the wages against qualifications as it is done in most developed countries44. The Minimum Wages Act, 194845 was enacted to safeguard the interests of workers mostly in the unorganized sector and needs to be seriously revised and aligned with the 21st century workplaces and productivity driven employment conditions. Under the provisions of the Act, both the Central Government and the State Governments are the appropriate governments to fix, revise, review and enforce the payment of minimum wages to workers in respect of scheduled employments under their respective jurisdictions. There is an urgent need for government stimulated discussions with a view to revise the minimum wages act. Currently there are 45 scheduled types of employments in the Central Government Sphere and as many as 1 679 in the State Government Sphere. The enforcement of the Minimum Wages Act, (1948) is ensured at two levels. While in the Central Sphere, the enforcement is done through the Inspecting officers of the Chief Labor Commissioner (Central) commonly designated as Industrial Relations Machinery, the compliance in the State Sphere is ensured through the State Enforcement Machinery. This needs to be streamlined/simplified and managed from close proximity to both the employers and employees.
44
See the Australian and German Vocational Qualification and wage frameworks. National Centre for Vocational Education Research. (2013). National VET in Schools, Australian Vocational Education And Training Statistics: VET In Schools Data Tables Queensland, NCVER, Adelaide. 45 Government of India. Ministry of Labour and Employment. (2009). About Us Report. Retrieved from http://labour.nic.in/upload/uploadfiles/files/Aboutus/About%20us.pdf

36
The Skills Gap Challenge
Current studies indicate that net enrolment in vocational courses (formal and informal) in India is about 5.5 million per year compared to 90 million in China and 11.3 million in the United States (IDFC, 2012). Currently, a mere 2 per cent of Indian workers are formally skilled. According to the Confederation of Indian Industry (CII) report, India’s workforce in 2006–07 numbered 484 million (Sinha et al. 2008)46. Out of this, 273 million were working in rural areas, primarily in agriculture, while 61 million were working in manufacturing and about 150 million in services. Of these workers 40% of the current workforce is illiterate and another 40% is made up of school dropouts. Those who are vocationally-trained, diploma holders, graduates and above comprise a mere 10% of the overall workforce, while those who have completed 12 years of schooling comprise another 10%. Software industry body National Association of Software and Services Companies says that of the 400, 000-odd engineering graduates who pass out every year, only 20 per cent would meet the requirements of the Indian industry. The rest would have to go through rigorous training before businesses could find use for them. This raises the quality and mismatch concern regarding the current Indian vocational education sectors capacity. This challenges the Indian VET sector on two levels. Firstly, the quality needs to be seriously reviewed given that a large percentage of potential employees require further training despite having just completed a degree program. Secondly, attention must focus on how the Indian VET sector will meet the projected workforce demand sought by contemporary industries with its current limited capacity.
46 Sinha, J.K., Abraham, J. and Vohra, R. (2008). India’s Demographic Dilemma: Talent Challenges For The Services Sector, Boston Consulting Group and Confederation of Indian Industry, New Delhi, India.

37
SECTION SIX: GOVERNMENT OF INDIA’S SKILL DEVELOPMENT AND VOCATIONAL TRAINING ORGANISATION REFORM
Organisational restructure Under the Coordinated Action Plan for Skill Development (2008) and the XII Five Year Plan (2012-17) for Skill Development and Training (2012)47, the Indian Government established a three-tier institutional structure consisting of the Prime Minister’s National Council on Skill Development, the National Skill Development Board (NSDB) and the National Skill Development Council, in order to bridge the existing skills gap and better coordinate work in the skill development sector. The Government of India further established NSDC as a corporation to implement skills development. Unfortunately, to date NSDC has struggled to deliver on the ambitious expectations. To ensure future capacity gaps are met, the NSDC has been revamped and is currently undertaking a review and a plan to achieve the target by 2022. NSDB48 coordinates skill development initiatives across 17 Central Ministries and State Governments and the National Skill Development Corporation. It is constituted by Secretaries of the Central Ministries of Labor and Employment, Rural Development, Finance and Higher Education along with the Chief Secretaries of four states by rotation (for a period of two years), three skill development specialists, the Chairperson of the National Skill Development Corporation, the Deputy Chairman of the Planning Commission and the Secretary of the Planning Commission. The functions of NSDC are, therefore:
a) Coordinate and stimulate private sector initiatives in skill development with enhanced flexibility and effectiveness.
b) Proactively catalyze creation of large, quality vocational training institutions. c) Reduce risk by providing capital d) Support systems required for skill development
From the reports reviewed to date, it appears most of the reform is happening at the Central government level and in creating layers of bureaucracies which can be a risk when implementation mostly occurs at the State and Territory levels. In fact, some States such as Gujarat 49are perhaps ahead of some of the Central Government initiatives and can provide valuable lessons learned to the central government initiatives. Efficiency and outcomes Despite the claim that skill development is now a national priority, tangible outcomes are progressing very slowly50. For instance, it is claimed that since 2009, NSDC and its 62 training partners have trained 280 000 people across 23 sectors. This is approximately 1 230
47 Government of India, Ministry of Labour and Employment. (2012). Report Of The Working Group On Skill Development And Training For XII Five Year Plan (2012-17). 48
NSDC has a 15-member Board consisting of six government nominees (including the Chairman of NSDC) and nine private members (including the Chief Executive Officer). NSDC invests in skill development through the National Skill Development Fund (NSDF), a government-owned trust with a corpus of Rs. 9,951 million, with financial contributions from donors, private entities, government, statutory bodies and financial institutions, among others. The NSDF provides funds to NSDC to facilitate skill development and NSDC receives a management fee for managing the fund. 49
Government of India, Ministry of Statistics and Programme Implementation, National Sample Survey Organisation. (2014, March). State-Wise Absolute Employment In Millions By Major Sectors And Share Of Employment (2004-5, 2009-10), Data Book. 50 The Ministry Of Labour & Employment Has Formulated A National Policy On Skill Development, World Bank Working Paper, Washington D.C.

38
graduates per institution per year (assume a 4 year period 2009-2012 inclusive). If we break this down to sectors, it comes to 49 graduates in each sector per year. For a country experiencing skilled labor demand in millions this achievement is insignificant achievement. Further, to achieve the above outcomes, it’s claimed that by June 2012, NSDC had disbursed a cumulative amount of IR 2 235 million towards funding skill development initiatives. Using this figure, the calculated cost per VET graduate is considerably high. It’s also unclear if this achievement is in addition to the 62 institution’s usual completions or is it inclusive of their existing completion numbers. The revised NSDC policy envisions an increase in skill development capacity to 15 million annually. This is an ambitious task particularly when considering that the present estimated51 capacity of skill development in India is around 3.1 million persons per year. Furthermore, the XII Five Year Plan has projected a target of creating 500 million skilled workers by 202252. This is only possible by increasing capacity and capability of skill development programs. A framework for better coordination between various stakeholders needs to be urgently established –it should not become a bureaucratic impediment. In 2009, MoLE formulated a new National Skill Development Policy that targets the creation of 500 million skilled workers by 202253 with the following vision:
▪ Harnessing inclusivity and reducing economic and social divisions among the Indian workforce particularly across rural-urban, male-female, organized -unorganized and traditional-contemporary segments
▪ Matching the emerging demands for skills across various industries and economic enterprises and developing mechanisms for close monitoring of the demand at the ‘coal face’; Employability and Demand and Supply matching; Informal Sector’s requirement; Multiple skills; Flexibility of Course design, modularity; Open and distance learning; Use of Technology; Career guidance; Teacher’s Training and Retention
▪ Evolving a National Vocational Qualification Framework comparable with international standards. In 2008, the NDSC was given the mandate to develop a national competency framework for the Voc Ed sector together with National Competency Testing and Accreditation system. In most OECD countries such an agency, in close corporation with respective industry sector, set professional standards. Some of the challenges are; (i) Lack of infrastructure – building, modern equipment and raw materials; (ii) Inadequate or non-coverage of trades in service sector, which has higher employment potential; (iii) Lack of equivalence for employment purposes and (iv) Lack of convergence between various agencies.
▪ Developing a credible and international benchmarked standard certification system by recognizing and including quality skills acquired through any informal system of learning
51 The limited coordination of outputs of all skills development institutions (private and public) makes it difficult to accurately aggregate the capacity and annual output. 52
Planning Commission Government of India. (2012). Eleventh Five Year Plan 2007-12. International Labour Office (ILO) & Organisation for Economic Co-operation and Development (OECD). (2011, September 26-27). G20 Country Policy Briefs, India, Meeting of Labour and Employment Ministers, Paris. Retrieved from: http://www.oecd.org/els/48724080.pdf Utamsingh, V. and Srinivas, R. KPMG, India. (2010). Report, India: Future of Education: Education, Skills, Development & Employability, PanIIT Conclave. 53 UNESCO Institute For Lifelong Learning. (2013, May 12-14).UIL’s Contribution To The Global Inventory On NQF.

39
▪ Greater and more active role for workers' organizations, industry, civil society, Panchayati Raj institutions and other professional bodies
▪ Greater reduction of poverty through enhanced earnings of skilled workers The coverage of the national policy on skill development includes the following:
▪ Institution-based skill development including ITIs/ITCs/Vocational schools/technical schools/ polytechnics/ professional colleges etc.
▪ Learning initiatives of sectoral skill development organised by different ministries/departments.
▪ Formal and informal apprenticeships and other types of training enterprises allowing for horizontal and vertical mobility
▪ Training for self-employment/entrepreneurial development ▪ Adult learning, retraining of retired or retiring employees and lifelong learning ▪ Inclusive approach- Non-formal training including training by civic society
organisations; Equity (Girls, rural population, SC, ST, Minority and Disabled) ▪ E learning, web-based learning and distance learning ▪ Complementary role of Central and State Government and and private sector
partners
Despite all the above policies and activities being implemented in the VET sector, there are very few monitoring and evaluation reports available in the public domain that tracks the impact of these reform initiatives. While conceptually the above organizational/structural reforms are welcomed, but the impact of these at the implementation/operational level is unclear. Since these initiatives started 2008/09 it is time to undertake an evaluation study. It seems a lot of energy and time has been spent yet again creating a bureaucratic system mostly at the Central government level, which has been a hindrance to developing a demand responsive, and quality assured VET sector by the industry stakeholders. The rhetoric of cutting red-tape and streamlining process for VET providers seems to be yet again, complicated by bureaucracy. Funding modality Funding public sector VET programs has always been through Central Government budgets, which can be limited and also restrictive. This in turn makes the VET provider unable to be responsive to changing demands. This model works when you have a very good demand forecast system and are able to plan in advance for the emerging skills that may be required. In countries like Australia, a small percentage levy on the company earnings is imposed, that may be used towards training and development of its workers. This allows companies to purchase specific training to suit their needs but also allows training providers to be innovative and develop programs appropriate to the industry needs. In Germany, the skill development is a joint venture between the Government and the private sector and the costs are shared. The current Indian VET system seems to be heavily dependent on public funds and wherever private enterprise exists it is largely in-house training or in-kind contributions. The other option for financing VET programs is self-funding and given the lack of a universal VET skill development loan scheme, that may not be very effective. The current bank financing

40
model, with its emphasis on collaterals or guarantees, acts as a big stumbling block for a number of people at the bottom of the pyramid who could have used the skill-training to improve their employability. As of now, the Central Bank of India is the only public sector lender active in this space, and there too, its intervention is limited to the partners of the NSDC. Although the declaration of a Credit Guarantee Fund in the Budget announced for 2012–13 is a positive development, it is still too early to comment on the impact it may have as the mechanism for its operational details are unclear. Even if the banks do aggressively start lending, there is a need for other Non-Banking Finance Companies to enter this space. There may be a need to review alternative funding options to support students taking VET programs. The continuous dependence on public sector means the Central Government may not be the best option when such funding is highly political and uncertain, and the actual stakeholders and beneficiaries are State level and in public and private company workshops. The National Vocational Educational Qualification Framework
In order to integrate the formal and vocational education streams, the Ministry of Human Resource Development has established the National Vocational Education Qualification Framework (NVEQF), which is expected to cater to 5 million students for vocational degrees/diplomas each year. This perhaps is the best reform activity as it allows comparability between programs, between States, between industry groups and also establishes confidence in graduates exiting from programs. NVEQF needs to be aligned and implemented from the secondary vocation education program through to the polytechnics, engineering colleges and other colleges including the university system. The NVEQF establishes seven certificate levels, with each level covering 1 000 hours of competency-based vocational training modules integrated with general learning. On completion of level 5, a vocational education diploma may be obtained; and on completion of level 7, a vocational education degree will be awarded. This is expected to make it possible for students to transition between vocational and formal education. Also, as noted under remuneration and incentivizing in Section Five of this report, the wages structure should be linked to the qualifications framework. Many argue that skill development has received a setback through select social schemes of the government, such as the Mahatma Gandhi National Employment Guarantee Act, that have had the impact of making rural people stay away from participating in skill development and upgrading. Being assured of a certain amount of money every year, a number of rural people have now started feeling they no longer need to make the extra effort to get themselves up-skilled as the money is still being provided without and accountability for the training being undertaken—creates a welfare entitlement. Skill Sector Councils
NSDC’s mandate includes setting up Sector Skill Councils (SSCs), which are industry-led organizations that coordinate skilling initiatives for each sector—a model extensively used in OECD countries. SSC ensures that the responsibility of skilling is with the industry, thereby addressing the fundamental imbalance in the skilling ecosystem, which has led to problems with the relevance and mismatch of training imparted. The main functions of the SSCs are: (i) undertake data driven research in VET sector to advise labor market demand and productivity analysis; (ii) develop competency standards and updated existing courses and

41
new courses to the standards, planning and delivering training for VET trainers; (iii) provide quality assurance through standardization of affiliation and accreditation, certification of trainers, certification test for employees completing the courses. SSCs will create a decentralized, industry-driven environment for skill development, where NSDC acts as a nodal agency and facilitates initiatives in the sector, while SSCs ensure standardization within each sector. However, how the SSC will operate at the State level, has not been reported anywhere yet. To monitor compliance of the minimum standards and certifications, it has to be done from the State level. These two functions are integral to a robust VET system and this cannot be achieved from by the Central Government in Delhi. Thus far, since 2009, NSDC’s Board in sectors such as automobile, retail, IT and media has approved 18 SSCs. Four SSC proposals are under evaluation and eight more are in the pipeline. These initiatives are presumably at the Central level, so setting up the State level SSC representative could take even longer. The slow pace of reform can be a serious disincentive for the VET stakeholder to want to engage. Regional Imbalances
NSDC reports54 that addressing the regional imbalances is one of the primary aims for the Indian government today to encourage inclusive growth across all states. There is a fine line between equity driven inclusive growth versus a demand driven growth. Some States are better positioned for growth and thus should not be disadvantaged in expanding their vocational education sector because every State can have only one of each initiative. A balance between market driven demand and equity is needed to accomplish a nation-wide growth in a short time period. It is important to keep in mind the supply and demand of labor across different regions. Therefore, skill development initiatives should be designed, keeping in mind the regional demands and imbalances. For instance, NSDC, in a recent analysis discovered that the majority of the blue collared labor gets sourced from the States of Bihar, Rajasthan, UP, and Chattisgarh in the northern sub-continent. Andhra Pradesh occupies the same position in south. Therefore it makes sense to expand the ITI and ITC capacities in these States.
54 Government of India. National Skills Development Corporation. (2012). Infrastructure Sector Report, Talent Projections & Skills Gap Analysis (2022)

42
SECTION SEVEN: TRACKING VOCATIONAL EDUCATION REFORM TO TRANSFORM THE INDIAN ECONOMY TO AN INDUSTRIALISED
ECONOMY: A MONITORING FRAMEWORK
The following section draws on the brief review of the main features of the Indian VET sector reforms currently happening in the country and provides a monitoring framework to track the effectiveness of the reform initiatives. As noted in the report, industrialized economies depend on the sectors that generate strong GDP growth, increased employment and share the opportunities. Therefore, to stimulate the Indian VET sector to support the transformation to an industrialized economy, make it internationally recognized, make it relevant to contemporary work practices and increase productivity, supply high quality and sufficient numbers of skilled workforce to each industry sub-sector, the monitoring has to target two levels of education; the secondary education which provides the supply side concerns and the VET sector capacity to meet the project demand. Secondary Education Drivers to Support Industrialisation of the Indian Economy
The secondary school monitoring is focused on the assumption that among the industrialized countries the throughput into the VET sector begins at the secondary level. To meet the projected workforce demand by the industrial sectors India has to seriously improve its secondary school (lower secondary and secondary enrolments) enrolment and attrition rates. Currently, a large numbers of students exit the system and engage in the informal workforce and a limited number pursues the vocational education pathway.
Key issues Indicator /performance Comments Secondary education
enrolment rates are very low compared to most industrialized countries. This is the entry point for candidates to the Voc Ed sector
Starting from a low enrolment rate India cannot afford the current high attrition rate
Number of places available in secondary schools ( private and public
Aggregated enrollment and completion/attrition rates for lower secondary and secondary schools
Disaggregated enrolment rates by gender, rural/urban and minority groups
Advocacy and parents education to support children attending secondary schools
The attached modeling took the current enrolment in grades 8,9,10,11 and 12 (which is low by international standards) and aligned that with the total skilled labor force demand. If we assume the attrition rates can be reduced as noted in the modeling for each of the grades then by 2020 the projected demand may be met. Alternatively, if the enrollment is increased and attrition against the improved enrollment still has the equivalent net attrition rate used in the modeling then demand can be reached by 2022. This assumes that all students enrolled in the above grades will go through to the VET program. We know that only 10% go into the formal VET program. If we use the 10% of the enrolment it could take India a very long time to reach the demand.
Therefore you need to monitor the

43
Vocational Education Drivers to Support Industrialisation of the Indian Economy
The second areas for monitoring are directly related to the vocational education sub-sector and are noted in the table below. Given that significant reform is happening in India to stimulate the VET sector as a response to the huge projected demand for skilled workforce in all industry sub-sectors. Only the issues identified as high priority are noted here. It is acknowledged that a full monitoring and evaluation framework could not be developed within the scope of this assignment.
secondary enrolment rate and also the attrition rate just to ensure there is enough supply of potential VET students
Quality of secondary education learning outcomes significantly restricts chances of students exiting at lower or secondary levels from returning to formal training to advance their vocational skills
Percentage improvement numeracy, literacy and cognitive skills in achievement test
Benchmarking at National, State and international level
Contemporary workplace requires high cognitive capacity and NOT physical labor. Base level education capacity is critical for progressing to higher levels within the vocational career pathway
With increasing numbers of multinational companies coming to India it is important to benchmark against international norms
Enrolment in VET in secondary schools is also very low compared to most industrialized countries
Secondary VET programs to be aligned with the NVEQF and grant advanced standing in formal VET programs in ITI and ITC
Increase number of students enrolling in VET—total numbers plus disaggregated by gender/rural/minority group
Advocate options for non-traditional job for girls and rural students
Since SCC is to be involved in designing VET programs, they should also review the secondary school VET program and align it to ITI and ITC. Revised programs to be responsive to local demand and better articulated with school to work transitions
Also, there is room to pilot industry-school partnerships as done in many OECD countries to improve the image and give assurance of a genuine career pathway through the school base VET programs
NSDC, NVQF and the SSC need to jointly develop mechanisms to recognize the school based VET and provide pathways to formal vocational career paths
Key issues Indicator /performance Comments Governance issues-
currently every initiative is driven by the Central Government in Delhi
Arrangements for implementation /enforcement of the NSDC policies and strategies at the State level
Indian system has excellent conceptual ideas but struggle to implement. The complex contextual arrangement between the Central and State

44
Adopting the NVEQF, linking the wage structure and implementing nationally
Central vs State legislation and red tape to support enforcement of NVEQF
Transparent and equitable process and procedures to access government funds for VET
government is a challenge. So developing and formally adopting simple and clear policy and procedure are critical
One of the common concerns of private sector investors in VET in India is the red tape and unnecessary supply side monitoring. Given the complexity and size of the VET sector a Results Based Management should be considered (focus on outcome and beneficiary) rather than complex transactions and procedures. Very few of the current report mention the results and/or beneficiaries
Quality and relevance - VET sector programs to meet specific industry skills demand
SSC established in all industry sub-sectors to provide Industry led ( relevant and quality based) VET program design with provision for vertical and horizontal pathways between Voc Ed and Academic programs
Increase the participation rate in formal VET programs – shift the balance in favor of formal training and formal employment
SSC and International VET provider to develop benchmarking by respective sectors/ stakeholders
Currently the NSDC is struggling to establish appropriate SSC for all 21 sectors identified by NSDC. There is an urgent need to accelerate this process so that the industry led program design can be implemented.
SSC with support from international collaborators should guide ITI and ITC to develop an efficient system for approving new programs and being responsive to the industry demands---current highly bureaucratic system, limited autonomy of ITI and ITC has been a major hindrance.
As shown in the report, India has the lowest participation rates in both VET credit programs as well as VET in-service /continuous professional development programs—this has to be changed to mirror the more successful industrialized countries.
Given the many private international companies are working in the VET, it will be prudent to do some benchmarking to compare quality and relevance.
Perception- vocational education as a career of choice
Public advocacy to show the career opportunities through formal Voc Ed programs are rewarding
Incentivize trainees to increase participation in Voc Ed programs and counter opportunity cost temptation.
Advocate non-traditional roles
Recognize VET qualification as pre-requirement for recruitment. If necessary legislate ratio of formal vs informally trained employees in a company.—will improve status of and Demand for VET programs
Provide stipends etc to counter opportunity cost concern.
Currently the automotive industry has

45
to encourage female and minority groups
a recruitment drive through the national TV in India, It outlines the benefits of enrolling in formal automotive VET programs. Exposure to the automotive assembly plant and garages via the TV presents a safe and rewarding work environment. Other sub-sectors should consider similar initiatives
VET sector capacity to meet the projected skilled workforce demands by 2022.
Maximize utilization of ITI and ITC current capacity by increasing enrolment, targeting programs that ensure employment after graduation etc.
Expansion of public and private VET places in the country and particular in high demand states
Increase number of private sector provider and incentivize companies to open in-house training facilities to external clients
Increased engagement with the private sector --number private sector providers licensed in each State and their graduate outputs
Increased numbers of innovative partnerships with private providers and private company training intuitions operating within the NVEQF
The modeling took the supply input from the secondary schools and mapped that with ITC and ITI capacities to meet NSDC projected labor demand. A projected 10 % compounded annual growth rate increase is added to the capacity annually as per the Planning commission report. The modeling suggests that India has to increase its seating capacity on a rate of 292% from its current capacity to catch up with the demand as projected by the modeler (supply perspective) in 1 year. And then maintain at par (1:1) to demand - the supply to meet the ongoing demand, year on year out till 2022—this is a huge ask but it must be noted that the information and private sector capacity is not factored in this. Further, the above does not take into consideration attrition within the ITI and ITC programs
All current ITI and ITC are underutilized at present for various reasons—irrelevant programs, poor facilities etc., but given the huge recent investment in upgrading and making C0E etc., has the demand for VET programs changed and by how much?—increased enrollment number could be proxy for this.
What may be monitored on the demand/capacity side is the increase in places. Based on the current VET enrolment and available places the system will take over 6 years to meet the projected demand

46
Financing Voc Ed- majority of the current initiatives is funded by Central Government.
Periodic return on investment analysis for Central and State investments in the VET is necessary
The serious anomaly with the current wage structure needs to be review to give credit for the additional training VET students engage in
Central government budget funding plus loans from World Bank and Asian Development Bank etc. are the main sources. This is fine for capital investments and/or to stimulate the VET sector but alternative, on-going sources of funding through industry training guarantee levy, ILO agreement regarding industry contribution to apprentice training etc., needs to be considered to ensure sustainability. The demand and cost will only increase given the labor force projection
The wage anomaly between secondary and vocational education qualified employees to be rectified. It should also be aligned to the NVEQF
47
REFERENCES
Commonwealth of Australia, Australian Government, Productivity Commission. (2011, April). Productivity Commission Research Report, Vocational Education and training Workforce. Directorate General of Employment & Training, Ministry of Labour, Government of India. (2014). List of 100 it is to be upgraded into Centres of Excellence. Retrieved from: http://dget.nic.in/coe/main/100ITIs.htm Ernst & Young, India. (2009). Making the Indian Higher Education System Future Ready. Federation of Indian Chambers of Commerce and Industry Higher Education Summit. Federation of Indian Chambers of Commerce and Industry, New Delhi, India. (2010). Skills Development Sector Profile Report. Federation of Indian Chambers of Commerce and Industry, New Delhi and Ernst & Young, India. (2012, September). Knowledge paper on skill development in India Learner First. Government of India, Ministry of Labour and Emploment. (2012). Quarterly Newsletter, Volume 2, Numbers 1 and 2. Government of India, Ministry of Labour and Employment. (2012). Report Of The Working Group On Skill Development And Training For XII Five Year Plan (2012-17). Government of India, Ministry Of Labour And Employment. (2012). Third Annual Report To People On Employment. Government of India, Ministry Of Statistics And Programme Implementation, Reports and Publications. (2012). National Sample Survey Organisation Survey Report. Government of India, Ministry of Statistics and Programme Implementation, National Sample Survey Organization (NSSO). (2004). Report: Status Of Education And Vocational Training In India 2004-2005 (Report No.517, 61/10/03). Government of India, Ministry of Statistics and Programme Implementation, National Sample Survey Organisation. (2014, March). State-Wise Absolute Employment In Millions By Major Sectors And Share Of Employment (2004-5, 2009-10), Data Book. Government of India, Planning Commission, New Delhi. (2007). Report On The Task Force On Skill Development. Government of India. (2005). National Knowledge Commission Report 2005-08 Government of India. (2009, March). Knowledge Commission Report to the Nation, 2006-09.
Government of India. Ministry of Labour and Employment. (2009). About Us Report. Retrieved from http://labour.nic.in/upload/uploadfiles/files/Aboutus/About%20us.pdf Government of India. National Skills Development Corporation. (2012). Infrastructure Sector Report, Talent Projections & Skills Gap Analysis (2022)

48
International Labour Office (ILO) & Organisation for Economic Co-operation and Development (OECD). (2011, September 26-27). G20 Country Policy Briefs, India, Meeting of Labour and Employment Ministers, Paris. Retrieved from: http://www.oecd.org/els/48724080.pdf International Labour Office (ILO), Geneva. (2010, November). G20, A Skilled Workforce for Strong, Sustainable and Balanced Growth. Retrieved from: http://www.oecd.org/g20/topics/employment-and-social-policy/G20-Skills-Strategy.pdf Lai. R.Z., Maturu, N., Stamberger, E., Stephens, N & Sze, P. (2011). Vocational Education and Training in China, Gerald R Ford of Public Policy, University of Michigan, U.S.A. Larsen & Toubro Limited, India. Training to Upgrade the Skills. Retrieved from: http://www.larsentoubro.com/lntcorporate/common/ui_templates/HtmlContainer.aspx?res=P_ECC_BABT_GCTN McKinsey Global Institute, McKinsey & Company.(2012, June). The World At Work: Jobs, Pay, And Skills For 3.5 Billion People. Mehta, A.C. ( 2012). Elementary Education In India: Analytical Table 2008-2009. National University Of Educational Planning And Administration, Government Of India, New Delhi. Menon, S. (2013, July). Personal interview with Mr. B. Muthuraman, Ex President, Confederation of Indian Industries (CII), Chairman, National Council on Affirmative Action, Vice Chairman and Head of Tata Steel Affirmative Action Forum. National Centre for Vocational Education Research. (2013). National VET in Schools, Australian Vocational Education And Training Statistics: VET In Schools Data Tables Queensland, NCVER, Adelaide. National Skill Development Corporation, India. (2009). Sector Skills Reports, 2009-10. OECD. (2006). Measuring The Effects Of Education On Health And Civic Engagement: Proceedings Of The Copenhagen Symposium, Copenhagen, Denmark. Planning Commission Government of India. (2012). Eleventh Five Year Plan 2007-12. Pratham Education Foundation, New Delhi, India. Annual Status of Education Report. (2012). Reuters U.S.A. (2011, December 15). ACER Releases Tamil Nadu India Results of PISA 2009+ Participant Economies. Retrieved from: http://www.reuters.com/article/2011/12/15/idUS242972+15-Dec-2011+BW20111215 Robert, O.E.D. (2011, April). Parents’ Socio-Economic Status And Pupils Education Attainment In Malaba Town Council, Africa. Retrieved from: http://www.academia.edu/552340/Parents_socio-economic_status_and_pupils_education_attainment_in_selected_primary_schools Sinha, J.K., Abraham, J. and Vohra, R. (2008). India’s Demographic Dilemma: Talent Challenges For The Services Sector, Boston Consulting Group and Confederation of Indian Industry, New Delhi, India. Srinivasan, S., Institute of South Asian Studies and National University of Singapore. (2013, July 11). ISAS Special Report. Skill Development Initiatives in India.

49
Sunita Chugh (2011). Dropout in Secondary Education: A Study of Children Living in Slums of Delhi, New Delhi: NUEPA Tan And Savchenko. (2005). In-Service Training In India: Evidence From The India Firm-Level Investment Climate Survey, Word Bank Working Paper, Washington D.C. The Ministry Of Labour & Employment Has Formulated A National Policy On Skill Development, World Bank Working Paper, Washington D.C. The World Bank. (2007, April). Education Quality And Economic Growth. The World Bank. (October, 2013). India Development Update, Economic Policy And Poverty Team, South Asia Region. The World Bank. (2012, December). Report, Special Focus: Creating Jobs, Edition No. 7 The World Bank. (2014). Data Table GDP Growth (Annual%). Retrieved from: Http://Data.Worldbank.Org/Indicator/NY.GDP.MKTP.KD.ZG UNESCO Institute For Lifelong Learning. (2013, May 12-14).UIL’s Contribution To The Global Inventory On NQF. UNESCO Institute Of Statistics. (2014). South Asia Regional Study Covering Bangladesh, India, Pakistan And Sri Lanka, UNICEF. Utamsingh, V. and Srinivas, R. KPMG, India. (2010). Report, India: Future of Education: Education, Skills, Development & Employability, PanIIT Conclave. World Bank, Washington D.C. (2009). The Investment Climate Survey. Policy Research Working Paper. World Bank. (2012, December). Report, Special Focus: Creating Jobs, Edition No. 7

APPENDIX

51


53


55

56

57
School enrolment and dropout rates
India Heat Map – Average Drop Out Rates from School