FDU Globalization: Nature, Causes and Consequences September 9, 2013

Policy Studies 22
India’s Globalization:Evaluating the Economic ConsequencesBaldev Raj Nayar
East-West Center Washington

East-West CenterThe East-West Center is an internationally recognized education andresearch organization established by the U.S. Congress in 1960 tostrengthen understanding and relations between the United States andthe countries of the Asia Pacific. Through its programs of cooperativestudy, training, seminars, and research, the Center works to promote astable, peaceful, and prosperous Asia Pacific community in which theUnited States is a leading and valued partner. Funding for the Centercomes from the U.S. government, private foundations, individuals, cor-porations, and a number of Asia Pacific governments.
East-West Center WashingtonEstablished on September 1, 2001, the primary function of the East-West Center Washington is to further the East-West Center missionand the institutional objective of building a peaceful and prosperousAsia Pacific community through substantive programming activitiesfocused on the theme of conflict reduction in the Asia Pacific regionand promoting American understanding of and engagement in AsiaPacific affairs.

India’s Globalization:Evaluating the Economic Consequences

b Baldev Raj Nayar

India’s Globalization i
Policy Studies 22___________
India’s Globalization:Evaluating the
Economic Consequences_____________________
Baldev Raj Nayar

Copyright © 2006 by the East-West Center Washington
India’s Globalization: Evaluating the Economic Consequencesby Baldev Raj Nayar
ISBN 1-932728-43-0 (online version)ISSN 1547-1330 (online version)
Online at: www.eastwestcenterwashington.org/publications
East-West Center Washington1819 L Street, NW, Suite 200Washington, D.C. 20036Tel: (202) 293-3995Fax: (202) 293-1402E-mail: [email protected] Website: www.eastwestcenterwashington.org
The Policy Studies series contributes to the Center’s role as a forum for dis-cussion of key contemporary domestic and international political, eco-nomic, and strategic issues affecting Asia. The views expressed are those ofthe author(s) and not necessarily those of the Center.
This publication is supported by a grant from the Sasakawa PeaceFoundation USA.
ii Baldev Raj Nayar

India’s Globalization iii
ContentsList of Acronyms v
Executive Summary vii
Introduction 1
India’s Reintegration with the World Economy: Its Limited Nature 8
Assessing the Consequences of Globalization 24
Economic Stagnation or Accelerated Economic Growth 24
Deindustrialization or Industrial Advance 32
Denationalization or Regeneration 37
Economic Destabilization or Stability 45
Impoverishment or Welfare Enhancement 62
Conclusion 78
Endnotes 85
Bibliography 89
Policy Studies: List of Reviewers 2005–06 98
Policy Studies: Previous Publications 99


India’s Globalization v
List of AcronymsADB Asian Development Bank
BPO business process outsourcing
CAC capital account convertibility
CE consumer expenditure
CFD combined fiscal deficit
EOU export oriented unit
EUS Employment-Unemployment Survey
FD fiscal deficit
FDI foreign direct investment
FII foreign institutional investor
GoI Government of India
GDP gross domestic product
IMF International Monetary Fund
ISI import substitution industrialization
IT information technology
M&A mergers and acquisitions
MNC multinational corporation

NCAER National Council of Applied Economic Research
NRI non-resident Indian
NSS National Sample Survey
NSSO National Sample Survey Organization
OECD Organization for Economic Cooperation and Development
OPEC Organization of the Petroleum Exporting Countries
PFI portfolio foreign investment
RBI Reserve Bank of India
RIS Research and Information System for the Non-Aligned and Other Developing Countries
SGDP state domestic gross product
UNCTAD United Nations Conference on Trade andDevelopment
vi Baldev Raj Nayar

India’s Globalization vii
Executive SummaryDespite its status as a “master concept” in the world today, globalizationhas attracted critics with powerful attacks against it. This study takesseriously these critiques by developing a hypothesis on the economicimpact of globalization for the purposes of systematic examination.Globalization is taken here to mean the sharper and continuing integra-tion of the world economy, while economic liberalization refers to dereg-ulation and decontrol in a national economy––an economic processinextricably linked with globalization.
On almost every point, the critics make the opposite case to that ofthe supporters of globalization. Thus, rather than higher economicgrowth, the critics see economic stagnation. Rather than economicadvance and industrialization, they see deindustrialization. Rather thanlocal entrepreneurship, they see denationalization. Rather than economicstability, they see economic destabilization. And rather than the enhance-ment of human welfare, they see impoverishment and growing inequality.
This study evaluates the competing claims through a systematicinvestigation using an intensive case study. The country chosen is India,which contains about a fifth of the population of the developing world;indeed, some of its constituent states have larger populations than mostdeveloping countries. The study brings to bear abundant quantitativeand qualitative data on the analysis.

The study first examines the nature and extent of India’s integrationinto the world economy along three dimensions––flows of goods andservices, capital flows, and migration of people. While India has madesubstantial strides, it still represents a case of limited integration comparedwith such dynamic economies as China, Korea, and Mexico. However,even this limited integration has had enormous consequences for India.
The study delineates three broad periods in India’s recent economichistory: (1) the period prior to liberalization (1956–57 through1974–75), characterized as one of autarky and “command and control”economy; (2) the period of intermittent incremental liberalization(1975–76 through 1990–91); and (3) the period after the paradigm shiftto an outward-oriented economic policy in 1991.
The study finds that, whatever the consequences of globalizationelsewhere in the developing world, the case of the critics has little meritwhen examined in relation to the Indian experience. The Indian casedoes not bear out the predictions of the critics.
1. Instead of economic stagnation, India has seen acceleration in itsaverage annual rate of economic growth, from 3.4 percent in thepre-globalization period to about 6 percent. That figure may soonreach 7 percent.
2. Instead of deindustrialization, there has been industrial growthand, indeed, acceleration in the industrial growth rate. The aver-age annual rate of industrial growth has jumped from 5.2 percentduring the period of autarky to 7.0 percent after 1991. At the lastrate, the value of manufacturing doubles about every tenyears––not exactly deindustrialization.
3. Instead of denationalization, business in India is now more com-petitive and is venturing forth into the global market. Increasedimports and the entry of foreign multinationals have notswamped it. Essentially, India is master of its own economy.
4. Instead of economic destabilization, the globalization of India’seconomy has led to fewer economic crises. The period of eco-nomic autarky before globalization was essentially one long,enduring crisis. Since the paradigm shift to economic liberaliza-tion in 1991, there has been a marked absence of economic crisisin India.
viii Baldev Raj Nayar

India’s Globalization ix
5. Instead of impoverishment, India has seen a long and unprece-dented period of welfare enhancement. The period before global-ization featured high levels of poverty. There has been a seculardecline in poverty since 1975––and inequality has not increasedmuch. Of more concern is the matter of growing regional dispar-ities in India.
The study shows that India has been a significant beneficiary of theglobalization process. Rather than support the case of the critics, India’sexperience strongly repudiates those critics. The policy conclusion thatflows from the experience is that India should, in general, be more opento globalization in the interest of sustaining the acceleration in growthand, therefore, the welfare of its people. The agenda for reform to thisend is well-established in the reform community. What is required ismore energetic action to implement it, but there are, of course, con-straints in doing so that are built into the larger political system.

x Baldev Raj Nayar

India’s Globalization 1
India’s Globalization:Evaluating the
Economic ConsequencesEconomic globalization has achieved the status of a master concept—albeit an ambiguous one—in the social sciences since the turn of the cen-tury. Its importance derives from the profound consequences it has for allcountries, and those consequences are multifaceted, bearing on literallyevery aspect of social life. It would be a daunting task indeed to examinethem all in a single paper. The focus here is therefore limited to investigat-ing the aspect that is affected most directly by globalization—the eco-nomy—and that, too, for a single country, India. Accordingly, eventhough it is hugely important, the impact of globalization on culture,society, and polity is not addressed here.
In its essence, economic globalization represents the sharp and con-tinuing integration of the world economy. Because of its profound conse-quences, it has been the object both ofmuch praise and strident criticism. Theenthusiasts and supporters of globalization(Bhagwati 2004; Wolf 2004) regard it as awholly benign process, heralding the long-awaited deliverance of humanity from eco-nomic backwardness, underdevelopment,and misery. For them, allowing marketforces to work largely unhindered by the state and its politics will makepossible higher economic growth and, therefore, human welfare. There is
[The] supporters of
globalization regard it as
a wholly benign processa

now a considerable consensus among mainstream economists on the basisof sophisticated econometric studies (Dollar and Kraay 2004, and theworks cited therein) that outward-oriented economies perform better interms of economic growth than do inward-oriented ones, which in turnleads to desirable consequences for human welfare.a
On the other hand, the critics of globalization (Falk 1999; Petras andVeltmeyer 2001; Chomsky 2002; Klein 2002; Monbiot 2003; Singh2005)—while varying considerably in their views—have mounted a pow-erful attack against globalization, holding it to be a malign force. Onalmost every point, the critics make the opposite case to that of the sup-porters of globalization. Thus, rather than higher economic growth, thelikely result of integration into the world economy is considered to be eco-nomic stagnation, a position that earlier had also been forcefully articulatedby dependency theorists. Rather than economic advance and industrializa-tion, deindustrialization. Rather than promotion of local entrepreneurship,denationalization. Rather than economic stability, economic destabilization.And rather than the enhancement of human welfare, impoverishment andgrowing inequality. These critics exist in both the developed and develop-ing worlds, and powerful lobbies agitate for policies to counter globaliza-tion in the protection of the interests of their various constituencies.
Although the critics are not limited to any particular region, theirinfluence varies. Thus, in most countries of the developed world as in EastAsia and Southeast Asia, by and large there exists a consensus on the desir-ability of integration into the world economy—though not recklessly—
and of policies to that effect. By contrast, in otherparts of the world—such as India—globalization isnot a settled issue at all but is highly contested.While India has doubtless made considerableaccommodation to globalization since the lastdecade of the twentieth century if not earlier, pow-erful political and intellectual forces nonethelessactively oppose and resist globalization therebecause of its actual or potential adverse conse-quences for the economy, among other areas. The
dean of Marxist economists in India, Prabhat Patnaik, offers an exemplaryarticulation of the contra position. In a wide-ranging attack in which heuses the terms globalization and imperialism alternatively to describe thesame phenomenon, Patnaik claims that:b
2 Baldev Raj Nayar
powerful political
and intellectual
forces…actively…
resist globalization
b

India’s Globalization 3
The net result, taking the third world as a whole, of surrendering to theprocess of “globalization” in this sense is: relative economic stagnation,increased income inequalities leading to a worsening of poverty, a loss ofeconomic and political sovereignty, an implicit attenuation of democra-cy . . . a loss of control over domestic assets and natural resources to met-ropolitan capital, the loss of food security, and an exposure to theprospects of sharply fluctuating fortunes owing to the vicissitudes of theworld market and the caprices of international speculators. . . . The cur-rent phase of imperialism entails a tendency towards stagnation, notonly generally but in particular in the third world . . . The process ofglobalization is associated with economic retrogression and accentuationof poverty over much of the third world. . . . Rather than ushering in amore vigorous development of capitalism, and hence a more rapidgrowth of the productive forces, the pursuit of “neoliberal” policiesunder the aegis of imperialism ushers in deflation, deindustrialization,loss of food security and stagnation. (2003: 42, 63, 102, 162)1
The contested status of globalization, particularly in India but notnecessarily limited to it, necessitates an empirical inquiry into globaliza-tion’s impact in terms of the debatebetween the supporters and critics ofglobalization. The issue can be cast in theform of a hypothesis: Increased integrationof the national economy into the worldeconomy under globalization will havesignificant negative outcomes for the for-mer, such as the five broad elementsmentioned earlier: (1) economic stagna-tion; (2) deindustrialization, with theclosure of domestic firms in the face ofunhindered imports; (3) denationalization, with the takeover of domesticfirms by foreign multinationals; (4) economic destabilization, marked bya higher frequency of economic crises arising from the greater exposure ofthe nation to external shocks; and (5) increased impoverishment.c
The hypothesis should not be seen as the cheap exercise of setting upan intellectual straw man or making broad generalizations about third-world countries. Prabhat Patnaik very much believes his diagnosis to applyspecifically to India as well, where his orienting concept is the “demand-constrained economy,” into which India has been transformed during the
The contested status of
globalization…necessitates
an empirical inquiry into
globalization’s impact
c

1990s as a direct result of implementing the program for structural adjust-ment. Defined as “a system in which the potential output in any periodalways exceeds the level of demand of that output at the base distributionof income,” its creation in India is “an inevitable accompaniment of itsopening out to global capital flows.” In brief, “the emergence of demandconstraint is an inevitable fall-out of wooing foreign capital, which is theessence of the ‘liberal’ strategy.” The consequence of the transformation toa perennially demand-constrained system has been the rise of “significantunutilized capacity during the 1990s, owing to the absence of adequatedemand for their products.” Besides, the “distinct decline in the role of thestate in stimulating demand” and “the opening up of the economy to theinflow of foreign goods . . . also has an adverse effect on aggregatedemand.” Naturally, therefore, the initial “transient boost to industrial pro-duction during the 1990s” to meet the elite’s pent-up demand for luxuryconsumption goods was short-lived; by the end of the decade “this stimu-lus had exhausted itself, landing the economy in the throes of an industri-al stagnation.” Moreover, “the inflow of net imports (financed, for exam-ple, through foreign capital inflows) was certainly an important reasonbehind the emergence of a demand constraint during the 1990s.” In addi-tion, structural adjustment has created a situation “that aggravates ruralpoverty” and has led to a fall in real wages of rural workers, all of whichhad “a demand-compressing effect” (2003: 183–97).
Although India may not have suffered as badly as some other third-world countries, for Patnaik “many of the tendencies associated with a lib-eralized third world economy, namely, accentuation of economic inequali-ties, the preservation of and even a marginal increase in rural poverty, wors-ening of the food supply situation, the transformation of the economy intoa demand-constrained system, a tendency towards industrial stagnation,and vulnerability to speculative capital flight, are already evident.” Thehypothesis, then, has very much to do with India’s experience, not the thirdworld in general. Needless to add, its thrust is accepted among a wide con-stituency in the intellectual and political arenas in India.
MethodologyThe more interesting task is to test the hypothesis empirically in a system-atic way. There are two ways in which the hypothesis can be tested: Oneway would be (a) develop appropriate indicators for the independent vari-able (globalization) and the dependent variables—stagnation, deindustrial-ization, denationalization, destabilization, and impoverishment; then (b)
4 Baldev Raj Nayar

India’s Globalization 5
take a large sample of developing countries for purposes of testing; andfinally (c) assess on a cross-national basis whether the suggested hypothe-sis is confirmed or not by this extensive procedure of examining the rela-tionship between the dependent and independent variables across the largesample of countries. Some excellent work in this genre is available on thedeveloping world comprehensively (Garrett 2001) and in more geograph-ically limited quantitative studies (Stallings and Peres 2000; Kaufman andSegura-Ubiego 2001).
The other way is to select one or more developing countries for anintensive examination as case studies. The first method has the merit ofmore extensive coverage, the second has the advantage of greater in-depthanalysis, which allows for more empirical richness and the potential fordeeper insights. Indeed, even some of the most sophisticated quantitativeanalyses (Kaufman and Segura-Ubiego 2001) end up stating: “Like moststatistical studies, our findings leave open a variety of questions, many ofwhich can be answered only by more qualitative research methods.” Again,despite much econometric analysis, Stallings and Peres (2000) perforceresort to “qualitative, historical analysis” because “the complex interrela-tion of variables leads to the use of such methodology.” Besides, the casestudy approach itself can also fall within the genre of comparative studydepending on the nature of the questions asked—that is, whether they arenomothetic or ideographic. In the present case, the questions have beenformulated in the form of a hypothesis that can also be the basis of a com-parative quantitative study.
It is the second method that has been chosen here (though elementsof the first method are included), and India is the country that has beenchosen for investigation. India constitutes an important case for suchstudy, because it is a mega-state that includesabout one-fifth of the population of the devel-oping world, containing more people than allof Africa or the Western Hemisphere. Largelyunique among developing countries (“Indianexceptionalism”), it has remarkably sustained ademocratic framework for more than a half-century. It is unrivalled in thedeveloping world for its ethnic and linguistic diversity; the presence of alarge number of states within its ethnic federation—many of which them-selves surpass the populations of most developing countries—opens uppossibilities for comparative study among them.d
India constitutes an
important case…study
d

The research strategy employed for examining the hypothesis is, then,a case study of India’s experience with globalization and the related processof economic liberalization. The rest of the study investigates the extent towhich that experience conforms to the hypothesis. It first examines the
nature and extent of the reintegration of India’s econo-my with the world economy and then assesses the con-sequences of such reintegration for the economy interms of the hypothesis, which forms the bulk of thestudy. In assessing the consequences of globalization forIndia’s economy, the study compares the experience ofthe period under globalization—with its different phas-es delineated—with that under non-globalization, astep that is absolutely essential. In its absence, globaliza-
tion is likely to be assessed against some ideal world that exists nowhere,and unwarranted assumptions are likely to be made about the possible con-sequences of constraining or ending globalization.
Briefly, the larger argument of the present study, based on considerablequantitative and qualitative evidence, is that India’s experience with glob-alization and liberalization over the period from 1975 to 2005 does notconform to the hypothesis. In other words, the experience of India has notfurnished the critics of globalization with much basis for argument.e
Complexity in Assessing Globalization’s ImpactDespite its importance, the issue of assessing the economic consequencesof globalization is not an easy one, especially if the assessment takes, as thepresent study does, a comprehensive view. To begin with, globalizationitself is a social phenomenon of systemic proportions, embodying contra-dictory processes and different crosscurrents. Again, no single variable canexplain such a broad and multifaceted phenomenon as the economy. Inparticular, where multiple variables are involved, as in the present case, itwould be difficult to determine the effect of any single variable with anydegree of precision or definitiveness. At best, one can only discern whetherglobalization is associated with changes in areas where it is reasonablyexpected to have an impact, such as economic growth, asset ownership,economic stability, and even human welfare. At the same time, any assess-ment of the consequences of globalization would have to be sensitive to theimpact of other variables.
Among these other variables, there is none more important than thestate, whether for good or ill. The state is critical to globalization. For one
6 Baldev Raj Nayar
the experience of
India [refutes
the critics]
e

India’s Globalization 7
thing, appropriate state policy is essential to benefit from the claimedbenign aspects of globalization and to obviate its alleged malign aspects.Indeed, the very diffusion of globalization presupposes state action.Globalization does not work its way auto-matically into a nation’s economy; itrequires state action to remove the blockingmechanisms in its path so that the economycan partake of it. In that sense, the statecontinues to be important, even under glob-alization. Importantly, it is not a helplessentity in coming to terms with globalization. As a gatekeeper between theworld economy and the national economy, the state can to a considerableextent determine the degree of openness to the world economy as it navi-gates the opportunities and risks involved in international integration.2f
Such a stance serves to underline the basic importance of public poli-cy. Even if the consequences of globalization are taken to be as benign asits enthusiasts insist, it is not a panacea, and it does not work instantly allby itself. It requires appropriate public policy tofacilitate its benign effects. This applies as muchto states within a federation as it does to nation-states. At the same time, no amount of globaliza-tion can entirely undo the effects of, or compen-sate for, bad or imprudent policy on the part ofthe state. At the most basic level, there must beadequate governance in the form of maintenance of law and order andsecurity of life and property. Governance matters. The lack of adequatecapacity for governance can hardly be propitious for economic growth, asis evident in the state of Bihar. Understandably, nation-states as well astheir constituent political units differ in this regard.g
Besides, the structure of the state itself has a crucial bearing on eco-nomic policy. Authoritarian and democratic regimes, for example, differfundamentally on how national goals and public policies are formulatedand implemented. In authoritarian systems, the state can largely imposegoals and policies on society from the top. On the other hand, goals andpolicies in democratic systems evolve through bargaining in the politicalmarketplace; they are a function largely of the balance of forces amongelectorates, interest groups, and political parties. Take, for example, theCongress-led coalition government in power in India since May 2004; the
the state can…determine
the degree of openness to
the world economy
f
globalization…is not
a panacea
g

aspirations of its reform “dream team” are heavily circumscribed by what isacceptable to the Left. The basic problem in democracies is not knowledge
but action. There is a surfeit of policy pro-posals for economic reform from a variety ofcommissions, committees, and task forces inthe government and international financialinstitutions, but movement to implementthem is excruciatingly slow because of therequirement of support for them from criti-cal support groups.h
Furthermore, authoritarian and democratic regimes differ significant-ly in their responsiveness to demands on the part of the population forexpenditure by the state (Goyal and Jha 2004). In an effort to enhancetheir electoral appeal, governments under democratic regimes tend toemphasize consumption over investment.
Thus, in the Indian case, both the specific extent of openness to glob-alization and the nature of its political system are fundamental factors inevaluating economic performance. What or how much ought to be attrib-uted to one or the other can be a difficult proposition. Given the ambigu-ity of social facts, human beings are likely to differ over interpreting them.
The complexity of assessing the economic consequences of globaliza-tion ought not to deter analysis, however. The importance of the issuedemands an analysis grounded in empirical evidence, even if it is con-strained by some limits rooted in the complexity of the subject matter.
India’s Reintegration with the World Economy: Its Limited Nature
With the twin aims of achieving economic advance and establishing “thesocialistic pattern of society,” India under a highly interventionist state in1956 launched a gigantic and overly ambitious import substitution indus-trialization (ISI) program, the hallmark of which was the heavy industrystrategy under the aegis of the public sector. Influenced significantly by theSoviet model and powerfully attracted by the notion of economic inde-pendence as a necessary complement to and foundation of political inde-pendence, India’s economic planners sought to install a regime of econom-ic autarky that delinked or disassociated the national economy from theworld economy. The strategy, which was structurally biased against agricul-ture and exports, essentially entailed a “command and control economy”that relied on physical controls and was restrictive toward the private sector.
8 Baldev Raj Nayar
The basic problem in
democracies is not
knowledge but action

India’s Globalization 9
While India succeeded in setting up a complex and diversified indus-trial system through this strategy, for a long time it was stuck with eco-nomic stagnation in the form of an annual economic growth rate ofaround 3.5 percent, the so-called “Hindu rate of growth.” It also becameeconomically marginalized in the world economy, with a secular decline inits share of world trade. Dissatisfied with this level of performance, thegovernment eventually jettisoned the strategy in favor of moving to eco-nomic liberalization—and with it reintegration with the world economy.
Globalization and LiberalizationGlobalization as the sharper and continuing integration of the world econ-omy is an ongoing economic process, not an end-stage. Consequently, anydetermination of its emergence is inherently arbitrary. Though globaliza-tion in its contemporary phase can be considered to have been underwayover a longer duration in the postwar period, 1975 can serve as a conven-ient point demarcating the period of globalization from the pre-globaliza-tion one. Such a temporal demarcation proceeds from the recognition ofthe transformative impact on the integration of the world economy of thecollapse in 1971 of the Bretton Woods regime and the earthshakingOPEC oil price shock of 1973. Besides, in the pre-globalization period asunderstood here, inward-oriented ISI policies as a matter of deliberatestrategy were the norm in much of the developing world—large portionsof the world economy, such as the Soviet bloc, China, and India, wereunder regimes that were committed to economic autarky.
Interestingly, the start of India’s reintegration into the world economythrough a policy of economic liberalization, at least in its nascent form,coincides temporally with the onset of globalization in the postwar period.Globalization as a social phenomenonand liberalization as a national project,though conceptually distinct, are linkedprocesses. They are two sides of the samecoin—each presupposes, compels, orentails the other. Globalization as themore comprehensive process and com-pelling force generates pressures on closedeconomies to open up. To fail to respond constructively to such pressuresis to forgo the benefits of participating in a wider, and therefore more pro-ductive, division of labor and to incur losses from perverse economic andsocial effects such as smuggling.i
Globalization…and
liberalization [are distinct
but linked processes]
i

At the same time, economic liberalization within a country createspressures to integrate the national economy with the world economy.Economic liberalization is at times differentiated between external liberal-ization and internal liberalization. The former relates to facilitating open-ness of the national economy to the world economy and seems essentiallysynonymous to globalization and its diffusion. On the other hand, inter-nal liberalization pertains to deregulation and decontrol in a national econ-omy. However, such liberalization cannot remain limited to the internalrealm alone, for it is likely to generate pressures to widen its scope to exter-nal liberalization as well. Say, for example, a country commences econom-ic reform and removes restrictions on production by the private sector inorder to accelerate growth. Eventually the state would have to allowimports of capital goods and intermediate goods to increase production—and that means integration into the world economy. And if it allowsimports of these goods, then it must also promote exports in order to payfor them—further integration into the world economy.
Although they are treated as different concepts, globalization and liber-alization in the actual world are, in effect, almost equivalent and interchang-eable terms. As the broader concept, globalization encompasses and entailsliberalization. It would therefore be futile to attempt to disentangle the twoin a vain effort to determine the separate effects of each on the economy.
India’s Long March to Economic LiberalizationThe year 1991 is often cited as marking the initiation of economic liberal-ization in India. However, some analysts (Virmani 2004; Panagariya2004), attempting to explain the country’s equally strong economic per-
formance during the 1980s, place the start-ing point of economic reforms around 1980.But they provide neither evidence of reformin 1980 (or even the early 1980s) nor anycompelling rationale for such reforms. Whatthe analysts (Rodrik and Subramanian 2004;Virmani 2004) see in the early 1980s is noteconomic policy reform but merely a changein Indira Gandhi’s attitude toward busi-ness—which, again, goes unexplained. They
regard Rajiv Gandhi to have carried out reform more explicitly from 1985onward during the remainder of the 1980s. On the other hand, the workof other analysts (Joshi and Little 1994; Nayar 2001; Dhar 2003) provides
10 Baldev Raj Nayar
the early 1980s…
[witnessed] a change
in Indira Gandhi’s
attitude toward business

India’s Globalization 11
considerable evidence that the reforms actually began in late 1974.Significantly, such reforms—or at least hesitant and tentative first steps—took place under the stimulus of an enormous economic and political cri-sis, and they were then carried forward incrementally in a long but stillfairly incomplete process of economic liberalization. This revisionist posi-tion, while largely accurate, needs a slight elaboration.j
The period from 1969 to 1973 witnessed an intense radicalization ofeconomic policy through large-scale nationalization of banking and indus-try and the further tightening of restrictions on the private sector in thename of curbing monopolies (Nayar 1989: 282–327). Whether because ofthis policy thrust under Prime Minister Gandhi or because of externalshocks (droughts, war, quadrupling of global oil prices), there occurred asocially ravaging deterioration of the economy, which then spilled overinto societal and political upheaval. In this circumstance, apart from sav-agely crushing a massive railway strike in May 1974, the government nowchanged economic course. It rescinded the nationalization of the wholesalewheat trade and jettisoned plans to nationalize the entire wholesale food-grains trade. More important, besides adopting a deflationary policy pack-age in July, it introduced deregulation and export promotion measures ontop of the earlier de facto currency devaluation (Joshi and Little 1994: 56).
The government made a sharp departure from the earlier pattern ofimposing ever-expanding and increasingly severe restrictions on produc-tion by the private sector. In an effort to boost non-traditional exports, itnow allowed fifteen export-oriented engineering industries to increasetheir production capacity by 25 percent over five years without prior per-mission. More broadly, to facilitate expand-ed production for exports, the governmentshifted to automatic licensing for theimport of raw materials and componentsfor export-oriented industries. To the sameend, it increased import entitlements forselected industries. The government alsoliberalized the provision of finance for theexport sector at concessional rates of interest. Further, it increased cashincentives for exports and expanded such entitlements to industries hith-erto not covered, such as engineering, chemicals, synthetic fibers, and gar-ments. The government crucially took to “selective abolition of exportlicensing and simplification of procedure. The licensing formalities were
Such changes…mark a
significant break with the
earlier radical course
k

dispensed with for nearly two-thirds of the 300 items which were subjectto export licensing earlier” (RBI 1976: 198–201; see also Dhar 2003:23–24). Such changes may not seem earthshaking in retrospect, but theymarked a significant break with the earlier radical course. Moreover, giventhe severe and extensive distortions that had come to inform the econom-ic system through escalating government controls and restrictions, theycontained a disproportional potential for spurring growth by providinggreater leeway to entrepreneurs.k
In view of this reversal of course, though nascent in form, 1975 is hereroughly regarded as demarcating the initiation of India’s effort to reinte-grate its economy with the world economy in direct contrast with the ear-lier attempts at economic autarky. Thus considered, 1975 marks the initialphase of a long liberalization process—to which the later reforms consti-tute a sequel. Incidentally, an econometric study (Wallack 2003), investi-gating the question of structural breaks in the Indian economy, finds 1974and 1980 to be “the two most robust break” years. The phase of liberaliza-tion inaugurated in 1975 was driven by dissatisfaction with performanceunder the earlier economic regime, not by any attempt at emulation of lib-eralization in some other successful countries or by any direction or coer-cion by foreign agencies to implement the “Washington consensus”(Williamson 1990: 7–38), which had not been developed yet. After thecourse reversal in 1975, there followed other economic reforms.
When Prime Minister Gandhi returned to power in January 1980after the 1977–79 interregnum of Janata Party rule, she resumed thecourse of economic reform in the context of an economic crisis resultingfrom an unprecedented drought and the doubling of global oil prices.One of the first noteworthy economic policy actions of her governmentwas the issuance of an Industrial Policy Statement in July 1980 to adjustthe Industrial Policy Resolution of 1956 to new circumstances.Continuing the liberalization inaugurated during the economic crisis of1974–75, the new policy extended the permission for automatic expan-sion of capacity by 25 percent over five years to a much larger number ofindustries (Lok Sabha Debates, July 23, 1980: 367–82). The governmentfurther adopted a more liberal stance toward the import by industry ofraw materials, spare parts, and, especially, technology. Significantly, thenumber of foreign collaborations approved annually suddenly more thandoubled. These various reforms were consolidated in the Sixth Five YearPlan. When India went in for an IMF loan in 1980, it preempted the
12 Baldev Raj Nayar

India’s Globalization 13
application of conditionalities that would likely have been placed on it onthe plea of having already accomplished the necessary reforms on its own(Stiles 1991: 114–15, 121, 122).
In 1982, a more dramatic shift in industrial policy incorporated twonew measures. One extended the principle of automatic expansion oflicensed industrial capacity to permit expansion by a third rather than afourth as before. The other enlarged the list of “core” industries that wouldbe open to large industrial houses and foreign companies (Lok SabhaDebates, April 21, 1982: 484–85; GoI 1983: 30). Again, the governmentallowed the private sector to enter new areas of industrial activity, such aspower and oil exploration, that were earlier closed to it. Further, it abol-ished government-administered prices for pig iron and brought about par-tial decontrol of cement (GoI 1983: 25, 30). Significantly, Prime MinisterGandhi appointed two important committees, one on licensing controlsand the other on trade liberalization, the recommendations of whichwould have a considerable impact on subsequent liberalization.
When Rajiv Gandhi became prime minister after his mother’s assassi-nation, he openly embraced and accelerated economic liberalization. Thiswas unlike his mother, whose “liberaliza-tion by stealth” was masked by socialistrhetoric. Remarkably, his liberalizationprogram was undertaken without thestimulus of an economic crisis. Despiteits great promise, the program was soonhalted in the face of strong opposition,however. Panagariya (2004) has provideda comprehensive account of the various measures undertaken by the gov-ernment under Rajiv Gandhi, which encompassed both internal andexternal liberalization.l
The various installments of economic reform undertaken thus far—sometimes characterized as “creeping liberalization”—while extremelyimportant in themselves and for revealing a new path, represented within-system change under the umbrella of the continuing inward-oriented eco-nomic regime. It was left to another economic crisis to provide the stimu-lus for a paradigm shift in 1991 to an outward-oriented economic regimeopenly seeking integration with the world economy in explicit emulationof the newly industrializing countries of East and Southeast Asia. Apartfrom a sharp devaluation, there was a gradual unification of exchange
Rajiv Gandhi…openly
embraced and accelerated
economic liberalization
l

rates, even as the national currency was made convertible on the currentaccount. The government also slashed tariffs, gradually removed quantita-tive restrictions on foreign trade, all but dismantled the system of industri-al licensing, and sharply reduced taxes (Joshi and Little 1996; Ahluwaliaand Little 1998; Nayar 2001). However, once the crisis was over, the thrustfor liberalization went with it. Economic liberalization was limited, but theprocess nonetheless continued through piecemeal measures under the aus-pices of a variety of successive governments.
In view of the various changes in economic policy, the following threebroad periods can be delineated for the purpose of making a comparativeassessment of the economic consequences of globalization (the Indian fis-cal year runs from April 1 to March 31):
1. 1956–57 to 1974–75, the dominant feature of which was thethrust for autarky and the “command and control” economy. Theperiod began with the launching of the Second Five Year Plan(1956–57/1960–61) with its inward-oriented heavy industry strat-egy. In the final year of the period, there was, as mentioned above,some turning away from its central feature.
2. 1975–76 to 1990–91, during which there occurred intermittentincremental liberalization but still within the earlier inherited frame-work of the inward-oriented economic strategy. This period can bedifferentiated into two parts, the first one of (a) nascent liberaliza-tion from 1975–76 to 1983–84, largely under Indira Gandhi, andthe second one of (b) explicit but stalled promotion of liberalizationfrom 1984–85 to 1990–91, largely under Rajiv Gandhi.
3. 1991–92 to the present, characterized by the paradigm shift in eco-nomic policy to liberalization, although admittedly in a half-heart-ed, halting, and limited form.
In light of this temporal differentiation, the decade and a half or sobetween 1975 and 1991 can properly be regarded as a long transition fromautarky to partial reintegration with the world economy. On the otherhand, the entire period after 1975 can be treated as one of extended liber-alization. Over the course of this long transition, the same intellectual andpolitical forces that would later attack and oppose the paradigm shift hadalso attacked and opposed the intermittent incremental reforms (Nayar1989: 322, 326–27, 338). Earlier, they had greeted similarly the change inthe mid-1960s to the modern, technology-driven, entrepreneurial agricul-tural strategy known as the Green Revolution strategy, which also modified
14 Baldev Raj Nayar

India’s Globalization 15
to some extent the inward-oriented economic strategy and the “commandand control” economy.
The Nature and Extent of ReintegrationThe nature of an economy’s integration with the world economy can beassessed through three different indicators: (1) trade in goods and servic-es, (2) capital flows, and (3) migration of people. The changes in theseindicators in India are discussed below; the purpose here is not to providea substantive analysis about these indicators but simply to assess the degreeto which India has become integrated into the world economy.
TradeIn regard to trade in both goods and services, what is noteworthy first andforemost is the dramatic change in India’s integration with the world econ-omy. In 1974, India’s trade (imports plusexports) as a proportion of its GDP wasaround 10 percent (already a substantialimprovement over its earlier performancebecause of the tacit but significant cur-rency devaluation following the linkageof the rupee with the weak sterling inDecember 1971). By 2002, however, thatproportion had about tripled to nearly 31 percent (table 1). At that level,India in 2002 was more globalized than the United States (23.6 percent)and Japan (21.0 percent). Even so, India was at the lower end of interna-tional integration.m
The twenty-five largest national economies in 2002 (table 2) can bedivided into four categories in terms of the share of trade in GDP: medi-um (20–49 percent), high (50–79 percent), very high (80–110 percent),and super high (above 110 percent).Significantly, none of these major eco-nomic powers are below the 20 percentlevel. India is in the medium category,but it is telling that it has very little com-pany in that category—the only othereconomic powers there are Japan, the United States, Brazil, and Australia.By contrast, the other twenty countries all have higher rates. It is signifi-cant that the more dynamic among the developing economies belong tothe high category (China: 54.8 percent; Indonesia: 65.1 percent; Korea:
India in 2002 was more
globalized than the United
States and Japan
m
China’s performance defies
the conventional wisdom
o

69.1 percent; Mexico: 55.5 percent). Indeed, China’s performance defiesthe conventional wisdom that exports are a low share of GDP in largeeconomies. Regardless, the record of the more dynamic among the devel-oping economies underlines the long road that India still has before it.o
Despite its belonging to the medium category, India has nonethelessmade rapid strides toward international integration when compared withits experience prior to liberalization. Looked at from a long-term perspec-tive in relation to merchandise exports alone, it took twenty-three years forIndia’s exports to double in dollar value (1949–72; table 3). They thendoubled in the next four years (1972–76), but this result may partly be anillusion because of the commodity boom following the first OPEC oilprice shock. However, they doubled again in the next eleven years(1976–87), nearly doubled again in the next six years (1987–93), and stillagain in the next eight years (1993–2001).
16 Baldev Raj Nayar
Year Exports Imports Total Trade Year Exports Imports Total Trade % % % % % %
1970 3.61 4.49 8.10 1987 5.72 7.13 12.851971 3.72 4.64 8.36 1988 6.15 7.59 13.741972 4.14 4.36 8.49 1989 7.12 8.27 15.391973 4.03 4.70 8.73 1990 7.15 8.56 15.711974 4.75 6.13 10.89 1991 8.61 8.61 17.231975 5.95 7.00 12.95 1992 8.99 9.75 18.751976 6.73 6.79 13.52 1993 10.03 10.01 20.041977 6.40 6.55 12.94 1994 10.03 10.34 20.371978 6.19 7.77 13.96 1995 11.00 12.20 23.211979 6.54 8.94 15.48 1996 10.59 11.77 22.361980 6.28 9.46 15.74 1997 10.85 12.11 22.961981 6.08 8.78 14.87 1998 11.22 12.91 24.131982 6.14 8.36 14.50 1999 11.76 13.72 25.471983 5.99 8.05 14.04 2000 13.89 14.65 28.541984 6.45 7.94 14.39 2001 13.48 14.10 27.581985 5.38 7.83 13.20 2002 15.22 15.60 30.821986 5.32 7.19 12.50 2003 14.48 15.99 30.47
2004 15.35 17.24 32.58
Source: World Development Indicators (WDI), available at devdata.worldbank.org/datalonline.
Table 1: India’s Foreign Trade in Goods and Services as a Share of GDP (%)

India’s Globalization 17
Before the beginning of economic liberalization in 1975, India hadmanifested stagnation in its trade performance. Indeed, as a share of worldexports, India’s merchandise exports went into a steep long-term declineover this period, falling almost every year, from 2.17 percent in 1949 to0.48 percent in 1974 (table 3), remarkably consistent with the country’sautarkic aims. Following the start of liberalization in 1975, India’s interna-tional integration in terms of trade fell into three major phases. There was,in the first phase of four years from 1975 to 1978, a sudden spurt ingrowth of exports, taking India’s share of world exports to an average ofaround 0.55 percent, but this performance was not sustained. In the sec-ond phase, from 1979 to 1991, the share fell into an unstable, stagnantpattern of a little up or a little down, with the average below 0.50 percent.Only in the third phase beginning in 1992 did there occur a slow but con-sistent rise, from 0.52 percent to 0.77 percent in 2002 (table 3) and,reportedly, to 0.82 percent in 2004 (Economic Times Online, April 29,2005). During this phase, India’s exports grew at a higher rate than worldexports. In the six years from 1999–2000 to 2004–05, exports in dollarvalue grew at over 15 percent, and they have moved to a higher growth tra-jectory since 2002–03, whence they have grown at over 20 percent (GoI
Medium (20–49%) High (50–79%) Very High (80–110%) Super High (110+%)
Australia 41.8 Korea, Rep. 69.1 Austria 103.1 Belgium 160.5India 30.8 Norway 68.8 Denmark 83.9 Netherlands 118.1Brazil 28.9 Germany 67.0 Canada* 82.5USA 23.6 Indonesia 65.1 Switzerland 81.8Japan 21.0 Turkey 59.9 Sweden 80.5
Russia 58.8Poland 58.7Spain 58.5Mexico 55.5China 54.8UK 53.4Italy 52.8France 52.1
*Figure for 2001
Source: World Development Indicators (WDI) Online.
Table 2: Share of Trade in GDP (%) of theWorld’s Top 25 Economies in 2002

2005: 113, S-79). Thus, the last buoyant phase since 1992 marks a sus-tained reversal of the secular decline that had started in 1950. Indeed, oneauthority maintains that “in our own gradual, laid-back sort of way, weseem to be moving closer to the export-led growth model that our East andNorth Asian neighbors have exploited so well” (Barua 2005). They take theincrease in exports to have contributed more than a quarter of the increasein GDP during the business boom over several years following 2001.
18 Baldev Raj Nayar
Year World India % Year World India %
1949 55.2 1.197 2.17 1976 953.4 5.549 0.581950 57.1 1.145 2.01 1977 1,080.5 6.378 0.591951 77.4 1.602 2.07 1978 1,251.5 6.671 0.531952 74.5 1.243 1.67 1979 1,618.4 7.806 0.481953 75.6 1.102 1.46 1980 1,931.7 8.586 0.441954 77.8 1.169 1.50 1981 1,924.4 8.295 0.431955 84.9 1.263 1.49 1982 1,777.2 9.358 0.531956 94.6 1.257 1.33 1983 1,736.0 9.148 0.531957 101.5 1.380 1.36 1984 1,840.8 9.451 0.511958 96.7 1.216 1.26 1985 1,875.8 9.140 0.491959 102.6 1.323 1.29 1986 2,048.5 9.399 0.461960 114.6 1.332 1.16 1987 2,419.0 11.298 0.471961 119.8 1.386 1.16 1988 2,765.2 13.234 0.481962 125.5 1.403 1.12 1989 3,008.5 15.872 0.531963 137.4 1.626 1.18 1990 3,423.4 17.969 0.521964 154.0 1.705 1.11 1991 3,534.0 17.727 0.501965 167.1 1.687 1.01 1992 3,775.9 19.628 0.521966 183.6 1.954 1.06 1993 3,768.7 21.572 0.571967 192.7 1.613 0.84 1994 4,287.7 25.022 0.581968 215.2 1.761 0.82 1995 5,129.6 30.630 0.601969 246.6 1.835 0.74 1996 5,351.5 33.105 0.621970 300.1 2.026 0.68 1997 5,537.2 35.008 0.631971 336.4 2.036 0.61 1998 5,450.7 33.437 0.611972 398.8 2.448 0.61 1999 5,649.8 35.667 0.631973 552.6 2.917 0.53 2000 6,360.7 42.379 0.671974 811.3 3.926 0.48 2001 6,128.9 43.347 0.711975 845.4 4.355 0.52 2002 6,419.1 49.327 0.77
2003 7,430.8 57.100 0.77
Source: International Monetary Fund, International Financial Statistics Yearbook, 1979, 2000, 2003, 2004.
Table 3: India’s Merchandise Exports as a Share of World Exports (US$, in billions)

India’s Globalization 19
In respect to overall trade in goods and services as a proportion ofGDP, economic liberalization is broadly associated with a rise in thetrade/GDP ratio, though not evenly. There was a sudden rise in the ratioin the second half of the 1970s, so that by 1980 it was about 50 percenthigher than in 1974. There was then a fall over the 1980s followed by astrong upward thrust after the paradigm shift in economic policy in 1991(table 1). That the share in 2004 (32.58 percent) was more than doublethat in 1990 (15.71 percent) is a sign of the quicker pace of integration inrecent years.
The rapid rise in services exports, which have grown faster than mer-chandise trade in recent years, is a noteworthy aspect of India’s new tradeprofile. Along with China, Ireland, and Korea, India has emerged as animportant services exporter on the global scene; its services exports, worth$4.9 billion in 1992, rose to $25 billion in 2003. Services now account for31 percent of India’s total exports. Of particular importance in servicesexports are software exports, in which India has emerged as a substantialglobal player. Growing at an annual compound rate of about 36 percentbetween 1995–96 and 2003–04, software exports formed about half (48.9percent) of all services exports in 2003–04 (GoI 2005: 111–12).
Examined from the viewpoint of both the trade/GDP ratio and thegrowth of merchandise exports in dollar value during the period after thestart of liberalization in 1975 and particularly after the paradigm shift in1991, it is manifest that India is now significantly integrated into theworld economy. The fate of India’s economy has thus become intertwinedwith the fate of the world economy, though not as intensely as that of mostof the other major economic powers.3
Capital FlowsThe story on capital flows points in the same direction. For long, Indiawas highly restrictive toward foreign investment, and its restrictive posturereached its peak in the mid-1970s when India forced foreign companies todilute the foreign equity in their subsidiaries in India to 40 percent onpain of having to withdraw from India. Indeed, IBM and Coca-Cola choseto leave India in 1977 rather than dilute equity. Every proposal for foreigninvestment in India required specific approval from the central govern-ment. Because of India’s restrictive posture, in the ten years from 1975 to1984 FDI net inflows to India were $434.8 million in all (table 4). Overthis entire period, they never reached the figure of even $100 million inany year; indeed, the figure in 1977 was a negative $36.10 million.

Gradually, however, in the 1980s, India began to relax its attitude. Forthe first time, in 1985, FDI net inflows crossed the figure of $100 million.In the next seven years, the average was about $180 million a year. Afterthe economic liberalization of the early 1990s, FDI net inflows expandedquickly, reaching the figure of over $2 billion in 1995; the annual averagebetween 1995 and 2000 was about $2.5 billion. The high point was in2001, when FDI net inflows exceeded $4 billion (table 4).
No doubt, the recent figures look good; indeed, in 2003 and 2004,India ranked fourth—after China, Hong Kong, and Singapore—amongFDI recipients in Asia and the Pacific (UNCTAD 2004: 51). But therecord looks impressive only against India’s own past experience.Compared to China’s achievement of $49.3 billion in FDI net inflows in2002, it seems rather pathetic. FDI net inflows to India as a share of suchinflows to developing countries have been about 1.5 percent; as a share ofIndia’s GDP they have been less than 1 percent (GoI 2002: 14–15).Understandably, this performance relative to China’s has been a source ofunhappiness and concern about the country’s inability to attract FDI inadequate measure. Despite the progressive relaxation of restrictions onFDI, a number of factors have acted as a deterrent to increased FDIinflows: bureaucratic hurdles and red tape, inflexible labor laws, “weakcredibility of regulatory systems,” poor infrastructure, and delays in thejudicial system (ibid.: 21–29).
India was quite late in allowing portfolio foreign investment (PFI).It was not until September 1992 that India permitted investment byforeigners in securities traded on India’s primary and secondary markets.But it required such investment to be channeled only through foreigninstitutional investors (FIIs), who had to register with the Reserve Bankof India and were subject to investment ceilings in particular sectors(GoI 2004b: 7–9). PFI inflows have been considerable since then, oftenmore than FDI inflows and sometimes strikingly so. India attracts a farhigher proportion of the PFI flows to developing countries than it doesof FDI. PFI inflows to India exceeded a billion dollars in 1993; the an-nual average from 1994 to 2003 was over $3 billion (table 4); the figurefor 2003 was a spectacular $8.2 billion. Such high inflows, while in-dicative of the confidence of foreign investors in the Indian economy,have created anxieties about externally driven monetary instability.Besides, they seem to have made the FIIs by far the dominant player inIndia’s stock markets. While this view has been questioned by the govern-
20 Baldev Raj Nayar

India’s Globalization 21
FDI Net Inflows PFI Equity Inflows Number of RemittancesYear ($, in millions) ($, in millions) Emigrants ($, in billions)
1975 85.10 0.00 N/A 0.43
1976 51.10 0.00 4,200 0.64
1977 -36.10 0.00 22,900 0.93
1978 18.10 0.00 69,000 1.16
1979 48.60 0.00 171,000 1.44
1980 79.20 0.00 236,200 2.76
1981 91.90 0.00 276,000 2.30
1982 72.10 0.00 239,545 2.62
1983 5.60 0.00 224,995 2.66
1984 19.20 0.00 205,922 2.29
1985 106.10 0.00 163,035 2.47
1986 117.70 192.00 113,649 2.24
1987 212.30 0.00 125,356 2.66
1988 91.30 56.00 169,844 2.31
1989 252.10 168.00 126,786 2.58
1990 236.70 0.00 143,565 2.35
1991 73.54 4.60 197,889 3.28
1992 276.51 283.60 416,784 2.89
1993 550.02 1,369.10 438,338 3.50
1994 890.69 5,491.10 425,385 5.78
1995 2,026.44 1,590.50 415,334 6.14
1996 2,186.73 3,958.30 414,214 8.45
1997 3,464.41 2,555.70 416,424 10.30
1998 2,587.06 -601.20 355,164 9.45
1999 2,089.23 2,317.10 199,552 11.00
2000 3,074.68 2,475.40 243,182 12.75
2001 4,073.96 2,951.50 278,664 14.16
2002 3,947.90 1,063.80 367,663 15.65
2003 3,260.04 8,237.00 466,456 21.60
Source: For capital inflows and workers remittances: World Development Indicators (WDI)Online; starting in December 2005, the WDI database no longer provides FDI figures before1991. For number of emigrants: (a) through 1989, International Organization for Migration,World Migration Report 2000, 110, and (b) after 1989, “Distribution of Annual Labor Outflowsfrom India by Destination,” available Online at www.indiastat.com.
Table 4: Capital Inflows, Labor Emigrants,and Inward Workers Remittances: India

ment, nonetheless “India is now more integrated with the factors thataffect all emerging markets such as world trade, portfolio flows, and FDI”(GoI 2005: 82).
MigrationContemporary globalization has often been unfavorably contrasted withthe globalization of the nineteenth century because of the massive humanmigration characteristic of the earlier period, including large outflows ofcontract labor from India, as also happened in China. This may, however,be a debatable issue, because, as the United Nations puts it: “In the pastfew decades, international movements of people have increased alongside,though less strongly than, the expanded international flows of goods andcapital” (2004: v). The International Organization for Migration (2000:4–5) puts the number of long-term (resident more than one year) migrantsin 1990 at 120 million, and the figure is estimated to have grown to 150million by 2000.
In the postwar period, the migration of workers from India beganwith globalization in the mid-1970s and quickly expanded to over200,000 labor emigrants by 1980. The movement slowed down to about150,000 by 1985 but escalated to over 400,000 in 1992 after the econom-ic liberalization of the early 1990s. In 1998, however, there was a reversemovement of the increasing trend, with the numbers falling sharply tobelow 200,000. However, the rising trend picked up again in 2000 andthe numbers swelled to a record level of over 460,000 by 2003 (table 4).The actual numbers of emigrants may have been as much as 30 to 50 per-cent higher, for only documented emigrants are covered in the officialdata. The International Organization for Migration believes that over 90percent of the labor emigrants from India went to the Middle East as tem-porary workers, and some 55 percent of them came from one state, Kerala(2000: 116; 2003: 19).
While this level of emigration is not significant as such in view ofIndia’s large population, one important by-product of it has been to stim-ulate a substantial reversal of capital flows to India. Starting with insignif-icant amounts in the mid-1970s, remittances to India from workersemployed or intending to remain employed abroad for more than a yearwere over $2 billion a year from 1980 to 1990. Thereafter they rose rapid-ly, passing $10 billion in 1997 and $15 billion in 2002. In 2003, theypassed the unprecedented and enormous figure of $21 billion (table 4).Note that these remittances have, except in 1994, invariably outstripped
22 Baldev Raj Nayar

India’s Globalization 23
FDI and PFI inflows put together—often by a wide margin—and werealmost twice their combined size in 2003. With a share of 15 percent ofworldwide foreign remittances, India ranks the highest in the world in thisrespect (Sorensen 2004: 8, 11). Such remittances were only 0.7 percent ofIndia’s GDP in 1990–91, but they increased to3.2 percent of the GDP in 2003–04. The bulkof these remittances now comes from theadvanced countries, primarily the United Statesand Europe, unlike the past, when the MiddleEast was the major source (GoI 2005: 111).p
Although it may be debatable as to withwhom the balance of gains and losses lies inrelation to the export of manpower—the hostcountry or the exporting country—there can be no doubt about the mas-sive sums involved in capital flows to India from workers remittances.Remarkably, then, these remittances show the important role that interna-tional labor mobility has come to play in international capital mobility. Inaddition, when strategically necessary, the Indian government has beenable to mobilize substantial resources from its emigrants abroad, as is evi-dent in the floating of the Resurgent India Bonds worth $4.2 billion in1998 and the Indian Millennium Deposits worth $5.5 billion in 2000(Sorensen 2004: 11).
Summary Assessment: Whether looked at from the perspective ofmovement of goods and services, capital, or people, it is patently evidentthat India has become considerably moreintegrated into the world economy since1975, when India began its long but stilluncompleted march to economic lib-eralization. The advance in this respectsince the paradigm shift in 1991 has beenvery substantial. At the same time, ifChina, as a country with a largely similarbackground in terms of population num-bers and stage of development, can be usedas a standard of comparison, then it isequally obvious that India is a case of only limited integration in the worldeconomy. From that perspective, India still has an enormous distance totravel in becoming internationally integrated.q
India ranks the
highest in [worldwide
foreign remittances]
p
India still has an
enormous distance to
travel in becoming inter-
nationally integrated
Q

Assessing the Economic Consequences of Globalization
The account that follows examines seriatim the consequences of globaliza-tion for the economy in terms of each of the principal elements of thehypothesis set forth earlier.
Economic Stagnation or Accelerated Economic GrowthContrary to the position of the critics of globalization, who emphasize eco-nomic stagnation as its likely outcome, the empirical data on economicgrowth rates leave no doubt that the opening to globalization has beenenormously beneficial for economic growth in India. Rather than econom-ic stagnation, globalization has led to the acceleration of the growth rate.r
Table 5 provides data on growth rates, with the years in column 1representing the period before globalization—that is, before 1975—andcolumn 4 the period after globalization. If one compares the pre- and post-
globalization periods, it is abundantly clearthat the latter period is marked by much high-er growth—an average growth rate of 5.5 per-cent instead of 3.4 percent for the earlier peri-od. However, the comparison considerablyunderstates the achievement. The two periodsare internally varied, and the true magnitudeof the difference emerges only when the peri-od in which globalization deepened after the
1991 paradigm shift is set against the last decade of the pre-globalizationperiod, when the long-term consequences of the earlier economic coursebecame manifest.
During the pre-globalization period, the first four years after thelaunching of the autarkic heavy industry strategy in 1956 saw an averagegrowth rate of 3.6 percent, the same as in the five-year period prior to it.However, the strategy resulted in an immediate foreign exchange andresource crisis, and it was rescued only because of the special resourcemobilization organized by foreign donors under the auspices of the WorldBank (Hanson 1966: 162). The subsequent five-year period(1960–61/1964–65) marked the high water mark of the economic per-formance of the heavy industry strategy, with the average growth rate being5.0 percent. This better performance was partly the result of the initialone-time impact of the gigantic ISI strategy, but it was also partly a func-tion of the massive foreign economic assistance provided by both the
24 Baldev Raj Nayar
globalization has led to
the acceleration of
the growth rate

India’s Globalization 25
power blocs in geopolitical competition with each other (Bhagwati andDesai 1970: 171–215). But it was only an aberration.
The strategy soon collapsed under the impact of two wars, twodroughts, donor fatigue, and crisis in the world economy, but fundamen-tally because of its own inherent structural weakness. The average rate ofgrowth over one whole decade, from 1965–66 to 1974–75, was a mere 2.6percent (table 5a), which, in view of the high population growth rate, real-ly meant economic stagnation. Indeed, if there was ever a period markedby economic stagnation in India’s post-independence history, it is precise-ly these ten years. It is against the particular performance of this specificdecade that the subsequent growth acceleration should more realisticallybe compared, rather than that of the entire autarkic period. Indeed, it wasprecisely dissatisfaction with that performance that served as the trigger in1975 for taking the liberalization cure, however modestly at the beginning.
Year GDP % Mfg. % Year GDP % Mfg. %(1) (2) (3) (4) (5) (6)
1951–52 2.3 3.2 1975–76 9.0 2.11952–53 2.8 3.5 1976–77 1.2 8.81953–54 6.1 6.9 1977–78 7.5 6.21954–55 4.2 7.8 1978–79 5.5 12.41955–56 2.6 7.8 1979–80 -5.2 -3.2Average 3.6 5.8 Average 3.6 5.3
1956–57 5.7 7.5 1980–81 7.2 0.21957–58 -1.2 3.9 1981–82 6.0 8.01958–59 7.6 4.9 1982–83 3.1 6.61959–60 2.2 6.8 1983–84 7.7 10.14-Year 3.6 5.8 1984–85 4.3 6.6Average* Average 5.7 6.3
1960–61 7.1 8.3 1985–86 4.5 3.91961–62 3.1 8.5 1986–87 4.3 6.91962–63 2.1 7.3 1987–88 3.8 7.31963–64 5.1 9.5 1988–89 10.5 8.81964–65 7.6 6.9 1989–90 6.7 11.8Average 5.0 8.1 Average 6.0 7.8
Table continued next page
Table 5: GDP and Manufacturing Growth Rates,1951–52 to 2004–05 (1993–94 prices)

Subsequently, during the period of “intermittent incremental liberal-ization” from 1975–76 to 1990–91, the growth rate accelerated to 5.1 per-cent (table 5a). But there are variations within this long period. The initialfour years from 1975–76 to 1978–79, after the change in economic course,
26 Baldev Raj Nayar
Continued from Table 5
Year GDP % Mfg. % Year GDP % Mfg. %(1) (2) (3) (4) (5) (6)
1965–66 -3.7 0.9 1990–91 5.6 6.11966–67 1.0 0.8 1991–92 1.3 -3.71967–68 8.1 0.4 1992–93 5.1 4.11968–69 2.6 5.5 1993–94 5.9 8.51969–70 6.5 10.7 1994–95 7.3 11.9Average 2.9 3.7 Average 5.0 5.4
1970–71 5.0 2.4 1995–96 7.3 14.91971–72 1.0 3.3 1996–97 7.8 9.71972–73 -0.3 3.9 1997–98 4.8 1.51973–74 4.6 4.5 1998–99 6.5 2.71974–75 1.2 2.9 1999–00 6.1 3.9Average 2.3 3.4 Average 6.5 6.6
2000–01 4.4 7.42001–02 5.8 3.62002–03 4.0 6.32003–04 8.5 6.92004–05 6.9 9.2Average 5.9 6.7
1956–57/1974–75 1975–76/2004–05Average 3.4 5.2 Average 5.5 6.4
*This four-year period starts with 1956–57, when the Nehru-Mahalanobis import-substitutionstrategy as embodied in the Second Five Year Plan, emphasizing heavy industry and the publicsector, was launched with the aim of establishing “the socialist pattern of society.” The particulardata series on national accounts on which this table is based begins with 1951–52.
Source: For GDP for all years (except the last one) and for manufacturing from 1951–52 to1960–61: Government of India, Central Statistical Organization (CSO), “National Accounts” –(1) Statement S1-2: Macro Economic Aggregates and Population, and (2) Statement 5: GrossDomestic Product by Economic Activity (available online). For manufacturing from 1961–62 to2003–04: World Bank Indicators (WDI) Online. The figures for 2004–05 are revised estimatesby CSO; see GoI, Press Information Bureau, Press Note dated June 30, 2005,mospi.nic.in/mospi_press_releases.htm.

India’s Globalization 27
saw the average growth rate go up to 5.8 percent, which is more than twicethe average of 2.6 percent for the preceding decade. However, because ofexternal shocks in the form of an unprecedented drought and the doublingof global oil prices, there was a severe setback in 1979–80. There wasresumption of the accelerated growth path during the first half of the1980s, when the average growth rate was 5.7 percent. With the moreexplicit move to economic liberalization in 1985, even though the processwas soon halted, the average growth rate moved up to 6.0 percent in thesecond half of the 1980s.
The pattern of high growth continued into the period after the para-digm shift. If one excludes the “paradigm shift” year 1991–92—in themidst of an economic crisis—then the average growth rate of 6.2 percentover the thirteen years from 1992–93 to 2004–05 provides a stark contrastwith the pre-globalization period. Clearly, as liberalization progressed fromone period to the next, so did the growth rate. Indeed, with an averagegrowth rate of over 7 percent during 2003–04, 2004–05 and 2005–06, “atrend acceleration may be under way,” spelling “a possible ratcheting up of
Table 5a: Growth Rates in Various Combinations of Years
Period GDP (%) Manufacturing (%)
1 Autarky and “Command” Economy (a) 1956–57 to 1974–75 3.4 5.2(b) 1956–57 to 1964–65 4.4 7.1(c) 1965–66 to 1974–75 2.6 3.5
2 Transition to Liberalization(a) 1975–76 to 1990–91 5.1 6.4(a) 1975–76 to 1978–79 5.8 7.4(a) 1975–76 to 1979–80 3.6 5.3(a) 1975–76 to 1984–85 4.7 5.8(a) 1980–81 to 1984–85 5.7 6.3(a) 1985–86 to 1990–91 5.9 7.5
3 Paradigm Shift(a) 1991–92 to 2004–05 5.8 6.2(a) 1992–93 to 2004–05 6.2 7.0
2 + 3 Extended Liberalization(a) 1975–76 to 2004–05 5.5 6.4

the trend rate of growth of the economy from around 6 percent to about7 percent” (GoI 2005: 14). The positive outlook embodied in the preced-ing statement rests on the recognition that the recent growth performanceis, in part, a function of structural change in India’s economy. That changepertains to the faster-growing services sector, the share of which now con-stitutes more than half (52.15 percent in 2004) of the country’s GDP(table 6), while that of the usually volatile agriculture sector has beenreduced to about a fifth (21.79 percent). Note the contrast with the year1970, when agriculture constituted 46.54 percent and services 34.06 per-cent of GDP. Since the time of the stepped-up but within-system liberal-ization under Rajiv Gandhi and through the paradigm shift, the servicessector as part of the GDP has been growing at an annual average rate ofabout 7.60 percent. Analysts differ over whether this is the most desirablesectoral growth configuration, but it is this sector that in recent years hasreally provided the dynamism to the economy, including the exports sec-tor, and there can be no doubt that it is associated with globalization.
28 Baldev Raj Nayar
Table 6: Share in GDP and Growth Rate of Various Sectors (Percent)
Year Agriculture Industry Services
Share in GDP (%)
1960 46.54 19.40 34.061970 46.07 20.65 33.271980 38.86 24.50 36.641990 31.27 27.64 41.102000 24.62 26.60 48.782004 21.79 26.06 52.15
Average Annual Growth Rate (%)
1970–74 1.17 2.02 3.861975–79 1.34 5.35 5.341980–84 5.71 6.03 5.421985–89 3.14 7.57 7.581990–94 3.50 5.31 6.041995–99 2.56 6.31 9.182000–04 1.98 6.23 7.63
Source: World Development Indicators (WDI) Online.

India’s Globalization 29
Given the empirical evidence, it would be difficult to maintain thatIndia’s experience with globalization in any way at all confirms the initialhypothesis; globalization, rather than making for economic stagnation,has led to the acceleration of the growth rate. Ifthe growth rate has not been even higher, as in,say, China, it is also true that globalization hasalso been limited in India’s case, with Indiabeing only a reluctant and partial “globalizer.”What India’s experience makes manifest is thatglobalization has not led to economic stagna-tion; indeed, non-globalization prior to 1975was associated with stagnation, and globaliza-tion rescued India from that fate. Consequently,the stagnationist thesis advanced by globaliza-tion’s critics merits rejection, as had that of theirpredecessors in dependency theory. No doubt, the case of the critics isbroader and encompasses much else, but it could hardly be maintainedthat the stagnation of the non-globalization period is preferable to the eco-nomic advances under globalization.s
International Integration and Economic Growth in the StatesThe case that emerges in favor of globalization on the basis of acceleratedgrowth at the national level in India receives considerable support from theperformance of the constituent states of India in respect of their state grossdomestic product (SGDP). There are some obvious limitations to study-ing the issue at the state level, however. For one thing, unlike the nation-al level of a single nation-state, where shifts in opening up to the worldeconomy can be easily discerned, it is more difficult to delineate similarshifts in the score or so of large political units within the federation.Besides, figuring out causation at the level of the constituent states is moreproblematic in the absence of in-depth analyses of most, if not all, ofthem. For example, does a given state have a higher growth rate because itis more globalized, or is it more globalized because it has a history of high-er growth rates? However, such questions are no different in studying thestates within India than they are in doing cross-national investigations oftrends among the states of the world. They need not therefore deter analy-sis in this case any more than they do in the other.
Consistent with the subcontinent’s immense ecological, economic,and social diversity, the states in India had shown divergent growth rates
stagnation of the non-
globalization period is
[hardly] preferable to
the economic advances
under globalization
s

even before the paradigm shift to economic liberalization in 1991. Studiesof growth rates after 1991 testify to a widening divergence in growthamong the states, leading to sharper disparities in terms of per capita stateincomes (Ahluwalia 2002; Dasgupta et al. 2000; Bhattacharya andSakthivel 2004; Ghosh and De 2004). Taking the greater divergence ingrowth rates as a given, the question that arises is whether the states thathave experienced accelerated growth rates in the post-1991 period hadgreater exposure to the world economy than those states that lagged behindthem. Unfortunately, official data on actual FDI inflows to individualstates are unavailable, as are official data on exports from them.Consequently, the value of “FDI proposals approved” by the governmentis used here as a proxy for actual FDI, while the value of investment in 100percent export-oriented units (EOUs) located in the different states istaken to be a proxy for exports.
Table 7 sets out the quantitative data on SGDP growth rates for eight-een states—relying on an authoritative study by Bhattacharya and Sakthivel(2004)—and on FDI and export-oriented units. As is evident, there alreadyexisted some disparities among the states in the 1980–90 period, but byand large most of the states (with the exception of Andhra Pradesh, Assam,and Kerala) had done uniformly well, with their SGDP growing at over 5percent. However, the disparities widened during the 1990–2000 period—which largely coincides with the post-1991 reform period—as some of theearlier good performers advanced sharply forward. Nine of the eighteenstates grew at a rate of over 6.5 percent, with the exceptional performersbeing Gujarat, Goa, West Bengal, and Karnataka. The other big winnerswere Himachal Pradesh, Maharashtra, Haryana, Tamil Nadu, and Delhi,the good showing by all of which came on the back of a strong perform-ance in the preceding decade. Rajasthan did nearly as well, followed byKerala, Madhya Pradesh, and Andhra Pradesh. On the other hand, Punjab,Uttar Pradesh, Orissa, Bihar, and Assam all fell behind, regressing fromtheir performance level during the 1980–90 period.
To what extent can this differential performance be attributed to glob-alization? While it may be mistaken to argue that FDI provides the soleexplanation for most instances of sharper or sustained growth, it isnonetheless evident that there is considerable correspondence betweenhigh FDI inflows and high economic performance in the individual states.To begin with, note that FDI is concentrated in a small number of states,with four states alone accounting for 43.74 percent of the FDI approved—
30 Baldev Raj Nayar

India’s Globalization 31
Maharashtra (14.78 percent), Delhi (12.24 percent), Tamil Nadu (9.12percent), and Karnataka (7.60 percent). All four states manifest highgrowth in the post-1991 reform period, with Delhi’s growth following anexceptionally strong performance in the earlier period.
What, then, is the relationship of FDI to the other high-growth per-formers? For part of the explanation, we must turn to the data on FDI percapita for these states (table 7). With the exception of West Bengal, all thehigh-growth states are among the top nine states in terms of FDI per capi-ta, with Delhi, Goa, Maharashtra, Tamil Nadu, and Karnataka occupyingthe first five places. So high FDI does correlate with high growth. Another
Table 7: GSDP Growth Rates, FDI, and Exports
Growth Rates (Constant Prices) FDI 1991–2004 Export-Oriented UnitsState 1980–90 1990–2000 Rs. Mill. Rs. Per Capita Rs. Mill. Rs. Per Capita
Andhra Pradesh 4.81 5.12 116,091 1,533.57 424,400 5,604.12Assam 3.91 2.47 15 0.56 360 13.51Bihar 5.20 3.46 7,397 89.25 170 2.05Delhi 7.80 6.60 303,038 21,991.15 11,150 809.14Goa 5.71 8.23 9,977 7,445.52 5,300 3,955.12Gujarat 5.71 8.28 111,765 2,208.79 86,270 1,704.94
Haryana 6.68 6.71 38,752 1,838.33 44,560 2,113.85Himachal Pradesh 6.10 6.91 11,742 1,931.15 20,330 3,345.75Karnataka 6.10 7.07 188,184 3,568.82 583,970 10,115.54Kerala 4.50 6.00 17,806 559.23 9,580 300.89Madhya Pradesh 5.18 5.45 92,714 1,535.25 90,240 1,494.29Maharashtra 5.98 6.80 366,024 3,783.19 81,490 842.27
Orissa 5.85 3.60 82,293 2,241.70 81,400 2,217.38Punjab 5.14 4.63 21,242 874.52 36,400 1,498.60Rajasthan 7.17 6.46 29,112 515.53 50,120 887.55Tamil Nadu 6.35 6.65 225,826 3,635.90 611,990 9,851.88Uttar Pradesh 5.88 4.33 48,267 290.68 168,390 1,014.09West Bengal 5.20 7.24 77,898 971.05 29,300 365.25
Source: (1) GSDP growth rates are from Bhattacharya and Sakthivel (2004), except for Delhi,the figures for which are for 1981–90 and 1990–2001 and are drawn from Joseph (2004). (2)FDI refers to FDI proposals approved over the period August 1991 to August 2004 and are fromthe Secretariat for Industrial Assistance, Department of Industrial Policy and Promotion,Ministry of Commerce and Industry, Government of India; available atwww.indiastat.com/India; actual realizations may vary from 20 to 100 percent. (3) Informationon 100 Percent Export-Oriented Units is from the same source as in (2).

similar but earlier analysis (Saez 2003) had come to a similar conclusion:“FDI magnets have had greater rates of growth than FDI laggards” over theperiod 1991–92 to 1999–2000. A more recent comparative study by theWorld Bank (2004) on the investment climate in the Indian states alsobroadly concludes that “the high-growth states are also among our high-FDI states.” It may well be that FDI is attracted to these high-growth statesby virtue of the welcome they accord to foreign investors through appro-priate economic and administrative policies as well as by their past growthrecord. On the other end of the scale, some of the poor growth performershave had low FDI inflows—Assam (0.00 percent), Bihar (0.30 percent),and Uttar Pradesh (1.95 percent).
The concentration of EOUs among the states in India is even higherthan that of FDI. Three southern states alone account for 68.76 percent ofthe total investment in such facilities—Tamil Nadu (25.97 percent),Karnataka (24.78 percent), and Andhra Pradesh (18.01 percent). The firsttwo of these three states are from among the high growth performers. Interms of per capita EOU investment, the top five ranking states are:Karnataka, Tamil Nadu, Andhra Pradesh, Goa, and Himachal Pradesh. Allexcept Andhra Pradesh are among the high growth states. Here, again, out-ward orientation correlates with high growth.
Overall, then, it can be reasonably concluded that, other things beingequal, openness to globalization leads to higher growth rates at the level of
the states within India, just as it does at the nation-al level. It is precisely the recognition of this correla-tion that has recently led the communist regime inWest Bengal to lay out the welcome mat for FDI. Atthe same time, it is apparent that globalization doesnot affect the states within India uniformly, anymore than it does the nation-states of the world. Itsimpact varies depending on initial conditions, insti-tutional capacity, and the policy regime.t
Deindustrialization or Industrial AdvanceThe data on industry confirm the overall findings noted above on thenational GDP growth rates, though the performance with respect toindustry does not mark as dramatic a break with the record prior to glob-alization. Table 5 also provides data on manufacturing, which is the largestcomponent of “industry,” the other components being construction, min-ing and quarrying, and electricity, gas, and water supply. At the broadest
32 Baldev Raj Nayar
globalization does
not affect the
states…uniformly
t

India’s Globalization 33
level of comparison, the rate of growth in manufacturing over the thirtyyears of the post-globalization period has been 6.4 percent, which rep-resents an increase of 23.1 percent over the rate of 5.2 percent for thenineteen years of the pre-globalization period. But, again, the internalvariations within these two periods are significant.
To begin with the period of autarky and “command and control”economy, there was an initial burst in the average growth rate for manu-facturing to 7.1 percent during the first nine years from 1956–57 to1964–65. That rate is quite high by Indian standards for that time. As inthe case of GDP in general, this high growth rate was a function of theone-time initial impact of the massive ISI strategy and of the large infu-sion of foreign aid. However, this performance proved to be a flash in thepan, and growth simply collapsed over the subsequent decade; the growthrate fell to an average of 3.5 percent—the lowest rate of any decade orhalf-decade. As a result, the rate for the period of autarky as a whole was5.2 percent.
During the second period of intermittent incremental liberalizationfrom 1975–76 to 1990–91, manufacturing recovered from the trough ofthe previous decade to grow at 6.4 percent, a respectable level for India.After the paradigm shift in the crisis year of 1991–92, which marks thestart of the third period, manufacturing grew at an average rate of 7.0 per-cent over the thirteen years from 1992–93 to 2004–05. It is obvious thatthere is a clear hierarchy among the three periods, with the period after theparadigm shift at the top (7.0 percent), followed by the period of intermit-tent incremental liberalization (6.4 percent), and the period of autarky atthe bottom (5.2 percent).
Within the post-paradigm shift period, the four years from 1993–94to 1996–97, with their average growth rate in double digits (11.3 per-cent)—a rate unequalled in India’s post-independence economic historyfor any comparable period—represent the high water mark in manufactur-ing growth. Indeed, the year 1995–96 recorded the highest growth rateever for a single year (about 15 percent). That performance was the resultof an investment boom based on euphoric growth expectations in thewake of the paradigm shift to economic liberalization in 1991. The neces-sary demand, however, failed to materialize, and the result was surpluscapacity. The period was soon succeeded in 1997 by a major slowdown asa result of election-induced, counter-inflation contractionary policies.Critics, however, took what was a transitory situation to be a permanent

condition of stagnation generated by economic liberalization. But by 2002industry had emerged from the slowdown and entered a buoyant period,fuelled by a consumption boom based on easy loan finance, by road con-struction, and by exports. That buoyancy is likely to be sustained during2005–06. Significantly, in its later stages, the buoyant period was alsoaccompanied by an upswing in the investment cycle.
No doubt, globalization in the post-1991 reform period presentedenormous challenges to industry through the competition arising from
increased foreign imports following thereduction in tariffs and from the expandedentry of foreign multinationals after the eas-ing of restrictions on foreign investment. Butindustry became stronger and more competi-tive after a wrenching restructuring duringthe economic slowdown of the late 1990s. Inthe process, it exorcised fears of imminentdisaster by cheap Chinese imports that weredominant at the time. The new competitivestrength of Indian industry is especially evi-dent in the area of pharmaceuticals and auto-
mobile parts, sectors that are now competing in foreign markets.uIn light of this evidence, it can hardly be maintained that globaliza-
tion has resulted in deindustrialization; rather, the evidence points to ahigher growth rate in the industrial sector and the strengthening of indus-trial capabilities. With the growth rate of 7.0 percent during the years
from 1992–93 to 2004–05 assuring a dou-bling of manufacturing output in a littleover every ten years, it would be preposter-ous to describe the outcome of the para-digm shift as deindustrialization. Nor canthe unprecedented expansion of manufac-turing be reconciled with claims that it isdemand-constrained. At the same time, it isobvious that India has not experiencedrapid industrialization either, comparable to
say, again, China’s, but then again India has been reluctant to remove thesubstantial barriers to FDI inflows, which lie at the heart of China’s rapidindustrialization and economic growth. As a consequence, India has
34 Baldev Raj Nayar
The new competitive
strength of India
industry is…evident
in…pharmaceuticals
and automobile parts
it would be preposterous
to describe the outcome
of the paradigm shift as
deindustrialization
India’s Globalization 35
stayed largely outside the transnationalization of industrial production,that is, participation in the global chains of production, where China hasexcelled, raising itself in the process to the status of a mighty industrialpower. But India may also be changing in some areas, such as automo-bile parts, where annual exports now exceed one billion dollars. Someobservers (Nagaraj 2005) see other positive features in India’s record—itsindustry is more competitive, largely dependent on local demand andlocal content, and predominantly domestically owned.4v
Of course, some might say that the overall growth rate is not anaccurate indicator of the health of industry, as it may well mask the hol-lowing-out of the capital goods industry even as a more import-intensiveconsumer goods industry, catering to an elite consuming class, hasexpanded production. Indeed, as ardent a supporter of economic liberal-ization as Ashok Desai acknowledged the damage that the machineryindustry had suffered during the 1990s in what he called the “massacreof machine-building” (1999: 66; see also 2001). However, this, too, wasnot a permanent condition, as seen by the recovery of the industry (Wolf2004: 202).
Perhaps the engineering industry had suffered more relatively, but inthe initial years after the paradigm shift, say up to 1993–94, the reversesin industry were more generalized; consumer durables suffered just asmuch as capital goods (table 8). However, it is an open question whethersuch reverses should be ascribed to liberalization, the crisis in 1990–91 towhich liberalization was a response, perversetariff policies, or over-protectionism underthe ancien regime. In the period after1993–94, consumer durables have, no doubt,demonstrated fast growth, but they havedone so from a small base, with their weightin the 1993–94 index being 5.4 percent andless than half of that in the 1980–81 index.Moreover, sectoral growth is not a zero-sum proposition, and there is noparticular order ordained by nature or economic theory as to the optimalbalance among growth rates for the various sectors. It is clear that indus-trial advance after 1993–94 has been quite broad-based. The capital goodsindustry has grown apace, recording an average annual growth rate of 7.4percent between 1993–94 and 2003–04 as against 10.6 percent and 6.5percent for consumer durables and non-durables, respectively.w
industrial advance
after 1993–94 has been
quite broad-based
w

Besides sustained industrial growth, globalization and liberalizationhave made possible breakthroughs to new areas of economic strength—information technology (IT), pharmaceuticals, and automobile compo-nents. In the case of computer software, India has emerged as a major eco-nomic power. It is hard to imagine that such a development would havebeen possible without globalization and liberalization. These new areas ofstrength have also made for increased exports to other countries; for exam-ple, exports of IT and IT-related services alone were $17.2 billion in2004–05, constituting 44 percent of the world’s outsourced market
36 Baldev Raj Nayar
Table 8: Industrial Production by Sectors: Index Numbers (Growth Rates %)
Basic Goods Capital Goods Intermediate Consumer ConsumerGoods Durables Non-Durables
Weight 1980–81 39.4 16.4 20.5 2.6 21.1Weight 1993–94 35.5 9.3 26.5 5.4 23.3
Base 1980–81
1991–92 226.9 (6.2) 266.8 (-12.8) 173.2 (-0.7) 320.5 (-12.5) 175.1 (1.2)1992–93 232.9 (2.6) 266.4 (-0.1) 182.6 (5.4) 318.1 (-0.7) 179.3 (2.4)1993–94 254.9 (9.5) 255.4 (-4.1) 203.9 (11.7) 369.4 (16.1) 181.7 (1.3)
Average (6.1) (-5.7) (5.5) (1.0) (1.6)
Base 1993–94
1994–95 108.9 (8.9) 105.7 (5.7) 105.3 (5.3) 116.2 (16.2) 110.8 (10.8)1995–96 120.6 (10.7) 110 (4.1) 125.4 (19.1) 146.2 (25.8) 121.1 (9.3)1996–97 124.3 (3.0) 120.2 (9.3) 135.5 (8.1) 153.0 (4.7) 127.5 (5.3)
1997–98 132.4 (6.5) 126.6 (5.3) 146.5 (8.1) 164.9 (7.8) 134.1 (5.2)1998–99 135.8 (2.6) 152.7 (20.6) 155.8 (6.3) 174.1 (5.6) 138.1 (3.0)1999–00 143.3 (5.5) 163.3 (6.9) 169.5 (8.8) 198.7 (14.1) 142.5 (3.2)
2000–01 148.5 (3.6) 166.2 (1.8) 177.4 (4.7) 227.6 (14.5) 150.8 (5.8)2001–02 152.5 (2.7) 160.6 (-3.4) 180.1 (1.5) 253.7 (11.5) 157.0 (4.1)2002–03 159.9 (4.9) 177.4 (10.5) 187.1 (3.9) 237.8 (-6.3) 175.9 (11.6)2003–04 168.6 (5.4) 201.5 (13.6) 199.0 (6.4) 265.4 (11.6) 186.1 (5.8)
Average (5.4) (7.4) (7.2) (10.6) (6.9)
Source: For 1991–92 to 1993–94, Reserve Bank of India, Bulletin (December 1997), S-1072,and GoI, Economic Survey 1995–96, 118; for 1994–95 to 2003–04, Reserve Bank of India,Bulletin (various issues).

India’s Globalization 37
(Economic Times Online, June 10, 2005; Chandrasekhar 2005). Givensuch exports, which perhaps displace or preempt local production, isn’t ittrue that globalization has resulted in deindustrialization not in India butelsewhere? At least, that is precisely thecase that protectionist elements outsideIndia have been making, even if it maynot be based on sound economic logic.Overall, India has been a clear benefici-ary of globalization; any notion of itbeing a victim as a result of some phan-tom deindustrialization seems at oddswith reality.x
Still, even if manufacturing growth in the post-liberalization periodclearly does not qualify as deindustrialization, it does fall radically short ofthe benchmark set by China. It also falls tremendously short of the needto widen employment opportunities beyond the high-value and high-skillones in the IT sector and the long-term aim to facilitate the demographictransition to an urban industrial society. The policy prescriptions to recti-fy the situation are also well known to the reformers (Acharya 2005b).These include bringing down tariff levels to deepen international econom-ic integration in order to accelerate growth, reforming restrictive labor leg-islation to promote labor-intensive industry, dereserving industries statu-torily reserved for the small-scale sector, drastically improving economicinfrastructure (especially in the area of power, which has been a nationaldisgrace), and relaxing restrictions on FDI inflows. But adequate move-ment on this score has been stymied by various interest groups in India’spolitical system.
Denationalization or RegenerationForeign investment is not only an indicator of globalization, it is alsoimportant for the national economy. It can be a source of additional cap-ital to supplement domestic savings, diffusion of new technology andmanagerial techniques, and employment expansion. But it can also simplylead to the displacement of local enterprise through direct mergers andacquisitions (M&As) or the ousting of domestic entrepreneurs from themarket in tough competition, predatory or otherwise, by the principalbearers of foreign investment—powerful multinational corporations(MNCs). It can therefore become a lightning rod for protectionist forces
exports of IT and IT-
related services alone were
$17.2 billion in 2004–05
w

in opposition. From the perspective of the advocates of globalization, ofcourse, the whole question of national ownership is meaningless. Rather,they see foreign investment as beneficial to humanity, especially the poor,on the analogy of a rising tide that lifts all boats. However, there is nodenying the appeal of nationalism as an antithesis to globalization.
For long, there was a national consensus in India against foreigninvestment because of what has been referred to as “the East IndiaCompany syndrome,” named after the British trading firm that served asthe spearhead of the British conquest of India from the seventeenththrough nineteenth centuries. As a consequence, government policy afterindependence was mistrustful of foreign investment and fiercely protectiveof local industry, particularly in the public sector. There was some relax-ation of the restrictive posture toward foreign investment in the mid-1980s, and the post-1991 economic reforms opened the door even wider.However, political forces on both the left and the right have continued tooppose foreign investment for fear of economic and political dominationand to agitate for the protection of local industry.
After the first flush of enthusiasm for the dismantling of licensing andcontrols, Indian business itself, though not entirely united, became suspi-cious about foreign investment and almost hostile once the early signs ofeconomic slowdown appeared around 1996. One element in the growingantagonism was the swiftness, vigor, and aggressiveness with which foreigninvestors sought to penetrate and capture the domestic market along abroad front and, more crucially, to sideline or oust earlier local partners injoint ventures. This startled the Indian corporate sector and spread conster-nation among its members. Particularly, in respect to joint ventures, itappeared as if the MNCs were alarmingly eager to reduce or eliminateIndian partners and to assume complete control. The rush on the part ofMNCs to shove aside their Indian partners became a grave concern for theIndian business class. MNC activity raised the specter of the Indian corpo-rate sector being eventually swallowed up by the multinationals, and itfueled a revival of “the East India Company syndrome.” The takeover byCoca-Cola of the dominant local soft drinks player Parle and the break-down of the joint venture in soap between Godrej and Procter & Gamblewere defining events for Indian business in its view of MNCs. Businessperceived itself to be under economic siege from the MNCs.
Yet the industrial recovery that began in 2002 rendered the rising threatfrom foreign investment almost a non-issue for local business. Having
38 Baldev Raj Nayar

India’s Globalization 39
restructured itself in the meantime, the business community reemergedwith renewed self-confidence, no longer afraid of globalization or of for-eign investors. It now perceived M&As to be part of the normal workingof the market, even as it believed that it was in a position to provide stiffcompetition to the multinationals. Meanwhile, the nature of discourse hadchanged from the “threat” of foreign investment to the failure of Indianpublic policy to attract FDI on a scale comparable to China’s, particularlyfor infrastructure. “India had missed the bus” became the refrain.
Is there some hubris at work here? Should Indian business be moreconcerned than it is? Perhaps part of the reason for the apparent lack ofconcern may be that, despite the greater welcome accorded to foreigninvestment in the post-1991 period, foreign investors have not yet foundIndia to be an attractive destination. For a long time, UNCTAD hasregarded India as a consistent underperformer in obtaining foreign invest-ment, receiving FDI much below its potential (2004: 13). At the sametime, Indian policymakers have looked at China with both awe and envyfor its ability to attract FDI many times beyond India’s level. In 2003,India received FDI worth $4.27 billion as against China’s spectacular fig-ure of $53.51 billion plus Hong Kong’s $13.56 billion (ibid.: 370).Another factor in the lack of concern may be that a significant part of theFDI inflows has gone into new lines, such as mobile telecommunicationsand business process outsourcing (BPO), where few local big players wereinitially involved.
There are issues beyond the absolute amount of FDI received thathave been of concern to independent Indian analysts, however. One ofthese pertains to the sectors where FDI is concentrated. Nagesh Kumar, arenowned authority on the subject of foreign investment in India, pointsto a significant shift in the sectoral composition of FDI in the post-1991period away from manufacturing and toward services (2003: 7, 10).Another issue concerns the “Trojan Horse” role of foreign investment intaking over functioning Indian enterprises. Again, Kumar underlines “theemergence of mergers and acquisitions as an important channel of FDIinflow. During the period 1997–99, for instance, nearly 39 percent of FDIinflows into India have taken the form of M&As by foreign companies ofexisting Indian enterprises, whereas in the pre-reform period, FDI entrywas invariably in the nature of greenfield investments.” On the basis of asample of large private sector companies listed on Indian stock exchanges,forming part of the database at the prestigious think-tank RIS,5 Kumar

maintains that “the shares of foreign enterprises in both value-added andsales reveal an increasing trend in the nineties particularly in the latenineties. Therefore, liberalization of policy seems to have led to a rise in theplace of foreign enterprises in the Indian industry” (2003: 14).
However, on closer examination of the data, the share of foreign firmsin total value-added and total sales does not look particularly high (table9). This is especially true if one recalls that the sample includes only largeprivate sector companies, not all Indian manufacturing enterprises, especial-ly not those belonging to the public sector. At the same time, foreigninvestment has clearly not prevented the number of large domestic privatesector companies from growing at a much faster rate than that of the for-eign enterprises. The number of such companies in 2000 was more thantwice that in 1990, whereas the number of foreign enterprises hadincreased by about 50 percent. Despite the talk of M&As facilitating dom-ination of the Indian economy, it is noteworthy that there are only threeMNCs among the top 25 companies in India—Hindustan Lever, ITC,and Maruti Udyog; in the next 25, there is exactly one more—Nestle.6
India is thus pretty much master of its own house in ownership and con-trol of the economy. However, since there are no normative standards thatwould tell us what the appropriate share of FDI ought to be in an econo-
40 Baldev Raj Nayar
Number of Sample Firms Share (%) of Foreign Firms inYear Total Foreign Domestic Total Value-Added Total Sales
1990 1,378 126 1,252 9.50 11.261991 1,754 149 1,605 9.77 11.771992 1,991 158 1,833 9.61 11.691993 2,381 171 2,210 9.77 11.881994 2,987 178 2,809 9.91 11.671995 3,500 190 3,310 9.25 11.031996 3,649 195 3,454 9.65 11.671997 3,695 208 3,487 10.77 12.641998 3,695 216 3,479 11.20 12.851999 3,716 225 3,491 12.12 13.662000 3,726 224 3,502 12.76 14.052001 2,959 193 2,766 12.63 13.77
Source: Kumar (2003: 14).
Table 9: Shares of Foreign Firms in Indian Manufacturing, 1990–2001

India’s Globalization 41
my, while the issue is at the same time politically sensitive due to nation-alism, a comparison with China seems instructive.
Table 10 confirms what is generally known—that when it comes toFDI, India is nowhere near China’s level. While inward FDI stock in Indiahas been increasing, in 2003 it stood at only about 6 percent of that inChina. True, China’s GDP at $1,409 billion in 2003 was more than twicethat of India’s at $599 billion, but one reason for such an augmented GDPis precisely the relatively massive presenceof foreign investment in China. It isnoteworthy that, as regards to FDI stockas a proportion of GDP, India’s figure of5.4 percent was roughly a seventh ofChina’s figure. The share of FDI inflowsin fixed gross capital formation was 12.4percent for China in 2003, which wasmore than three times India’s share. Again, M&A sales to cross-borderinvestors were far higher for China than for India. Given the decided con-trast in the role of FDI in the two countries, China and India can indeedbe regarded as two distinct growth models, the former driven by foreigncapital and the latter principally reliant on local capital.y
The position that foreign investment has come to occupy in Chinahas had consequential results for China’s economy. Corresponding to thefrenetic pace of capital inflows from the early 1990s onwards, the share ofexports by foreign affiliates in China’s total exports exploded to 50 percentin 2001 from less than 5 percent in 1986. Significantly, 90 percent of theirexports consisted of manufactured goods, with machinery and equipmentoccupying a prominent place (UNCTAD 2002: 154, 162–63). Besidestheir role in exports, foreign affiliates have a substantial share—about aquarter—of the domestic sales in manufactures (Huang 2001: 147).
The massive level of foreign participation in China’s economy hasundoubtedly made an enormous contribution to China’s GDP, per capi-ta income, and industrial capabilities, and by extension also to higheremployment. Note that in 1980 per capita income was about the same inIndia ($270) and China ($220), but by 2003 China’s per capita income($1,100) was more than twice that of India’s ($530; World DevelopmentIndicators Online). Beyond economic growth and employment expan-sion, China has also benefited strategically from acquiring, through FDIinflows, foreign stakeholders in sustaining its wealth and power and,
China and India can
indeed be regarded as two
distinct growth models
y

therefore, its welfare. Such an outcome must raise troubling questions forpolicymakers and analysts elsewhere: Is it preferable, for reasons of nation-alism or protection of the interests of local business and unionized labor,to limit foreign investment? Or is it more desirable, as in the case ofChina, to improve per capita incomes, expand employment beyond theexisting unionized labor, and help reduce poverty through a larger role forforeign investment?
No absolute answers are possible, however, for the response must takeinto account the specificities of individual countries and the characteristicsof the particular historical-time in which they are situated. Continental-size economies and polities are not in the same situation as small-size coun-tries. Nor can the present situation of competition among several centersof economic power and their numerous corporations be equated with thatof a world-system dominated by a single hegemonic power with a fewmonopolistic firms. Ironically, in the seventeenth century both China andIndia had full ownership of the national economy, but that did not preventthem from becoming helpless victims of imperialism. What is really rele-vant is the achievement of overall capabilities under national control, notany particular local share in the ownership of the economy. With its size ofpopulation, territory, and economy closely matching China’s, it wouldseem that India needs to learn from China’s globalization policies. Equally,foreign MNCs cannot be regarded as more sinister or exploitative than
42 Baldev Raj Nayar
Table 10: Comparison between China and India Regarding FDI ($, in millions)
2000 2002 2003China India China India China India
FDI Inward Stock 348,346 17,517 447,966 25,408 501,471 30,827
Inward FDI Flows as% of Gross FixedCapital Formation 10.3 2.3 11.5 3.0 12.4 4.0
Inward FDI Stock as% of GDP 32.2 3.8 35.4 5.2 35.6 5.4
Cross-Border Sales by 2,247 1,219 2,072 1,698 3,820 949
Source: UNCTAD 2004: Annex Tables B.3, B.5, B.6, and B.7.

India’s Globalization 43
local companies, even as it is undoubtedly in the nature of business,whether domestic or foreign, to make profit. Certainly, foreign businessinvariably sets higher standards on quality for its products, and it treats itslabor better. Indeed, to work for an MNC in management carries a badgeof high social status comparable, if not higher, to membership in the elitecivil services and commands similar value in India’s marriage market.
India’s record as an underperformer when it comes to attracting FDI,particularly in comparison to China, has been, of course, a consequence ofpublic policy. When India reversed its longstanding restrictive posture onforeign investment, change was gradual, incremental, measured, and halt-ing, and FDI inflows continued to be hemmed in by myriad restrictions.It would therefore be difficult to characterize such change as a “race to thebottom.” At best, it has been more like a slow crawl, not necessarilybecause of some top-down policy blueprint but rather because of carefulresponses to societal pressures within a democratic and open polity. It is asif a hidden hand had conspired, in effect, to organize a subtle sequencingby way of initiating “internal liberalization” first, in order to enable Indianbusiness to adjust to economic competition within, before being exposedto competition from without through “external liberalization.” Further, itseems that the shift to external liberalization was, consciously or uncon-sciously, staggered over a considerable period of time. This was accom-plished through various measures, such as devaluation or high tariffs, toprovide as it were—in the manner discussed by the great historian ArnoldToynbee—enough challenge to business to restructure itself and to adaptto economic openness but not so much challenge that the economy wouldbe overwhelmed.
To examine the issue of M&As in terms of foreign takeovers of Indianbusiness enterprises is to consider only one side of the equation, however.If an essential characteristic of globalization is that economic actorsbecome increasingly oriented to the world market, rather than remainingfocused on the domestic market, then Indian business transformed itselfconsiderably in that direction during the second half of the 1990s. Longsheltered from competition, both internal and external, Indian businessunderwent a regeneration through a wrenching restructuring in the face ofincreased competition from within and without. The new reorientation ofIndian business toward the world market expressed itself in expandedexports, as new (though small) multinationals establishing subsidiaries andplants abroad, and in the takeover of foreign enterprises abroad.

No doubt, India’s record does not match that of China’s (table 11), butin the post-1991 period it is strikingly evident that Indian business hasbroken out of its traditional mold of being confined to the domestic mar-
44 Baldev Raj Nayar
Table 11: FDI Outflows and M&A Purchases Abroad by China, Hong Kong, and India
Year China Hong Kong India
FDI Outward Stock ($, in millions)
1980 - 148 41985 131 2,344 191990 2,489 11,920 501995 15,802 78,833 2642000 25,804 388,380 1,8592002 35,206 309,430 4,0062003 37,006 336,098 5,054
FDI Outward Flows as Share of GDP (%)
1980 - 0.5 -1985 - 6.7 -1990 0.7 15.9 -1995 2.3 55.6 0.12000 2.4 234.9 0.42002 2.8 191.6 0.82003 2.6 211.9 0.9
Cross-Border M&A Purchases ($ Million)
1993 485 4,113 2191994 307 2,267 1091995 249 2,299 291996 451 2,912 801997 799 8,402 1,2871998 1,276 2,201 111999 101 2,321 1262000 470 5,768 9102001 452 3,012 2,1952002 1,047 5,062 2702003 1,647 4,168 1,362
Source: UNCTAD 2004, Annex Tables B.4, B.6, and B.8.

India’s Globalization 45
ket. It is a testimony to the regeneration of the competitive spirit andstrength of Indian business that had been lost during the years of autarkythat it has increasingly ventured forth abroad to make acquisitions there.The trend has been manifest not only in the field of information technol-ogy but also in pharmaceuticals and motor vehicles.7 The pace of acquisi-tions of overseas businesses by Indian firms has also quickened; the valueof such acquisitions abroad doubled to $9.30 billion in 2004 over the pre-vious year (Business Standard, May 20, 2005), a clear sign that Indianbusiness is becoming increasingly global. Some twenty of India’s top hun-dred companies (ranked by market capitalization) derive more than 50percent of their revenues from sales abroad (Economic Times Online,December 5, 2005).8
In summary, then, neither foreign imports nor foreign investmentthrough a sudden and massive wave of takeovers has swamped Indianbusiness. Entering gradually because of policy-driven limits on interna-tional integration by India, foreign investment has served to supplement,not supplant, Indian business. Meanwhile, confronted by the threat ofcompetition, Indian enterprises have themselves undergone a regenera-tion, one that has enabled many of them to enter the world market as newmini-multinationals.
Economic Destabilization or StabilityWhat is the likely impact of globalization on the stability of a nationaleconomy? There are essentially two opposing viewpoints on the question.One view asserts that the opening up of a national economy to the con-temporary world economy makes it vulnerable to external shocks andexposes it to economic instability (Weil 2005: 327; Patnaik and Rawal2005). The prospect for countries that take to globalization through theliberalization of their economies is therefore likely to be economic desta-bilization. The point has considerable merit in the light of the region-wide contagion of financial crisis that struck East and Southeast Asia inthe late 1990s.
The opposing viewpoint, however, holds that there is no automaticrelationship between integration with the world economy and economicinstability (Ila Patnaik 2004a, b, 2005b). The real outcome of integra-tion would seem to depend on national capacity and public policy. Thus,for example, developing countries are more prone to economic crisesthan are developed countries, because of the weaker capacity of institu-tions in the former. At the same time, public policy may also induce

economic instability, with public policy understood not as necessarilylimited to international trade and capital flows, but also encompassingthe domestic sphere, particularly the management of public finances andmonetary policy.
Interdependence and Economic CrisesIt is a truism to say that globalization entails both opportunities and risks.The key risk from international integration is that any turmoil in theworld economy will transfer to the national economy and make for desta-bilization. Yet there can be no guarantee about escaping such turmoil evenon a path of exclusive economic insulation. For a certain minimal level ofintegration of national economies into the world economy is inevitable,because the sheer fact of sharing the physical space of the same planetmakes it inescapable. The Soviet Union was a model par excellence of eco-nomic insulation—and a socialist one at that—yet it could not escape theexplosive implications of existing physically alongside the rest of the worldeconomy with a more productive and dynamic economic system. That sit-uation eventually led to its collapse and dissolution. Similarly, India’seconomy was perhaps the most insulated one outside the Communistbloc, but the shock of the OPEC oil price hike in 1973 had a devastatingimpact, as did the similar shock in 1979. Indeed, India had to rely on theworld economy and its international financial institutions to rescue itfrom its desperate situation.
Given this experience, the grievance against globalization, then, canonly be one about the likelihood of the relatively higher incidence of eco-nomic instability after integration into the world economy. The questions,consequently, would be: Given that economic vulnerability is unavoidablefor all economies, what difference does integration with the world econo-my make? Does it accentuate vulnerability?
On the other hand, it may well be that integration serves to enhancenational capacity through improved national and per capita incomes aswell as economic diversification. The issue then becomes not whetherinternational integration generates more economic instability but whetherover the longer term it provides greater capacity to cope with prospectiveinstability. There is a substantial consensus in the mainstream economicsliterature over the better economic performance of outward-orientedeconomies compared with inward-oriented ones. India’s own shift frominward to outward orientation, even though gradual, fitful, and limited,provides considerable testimony to the learning effect of that consensus.
46 Baldev Raj Nayar

India’s Globalization 47
Interestingly, it was a strongly held position by the late Bela Balassathat outward-oriented economies not only perform better in terms of eco-nomic growth, they also manage external shocks better. After studying theeffects of the OPEC oil price shock in the early 1970s, he rejected theproposition of some observers that “the high share of exports in the grossnational product associated with outward orientation increases the vulner-ability of countries applying such a strategy to external shocks.” Instead,he maintained:
The experience of the period following the quadrupling of oil prices in1973–4 and the world recession in 1974–5 does not support this pro-position. While the balance-of-payments effects of external shocksrepresented a larger proportion of GNP in countries following outward-oriented, than in those pursuing inward-oriented, policies, the superiorgrowth performance of outward-oriented economies compensated forthis loss several times over. (1985: 216)Statements such as these on general tendencies in the developing
economies, however, do not necessarily hold true for individual countries.Such countries have to be examined in their own terms. What, then, hasbeen India’s experience with international economic integration in relationto the issue of economic crises? Has integration worsened the situation ornot? Economic crisis is understood here to mean the eruption of an eco-nomic situation, no matter its origins (nature, markets, or states), whichentails production, employment, and welfare losses severe enough to leadto a balance of payments problem of such acuteness as to require the helpof external economic agents.
Autarky and the Enduring CrisisSeveral major crises have marked India’s post-independence economic his-tory between the launching of the autarkic heavy industry strategy in 1956and the paradigm shift in 1991. It is not the purpose here to give a detailedaccount of each crisis but rather to provide a summary assessment of thecrises encountered by the Indian economy before and after internationalintegration and to touch on their principal causes.
Whether generated internally or externally, the crises usually manifest-ed themselves in food shortages and high inflation—but the eruption ofserious balance of payments problems due to the scarcity of foreignexchange was a constant. While the predicament of the shortage of foreignexchange resources arose in a critical manner in each of the crises, it is
noteworthy that the lack of such resources was a perennial problemthroughout the period of autarky before the paradigm shift. The foreignexchange constraint, with its slow-burn—but cumulatively extremely dam-aging—consequences for the economy, handcuffed India’s economic devel-opment, stunting the country’s growth, condemning it to economic stag-nation, confining it to low-income status, and making it a basket case fitonly for aid donors. In the process, it also adversely affected its foreign pol-icy and national autonomy aside from the simple blow to national pride itcaused in being a perennial supplicant for aid. As Bimal Jalan, one ofIndia’s foremost economic administrators, had noted at the height of theeconomic crisis in 1991:
India has had balance-of-payments problems in twenty-nine out of th-irty-five years since 1956–7 [marking the start of the inward-orientedeconomic strategy], which has been highly disruptive to its develop-ment. . . . India has been continuously subject to balance-of-paymentsproblems since 1956–7. Policy-making during this entire period wasdominated by concern over the balance of payments. The evolution ofthe industrial and trade policy, in particular, was heavily influenced bythe concerns over the balance-of-payments situation, and this intro-duced several distortions. . . . Ever since 1956–7, except for a few years,the balance-of-payments problem has merely varied in its intensity.(1991: 12, 14, 31–32)
Given the abiding foreign exchange constraint under the inward-orientedeconomic strategy and its damaging consequences for economic growth,the ill effects of any rise in the incidence of economic crises following theadvent of international economic integration must be weighed against theenduring harm inflicted earlier on the economy by that constraint. It wasnot simply the economic stagnation, there were also social consequenceslike smuggling and corruption as a result of the many controls that issuedout of the scarcity of foreign exchange resources. Incidentally, Jalan saw nopossibility of relief from the constraint in the foreseeable future: “The bal-ance-of-payments concern is likely, once again, to dominate India’s eco-nomic policy-making in the 1990s” (1991: 47).
Apart from the chronic infirmity of the shortage of foreign exchange,there were three major economic crises over the first period. The first ofthese occurred within the first year of the Second Five Year Plan(1956–57/1960–61), which had the inward-oriented heavy industry strat-egy as its principal focus. It was triggered by the large-scale expenditures on
48 Baldev Raj Nayar

India’s Globalization 49
the ambitious ISI program; in that sense, public policy was clearly at theroot of the crisis. The foreign exchange resources of the country werequickly exhausted, throwing the future of the Second Plan into doubt.Fortunately for India, the crisis did not last long. It proved to be briefbecause the Western powers, persuaded by Cold War considerations, cameto India’s rescue through mounting a major effort at aid mobilization forthe Plan. Were it not for that effort, the heavy industry strategy wouldhave collapsed.
The second crisis during the first period was, in contrast, a drawn-outaffair, spread over most of the 1960s. Public policy was, no doubt, againimplicated because of the inward-oriented economic strategy. But so alsowere interstate conflict and war, forces of nature by way of consecutivedroughts, and partial abandonment by aid donors as a result of “aidfatigue” in the wake of the thaw between the superpowers after the Cubanmissile crisis. India’s second crisis did not end until 1967—if at all—whenthe shift to the Green Revolution agricultural strategy during the mid-1960s offered its first fruits in an abundant harvest.
Even before that crisis erupted, the Third Five Year Plan(1961–62/1965–66), in which the state persisted with its heavy industrystrategy, was already in trouble soon after its initiation in what Lewis hasdescribed as a “quiet crisis” (1963). The cause lay in the shortage ofresources, galloping population growth, and stagnation in agriculture.Then, in 1962, the short but traumatic border dispute between India andChina made defense a top priority. The escalation in defense expendituresaffected the implementation of the Third Plan adversely while inflationreached double digits (on average) during the four years from 1964 to1967. A second war took place in 1965 between India and Pakistan. Anunprecedented drought added to India’s miseries in 1965, reducing agri-cultural production by a steep 11.0 percent, while a similar seconddrought in the following year brought it down a further 1.4 percent(World Development Indicators Online). Food riots and the looting offood trains and food warehouses followed. The crisis made India thor-oughly dependent for its survival on the United States. In the midst of theagricultural downturn, the American-imposed currency devaluation of 34percent (Manohar Rao 2002: 97)—as the first installment of a liberaliza-tion package—turned out to be a disaster. Economic planning then sim-ply collapsed, and the Fourth Five Year Plan was postponed for three yearswhile economic liberalization was aborted. The severe cuts in public

expenditure dictated by the economic strategy resulted in deterioration ofthe economic infrastructure, and the savage cuts in imports rendered idlea substantial part of industrial capacity. It was the most difficult time forIndia in its entire post-independence history.
Many factors were involved in the period’s third economic crisis,which lasted from 1971 to 1974: consecutive droughts in 1971 and 1972,which brought agricultural production down by 1.9 and 5.1 percent,respectively; the influx of 10 million refugees from East Pakistan; war withPakistan in 1971, in which the United States and China both supportedPakistan; the first OPEC oil price shock in 1973 that quadrupled oil prices;strikes and agitations by trade unions; and a large-scale political movementto bring about the downfall of the government. Inflation reached intolera-ble levels, with consumer prices rising by 16.9 percent and 28.6 percent in1973 and 1974, respectively. It was in response to this deepening and polit-ically threatening crisis that the government took the first hesitant steps inlate 1974 to reintegrate India with the world economy. As a result of thechange in policy, India did quite well in the subsequent five years in bal-ancing its payments and building up its foreign exchange reserves.
Overall, the three crises taken together demonstrate that, barring a fewexceptional years, virtually the entire period of the heyday of the inward-oriented heavy industry strategy, even when somewhat modified by beingsupplemented by the Green Revolution strategy in the mid-1960s, was onelong, enduring crisis.
The Long Liberal Transition and Economic CrisesThe second period from 1975–76 to 1990–91 saw two major crises. Thefirst one was triggered by the severe drought in 1979, which brought agri-cultural production down by an unprecedented 12.8 percent and wasaggravated by the second OPEC oil price shock of 1979, which doubledoil prices. Inflation raged for five years, with the average annual rise in con-sumer prices over the 1980–84 period at over 10 percent. Learning fromthe past, however, the government did not adopt contractionary policieson this occasion but instead went to the IMF in 1981 for a massive loanof over $5 billion to continue with economic development even as itopened India further to technology imports and liberalized industrial pol-icy. The crisis was soon overcome, and in 1983 India decided not to availof a substantial part of the IMF loan. The rest of the 1980s saw no eco-nomic crisis even as economic liberalization was pushed further. However,one was certainly building up over this period.
50 Baldev Raj Nayar

India’s Globalization 51
The second crisis occurred in 1990–91, and it stemmed from a com-bination of internal and external factors. The principal culprit was impru-dent public policy with the resort to fiscal profligacy by the state over thesecond half of the 1980s. The fiscal deficit (FD)—representing the excessof government expenditure over revenues, which has then to be borrowed,thus increasing the public debt—persisted at unsustainable levels. Theaverage FD/GDP ratio for the six years from 1985–86 to 1990–91 (theyear of the economic crisis) was about 8 percent (Parikh 1997: StatisticalTables). Meanwhile, as foreign aid went into decline because of aid fatigue,the state took to extensive short-term external commercial borrowing,making India a ripe case for the debt trap. India’s foreign debt increasedfourfold from $18.0 billion in 1980 to $71.8 billion in 1991 (OECD1982: 77; OECD 1993: 135). The situation was compounded by thesharp rise in oil prices because of the gathering international crisis in thePersian Gulf following Iraq’s invasion ofKuwait in 1990. Unable to pay even for its sav-agely cut imports, with foreign exchangereserves good only for a fortnight’s imports,with non-resident Indian (NRI) depositorsabroad withdrawing their capital and withcreditors unwilling to provide further loans,India was on the economic brink. It had tomortgage its gold holdings and was teeteringtoward default on its international obligations.It was in this circumstance of extreme econom-ic exigency that India made the paradigm shift in 1991–92 to economicliberalization and to more deeply reintegrating itself with the world econ-omy. As part of this endeavor, it undertook a devaluation of 36 percent(Manohar Rao 2002: 97), a considerable dismantling of controls, and asharp lowering of tariffs even though India continued to remain amongthe world’s most protected economies.
The Paradigm Shift and Crisis-AvoidanceSince the paradigm shift in 1991–92, there has been a remarkable turn-around in the building up of India’s foreign exchange reserves. What isstriking about the entire period after the paradigm shift is the absence ofany major economic crisis.z
In the post-1991 period, even though the trade imbalance grew enor-mously despite the robust expansion of merchandise exports, the foreign
What is striking about
the entire period after
the paradigm shift is
the absence of any
major economic crisis
z

exchange reserves began accumulating with great consistency after1993–94. That accumulation occurred on the basis of India’s strengths(not IMF loans) with contributions from expanding exports of services(particularly relating to IT), foreign remittances from NRIs, and inflows offoreign capital. Bimal Jalan, who in 1991 saw no end to the foreignexchange constraint, exulted: “I believe today India is in a position to dowhat it wants to do. If we want the best of anything—airports, roads,ports, we can have it because today we do not have resource crunch of anykind” (Hindu Business Line Online, May 18, 2004). The reserves grew tosome $120 billion by the end of 2004, and ironically the growing concernfor India became this surfeit of new riches that was causing its currency toappreciate against the U.S. dollar. India’s foreign debt as a share of GDPfell substantially from 28.7 percent in 1991 to 17.8 percent in 2004 (GoI2005: 138), and India became a creditor country to the IMF. Furthermore,for the half dozen years after 1998, India experienced, in contrast to thebouts of severe inflation earlier, a low-inflation regime of around 5 percent.Indeed, “the tolerance limit for inflation in India is now 5 percent, if notless” whereas earlier “the politically tolerable limit for inflation used to bereckoned as 10 percent” (Ninan 2005a).
Even though no economic crisis has occurred in this third period ofnearly a decade and a half, there have certainly been occasions that wouldhave potentially led to a crisis situation were it not for the absence of theforeign exchange constraints of the past. Such occasions include the slidein the value of the rupee in the late 1990s, India’s nuclear tests andAmerican sanctions against the country in 1998, the financial crisis in Eastand Southeast Asia in 1997, the monsoon-induced fall of 5.2 percent inagricultural production in 2002, and the oil price spikes of 2004 and 2005.The fundamental reason for the lack of economic crisis has been thestrengthening of India’s economic capacity, made possible by globalizationand liberalization, primarily through generating increased financialresources as a result of the acceleration of the growth rate of the economyand the accumulation of vast foreign exchange reserves. Despite the mani-fest absence of a crisis through 2005-end, there is no room for complacen-cy on the economic crisis front, however, for the past cannot foretell thefuture. As it is, there already exist two very live potential sources for crisis.
The PFI Flood and the Economic TrilemmaDuring the calendar year 2004, PFI net inflows rose to a crescendo, withreportedly over $8.5 billion (Korgaonkar 2005a) coming in on top of the
52 Baldev Raj Nayar

India’s Globalization 53
record-breaking inflows of over $8.2 billion during the previous year (table4). For foreign institutional investors (FIIs), India had become a veryattractive destination for portfolio investment, behind only Korea amongAsia’s emerging markets (excluding China as a special case). In 1999, Indiahad a share of 12.2 percent in net PFI inflows to Asia’s emerging markets,but five years later, in 2004, that share had jumped to 30.3 percent, withonly Korea (32.8 percent) ahead of India (Bandyopadhyay 2005).
One consequence of this massive inflow of PFI money has been thatFIIs have emerged as arguably the dominant player in the domestic stockmarkets (Pal 2005). Not only that, they have also acquired substantialownership of India’s blue-chip companies, even though this aspect is per-haps mitigated by the nature of PFI in that it is distinguished from FDIby the “basic presumption . . . that FIIs are not interested in managementcontrol” (GoI 2004b: 9). By the end of 2004, they owned every fifth shareof the thirty scrips in the Sensex basket (India’s equivalent of the DowJones). They held the largest number of shares in 77 companies (comparedto 24 in 2002 and 54 in 2003), which accounted for 44 percent of thetotal traded market capitalization of the Bombay Stock Exchange.9 Thisentire outcome began to raise serious issues for public policy over nation-al ownership of the economy, over the government’s own voraciousappetite for money, and over domestic investor behavior. It seemed asthough India’s risk-averse investors were putting their savings in physicalassets or in public sector banks, which in turn—although already holdinga mountain of government bonds—preferred the easy path of lendingthem to the government, while foreign investors furiously bought intoIndian companies (Ninan 2005).
The rising tide of PFI inflows, however, provoked a more immediateconcern over a possible imminent threat to India’s financial and econom-ic stability. In January 2005, Reserve Bank of India (RBI) Governor Y. V.Reddy gave pointed expression to this concern, and he wondered aloudabout imposing controls on PFI inflows.10 The stated concern of the RBIwas not new but had now been raised publicly by India’s central banker.In the event, fearing damage on the bourses, Minister of Finance P.Chidambaram immediately quashed any proposition to restrict FIIinflows. Indeed, in a quick clarification that was tantamount to an embar-rassing retraction, the RBI governor first mentioned the option of employ-ing price-based measures like taxes (a face-saving gesture) but then,acknowledging that their effectiveness may be arguable, said that “there-

fore it may not be desirable.” An opportunity to seriously debate and clar-ify critical issues was lost.
Many have long suspected that “hot money” has been at play in theaugmented PFI inflows. Others have, however, contested this view (Aiyar2005; Emcee 2005), noting that since the economic reforms of the early1990s, there has been only one year when a small net PFI outflow tookplace. That was 1998—in the midst of the generalized financial crisis inEast and Southeast Asia (and India’s nuclear tests and American sanctionsagainst India). In all other years, PFI net inflows have been consistentlypositive (table 4). On its face, such commitment to investments in Indiaran against the suspicion about hot money. Equally, the alleged dominationof the FIIs over the stock markets has been questioned. In the first place,FIIs and their sub-accounts—given their large numbers (637 and 1,785,respectively), with some selling, some buying, some both—are not a single,homogeneous force but rather reflect “a diversity of views and portfoliostrategies.” Moreover, their participation is limited in the totality of stockmarket transactions (GoI 2005: 80–81). Regardless, there are larger struc-tural forces at work in India’s predicament over excessive PFI inflows.
There exists a consensus among economists, following the work ofMundell and Fleming, about the “open-economy trilemma” or “impossibletrinity,” according to which the decision-makers of a country with an openeconomy do not have the option of simultaneously claiming control of allthree macroeconomic levers: (1) monetary autonomy, (2) fixed exchangerates, and (3) capital mobility. Rather, they can exercise control over onlytwo of them at any one time. During the long course of its economicregime of autarky, India attempted to defy the trilemma by applying strin-gent controls on all three macroeconomic levers. The consequence, ofcourse, was the frequent eruption of balance of payments crises. In the res-olution of these crises, the country had to beg perpetually for increased for-eign aid and loans from donors and devalue the currency periodically.
After the economic reforms of the early 1990s, India gradually relaxedmany of its controls, but in reality many controls have persisted through-out the economy. In effect, India has tried to transcend the trilemma bycontinuing to exercise control over all three macroeconomic levers ingreater or smaller measure. True, there has been liberalization of the con-trols on capital mobility, as the abundant influx of PFI inflows (some $30billion in the decade from 1994 to 2003) demonstrates. Yet the IMF takesIndia to be a closed economy as far as capital transactions are concerned.
54 Baldev Raj Nayar

India’s Globalization 55
As IMF’s Economic Counsellor Rajan (2005) has averred, “India’s capitalaccount is still closed. It still places restrictions on foreign entry and par-ticipation in various areas of the economy.”
Technically, at first blush, it would seem that India’s exchange rate is,as the RBI repeatedly maintains, market-driven and that the RBI merelyattempts to smoothen out the fluctuations in the market. In fact, by itsheavy intervention, the RBI controls the market that, in turn, determinesthe exchange rate. The RBI has “continued to buy and sell heavily in therupee-dollar market to manipulate prices” (Ila Patnaik 2005b); in short,“the market itself is RBI-driven” (Aiyar 2004). The intent, of course, is toprevent the rupee from appreciating too much, which if left uncheckedwould hurt India’s export competitiveness and thus local employment. Tothat end, the RBI buys the dollars that the FIIs bring in and parks themmostly in low-yielding American securities. Since such intervention is like-ly to expand the local currency in circulation and generate inflationarypressures, the RBI has the option of controlling these pressures throughraising the interest rate. However, because raising the interest rate wouldaffect domestic investment, the RBI instead controls the money supply byselling government bonds that it holds. Through this latter process,referred to as “sterilization,” it is able to reduce “the impact of its dollarpurchases on money supply in the economy” (Ila Patnaik 2004a, b).Incidentally, PFI inflows are not the only element at work in creating thedilemma for the RBI, so are (perhaps principally and more sustainedly)software export earnings and foreign remittances from NRIs (Acharya2005a)—but they do aggravate it.
Many attacked the RBI for having publicly articulated the need forthe imposition of restrictions on PFI inflows and for being the last surviv-ing bastion of the erstwhile “Control Raj,” with a 1970s mindset that wasout of tune with the contemporary ethos of liberalization.11 Such harshcriticism was perhaps misdirected, for the issues raised by the RBI inessence lay in the realm of high policy, not that of banking alone. Therecan be little quarrel over the fact that the RBI had a genuine basis for itsfears of a gathering crisis. As its 2003–04 “Report on Currency andFinance” already noted, “Permitting unbridled appreciation of theexchange rate during periods of heavy capital inflows can be a harbinger ofa future financial crisis” (Chandrasekhar 2005b). Quotas or taxes may nothave been the answer, but neither was inaction. For the combination ofcapital mobility with substantively fixed exchange rates (variously

described as “managed float,” “dirty float,” “moving peg,” “tight peg”)12 isa combustible mix for the financial health of the economy.
It is understandable that brokers and merchant bankers would be vitu-perative in their reaction to the RBI governor’s pronouncements, for theyhad a vested interest in a giddily ascending stock market index. But whatcan explain the peremptory dismissal of the idea of taxation to stem the
tide of PFI inflows, with Finance MinisterChidambaram declaring “I rejected it earlier; Ireject it now” (Hindu Business Line Online,January 13, 2005) without offering any alterna-tive solution for the conundrum? Perhaps thegovernment either felt that the RBI governor’sviews were unnecessarily alarmist or was anxiousto signal foreign investors about its intent to per-sist with the economic reforms process in the
hope of attracting a greater volume of what it really yearned for—FDI. Inany event, by late 2005 as the U.S. dollar strengthened, fears of a risingrupee eased. Chidambaram seemed vindicated in his faith in the market,partly controlled though it may have been. But the problems of a strongerrupee cannot be ruled out.1
One prescription offered for getting out of the conundrum of accumu-lating foreign exchange reserves is to expand the sphere of the market inthis arena by “letting market forces determine the exchange rate, andsimultaneously moving towards capital account convertibility” (Ila Patnaik2005b). In other words, renounce altogether, after the fashion of mostadvanced economies, the lever of fixed exchange rates and secure monetaryautonomy through influencing interest rates. That is easier recommendedthan done, however. For capital account convertibility runs into a majorblock—persistent and high fiscal deficits—which is, additionally, an inde-pendent source for potential crisis.
Fiscal Deficits—The Permanent Tendency to Fiscal CrisisAs part of its liberalization thrust in the early 1990s, the government hadconsidered the issue of capital account convertibility (CAC). The commit-tee instituted for the purpose, chaired by RBI Deputy Governor S. S.Tarapore, in its report of May 1997 set out an astute roadmap for shiftingto CAC. Rather than simply accepting the prevailing doctrinal wisdom ofthe IMF about the superiority of CAC, it established three critical precon-ditions for moving to CAC—quite prudently, it would seem, in view of the
56 Baldev Raj Nayar
the problems of a
stronger rupee cannot
be ruled out
1

India’s Globalization 57
financial contagion that swept across Southeast Asia soon after. Chiefamong the preconditions was the reduction of the FD/GDP ratio by thecentral government from 4.5 percent in 1997–98 to 4.0 percent in1998–99 and then on to 3.5 percent in 1999–2000. The other two per-tained to bringing down the inflation rate and strengthening the financialsystem (Jadhav 2003: 16–18, 47).
The record of achievement in regard to the principal precondition has,however, been less than awe-inspiring. In the seven years following thereport, it proved quite difficult to bring the FD/GDP ratio at the Centerbelow 4.5 percent.13 Not until 2004–05 did the ratio come down to 4.1percent (Financial Express Online and Business Standard Online, June 3,2005). At the same time, the Tarapore committee had not established anyFD/GDP ratio precondition for the states, perhaps on the assumption thatthe ratio of 3.3 percent then prevailing there was satisfactory and stable.However, the FD position of the states deteriorated soon after, followingthe implementation of the recommendations of the Fifth PayCommission, and the FD/GDP ratio for the states rose; by 2003–04 itstood at 5.1 percent. The combined FD (CFD) for the central governmentand the states together as a proportion of GDP also rose; in 2001–02, itwas 10.0 percent, higher than in the crisis year of 1990–91. Revised esti-mates place the CFD/GDP figure for 2003–04 at 9.4 percent, the samefigure as in the crisis year (table 12). Meanwhile, the gross debt to GDPratio climbed from 71.0 percent in 1995 to 80.6 percent in 2002(Hausman and Purfield 2004: 4). Note the contrast between these figuresand the standards set for EU members by the 1992 Maastricht Treaty, withFD/GDP and debt/GDP ratios required at 3 percent and 60 percent,respectively, for a sustainable fiscal policy (Burger 2003: 2). Such fiscal dis-cipline is regarded as an essential requirement for crisis prevention.14 ForIndia, the Twelfth Finance Commission has deemed the sustainableCFD/GDP ratio to be 6 percent, equally shared by the central governmentand the states (Govinda Rao 2005b).
There are two issues that arise for analysis from this situation of per-sistent and high fiscal deficits. First, what are its causes? Is economic liber-alization or globalization to blame? Second, what are its likely conse-quences? Taking the issue of the causes first, one school of thought holdsthe persistence of the high deficits to be the result of the slashing of taxes,both direct and indirect, in the wake of economic liberalization. The cut-ting of tariffs was, of course, part of the deliberate shift in economic poli-

cy to make Indian industry competitive in the world economy, and thebuoyancy of India’s exports is testimony to the success of that policy. Therecan be no denying, however, that the tariff cuts have led to a reduction inthe contribution of revenues from customs as a proportion of GDP, from3.6 percent in 1990–91 to half of that, 1.8 percent, in 2003–04 (table 12).Similarly, the revenue from excise taxes has come down but much less so,from 4.3 percent to 3.3 percent. The total contribution from indirect taxeschanged from 7.9 percent to 5.3 percent. Since indirect taxes are usuallyregarded as regressive, some would welcome the change.
The story is very different, however, in relation to direct taxes, but ittends to receive far less attention, indeed neglect, from critics of economicreform. Even as such taxes were cut drastically by the central governmentin the early and mid-1990s, the revenues they yielded as a proportion ofGDP doubled from their 1990–91 rate (1.9 percent) to 3.8 percent in2003–04. (The share of personal income tax and corporation income taxrose from 0.9 percent each of GDP to 1.5 percent and 2.3 percent, respec-tively.) Indeed, during 2004–05, direct taxes exceeded 4 percent of GDP(Business Standard Online, July 7, 2005). The change emerges as evenmore dramatic when direct taxes are examined as a share of gross tax rev-enues, having risen from 19.1 percent in 1990–91 to 43.9 percent in2004–05 and expected to go up even further to 48 percent in 2005–06(GoI 2005: 24; Economic Times Online, March 1, 2005). No matter fromwhich perspective it is examined, this outcome contradicts the position ofthe opponents of tax cuts—that they would result in a decline in revenues.At the same time, it vindicates tax cut advocates, who had argued, on thebasis of the Laffer curve approach, that tax cuts would lead to higher rev-enues. Since total revenues as a proportion of GDP were 10.1 percent in1990–91 and had declined only marginally to 9.2 percent by 2003–04, itwould seem that liberalization and globalization as such could hardly befaulted for the persistence of high fiscal deficits.15 Meanwhile, the share oftax revenues in GDP increased to 9.8 percent in 2004–05, and it was bud-geted to increase to 10.6 percent in 2005–06 (Hindu Online, June 23,2005). Regardless, experts continue to differ over whether India is more orless taxed compared to other countries at its stage of development (Bhalla2005a; Govinda Rao 2005a). However, the balance within tax revenues haschanged to the more progressive component as against the regressive one.
Fundamentally, the persistence of high fiscal deficits is rooted more inthe expenditure, rather than in the revenue, side. Here, it is not just the
58 Baldev Raj Nayar

India’s Globalization 59
bloated bureaucracy and the extensive subsidies at the central and partic-ularly state levels—often benefiting the middle classes in the name of thepoor—that are at issue (GoI 2004a; GoI 1998: 21–24). But, more sub-stantively, it is also the vast and expanding array of development and wel-fare agencies and programs instituted by the central and state govern-ments. Of the government’s penchant for expending state funds, Bhalla is
Table 12: Revenues, Expenditures and Deficits (% of GDP)
1990–91 1999–00 2000–01 2001–02 2002–03 2003–04*
Central Government
Tax Revenues 10.1 8.9 9.0 8.2 8.8 9.2
Direct** 1.9 3.0 3.3 3.0 3.4 3.8PIT 0.9 1.3 1.5 1.4 1.5 1.5CIT 0.9 1.6 1.7 1.6 1.9 2.3
Indirect 7.9 5.8 5.7 5.1 5.3 5.3Customs 3.6 2.5 2.3 1.8 1.8 1.8Excise 4.3 3.2 3.3 3.2 3.3 3.3Service tax 0.0 0.1 0.1 0.1 0.2 0.3
Revenue Expenditures 12.9 12.9 13.3 13.3 13.8 13.1Interest Payments 3.8 4.7 4.8 4.7 4.8 4.5Major Subsidies 1.7 1.2 1.2 1.3 1.7 1.6Defense Expend. 1.9 1.8 1.8 1.7 1.7 1.5
Revenue Deficit 3.3 3.5 4.1 4.4 4.4 3.6Fiscal Deficit 6.6 5.4 5.7 6.2 5.9 4.6
StatesRevenue Deficit 0.9 2.8 2.6 2.6 2.2 2.6Fiscal Deficit 3.3 4.7 4.3 4.2 4.1 5.1
Combined Center and States
Revenue Deficit 4.2 6.3 6.6 7.0 6.6 6.2Fiscal Deficit 9.4 9.5 9.6 10.0 9.5 9.4
* Provisional for Central Government; revised estimates for States andCombined Center and States** Personal income tax and corporation income tax
Source: Tabulated from data in GoI (2005: 23, 24, 44, 48). The original sources are different for(1) Central Government, and (2) States and also Combined Center and States. Budget docu-ments were used for the first, Reserve Bank of India documents for the second.

exaggerating only slightly when he laments, “Our expenditures areScandinavian social democratic, and our incomes are close to Sub-SaharanAfrica. That is the problem” (2005a).
Regardless, the innumerable welfare and subsidy programs are a struc-tural response by political leaders to India’s democratic framework. Thatframework requires the leaders to go to the electorate periodically to securepower. In the resulting fierce, often bitter, competition, the leaders attemptto win votes through ever-increasing commitments to the electorate ofdirect governmental help in consumption rather than indirect economicimprovement through investment. Such competitive populism is what hasmade for the state’s permanent tendency to fiscal crisis. No doubt, in theprocess, many of the leaders also abundantly enrich themselves and theirprotégés through what amounts to organized graft. The cause of the poten-tial crisis emerging from high fiscal deficits is thus an internal one, notexternal in the form of economic globalization. The graft does exist, but itis the electoral process that is really at the root of the problem.
Given the persistent pattern of high fiscal deficits, there has been crit-icism not only from domestic votaries of fiscal prudence but also, particu-larly, from the IMF. On the occasion of the economic crisis in the early1990s, the IMF had, of course, used its enormous leverage as a provider ofhuge loans at a critical time to have the Indian government bring down thefiscal deficit. However, for more than a decade after it lost its clout with theend of that crisis, the IMF (2005) has continued to beseech India to attendto its FD problem. Not only has it brought the problem to the attentionof India’s decision-makers in its periodic reports, but senior IMF officialshave publicly warned them of the grave consequences that are likely toresult if the situation persists, warnings that are highlighted in the finan-cial press. Thus, IMF’s Economic Counselor Rajan (2003) told theFinancial Express in an interview:
We would be making a mistake not to deal with the fiscal issue on a pri-ority basis. . . . I think we will have to curb our deficits or else see tremen-dous increase in interest rates as private investment competes. I’d say thatit should be a priority to control the deficit. If nothing else, we knowfrom the experience of many countries, that eventually it comes back tohaunt you. One can’t imagine that India is a special situation where thedeficit is not going to be a problem.
Again, he reportedly warned that those who believed “that deficits haveceased to matter argue as if the laws of economics don’t hold any more”
60 Baldev Raj Nayar

India’s Globalization 61
(Mulji 2004a). Later, an IMF study concluded that “India is on an unsus-tainable path and will eventually have to adjust, one way or the other—inother words, with or without a crisis” (Hausman and Purfield 2004: 24).
Notwithstanding the warnings about an impending crisis—not onlyfrom the IMF—that one has not yet happened constitutes a genuine enig-ma. Stanley Fischer described India’s uncontrolled fiscal deficit as an unex-plained mystery in the general story of positive developments since theeconomic reforms of 1991 (Mulji 2004b).Similarly, NCAER director-general SumanBery, formerly a World Bank official, hasadmitted: “There is a paradox here of a gravefiscal situation that is not showing up in eitherhigh inflation or in external debt” (Mulji2004c). Even the IMF’s economic counseloracknowledged in the interview noted abovethat “the beauty of India’s fiscal deficit is thatsomehow, the consequences of the lack of fis-cal prudence aren’t showing up.” The IMF study cited earlier was struckby “the apparent absence of any symptoms of fiscal illness” and recognizedthat “elsewhere, the magnitude of fiscal imbalances in India would presagea fiscal crisis. Yet, this is not happening” (Hausman and Purfield 2004: 4).There is thus no getting away from this modern “rope trick” of Indianexceptionalism, apparently defying the laws of economics on fiscal pru-dence over a long period. It will not do to say that the IMF and other crit-ics have cried wolf too often and too early. For, in the absence of fiscal con-solidation, a crisis can still take place. Even though India may eventuallyhave to countenance its day of reckoning, that a crisis has not occurredover a decade and a half in the face of an apparently reckless lack of fiscalprudence still requires an explanation.2
Discounting Indian exceptionalism in terms of immunity to econom-ic laws, there are two possible candidates for such an explanation. One,buoyant invisible earnings from foreign remittances of NRIs and softwareexports are said to have compensated for the lack of fiscal prudence; asSwaminathan Aiyar (2003) argues,
So how does it sustain its huge overspending without going bust? The
answer lies in the flood of remittances coming from Indians overseas.
These, along with software exports and other items are called invisibles,
since they earn dollars without any visible export of goods. . . . This
There is…no getting
away from this
modern “rope trick” of
Indian exceptionalism
2

enormous inflow is almost 4 percent of GDP, roughly equal to the gov-ernment’s revenue deficit. So, Jaswant Singh’s overspending is offset bythe bonanza from abroad. The dissaving of the government is offset bythe huge savings from abroad. Hence even a deficit of this size is sustain-able, and causes no distress, let alone crisis. Forex reserves are high, infla-tion and interest rates are modest.
Two, there is the Keynesian argument, most forcefully and persistentlypresented by Sudhir Mulji (2004a, b): there are unemployed resources inthe economy and fiscal deficits work productively to pick up the conse-quent slack. In short, as a developing country, India faces the problem oflack of adequate demand, and fiscal deficits function as a means of creat-ing such demand.
To sum up the discussion on globalization’s relationship to economicdestabilization, whereas economic crises were a principal characteristic ofthe period before globalization, the period after the paradigm shift in 1991has seen no economic crisis. While the flood of PFI inflows constitutes apotential source of economic instability, there is merit in the argument ofsome critics that the solution lies in greater openness to globalization inthis arena through capital account convertibility. To the extent that there isa latent hazard in that path, it is created by a domestic public policy thathas generated huge and persistent fiscal deficits and the consequent mas-sive and mounting domestic debt, and not by globalization as such.
Impoverishment or Welfare EnhancementEquality as an ideal goal for society has exercised a powerful attraction onmany socially concerned individuals and groups over the ages. It explains toa considerable extent the appeal of socialism over the past several genera-tions. On the other hand, many others have regarded complete equality asimpractical and its pursuit as the source of immense suffering for humani-ty. The turning away from it by the end of the twentieth century by mostsocieties under socialism underscores the recognition of both its impracticalnature and of the high price that attempting to achieve it can incur. Still, itis a sign of its persistent appeal that even an international financial institu-tion such as the World Bank, much abused for its conservatism, has recent-ly made equality—albeit in its softer version, equity—the focus of oneannual report: World Development Report 2006: Equity and Development.
It is almost universally accepted today that all human beings quahuman beings deserve, regardless of their background, an equitable orderthat assures them of a certain minimum level of living standards and that
62 Baldev Raj Nayar

India’s Globalization 63
does not discriminate against them in the opportunities of life. However,societies fall short of living up to that ideal in smaller or greater measure,especially in the third world, precisely because they are underdevelopedand lack the means to implement it. As a consequence, what happens incontemporary society in relation to mass welfare and equality is a livelyissue for research. Indeed, the study of poverty and inequality—the formeran absolute concept and the latter a relative one—constitutes, like global-ization, a growth industry. However, the impact of economic reform, byway of liberalization and globalization, on poverty and inequality is a heat-edly debated topic, and nowhere more so than in India. To understandthat impact is therefore necessarily to navigate through a veritable intellec-tual minefield. Little convergence is apparent in the research on the con-sequences of globalization and liberalization for poverty and inequality.
Most analysts studying the issue of poverty and, relatedly, inequalityin India have in recent years made a pointed comparison of the record forthe 1990s with that of the 1980s to establish whether there has beenimprovement or deterioration. At times explicitly and at other timesimplicitly, the intent of the comparison is to demonstrate the success orfailure of economic reform. In this endeavor, the analysts have taken1991—the year of the paradigm shift in economic policy—as marking ademarcating point between “economic reform in the 1990s” and “no eco-nomic reform in the 1980s.” Despite the agreement on this score, theyoften differ quite radically in their conclusions about poverty and inequal-ity. Chart 1 provides a tentative classification of their divergent, even con-tradictory, views.
Chart 1: Analyses of Poverty and Inequality in the 1990s Compared to the 1980s: A Tentative Classification
Poverty
Improvement Deterioration
Improvement
Inequality
Deterioration
Bhalla (2003a,b; 2004;2005c)
Datt/Ravallion (2002)Deaton/Dreze (2002)Sundaram/Tendulkar(2004a,b)
Sen/Himanshu(2003a,b,c,d)

The analysts in the lower left quadrant can be taken to represent amiddle position, agreeing by and large with the official position that the1990s saw a considerable decline in poverty. At the same time, they empha-size the rise of inequalities of different kinds. On the other hand, the lowerright quadrant (Sen and Himanshu) and the upper left quadrant (Bhalla)represent the left and right positions, respectively. For Sen and Himanshu,there has been little decline in poverty during the 1990s compared to the1980s, at most about 3 percent for the five years between 1993–94 and1999–2000; indeed, there has been a worsening of the situation with anincrease in the absolute numbers of people below the poverty line. Worsestill, there has been a significant increase in inequality, almost on the scaleof that in China. On the other hand, however, Bhalla is highly critical ofsuch views and demonstrates that there has been a reduction in poverty tohalf the level of that claimed by the official position even as there has beenno increase in inequality.
Remarkably, despite the wide divergence among their positions, theseanalysts basically draw on the same sources for quantitative data in theirresearch—household consumer expenditure (CE) surveys conducted bythe National Sample Survey Organization (NSSO) every five years (“quin-quennial”) on the basis of a large or “thick” sample of about 125,000households and annually on a smaller or “thin” sample of about 60,000households. Some of them supplement such data from CE surveys withdata from the parallel Employment-Unemployment Surveys (EUS) under-taken by the same organization. The source of the radical differencesamong the analysts is the application of different deflators (temporal andspatial), the changes in questionnaire design—which raise issues aboutcomparability with other surveys—and the use of only the more intensivequinquennial surveys or, additionally, the less intensive annual surveys.The 1999–2000 quinquennial CE survey has generated particular contro-versy because of changes in its questionnaire design, with the resulting con-taminated or biased data alleged to have boosted the figures on decline inpoverty. Perhaps there is some exaggeration about the extent of bias thathas resulted from the changes in the questionnaire design, since the organ-ization soon took action to reduce the bias.16
Extending the Horizon on Economic LiberalizationOne remarkable feature of the controversy among the various analysts isthe focus on the 1990s—which they take to be the decade of reforms—asagainst the 1980s, which they regard as having been without reform. It is
64 Baldev Raj Nayar

India’s Globalization 65
not clear why the attempts at comparison have been limited to onlybetween the 1990s and 1980s. There is certainly an element of arbitrari-ness in circumscribing the comparison to just periods selected in this man-ner. The underlying assumptions seemto be that economic reform began in1991 only and that a comparison ofthe 1990s with the 1980s provides avalidation of the success or failure ofeconomic reforms as against the earliereconomic regime.3
However, this assumption is notwarranted. There is no valid basis forregarding the entire period before1991, and certainly not the 1980s, ashaving had no economic reform. Of course, some analysts have recognizedthat the reform process started in 1985, or even in 1980. In that light, the1980s are distinguished from the 1990s only by the degree of economicliberalization, not by its absence. The 1980s and the 1990s thus belongtogether—not in separate compartments by a false dichotomy. Indeed, inthe perspective adopted earlier in this study, economic reform actuallybegan even earlier.
If the intellectual horizon is broadened to encompass the longer peri-od of economic reform—if the period from 1975 onwards is regarded asone of extended liberalization or globalization—what kind of assessmentcan be made about what has happened to poverty and equality? In mak-ing such an assessment, the analysis here draws on data of the “thick”quinquennial CE surveys from official sources and the World Bank, forusing such sources has the advantage of allowing quick verification byothers because of their easy accessibility. Data adjusted by particular ana-lysts are likely to reflect idiosyncratic biases and in any case are not avail-able for the period prior to 1983. The criticisms of the 1999–2000 CEdata on grounds of possible contamination of responses on the recall peri-od are sidestepped here for two reasons. One, there seems to be an ele-ment of exaggeration in them, because only about 10 percent of thehouseholds surveyed could have been affected by the alleged contamina-tion. Two, such data do not deviate wildly from the adjusted data as rep-resented by the largely consensual middle position considered above, evenas the opposite ends of the spectrum on adjusted data as reflected in
It is not clear why…
comparison [has] been
limited to only between
the 1990s and 1980s
3

Sen/Himanshu and Bhalla can be taken to largely cancel each other out.While we rely primarily on the quinquennial surveys, which began withthe 1973–74 CE survey, comparison with the period prior to that is madethrough the annual surveys (then the practice by the NSSO) for the pre-ceding decade or so.
Table 13 and figure 1 set out the data on poverty before and after1975. What they illuminate with singular clarity is the correspondence, byand large, of the entire period of liberalization and globalization in itsextended form, starting from around 1975, with a continuous and consis-tent decline in poverty.
On the other hand, it is clear that the decade prior to 1975 is notmerely one of sheer stagnation in terms of the economic growth rate, asdemonstrated in an earlier section. It is also one in which poverty persist-ed at very high levels, covering more than 50 percent of the population—albeit with annual variations—and at times even over 60 percent. That,then, is the record of the period before economic reform as understood inits extended version.
It is evident that, somewhere around 1975, coincident with the onsetof liberalization, undoubtedly initially in a nascent form, there began agradual but consistent decline in the level of poverty. The record for the1993–94 survey and for the more contentious 1999–2000 survey—bothcarried out after the paradigm shift—is simply a continuation of thatdecline, with the poverty ratio falling from 54.88 percent in 1973–74 toless than half that by the latter year (26.10 percent). It is fashionable insome quarters to mock “the trickle down theory,” but, in view of the com-bined record for economic growth and poverty reduction under extendedliberalization, nothing could illustrate the theory’s intrinsic merit betterthan the data in table 13 and figure 1. The line of causality can be taken toproceed thus: globalization/liberalization ➞ acceleration of economicgrowth rate ➞ reduction in poverty.
The counterpoising of the 1990s as the reform decade against the1980s as the so-called non-reform decade is perhaps supposed to establishfor some the superior performance in respect of poverty reduction underthe economic ancien regime of the autarkic heavy industry strategy and the“command and control” economy. What such counterpoising has actuallybrought about, however, is an overlooking or masking of the correlationbetween the staggeringly high poverty ratio and the heyday of that eco-nomic regime prior to 1975.
66 Baldev Raj Nayar

India’s Globalization 67
Table 13: Poverty Trends in India (Headcount Index): Population Below Poverty Line
NSS Year Poverty NSS Year Poverty NumberRound Level (%) Round Level (%) (Millions)
Annual Surveys Quinquennial Surveys
17 1961–62 46.54 28 1973–74 54.88 321
18 1963–64 47.85 32 1977–78 51.32 329
19 1964–65 52.75 38 1983 44.48 323
20 1965–66 56.71 43 1987–88 38.86 307
21 1966–67 62.00 50 1993–94 35.97 320
22 1967–68 61.60 55 1999–00* 26.10 260
23 1968–69 57.11
24 1969–70 55.56 * 30-day recall
25 1970–71 52.88
27 1972–73 53.37
Source: “Estimates of Poverty Ratio by Expert Group Methodology in India” and “Poverty Trendsof India (1951 to 1957)” at www.indiastat.com.
Figure 1: Poverty Ratio in India
Source: Based on data from Table 13.
1999–00
1993–94
1987–88
1983
1977–78
1973–74

The Question of InequalityWhat, then, of the record on equality? Of course, some degree of increasein inequality is to be expected with development or industrialization,regardless of the era or political regime in which it takes place. That was,indeed, the basis of the U-shaped Kuznets curve, advanced in 1955 bySimon Kuznets, who hypothesized that inequality tends to rise first withindustrialization but then begins to fall as industrialization and its conse-quences spread through society (Weil 2005: 369–74). Globalization assuch is not implicated in this process except insofar as it affects the pace ofindustrialization. Some, however, have gone further, advocating the doc-trine of the “functional utility” of inequality, which proponents used todivert resources to entrepreneurs by squeezing agriculture and suppressingthe demands of industrial workers in the name of driving economic growth(Papanek 1967: 242). Such a course may, however, not be acceptable tomany governments today on political or ethical grounds.
More recently, the World Bank (2005) and the United NationsDevelopment Program (2005) have, quite to the contrary, underlined thefunctional utility of equality and equity for economic development. Suchauthoritative endorsements are, however, not likely to close the debate onthe subject, for some will maintain that unrealistic policies undertaken inthe name of fostering equality may well retard development, as had hap-pened earlier in the Indian case. Regardless, the issue will remain a livelyone, and India’s own record on inequality will continue to be an importantpart of the debate.
One means for examining inequality in income or consumptionexpenditure in a country is the Gini coefficient or ratio, a summary meas-ure of inequality; the higher the Gini ratio, the greater the inequality. Theother is to look directly at the income or expenditure distribution of thebottom quintile of the population against the other quintiles; understand-ably, the Gini ratio based on expenditure as against income understatesinequality. Data on the Gini ratio and distribution of per capita consump-tion expenditure by quintiles is available for India in the World Bank’sdatabase. Table 14 presents the Gini ratio data for several five-year inter-vals after 1973 on the assumption that these reflect information from thequinquennial CE surveys. The table also includes annual data for about adecade prior to 1973. With this table, one can make a broad comparisonbetween the state of inequality between the period before and after 1975—the year of the onset of economic liberalization.
68 Baldev Raj Nayar

India’s Globalization 69
An examination of table 14 reveals no discernible trend before or after1975 in respect to either the Gini ratio or the bottom quintile despite peri-odic variations. The average Gini ratio for the years 1962 to 1973, cover-ing a considerable period before reform, is 31.08. The average for the years
Table 14: Gini Coefficient and Distribution of Consumption Expenditure in India
Year Gini Q1 Q2 Q3 Q4 Q5
1962 32.60 8.4 12.4 16.3 21.6 41.3
1963 30.73 8.9 12.9 16.6 21.8 39.8
1964 31.05 8.8 12.7 16.7 21.8 40.0
1965 31.14 8.8 12.7 16.6 21.9 40.0
1966 31.06 8.4 12.9 16.8 22.1 39.8
1967 30.55 8.6 13.0 16.9 22.0 39.5
1968 31.86 8.5 12.6 16.5 21.8 40.6
1969 31.47 8.6 12.7 16.6 21.8 40.3
1970 30.38 8.8 13.0 16.8 21.9 39.5
1972 31.85 8.5 12.6 16.5 21.8 40.6
1973 29.17 9.0 13.1 17.2 22.6 38.1
1977 32.14 8.5 12.5 16.4 21.7 40.9
1983 31.49 8.6 12.7 16.5 21.7 40.5
1988 31.15 9.0 12.7 16.4 21.4 40.5
1994 29.7 9.2 13.0 16.8 21.7 39.3
2000 32.5 8.9 12.3 16.0 21.2 43.3
Source: For all years except 1994 and 2000: 1997 World Development Indicators CD-ROM. For1994 and 2000: 1999 World Development Indicators CD-ROM and 2005 World DevelopmentIndicators CD-ROM.Note: Information for 1973 and 1977 is included here on the assumption that it corresponds tothe quinquennial surveys of 1973–74 and 1977–78, respectively.

1977, 1983, and 1988, representing the period of intermittent incremen-tal reform, is 31.59; that for 1994 and 2000—the years after the paradigmshift—is 31.10. That is, the Gini ratio is about the same for these three dif-ferent periods. Similarly, the figure for the first or bottom quintile over allthe years ranges from 8.4 to 9.2, though the average tends toward the lowerside for the first two periods as against the last one—8.7, 8.7, and 9.1.
It is true that within the period after the paradigm shift, there is anoticeable increase in the Gini ratio from 29.7 in 1994 to 32.5 in 2000.But that outcome, though sharp as such between those two years, is notvery much out of line with earlier years, such as 1977 and 1988 or, for thatmatter, 1962. As for the shares in CE distribution among the first fourquintiles, there are marginal variations over the years, but they all mani-fest—after a rise in 1994—slight declines in 2000. What is striking, how-ever, is the sharp increase in the share of the fifth quintile from 39.3 in1994 (and from 38.1 in 1973) to 43.3 in 2000, which apparently under-lies the rise in the Gini ratio in that year.
Overall, then, the pattern is one of stability in the Gini ratio and CEexpenditure distribution except for the fifth or top quintile in 2000—a sta-bility that had earlier been noted by S. R. Hashim (1998), then member ofthe Planning Commission. Certainly, the fifth quintile has gained, butsurprisingly, this gain does not seem to have been much at the expense ofthe first quintile. The gain rather reflects decline in the shares of the threemiddle quintiles since 1973. This finding reflects some change from thepattern of stability in respect of equality over the post-independence periodpointed out by Hashim (1998). However, while there have been some gain-ers and there has been some rise in inequality, it would be difficult to say—absent any drastic change in the pattern of distribution—that there havebeen losers as such during the course of development since the inaugurationof liberalization. For, in the meantime, incomes have risen substantially inabsolute terms since 1975, particularly after the paradigm shift.
It may well be that this interpretation based on data over a longer peri-od tends to understate a possible strong rise in inequality that has beenunderlined by several scholars (Deaton and Dreze 2002; Sen andHimanshu 2004a, b; Banerjee and Piketty 2001). On the other hand, it isnoteworthy that 1994 (after the paradigm shift, incidentally) is an excep-tional year from the viewpoint of declining inequality. Perhaps data fromsubsequent surveys would shed more light on the issue of whether there isa decisive break in 2000 in the pattern of stability in inequality.
70 Baldev Raj Nayar
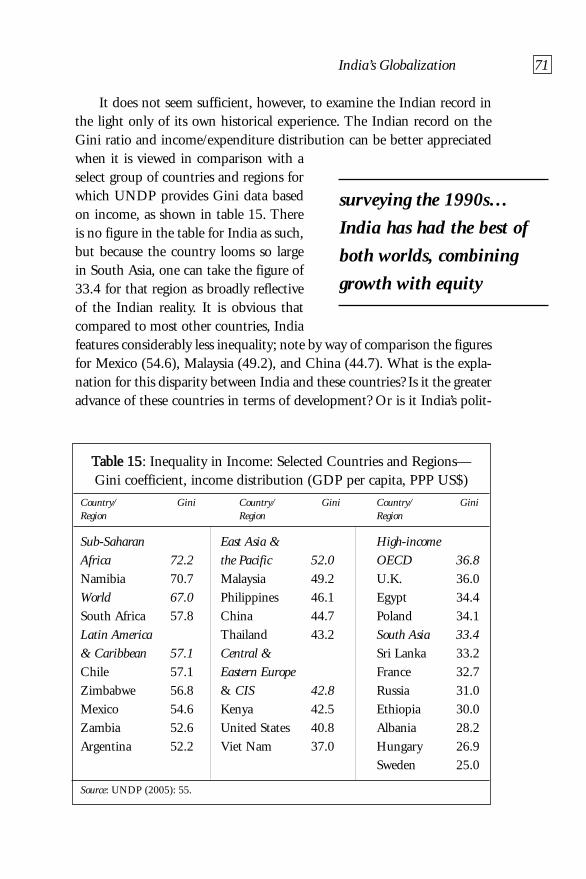
India’s Globalization 71
It does not seem sufficient, however, to examine the Indian record inthe light only of its own historical experience. The Indian record on theGini ratio and income/expenditure distribution can be better appreciatedwhen it is viewed in comparison with aselect group of countries and regions forwhich UNDP provides Gini data basedon income, as shown in table 15. Thereis no figure in the table for India as such,but because the country looms so largein South Asia, one can take the figure of33.4 for that region as broadly reflectiveof the Indian reality. It is obvious thatcompared to most other countries, Indiafeatures considerably less inequality; note by way of comparison the figuresfor Mexico (54.6), Malaysia (49.2), and China (44.7). What is the expla-nation for this disparity between India and these countries? Is it the greateradvance of these countries in terms of development? Or is it India’s polit-
surveying the 1990s…
India has had the best of
both worlds, combining
growth with equity
4
Table 15: Inequality in Income: Selected Countries and Regions—Gini coefficient, income distribution (GDP per capita, PPP US$)
Country/ Gini Country/ Gini Country/ GiniRegion Region Region
Sub-Saharan East Asia & High-incomeAfrica 72.2 the Pacific 52.0 OECD 36.8Namibia 70.7 Malaysia 49.2 U.K. 36.0World 67.0 Philippines 46.1 Egypt 34.4South Africa 57.8 China 44.7 Poland 34.1Latin America Thailand 43.2 South Asia 33.4& Caribbean 57.1 Central & Sri Lanka 33.2Chile 57.1 Eastern Europe France 32.7
Zimbabwe 56.8 & CIS 42.8 Russia 31.0Mexico 54.6 Kenya 42.5 Ethiopia 30.0Zambia 52.6 United States 40.8 Albania 28.2Argentina 52.2 Viet Nam 37.0 Hungary 26.9
Sweden 25.0
Source: UNDP (2005): 55.

ical regime? Hashim (1998) had thought that the stability in India’s Giniratio was the consequence of its democratic framework, which compelledpolitical leaders to implement programs to benefit the poorer sections inorder to get elected. Regardless, surveying the 1990s, Bhalla (2005) believesthat India has had the best of both worlds, combining growth with equity,and that it has been able to reduce poverty and place a considerable degreeof restraint on inequality while maintaining high economic growth.4
Rural-Urban and Regional DisparitiesThe contributions of some of the major authorities included earlier inchart 1 make obvious their concern over rising rural-urban and regionaldisparities. It is understandable that urban areas, which house concentra-tions of capital, technology, and skills, would be economically more advan-taged than rural areas, and that not all regions are likely to advance at thesame pace. There is a considerable literature that investigates these dispar-ities in India on the basis of GDP growth rates and GDP per capita andon indices of human development. The focus in what follows, however, isonly on performance in relation to poverty reduction and inequality, basedon data in the CE quinquennial surveys of the NSSO.
Table 16 confirms, first of all, the finding that poverty came downsharply after 1973–74 and further reveals that this finding of povertydecline broadly applies to both rural and urban areas. If one takes 1987–88
72 Baldev Raj Nayar
Table 16: Poverty Levels and Gini Ratios for Rural and Urban Areas
Survey Poverty Level (%) Gini CoefficientYear Rural Urban Rural Urban
1973–74 56.4 49.0 0.276 0.301
1977–78 53.1 45.2 0.339 0.345
1983 45.7 40.8 0.298 0.330
1987–88 39.1 38.2 0.298 0.354
1993–94 37.3 32.4 0.282 0.339
1999–00* 27.1 23.6 0.258 0.341
* 30-day recall
Source: Tables on “Population below Poverty Line,” “Indices of Poverty and Inequality” and“State-wise Gini Ratio for Per Capita Consumption Expenditure” at www.indiastat.com.

India’s Globalization 73
to represent the period prior to the paradigm shift in 1991, it is strikingthat both rural and urban areas had about the same proportion of the pop-ulation below the poverty line in that year; the difference between the twois nominal. Against that background, it becomes clear why observers havefound the period after the paradigm shift—the 1990s—to be one thatmanifests rising disparities between rural and urban areas. For, in1999–2000, the rural areas (27.1 percent) have a higher poverty level thanurban areas (23.6 percent) by 3.5 percentage points. On the other hand,it seems that 1987–88 is an unusual year, for earlier years show an evenhigher degree of disparity than 1999–2000—7.4 points in 1973–74, 7.9points in 1977–78, and 4.9 points in 1983. Again, it would seem that theobservations by some analysts about growing rural-urban disparities inrespect of poverty reduction are based on a limited time horizon. The sameseems to apply to the Gini ratio on inequality. The year 1999–2000, or forthat matter 1993–94—both after the paradigm shift—do not indicate ris-ing inequality, whether in rural or urban areas, but rather declininginequality compared to both 1987–88 and 1977–78.
Turning to regional inequalities, table 17 provides data on poverty lev-els for the major states of India. There is no doubt that disparities haveincreased among the different states in respect of performance on povertyreduction. This can be illustrated through comparing the average povertylevels in the worst five states to that of the best five states in each of theyears of 1973–74, 1987–88, and 1999–2000 (the states in the two groupschange over the years). The ratio between the two (the average for the worststates divided by that for the best) increased from 1.74 in 1973–74 to 2.91in 1987–88 to an excessively high 5.53 in 1999–2000. The trend in theratios clearly indicates that poverty has come down in the top five statesmuch more substantially than it has in the lowest five states. Again, howev-er, it bears mentioning that, while the best five states are certainly the gain-ers, the worst five states are not necessarily losers; rather, they are laggards,since poverty has come down considerably even in these states. Still, theimmense rise in regional disparities in relation to performance on povertyreduction is an ominous development, the redressing of which deservesserious attention from the Planning Commission and Finance Commissionbecause of its implications for centrifugal strains on the federation.
Employment and UnemploymentAs with poverty, so with unemployment—there is considerable controver-sy associated with the subject. Any assessment of the situation in respect

74 Baldev Raj Nayar
Table 17: State-Wise Percentage of Population Below Poverty Line in India
States 1973–74 1977–78 1983 1987–88 1993–94 1999–2000
Goa 44.26 37.23 18.90 24.52 14.92 4.40
Punjab 28.15 19.27 16.18 13.20 11.77 6.16
Himachal Pradesh 26.39 32.45 16.40 15.45 28.44 7.63
Delhi 49.61 33.23 26.22 12.41 14.69 8.23
Haryana 35.36 29.55 21.37 16.64 25.05 8.74
Kerala 59.79 52.22 40.42 31.79 25.43 12.72
Gujarat 48.15 41.23 32.79 31.54 24.21 14.07
Rajasthan 46.14 37.42 34.46 35.15 27.41 15.28
Andhra Pradesh 48.86 39.31 28.91 25.86 22.19 15.77
Karnataka 54.47 48.78 38.24 37.53 33.16 20.04
Tamil Nadu 54.94 54.79 51.66 43.89 35.03 21.12
Maharashtra 53.24 55.88 43.44 40.41 36.86 25.02
West Bengal 63.43 60.52 54.85 44.72 35.66 27.02
Uttar Pradesh 57.07 49.05 47.07 41.46 40.85 31.15
Assam 51.21 57.15 40.47 36.21 40.86 36.09
Madhya Pradesh 61.78 61.78 49.78 43.07 42.52 37.43
Bihar 61.91 61.55 62.22 52.13 64.96 42.60
Orissa 66.18 70.07 65.29 55.58 48.56 47.15
Source: www.indiastat.com.
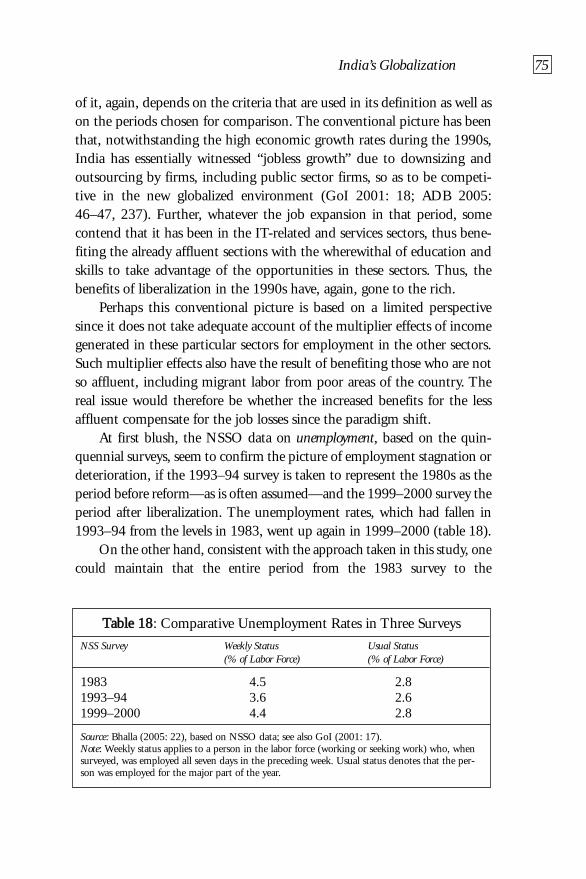
India’s Globalization 75
of it, again, depends on the criteria that are used in its definition as well ason the periods chosen for comparison. The conventional picture has beenthat, notwithstanding the high economic growth rates during the 1990s,India has essentially witnessed “jobless growth” due to downsizing andoutsourcing by firms, including public sector firms, so as to be competi-tive in the new globalized environment (GoI 2001: 18; ADB 2005:46–47, 237). Further, whatever the job expansion in that period, somecontend that it has been in the IT-related and services sectors, thus bene-fiting the already affluent sections with the wherewithal of education andskills to take advantage of the opportunities in these sectors. Thus, thebenefits of liberalization in the 1990s have, again, gone to the rich.
Perhaps this conventional picture is based on a limited perspectivesince it does not take adequate account of the multiplier effects of incomegenerated in these particular sectors for employment in the other sectors.Such multiplier effects also have the result of benefiting those who are notso affluent, including migrant labor from poor areas of the country. Thereal issue would therefore be whether the increased benefits for the lessaffluent compensate for the job losses since the paradigm shift.
At first blush, the NSSO data on unemployment, based on the quin-quennial surveys, seem to confirm the picture of employment stagnation ordeterioration, if the 1993–94 survey is taken to represent the 1980s as theperiod before reform—as is often assumed—and the 1999–2000 survey theperiod after liberalization. The unemployment rates, which had fallen in1993–94 from the levels in 1983, went up again in 1999–2000 (table 18).
On the other hand, consistent with the approach taken in this study, onecould maintain that the entire period from the 1983 survey to the
Table 18: Comparative Unemployment Rates in Three Surveys
NSS Survey Weekly Status Usual Status(% of Labor Force) (% of Labor Force)
1983 4.5 2.81993–94 3.6 2.61999–2000 4.4 2.8
Source: Bhalla (2005: 22), based on NSSO data; see also GoI (2001: 17).Note: Weekly status applies to a person in the labor force (working or seeking work) who, whensurveyed, was employed all seven days in the preceding week. Usual status denotes that the per-son was employed for the major part of the year.

1999–2000 survey falls under the rubric of liberalization, even if only a partof it. Further, the 1993–94 survey itself incorporates some of the impact ofthe paradigm shift in 1991. Again, a one-time figure for 1999–2000 may notbe an adequate basis for a conclusive generalization about post-1991 reforms.
Bhalla (2005) offers a useful compilation of data on employment thatincludes statistics on an annual basis—available only from 1989onwards—which, while encompassing the quinquennial surveys, stretchesbeyond 1999–2000 to 2003 (table 19 and figure 2). The picture thatemerges on employment is somewhat different from the conventional one,though not necessarily contradictory to it. This picture is not one of “job-less growth” but of secular growth in employment with annual variations.Particularly noteworthy is the continued rise in employment after thequinquennial survey of 1999–2000, except for the decline in 2002, adrought year. The recovery from the drought and from the earlier industri-al slow-down saw a considerable jump in employment in 2003. However,there are legitimate questions (GoI 2001: 2, 23–24) about the quality ofthe jobs created (which are primarily in the informal sector), since there isa big disparity between levels of unemployment (4.4 or 2.8 percent in table18) and poverty (26.1 percent) in 1999–2000.
76 Baldev Raj Nayar
Table 19: Employment in Millions
NSS Weekly Usual NSS Weekly UsualRound Period Status Status Round Period Status Status
38* Jan–Dec 83 263 274 52 July 95–June 96 344 34643* July 87–June 88 270 281 53 Jan–Dec 97 351 35345 July 89–June 90 298 308 54 Jan–June 98 341 34546 July 90–June 91 311 317 55* July 99–June 00 363 35947 July–Dec 91 317 321 56 July 00–June 01 364 36948 Jan–Dec 92 328 332 57 July 01–June 02 380 38450* July 93–June 94 341 331 58 July–Dec 02 377 37951 July 94–June 95 342 342 59 Jan–Dec 03 390 395
* quinquennial survey
Source: Bhalla (2005: 28), which is based on NSSO’s Employment-Unemployment Surveys for1983, 1993–94 and 1999–2000, and on NSSO’s Report on Household Consumer Expenditure andEmployment-Unemployment Situation in India, 59th Round, No. 490, March 2005.

India’s Globalization 77
Notwithstanding the somewhat brighter picture about employmentconveyed in table 19, the annualized rates of growth in employment on thebasis of the “weekly status” and “usual status” were nonetheless higher forthe 1983–90 period (2.4 and 2.1, respectively) than for the 1991–2003period (1.5 and 1.5, respectively; Bhalla 2005c: 30). Since this latter pat-tern of slower growth in the post-1991 period does not square with thesuperior performance in real wagerates during the same period,Bhalla finds the explanation for itin two factors (2005c: 30–33; seealso GoI 2001: 2, 18–19). One isthe decline in the growth rate in thecensus data of the potential laborforce in the age group of 15–59years from 2.6 percent in the 1980sto 2.3 percent in the 1990s; theNSSO’s age-distribution data show a steeper decline, to 1.7 percent. Theother factor pertains to a higher proportion of the 15–24 years age groupgoing to school in the post-1991 period, thus, again, reducing the poten-tial labor force; the growth in school enrollment from this age group washigher than the growth in the potential labor force. The slower growth in
despite the slower growth
rate in employment, the
overall picture is
one of improvement
5
Figure 2: Employment in India (in Millions)

employment in the 1990s, then, seems consistent with the slower growthin the potential labor force. In other words, despite the slower growth ratein employment, the overall picture is one of improvement. It is notewor-thy that there has been at the same time a drastic reduction in child laboras a proportion of the total population in the age group 10–14 years. Thatproportion fell from 16.7 percent in the quinquennial employment-unem-ployment survey in 1983 to 10.4 percent in 1993–94 and further to 7.3percent in 1999–2000, which is less than half of the 1983 figure (Bhalla2005c: 33).5
To sum up this section on impoverishment, poverty has droppedsharply over the period of economic liberalization, whether viewed from1975 onwards or since 1991. At the same time, inequality—in terms of theGini ratio or the share of the bottom 20 percent in per capita consump-tion—has not shown any increasing trend. Equally, it is evident that thedata for the longer term do not justify the picture of “jobless growth,” evenas child labor has seen a drastic reduction. At the same time, the record onregional disparities should be cause for serious concern because it placescentrifugal pressures on the federation, a fuller discussion of which wouldbe a fit subject for another study.6
Conclusion
The opponents of globalization have mounted a wide-ranging attack onglobalization that focuses on its malign consequences for economy, socie-ty, and polity as well as ecology in the developing countries. Regardless ofwhether such an attack is derived from ideological preferences or empiricalobservation, it deserves serious consideration because of the importance ofthe subject. Accordingly, to treat it adequately, the in-depth analysis hereof the issues involved has been confined only to India and has been limit-ed to the economy, where the purported ill-effects ascribed to globalizationinclude economic stagnation, deindustrialization, denationalization, desta-bilization, and impoverishment.
Whatever the value of the critique of globalization in relation to otherdeveloping countries, a thorough evaluation of it on the basis of empiricaldata, both quantitative and qualitative, demonstrates that it has littlemerit in the case of India. On literally every count that has been heldagainst globalization, the criticisms seem groundless. An important part ofthe empirical examination undertaken here was to compare systematical-ly the situation prevailing in India prior to globalization with that subse-
78 Baldev Raj Nayar

India’s Globalization 79
quent to the adjustment to globalization. For a realistic assessmentrequires the determination of what difference the presence or absence ofthe variable of globalization has made to the equa-tion. Without such a systematic comparison, unreal-istic expectations are likely to be held about the rangeof economic choice that may be available by eradicat-ing globalization. Obviously, the globalization periodneeds to be seen in a differentiated way depending onthe intensity of international integration. It is broad-ly divided here into two periods: (1) the intermittentincremental liberalization from 1975 to 1991, and(2) the post-paradigm shift period starting in 1991.Although the case in favor of globalization is manifest for both periods, itis especially so after the paradigm shift.7
What the empirical examination has demonstrated is that, instead ofeconomic stagnation, India achieved an acceleration of the growth rateafter it opted for integration with the world economy. And in doing so, ithas broken the barrier of stagnation that had been the lot of the countrybefore globalization. It is difficult to exaggerate the importance of thisaccomplishment. The acceleration has provided additional resources notonly for investment in human capital but also for expenditures on thesocial sectors and poverty alleviation. Moreover, the economic dynamismassociated with and resulting from the acceleration has imparted to theelites and the people the self-confidence to go forward with their projectof building a consolidated nation-state. It has indeed transformed whathad been mocked as “the sick man of Asia”—an inveterate supplicant forforeign aid, a perennial basket case—into a credible contender for a majorpower role in the balance of power in Asia.
Similarly, far from the specter of deindustrialization held out by thecritics, foreign imports have not swamped Indian industry after tariffswere lowered as part of India’s reintegration into the world economy.Rather, Indian industry has grown at a higher rate than it had prior to lib-eralization of the economy. To be sure, industrial advance in Indianowhere near compares with the industrial leap forward in China, butthen India’s integration into the world economy has by its own choice (orby necessity because of the nature of its political system) been limited,especially when compared to that of China, in respect of both trade andforeign investment. However, as India sustains its pattern of accelerated
On literally every
count [criticism
of globalization
seems groundless]
7

growth, circumstances are likely to change even in respect of FDI inflows;foreign investors will find participation in a rapidly growing market irre-sistible even with a restrictive regime, and in the process they will reinforcethe virtuous cycle.
On denationalization, industry in India has no doubt faced seriouschallenges from the entry of foreign multinationals, but it has not beenswallowed up by them. Foreign investment has served to supplement andnot supplant Indian industry. Besides, under the invigorating impulsesimparted by increased foreign competition, Indian industry has reorgan-ized itself and it has reoriented its horizons beyond the domestic market tothe wider world market in terms not only of exports and establishing sub-sidiaries but also of M&A purchases abroad.
On the issue of economic destabilization, the autarkic period prior tothe initial and nascent opening to globalization in 1975 was ridden witheconomic crises of a grave nature. Indeed, throughout that entire period,India labored under an enormous and enervating foreign exchange con-straint, which both retarded and distorted the country’s development. Theperiod of intermittent incremental liberalization still saw a couple of crisesbut, learning from the beneficial nature of its experience with integrationwith the world economy, the leadership used the occasions creatively toadvance liberalization. The story of India’s economy after the paradigmshift to economic liberalization in the early 1990s is entirely different,however—India has not yet seen another economic crisis and no longerfaces a foreign exchange constraint because of its accumulating reserves.Some credit may go to some of the continuing capital controls, but con-trols by themselves do not explain the stability. Rather, the explanation liesin the positive results that followed liberalization—a more rapidly expand-ing economy, the build-up of foreign exchange reserves—that have addedto the national capacity to cope with instability and, indeed, to preempt it.The controls were even more stringent earlier, but that had not preventedcrises from arising. There is, no doubt, considerable potential for the erup-tion of an economic crisis in the future as a result of the persistent fiscaldeficits, but the latter have their roots in political and electoral compul-sions in the domestic arena, not globalization.
As for impoverishment, the globalization period has seen welfareenhancement through a long-term decline in poverty without any markedincrease in inequality relative to the period prior to economic reform.There can be no doubt about this result of poverty decline, with the line
80 Baldev Raj Nayar

India’s Globalization 81
of causality running from globalization and liberalization to accelerationin the growth rate and then poverty reduction. Obviously, there wouldhave been more reduction of poverty if some of the economic laggardsamong the states had set their house in order to push for higher econom-ic growth. At the same time, it would be heartless, indeed cruel, to makethe performance on poverty reduction an occasion to celebrate liberaliza-tion, as so much poverty still remains, even when defined minimally incaloric-intake terms. Indeed, it is the persistence of poverty in such mas-sive numbers that makes understandable the passion that goes into cri-tiques of the contemporary situation. However, the conclusion that flowsfrom a considered comparative analysis of the trends over the extendedperiod of liberalization—when set against the period prior to it, of stagger-ingly high poverty and economic stagnation—is different. Poverty reduc-tion has gone forward with the higher rates of economic growth that inter-mittent doses of liberalization and the paradigm shift facilitated. The pol-icy implication therefore is more, not less, liberalization that fosters andsustains rapid economic growth, especially in industry and agriculture.
The widening of regional disparities in poverty reduction, as moregenerally in economic growth, remains a matter of deep concern. As longas measures are undertaken to reduce the sharper edges of such disparities,the present situation need not, however, be viewed entirely negatively. Theearlier situation of relatively smaller regional disparities was associatedwith economic stagnation, whereas economic dynamism characterizes thepresent situation—to be vastly preferred over economic stagnation. Thegreater advance by some states should be a stimulus to the laggard statesto set their own house in order to promote growth, with the support of thecentral government, obviously.
In short, contrary to the position of the critics, globalization has—toput it provocatively—served as the agent of deliverance for India from eco-nomic stagnation and perpetual economic crises, even as it has helpedreduce poverty. India continues to be dogged by deep-seated societal prob-lems that persisted through the autarkic period, but it is precisely theaccelerated growth generated by globalization that has been providing theadditional resources to alleviate, if not yet to remove, them.
In view of the beneficial results that globalization has brought to Indiawhen compared with the situation that existed before it, the larger policyorientation that the case study forcefully urges on us is that there should,in general, be greater openness to globalization. Economic reform is not a

82 Baldev Raj Nayar
one-time affair but an ongoing process to sustain growth acceleration. Indiahas now enhanced its capacity to manage greater integration with the worldeconomy, which is essential for sustaining the accelerated growth rate. Thatis not, however, an argument for a mindless or reckless integration, fornation-states fundamentally exist to advance the interrelated goals of wealthand power of their peoples. But India need not worry on that count, forexcessive caution is built into its political structure as a central tendency.
International economic integration is a means to an end, not an endin itself. One of India’s paramount aims has been the alleviation of pover-ty and, for that purpose, the promotion of wider gainful employment. Thefulfillment of that aim requires not just the maintenance of the highergrowth rate thus far achieved but its further acceleration to 9 or 10 per-cent. Accomplishing such acceleration, in turn, demands a major boost toinvestment in both agriculture and industry. The world economy can serveas both a resource for additional finance for investment via FDI and amarket for the commodities produced and goods manufactured. To fosteran environment that is conducive to greater investment, several reformsseem appropriate. There needs to be, of course, prudential macroeconom-ic management, particularly in respect of bringing down the fiscal deficitand the public debt. At the same time, support would have to continue tobe provided to the poor even as non-strategic public sector enterprises areprivatized to make them function more productively and efficiently. Thepromotion of industrialization requires introducing flexibility in the cur-rently rigid labor markets through reforming the antiquated labor lawsand at least selectively de-reserving industries that are now reserved for thesmall-scale sector. It requires, as well, the radical improvement of the infra-structure, particularly as regards to power, the lowering of tariffs toenhance competitiveness, the relaxation of restrictions on FDI, and high-er investment in the social sectors. Such an agenda for reform, though notundisputed, is widely understood (see, for example, GoI’s annualEconomic Surveys over the last decade). What is necessary, however, isemphatic action. That presupposes movement on assuring effective gover-nance (Jalan 2005), where institutional infirmities have accumulated toprevent India from performing to its economic potential.

India’s Globalization 83
Acknowledgements
First and foremost, I would like to express my gratitude to Dr. Muthiah Alagappafor his encouragement, and for arranging a rigorous and comprehensive review ofthe paper. The paper went through the review process twice, and I have valuedhighly the detailed comments of the three anonymous reviewers. I believe thattheir criticisms have made the paper better. I am grateful to Professors JagdishHanda and T. V. Paul, both of McGill University, for their valuable advice andsupport. As a colleague of forty years, Professor Handa has long borne the bur-den, on being constantly importuned, of perpetually instructing me in variousaspects of economics. I acknowledge with thanks the dedicated research assistanceprovided by Leah Gardner for this paper. My greatest debt is owed to my wife,whose devotion to family and research remains undiminished despite her decade-long battle with breast cancer.

84 Baldev Raj Nayar

India’s Globalization 85
Endnotes1. In a subsequent contribution, Patnaik and Rawal (2005) repeat the stagnation and
deindustrialization theses, arguing: “the ‘opening up’ of an underdeveloped economyto free capital flows, instead of boosting its rate of growth as neo-liberals claim, wouldhave the precisely opposite effect of unleashing ceteris paribus a tendency towardsstagnation and greater unemployment. . . . a reduction in the level of activity (‘dein-dustrialization’).” For other works largely critical of globalization in relation to India,see Nayyar (1996), Ghosh and Chandrasekhar (2002), Gupta et al. (2003), Vanaik(2004), and Kar (2005).
2. As Grenville notes: “Globalization is an opportunity for countries to improve theirliving standards. Individual countries must decide how deeply they will avail them-selves of this opportunity. It is not an all-or-nothing choice” (2001: 34). Similarly,Bimal Jalan advises: “neither view—for or against [globalization]—is correct. Theonly rational view is to accept it as an emerging and powerful global reality which hasa momentum of its own. Our job as an independent nation/state is to ensure that wemaximize the advantage of our country and minimize the risks” (2001: 9).
3. As two eminent observers have noted: “We must wake up to the realization that weare now a highly open economy, and consequently need to start behaving like one”(Kelkar 2004); “the meaning is clear: what goes on in India is now influenced byglobal trends” (Ninan 2004).
4. Nagaraj notes: “While the size and growth rate of India’s industrial sector and itsexports are modest compared to China’s, it seems to rest on a firmer microeconomic,legal and institutional footing. India’s growth and exports have a much higher domes-tic content, domestic ownership and are sold under domestic brands. In an increas-ingly open economic environment, Indian firms have displayed the ability [to] inter-

nationalize their operations with exports and by investing in businesses abroad in avariety of manufacturing and service industries” (2005: 2,170).
5. On the database at the Research and Information System for the Non-Aligned andOther Developing Countries (RIS), Kumar states: “We have computed share of for-eign firms in total value-added and total sales in a sample of large private sector com-panies that are quoted at Indian stock exchanges and included in the RIS Databasecompiled by extracting information of relevant companies from the Prowess (online)Database of the Center for Monitoring Indian Economy (CMIE). The shares comput-ed on the basis of the sample such as this are useful only to observe trends over time asinformation is not available from official sources” (2003: 14). Attempts to elicit fur-ther information from the author, who is the director-general of RIS, on the databaseand the selection of foreign enterprises were not successful.
6. See the article “Super 100—India’s Best Performing Companies” (Business India,October 11, 2004), available at www.iocl.com/story_businessindia.asp. Based on sever-al variables, the ranking is among those companies that are listed on the stockexchanges. It thus excludes those public sector firms in which there is no private equi-ty, some of which are massive. It would seem that the ranking would not have beenaffected much by the inclusion of foreign firms that are not listed on the stockexchanges, such as Ford India.
The conclusion on foreign ownership would be substantially similar to another rank-ing that is based on net sales only of firms listed on the stock exchanges. Four foreignfirms appear among the top 25 of BS 1000 (Business Standard, January 2004, supple-mentary brochure)—Hindustan Lever, Maruti Udyog, ITC, and Hero Honda. The listexcludes financial services and banks.
7. Among the prominent Indian takeovers of foreign businesses in recent years, quite afew have been by several enterprises of the House of the Tatas, including purchases ofDaewoo’s truck business division by Tata Motors, Tyco Global Network by thetelecommunications firm Videsh Sanchar Nigam Limited, and National Steel ofSingapore by Tata Steel. Other purchases by Indian firms include the German forgingcompanies CDP and CDP-AT by Bharat Forge (now the world’s second largest forg-ing company), Berger International by Asian Paints, the German maker of specialtypolyester fibers Trevira by Reliance, the UK-based maker of molded luggage CarltonInternational by Dilip Piramal, and the generics business of Aventis by pharmaceuticalgiant Ranbaxy Laboratories. See the special issue of BusinessWorld (June 7, 2004) onglobalization (available at www.businessworldindia.com/june0704/coverstory/01.asp)as well as Ganguli and Sriram (2005) and Murti (2005).
8. These include not only several of the IT and pharmaceutical firms, but also othercompanies, such as United Phosphorous, Bharat Forge, Nalco, Tata Tea, and EastIndia Hotels. In the case of JSW Steel, 49 percent of its revenues are from overseas.Other companies with high overseas revenues include: Sesa Goa (45%), Arvind Mills(41%), Reliance Industries (36%), Cummins India (34%), and Hindalco (24%).
86 Baldev Raj Nayar

India’s Globalization 87
9. What is remarkable is that in twenty-three companies, of which nine were in theSensex, the stake of the FIIs was higher than that of all the local banks, mutual funds,and public and private companies put together. Indeed, their holdings in HDFC(63.17%), Satyam Computer Services (56.59%) and HDFC Bank (28.99%) weremore than that of the promoters (Korgaonkar 2005b, 2005c; Nayak 2005).
10. “The magnitude of FDI/FII flows are tending to be large and volatility has perhapsincreased. The impact of such flows on the stock markets is discernible, but per-haps less evident at this juncture in corporate ownership and control. . . . A viewneeds to be taken on the quantity and quality of FII flows. While quotas or ceil-ings, as practiced by certain countries, may not be desirable at this stage, there ismerit in our keeping such an option open and exercising it selectively as needed,after due notice to the FIIs” (Hindu Online and Hindu Business Line Online,January 13, 2005).
11. “Over the last few years, as the size of the foreign exchange market has increased, ithas become even more difficult for the RBI to fix the rate. Today, it is the RBI’s frus-tration at its shrinking power to manipulate the rupee that makes it wish to reducethe size of the market. The increase in the size of reserves is not an outcome ofinflows, it is the outcome of RBI buying dollars to manipulate the rupee dollar rateand keep its movements within a narrow band. . . . RBI wants to cling on to theircontrol of the exchange rate, and this can only be achieved by bringing back controlson FII and FDI flows” (Ila Patnaik 2005b).
12. Experts differ on their characterization of Indian exchange rate policy, partly perhapsbecause the policy itself has not been constant. Some call it a “dirty float” (Sharma2005, Ninan 2005a). Others refer to it as “a flexible exchange rate policy, not apegged rate” or “exchange rate flexibility without a fixed rate or a pronounced band”(Venkitarmanan 2005a,b). Still others regard it in certain periods as “tightly manag-ing” or “tightly pegging” the rate (Ila Patnaik 2005a).
13. In 1997–98, the FD/GDP ratio was 4.8 percent and in the subsequent five years itwas even higher at 5.1, 5.4, 5.7, 6.2 and 5.9 percent. In 2003–04, it came down to4.6 percent (GoI 2005: 20).
14. Note Fischer’s reservation about developing countries: “It is likely that the Maastricht60 percent debt-to-GDP threshold ratio is too high for countries subject to muchlarger interest rate and other external shocks than are the industrialized countries”(2003: 19). For a balanced treatment of the issue in relation to India, see Ahluwalia(2002a) and Acharya (2002).
15. Some critics have speculated that if the present GDP levels had been subjected totaxation rates at the level of 1990-91, there would be abundant resources available forwelfare programs. As Sainath comments, “As Professor Patnaik points out: ‘Thecountry’s tax-GDP ratio, already among the lowest in the world,’ sank with the com-ing of the ‘reforms.’ What if the Central tax-GDP ratio had stayed the same as it wasin 1990-91? ‘Then the Center,’ he points out, ‘would be raising an additional rev-enue of Rs. 30,000 crore annually at today’s GDP’” (2005). There is little merit in

such speculation, however, without also asking what the current levels of GDP wouldhave been without the reforms.
16. The recent controversies about poverty and inequality revolve around the issue of thequestionnaire used in the quinquennial CE survey of 1999–2000 not being quitecomparable to the one used in the 1993–94 survey or other such surveys. Earlier,households were basically administered a long questionnaire about their consump-tion expenditures for a uniform recall period of 30 days. But in the 1999–2000 sur-vey, NSSO—which had been experimenting with questionnaire design in some ofthe annual surveys—used a 7-day recall period in addition to the 30-day recall peri-od, for a certain set of questions pertaining largely to food, referred to as “the foodgroup.” This procedure in which the columns for the two recall periods were juxta-posed alongside each other on the same page of the questionnaire—with the 7-dayrecall period coming before the 30-day period—is said to have contaminated orbiased the survey results. Having first answered the questions for the 7-day recallperiod—the recall for which is likely to be better—the respondents may then havesimply mentally extrapolated their responses to the 30-day recall period. Besides, inrelation to certain durable goods, the NSSO used only a 365-day recall period incontrast to the earlier practice of using a uniform 30-day recall period. The conse-quence of this innovation may again have been to raise CE estimates, since thechances of such goods being purchased are likely to increase over a 365-day periodthan over a 30-day one. The net result of these two changes may have been to elevateCE figures compared to earlier surveys and thus biased upward the subsequent offi-cial estimates about decline in poverty.
These changes in questionnaire design have, of course, provided a field day for theexperts. Analysts studying the problem of poverty and inequality in India haveemployed various techniques, some of them quite innovative, to overcome the prob-lems of comparability between the 1999–2000 survey and the survey in 1993–94 asalso the ones in 1983 and 1987–88. They have often taken all three of the CE surveysprior to the 1999–2000 in whole or in part to stand broadly for the record on povertyand inequality before the economic reforms. Additionally, some analysts have used theannual surveys based on “thin” simples to bolster their particular case. Little wonderthat they have come up with the kind of different results that are reflected in chart 1or that there is so much controversy about the issue of poverty and inequality.
It may well be that there is an element of “overcorrection” in the various analyses,because six weeks into the 1999–2000 survey, NSSO issued instructions to the fieldinvestigators to ask questions about the 30-day recall period first and only then aboutthe 7-day recall period. That would mean that, of all the households surveyed, onlyabout 10 percent might have had their 30-day recall responses contaminated by anearlier 7-day recall. However, while some analysts refer to this fact they do so only inpassing without taking it into account in their analyses; others simply ignore it ormay even be unaware of it.
88 Baldev Raj Nayar

India’s Globalization 89
BibliographyAcharya, Shankar. 2002. “Managing India’s External Economic Challenges in the 1990s.”
In Macroeconomics and Monetary Policy: Issues for a Reforming Economy, ed.Montek S. Ahluwalia, Y. V. Reddy, and S. S. Tarapore. New Delhi: OxfordUniversity Press.
———. 2004. “Reforms—But at What Speed?” Business Standard Online, May 25.
———. 2005a. “A New BOP Paradigm.” Business Standard Online, February 22.
———. 2005b. “Reviving Industrial Employment.” Business Standard Online,November 22.
Ahluwalia, Isher Judge, and I.M.D. Little, eds. 1998. India’s Economic Reforms andDevelopment: Essays for Manmohan Singh. Delhi: Oxford University Press.
Ahluwalia, Montek S. 2002. “India’s Vulnerability to External Crises: An Assessment.” InMacroeconomics and Monetary Policy: Issues for a Reforming Economy, ed. Montek S.Ahluwalia, Y. V. Reddy, and S. S. Tarapore. New Delhi: Oxford University Press.
———. 2002b. “State-level Performance under Economic Reforms in India.” InEconomic Policy Reforms and the Indian Economy, ed. Anne O. Krueger. NewDelhi: Oxford University Press, 91–125.
Aiyar, Swaminathan S. Anklesaria. 2003. “The Neo-Hindu GDP Growth Rate.” Times ofIndia Online, March 9.
———. 2004. “Invisibles Overtake Visible Exports.” Times of India Online, December 8.
———. 2005. “FII Inflows Aren’t Hot Money.” Times of India Online, January 16.
Amin, Samir. 1974. Accumulation on a World Scale: A Critique of the Theory ofUnderdevelopment. New York: Monthly Review Press.
Andersson, Martin, and Christer Gunnarsson, eds. 2003. Development and StructuralChange In Asia-Pacific: Globalizing Miracles or End of a Model? London:RoutledgeCurzon.

Asian Development Bank [ADB]. 2005. Key Indicators 2005: Labor Markets in Asia:Promoting Full, Productive, and Decent Employment. Manila, Philippines: ADB.Also available online.
Balassa, Bela. 1985. Change and Challenge in the World Economy. London: Macmillan.
Banerjee, Abhijit, and Thomas Piketty. 2001. “Are the Rich Growing Richer? Evidencefrom Indian Tax Data.” Available at:http://lnweb18.worldbank.org/sar/sa.nsf/Attachments/ppd/$File/Abhijit0Banerjee0and0Picketty0Paper.pdf.
Bandyopadhyay, Tamal. 2005. “FII Money: India Gaining on Asia.” Business StandardOnline, February 09.
Barua, Abheek. 2005. “Do We Have a New Growth Model?” Business Standard Online,April 8.
Basant, Rakesh. 2000. “Corporate Response to Economic Reforms.” Economic andPolitical Weekly 35, no. 10 (March 4): 813–22.
Bhagwati, Jagdish. 2004. In Defense of Globalization. New York: Oxford University Press.
Bhagwati, Jagdish N., and Padma Desai. 1970. India: Planning for Industrialization:Industrialization and Trade Since 1951. London: Oxford University Press.
Bhalla, Surjit S. 2002. Imagine There’s No Country: Poverty, Inequality, and Growth inthe Era of Globalization. Washington, D.C.: Institute for International Economics.
———. 2003a. “Not as Poor, Nor as Unequal, As You Think—Poverty, Inequality, andGrowth in India, 1950-2000.” Available at www.oxusresearch.com. December 4.
———. 2003b. “Recounting the Poor: 1983-99.” Economic and Political Weekly. 38,no. 4 (January 25): 338–49.
———. 2004. “Why be Afraid of the Truth? Poverty, Inequality, and Growth in India,1983-2000.” Available at www.oxusresearch.com. December 6.
———. 2005a. “Earn Poor, Spend Rich: Jadu Economics.” Business Standard Online,January 22.
———. 2005b. “Finding India’s Nemo—A Low Tax-to-GDP Ratio.” Business StandardOnline, February 8.
———. 2005c. “Unemployment and Wages in India: Ideology, Reforms, Evidence.”Available at www.oxusresearch.com. July 15.
Bhattacharya, B. B., and S. Sakthivel. 2004. “Regional Growth and Disparity in India:Comparison of Pre- and Post-Reform Decades.” Economic and Political Weekly 39,no. 10 (March 6): 1071–77.
Burger, Philippe. 2003. Sustainable Policy and Economic Stability: Theory and Practice.Cheltenham, UK: Edward Elgar.
Chan, Steve, and James R. Scarritt. 2002. Coping with Globalization: Cross-NationalPatterns in Domestic Governance and Policy Performance. London: Frank Cass.
Chanda, Rupa. 2002. Globalization of Services: India’s Opportunities and Constraints. NewDelhi: Oxford University Press.
Chandrasekhar, C. P. 2005a. “IT-Services as Locomotive.” Frontline Online, July 1.
———. 2005b. “Too Much for Comfort.” Frontline Online, January 15.
Chomsky, Noam. 2002. “A World Without War? Reflections on Globalization and Anti-Globalization.” Canadian Journal of Development Studies 33, no. 3: 493–511.
90 Baldev Raj Nayar

India’s Globalization 91
Cockcroft, James D., Andre Gunder Frank, and Dale L. Johnson. 1972. Dependenceand Underdevelopment: Latin America’s Political Economy. Garden City, NY:Anchor Books.
Cole, Shawn. 2004. “Fixing Market Failures or Fixing Elections? Agricultural Credit inIndia.” Job Market Paper, Department of Economics, MIT, December 17.Available online.
Cordoso, Henrique, and Enzo Faletto. 1979. Dependency and Development in LatinAmerica. Berkeley: University of California Press.
Das, Tarun. 1996. “MNCs: India Strategy Needs Rethink.” Typescript. New Delhi: CII.
Datt, Gaurav, and Martin Ravallion. 2002. “Is India’s Economic Growth Leaving thePoor Behind?”Journal of Economic Perspectives 16, no. 3 (Summer): 89–108.
Dasgupta, Dipak, Marc Uzan, and Dominic Wilson, eds. 2001. Capital Flows WithoutCrisis: Reconciling Capital Mobility and Economic Stability. London: Routledge.
Dasgupta, Dipankar et al. 2000. “Growth and Interstate Disparities in India.” Economicand Political Weekly 35, no. 27 (July 1): 2,413–22.
Deaton, Angus, and Jean Dreze. 2002. “Poverty and Inequality in India: A Re-Examination.” Economic and Political Weekly 37, no. 36 (September 7): 3,729–48.
Desai, Ashok V. 1999. The Economics and Politics of Transition to an Open MarketEconomy: India. Technical Paper No. 155. Paris: OECD Development Centre.
———. 2001. “A Decade of Reforms.” Economic and Political Weekly 36, no. 50.
Dhar, P. N. 2003. The Evolution of Economic Policy in India: Selected Essays. New Delhi:Oxford University Press.
Dollar, David. 1992. “Outward-oriented Developing Economies Really Do Grow MoreRapidly: Evidence from 95 LDCs, 1976-1985.” Economic Development andCultural Change. 40, no. 3: 523–44.
Dollar, David, and Aart Kraay. 2004. “Trade, Growth, and Poverty.” Economic Journal114, no. 493: (February), F22–F49.
Edwards, Sebastian. 1998. “Openness, Productivity, and Growth: What Do We ReallyKnow?” Economic Journal 108, no. 2: 384–98.
Emcee. 2005. “Wrong Diagnosis, Dr. Reddy.” Business Standard Online, January 15.
Falk, Richard.1999. Predatory Globalization: A Critique. Cambridge, UK: Polity Press.
Fischer, Stanley. 2003. “Globalization and Its Challenges.” American Economic Review 93,no. 2 (May): 1–30.
Frankel, Jeffrey A., and David Romer. 1999. “Does Trade Cause Growth?” AmericanEconomic Review 89, no. 3: 379–99.
Ganguli, Bodhisatva, and R. Sriram. 2005. “Local Cos Spin Dreams from Global Dust.”Economic Times, January 18.
Garrett, Geoffrey. 2001. “The Distributive Consequences of Globalization.” January.Available online.
Ghosh, B. N., ed. 2001. Global Financial Crises and Reforms: Cases and Caveats.London: Routledge.
Ghosh, Buddhadeb, and Prabir De. 2004. “How Do Different Categories ofInfrastructure Affect Development? Evidence from Indian States.” Economic andPolitical Weekly 39, no. 42 (October 16): 4,645–57.

Ghosh, Jayati, and C. P. Chandrasekhar. 2002. The Market That Failed: A Decade ofNeoliberal Economic Reforms in India. New Delhi: Leftword Book.
Gilpin, Robert. 2000. The Challenge of Global Capitalism: The World Economy in the 21stCentury. Princeton: Princeton University Press.
Government of India [GoI]. 1983. Economic Survey 1982-83. New Delhi: Ministryof Finance.
———. 1998. Economic Survey 1997-98. New Delhi: Ministry of Finance.
———. 2001. Report of the Task Force on Employment Opportunities. New Delhi:Planning Commission, June.
———. 2002. Report of the Steering Group on Foreign Direct Investment. New Delhi:Planning Commission, August. Available online.
———. 2004a. Central Government Subsidies in India: A Report. New Delhi: Ministry ofFinance. Prepared with the assistance of the National Institute of Public Financeand Policy.
———. 2004b. Report of the Committee on Liberalization of Foreign InstitutionalInvestment. June. New Delhi: Ministry of Finance. Available online.
———. 2005. Economic Survey 2004-05. New Delhi: Ministry of Finance.
Goyal, Ashima, and A. K. Jha. “Dictatorship, Democracy and Institutions: Macro Policyin China and India.” Economic and Political Weekly 39, no. 42 (October 16):4,464–74.
Grenville, Stephen. 2001. “Financial Crises and Globalization.” In Capital Flows WithoutCrisis? Reconciling Capital Mobility and Economic Stability, ed. Dipak Dasgupta,Marc Uzan, and Dominic Wilson. London: Routledge.
Gupta, Suman, Tapan Basu, and Subarno Chattarji, eds. 2003. India in the Age ofGlobalization: Contemporary Discourses and Texts. New Delhi: Nehru MemorialMuseum and Library.
Hanson, A. H. 1966. The Process of Planning: A Study of India’s Five Year Plans, 1950-1964. London: Oxford University Press.
Hashim, S. R. 1998. “Economic Growth and Income Distribution: The IndianExperience of Development.” Economic and Political Weekly 13, no. 12 (March21): 661–66.
Hausman, Ricardo, and Catrina Purfield. 2004. The Challenge of Fiscal Adjustment in aDemocracy: The Case of India.” IMF Working Paper WP/04/168. Washington,D.C.: IMF.
Hawkins, Penelope Anne. 2003. The Open Economy and Its Financial Constraints.Northampton, MA: Edward Elgar.
Huang, Yasheng. 2001. “The Role of Foreign-Invested Enterprises in the ChineseEconomy: An Institutional Foundation Approach.” In China, the United States,and the Global Economy, ed. Shuxun Chen and Charles Wolf Jr. Santa Monica,CA: Rand Corporation.
Iacobucci, Edward M., Michael J. Trebilcock, and Huma Haider. 2001. Economic Shocks:Defining a Role for Government. Toronto: C.D. Howe Institute.
IMF. 2005. “IMF Executive Board Concludes 2004 Article IV Consultation with India.”IMF Public Information Notice No. 05/12. February 3. Washington, D.C.: IMF.
92 Baldev Raj Nayar

India’s Globalization 93
International Organization for Migration. 2000. World Migration Report 2000. Geneva,Switzerland. Available online.
———. 2003. Labor Migration in Asia: Trends, Challenges, and Policy Responses inCountries of Origin. Geneva, Switzerland. Available online.
Jadhav, Narendra. 2003. “Capital Account Liberalization: The Indian Experience,” Paperpresented at the conference on “A Tale of Two Giants: India’s and China’s Experiencewith Reform and Growth.” November. New Delhi, India. Available online.
Jalan, Bimal. 1991. India’s Economic Crisis: The Way Ahead. Delhi: Oxford University Press.
———. 2001. “India and the Challenge of Globalization.” Indian Economic Journal 49,no. 3 (January–March): 9–12.
———. 2005. The Future of India: Politics, Economics, and Governance. New Delhi:Penguin/Viking.
Joseph, Mathew. 2004. “Performance of the Northern States: A Comparative Analysis.”Economic and Political Weekly 39, no. 6 (February): 564–79.
Joshi, Vijay, and I. M. D. Little. 1994. India: Macroeconomics and Political Economy,1964-1991. Washington, D.C.: World Bank.
———. 1996. India’s Economic Reforms 1991-2001. Delhi: Oxford University Press.
Kar, Samit, ed. 2005. Globalization: One World, Many Voices. Jaipur, India: Rawat Publications.
Kaufman, Robert R., and Alex Segura-Ubiergo. 2001. “Globalization, Domestic Politics,and Social Spending in Latin America: A Time-Series Cross-Section Analysis,1973-97.”World Politics 53 (July): 553–87.
Kelkar, Vijay. 2004. “Globalization Involves Us All.” Indian Express Online, November 20.
Klein, Naomi. 2002. The Front Lines of the Globalization Debate. Toronto: Vintage Canada.
Korgaonkar, Deepak. 2005a. “FII Buying Sets New High in February.” Business StandardOnline, March 2.
———. 2005b. “FIIs Hold One in Every Five Blue-Chip Shares.” Business StandardOnline, January 20.
———. 2005c. “FIIs Largest Shareholders in 77 Indian Companies.” Business StandardOnline, January 25.
Krueger, Anne O. 2004a. “An Intolerable Surge? International Capital Flows and theIndian Policy Response.” January 21. Washington, D.C.: IMF. Available online.
———. 2004b. “Letting the Future In: India’s Continuing Reform Agenda.” June 4.Washington, D.C.: IMF. Available online.
Kumar, Nagesh. 2000. “Mergers and Acquisitions by MNEs: Patterns and Implications.”Economic and Political Weekly 35, no. 32 (August 5): 2,851–58.
———. 2003. “Liberalization, Foreign Direct Investment Flows, and EconomicDevelopment: The Indian Experience in the 1990s.” RIS Discussion Paper65/2003. New Delhi: Research and Information System for the Non-Aligned andOther Developing Countries.
———. 2005. “Liberalization, Foreign Direct Investment Flows, and Development:Indian Experience in the 1990s.” Economic and Political Weekly 40, no. 14 (April2): 1,459–69.

Lewis, John P. 1963. Quiet Crisis in India: Economic Development and American Policy.Bombay: Asia Publishing House.
Mohan, T. T. Ram. 2005. “Taking Stock of Foreign Institutional Investors.” Economic andPolitical Weekly 40, no. 24 (June 11): 2395–99.
Mohan, T. T. Ram, Ravindra H. Dholakia, and Navendu Karan. 2005. “Is India’s CentralDebt Sustainable? Revisiting an Old Debate.” Economic and Political Weekly 40,no. 10 (March 5): 951–59.
Monbiot, George. 2003. The Age of Consent: A Manifesto for a New World Order.Hammersmith, London: Flamingo.
Mulji, Sudhir. 2004a. “The Humbug of Fiscal Deficits.” Business Standard Online,January 1.
———. 2004b. “Why Deficit Finance Works.” Business Standard Online, April 22.
———. 2004c. “A Keynesian Election.” Business Standard Online, June 3.
Murti, Mohan. 2005. “Rumbles of Acquisitions in Europe.” Hindu Business Line Online,April 25.
Nagaraj, R. 2005. “Industrial Growth in China and India: A Preliminary Comparison.”Economic and Political Weekly 40, no. 21 (May 21): 2,163–71.
Nayak, Mahesh. 2005. “FII Stake in 202 Firms Surges in Q3.” Financial Express Online,January 18.
Nayar, Baldev Raj. 1989. India’s Mixed Economy: The Role of Ideology and Interest in ItsDevelopment. Bombay: Popular Prakashan.
———. 2001. Globalization and Nationalism: The Changing Balance in India’s EconomicPolicy, 1950-2000. New Delhi: Sage.
Nayyar, Deepak. 1996. Economic Liberalization in India: Analytics, Experience, and Lessons.Hyderabad: Orient Longman.
Ninan, T. N. 2004. “Part of the World.” Business Standard Online, November 27.
———. 2005a. “Dirty Trinity.” Business Standard Online, May 7.
———. 2005b. “Market Imbalances.” Business Standard Online, May 5.
OECD. 1982. External Debt of Developing Countries: 1982 Survey. Paris.
———. 1993. Financing and External Debt of Developing Countries: 1992 Survey. Paris.
Pal, Parthapratim. 2005. “Volatility in the Stock Market in India and ForeignInstitutional Investors: A Study of the Post-Election Crash.” Economic and PoliticalWeekly 40, no. 8 (February 19): 765–72.
Panagariya, Arvind. 2004. “Growth and Reforms during 1980s and 1990s.” Economic andPolitical Weekly 39, no. 25 (June 19): 2,581–94.
Papanek, Gustav F. 1967. Pakistan’s Development: Social Goals and Private Incentives.Cambridge, MA: Harvard University Press.
Parikh, Kirit S., ed. 1997. India Development Report 1997. New Delhi: OxfordUniversity Press.
Patnaik, Ila. 2004a. “Gained in Translation, Part I: Reserving Currency to Go ShoppingAbroad.” Indian Express Online, November 29.
———. 2004b. “Gained in Translation, Part II: Dollars Dollars Everywhere But NotVery Much to Buy.” Indian Express Online, December 1.
94 Baldev Raj Nayar

India’s Globalization 95
———. 2005a. “Fear of Floating”. Indian Express Online, March 21.
———. 2005b. “From India on Move: A Reverse Signal.” Indian Express Online,January 13.
Patnaik, Prabhat. 2003. The Retreat to Unfreedom: Essays on the Emerging World Order.New Delhi: Tulika.
Patnaik, Prabhat, and Vikas Rawal. 2005. “Level of Activity in an Economy with FreeCapital Mobility.” Economic and Political Weekly 40, no. 14 (April 2): 1,449–58.
Petras, James, and Henry Veltmeyer. 2001. Globalization Unmasked: Imperialism in the21st Century. Halifax, Nova Scotia: Fernwood.
Rajan, Raghuram G. 2003. “The Fiscal Deficit Will Come Back to Haunt India: AnInterview.” December 15. Washington, D.C.: IMF. Available online.
———. 2005. “India: A Hub for Globalizations.” January 7. New Delhi. Available online.
Rao, M. Govinda. 2005a. “Should Indians Pay More in Taxes.” Business StandardOnline, February 12.
———. 2005b. “Fiscal Adjustment: What Prospects?” Business Standard Online, May 4.
Rao, M. J. Manohar. 2002. “Business Cycles, International Linkages, and ExchangeRates.” In Macroeconomics and Monetary Policy: Issues for a Reforming Economy, ed.Montek S. Ahluwalia, Y. V. Reddy, and S. S. Tarapore, eds. New Delhi: OxfordUniversity Press.
Reserve Bank of India [RBI ]. 1976. Report on Currency and Finance 1975-76. Vol. 1.Bombay: RBI.
Rodriguez, Francisco, and Dani Rodrik. 2001. “Trade Policy and Economic Growth: ASkeptic’s Guide to the Cross-National Evidence.” In NBER MacroeconomicsAnnual 2000, ed. Ben S. Bernanke and Kenneth Rogoff. Cambridge, MA: MITPress, 261–324.
Rodrik, Dani. 1997. Has Globalization Gone Too Far? Washington, D.C.: Institute forInternational Economics.
Rodrik, Dani, and Arvind Subramanian. 2004. “From ‘Hindu Growth’ to ProductivitySurge: The Mystery of the Indian Growth Transition.” March. Cambridge, MA,and Washington, D.C. Available online.
Sachs, Jeffrey D., and Andrew M. Warner. 1995. “Economic Reform and the Process ofGlobal Integration.” Brookings Papers on Economic Activity 1:1-118.
Saez, Lawrence. 2003. “Market-preserving Federalism, Globalization, and SubnationalEconomic Growth: Evidence from China and India.” In Indian Federalism in theNew Millennium, ed. B. D. Dua and M. P. Singh. New Delhi: Manohar, 351–90.
Sainath, P. 2005. “BHEL: The Turtle and the Hare-brained.” Hindu Online, June 18.
Sen, Abhijit. 1996. “Economic Reforms, Employment and Poverty.” Economic andPolitical Weekly 31, no. 35 (September): 2,459–77.
Sen, Abhijit, and Himanshu. 2004a. “Poverty and Inequality in India, Part I.” Economicand Political Weekly 39, no. 38 (September 18): 4,247–63.
———. 2004b. “Poverty and Inequality in India, Part II: Widening Disparities Duringthe 1990s.” Economic and Political Weekly 39, no. 39 (September 25): 4,361–75.

Sharma, Ruchir. 2005. “Charting an Independent Course.” Economic Times Online, May 3.
Singh, Kavaljit. 2005. Questioning Globalization. London: Zed Books.
Sklair, Leslie. 2002. Globalization: Capitalism and Its Alternatives. Oxford: OxfordUniversity Press.
Sorensen, Ninna Nyberg. 2004. The Development Dimension of Migrant Remittances.Working Paper Series No. 1. June Geneva: International Organization forMigration. Available online.
Stallings, Barbara, and Wilson Peres. 2000. Growth, Employment, and Equity: The Impactof the Economic Reforms in Latin America and the Caribbean. Washington D.C.:Brookings Institution Press.
Stiles, Kenneth W. 1991. Negotiating Debt: The IMF Lending Process. Boulder, CO:Westview Press.
Sundaram, K., and Suresh D. Tendulkar. 2003a. “Poverty Has Declined in the 1990s: AResolution of Comparability Problems in NSS Consumer Expenditure Data.”Economic and Political Weekly 38, no. 4 (January 4).
———. 2003b. “Poverty in India in the 1990s: An Analysis of Changes in 15 MajorStates.” Economic and Political Weekly 38, no. 14 (April 5): 1,385–93.
———. 2003c. “Poverty in India in the 1990s: Revised Results for All-India and 15Major States for 1993-94.” Economic and Political Weekly 38, no. 46 (November15): 4,865–72.
———. 2003d. “Poverty Among Social and Economic Groups in India in 1990s.”Economic and Political Weekly 38, no. 50 (December 13): 5,263–76.
“Super 100: India’s Best Performing Companies.” Business India. October 11, 2004.Available at www.iocl.com/story_businessindia.asp.
UNCTAD. 2002. World Investment Report 2002. New York and Geneva: United Nations.
———. 2004. World Investment Report 2004. New York and Geneva: United Nations.
United Nations. 2004. World Economic and Social Survey: International Migration. NewYork: Department of Economic and Social Affairs.
United Nations Development Program. 2005. Human Development Report 2005:International Cooperation at a Crossroads: Aid, Trade, and Security in an UnequalWorld. New York: UNDP.
Vanaik, Achin, ed. 2004. Globalization and South Asia: Multidimensional Perspectives.New Delhi: Manohar.
Venkitarmanan, S. 2005a. “A Bully in the China Shop.” Hindu Business Line Online,June 13.
———. 2005b. “Right Emphasis on Growth and Liquidity.” Hindu Business LineOnline, April 29.
Virmani, Arvind. 2004. “India’s Economic Growth: From Socialist Rate of Growth to Bharatiya Rate of Growth.” Working Paper No. 122. February. New Delhi:Indian Council for Research on International Economic Relations. Available online.
Wallack, Jessica Seddon. 2003. “Structural Breaks in Indian Macroeconomic Data.”Economic and Political Weekly 38, no. 41 (October 11): 4,312–15.
96 Baldev Raj Nayar

India’s Globalization 97
Weil, David N. 2005. Economic Growth. Boston: Pearson/Addison Wesley.
Williamson, John, ed. 1990. Latin American Adjustment: How Much Has Happened?Washington, D.C.: Institute for International Economics.
Wolf, Martin. 2004. Why Globalization Works. New Haven, CT: Yale University Press.
World Bank. 2002. Globalization, Growth, and Poverty: Building an Inclusive WorldEconomy. New York: Oxford University Press.
———. 2004. India: Investment Climate Assessment 2004, Improving ManufacturingCompetitiveness. November. Washington, D.C.: Finance and Private SectorDevelopment Unit, South Asia Region, World Bank. Available online.
———. 2005. World Development Report 2006: Equity and Development. Washington,D.C.: World Bank.

98
Pamela AallUnited States Institute of Peace
Patricio Nunes AbinalesKyoto University
Itty AbrahamEast-West Center Washington
Vinod K. AggarwalUniversity of California, Berkeley
Muthiah AlagappaEast-West Center Washington
Marc AskewVictoria University
Edward AspinallAustralian National University
Upendra BaxiUniversity of Warwick
Ikrar Nusa BhaktiIndonesian Institute of Sciences (LIPI), Jakarta
Gardner BovingdonIndiana University, Bloomington
Craig CalhounNew York University
Ralph A. CossaPacific Forum CSIS, Honolulu
HHarold CrouchAustralian National University
June Teufel DreyerUniversity of Miami
Dieter ErnstEast-West Center
David FinkelsteinThe CNA Corporation
Brigham GoldenColumbia University
Avery GoldsteinUniversity of Pennsylvania
NNatasha HamiltonNational University of Singapore
Rana HasanAsian Development Bank
Eric HeginbothamRAND Corporation
Konrad HuberUSAID, D.C.
Yuen Foong KhongNuffield College, Oxford University
Damien KingsburyDeakin University
R. William LiddleThe Ohio State University
Kenneth G. LieberthalUniversity of Michigan
Gurpreet MahajanJawaharlal Nehru University
Eugene MartinUnited States Institute of Peace
Duncan McCargoUniversity of Leeds
Donald McFetridgeFormer Defense Attaché, Jakarta
Thomas McKennaSRI Consulting
Andrew NathanColumbia University
Steven RoodThe Asia Foundation, Philippines
Danilyn RutherfordUniversity of Chicago
Leonard SchoppaUniversity of Virginia, Charlottesville
Kirsten E. SSchulzeLondon School of Economics
Sheldon SimonArizona State University
David TimbermanUSAID, D.C.
Meredith WeissEast-West Center Washington
Wu XinboFudan University
List of Reviewers 2005–06The East-West Center Washington would like to acknowledge the
following, who have offered reviews of manuscripts for Policy Studies.
99
Policy Studies 1 The Aceh Peace Process: Why it FailedEdward Aspinall, University of SydneyHarold Crouch, Australian National University
Policy Studies 2 The Free Aceh Movement (GAM): Anatomy ofa Separatist OrganizationKirsten E. Schulze, London School of Economics
Policy Studies 3 Security Operations in Aceh: Goals,Consequences, and LessonsRizal Sukma, Centre for Strategic and International
Studies, Jakarta
Policy Studies 4 Beijing’s Tibet Policy: Securing Sovereignty andLegitimacyAllen Carlson, Cornell University
Policy Studies 5 The Papua Conflict: Jakarta’s Perceptions andPoliciesRichard Chauvel, Victoria University, MelbourneIkrar Nusa Bhakti, Indonesian Institute of Sciences,
Jakarta
Policy Studies 6 Violent Separatism in Xinjiang: A CriticalAssessmentJames Millward, Georgetown University
Policy Studies 7 The Tibet-China Conflict: History and PolemicsElliot Sperling, Indiana University, Bloomington
Policy Studies 8 The Moro Conflict: Landlessness andMisdirected State PoliciesEric Gutierrez, WaterAid, U.K.Saturnino Borras, Jr., Institute of Social Studies,
The Hague
Policy Studies 9 The HDC in Aceh: Promises and Pitfalls ofNGO Mediation and ImplementationKonrad Huber, Council on Foreign Relations
Policy Studies 10 Secessionist Challenges in Aceh and Papua: IsSpecial Autonomy the Solution?Rodd McGibbon, USAID, Jakarta
Policy Studies 11 Autonomy in Xinjiang: Han NationalistImperatives and Uyghur DiscontentGardner Bovingdon, Indiana University, Bloomington
Policy Studies 12Sino-Tibetan Dialogue in the Post-Mao Era:Lessons and ProspectsTashi Rabgey, Harvard UniversityTseten Wangchuk Sharlho, Independent Journalist
Policy Studies 13Plural Society in Peril: Migration, EconomicChange, and the Papua ConflictRodd McGibbon, USAID, Jakarta
Policy Studies 14Constructing Papuan Nationalism: History,Ethnicity, and AdaptationRichard Chauvel, Victoria University, Melbourne
Policy Studies 15The Xinjiang Conflict: Uyghur Identity,Language Policy, and Political DiscourseArienne M. Dwyer, The University of Kansas
Policy Studies 16Meeting the China Challenge: The U.S. inSoutheast Asian Regional Security StrategiesEvelyn Goh, Institute of Defence and Strategic Studies,
Singapore
Policy StudiesPrevious Publications
These issues of Policy Studies are presently available in print and PDF. Hardcopies are available through Amazon.com. In Asia, hardcopies are available through theInstitute of Southeast Asian Studies, Singapore at 30 Heng Mui Keng Terrrace, Pasir PanjangSingapore – 119614. Website: http://bookshop.iseas.edu.sg/
Online at: www.eastwestcenterwashington.org/publications
(continued next page)

Policy Studies 17Forging Sustainable Peace in Mindanao: TheRole of Civil SocietySteven Rood, The Asia Foundation, Philippines
Policy Studies 18Islamic Radicalism and Anti-Americanism inIndonesia: The Role of the InternetMerlyna Lim, Bandung Institute of Technology,
Indonesia
Policy Studies 19Nine Lives?: The Politics of ConstitutionalReform in JapanJ. Patrick Boyd, Massachusetts Institute of TechnologyRichard J. Samuels, Massachusetts Institute of
Technology
Policy Studies 20The Helsinki Agreement: A More PromisingBasis for Peace in Aceh?Edward Aspinall, Australian National University
Policy Studies 21China’s Rise: Implications for U.S. Leadershipin AsiaRobert G. Sutter, Georgetown University
These issues of Policy Studies are presently available in print and PDF. Hardcopies are available through Amazon.com. In Asia, hardcopies are available through theInstitute of Southeast Asian Studies, Singapore at 30 Heng Mui Keng Terrrace, Pasir PanjangSingapore – 119614. Website: http://bookshop.iseas.edu.sg/
Online at: www.eastwestcenterwashington.org/publications
Policy StudiesPrevious Publications continued
100

Policy StudiesA publication of the East-West Center Washington
Editor: Dr. Muthiah Alagappa
Publications Associate: Jeremy Sutherland
DescriptionPolicy Studies presents scholarly analysis of key contemporary domestic and internationalpolitical, economic, and strategic issues affecting Asia in a policy relevant manner.Written for the policy community, academics, journalists, and the informed public, thepeer-reviewed publications in this series provide new policy insights and perspectivesbased on extensive fieldwork and rigorous scholarship.
Each publication in the series presents an 18,000- to 24,000-word investigation of a sin-gle topic. Often publications in this series will appear in conjunction with East-WestCenter research projects and fellowships; stand-alone investigations of pertinent issueswill also appear in the series. Submissions should address a contemporary, broadly policyrelevant issue, puzzle, or problem and provide a new insight or argument.
Submissions Submissions may take the form of a proposal or completed manuscript.
Proposal. A five-page proposal indicating the issue, problem, or puzzle to be analyzed, itspolicy significance, the novel perspective to be provided, and date by which the manu-script will be ready. The series editor and two relevant experts will review proposals todetermine their suitability for the series. The manuscript when completed will be peerreviewed in line with the double-blind process.
Complete Manuscript. Submission of a complete manuscript should be accompanied by atwo- to three-page abstract that sets out the issue, problem, or puzzle analyzed, its policysignificance, and the novel perspective to be provided by the paper. The series editor andtwo relevant experts will review the abstract. If considered suitable for the series, the man-uscript will be peer reviewed in line with the double-blind process.
Submissions must be original and not published elsewhere. The East-West Center willhave copyright over all material published in the series. A CV indicating relevant quali-fications and publications should accompany submissions.
Notes to Contributors The manuscript should be formatted per the guidelines laid out in the Policy Studiesstylesheet, which can be made available upon request. Manuscripts should be typed, dou-ble-spaced, with notes double-spaced at the end. Citations should be embedded in textwith minimum endnotes and a complete bibliography. Use of double quotes, and singlespacing after punctuation is desirable. All artwork should be camera ready. Authorsshould refrain from identifying themselves in their proposals and manuscripts.Submissions should be sent to:
Editor, Policy StudiesEast-West Center Washington
1819 L St., NW, Suite 200Washington, D.C. 20036
Tel: 202-293-3995Fax: 202-293-1402
Submissions can also be forwarded by e-mail to [email protected]
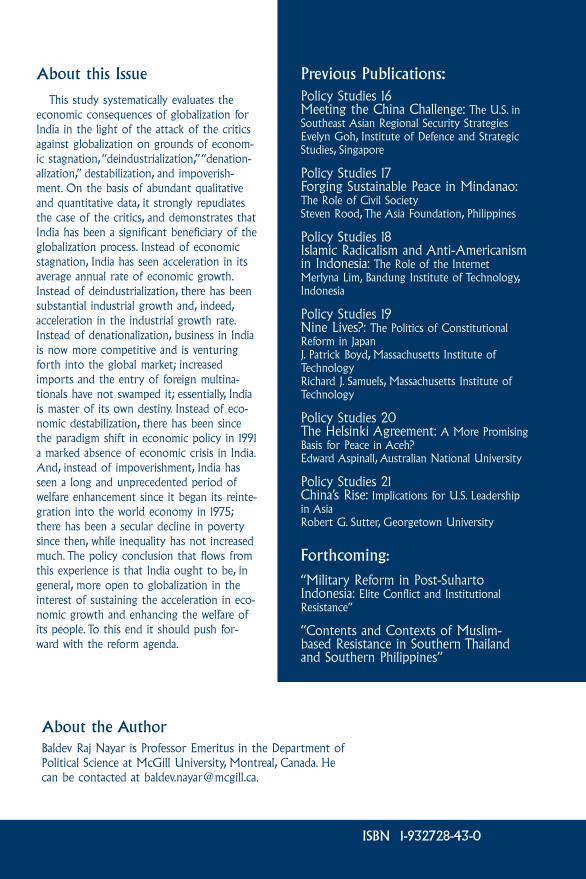
Previous Publications:Policy Studies 16Meeting the China Challenge: The U.S. inSoutheast Asian Regional Security StrategiesEvelyn Goh, Institute of Defence and StrategicStudies, Singapore
Policy Studies 17Forging Sustainable Peace in Mindanao:The Role of Civil SocietySteven Rood, The Asia Foundation, Philippines
Policy Studies 18Islamic Radicalism and Anti-Americanismin Indonesia: The Role of the InternetMerlyna Lim, Bandung Institute of Technology,Indonesia
Policy Studies 19Nine Lives?: The Politics of ConstitutionalReform in JapanJ. Patrick Boyd, Massachusetts Institute ofTechnologyRichard J. Samuels, Massachusetts Institute ofTechnology
Policy Studies 20The Helsinki Agreement: A More PromisingBasis for Peace in Aceh?Edward Aspinall, Australian National University
Policy Studies 21China’s Rise: Implications for U.S. Leadershipin AsiaRobert G. Sutter, Georgetown University
Forthcoming:
“Military Reform in Post-SuhartoIndonesia: Elite Conflict and InstitutionalResistance”
“Contents and Contexts of Muslim-based Resistance in Southern Thailandand Southern Philippines”
About this Issue
This study systematically evaluates theeconomic consequences of globalization forIndia in the light of the attack of the criticsagainst globalization on grounds of econom-ic stagnation, “deindustrialization,” “denation-alization,” destabilization, and impoverish-ment. On the basis of abundant qualitativeand quantitative data, it strongly repudiatesthe case of the critics, and demonstrates thatIndia has been a significant beneficiary of theglobalization process. Instead of economicstagnation, India has seen acceleration in itsaverage annual rate of economic growth.Instead of deindustrialization, there has beensubstantial industrial growth and, indeed,acceleration in the industrial growth rate.Instead of denationalization, business in Indiais now more competitive and is venturingforth into the global market; increasedimports and the entry of foreign multina-tionals have not swamped it; essentially, Indiais master of its own destiny. Instead of eco-nomic destabilization, there has been sincethe paradigm shift in economic policy in 1991a marked absence of economic crisis in India.And, instead of impoverishment, India hasseen a long and unprecedented period ofwelfare enhancement since it began its reinte-gration into the world economy in 1975;there has been a secular decline in povertysince then, while inequality has not increasedmuch. The policy conclusion that flows fromthis experience is that India ought to be, ingeneral, more open to globalization in theinterest of sustaining the acceleration in eco-nomic growth and enhancing the welfare ofits people. To this end it should push for-ward with the reform agenda.
About the AuthorBaldev Raj Nayar is Professor Emeritus in the Department ofPolitical Science at McGill University, Montreal, Canada. Hecan be contacted at [email protected].
ISBN 1-932728-43-0