Indiana Public Health System Review - IUPUI
96
Indiana Public Health System Review December 2020 IU RICHARD M. FAIRBANKS SCHOOL OF PUBLIC HEALTH
Transcript of Indiana Public Health System Review - IUPUI

Indiana Public Health System Review
December 2020
I U R I C H A R D M . F A I R B A N K S S C H O O L O F P U B L I C H E A LT H

2 IU Richard M. Fairbanks School of Public Health
Project LeadsPaul K. Halverson, DrPH, FACHE, MSHA, is the Founding Dean and Professor of the IU Richard M. Fairbanks School Public
Health. He holds additional appointments at the IU School of Medicine and the Regenstrief Institute. Halverson previously
served as the State Health Officer in Arkansas and as a Division Director at the US Centers for Disease Control and Prevention.
Valerie A. Yeager, DrPH, MPhil, is an Associate Professor in the Department of Health Management and Policy. Previously,
Yeager was a Lister Hill Policy Fellow in the Division of Global Migration and Quarantine at the Centers for Disease Control
and Prevention. Her research focuses on public health systems and services across local, state, and federal levels.
External Consultants and ReviewersGlen P. Mays, PhD, MPH, Professor and Chair, Department of Health Systems, Management and Policy, Colorado School
of Public Health, Anschutz Medical Campus; Former Coordinating Center Director, Public Health Systems and Services
Research, Robert Wood Johnson Foundation.
Hugh Tilson, MD, DrPH, Senior Advisor to the Dean of the Richard M. Fairbanks School of Public Health; Adjunct Professor,
UNC Gillings School of Global Public Health, Co-Chair of the Institute of Medicine’s 1988 Future of Public Health Report;
former North Carolina State Health Officer and former Local Public Health Director in Oregon and Maine.
With contributions fromAmber Blackmon, MPH
Amanda Briggs, MS
Jyotsna Gutta, MPH
Harold Kooreman, MA, MSW
Nir Menachemi, PhD, MPH
Nadia Unruh Needleman, MS
Joshua R. Vest, PhD, MPH
The authors wish to express sincere gratitude to all participants who shared their experiences and insights via participation in
a qualitative interview.
This report is made possible by funding from the Richard M. Fairbanks Foundation.
C R E D I T S

3 IU Richard M. Fairbanks School of Public Health
T A B L E O F C O N T E N T S
Executive Summary . . . . . . . . . . . . . . . . . . . . . . . . . . . . . . . . . . . . . . . . . . . . . . . . . . . . . . . . 4
Section 1: Introduction to Public Health Systems . . . . . . . . . . . . . . . . . . . . . . . . . . . . . . 8
Section 2: The Public Health System in Indiana
and Comparison States . . . . . . . . . . . . . . . . . . . . . . . . . . . . . . . . . . . . . . . . . . . . . . . . . . . . 14
Section 3: Evidence Synthesis . . . . . . . . . . . . . . . . . . . . . . . . . . . . . . . . . . . . . . . . . . . . . . 36
Section 4: Qualitative Insights from Key Stakeholders in Indiana . . . . . . . . . . . . . . . . 55
Section 5: Recommendations for Public Health System Change . . . . . . . . . . . . . . . . . 64
Section 6: Conclusions . . . . . . . . . . . . . . . . . . . . . . . . . . . . . . . . . . . . . . . . . . . . . . . . . . . . . 71
References . . . . . . . . . . . . . . . . . . . . . . . . . . . . . . . . . . . . . . . . . . . . . . . . . . . . . . . . . . . . . . . 74
Appendices . . . . . . . . . . . . . . . . . . . . . . . . . . . . . . . . . . . . . . . . . . . . . . . . . . . . . . . . . . . . . . . 82

4 IU Richard M. Fairbanks School of Public Health
E X E C U T I V E S U M M A R Y
Regardless of where you live, all people in Indiana deserve a strong public health system, one that protects and improves the health of your community and is based on science and data. However, today, the extent and quality of public health services that are available in your community is entirely dependent on what county you live in. Because most individuals are often not aware of what “good public health” looks like, or when they might need it, they generally do not choose to live in a county based on the public health services available. Fortunately, the work of defining what “good public health” looks like and how to measure it is well established and guidance from that work can be used to inform improvements to Indiana’s public health system. This study examines the current state of Indiana’s public health system.1-5 In particular, this report focuses on the centerpiece of the public health system - the network of local and state governmental public health agencies - their structure, human and financial resources, authorities, and activities.
EXECUTIVE SUMMARYPublic health is “the science and art of preventing disease, prolonging life and promoting health through the organized efforts and informed choices of society, organizations, public and private communities, and individuals”.6 In the period of the 20th century, the US has gained an additional 30 years in life expectancy, and 25 of those 30 years are attributed to public health efforts. As a field, public health includes expertise in biostatistics and informatics, epidemiology, health policy and management, social and behavioral health, and environmental health. In practice, this expertise includes activities that influence the social and physical environments in which we live, policies and interventions that influence behaviors, and assuring access to essential and high quality health care. More specifically, public health activities include a wide range of activities such as identifying and tracking food-borne pathogens, intervening in an outbreak, educating communities, inspecting restaurants, training restaurant workers in
Build and maintain astrong organizationalinfrastructure for public health
Improve and innovatethrough evaluation, research, and qualityimprovement
Build a diverse andskilled workforce
Enable equitable access
Utilize legaland regulatoryactions
Create, champion,and implement policies,plans, and laws
Strengthen, support, andmobilize communitiesand partnerships
Investigate, diagnose, and
address health hazards androot causes
Assess and monitorpopulationhealth
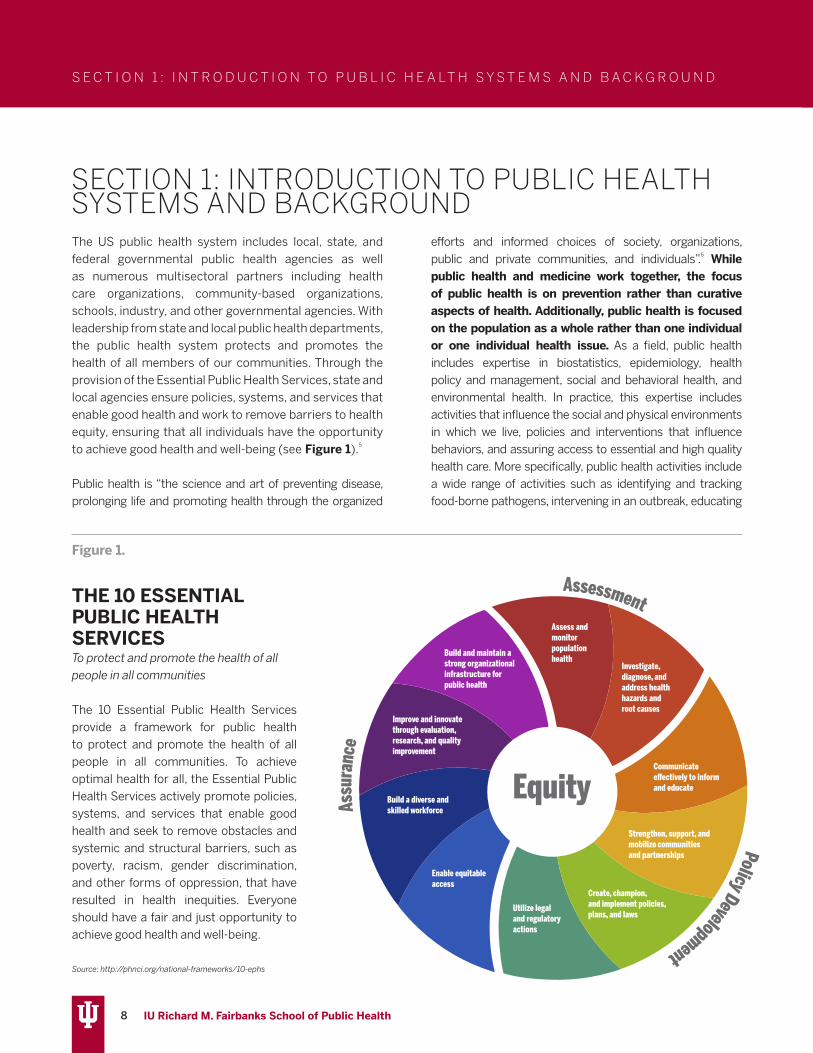
THE 10 ESSENTIAL PUBLIC HEALTH SERVICESTo protect and promote the health of all people in all communities
The 10 Essential Public Health Services provide a framework for public health to protect and promote the health of all people in all communities. To achieve optimal health for all, the Essential Public Health Services actively promote policies, systems, and services that enable good health and seek to remove obstacles and systemic and structural barriers, such as poverty, racism, gender discrimination, and other forms of oppression, that have resulted in health inequities. Everyone should have a fair and just opportunity to achieve good health and well-being.
Source: http://phnci.org/national-frameworks/10-ephs
5 IU Richard M. Fairbanks School of Public Health
E X E C U T I V E S U M M A R Y
food-borne illness prevention, and developing policies to make food processing safer. It also includes assuring that children are immunized, tracing infectious diseases and contacting individuals who may have been exposed, and leading communities in public health emergencies and disasters such as an event that compromises our water systems, or in outbreaks such as the COVID-19 pandemic.
Clarifying what public health is and what services it should provide is an essential goal of this report. In fact, one of the most important findings of this study is that many key state stakeholders are unable to differentiate between public health and healthcare. While both work to improve the health of Hoosiers, public health is focused on preventing illness and protecting the population from injury, communicable diseases, and premature death whereas, the vast majority of the time, healthcare primarily serves to treat disease and injury and is focused on making people well again. Unfortunately, when we are unable to differentiate between these two roles, making a case for investing more in the public health system is challenging, especially given the existing high costs of health care in our state.
Evidence shows that when communities invest more in public health, they actually spend less on health care and live longer. However, findings presented in this report show that Indiana communities are less likely to be implementing nationally recommended public health activities compared to other states. Further, Indiana’s communities receive less public health funding compared to neighboring states, companion states, or exemplar states. Funding for local public health departments
(LHDs), where many of the essential, community-facing public health activities are conducted, is typically shared across federal, state, and local sources with the average US LHD receiving a quarter of its funding from local funds. However, Indiana’s LHDs rely on local sources for the majority of their budgets, unlike most other US communities that rely equally on state and federal (passthrough) funding in addition to local funding.
This ensures that less resourced communities that likely have a greater need for the protection and preventive services public health provides also have less funding and less capacity to ensure that they receive them. Although there is value in having direct local connections in every county, the current structure ensures that many of the 94 LHDs are able to provide only a fraction of the necessary public health services and expertise that should be available to all communities. Epidemiologic expertise, data analytics to inform education and services relevant to the needs of communities, emergency preparedness capabilities, and an information technology infrastructure that allows for an efficient and effective system are skills and tools that are not present in many of Indiana’s local settings. This missing expertise and resources translates to paper-based reporting systems and delays in routine outbreak identification for diseases like syphilis and HIV – triggers that should alert officials about acute crises earlier rather than later. It also means that public health is often not factored into local policymaking or community decisions. While it may be difficult to imagine, during the early response to the COVID-19 pandemic, there were LHDs in Indiana that literally closed their doors and were not participating in the response or available to their communities. It cannot be more obvious that the public health system is not functioning as a system when LHDs are not seamlessly plugged into a statewide response to a pandemic.
These issues are not for lack of dedication of the public health workers at the local or the state levels. These are issues of a system that has been chronically underfunded and undervalued. In fact, one thing that is consistent is that public health investments in Indiana are routinely below US averages and frequently among the lowest across neighboring, companion, and exemplar states. America’s Health Rankings rank Indiana 48th for public health funding. Funding at the local level is particularly low compared to
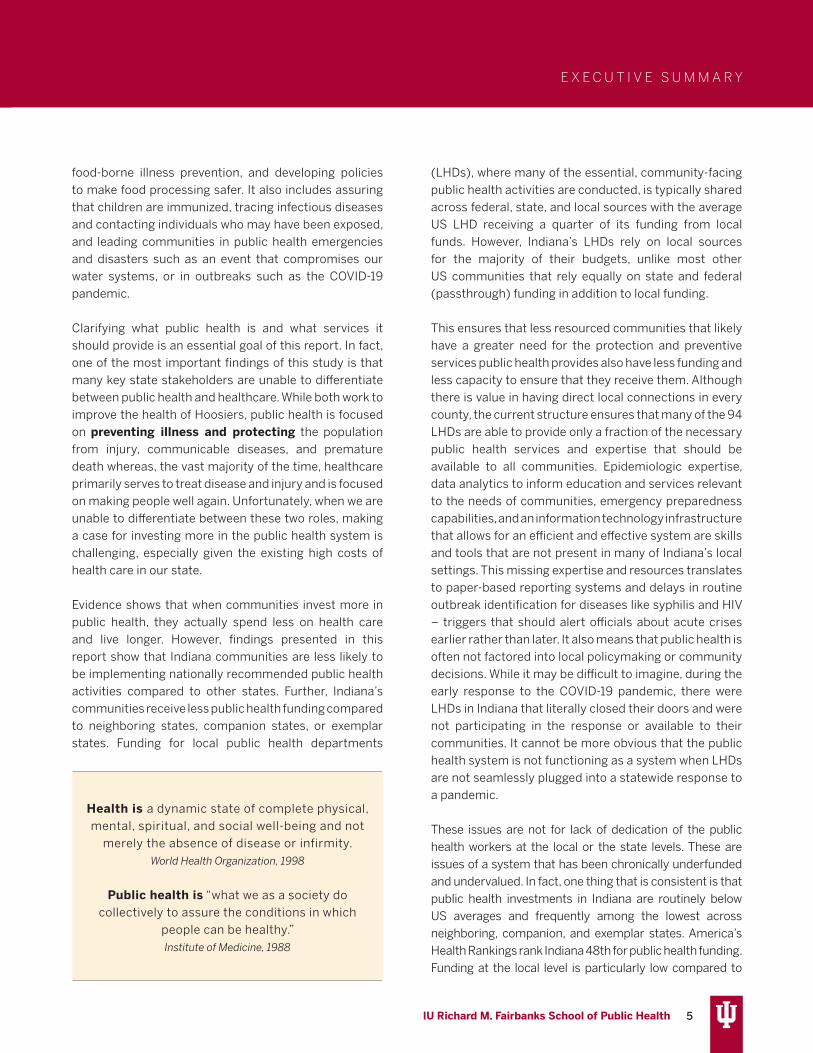
Health is a dynamic state of complete physical, mental, spiritual, and social well-being and not
merely the absence of disease or infirmity. World Health Organization, 1998
Public health is “what we as a society do collectively to assure the conditions in which
people can be healthy.”Institute of Medicine, 1988

6 IU Richard M. Fairbanks School of Public Health
other states. The national median funding among LHDs is $41 per capita and the 25th percentile is $23 per capita, but the majority of LHDs in Indiana have per capita budgets far below these levels. In fact, at least 37 of the 94 LHDs in Indiana have per capita budgets of less than $10 per capita.
Understanding how Indiana’s public health system is structured and financed is important in the context of benchmarking health outcomes across states. For example, Indiana ranks 41st among all states on public health and is at least 10% below the US average rate for preventable mortality such as infant deaths, accident deaths, and alcohol, drug, and suicide deaths. In terms of prevention, Indiana has particularly low rates of vaccinations for influenza, childhood vaccines, and adult and elderly vaccines, and the state scores in the bottom tier nationally with respect to public health preparedness. Indiana also has one of the highest rates of adult smokers in the nation (21.8% compared to the national average of 17.1%), contributing to higher rates of preventable chronic diseases and cancers.
Based on feedback from stakeholders, Indiana’s communities are ready for change and willing to work together to make improvements to the public health system. A total of 49 stakeholders participated in an
interview for this report and contributed feedback and/or ideas for improvements to the public health system in Indiana. The review of the scientific evidence for public health systems change presented in Section 3 and the insights provided by Indiana stakeholders in Section 4 informed the recommendations in this report.
In general, the recommendations are focused on achieving better health for Hoosiers through a more robust public health system and one that ensures that the Foundational Public Health Services are provided to all communities. A stronger, appropriately-funded public health system means better capacity at the local and state levels and improved effectiveness of public health efforts. These improvements will allow Indiana’s public health agencies to work with public health partners and to have a bigger collective impact and begin to address the upstream social determinants of health. Indiana’s public health system needs substantial funding increases at both the state and local levels. Four overarching recommendations are presented in Section 5. These include:
1. Create a uniform approach to deliver the Foundational Public Health Services (FPHS) across the state
E X E C U T I V E S U M M A R Y
7 IU Richard M. Fairbanks School of Public Health
2. Create a district-level mechanism to enable resource sharing among LHDs
3. Strengthen the State Health Department’s oversight and enabling capacity to support the local public health delivery system
4. Under the auspices of the state board of health, create a multi-disciplinary state-wide implementation committee tasked with executing the recommended implementation steps outlined in Section 5
In addition to the 4 recommendations, 15 implementation steps necessary to improve the capacity and effectiveness of Indiana’s public health system are provided. In brief, these steps include the establishment of district level capacity that will provide resource-sharing of expertise and services in support of existing LHDs. District offices should be led by a full-time District Health Officer with formal public health training. The District Health Officer should be supported by a district leadership network comprised of health officials/administrators from each LHD within the district. Such a structure will provide district-level strategies that are both resourced and informed by expertise, local-level data, and local perspectives. Existing LHDs and district offices will work together to provide a core package of public health services that is aligned with the Foundational Public Health Services for local public health and supports the state public health system in assuring the 10 essential services across Indiana.
Specific state-level improvements recommended in this report include: structures to ensure expertise and essential skills across the state and local workforce; information systems that employ a common data platform and ensure real-time reporting at all levels of the public health system; state-wide standards that assure continuous quality and performance improvement; and improved collaboration between the state and local levels and with partners external to public so that the state can work more effectively to improve the health of Hoosiers.
The implementation of the recommendations in this report will need a clear path to implementation with funding but with incremental rollout and should be informed by an empowered state-wide committee made up of state and local public health representatives as well
as state, county, and city leaders, health care leaders, and other key stakeholders. While priority should be given to the establishment of the district health offices and the provision of core public health services, each of the implementation steps will need to be strategically phased into the plan to improve Indiana’s public health system.
Lastly, although all of the costs needed to make improvements to the public health system are not estimated in this report, estimates for the priority actions (district health offices supported by a state-level expertise and the provision of core public health services) have been provided along with potential funding mechanisms for consideration. Of particular importance is the potential of an increase in tax on the sale of tobacco products, the most effective mechanism to reduce tobacco use. Revenue from an increased tobacco tax should be dedicated to the public health system and should fund the establishment of an Indiana Public Health Trust Fund. The Trust Fund would allow for the new revenue to generate interest and to support the phased implementation of public health improvements. The Trust Fund should be explicitly limited to ensuring the provision of Foundational Public Health Services and related infrastructure for the public health system. As a matter of priority, an initial $50 million should be dedicated in year one of this work with increases annually over 5 years so that the system has consistent, annual funding of at least $338 million from the Public Health Trust Fund. This consistent funding will allow public health agencies to plan strategically for a future where Indiana is among the top states in health outcomes rather than the bottom. There is a bi-directional connection between health and wealth, not just for individuals but for their communities and their economies.
As the report indicates, substantial changes are needed to improve the Indiana public health system, and it is clear that stakeholders are ready and willing to get started. Specific thanks and appreciation are due to the hundreds of public health workers at the state and local levels that toil every day on behalf of the people of the state and who do so without the resources they need to do the best job they can. This report was written to support their work and give them the tools they need to improve the public health system for Hoosiers. COVID-19 sounded the alarm and the status quo is no longer sufficient.
E X E C U T I V E S U M M A R Y
8 IU Richard M. Fairbanks School of Public Health
S E C T I O N 1 : I N T R O D U C T I O N T O P U B L I C H E A LT H S Y S T E M S A N D B A C K G R O U N D
The US public health system includes local, state, and federal governmental public health agencies as well as numerous multisectoral partners including health care organizations, community-based organizations, schools, industry, and other governmental agencies. With leadership from state and local public health departments, the public health system protects and promotes the health of all members of our communities. Through the provision of the Essential Public Health Services, state and local agencies ensure policies, systems, and services that enable good health and work to remove barriers to health equity, ensuring that all individuals have the opportunity to achieve good health and well-being (see Figure 1).5
Public health is “the science and art of preventing disease, prolonging life and promoting health through the organized
efforts and informed choices of society, organizations, public and private communities, and individuals”.6 While public health and medicine work together, the focus of public health is on prevention rather than curative aspects of health. Additionally, public health is focused on the population as a whole rather than one individual or one individual health issue. As a field, public health includes expertise in biostatistics, epidemiology, health policy and management, social and behavioral health, and environmental health. In practice, this expertise includes activities that influence the social and physical environments in which we live, policies and interventions that influence behaviors, and assuring access to essential and high quality health care. More specifically, public health activities include a wide range of activities such as identifying and tracking food-borne pathogens, intervening in an outbreak, educating
SECTION 1: INTRODUCTION TO PUBLIC HEALTH SYSTEMS AND BACKGROUND
Build and maintain astrong organizationalinfrastructure for public health
Improve and innovatethrough evaluation, research, and qualityimprovement
Build a diverse andskilled workforce
Enable equitable access
Utilize legaland regulatoryactions
Create, champion,and implement policies,plans, and laws
Strengthen, support, andmobilize communitiesand partnerships
Investigate, diagnose, and
address health hazards androot causes
Assess and monitorpopulationhealth
THE 10 ESSENTIAL PUBLIC HEALTH SERVICESTo protect and promote the health of all people in all communities
The 10 Essential Public Health Services provide a framework for public health to protect and promote the health of all people in all communities. To achieve optimal health for all, the Essential Public Health Services actively promote policies, systems, and services that enable good health and seek to remove obstacles and systemic and structural barriers, such as poverty, racism, gender discrimination, and other forms of oppression, that have resulted in health inequities. Everyone should have a fair and just opportunity to achieve good health and well-being.
Source: http://phnci.org/national-frameworks/10-ephs
Figure 1.

9 IU Richard M. Fairbanks School of Public Health
S E C T I O N 1 : I N T R O D U C T I O N T O P U B L I C H E A LT H S Y S T E M S A N D B A C K G R O U N D
communities, inspecting restaurants, training restaurant workers in food-borne illness prevention, and developing policies to make food processing safer. It also includes assuring that children are immunized, tracing infectious diseases and contacting individuals who may have been exposed, and leading communities in public health emergencies and disasters such as an event that compromises our water systems or in outbreaks such as the COVID-19 pandemic.
In the period of the 20th century, the US has gained an additional 30 years in life expectancy. Twenty-five of those 30 years are attributed to public health efforts, including the 10 great public health achievements (see Figure 2).7,8 These achievements include the provision of immunizations, family planning, and support for healthy mothers and babies. Deaths from heart disease and stroke
were prevented by public health activities and policies that decreased tobacco use, improved what people eat, and reduced children’s exposure to lead. Tooth decay, the most common disease of childhood, declined with the equitable provision of fluoridation in community drinking water systems. Prior to the introduction of workplace safety policies, injuries were one of the most common reasons for preventable deaths in the early 20th century. Each of these public health achievements has played a role in improving the health of the population.
In general, at the federal level, governmental public health is responsible for the documentation of the health status of our population including providing data systems and analysis. Federal level public health also sponsors relevant research, programs, and activities and formulates national objectives and policy related to public health. Such policies may include setting standards for performance and protection of the public’s health. Agencies at the federal level include the Health Resources and Services Administration (HRSA) and the Centers for Disease Control and Prevention (CDC).
At the state level, public health agencies exist within super agencies or as free-standing agencies like the Indiana Department of Health (IDOH). State public health agencies are responsible for collecting and analyzing state health statistics and reporting these to the federal public health agencies. They maintain state laboratories,
Figure 2.
10 GREAT PUBLIC HEALTH ACHIEVEMENTS
Control of Infectious Diseases
FamilyPlanning
Healthier Mothersand Babies
Motor VehicleSafety
Tobacco as aHealth Hazard
Declines in deaths from heart disease and stroke
Fluoridation ofDrinking Water
Immunizations Safer andHealthier Foods
WorkplaceSafety
Health is a dynamic state of complete physical, mental, spiritual, and social well-being and not
merely the absence of disease or infirmity. World Health Organization, 1998
Public health is “what we as a society do collectively to assure the conditions in which
people can be healthy.”Institute of Medicine, 1988

10 IU Richard M. Fairbanks School of Public Health
S E C T I O N 1 : I N T R O D U C T I O N T O P U B L I C H E A LT H S Y S T E M S A N D B A C K G R O U N D
establish and police public health standards for the state, grant licensure to health care professionals and institutions, lead public health education efforts in the state, and establish policies on how local public health units function and their responsibilities, and determine funding for local health agencies by disseminating federal public health resources. State public health agencies also work with state leaders to declare a state of emergency, activate state response plans, and request federal assistance during emergencies.
Local public health departments (LHDs) and their workforces are the frontlines of public health efforts and they operate under the authority of the state. They are responsible for conducting environmental inspections related to water, sanitation, restaurant safety, and daycares. LHDs provide communicable disease control, childhood immunizations, health screenings, and in some locations, direct clinical care including sexually transmitted
disease clinics. They also maintain vital records such as birth and death records for their communities. LHDs have substantial variation in human and financial resources as well as community needs and public health priorities. State and local public health structure, function, funding, and workforce requirements vary across the nation and Section 2 of this report characterizes Indiana’s public health system as it relates to those of other states.
An important component of understanding the role of public health in state and local communities is understanding what makes us healthy. While access to health care is a crucial part of health, it actually makes up the smallest proportion of what makes us healthy (about 10%) (see Figure 3). Instead, the vast majority of what determines our health is the environment we live in (20%) and our behaviors (50%). Public Health efforts specifically focus on both of these determinants of health, yet the majority of the dollars spent toward health are
Figure 3.
Source: https://bipartisanpolicy.org/report/what-makes-us-healthy-vs-what-we-
spend-on-being-healthy/
While access to health care is a crucial part of health, it actually makes up the smallest proportion of what makes us healthy (about 10%) (see Figure 3). Instead, the vast majority of what determines our health is the environment we live in (20%) and our behaviors (50%). Public Health efforts specifically focus on both of these determinants of health, yet the majority of the dollars spent toward health are spent on medical services. Not only are these resources directed at the determinant which has the smallest impact on overall health, the resources are often spent when an individual is already sick. If those health dollars are instead invested earlier, in the form of public health protections and prevention of illness, they would extend further.
11 IU Richard M. Fairbanks School of Public Health
S E C T I O N 1 : I N T R O D U C T I O N T O P U B L I C H E A LT H S Y S T E M S A N D B A C K G R O U N D
spent on medical services. Not only are these resources directed at the determinant which has the smallest impact on overall health, the resources are often spent when an individual is already sick. If those health dollars are instead invested earlier, in the form of public health protections and prevention of illness, they would extend further. For example, annual governmental public health spending is approximately 3% of the national health expenditures despite that more than 75% of the overall health care costs are attributable to preventable health conditions.9
Until recently, much of the discourse about improving health in the US overlooked the role of public health. The COVID-19 pandemic has reminded everyone of the important role public health systems have in protecting and ensuring the public’s health. Unfortunately, this reminder simultaneously highlighted the limitations of the existing system including the limited funding for public health.
The US public health system was established in alignment
with the perspective of federalism whereby each state determines the structure, governance, and activities of their governmental public health system. In 1988, the Institute of Medicine (now the National Academy of Medicine) reported that the public health system was in a state of disarray and that there was a lack of consistency in what activities and assurances public health was providing populations across states.10 Over the three decades since the pivotal 1988 Future of Public Health Report, several attempts have been made to establish national and state-based standards for public health agencies; however, because state public health has so much flexibility, there remains a lot of variation. First, the Essential Services were outlined as a guiding framework by the 1988 IOM Committee, establishing assessment, policy development, and assurance as the three core functions of public health. Within these three functions, ten essential services were outlined.
In 2003 the IOM again convened a committee to review the
Figure 4.

12 IU Richard M. Fairbanks School of Public Health
S E C T I O N 1 : I N T R O D U C T I O N T O P U B L I C H E A LT H S Y S T E M S A N D B A C K G R O U N D
state of public health in the US and issued a report entitled: “The Future of the Public’s Health in the 21st Century,” which recommended the development of national public health accreditation.11 Building a program for public health accreditation took the better part of a decade, but national voluntary accreditation for public health agencies launched in the fall of 2011 with the first health departments receiving accreditation in 2013. Public Health accreditation provides a standard framework for health departments to prioritize services, initiatives, and efforts to best promote and protect the health of their jurisdictions (see Appendix A for a summary of the national accreditation standards and measures).3 Uptake has been progressing, but adoption of accreditation varies across the nation. As of September 2020, the Public Health Accreditation Board (PHAB) reported that 82% of the US population is covered by an accredited health department. This includes a total of 36 state, 263 local, 4 Tribal, 1 statewide integrated local public health department system, and 2 Army Installation Departments of Public Health.12
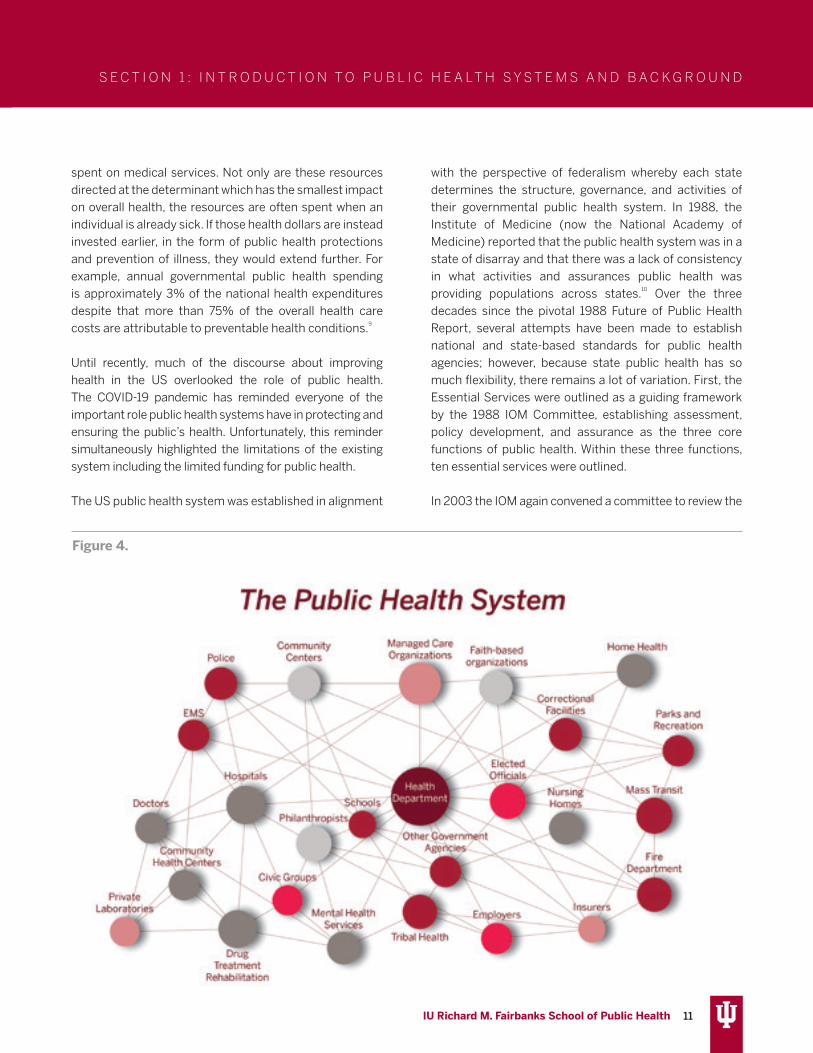
The Public Health 3.0 framework is another national effort to guide and inform the work of governmental public health agencies. It outlines a strategy for public health agencies to serve as the chief health strategist in their communities and to play a key role in leading public health system partners in addressing social determinants of health.13 Figure 4 is a diagram of a functioning public health system. Public health agencies connect and lead other community partners in the effort to promote and protect public health and specifically address social determinants of health.
The Foundational Public Health Services (FPHS) is a recently developed framework for guiding public health practitioners and ensuring sufficient infrastructure for effective public health systems.14 It outlines foundational capabilities and public health programs that should be provided to communities. The FPHS framework is particularly useful in guiding local public health agencies and is used for assessing the capacity of the public health system (see Figure 5).
A particular initiative focused on implementing the FPHS is called the 21st Century Learning Community, a program funded by the Robert Wood Johnson Foundation and supported by the Public Health National Center for
Innovation.15 More specifically, the purpose is to support states in the process of rethinking and strategically transforming their public health systems. The first three states to participate included Ohio, Oregon, and Washington. Case summaries that explain the efforts in each of these three states are included in Section 4 of this report. A total of 10 states are now working toward modernization of their public health systems as a part of the 21st Century Learning Community.
PurposeThe response to the COVID-19 pandemic has highlighted the crucial role the public health system plays in protecting populations and ensuring the health of our communities. It has also drawn attention to ways that the system is strained and limited. The purpose of this report is to summarize the current state, including the challenges and strengths, of Indiana’s public health system and to make recommendations for improvements to the system. To do so, the current report includes four main components.
• In Section 2, we present a wide range of data to characterize the context of Indiana’s public health system. We compare Indiana to neighboring states, states similar in political culture, policy, and structure (cohort states), as well as states where innovative public health approaches have been employed (exemplar states). We specifically examine funding as well as health outcomes impacted by public health systems such as preventable conditions and deaths. We also summarize the workforce and structure of public health within Indiana.
• For Section 3, we have conducted a rapid assessment of the evidence focused on public health systems strengthening initiatives. These include structural changes to state public health systems, resource sharing within state public health systems, and strategies such as accreditation of public health agencies and partnering with organizations outside of governmental public health. We also examine the role of public health funding as it relates to health and the effectiveness of public health systems.
• In Section 4, a list of stakeholders who have contributed their experiences and insights is provided. A summary of key insights, challenges, and ideas for resolving these challenges is provided along with quotes that provide context for the main themes identified.
• In Section 5, in the context of the insights provided by

13 IU Richard M. Fairbanks School of Public Health
S E C T I O N 1 : I N T R O D U C T I O N T O P U B L I C H E A LT H S Y S T E M S A N D B A C K G R O U N D
the review and stakeholders, we prioritize 4 overarching recommendations for making improvements to Indiana’s public health system. Consideration was given to feasibility and acceptability of these recommendations given insights from key stakeholders within the public health system. It should be noted that while 15 specific implementation steps are provided, these changes will require stakeholder input and need to be approached incrementally. Some of the recommendations will be easier than others to implement and some will take time. In sum, the recommendations offer a path toward an effective public health system for the improved health of Hoosiers.
LimitationsOur process and methodology have several limitations to note. First, this study was conducted during the ongoing COVID-19 pandemic, which may have influenced the perspectives of stakeholders who contributed insights through their participation in a qualitative interview. However, the COVID-19 epidemic provided an important opportunity to highlight the challenges of Indiana’s public health system under extreme pressure. Second, we
recognize that there may be additional variables that could provide insight about Indiana’s public health system or any of the comparison states’ systems. Further examination of any of the specific areas of focus may provide additional and valuable insight moving forward. We presented the most up-to-date data whenever possible; however, in some cases the most recent data may be several years old. With respect to the rapid synthesis of the evidence, while we have followed standard search protocols, we acknowledge that there may be additional studies or grey literature that could have been missed. We believe we have identified the most relevant studies and cases in the evidence synthesis. In regard to the recommendations, while these are framed with the findings of the current review in mind, we recognize that there will be implementation details and decisions that are beyond the scope of the recommendations made in this report. We welcome the establishment of a state strategic planning committee of key public health stakeholders focused on implementing change and improving Indiana’s public health system.
Figure 5.

14 IU Richard M. Fairbanks School of Public Health
S E C T I O N 2 : T H E P U B L I C H E A LT H S Y S T E M I N I N D I A N A A N D C O M PA R I S O N S TAT E S
This chapter examines characteristics of Indiana’s public health system, structure, governance, and activities, its workforce, its financing, and related health outcomes. Further, to position where Indiana is in relation to other states, we examined three collective groups (see Figure 6): neighboring states that experience similar regional
SECTION 2: THE PUBLIC HEALTH SYSTEM IN INDIANA AND COMPARISON STATES
and cultural norms; companion states that were selected based on similarities in political leadership and historic voting patterns or being home rule states; and exemplar states that have implemented innovative public health system changes in recent years. A list of states included in each of these groupings is summarized below.
NEIGHBORING STATES COMPANION STATES EXEMPLAR STATES
Illinois Alabama Washington
Kentucky Arizona Minnesota
Ohio Arkansas North Carolina
Michigan Georgia Oregon
Missouri
Nebraska
South Carolina
Tenessee
Figure 6.

15 IU Richard M. Fairbanks School of Public Health
Figure 7.
Public Health System Structure, Governance, and Activities
State Public Health in IndianaIndiana’s public health system consists of the state health department (the Indiana Department of Health/IDOH) and 94 local health departments (LHDs).
The Indiana Department of Health (IDOH) is an executive branch agency of state government. IDOH has four major operating units called “commissions.” These include:
S E C T I O N 2 : T H E P U B L I C H E A LT H S Y S T E M I N I N D I A N A A N D C O M PA R I S O N S TAT E S
Consumer Services & Health Care Regulation Commission; Health and Human Services Commission; Laboratory Services Commission, and the Public Health Protection Commission. The Department is led by the State Health Commissioner, Kristina Box, MD, FACOG, who was appointed in 2016 by Governor Eric Holcomb in his first term. Figure 7 shows the current organizational chart of the IDOH.
The budget for the State Health Department is contained within the Health and Human Services function of the state government, which is the second largest expenditure
16 IU Richard M. Fairbanks School of Public Health
function (24% in 2020) after education (62%).
Within the Health and Human Services function, the Medicaid budget is the largest share of the 2020 budget at 63.6%, whereas IDOH is the 10th largest budget line at $29.6 million. The responsibilities and general roles of the SHD and LHDs are presented in Figure 8.
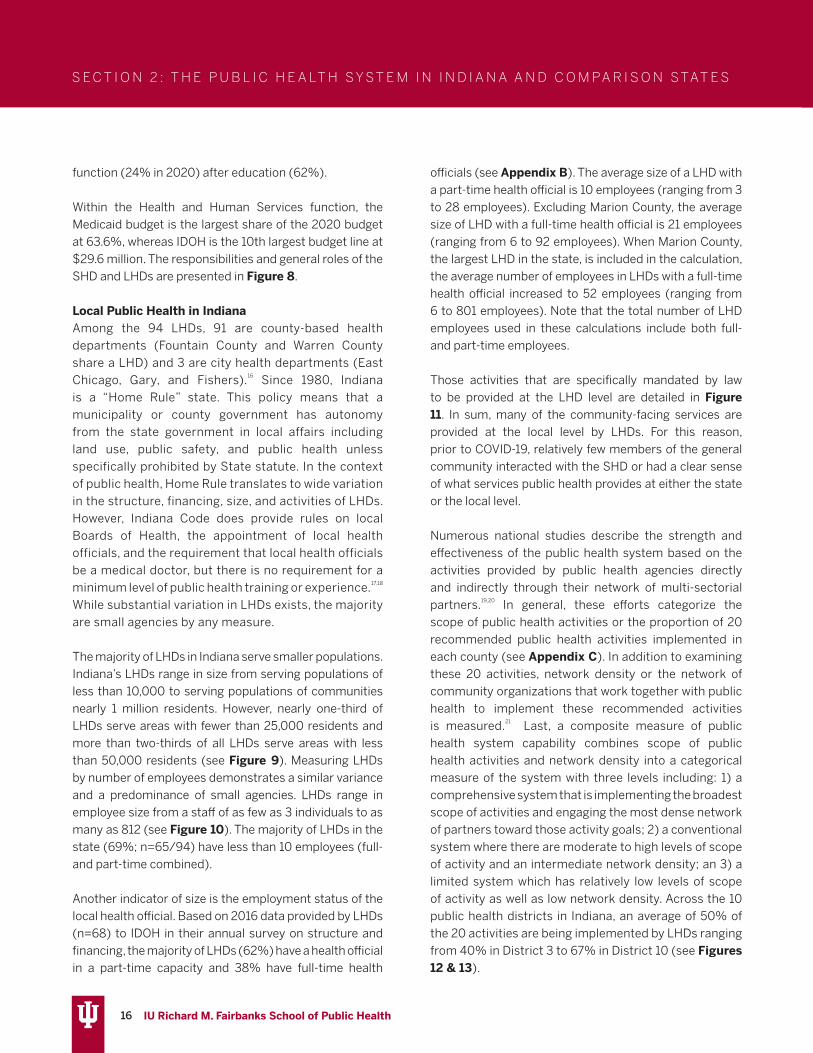
Local Public Health in IndianaAmong the 94 LHDs, 91 are county-based health departments (Fountain County and Warren County share a LHD) and 3 are city health departments (East Chicago, Gary, and Fishers).16 Since 1980, Indiana is a “Home Rule” state. This policy means that a municipality or county government has autonomy from the state government in local affairs including land use, public safety, and public health unless specifically prohibited by State statute. In the context of public health, Home Rule translates to wide variation in the structure, financing, size, and activities of LHDs. However, Indiana Code does provide rules on local Boards of Health, the appointment of local health officials, and the requirement that local health officials be a medical doctor, but there is no requirement for a minimum level of public health training or experience.17,18 While substantial variation in LHDs exists, the majority are small agencies by any measure.
The majority of LHDs in Indiana serve smaller populations. Indiana’s LHDs range in size from serving populations of less than 10,000 to serving populations of communities nearly 1 million residents. However, nearly one-third of LHDs serve areas with fewer than 25,000 residents and more than two-thirds of all LHDs serve areas with less than 50,000 residents (see Figure 9). Measuring LHDs by number of employees demonstrates a similar variance and a predominance of small agencies. LHDs range in employee size from a staff of as few as 3 individuals to as many as 812 (see Figure 10). The majority of LHDs in the state (69%; n=65/94) have less than 10 employees (full- and part-time combined).
Another indicator of size is the employment status of the local health official. Based on 2016 data provided by LHDs (n=68) to IDOH in their annual survey on structure and financing, the majority of LHDs (62%) have a health official in a part-time capacity and 38% have full-time health
officials (see Appendix B). The average size of a LHD with a part-time health official is 10 employees (ranging from 3 to 28 employees). Excluding Marion County, the average size of LHD with a full-time health official is 21 employees (ranging from 6 to 92 employees). When Marion County, the largest LHD in the state, is included in the calculation, the average number of employees in LHDs with a full-time health official increased to 52 employees (ranging from 6 to 801 employees). Note that the total number of LHD employees used in these calculations include both full- and part-time employees.
Those activities that are specifically mandated by law to be provided at the LHD level are detailed in Figure 11. In sum, many of the community-facing services are provided at the local level by LHDs. For this reason, prior to COVID-19, relatively few members of the general community interacted with the SHD or had a clear sense of what services public health provides at either the state or the local level.
Numerous national studies describe the strength and effectiveness of the public health system based on the activities provided by public health agencies directly and indirectly through their network of multi-sectorial partners.19,20 In general, these efforts categorize the scope of public health activities or the proportion of 20 recommended public health activities implemented in each county (see Appendix C). In addition to examining these 20 activities, network density or the network of community organizations that work together with public health to implement these recommended activities is measured.21 Last, a composite measure of public health system capability combines scope of public health activities and network density into a categorical measure of the system with three levels including: 1) a comprehensive system that is implementing the broadest scope of activities and engaging the most dense network of partners toward those activity goals; 2) a conventional system where there are moderate to high levels of scope of activity and an intermediate network density; an 3) a limited system which has relatively low levels of scope of activity as well as low network density. Across the 10 public health districts in Indiana, an average of 50% of the 20 activities are being implemented by LHDs ranging from 40% in District 3 to 67% in District 10 (see Figures 12 & 13).
S E C T I O N 2 : T H E P U B L I C H E A LT H S Y S T E M I N I N D I A N A A N D C O M PA R I S O N S TAT E S

17 IU Richard M. Fairbanks School of Public Health
Figure 8. State/Local Responsibilities
S E C T I O N 2 : T H E P U B L I C H E A LT H S Y S T E M I N I N D I A N A A N D C O M PA R I S O N S TAT E S

18 IU Richard M. Fairbanks School of Public Health
Figure 10. Average Number of Full and Part Time Employees by Size of Jurisdiction Served
160
140
200
180
120
100
80
60
40
20
0
Full-time employees Part-time employees
Very Small(<25K)
Small(25K to 50K)
Medium(50K to 100K)
Large(100K to 250K)
Very Large(>250K)
3.2 2.4 6.2 2.614.9
6.0
29.9
6.8
194.8
17.0
S E C T I O N 2 : T H E P U B L I C H E A LT H S Y S T E M I N I N D I A N A A N D C O M PA R I S O N S TAT E S
Figure 9. Number of LHDs per Size of Population Served
30
35
12 12
5
40
35
30
25
20
15
10
5
0Very Small
(<25K)Small
(25K to 50K)Medium
(50K to 100K)Large
(100K to 250K)Very Large(>250K)

19 IU Richard M. Fairbanks School of Public Health
Provide vital records services and access to public records, birth and death servicese.g., Birth/Death records, name changes, etc.
Associated Legislation: IC 5-14-3; IC 16-20-1-17; IC 16-21-11-6; IC 16-34-3-4; IC 16-35-7; IC 16-37; IC 16-37-1-9; IC 16-38-2-7; IC 16-38-4; IC 16-38-6-7; IC 16-41-6-9; IC 23-14-31; IC 23-14-57; IC 31-19-5; IC 31-19-13; IC 34-28-2; IC 36-2-14; IC 10-13-5-11; 410 IAC 18
Ensure safe and sanitary food and lodgingse.g., food inspections, regulations of food/drugs/cosmetics, certifications for food handlers, and establishment of sanitary requirements for establishments which provide food and/or lodging
Associated Legislation: IC 16-18-2-137; IC 16-20-8; IC 16-41-31; IC 16-42; IC 16-42-5; 410 IAC 7-15.5; 410 IAC 7-22; 410 IAC 7-23; 410 IAC 7-24; IC 16-41-30
Ensure a healthy, clean environment by monitoring and regulating waste and sewage disposal e.g., set standards for residential sewage disposal and commercial wastewater disposal)
Associated Legislation: 410 IAC 6-8.3; 410 IAC 6-10.1; 410 IAC 6-12; IC 16-41-25; IC 13-26-5-2.5
Perform disease control measures and infectious disease surveillance e.g., reporting communicable diseases, ensuring confidentiality of individuals is not compromised in reporting, implementing public health measures to control communicable diseases and epidemics, providing vaccination for indigent individuals
Associated Legislation: IC 16-20-1-21; IC 16-20-1-24; IC 16-41; 410 IAC 1-2.2-5; 410 IAC 1-2.3; 410 IAC 1-2.5-48; 410 IAC 29; IC 16-41-19; 410 IAC 6-9-5(b); IC 16-20-1-25; IC 16-41-8
Control pests and vectors e.g., provisions for eradication of rats
Associated Legislation: IC 16-41-33; IC 16-41-34
Minimize childhood lead poisoning through reporting, monitoring, management of cases, and implementing preventive measures
Associated Legislation: 410 IAC 29; IC 16-41-39.4
Provide immunization services e.g., all child immunizations and basic adult immunizations (including influenza), provide vaccinations/antitoxins to persons unable to purchase (for diphtheria, scarlet fever, tetanus, and rabies)
Associated Legislation: IC 16-41-19-2
Inspect and license railroad camp carsAssociated Legislation: IC 8-9-10; 410 IAC 6-14
Ensure that dwellings are safe for human habitation Associated Legislation: IC 16-41-20
Authorize mass gatherings through licensingAssociated Legislation: IC 16-41-22-12; IC 16-41-22
Establish child fatality review teams Associated Legislation: IC 16-49-2 & 3
Assume jurisdiction over temporary campgrounds (campgrounds operated not more than 10 consecutive days per event, and not more than 30 days per calendar year)
Associated Legislation: 410 IAC 6-7.1-16 and 7.1-33
Reporting of spills and overflows from underground sewage tanks Associated Legislation: IC 13-23-16
Inspection and cleanup of property/vehicles contaminated by methamphetamine productionAssociated Legislation: 318 IAC 1; IC 24-5-13, sections 4.1, 16.1, 16.2, and 24
Notify the public (at least 48 hours beforehand) of board and agency meetingsAssociated Legislation: IC 5-14-1.5
Assume responsibility for health-related areas during emergencies/disastersAssociated Legislation: IC 10-14-3
Ensure public and semi-public pool/spa compliance with established standardsAssociated Legislation: 15 U.S.C. 8001-8008
Figure 11. Indiana Mandated Local Health Department Activities
S E C T I O N 2 : T H E P U B L I C H E A LT H S Y S T E M I N I N D I A N A A N D C O M PA R I S O N S TAT E S

20 IU Richard M. Fairbanks School of Public Health
S E C T I O N 2 : T H E P U B L I C H E A LT H S Y S T E M I N I N D I A N A A N D C O M PA R I S O N S TAT E S
Figure 12. Map of Average Proportion of Activities Completed by LHDs at District Level (weighted by population)
The shade of red color reflects the average proportion of activities in a district. Lighter colors indicate a higher proportion of activities among LHDs in that district, whereas a darker red indicates a lower proportion.

21 IU Richard M. Fairbanks School of Public Health
S E C T I O N 2 : T H E P U B L I C H E A LT H S Y S T E M I N I N D I A N A A N D C O M PA R I S O N S TAT E S
There is some variation in public health system capabilities across the 10 districts in Indiana (see Figure 14). However, at least half of the LHDs in every district have ‘limited’ capabilities and the majority of LHDs in 6 of the 10 districts have ‘limited’ capabilities. Nine of the 10 districts do have LHDs with a small proportion of comprehensive capabilities. Note that in 4 of the 10 districts there were no LHDs with comprehensive capabilities.
Size of jurisdiction has implications for public health system capabilities (see Figure 15). In particular, when LHDs are grouped by size of jurisdiction served, 3 of the 5 groups of LHDs contained some agencies that had comprehensive capabilities. These included the small, medium, and large LHDs, but not very small or very large LHDs. Among those groups, the highest proportion of LHDs that had comprehensive capabilities was 30%. The majority of all but the large LHDs had limited capabilities, which speaks to the overall limited capabilities of the public health system in the state. Note that none of the very large
or very small LHDs had comprehensive capabilities.
The Public Health WorkforceCurrently, a total of 814 employees plus another 336 contractors work for the IDOH. The 2014 and 2017 Public Health Workforce Interests and Needs Survey,22 a national survey of governmental public health workers, examined topics such as demographics and education, job satisfaction, intentions to leave the workforce, as well as skill gaps and training needs. In general, Indiana’s state public health workforce is similar to the national public health workforce in age (average age in Indiana is 46.1 years compared to 47.5 nationally) and gender (74% female in Indiana compared to 77% nationally).
A higher proportion of Indiana’s state workforce has shorter tenure (new recruits with 0-5 years of experience) compared to the national averages (61% versus 43% respectively in 2017). In fact, Indiana’s state public health
Figure 13. Average Proportion of Recommended Activities Completed by LHDs at District Level (weighted by population)
80%
70%
100%
90%
60%
50%
40%
30%
20%
10%
0%1 2 3
Public Health Preparedness District Number
4 5 6 7 8 9 10

22 IU Richard M. Fairbanks School of Public Health
S E C T I O N 2 : T H E P U B L I C H E A LT H S Y S T E M I N I N D I A N A A N D C O M PA R I S O N S TAT E S
Figure 15. Count of Local Health Departments by Public Health Capability by Size of Population Served
80%
70%
100%
90%
60%
50%
40%
30%
20%
10%
0%
Comprehensive
Perc
enta
ge of
healt
h dep
artm
ents
Conventional Limited
Very Small(<25K)
Small(25K to 50K)
Medium(50K to 100K)
Large(100K to 250K)
Very Large(>250K)
Figure 14. Count of Local Health Departments by Public Health Capability by District
80%
70%
100%
90%
60%
50%
40%
30%
20%
10%
0%1 2 3
Public Health Preparedness Districts
Comprehensive
4 5 6 7 8 9 10
Perc
enta
ge of
healt
h dep
artm
ents
Conventional Limited
23 IU Richard M. Fairbanks School of Public Health
S E C T I O N 2 : T H E P U B L I C H E A LT H S Y S T E M I N I N D I A N A A N D C O M PA R I S O N S TAT E S
workforce with 0 to 5 years of experience grew from 50% in 2014 to 61% in 2017, indicating that public health agencies are recruiting new individuals to their agencies. Compared to national responses in 2017, Indiana’s public health workforce has slightly higher levels of education with 42% having Bachelors degrees and 29% having Masters degrees, compared to an average of 35% and 26% nationally. These statistics may be tied to the increases in new staff and the introduction of two schools and multiple programs of public health to Indiana’s higher education environment in the last decade.
Indiana’s public health state workforce reported higher levels of satisfaction with their jobs and their organizations in 2017 compared to 2014. In particular, among Indiana’s 2017 PH WINS respondents, 86% reported being somewhat or very satisfied with their jobs; however, 29% reported planning to leave governmental public health in 2018. Additionally, only 3% of these individuals plan to do so as a result of retirement. The top 5 reasons for planned voluntary turnover among respondents include pay (58%), lack of opportunities for advancement (42%), other opportunities outside the agency (24%), weakening of benefits (23%), and other reason (23%).
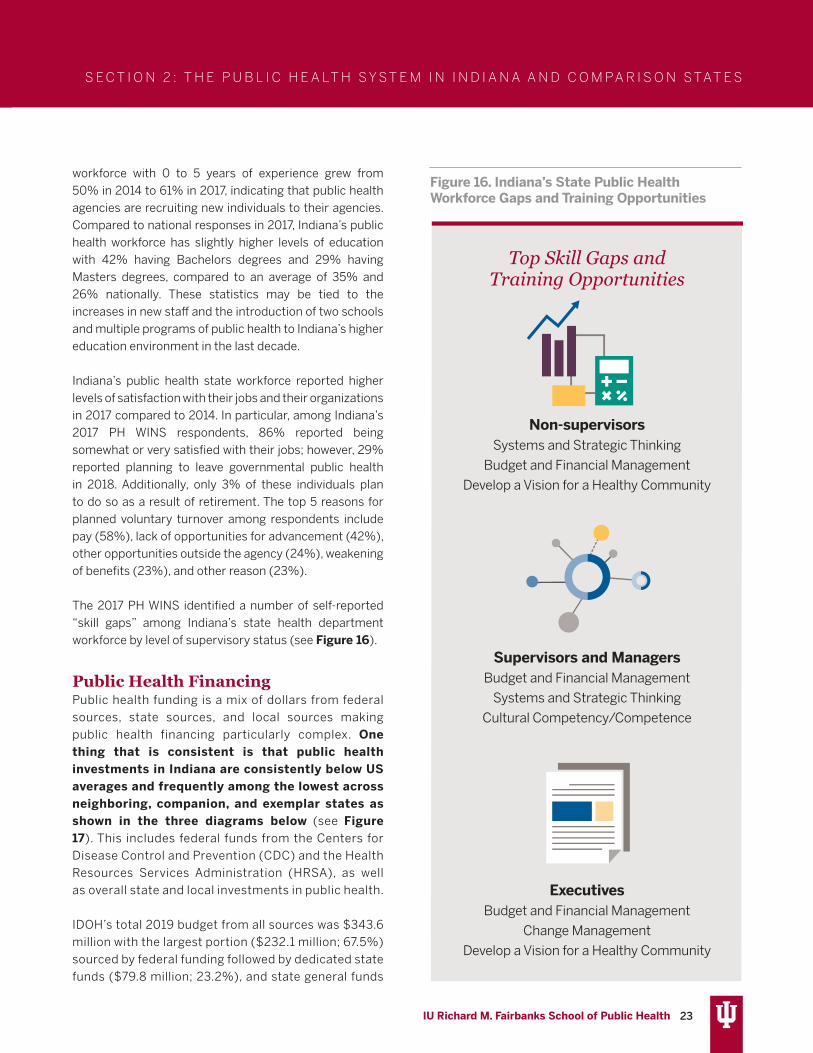
The 2017 PH WINS identified a number of self-reported “skill gaps” among Indiana’s state health department workforce by level of supervisory status (see Figure 16).
Public Health FinancingPublic health funding is a mix of dollars from federal sources, state sources, and local sources making public health financing particularly complex. One thing that is consistent is that public health investments in Indiana are consistently below US averages and frequently among the lowest across neighboring, companion, and exemplar states as shown in the three diagrams below (see Figure 17). This includes federal funds from the Centers for Disease Control and Prevention (CDC) and the Health Resources Services Administration (HRSA), as well as overall state and local investments in public health.
IDOH’s total 2019 budget from all sources was $343.6 million with the largest portion ($232.1 million; 67.5%) sourced by federal funding followed by dedicated state funds ($79.8 million; 23.2%), and state general funds
Top Skill Gaps and Training Opportunities
Non-supervisorsSystems and Strategic Thinking
Budget and Financial Management
Develop a Vision for a Healthy Community
Supervisors and ManagersBudget and Financial Management
Systems and Strategic Thinking
Cultural Competency/Competence
ExecutivesBudget and Financial Management
Change Management
Develop a Vision for a Healthy Community
Figure 16. Indiana’s State Public Health Workforce Gaps and Training Opportunities

24 IU Richard M. Fairbanks School of Public Health
Figure 17. Public Health Investment
Public Health Investment Across Neighboring States
Public Health Investment Across Comparison States
Gray bands represent range of comparison states as percent change from the US rate (dotted line). A red dot indicates Indiana is at least 10% worse than the US rate, an orange dot indicates 5% worse, and a green dot indicates 10% better than the rate of the US overall. A grey dot indicates that Indiana is not significantly different from the US rate.
SOURCE• Trust for America’s
Health, Investing in America’s Health, 2016
23
• Trust for America’s Health, A Funding Crisis for Public Health and Safety, 2017
24
• Center for Disease Control and Prevention, Map of Funding – Appropriations/Grants Total Per Capita
25
• Trust for America’s Health, Ready of Not: Protecting the Public’s Health from Diseases, Disasters and Bioterrorism, 2019
26
• Trust for America’s Health, Promoting Health and Cost Control in States, 2019
27
• WalletHub, States that Vaccinate the Most, 2019
28
S E C T I O N 2 : T H E P U B L I C H E A LT H S Y S T E M I N I N D I A N A A N D C O M PA R I S O N S TAT E S

25 IU Richard M. Fairbanks School of Public Health
S E C T I O N 2 : T H E P U B L I C H E A LT H S Y S T E M I N I N D I A N A A N D C O M PA R I S O N S TAT E S
Public Health Investment Across Exemplar States
Gray bands represent range of comparison states as percent change from the US rate (dotted line). A red dot indicates Indiana is at least 10% worse than the US rate, an orange dot indicates 5% worse, and a green dot indicates 10% better than the rate of the US overall. A grey dot indicates that Indiana is not significantly different from the US rate.
($31.8 million; 9.2%). State dedicated funds include those funding sources that are earmarked for specific public health programs such as the Tobacco Master Settlement Agreement, the administration of the Youth Risk Behavior Survey (YRBS), or the Safety Pin (Protecting Indiana’s Newborns) Program targeting infant mortality prevention.
Approximately, 8.4% ($28.9 million) of IDOH’s annual budget is allocated to the 94 local health departments (LHDs) and the services they provide their communities. In other words, including both the state general fund and state dedicated funds, the SHD provides approximately 1.3 cents per capita to the local provision of public health programs and services.
When considering the entire budget of LHDs as a whole (state, federal, and local funds), LHD expenditures per capita vary greatly by state. For example, in 17 states including Indiana, LHD expenditures were less than $30 per capita on average whereas 15 states spend between $30-50 per capita, 4 spend between $50-70 per capita, and another 8 states spend more than $70 per capita.29
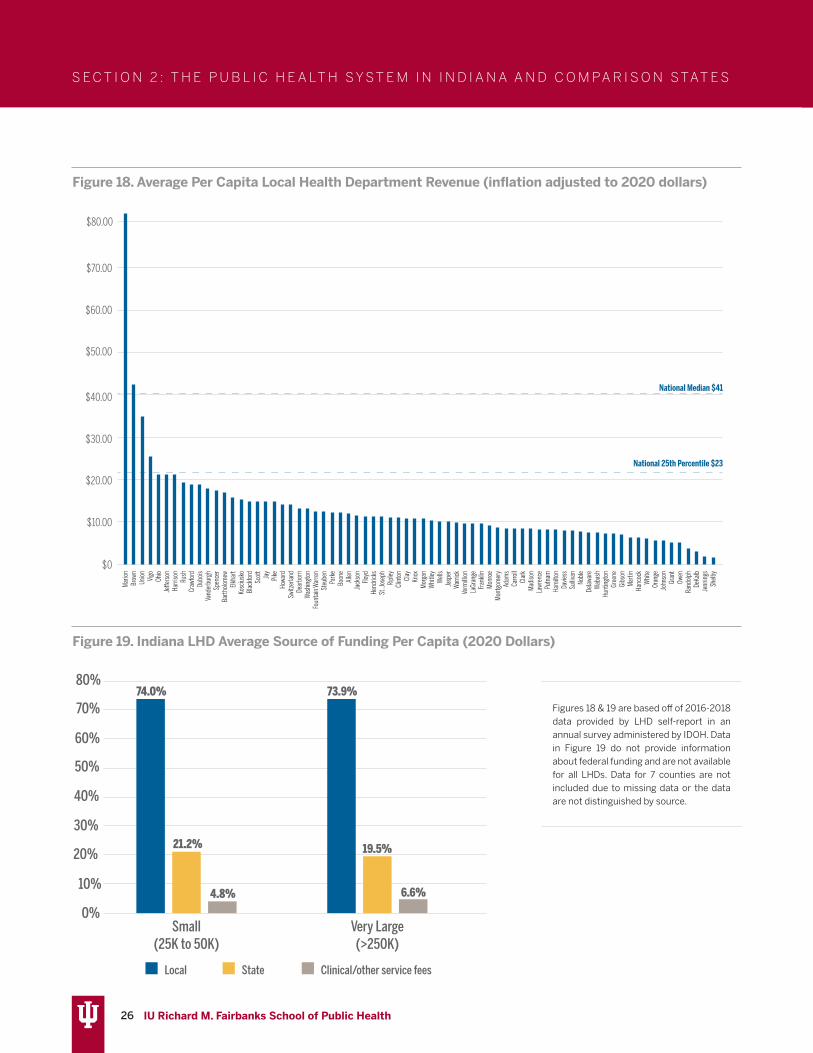
Indiana’s average per capita revenues across LHDs in the state are low compared to national NACCHO reported distributions (see Figures 18 & 20).29 Note that the national median among LHDs is $41 per capita and the 25th percentile is $23. The vast majority of Indiana’s LHD
budgets are far below both of these levels. At least 37 of the 92 counties have a local public health per capita spending of less than $10. Local per capita revenues across 2016 to 2018 range from a low of $1.25 per person in Shelby County to a high of $82.71 per person in Marion County. When these data were examined by location (e.g., rural/urban/mixed) there was no pattern; per capita spending was not associated with location.
The majority of LHD budgets comes from local funding provided by the county general fund or a county tax earmarked for public health (see Figure 19). The second largest portion of LHD budgets is state base funding, which includes the Indiana Local Health Maintenance Fund,30 the Indiana Local Health Department Trust Account (funded by the tobacco master settlement)31, and public health preparedness funds. The third and smallest portion of LHD budgets is made of clinical care revenues generated by charges for clinical health services. and other fees collected for services provided to the public.
26 IU Richard M. Fairbanks School of Public Health
S E C T I O N 2 : T H E P U B L I C H E A LT H S Y S T E M I N I N D I A N A A N D C O M PA R I S O N S TAT E S
Figure 18. Average Per Capita Local Health Department Revenue (inflation adjusted to 2020 dollars)
Figure 19. Indiana LHD Average Source of Funding Per Capita (2020 Dollars)
$40.00
$30.00
$20.00
$70.00
$80.00
$60.00
$50.00
$10.00
$0
Mar
ionBr
own
Union Vigo
Ohio
Je�e
rson
Harri
son
Rush
Craw
ford
Dubo
isVa
nder
burg
hSp
ence
rBa
rtholo
mew
Elkha
rtKo
scius
koBl
ackf
ord
Scot
tJa
yPi
keHo
ward
Switz
erlan
dDe
arbo
rnW
ashi
ngto
nFo
unta
in W
arre
nSt
eube
nPa
rke
Boon
eAl
lenJa
ckso
nFlo
ydHe
ndric
ksSt
. Jos
eph
Ripl
eyCl
into
nCl
ayKn
oxM
orga
nW
hitle
yW
ells
Jasp
erW
arric
kVe
rmilli
onLa
Gran
geFr
ankli
nM
onro
eM
ontg
omer
yAd
ams
Carro
llCl
ark
Mad
ison
Lawr
ence
Putn
amHa
milt
onDa
viess
Sulliv
anNo
ble
Delaw
are
Wab
ash
Hunt
ingt
onGr
eene
Gibs
onM
artin
Hanc
ock
Whi
teOr
ange
John
son
Gran
tOw
enRa
ndolp
hDe
Kalb
Jenn
ings
Shelb
y
National Median $41
National 25th Percentile $23
74.0%
21.2%
4.8%
73.9%
19.5%
6.6%
80%
70%
60%
50%
40%
30%
20%
10%
0%Small
(25K to 50K)Very Large(>250K)
Local State Clinical/other service fees
Figures 18 & 19 are based off of 2016-2018 data provided by LHD self-report in an annual survey administered by IDOH. Data in Figure 19 do not provide information about federal funding and are not available for all LHDs. Data for 7 counties are not included due to missing data or the data are not distinguished by source.

27 IU Richard M. Fairbanks School of Public Health
Figure 20. Map of Average Per Capita Revenue by County
S E C T I O N 2 : T H E P U B L I C H E A LT H S Y S T E M I N I N D I A N A A N D C O M PA R I S O N S TAT E S

28 IU Richard M. Fairbanks School of Public Health
Health OutcomesAcross the 6 health outcomes examined, neighboring states are less healthy overall with the majority of neighboring states below or just at the US overall rate for these health outcomes (see Figure 21). However,
Indiana is at least 10% worse than the US rates on adult smoking, adults with diabetes, and adults with cardiovascular diseases. The percentage of adults with poor mental health is also high; Indiana is at least 5% worse than the US rate. Among companion
S E C T I O N 2 : T H E P U B L I C H E A LT H S Y S T E M I N I N D I A N A A N D C O M PA R I S O N S TAT E S
Figure 21. Health Conditions
Health Conditions Across Neighboring States
Health Conditions across Companion States
Health Conditions across Exemplar States
SOURCE• Center for Disease
Control and Prevention, Behavioral Risk Factor Surveillance System, BRFSS; Kaiser Family Foundation, 2018
32
• Center for Disease Control and Prevention, Behavioral Risk Factor Surveillance System, BRFSS; Kaiser Family Foundation, 2019
33
• March of Dimes Report 2019
34
Gray bands represent range of comparison states as percent change from the US rate (dotted line). A red dot indicates Indiana is at least 10% worse than the US rate, an orange dot indicates 5% worse, and a green dot indicates 10% better than the rate of the US overall.

29 IU Richard M. Fairbanks School of Public Health
states examined, a number of states are at or above the US rate for these 6 health conditions and the range above the US rate is even higher among exemplar states.
Indiana ranks 41st in state public health rankings overall, which means that Indiana is in the bottom 10 states on public health. Among neighboring states, Michigan and Illinois are ranked higher. Among companion states, Arizona and Nebraska are ranked 30th and 15th respectively, and two of the exemplar states have rankings among the top 10 states (Minnesota is the 7th and Washington is the 9th).
Public Health RankingsHistorically, Indiana has ranked in the bottom half of states or among the bottom 10 states for the last 30
years. Figure 22 shows Indiana’s ranking over this period of time.
The consistent underfunding of public health presented above relates to why Indiana ranks 41st among all states on public health and is at least 10% below the US average rate for preventable mortality such as infant deaths, accident deaths, and alcohol, drug, and suicide deaths. Additionally, the state’s high rates of smoking contribute to these health outcomes. Indiana receives approximately $137 million in Master Settlement Agreement funds annually as a portion of the state dedicated funds; however, 21.8% of adult Hoosiers smoke tobacco compared to the national average of 17.1%.35
Figure 22. Indiana Historical Public Health Rankings, 1990-2018
S E C T I O N 2 : T H E P U B L I C H E A LT H S Y S T E M I N I N D I A N A A N D C O M PA R I S O N S TAT E S
1
10
20
30
40
5090 91 92 93 94 95 96 97 98 99 00 01 02 03 04 05 06 07 08 09 10 11 12 13 14 15 16 17 18
41
30

30 IU Richard M. Fairbanks School of Public Health
S E C T I O N 2 : T H E P U B L I C H E A LT H S Y S T E M I N I N D I A N A A N D C O M PA R I S O N S TAT E S
Public Health Rankings across Neighboring States Measure Indiana Illinois Kentucky Michigan Ohio
State Health Rankings (overall) 2018 41 26 45 34 40
Mental Health Ranking 2016 38 7 48 40 35
Infant Mortality Rate 2016 42 31 37 34 43
Mortality Rate 2017 41 23 48 36 42
Obesity Rate 2017 39 23 43 31 40
Smoking Rate 2017 44 15 49 38 43
Suicide Rate 2017 25 7 28 15 18
Public Health Rankings across Companion States
Measure Indiana Alabama Arizona Arkansas Georgia Missouri Nebraska South Carolina Tennessee
State Health Rankings (overall) 2018 41 48 30 46 39 38 15 43 42
Mental Health Ranking 2016 38 47 25 49 31 39 5 43 42
Infant Mortality Rate 2016 42 50 14 48 45 36 26 38 41
Mortality Rate 2017 41 47 10 45 38 39 24 40 44
Obesity Rate 2017 39 46 20 44 26 33 34 41 35
Smoking Rate 2017 44 41 16 46 30 40 14 36 47
Suicide Rate 2017 25 27 33 42 12 32 14 26 29
Public Health Rankings across Exemplar StatesMeasure Indiana Minnesota North Carolina Oregon Washington
State Health Rankings (overall) 2018 41 7 33 21 9
Mental Health Ranking 2016 38 4 29 36 21
Infant Mortality Rate 2016 42 12 40 8 6
Mortality Rate 2017 41 5 37 18 11
Obesity Rate 2017 39 16 30 19 12
Smoking Rate 2017 44 11 27 21 5
Suicide Rate 2017 25 13 16 37 30
SOURCES• United Health Foundation – America’s Health Rankings, 2018
36
Public Health Rankings
The following tables present comparisons between Indiana and neighboring, companion, and exemplar states on public health rankings overall as well as specific indicators of public health such as mental health ranking, infant mortality rate, obesity rate, smoking rate, and suicide rate.
Indiana’s overall public health ranking (41st) is lower than all neighboring states except Kentucky (45th). Across the public health indicators, Indiana is typically ranked lower or worse than Illinois and Michigan and higher or better than Kentucky. Of particular note, however, Indiana has the lowest ranking in the 2017 smoking rate measure across neighboring states, ranking 44th nationwide.
Among companion states, Indiana is neither the best nor the worst. Indiana consistently performs better on public health measures than states such as Alabama and Arkansas; however, Indiana performs worse on most measures compared to Arizona and Nebraska.
As expected, when compared to exemplar states, Indiana is worse on most, if not all, public health measures. Though states that rank highly overall may not be ranked highly in every measure (e.g., Washington is ranked 9th overall, but is 30th in the nation in suicide rates), states that are ranked strongly overall tend to perform well on the other measures.
• US News and World Reports, Public Health Rankings, 201737

31 IU Richard M. Fairbanks School of Public Health
The red indicates at least 10% worse than the US rate, the orange indicates 5% worse, and the green indicates 10% better than the US overall.
Market Characteristics for Neighboring StatesMeasure U .S . Indiana Illinois Kentucky Michigan Ohio
Hospital Characteristics
Percent Non-Profit Hospitals, 2018* 56.40% 55.30% 78.10% 68.60% 78.50% 71.60%
Percent For-Profit Hospitals, 2018* 24.90% 25.80% 9.60% 21.00% 17.40% 19.60%
Percent Public Hospitals, 2018* 18.60% 18.90% 12.30% 10.50% 4.20% 8.80%
Percent of Rural Hospital at Risk of Closure, 2018
21.00% 23 .10% 17.30% 24 .60% 25 .40% 10.80%
Physician Supply
Active Patient Care Physicians per 100K pop., 2019
242.1 212 240.5 214 .6 249.7 248.6
Active Patient Care PCPs per 100K pop., 2019 83.2 74 .4 87.2 72 .9 87.6 83.7
Active Patient Care Gen. Surgeons per 100K pop., 2019
6.6 6 .1 5 .8 7 .6 6.7 7.1
Health Insurance
Avg. Annual Premium- SINGLE coverage, 2018 $6,715 $6,778 $7,123 $6,690 $6,322 $6,804
Employee contribution for SINGLE coverage, 2018
21.30% 21.30% 20.40% 24 .40% 22 .70% 24 .00%
Avg. Annual Premium- FAMILY coverage, 2018 $19,565 $19,551 $20,407 $19,277 $18,242 $19,640
Employee contribution for FAMILY coverage, 2018
27.80% 23 .30% 26.40% 27.90% 23 .50% 25.50%
% of Employees Enrolled in HDHPs, 2018 49.10% 51 .90% 48.10% 53.20% 44 .40% 54 .00%
Percent of Income Devoted to Health Care (before full coverage kicks in) 2017
11.70% 11.50% 9 .50% 12.90% 8 .50% 10.60%
Spending
Per Capita Personal Healthcare Spending, 2014 $8,045 $8,300 $8,262 $8,004 $8,055 $8,712
Per Capita State Government Healthcare Spending, 2015
$1,880 $1,491 $1,482 $2,618 $1,743 $1,820
Market Characteristics
S E C T I O N 2 : T H E P U B L I C H E A LT H S Y S T E M I N I N D I A N A A N D C O M PA R I S O N S TAT E S
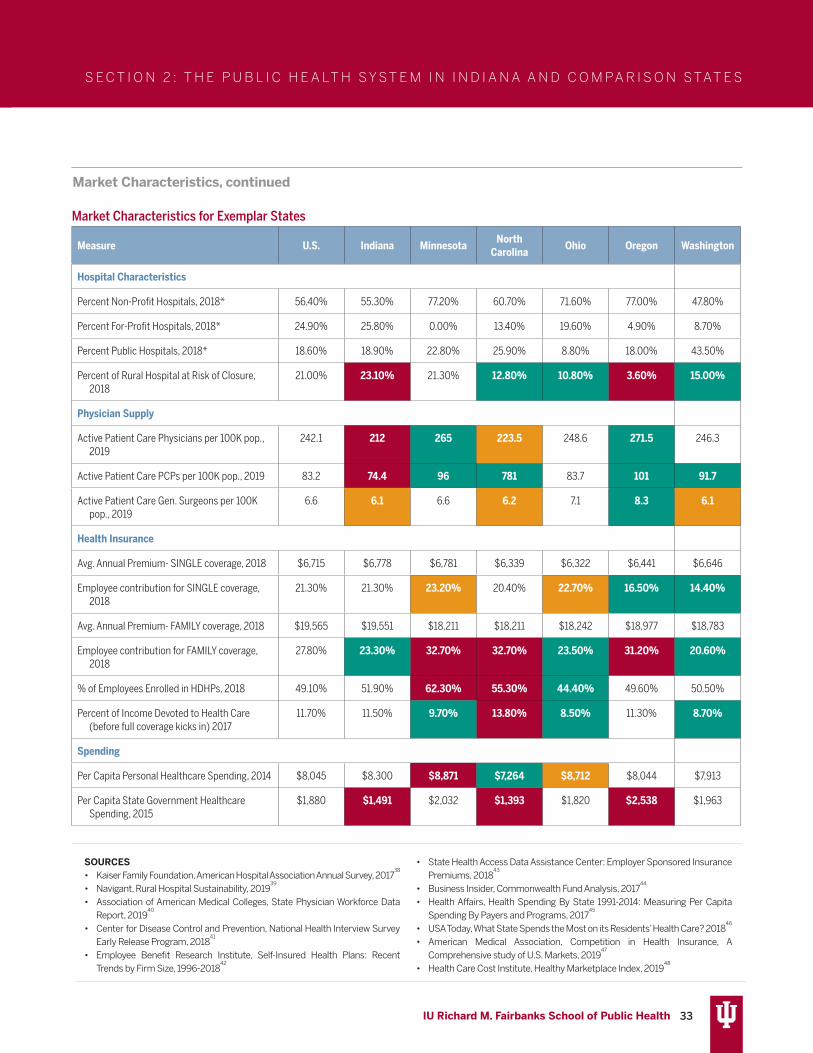
Healthcare market characteristics are presented below and compared across neighboring, comparison, and exemplar states in the following tables. Healthcare market characteristics are of particular importance as these resources provide context for the health-related environment in the state and the stakeholders and partners who may partner with public health agencies in responding to outbreaks, preventing chronic conditions and treating them, as well as addressing social determinants of health.
In terms of market characteristics across neighboring states, Indiana fares at least 10% worse than the US rate on 4 measures that relate to access to health care – percent of rural hospitals at risk of closure, active patient care physicians per 100,000 population, active patient care primary care providers (PCPs) per 100,000 population, and per capita state government healthcare spending. The closure of rural hospitals, has implications for public health’s reach as it would
reduce the availability of important stakeholders and potential partners in addressing health needs in rural communities.
Aside from Georgia, Missouri, and South Carolina, almost all of the companion states have a 10% higher risk of rural hospital closure than average states. Most of the companion states are worse than the average US state on physician supply. However, Missouri, Nebraska, and South Carolina have better health insurance coverage than other states in the group.
As one may expect, Indiana can generally be considered ‘worse’ than the exemplar states. Most of the exemplar states have better health insurance coverage and healthcare access. In general, these characteristics translate to a decreased likelihood that their residents will experience severe financial distress as a result of healthcare needs or have unmet healthcare needs.

32 IU Richard M. Fairbanks School of Public Health
Market Characteristics for Companion States
Measure U .S . Indiana Alabama Arizona Arkansas Georgia Missouri Nebraska South Carolina Tennessee
Hospital Characteristics
Percent Non-Profit Hospitals, 2018* 56.40% 55.30% 29.70% 51.80% 58.00% 55.20% 54.10% 53.80% 43.50% 43.50%
Percent For-Profit Hospitals, 2018* 24.90% 25.80% 33.70% 43.40% 31.80% 18.60% 20.50% 7.50% 36.20% 39.10%
Percent Public Hospitals, 2018* 18.60% 18.90% 36.60% 4.80% 10.20% 26.20% 25.40% 38.70% 20.30% 17.40%
Percent of Rural Hospital at Risk of Closure,
2018
21.00% 23 .10% 50 .00% 25 .00% 36 .70% 41 .30% 23 .00% 11 .40% 26 .70% 18 .90%
Physician Supply
Active Patient Care Physicians per 100K pop.,
2019
242.1 212 196 .7 224 188 .2 202 .9 236.3 214 .5 205 225 .8
Active Patient Care PCPs per 100K pop., 2019 83.2 74 .4 71 .2 73 .2 75 71 .9 79 80.3 72 .3 77 .8
Active Patient Care Gen. Surgeons per 100K
pop., 2019
6.6 6 .1 6.9 6 .1 6.5 6 .1 6 .3 6 .2 6 .2 7 .4
Health Insurance
Avg. Annual Premium- SINGLE coverage, 2018 $6,715 $6,778 $6,089 $6,229 $5,974 $6,799 $6,664 $6,851 $6,708 $5,971
Employee contribution for SINGLE coverage,
2018
21.30% 21.30% 23 .90% 25 .00% 23 .00% 21.70% 21.10% 20.30% 21.30% 23 .60%
Avg. Annual Premium- FAMILY coverage, 2018 $19,565 $19,551 $18,001 $18,875 $17,995 $18,575 $19,249 $19,015 $19,284 $17,663
Employee contribution for FAMILY coverage,
2018
27.80% 23 .30% 29 .30% 30 .70% 31 .80% 31 .50% 26.00% 28.50% 27.50% 31 .20%
% of Employees Enrolled in HDHPs, 2018 49.10% 51.90% 38 .10% 59 .30% 42 .60% 55 .30% 51 .90% 47.40% 49.70% 56 .80%
Percent of Income Devoted to Health Care
(before full coverage kicks in) 2017
11.70% 11.50% 10 .40% 14 .30% 12.80% 13 .80% 11.50% 11.30% 12 .80% 13 .90%
Spending
Per Capita Personal Healthcare Spending, 2014 $8,045 $8,300 $7,281 $6,452 $7,408 $6,587 $8,107 $8,412 $7,311 $7,372
Per Capita State Government Healthcare
Spending, 2015
$1,880 $1,491 $1,679 $1,598 $2,441 $1,242 $1,837 $1,186 $1,879 $1,498
Market Characteristics, continued
S E C T I O N 2 : T H E P U B L I C H E A LT H S Y S T E M I N I N D I A N A A N D C O M PA R I S O N S TAT E S
The red indicates at least 10% worse than the US rate, the orange indicates 5% worse, and the green indicates 10% better than the US overall.
33 IU Richard M. Fairbanks School of Public Health
Market Characteristics, continued
Market Characteristics for Exemplar States
Measure U .S . Indiana Minnesota North Carolina Ohio Oregon Washington
Hospital Characteristics
Percent Non-Profit Hospitals, 2018* 56.40% 55.30% 77.20% 60.70% 71.60% 77.00% 47.80%
Percent For-Profit Hospitals, 2018* 24.90% 25.80% 0.00% 13.40% 19.60% 4.90% 8.70%
Percent Public Hospitals, 2018* 18.60% 18.90% 22.80% 25.90% 8.80% 18.00% 43.50%
Percent of Rural Hospital at Risk of Closure, 2018
21.00% 23 .10% 21.30% 12 .80% 10 .80% 3 .60% 15 .00%
Physician Supply
Active Patient Care Physicians per 100K pop., 2019
242.1 212 265 223 .5 248.6 271 .5 246.3
Active Patient Care PCPs per 100K pop., 2019 83.2 74 .4 96 781 83.7 101 91 .7
Active Patient Care Gen. Surgeons per 100K pop., 2019
6.6 6 .1 6.6 6 .2 7.1 8 .3 6 .1
Health Insurance
Avg. Annual Premium- SINGLE coverage, 2018 $6,715 $6,778 $6,781 $6,339 $6,322 $6,441 $6,646
Employee contribution for SINGLE coverage, 2018
21.30% 21.30% 23 .20% 20.40% 22 .70% 16 .50% 14 .40%
Avg. Annual Premium- FAMILY coverage, 2018 $19,565 $19,551 $18,211 $18,211 $18,242 $18,977 $18,783
Employee contribution for FAMILY coverage, 2018
27.80% 23 .30% 32 .70% 32 .70% 23 .50% 31 .20% 20 .60%
% of Employees Enrolled in HDHPs, 2018 49.10% 51.90% 62 .30% 55 .30% 44 .40% 49.60% 50.50%
Percent of Income Devoted to Health Care (before full coverage kicks in) 2017
11.70% 11.50% 9 .70% 13 .80% 8 .50% 11.30% 8 .70%
Spending
Per Capita Personal Healthcare Spending, 2014 $8,045 $8,300 $8,871 $7,264 $8,712 $8,044 $7,913
Per Capita State Government Healthcare Spending, 2015
$1,880 $1,491 $2,032 $1,393 $1,820 $2,538 $1,963
SOURCES• Kaiser Family Foundation, American Hospital Association Annual Survey, 2017
38
• Navigant, Rural Hospital Sustainability, 201939
• Association of American Medical Colleges, State Physician Workforce Data Report, 2019
40
• Center for Disease Control and Prevention, National Health Interview Survey Early Release Program, 2018
41
• Employee Benefit Research Institute, Self-Insured Health Plans: Recent Trends by Firm Size, 1996-2018
42
• State Health Access Data Assistance Center: Employer Sponsored Insurance Premiums, 2018
43
• Business Insider, Commonwealth Fund Analysis, 201744
• Health Affairs, Health Spending By State 1991-2014: Measuring Per Capita Spending By Payers and Programs, 2017
45
• USA Today, What State Spends the Most on its Residents’ Health Care? 201846
• American Medical Association, Competition in Health Insurance, A Comprehensive study of U.S. Markets, 2019
47
• Health Care Cost Institute, Healthy Marketplace Index, 201948
S E C T I O N 2 : T H E P U B L I C H E A LT H S Y S T E M I N I N D I A N A A N D C O M PA R I S O N S TAT E S

34 IU Richard M. Fairbanks School of Public Health
S E C T I O N 2 : T H E P U B L I C H E A LT H S Y S T E M I N I N D I A N A A N D C O M PA R I S O N S TAT E S
Public Health Organizational Characteristics
Public Health Organizational Characteristics
Public Health Organizational Characteristics for Neighboring StatesPublic Health Organizational Characteristics US Indiana Illinois Kentucky Michigan Ohio
Agency Structure [free-standing (independent)/under a larger agency]
. Freestanding Freestanding Under a larger agency
Under a larger agency
Freestanding
Agency Governance (decentralized/centralized/shared)
. Decentralized Decentralized Shared Decentralized Decentralized
Accreditation Status (State agency) 39 Not Accredited Accredited Not Accredited Not Accredited Accredited
Number of Local Agencies that are accredited
. 3 12 16 8 41
Percent of Local Agencies that are accredited
. 3% 12% 26% 18% 36%
State-run local health agencies 612 0 0 0 0 0
Independent Local Health Agencies 2197 94 96 61 45 113
State-run regional or district offices 326 0 7 0 0 2
Independent regional or district offices 99 0 0 0 0 0
Full Time Equivalents State Agency . 814 1169 440 515 1049
Temporary and Contract Workers State Agency
. 336 30 114 374 82
SOURCES• ASTHO Individual Agency Profiles, 2019
49
• Public Health Accreditation Board, 2020t
Indiana and the majority of the neighboring states have decentralized governance structures, with the exception of Kentucky. Like Indiana, Illinois and Ohio are freestanding, while Kentucky and Michigan are under a larger, state agency. Of this group of states, only Ohio and Illinois are accredited at the state agency level. Indiana had the fewest number of accredited health agencies (n=3 or 3%; Montgomery, Rush, and Vanderburgh Counties).
The majority of companion states, like Indiana, are freestanding, with the exception of Nebraska. Most state health agencies are accredited (n=6), with the exception of Missouri and Nebraska. Generally, these states also had a low percentage of accredited local health agencies, with Arizona (33%) and Nebraska (29%) as exceptions.
All exemplar states, like Indiana, are decentralized. The only not accredited state agency is North Carolina. North Carolina also had a low percentage of local health departments that were accredited through national public health accreditation, although North Carolina has a state-based accreditation process which many of the LHDs have completed. Of the exemplar states, Oregon had the highest percentage of accredited local agencies (43%).
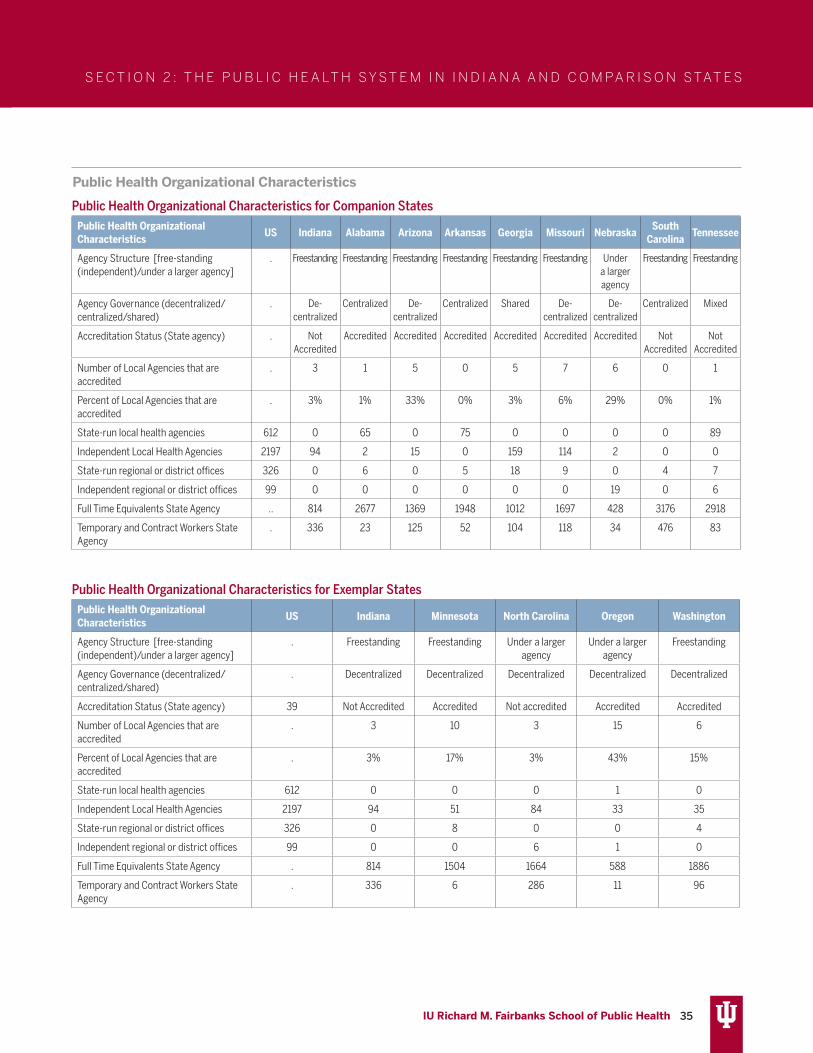
35 IU Richard M. Fairbanks School of Public Health
S E C T I O N 2 : T H E P U B L I C H E A LT H S Y S T E M I N I N D I A N A A N D C O M PA R I S O N S TAT E S
Public Health Organizational Characteristics
Public Health Organizational Characteristics for Companion StatesPublic Health Organizational Characteristics US Indiana Alabama Arizona Arkansas Georgia Missouri Nebraska South
Carolina Tennessee
Agency Structure [free-standing (independent)/under a larger agency]
. Freestanding Freestanding Freestanding Freestanding Freestanding Freestanding Under a larger agency
Freestanding Freestanding
Agency Governance (decentralized/centralized/shared)
. De- centralized
Centralized De- centralized
Centralized Shared De- centralized
De- centralized
Centralized Mixed
Accreditation Status (State agency) . Not Accredited
Accredited Accredited Accredited Accredited Accredited Accredited Not Accredited
Not Accredited
Number of Local Agencies that are accredited
. 3 1 5 0 5 7 6 0 1
Percent of Local Agencies that are accredited
. 3% 1% 33% 0% 3% 6% 29% 0% 1%
State-run local health agencies 612 0 65 0 75 0 0 0 0 89
Independent Local Health Agencies 2197 94 2 15 0 159 114 2 0 0
State-run regional or district offices 326 0 6 0 5 18 9 0 4 7
Independent regional or district offices 99 0 0 0 0 0 0 19 0 6
Full Time Equivalents State Agency .. 814 2677 1369 1948 1012 1697 428 3176 2918
Temporary and Contract Workers State Agency
. 336 23 125 52 104 118 34 476 83
Public Health Organizational Characteristics for Exemplar StatesPublic Health Organizational Characteristics US Indiana Minnesota North Carolina Oregon Washington
Agency Structure [free-standing (independent)/under a larger agency]
. Freestanding Freestanding Under a larger agency
Under a larger agency
Freestanding
Agency Governance (decentralized/centralized/shared)
. Decentralized Decentralized Decentralized Decentralized Decentralized
Accreditation Status (State agency) 39 Not Accredited Accredited Not accredited Accredited Accredited
Number of Local Agencies that are accredited
. 3 10 3 15 6
Percent of Local Agencies that are accredited
. 3% 17% 3% 43% 15%
State-run local health agencies 612 0 0 0 1 0
Independent Local Health Agencies 2197 94 51 84 33 35
State-run regional or district offices 326 0 8 0 0 4
Independent regional or district offices 99 0 0 6 1 0
Full Time Equivalents State Agency . 814 1504 1664 588 1886
Temporary and Contract Workers State Agency
. 336 6 286 11 96

36 IU Richard M. Fairbanks School of Public Health
S E C T I O N 3 : E V I D E N C E S Y N T H E S I S
EVIDENCE SYNTHESIS INTRODUCTION
STRUCTURE AND GOVERNANCEOverviewThis section describes the literature that focuses upon public health agency structure and governance models. These concepts are distinct from a related term, the ‘public health infrastructure,’ which describes the workforce, information and knowledge systems, as well organizational capacity.50
Public health services are delivered through a mix of local and state governmental and nongovernmental agencies. Such agencies can be organized in centralized, decentralized, or “mixed” structures depending on where the authority for decision making resides. Generally, centralized refers to state-level decision making authority, whereas decentralized refers to decision-making authority residing at the local county or city level. Mixed (sometimes referred to as “shared”) decision authority describes instances where the state and local health agencies have joint responsibility and authority for decisions.
In addition to these structures, public health agencies also have varying governance models at the state or local levels. Approximately 60% of state public health agencies are governed by a board or council of health typically made up of governor-appointed public health professionals, citizens, business professionals, and educators.51 Nationally, 80% of local public health agencies are governed by a board of health similarly comprised of representatives from the local community. Local boards of health are significantly less common in centralized state structures (87.1% vs. 22.2%).52
Boards or councils of health at the state and local
The following section includes reviews of the relevant literature related to public health systems change. It also includes case summaries of each of the exemplar states, which explain their ongoing work toward public health system improvements. Reviews focus on the state of evidence as it relates to 5 general topic areas of public health systems and public health performance.
level could have varying responsibilities including promulgating rules, advising elected officials (in 7% of states, Boards are made up of elected officials)51, developing public health policies and/or legislative agendas, and other responsibilities. Local health departments that serve a population of less than 50,000 people make up almost two-thirds (64%) of all such agencies but serve only 12% of the US population.51 As seen in the “Public Health Organizational Characteristics” tables above, Indiana’s public health departments are freestanding, with a decentralized governance structure.
Associations Between Structure or Governance and Public Health OutcomesSeveral studies examined how either structural and/or governance models are associated with public health performance. In these studies, performance includes (1) the extent to which the 10 Essential Public Health Services are offered, (2) the community health outcomes of a given locale, and (3) the use of administrative evidence-based practices by health departments.
The findings across studies that examined how structural attributes are associated with the provision of essential public health services are not consistent. Whereas some researchers reported that centralized structures were associated with a greater number of Essential Services provided,53,54 other researchers reported that mixed or shared authority structures had higher public health performance.55,56 Yet other studies observed no performance difference.51 One study reported that centralized state structures were
These include: 1) the structure and governance of public health, 2) regionalization within public health systems, 3) accreditation of public health, 4) public health partnerships, and 5) public health expenditures. Reviews include a conclusions section and summary of key takeaways as they relate to the context in Indiana and the recommendations provided in Section 5 of this report.

37 IU Richard M. Fairbanks School of Public Health
S E C T I O N 3 : E V I D E N C E S Y N T H E S I S
associated with a greater occurrence of administrative best practices (Brownson et al, 2014).57
The association between overall system structure and performance may be contingent on the presence of a local board of health. Researchers examining how the structure and governance of public health agencies are associated with community health outcomes utilized a composite measure of ‘proximal health outcomes’ to measure performance. Their findings suggest that whereas centralized (e.g., state-run) systems achieve the lowest mean performance scores; agencies with local boards of health performed best. Specifically, health departments with the best performance were those with local boards comprised of both local health professionals and political officeholders, but where neither group has a majority.58 Relatedly, researchers analyzing data from local health departments in Massachusetts found that one of the strongest predictors of overall performance and capacity to deliver Essential Services was an understanding of health issues among elected officials that serve on the local board of health.51 This finding, the authors suggested, represents an opportunity to improve public health capacity by educating elected municipal leaders about the responsibilities of local health officials.
With respect to governance models, several researchers have reported that having a local board of health, with policy-making authority, is positively associated with performance on some Essential Services offered;55, 59, 60 but this relationship was not observed in local health agencies who served a smaller population of under 100,000 residents.60 This latter caveat raises the potential for benefits associated with regionalization as described below.
Conclusions/TakeawaysAs evidenced by some of the conflicting findings, the relationship between structure and/or governance and performance is complex and nuanced. However, an important insight from this body of research is that educating local leaders about the responsibilities of public health agencies and public health officials is an opportunity that should not be overlooked.
Studies that examined differences in public health
performance by structure or governance have typically relied on two common data sources: (1) the NACCHO National Profile of Local Health Department series, or (2) the ASTHO Profile of State Public Health Surveys, both of which are conducted every 3 years on average. One or both of these data sources are typically combined with other datasets to examine various public health performance measures. The limited data on performance that are available for such studies is recognized by many contributing authors as a limiting factor. Furthermore, the variability in how structure and governance attributes have proliferated across jurisdictions makes precise measurement challenging. In an effort to manage this variability, one group of researchers created a typology of observed structures and identified seven groups that explained a high proportion of structure and governance configurations among public health agencies.61 Still, the lack of longitudinal studies that can better elucidate how changes to structure or governance attributes affect outcomes is a recognized limitation among researchers. More research is needed to better understand how governing structures, and what specific board powers and authorities, are most critical in positively influencing public health performance.

38 IU Richard M. Fairbanks School of Public Health
S E C T I O N 3 : E V I D E N C E S Y N T H E S I S
REGIONALIZATIONOverviewMany scholars have highlighted the challenges that health departments serving smaller populations face, including resource constraints, that result in insufficient service offerings and a dearth of on-staff expertise.51 Researchers have long observed that the size of the population served by a public health agency was consistently the strongest predictor of public health performance as measured by the capacity to provide a greater number of the 10 Essential Services.51,55 Given that public health agencies that serve smaller populations have challenges in offering a complete complement of Essential Services, there have been calls to consider pooling resources across a given region to better enable the performance of local public health. This concept, known as either “regionalization” or “cross-jurisdictional resource sharing” is modeled after the experiences of police, fire, and waste water treatment departments who have implemented similar strategies over the past decades.62 The call for public health regionalization became more prominent in the early 2000’s following the events of 9/11 that raised concerns about the vulnerability of the US public health infrastructure to a potential bioterrorism attack.
Evidence of Regionalization from Other Government AgenciesSome of the benefits of regionalization observed in other governmental services (e.g., police, fire) include a more efficient use of resources (28% reduction in costs without a reduction in services in one study), economies of scale to procure specialized expertise or equipment, better-trained staff members, lower turnover rates, and higher levels of 24-hour coverage.63 Researchers also noted that police departments that ignored coordination of services with neighboring jurisdictions exacerbated problems regionally.63 Nevertheless, scholars have noted that potential drawbacks to regionalization could include resistance to ceding local autonomy because of perceptions that regionalization can lead to a loss of focus on specific local needs; and the potentially challenging legal and fiscal issues that can assure a fair allocation of funding if variability exists in the resource inputs available among counties or cities that began to cooperate.
Regionalization and Public HealthKoh et al. described multiple degrees of regionalization activities each of which is progressively more involved including: (1) Networking, (2) Coordinating, (3) Standardizing, and (4) Centralizing.63 Networking represents the loosest form of cross-jurisdictional sharing and merely involves interactive sharing of plans and information among different local health departments. Coordinating occurs when otherwise independent health departments plan, train, or engage in exercises together. Standardization describes the process of creating uniformity across regional health departments through the mutual adoption of functions, tools, press releases, and response activities. Finally, centralization involves the creation of a consolidated entity to support or potentially replace the previously autonomous health departments for the purposes of all public health services, programs, and activities. Importantly, each of these levels of regionalization requires varying legal, governance, and management structures; and it is unclear what level of regionalization is required among public health agencies for benefits to accrue.
Since the early 2000’s, several states have implemented some aspect of intra-state cross-jurisdictional resource sharing. Researchers have determined that 54% of local health departments engage in some regular level of resource sharing. Those with a more formally educated director and/or those with a board of health were more likely to resource-share with other health agencies.64 Most of the remaining literature on regionalization uses qualitative methods to better understand experiences with regionalization in public health. For example, researchers interviewed local health directors in Connecticut and Massachusetts to elucidate the advantages and disadvantages of regionalization from the perspective of leaders who implement such approaches.65 Advantages included being able to provide more community health programs and services. A reported disadvantage of regional resource sharing was the perception that the governing body had less local knowledge about issues that differentially affect the adjacent jurisdictions that shared resources.

39 IU Richard M. Fairbanks School of Public Health
S E C T I O N 3 : E V I D E N C E S Y N T H E S I S
A similar study in Kansas reported that public health workers believed that regionalization positively influenced trust, mutual respect among local agencies, and improved public health service offerings.66 Moreover, Kansas public health workers reported that regionalization helped increase operational efficiency and resulted in additional resources including personnel, knowledge, technology, and technical expertise. However there remained dissatisfaction after regionalization due to insufficient funding, a lack of documented benefits, and insufficient engagement from local elected officials in the regional process and activities.66
Researchers found that Ohio local health departments that consolidated experienced a 16% reduction in total expenditures; and qualitative findings suggest that county health officials believed their consolidations yielded financial and public health benefits.67 However, in a synthesis of several early case studies that examined the impact of public health regionalization, Stoto and Morse noted that the mere need to provide services is not typically sufficient to entice regionalization.68 Instead, the perceived need for a regional response—for example in response to bioterrorism or an infectious disease, can help motivate action. Stoto and Morse, summarizing the findings of the case studies, concluded that a consistent reported benefit of regionalizing was the enhancement of social capital.68 Social capital in this context includes connections and relationships that may prove beneficial between otherwise disparate public health agencies and partner stakeholder groups. These connections, whether catalyzed by the threat of bioterrorism or some other reason, stand to benefit other public health activities as well.
Researchers in Montana, a rural frontier state with a decentralized structure, surveyed local elected officials and public health staff to determine attitudes and potential barriers to regionalization. They reported that public health officials and elected county commissioners have similar viewpoints with respect to the benefits of regionalization but different viewpoints regarding barriers to local resource-sharing.69 Specifically, elected officials perceived regionalization as a greater threat to their autonomy and ability to respond to local needs. In a separate study, interviews of Nebraska health departments that underwent regionalization
suggested that decisions about resource allocations in regionalized health departments were prioritized based upon community needs and the size of the vulnerable population served—but were contingent upon the amount of funds received from the state.70 Thus, Chen et al., asserted that regionalization without commensurate resource allocation from the state may undermine some of the gains expected from local resource sharing.70
Conclusions/TakeawaysRegionalization can be used to overcome resource constraints faced by local public health agencies that serve a relatively small population. To date, most of the literature has been limited to qualitative case studies designed to understand perceptions of regionalization by local health department leaders who implemented this strategy. Lacking are quantitative analyses, including longitudinal ones, that can more objectively determine the impact of regionalization on public health outcomes. However, benefits of regionalization include being able to provide more services and programs, financial efficiencies, and improved social capital within a region. Based on the current evidence, two key takeaways should be considered. The potential of improved capacity, expertise, an stability will likely be realized if there is sufficient and sustained resource allocation from the state. In planning for a regional structures, legal and governance issues need to be considered so that there is responsiveness to local needs. This may mean establishing governing bodies that include representation of existing counties or local health departments.
In regard to the current pandemic (see Section 4 for specific insights), informal regional responses were attempted but were perceived to be relatively inefficient as they were reactionary rather than strategic and intentional. In an emergency, it is nearly impossible to generate expertise or effectively stand-up essential infrastructure.

40 IU Richard M. Fairbanks School of Public Health
S E C T I O N 3 : E V I D E N C E S Y N T H E S I S
ACCREDITATION OverviewAs of September 1st, 2020, the Public Health Accreditation Board (PHAB) reported that 82% of the US population was covered by an accredited public health department. This includes a total of 36 state, 263 local, 4 Tribal, 1 statewide integrated local public health department system, and 2 Army Installation Departments of Public Health.12 Specifically, within Indiana, the Indiana Department of Health is in the process of their state agency accreditation review. Additionally, 3 of 94 LHDs are accredited including: Montgomery County Health Department, Rush County Health Department, and Vanderburgh County Health Department.
Public health department accreditation began in September 2011, in response to the “fragmentation in governmental public health department services”3 described in a 2003 Institute of Medicine Report.11 The purpose of accreditation is to “improve and protect the health of the public by advancing and transforming the quality and performance of governmental public health agencies in the U.S. and abroad”.3 PHAB accreditation provides a standard framework for health departments to prioritize services, initiatives, and efforts to best promote and protect the health of their jurisdictions.3
The accreditation standards and measures are designed to assess population health services3 and align with the CDC’s 1993 “10 Essential Public Health Services” framework (as shown above in Figure 1 of the report).71 PHAB’s accreditation standards are grouped into 12 domains.72 See Appendix A for a complete list of PHAB’s 12 domains and the related standards and measures.
Initial PHAB accreditation indicates a health department has the capacity to carry out the 10 essential services, administer/manage their health department, and effectively engage with its governing entity.3 PHAB accreditation is organized in a manner which allows health departments to foster a culture of health73 and incorporates the components of Public Health 3.0, where public health agencies serve as the chief health strategists in communities. 13, 74 The Association of State and Territorial Health Officials (ASTHO)’s Accreditation Leadership Guide describes accreditation as a tool for new health officials to
ensure their health department meets national standards, and are able to proactively identify issues thus ensuring optimal public health performance.75 An independent research firm has evaluated how accreditation and outcomes are related at multiple points before and after receiving accreditation. Specifically, researchers have examined how accreditation is associated with quality improvement (QI), performance management (PM), partnerships, accountability, workforce development, resources, community health and equity, and emergency preparedness.
Quality Improvement and Performance ManagementResearchers have found that QI is consistently one of the top motivations for pursuing accreditation and is also one of the most commonly cited benefits.3, 76, 77 The majority (80%) of local health departments accredited by June 2017 implemented a formal QI program, a larger percentage than reported in earlier years, and larger than among non-accredited health departments.3 Several researchers have reported improvements in process, program, or service efficiency as a result of engagement in QI,3, 78-81 underscoring the justification for why QI is prominent in the accreditation process. Some observed improvements in either QI and/or PM occurred immediately after undergoing accreditation,82 or soon after completion of the accreditation process.83 The specific QI benefits associated with accreditation include decreased time or cost of providing services, improved process quality, and improved public health outcomes.82 One study found that among 35 public health projects that measured the economic impact of quality improvement, there was a mean return on investment of $8.56 per dollar spent.84
PartnershipsPublic health departments often collaborate with partners from a multitude of sectors, including but not limited to academic partners, hospitals or hospital systems, other clinical organizations, nonprofits, businesses, and faith organizations. When compared with non-accredited health departments, accredited departments offer more public health services, and have more partners who assist

41 IU Richard M. Fairbanks School of Public Health
S E C T I O N 3 : E V I D E N C E S Y N T H E S I S
in delivery of those services.85 Following accreditation, a majority of health departments (70%) report strengthened relationships with external partners,3 and greater intra- and inter-organizational communication with partner organizations.86 Researchers report that collaborations between public health departments and health care delivery organizations are enhanced through public health accreditation processes,87, 88 including as a result of pursuing community health assessments in conjunction with nonprofit hospitals.89,90 Researchers report that successful collaborations can improve outcomes such as reduced mortality rates due to preventable conditions,19, 91 reduced disparities in life expectancy,91 better alignment of policy goals, increased policy expertise, and joint governance leading to collaborative action.92
AccountabilityPHAB believes that accreditation leads to greater transparency, a more accountable public health infrastructure, and serves as a “seal of approval” that signals that an agency exceeds an industry threshold of competence and capabilities to the outside world. Accreditation assures that a health department has the ability to deliver essential services through a competent workforce able to deliver evidence-based solutions.93 After one year of accreditation, the majority of surveyed health departments (n=214) reported that accreditation led to greater accountability and transparency, both within the health department (90% of respondents), and to external partners.3, 77 The majority also stated that the accreditation process improved their credibility within their community and/or within their state (79% of respondents) and enhanced their visibility and reputation with external stakeholders (74% of respondents).3, 77 Researchers have reported that health departments which seek and achieve accreditation are more engaged with their governing boards of health,94, 95 and have leaders that are more engaged with legislative partners.96
WorkforceGiven that a skilled workforce is essential to an effective public health department, accreditation is designed to address gaps in workforce competencies.97-99 A year after accreditation, the majority of accredited public health departments report increased ability to identify and address gaps in workforce training and development
(89% of respondents), and the majority (69% of respondents) report competencies improving as a result of accreditation.77 This is important because employee development in public health agencies is associated with increased levels of job satisfaction and intention to remain in their position.100-101 Case studies conducted by researchers indicate that accreditation boosts employee pride102 and increases intra-organizational collaboration.103 Analysis of PH WINS data indicates that there were no significant differences in reported burnout or intention to leave when controlling for individual and agency characteristics, indicating that accreditation is not considered to be a burden.74 Overall, employees in accredited departments reported higher job satisfaction104 and because accreditation includes a strong focus on continuous quality improvement, this may be appealing to many public health workers.105
ResourcesIn addition to the benefits described above, accreditation has also been associated with a financial return on investment. The majority of health departments that have been accredited report more effective use of resources within the department.3 The potential benefit may be achieved through multiple mechanisms. For example, accreditation activities may allow health departments to increase their funding opportunities. Moreover, the required process of developing community health assessments (CHAs) and community health improvement plans (CHIPs) has been linked to being more competitive for funding opportunities,106 and seeking new funds.107 Researchers who conducted case studies reported that accreditation status is a factor in distributing state funding to local health departments.3 Likewise, opportunities for, and usage of, federal funding may be enhanced through accreditation. For example, the CDC is a co-funder of PHAB and the CDC provides support for projects that could be used to meet accreditation standards.108 Additionally, as a potential harbinger of future requirements directly tying accreditation to funding opportunities, the CDC’s Notice of Funding Opportunities requires applicants to report their accreditation status as demonstration of their organization’s capacity.3
Community Health and EquityPHAB does not claim a direct link between accreditation status and health outcomes, but instead argues multiple

42 IU Richard M. Fairbanks School of Public Health
S E C T I O N 3 : E V I D E N C E S Y N T H E S I S
intervening steps exist between accreditation and any improvements in health status.3 However, their logic model indicates that improved health outcomes are a long-term outcome from accreditation efforts.109 Therefore, PHAB has added a requirement for monitoring and reporting of outcomes during the reaccreditation process.3 An analysis of CHIPs by accredited health departments indicate the health departments perceive accreditation as associated with positive impact in their community’s health, lending credence to the acceptance that accreditation can be linked with improved population outcomes. Many of the activities designed to improve community health come from implementation of evidence-based practices, a key component of accreditation.3, 110 A recent ASTHO report indicates that health departments have used accreditation processes as an opportunity to emphasize health equity.111
Emergency PreparednessImproved efficiencies and effectiveness, both overarching goals of accreditation, may support public health departments in preparing for and responding to public health emergencies.3 Case studies reported that the accreditation process better prepared health departments to address the recent Zika outbreak.94, 112
Because accreditation efforts have led to improvements in QI, which in many cases proved beneficial in terms of enhanced laboratory and epidemiological performance, it is believed that accreditation improves communicable disease investigations.3, 113 Lastly, researchers noted that while all departments’ preparedness capabilities declined when funding decreased, those that were accredited experienced fewer degradations in their preparedness capacity.114
Accreditation ChallengesSeveral challenges exist for LHDs that impede the decision to engage in the accreditation process or the process itself. The most commonly cited barriers or challenges include staffing concerns (limited time and turnover), competing priorities, and financial costs associated with accreditation. Although these barriers are faced by LHDs of all sizes, they are particularly challenging for LHDs with fewer employees/serving smaller jurisdictions.115-120
Conclusions/TakeawayQuality improvement (QI) is one of the most cited benefits of public health accreditation leading to improvements in process, program, and service efficiency. Accredited health departments offer more public health services, have more partners and stronger relationships with those partners, greater job satisfaction among their employees, and improved accountability and transparency. In the context of an extended pandemic, it is important to note that these benefits along with associated improvements in laboratory and epidemiological performance have the potential to make a difference in the response and ultimately in health outcomes.

43 IU Richard M. Fairbanks School of Public Health
S E C T I O N 3 : E V I D E N C E S Y N T H E S I S
PARTNERSHIPSOverviewThis section describes the literature focusing on partnerships between public health departments and their multi-sectoral partners. Public health partners can include academic institutions, hospitals and health systems, other clinical organizations, nonprofits, businesses, and faith-based organizations. Partnerships are a viable strategy for addressing problems that may be difficult to solve alone due to limited resources, expertise, or time.
Public health organizations have historically expanded and adapted the scope of their activities in order to better serve the health needs of their communities and to address health disparities.121 One method of doing so is to seek collaborations with external entities, thus increasing available expertise and capacity. Collaboration allows organizations to combine resources and expertise, and has historically been a cornerstone of public health practice.122,123 Successful collaboration hinges upon all partners sharing, or having compatible organizational objectives and incentives.124, 125 Partnerships require strong coordination mechanisms, or they risk perpetuating and potentially increasing existing inefficacies.127, 128
Despite the historic tendency of public health agencies to pursue partnerships, experts have noted that overt incentives for organizations to collaborate with public health agencies have been minimal or non-existent.129 Given historic reimbursement models, clinical organizations, as noted by experts, may have had a perverse incentive to partner with public health because successful collaborations may result in lost revenue due to the prevention of disease and/or slowing of disease progression thus reducing demand for health care services.130 Nevertheless, clinical providers could potentially benefit from partnerships to address the needs of uninsured members of the population who would otherwise require uncompensated medical care.128 Further, given federal policies that require not-for-profit hospitals to document community benefit contributions and to conduct periodic community health needs assessments, partnerships between
hospitals and public health agencies are of growing importance.126, 127
Who does Public Health partner with? And what is known about these partnerships?
Hospitals and health systems.Hospitals and health systems often partner with public health departments, especially for community health needs assessments (CHNAs) that are required of nonprofit hospitals.89, 90, 133-136 An analysis of cross-sector networks indicated that organizations such as hospitals, community health centers, and public health agencies were considered to be the most trusted and valued by other members of the partnerships (e.g., nonprofit organizations, private firms, government agencies, employer/business groups, or academic institutions).137 Collaboration between public health departments and providers of medical care is accepted as an effective strategy for improving population health, due to the combination of health-related and clinical skills, as well as the complementary resources of each organization.138-140
Researchers examining the impact of public health partnerships with hospitals and/or health systems have reported reductions in infant mortality rates141 and
Partnerships between public health agencies and hospitals/health systems offer the following opportunities: • Incorporation of community voices into CHNAs• Pathways for increasing individuals’ access to
community resources• Identification of relevant priorities for communities
served• Support for partnerships to last beyond initial
assessment efforts • Enhanced understanding of collected data and what
initiatives can be launched based on those data
44 IU Richard M. Fairbanks School of Public Health
S E C T I O N 3 : E V I D E N C E S Y N T H E S I S
increased patient satisfaction with expanded services and provision of holistic services.142
Community partners. Relationships between social service organizations and local health departments (LHDs) are important and widespread, and assist communities with addressing the effects of social determinants of health. The federal government has encouraged cross-sector partnerships with community stakeholders and encourages public health agencies to assume the role of “chief health strategist” in order to guide community organizations in a concerted effort toward improved population health.98 Public health agencies most frequently partner with social service organizations to address issues pertaining to housing and food assistance.143 An analysis by Hogg and Varda found that collaborations between nonprofit organizations and public health departments are prevalent, potentially due to shared goals and objectives.137 Recent multi-sector collaborative networks, including community-based organizations, have been designed to improve access to community resources.144, 145
Partnerships between public health agencies and community-based organizations have been associated with a reduction in single-occupant vehicle crashes (as a long-term outcome associated with substance use disorder),146, 147 childhood obesity,148 increases in social
support and self-rated health, as well as decreases in depressive symptoms among minority communities.149 Such partnerships have also been associated with a 50% reduction in African American infant mortality rates within 2 years following the partnership inception.150 Lastly, public health and social services organizations have successfully partnered to decrease adolescent pregnancy and birth rates among 14 to 17 year olds in three Kansas counties.151
Academic partners. Academic health departments (AHDs) refer to partnerships between governmental public health agencies and academic institutions such as colleges and universities. AHDs are typically established to increase the use of research and evaluation in support of public health, create opportunities for access to continued education among the existing workforce and applied training for students, and provide service exchange opportunities for public health experts and academics.152
Academic and public health practice partnerships are not new. In 1984, Congress enacted the Prevention Research Center (PRC) program which, administered by the Centers for Disease Control and Prevention (CDC), established centers for applied public health research within academic institutions. As the PRCs were in a limited number of states, in their 1988 report, the Institute of Medicine (IOM) further recognized the need for continued and expanded collaboration between public health practice and academia and made recommendations to facilitate relationships.10 In 2003, the IOM again recommended that academic partnerships be implemented to help carry out the three core functions of public health: assessment; policy development; and assurance.11
The structure of AHDs can vary. An AHD typically joins (formally or informally) a health professions school (a school with programs in public health, medicine, nursing, dentistry, environmental health, health education, or other health field) with a state or local health department. AHDs can be similar to teaching hospitals, where public health staff and university faculty have joint appointments within each other’s organizations.152 Students are able to get “real-world”,
Community partners or social service organizations are those that strive to improve health by delivering services directly to an individual or their family. These can include (but are not limited to) organizations which provide assistance or resources in the following areas:• Food • Housing/shelter• Transportation• Cash assistance (for low income individuals or
families)• Employment assistance including job training• Support for special populations (veterans,
children/families, those with special needs, older adults)
• Legal assistance

45 IU Richard M. Fairbanks School of Public Health
AHDs may include some or all of the following: • Involvement of at least one health professions school
and at least one public health practice organization• Formal partnership agreements between
involved institutions• Shared (jointly appointed and funded) faculty
and/or staff• Organizational structure which allows for
resource sharing• Exchange of resources or other compensatory
methods between institutions in exchange for provided services
• Collaborative efforts to provide education and training for public health students and professionals, grounded in theory and practice
• Joint proposal, then implementation of projects
S E C T I O N 3 : E V I D E N C E S Y N T H E S I S
practical experience through internships at public health agencies.153
Studies of academic practice partnerships and AHDs154-156 have determined that formal agreements between LHD staff and university faculty increase collaborative benefits. Erwin et al., analyzed local health department relationships with academic institutions and determined that local health departments with a formal academic partnership had higher organizational support for evidence-based programming and decision-making when compared to their counterparts with less formal relationships with academia.157 However, a study focused specifically on PRCs determined that AHDs do not need a formal agreement to provide benefits to public health practice, noting that most do not have formal agreements between public health departments and the academic institution.153 The researchers determined that the PRCs and health departments built on each other’s strengths to augment core public health functions where health departments provided the “boots on the ground” practical expertise, while PRCs enhanced data quality and scientific rigor and filled knowledge gaps. Further, the presence of academic partnerships with LHDs was also associated with providing at least
one chronic disease evidence-based intervention.157
Academic partnerships have been found to be mutually beneficial for the local health department and the academic institution, resulting in impactful research, innovative programming, and public health policies.153 Other key benefits include:152, 158
• Maximization of scarce resources • Expansion of academic research beyond academic
settings and more application of research within practice settings
• Involvement of academic institutions in community health
• The potential for an increased number of people working in public health through the addition of academic faculty, staff, and students
• Additional expertise available to support local public health agencies
• Use of tuition reimbursements for employees resulting in higher numbers of individuals working in public health with advanced degrees
• Additional, more qualified public health professionals
• Enhanced career opportunities for public health graduates
• Increased capacity for performing essential public health functions
• More opportunities for grant funding which can support public health and local organizations and improve the health of the population
Multisectoral and Other partners.There is limited evidence in the literature regarding the specific impacts of public health partnerships with nontraditional partners (e.g., employers, business groups, and academic partners), but these partners have reported contributing high levels of resources (i.e., community connections, information, health expertise, advocacy, etc.) to multisectoral partnerships.137
Studies that examined multisectoral partnerships in pursuit of public health goals have reported promising impacts. For example, multisectoral partnerships have been associated with declines in death due to largely preventable chronic diseases, such as cardiovascular disease, diabetes, and influenza.19

46 IU Richard M. Fairbanks School of Public Health
S E C T I O N 3 : E V I D E N C E S Y N T H E S I S
Moreover, multisectoral partnerships could reduce income-related disparities in life expectancy.91
Multisectoral partnerships attempt to address population health issues, by sharing resources and knowledge.128, 140, 147, 159-161 These outcomes appear to depend on the availability of organizations and their willingness to work towards prioritized public health goals.162, 163 Factors which may encourage organizations to collaborate include economic incentives (e.g., revenue gains, cost reduction, marketing advantages, achievement of economies of scale, reduction in duplicative efforts), non-economic advantages (i.e., organizational missions to improve health and welfare, reaching new populations, expanding or improving services), or regulatory mandates.128, 164-170
Conclusion/TakeawaysResearchers have noted that partnerships promote better alignment of policy goals, increased policy expertise, and joint governance leading to collaborative action.92 Partnerships between external stakeholders and public health agencies also contribute to organizational policy changes147 and to increased organizational capacity.171
47 IU Richard M. Fairbanks School of Public Health
OverviewState and local governmental public health agencies are funded by a combination of federal, state, and local sources resulting in wide variability in community-specific public health expenditures across jurisdictions. Public health decision-makers are often faced with questions about how to align funds to maximize the effectiveness of public health at the local, state, and federal levels. Concurrently, public health agencies are being asked to take on additional responsibilities at a time when fiscal constraints and budget reductions continue to occur.172 Researchers determined that in order for all Americans to receive adequate public health services, an annual expenditure of $32 per person is needed; yet current average expenditures are only approximately $19 per person.173
In the US, 75% of health care costs are allocated to treating preventable health conditions.174 However, governmental public health expenditures which focus on preventing and/or controlling these conditions constitute less than 3% of national health spending.175 As a result, the varying levels of public health funds available across communities are frequently insufficient given the high need to focus on key services and population-based programs. For example, public health expenditures in the top 20% of US localities are 13 times greater than similar expenditures in the bottom 20% of US localities.176
Often, local health departments heavily depend on local governments and local tax revenues. Nationally, local government agencies received on average 25% of their funding from local government appropriations, 21% from state government, 27% from Federal direct or pass-through, and 21% from services and fees provided to their communities.29 As described below, these expenditures are linked to a wide range of population health outcomes.
Associations between Funding and Performance/Health OutcomesGiven the wide variability in available funding and local public health expenditures, researchers have examined
how such investments are associated with health outcomes. In a study of Missouri local public health departments, researchers reported that local agencies that receive more from federal and state sources also raise more funds at the local level and perform better. For example, the local agencies who receive more funding perform a broader range of the 10 essential public health services (e.g. inspections, education, and monitoring).177 Moreover, in a national study, local health departments across the US, with greater per capita expenditures perform more core public health activities.178 Experts suggest that in order for substantial improvements in performance, additional funds are necessary to support local health departments.55
One study using national data found that a $10 per capita increase in local health department expenditures was associated with significant reductions in infectious disease incidence and in years of potential life lost.179 Another study concluded that a 10% increase in local public health spending was associated with a reduction in infant mortality and deaths from cardiovascular disease, diabetes, and cancer.180 The researchers further noted that for the average metropolitan area, a 10% increase in local public health expenditures translated into approximately $312,000 and resulted in the same mortality reduction as would be expected by the introduction of 27 new primary care doctors in the same community.
Researchers using California data from 2001 to 2009 found that an additional investment of $10 per capita in local health department expenditures reduced 9.1 deaths for every 100,000 people. The study also found that the additional public health investments improved
PUBLIC HEALTH EXPENDITURES
Governmental public health investments have been associated with a wide range of outcomes
including a reduction in the incidence of diseases, a reduction in overall and disease-specific
mortality, and improvements in health status.
S E C T I O N 3 : E V I D E N C E S Y N T H E S I S
48 IU Richard M. Fairbanks School of Public Health
S E C T I O N 3 : E V I D E N C E S Y N T H E S I S
the self-reported health status of approximately 24,000 people who improved from a “poor” or “fair” rating to a health status in the “good, very good, or excellent” health category.181
In a national study using more than 20 years of data ending in 2013, researchers found that a 10% increase in local public health spending per capita (the equivalent of $594,000 for the average sized community) reduced Medicare expenditures in the county by 0.8% per person after 1 year, and by 1.1% after 5 years.174 These Medicare savings represented $515,000 after 1 year and $656,500 after five years. Thus, Medicare alone could recover $1.10 for every $1 invested in public health over a five-year period and the overall societal returns (including to Medicaid and other payers) would be even greater.
The Bipartisan Policy Center recently completed a review of the research on public health spending and costs in order to develop evidence-based recommendations about needed levels of investment. This review focused specifically on the resources required to support cross-cutting public health infrastructure -- including surveillance, assessment, analysis, planning, communication and coordination functions -- which are collectively designated as “foundational public health capabilities” by the Institute of Medicine and other national public health advisory bodies. The review found that state and local public health agencies collectively achieved only about 60% of the recommended capability levels. To achieve full capability levels, the review concluded that the average U.S. community requires an additional annual investment of $32 per capita, or $4.5 billion nationally, to support foundational capabilities.173
Limitations There are several limitations of existing studies on the relationship between public health funding and public health performance and outcomes. First, most studies are limited to select data sources, notably a periodic survey of local health departments and/or census data, to estimate public health expenditures. Ideally, additional data sources would allow for replication of results and could further enrich current conclusions. Second, we found few studies that examined how increased public health expenditures affect health disparities—including in rural, minority, or other under-represented groups.
Conclusions/TakeawaysEvidence indicates that there is a strong relationship between public health funding and health outcomes of communities. In particular, more investment in public health translates to LHDs performing a broader range of the 10 essential public health services and more core public health activities. Higher investment in public health also relates to reductions in the incidence of chronic diseases and infant mortality and deaths from cardiovascular disease, diabetes, and cancer. In addition, higher per capita funding for public health is associated with improvements in self-reported health status, increased life expectancy, and reductions in Medicare expenditures. Public health investments result in improved health across the population and reduced healthcare expenditures.

49 IU Richard M. Fairbanks School of Public Health
C A S E S U M M A R I E S O F E X E M P L A R S TAT E S
North Carolina
North Carolina’s public health system includes the North Carolina Department of Health and Human Services (DHHS)
and within this super-agency, the Division of Public Health. DHHS and the Division of Public Health are accountable for
overseeing local public health programs and services and distributing federal and state funds to local public health agencies.
In 2017-2018, North Carolina’s public health budget was $157,214,360 (or approximately $14.99 per capita) and they were
ranked 33 in the 2018 America’s Health Rankings for public health.9 As a decentralized public health system, county
governments have legal authority and responsibility for public health. North Carolina’s fundamental accomplishments
toward a modern and sustainable public health system can be attributed to their early work in establishing a state system
for accreditation paired with accreditation requirements and their flexibility in local public health agency organizational
structures.
As of 2014, North Carolina requires all local public health agencies to be accredited and maintain accreditation through a
state accreditation board – the North Carolina Local Health Department Accreditation (NCLHDA) Board. To receive state
funding or federal pass-through funding from the state, LHDs must be accredited and re-accredited every four years.182 The
accreditation process is comprised of LHD self-assessments, site visits by the NCLHDA, and review of board decisions. To
meet accreditation standards, LHDs must reasonably perform approximately 90% of 148 specific activities, as well as be
able to provide the ten essential public health services.183 Although all 85 of North Carolina’s LHDs have been accredited
through the NCLHDA, only three have received national accreditation through the Public Health Accreditation Board
(PHAB).12, 184
Although North Carolina does not have a formal regional structure of public health services, the state is divided into four
regions for public health preparedness and response. Each region has a field office with staff, consultants, and other
support specialists who are employed by the state and work with and in support of local public health departments. In
2012, new legislation was introduced that offered flexibility for local public health agency structure.184 The new laws made
it possible for counties serving populations of 425,000 people or less to be able to create a consolidated human service
agency, as well as the option for county commissioners to assume the duties of a local board of health. Only three counties
previously were large enough to meet the population threshold, but as of 2014, at least eighteen counties had reorganized,
changed their local board of health, or both.182 The state currently has a total of 85 local health agencies, serving 100
counties with jurisdiction sizes ranging from 6,000 to over 900,000 people.184
In sum, local public health departments in North Carolina can provide public health services in various ways: establishing a
county health department; forming a multi-county district health department; forming or joining a public health authority;
establishing a consolidated human services agency; or contracting with the state to provide public health services. These
various agencies are all considered local health departments, must have a ‘governing board,’ and are obligated to provide
local public health services.182

50 IU Richard M. Fairbanks School of Public Health
C A S E S U M M A R I E S O F E X E M P L A R S TAT E S
Ohio
Ohio’s state health department, the Ohio Department of Health (ODH) is supported by 114 local health departments (LHDs)
including general health districts, city health districts and combined health districts. In 2017-2018, Ohio’s public health
budget was $153,239,809 (or approximately $13.11 per capita) and they were ranked 40 in the 2018 America’s Health
Rankings for public health.9 In 2013, Ohio was the first state to mandate public health accreditation by law. It is also one
of the three initial 21st Century Learning Community states working to modernize their public health systems.15 Ohio local
public health departments have been working to incorporate the foundational public health services (FPHS) framework to
guide improvements to public health practice, service delivery, and health outcomes.
To support planning for public health modernization efforts, in 2016, Ohio conducted LHD surveys to assess FPHSs and
the extent of shared services across LHDs. Findings indicated that, although LHDs were already engaging in some sharing
of services, additional sharing arrangements and service contracts were needed to facilitate increased cross-jurisdictional
sharing.185 Following this work, a costing tool was employed that factored in FPHS capabilities, identified FPHS gaps, and
then estimated the cost of closing those gaps. While these costs estimates were being generated, the 2017-2019 proposed
state budget consisted of $1 million to assist LHDs in transitioning from a five-year Community Health Assessment (CHA)
to a three-year cycle that aligned with hospital Community Health Needs Assessments and includes common metrics that
can be used by both partners.186 The 2017-2019 budget also included an additional $12,500 incentive for each LHD to aid
in addressing two of three specific population health areas including: mental health/addiction, maternal/child health,
and chronic diseases. Another $3.5 million of the 2017-2019 budget was allocated to support infrastructure costs and
accreditation efforts for merging LHDs.186 The ODH continues to strategically work to communicate the importance of the
FPHS and public health accreditation for improving health outcomes in the state. In sum, substantial state increases for
Ohio’s public health budget and state mandated accreditation were crucial to Ohio’s public health modernization efforts.
The additional funding allowed Ohio to develop a costing tool to close FPHS gaps; supported the LHDs in transitioning to
a three-year funding cycle; funded specific population health areas; and supporting LHD accreditation for the state.

51 IU Richard M. Fairbanks School of Public Health
C A S E S U M M A R I E S O F E X E M P L A R S TAT E S
Oregon
Oregon’s state health department, the Oregon Health Authority, is supported by 33 county-based local health departments
(LHDs) and 1 public health district serving 3 counties. In 2017-2018, Oregon’s state public health budget was $116,277,440
(or approximately $27.57 per capita) and they were ranked 21 in the 2018 America’s Health Rankings for public health.9
Starting in 2013, the Oregon Health Authority, the Oregon Coalition of Local Health Officials, and the Oregon Public Health
Advisory Board led the state in a process they refer to as public health modernization. In 2015, the state legislature established
the foundational public health services (FPHS) model in state law and mandated a public modernization plan, requiring local
public health modernization plans to be submitted by 2023.187 Oregon has used the foundational FPHS framework to define
its health activities and to inform reorganization of their public health system.
As a first step toward the state’s public health modernization plan an evaluation was conducted that examined capacity
for the FPHS and estimated the cost of fully implementing the FPHS at the state and local levels.188 Findings from this
work were used to develop a statewide public health modernization plan and communication tools to help with technical
assistance. Additionally, Oregon emphasized relationships among LHDs, legislators, and key stakeholders in order to build
awareness and a shared understanding of FPHS in the state. Oregon established various resources to guide the state’s
implementation of FPHS, including the online Public Health Modernization Roadmap for moving to FPHS implementation.
The Roadmap provides strategies and tools such as decision aids and model agreements for cross-jurisdictional sharing.188
The Oregon Coalition of Local Health Officials held several regional meetings to prepare LHDs to apply for a local public
health modernization grant.187 In 2017, a total of $5 million was awarded in public health modernization grants within
the state. A total of $3.9 million was awarded to 32 out of the 34 LHDS and $1.1 million was awarded to the state health
authority.188 In 2018, the state published its baseline Public Health Accountability Metrics Report to identify shared goals
and track progress toward population health priorities.189 Following the RWJF grant work, Oregon is currently working
towards continuing to identify public modernization tools and resources for the roadmap, as well as implementing other
service delivery models for cross-jurisdictional sharing and regionalization.15
In sum, Oregon is an exemplar state because they are committed to improving the public health system. Their legal mandate
that all LHDs submit modernization plans to establish the FPHS model in the state is one example of this commitment.
Another example is that the State incentivized it by using state funds for modernization grants for LHDs.

52 IU Richard M. Fairbanks School of Public Health
C A S E S U M M A R I E S O F E X E M P L A R S TAT E S
Washington
Washington’s state health department, the Washington Department of Health (DOH), is supported by 35 local health
departments (LHDs). Other public health authorities include the Washington State Association of Local Public Health
Officials and the State Board of Health. In 2017-2018, Washington’s state public health budget was $341,908,500 (or
approximately $44.69 per capita) and they were ranked 9 in the 2018 America’s Health Rankings for public health.9 In an
effort to advance its increasing demand for public health services and a historic lack of public health funding, the state
implemented the foundational public health services (FPHS) framework in 2018.190 The Robert Wood Johnson Foundation
provided grant funding for Washington to build on longstanding working relationships between state and local public health
leaders. Washington has focused its efforts on defining the governmental public health system and creating a modern and
sustainably-funded governmental public health system.191 Washington was the first state to implement the Uniform Chart
of Accounts (UCOA), a system to standardize the tracking of public health financial data. Over a period of multiple years,
the State built a crosswalk so that LHDs could report their financial data (where funds come from, which services are
covered by specific funds, etc.) into a uniform and standard system across the state. The ultimate purpose of the UCOA is
to improve transparency and accountability for public health funding and to be able to examine the use of funds in terms
of effectiveness and efficiencies. Additionally, the state agency and the local public health delivery system each established
defined services and funding roles. Strategically allocating funds toward this work, the state awarded an initial investment
of $10 million to LHDs and $2 million to the DOH for statewide efforts toward implementing statewide strategies to control
the spread of communicable disease and other strategies. The LHDs and the Washington State Association of Local Public
Health Officials apportioned $1 million out of its $10 million funding to support shared service delivery demonstration
projects.192 Local public health leaders are optimistic that these demonstration projects will provide opportunities to test
new service delivery models and expand access to learned expertise and increase awareness.
The state of Washington is an exemplar state because they have a longstanding and shared commitment to improving the public
health system. Through the investments made in implementing the Uniform Chart of Accounts as well as the the commitment
of a statewide team that systematically assessed how to structure the delivery of the FPHS, the State has developed a strategy
to create sustainable change. Through these efforts they have also estimated the costs to implement these structural changes
and to perform the FPHS. They have used this work to inform a formal budget request of their legislature.
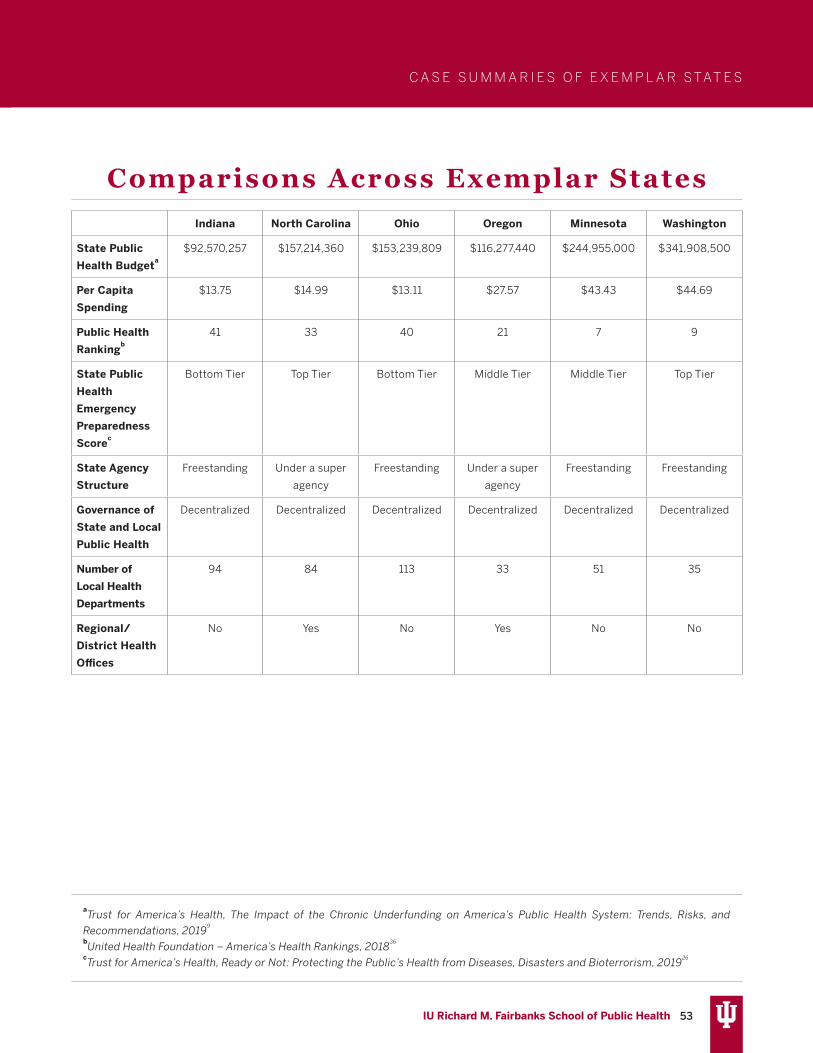
53 IU Richard M. Fairbanks School of Public Health
C A S E S U M M A R I E S O F E X E M P L A R S TAT E S
Comparisons Across Exemplar StatesIndiana North Carolina Ohio Oregon Minnesota Washington
State Public
Health Budgeta$92,570,257 $157,214,360 $153,239,809 $116,277,440 $244,955,000 $341,908,500
Per Capita
Spending
$13.75 $14.99 $13.11 $27.57 $43.43 $44.69
Public Health
Rankingb41 33 40 21 7 9
State Public
Health
Emergency
Preparedness
Scorec
Bottom Tier Top Tier Bottom Tier Middle Tier Middle Tier Top Tier
State Agency
Structure
Freestanding Under a super
agency
Freestanding Under a super
agency
Freestanding Freestanding
Governance of
State and Local
Public Health
Decentralized Decentralized Decentralized Decentralized Decentralized Decentralized
Number of
Local Health
Departments
94 84 113 33 51 35
Regional/
District Health
Offices
No Yes No Yes No No
aTrust for America’s Health, The Impact of the Chronic Underfunding on America’s Public Health System: Trends, Risks, and
Recommendations, 20199
bUnited Health Foundation – America’s Health Rankings, 2018
36
cTrust for America’s Health, Ready or Not: Protecting the Public’s Health from Diseases, Disasters and Bioterrorism, 2019
26
54 IU Richard M. Fairbanks School of Public Health
Fishers Health Department
In the early weeks of the COVID-19 pandemic, Mayor Scott Fadness of the City of Fishers, Indiana, found himself reading national public health recommendations and the state and local policies governing public health. At the time, he was focused on finding ways to ensure resiliency. This required a focus on essential public safety and public health infrastructure so that his city could weather the anticipated impacts of COVID-19. He learned that the law allowed him to stand up a health department in his city and it aligned with his vision of making sure that the health of his community is considered in all governmental decisions. In the field of public health systems, this concept is referred to as a “health in all policies” approach and in practice it means consulting with or having public health experts at the table when policy decisions are being made regarding transportation, parks and recreation, public safety, etc.
Mayor Fadness, with a background in mental health services, was of the mind that the health of the members of a community is directly tied to the economic success of those individuals and the economic success of the businesses operating in that community. However, as a Mayor and leader of a city, it was his experience that he was “completely divorced” from decisions influencing the welfare and health of the population by both structure and culture. He said, “I saw a future where public health had to be seamlessly integrated into the urban setting and in the structures that exist in government at the local level.” So, on April 24, 2020, the City Council of Fishers approved the establishment of the Fishers Health Department, established a board of health, and appointed Dr. Indy Lane as the Health Officer. At the same time, the City Council approved the reallocation of $2 million in city resources in addition to reallocated resources from Hamilton County to fund the public health department.
As discussed in Section 1 of this report, the Public Health 3.0 approach emphasizes the concept of health in all policies. It also emphasizes the idea that public health agencies should be the chief health strategist for their communities. More specifically, as a chief health strategist, public health agencies convene government as well as non-governmental for-profit and not-for-profit organizations to use their diverse resources to collectively work to improve public health. Using public health expertise and tools, the collective of stakeholders has the potential to make a bigger impact on the public’s health. These two concepts, the health in all policies approach and public health as the chief health strategist have similar goals – working with stakeholders to improve public health from a systems perspective. According to Mayor Fadness, in the years prior to the COVID-19 pandemic, he rarely experienced interactions with the county health department in his jurisdiction and did not see the connections between public health and other community stakeholders, which was part of his worry as he was considering ways to prepare his community for the pandemic. He said, “when a crisis does occur and those [connections to public health] aren’t there, you’re at a deficit before you even get started. So what we’re trying to create here is those relationships, that web has to be nurtured and developed and become muscle memory for the future.”
In alignment with the goal of public health integration within a system, Mayor Fadness and Fishers Health Department Director, Monica Heltz, have worked to cross-train other governmental employees with relevant expertise and responsibilities. For example, the City of Fishers requires that all fire department employees are trained paramedics. Since you have to have fire departments, even when there are rarely fires, there is a value proposition for the community for fire fighters to support public health, especially in health-related response roles. In fact, the more than 15,000 COVID-19 tests that have been administered to Fishers residents have been conducted by fire fighters. While this approach is working for Fishers, Mayor Fadness cautioned that this process is not simple and that this model would not work everywhere; however, for a relatively large city in a large county primarily made up of rural settings, he believes this was the best solution to ensuring the health and wellbeing of his community.
C A S E S U M M A R Y

55 IU Richard M. Fairbanks School of Public Health
QUALITATIVE INSIGHTSInterviews were conducted with public health and health care experts as well as business and policy leaders across the state of Indiana. A total of 49 individuals contributed insights about their experiences with the public health system, their vision for improving the public health system, and considerations for creating a path to change. The authors would like to acknowledge and thank the following list of stakeholders who participated in an interview.
Public Health Experts and Practitioners• Dr. David Allison, Dean and Distinguished Professor at
Indiana University School of Public Health-Bloomington• Dr. Jeremey Adler, Tippecanoe County Health Officer
and President, Indiana State Association of County and City Health Officials (INSACCHO)
• Dr. Kris Box, Indiana State Health Commissioner, Indiana• Dr. Virginia Caine, Marion County Public Health
Department Director• Dr. Robert Einterz, St. Joseph County Health Officer• Dr. Richard Feldman, former Indiana State Health
Commissioner• Dr. Mark Fox, St. Joseph County Deputy Health Officer• Monica Heltz, Fishers Health Department Public
Health Director• Dr. Merle Holsopple, Former President, Indiana
State Association of County and City Health Officials (INSACCHO)
• Kim Irwin, Health by Design Executive Director and Administrator, Indiana Public Health Association
• Dr. Greg Larkin, former Indiana State Health Commissioner
• Dr. Judy Monroe, former Indiana State Health Commissioner
• Betsy Prentice, Indiana Public Health Association Administrator
• Dr. Jennifer Sullivan, Secretary, Indiana Family Social Services Administration
• Dr. Matt Sutter, Allen County Health Officer• Dr. Chandana Vavilala, Lake County Health Officer• Mindy Waldron, Allen County Health Administrator• Dr. David Welsh, Ripley County Health Officer• Dr. Eric Yazel, Clark County Officer
Health Care Experts• Dr. Joseph Bonanno, Dean and Professor, Indiana
University School of Optometry• Dr. David Daleke, Vice Provost for Graduate Education
and Health Sciences and Associate Dean, Indiana University Graduate School
• Dr. Sarah Giaquinta, Vice President of Community Health, Parkview Health
• Dr. Lisa Harris, Chief Executive Officer, Eskenazi Health• Dr. Dawn Haut, Chief Executive Officer, Eskenazi
Health Centers• Dr. Jay Hess, Dean, Indiana University School of
Medicine and Executive Vice President for University Critical Affairs
• Dr. Indy Lane, Fishers Health Department Chief Medical Director
• Dr. David Lee, Vice President, Provider Engagement and Contracting, Anthem
• Dr. Patrick McGill, Chief Analytics Officer, Community Health Network
• Bryan Mills, President/Chief Executive Officer, Community Health Network
• Dr. Mike Mirro, Chief Academic and Research Officer, Parkview Health
• Dennis Murphy, President/Chief Executive Officer, IU Health
• Jonathan Nalli, Chief Executive Officer, St. Vincent/Ascension Health Care
• Dr. Robin Newhouse, Dean and Distinguished Professor, Indiana University School of Nursing
• Mike Packnett, President/Chief Executive Officer, Parkview Health
• Julie Reed, Executive Vice President, Indiana State Medical Association
• Dr. Paul Wallach, Executive Associate Dean of Educational Affairs and Institutional Improvement, Indiana University School of Medicine
• Dr. Ram Yeleti, Chief Physician Executive, Community Health Network
Business and Policy Leaders• Senator Jean Breaux, Indiana Legislature• Kevin Brinegar, President and Chief Executive Officer,
Indiana Chamber of Commerce
S E C T I O N 4 : Q U A L I TAT I V E I N S I G H T S F R O M K E Y S TA K E H O L D E R S I N I N D I A N A

56 IU Richard M. Fairbanks School of Public Health
S E C T I O N 4 : Q U A L I TAT I V E I N S I G H T S F R O M K E Y S TA K E H O L D E R S I N I N D I A N A
• Senator Ed Charbonneau, Indiana Legislature• Scott Fadness, Mayor, City of Fishers• Mark Fisher, Chief Policy Officer, Indy Chamber of
Commerce• Angel Franklin, Vice President of Compensation and
Benefits, Cummins• Michael Huber, President/CEO, Indy Chamber of
Commerce• David Johnson, President/CEO, Central Indiana
Corporate Partnership• Representative Cindy Kirchhofer, Indiana Legislature• David A. Ricks, Chairman and Chief Executive Officer, Eli Lilly• Dr. Michael McRobbie, President, Indiana University• Representative Robin Shackleford, Indiana Legislature
Qualitative Insights About Public Health in Indiana OverviewParticipants were asked to provide their perspectives on the current state of the public health system. They were also asked if they have specific insight about issues with the public health system either during the COVID-19 pandemic specifically or prior to the pandemic. Participants identified a total of 6 overarching issues with the public health system. These include:
1. Public health is not well understood and is undervalued2. Public health does not have sufficient funding3. There is a lack of specific types of public health expertise
at the local level4. There is a lack of connectedness and communication
between the state health department (SHD) and local health departments (LHDs)
5. There is insufficient technology and essential infrastructure coupled with inconsistent data for evidence-based decision making
6. The local public health system is not providing the essential public health services consistently across communities.
The next section describes these issues in detail and provides the context for each issue as well as key quotes from participants. Participants were also asked for recommendations about strengthening the public health system in Indiana. As available, participant suggestions for improvements are explained within each of the related themes.
Participant Identified Public Health System Issues and Suggestions for Improvement
Issue 1: Public health is not well understood and is undervaluedAcross the three types of participants, it was reported that there is a general lack of understanding of the value of public health and its role in protecting and ensuring the health of the population. For example, participants felt that state lawmakers and other key stakeholders do not recognize that public health and healthcare delivery are different entities or that they have different roles. A policy expert said,
“The biggest challenge, number one is, is that the average [member of the] public does not realize the value and importance of what public health does. When public health is effective and efficient, they don’t hear anything about it.”
In a related comment, a health care expert noted, for example, “[Indiana] is woefully inadequate on vaccine education in the state.” While the general public may not understand the role of public health, participants perceived different implications when lawmakers and local leaders do not understand public health. In particular, a policy expert reported that elected officials are not aware of the impact of behavior change on health and believes that this disconnect limits state funding for public health. Another important consideration that was raised by a health care expert is that investing in public health is about investing in the path toward health goals and having realistic expectations for the time it takes to see returns on those investments. The health care expert stated:
“There’s this sense ‘I want to invest in something today, and I want to see material payback in twelve months.’ I don’t think that’s realistic…It feels like public health is more like our bridge and road infrastructure improvements – nobody’s looking for an immediate return on investment for all the money we’re putting in roads. But there’s an inherent belief that that makes us a better statewide economy, if we have better roads and bridges. I don’t know how you get people to that same understanding on public health -that this is a long-term investment for major returns as opposed to this ‘I need to see improvements in twelve months.’”

57 IU Richard M. Fairbanks School of Public Health
Participant Suggestions for Improvement
A public health expert suggested that: “Public health has to do more community outreach and education about all the things that public health is responsible for and all the things that it does.” Additionally, it was suggested that providing local leaders with more information about the value of public health, may be beneficial. Specifically, one public health expert said:
“I think one of the things that would really help a great deal to our commissioners and to other elected officials is on demonstrating to them, with some concrete data from either within the state of Indiana or from other states, about the economic benefits of a strong public health system. That’s the one thing that they seem to really latch on to - the things that benefit the economy. And if they could see how spending that money on public health creates a large return on investment, that I think it’d be a lot easier for them to wrap their heads around the idea of spending more money on public health.”
Other participants supported this idea, reporting perceptions that the lack of clarity about the value of public health impedes funding at both the local and state level as well as support from state and county leadership. Respondents also suggested that state leaders, local government, and private organizations may be more supportive of public health if they had a better understanding of its value and role and how to partner in support of public health. A policy expert stated, “Your biggest gap in the legislature is people not knowing what public health means.”
Issue 2: Public health does not have sufficient fundingParticipant insight about the issues of public health in Indiana focused on funding as the root cause of many of the other more specific issues detailed in this section of the report. A policy expert said, “Public health in Indiana is not a high priority. When we start to prioritize where our limited dollars go, it does not appear to me that public health receives a sufficient amount of those dollars to be able to really have a meaningful impact on health overall in the state of Indiana.” Additionally, participants explained that understanding the value of public health and the potential of providing sufficient funding for
public health are directly connected. One policy expert said: “…our legislative body feels that changing behavior is not motivated by necessarily allocating more money towards public health initiatives. It’s just not convinced that behavior is changed in the public health space by allocating more money.” Another policy expert said,
“I think Indiana is a sicker state, and when you’re sicker it costs more money. But we don’t want to contribute the money, and so I think that there is a real disconnect between understanding the role that a healthy community and a health society can play versus the financial commitment it takes to achieve that.”
Health care experts summarized the problem of funding by explaining their perspective that Indiana pays for health, but it does so in the most costly way – by paying for it through a sicker population and the costs of their medical care. A policy expert stated “We pay for poor health, but we do so ineffectively.” A health care expert explained:
“We have very low-income state taxes for corporations and individuals. We have very high healthcare taxes…[Employers are] basically tax[ed] to do business [in Indiana]. So if you’re a pro-growth Republican, you should really care about healthcare costs. Those are things that won’t change overnight with public health, but over time really can change quite a bit.”
There is also the issue of LHDs receiving little funding from the state, causing them to be dependent on local leaders/county commissions who may not understand the value of public health. One public health expert said: “I know some of the counties around us have the same attitude I think the state does – where public health funding is kind of an afterthought. When things get tight around the belt, it’s one of the first things they want to cut.” The dependency on local funding and county leadership also leads to problems with funds being supplanted. More specifically, if a LHD is seeking ways to generate more review with the intention of expanding services or meeting community public health needs; if they are successful, the county commissioners/councils might take that same amount of money back from the LHD budget. This, in effect, creates a zero sum game whereby LHDs are discouraged from
S E C T I O N 4 : Q U A L I TAT I V E I N S I G H T S F R O M K E Y S TA K E H O L D E R S I N I N D I A N A
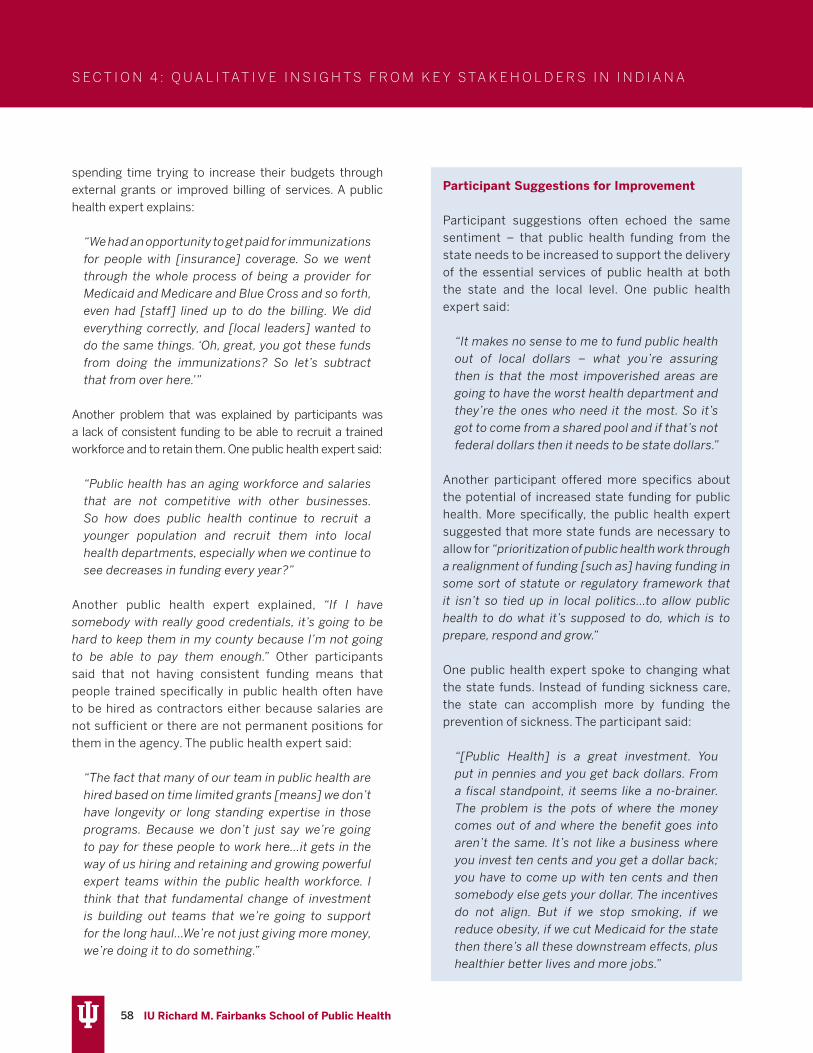
58 IU Richard M. Fairbanks School of Public Health
Participant Suggestions for Improvement
Participant suggestions often echoed the same sentiment – that public health funding from the state needs to be increased to support the delivery of the essential services of public health at both the state and the local level. One public health expert said:
“It makes no sense to me to fund public health out of local dollars – what you’re assuring then is that the most impoverished areas are going to have the worst health department and they’re the ones who need it the most. So it’s got to come from a shared pool and if that’s not federal dollars then it needs to be state dollars.”
Another participant offered more specifics about the potential of increased state funding for public health. More specifically, the public health expert suggested that more state funds are necessary to allow for “prioritization of public health work through a realignment of funding [such as] having funding in some sort of statute or regulatory framework that it isn’t so tied up in local politics…to allow public health to do what it’s supposed to do, which is to prepare, respond and grow.”
One public health expert spoke to changing what the state funds. Instead of funding sickness care, the state can accomplish more by funding the prevention of sickness. The participant said:
“[Public Health] is a great investment. You put in pennies and you get back dollars. From a fiscal standpoint, it seems like a no-brainer. The problem is the pots of where the money comes out of and where the benefit goes into aren’t the same. It’s not like a business where you invest ten cents and you get a dollar back; you have to come up with ten cents and then somebody else gets your dollar. The incentives do not align. But if we stop smoking, if we reduce obesity, if we cut Medicaid for the state then there’s all these downstream effects, plus healthier better lives and more jobs.”
spending time trying to increase their budgets through external grants or improved billing of services. A public health expert explains:
“We had an opportunity to get paid for immunizations for people with [insurance] coverage. So we went through the whole process of being a provider for Medicaid and Medicare and Blue Cross and so forth, even had [staff] lined up to do the billing. We did everything correctly, and [local leaders] wanted to do the same things. ‘Oh, great, you got these funds from doing the immunizations? So let’s subtract that from over here.’”
Another problem that was explained by participants was a lack of consistent funding to be able to recruit a trained workforce and to retain them. One public health expert said:
“Public health has an aging workforce and salaries that are not competitive with other businesses. So how does public health continue to recruit a younger population and recruit them into local health departments, especially when we continue to see decreases in funding every year?”
Another public health expert explained, “If I have somebody with really good credentials, it’s going to be hard to keep them in my county because I’m not going to be able to pay them enough.” Other participants said that not having consistent funding means that people trained specifically in public health often have to be hired as contractors either because salaries are not sufficient or there are not permanent positions for them in the agency. The public health expert said:
“The fact that many of our team in public health are hired based on time limited grants [means] we don’t have longevity or long standing expertise in those programs. Because we don’t just say we’re going to pay for these people to work here…it gets in the way of us hiring and retaining and growing powerful expert teams within the public health workforce. I think that that fundamental change of investment is building out teams that we’re going to support for the long haul…We’re not just giving more money, we’re doing it to do something.”
S E C T I O N 4 : Q U A L I TAT I V E I N S I G H T S F R O M K E Y S TA K E H O L D E R S I N I N D I A N A

59 IU Richard M. Fairbanks School of Public Health
Issue 3: There is a lack of specific types of public health expertise at the local levelPublic health experts consistently noted that LHD employees would benefit from improved training opportunities. In particular, local health officials report that when they start working for the LHD they receive no on-the-job training in public health or what is expected of their specific role as a health official. One public health expert said: “There’s just really no system of having standardized ways of doing what we do [in LHDs] and there’s no training. The training that’s there is very pocketed.” Another public health expert explained: “I’ve been a health officer for [many years]. And it’s been kind of on-the-job training.” In addition to the lack of public health training among local health officials, respondents reported that LHDs are not resourced with enough appropriate expertise overall. In particular, respondents reported that local public health does not have resources for public health preparedness, Medicaid billing, epidemiology and informatics, and surveillance and disease intervention – some of which was perceived to have impeded local response efforts for COVID-19. One public health expert said: “whatever we think we don’t have in training and expertise at the state level, we have even less of it at the local level.”
Issue 4: There is a lack of connectedness and communication between the SHD and LHDs and among LHDsLHDs report that there is a lack consistent communication between the SHD and LHDs. One public health expert directly stated: “The state health department does not have enough contact with local health departments or Local Health Officers.” A specific example from the COVID-19 pandemic referenced situations in which LHDs learned of SHD response initiatives and decisions through the media. Participants reported being caught off guard and unprepared to respond to their community’s questions about state announcements. Further, participants believed that this lack of communication created inefficiencies at a time when resources were crucial. Participants also suggested that the lack of consistent communication between the SHD and LHDs contributes to a lack of alignment and lack of strategic efforts across LHDs and the state. One local public health expert said “when there is a major [state public health] announcement coming out, just a little bit of forewarning would be awesome…You may not be calling the shots about what the state’s doing but you’re frequently asked details and it certainly impacts you, so having that information ahead of time would be helpful.” In another example, a participant said their LHD dedicated a week preparing for a COVID-19-related decision and the public announcement of it, only to see their work become irrelevant by a change made by the SHD. A public health expert explained:
“I continue to think that Home Rule is a flawed system. It’s very unclear what the state and local health departments have responsibilities for and what they have shared responsibilities for and who gets to make the rules. It’s been incredibly frustrating throughout [the pandemic] that the state [health department] will make an edict and say ‘call your local health department because they’ll take care of it.’ So then local health departments are tasked with enforcing something that we had no role in creating and no voice in discussing the implications of and we
Participant Suggestions for Improvement
Local health officials suggest that ongoing training covering new public health initiatives and innovations would beneficial. Two public health experts offered their perspectives:
“Some kind of ongoing educational process is needed. ‘What’s the latest thing on vaccinations? What’s the latest thing on water safety? What’s the latest thing on farming issues? If you have a highway going through your county, what are some of the transportation issues you need to be aware of about hazmat coming through your county?”’
“Some sort of health officers training would be great…I think you still get a decent amount of [local] health officers who think, ‘I can just walk through [the health department] for 30 minutes on Friday and pick up my check,’ and [they have]
no interest in the actual process themselves. I think [mandatory trainings] would help weed out the ones that are truly wanting to [be health officers] for the right reasons.”
S E C T I O N 4 : Q U A L I TAT I V E I N S I G H T S F R O M K E Y S TA K E H O L D E R S I N I N D I A N A

60 IU Richard M. Fairbanks School of Public Health
found out ten minutes before the public found out. That fractures the relationship [between the state and the locals]. In other states that are state-run, at least you’re clear who has the authority and what the relationship is. So this shared relationship where we both, both the state and the county, have responsibility but it’s not really clear who ultimately has responsibility and who gets to make decisions, is a set-up for poor management. At the end of the day, you’ve got to know who’s making the shots and who’s responsible for enforcing them. Right now we don’t know. A lot of times, it’s whoever speaks the loudest.”
A health care expert explained an example that alludes to the lack of connectedness within the public health system. The example provided relates to the COVID-19 pandemic response and highlights a need for public health coordination to work with health care systems at a district level. The health care expert said:
“Two things that have been very challenging. One is getting increased capacity for hospital beds. So we have a district where we’re going to run out of beds much quicker than we thought we would. What are we going to do to set up a field hospital? Unfortunately, there’s no one person that we can go to, to rally by district. And the second thing is [the State Health Department] is sending out vaccines to different hospitals, but again this is uncoordinated. I think that having a district approach makes sense.”
Participant Suggestions for Improvement
Most LHD respondents suggested that they would benefit from a structure that offers improved connections between the SHD and LHDs. A suggestionfrom one public health expert was: “There needs to be a team of people [at the state] that their assignment is the local health departments and the communication with, the interaction with, and kind of holding accountable the local health departments for metrics.” A public health expert also suggested that the large number of LHDs makes communication difficult and recommended a regional support structure to facilitate better connectedness.
“I don’t think you can put [new funds] out to
92 local health departments and make it work. I think you got to have at least some level of regionalization at least for oversight. And I think there’s some advantages to that – having a regional contact as opposed to just a state contact. I just think the regions are different enough that I think you’ve got to have some middle layer there.”
Another reason provided for sharing-resources at a district level was that it would improve surge capacity at the local level. A public health expert said: “having the ability to move resources around from county to county I think would be very helpful because in the non-COVID world, most of the time my workflow is fine. But then all of a sudden something will happen and I could use all hands on deck, and we’re absolutely overextending all our local people.” Specific ideas generated included one from a public health expert:
“You could hire one full time health officer that could oversee five or six counties, one large administrator that oversees five or six local health offices, and you get economies of scale from that standpoint, but also better trained, maybe better educated, MPH-type candidates along with the local health officer. [The state] could have more interaction with them, provide more training for them, and be more supportive of them.”
Another public health expert explained that the current funding structure of dependency on local county governments and local taxes makes it difficult to work together on regional public health issues and initiatives. Given this context, it was recommended that efficiencies could be gained by supporting LHDs to work together. The expert said:
“I understand we are all constrained within our own county budgets and nobody wants to spend public health dollars from county [A] in county [B], but a little more cooperation would be huge on the local level. Because, again, an opioid epidemic doesn’t stop as soon as you leave county [A]. So a lot of these programs would be much more efficient if we worked together.”
S E C T I O N 4 : Q U A L I TAT I V E I N S I G H T S F R O M K E Y S TA K E H O L D E R S I N I N D I A N A

61 IU Richard M. Fairbanks School of Public Health
Issue 5: There is insufficient technology and essential infrastructure coupled with inconsistent data for evidence-based decision making Participants report inefficiencies and delays in essential service provision by LHDs because public health functions remain paper-based. One participant reported that many of the services that LHDs provide do not have community access to web-based forms or technology that would streamline processes. A public health expert explained:
“I’d say the biggest gap is information…[LHDs are] stuck in 1970 because that’s where we’re at in terms of the information systems. We’re just woefully impoverished from a resource perspective as relates to information systems…We do not have online permitting; no web-based permitting. We’re still using paper.”
Another public health expert provided an example about improving the efficiency of infectious disease reporting (e.g., new HIV infections are still received as paper-based reports) and the implications for the timeliness of identifying or responding to an outbreak. The participant said that at one time:
“[the State Health Department had a] goal to become 80% paperless and got a long way down that path…but those things always take a backseat because there’s always a ‘fire’ to put out and, when you have such a small workforce, all of that growth gets constantly interrupted because you end up with all hands on deck for a response. Then your baseline teams that
are supposed to be making you good at what you do get pulled to do other stuff.”
Regarding laboratory capabilities, one participant reported that as of mid-March, at the start of the COVID-19 pandemic, the state public health laboratory was capable of processing 40 COVID-19 tests per day, which was insufficient and was resulting in long turn-around times. To support the state public health system, private industry stood up the capacity to process more tests. More specifically, Eli Lilly developed that capacity for Indiana. One health care expert said, “within a month Lilly built the capacity for 2,600 tests and can now [process] 40,000.” It was recommended that laboratory capabilities and “diagnosis capabilities for public health emergencies need to be permanent going forward.” A public health expert echoed this sentiment about the need for consistent and sufficient infrastructure:
“I feel like even more now than previously, our State Department of Health in particular and our local health departments have to scrap to get stuff done and they have to rebuild things every single time there’s a problem. And that doesn’t have to be that way… existing infrastructure is really key.”
LHDs also shared that they often have to report data manually to the SHD, but that when they ask the SHD for analytics about their own LHD data, they are told the SHD cannot share it back to them. This mattered to participants because they suggest that time is being wasted in reporting data to the SHD and that LHDs are hindered by not being able to use data analytics in decision-making. One public health expert said, “I feel like I’m going to seven different systems to get very little meaningful information.”
Participant Suggestions for Improvement
A public health expert made the following recommendation: “As a state, the best thing would be if we came up with one IT system that connected everything together, and we made sure every local health or every county had a connection.” Another public health expert echoed this call: “being able to have a common platform would be critical to be sure, and I think there
However, one public health expert also said: “I think you’d almost have to have both [LHDs and a district office] because I think some of the relationships that are cultivated at the local level would be really hard to do at the regional level.” Another important consideration offered by a public health expert is that “one of the potential barriers from the standpoint of a larger health department is that many of them may fear that they’re going to be given extra [district level] responsibilities, but then not be given extra staff or extra funding to take care of those other counties.”
S E C T I O N 4 : Q U A L I TAT I V E I N S I G H T S F R O M K E Y S TA K E H O L D E R S I N I N D I A N A

62 IU Richard M. Fairbanks School of Public Health
Issue 6: The local public health system is not providing the essential public health services consistently across populations
Participants reported that there are variations in what public health provides at the local level. According to one public health expert:
“LHDs say, ‘We can’t afford to have a food safety person along with the person who does the septic system stuff along with preparedness.’ So [LHDs] hire one person and they do all three. And so then you’ve got basically someone who likes preparedness better. So they spend all their time on that. And one person actually said ‘well, I just don’t do food safety. I don’t really understand it.’ So that’s where you need to have counties joined together and hire a food safety person that the State Department of Health can train well and interact with and they know that they go out and do these X number of counties. And the same with the septic person. And, and the same with a preparedness person.”
Another public health expert said: “I do think that there should be some incentive, whether for good or for bad to actually achieve essential public health work. The fact that locals get to pick and choose what they do, and what they don’t do is pretty alarming.” It was suggested that the challenge is the differences in sizes of jurisdictions. According to a public health expert:
“We have such disparate county sizes, which is a bit of a problem when it comes to what we do as local public health. For example, [our county is large enough to deal with] TB (Tuberculosis) and STDs (sexually transmitted diseases) all the time. So we’re good at it and we have routines. Whereas smaller counties will call us and say, ‘hey, we’ve got our first case of TB in three years. What do we do again?’ There’s no state system that supports locals. The locals rely on the locals.”
In a similar sentiment, another public health expert said:
“Getting people together and having the combined resources of multiple counties working to fund public health initiatives in a particular area would be very beneficial and probably would benefit a lot of the rural counties to a great extent, because many of those health departments are very small. And I’m sure they have some challenges meeting some of the basic public health needs of their area.”
Even more specifically, another public health expert explained:
“The local health departments are almost completely autonomous from the state health department. There is some funding that flows down to the local health departments, but not much. The vast majority of funding in Indiana for local health departments comes from the local community…If we think about public health as having responsibility of protecting and improving the health of the public, how well are [LHDs] doing with that? And what are things that could be done better or suggestions that [the state] might have about how to move farther faster?... So if there was some sort of template that, ‘Hey, county, this is the stuff you need to have in place for a good, functioning health department. Here’s the way you need to act. Here’s the funding level for basics and if you don’t do your job, county government, then there’s a mechanism for the state to step in to protect the population.’”
It was stated that LHD activities are limited to just those required of them (as shown in Figure 11). One public health expert said:
“What we focus on, at least in this county, are the statutory obligations and really if [a LHD] goes beyond that, it’s unusual. And unfortunately the statutory obligation seems to be stuck in 100 years ago and there’s no real emphasis or expectation on the part of the health department to really engage in identifying or grappling with and taking action items against the real health problems of this
would be cost savings in this infrastructure.” Relatedly, a public health expert suggested: “What we need to do is invest in and continue to push metric-based, evidence-based programming that is getting results, even if it doesn’t get results as fast as people want.”
S E C T I O N 4 : Q U A L I TAT I V E I N S I G H T S F R O M K E Y S TA K E H O L D E R S I N I N D I A N A

63 IU Richard M. Fairbanks School of Public Health
county and of this state. For example, a simple one would be adverse childhood experiences - clearly a major problem for children and the outcomes of those in adulthood are profound. And yet what health department within the state of Indiana is really grappling with these?”
Participant Suggestions for Improvement
One public health expert suggested that the accreditation process could offer systematic process improvement across a variety of related areas. More specifically, the participant stated: “…accreditation does kind of raise all levels, really does improve services that public health provides, and the way public health provides them and documents them.” Similarly, another public health expert said: “I think there is value to doing the work that’s required for accreditation…and so I suggested we look at the framework of what’s required and holding ourselves to try to account for all that.” Along that same line, a number of participants indirectly asked for local public health in Indiana to have standards for services such as that which is provided by the Foundational Public Health Services framework. A public health expert said:
“If it were a little bit more prescriptive in terms of the development of standards that each of the local health departments had to meet, whether it’s services or scope of the overall mission, having that as a touchpoint may be helpful to working with county commissioners and others to identify those things that you had to do.”
A related recommendation came from a health care expert:
“I think there is a foundational set of capabilities that every department needs to have. Today, I think it’s highly variable and it’s not prescribed. And I see that more in a regulatory framework than a legislative framework. Lay out requirements, but leave them to the experts to lay out.”
Health care experts recognize the limitations the
existing public health system have on their efforts to address health inequity. More specifically, one health care expert said:
“[Indiana] really needs a unified message and a unified coordinated plan. Because of the lack of coordination in the counties and the state, [healthcare system efforts] have become ineffective, even when resources are put in. It’s not just the money, but the connectivity – there are different initiatives that are not connected. And so we were struggling right now with ‘how do we [as healthcare systems] reach out to the locals or the state to help us address some of these health inequities based on race? And there is no one go-to place, one go-to person, one situation where we can tap into resources to help them do the best we can. It’s even more than an uphill battle.”
Participants directly expressed the need for a comprehensive strategic plan for public health and that this lack of guidance trickles down to the decisions at the local level as well. A public health expert said: “[LHDs] don’t really get into a lot of the chronic issues like obesity and things like that, unless there’s a small little pocket of grant money, so we don’t have that full [public health] system.” One policy expert noted that state strategic plans exist in most other areas, but not one for public health and wellness.
“We don’t have a comprehensive state health and wellness plan…You have a comprehensive plan for everything else but you don’t have one for wellness…Where [we] need to start is drafting a comprehensive health and wellness plan for the state.”
A health care expert made a similar call for planning: “There needs to be a post-pandemic reckoning process…[we need to know] what we need to do to be better-prepared.”
S E C T I O N 4 : Q U A L I TAT I V E I N S I G H T S F R O M K E Y S TA K E H O L D E R S I N I N D I A N A

64 IU Richard M. Fairbanks School of Public Health
S E C T I O N 5 : R E C O M M E N D AT I O N S F O R P U B L I C H E A LT H S Y S T E M C H A N G E
RECOMMENDATIONSThe recommendations and implementation steps contained in this section are based on the comprehensive review of Indiana’s state and local public health system as well as the relevant evidence and experiences of public health systems experts. As noted in Section 2, Indiana’s current public health system is not able to provide the full range of capabilities necessary to protect health and safety for all Hoosiers. Current capabilities vary widely across the state, fall significantly short of national recommendations and guidelines, lag behind the capabilities maintained in neighboring states, and are most severely constrained in Indiana’s small and rural communities. These problems derive from multiple contributing factors, but root causes lie in its fragmented delivery system structure and its inadequate financial and human resources. Indiana’s under-resourced public health system contributes to higher levels of preventable disease and injury burden along with higher medical care costs, compared to many other states. These health and economic burdens are not distributed evenly across the state, but rather they are concentrated in rural communities, low and moderate income households, and racial and ethnic minority groups. As a consequence, strategic investments in Indiana’s public health system can produce sizable improvements in health status for state residents while helping to constrain growth in medical spending and creating more equitable opportunities for health in low-resource and under-served communities. Over the longer term, these investments can also boost economic development and growth across the state as children face fewer health-related interruptions in learning and educational attainment, and as workers face fewer health-related interruptions in productivity, earnings, and career advancement.
Based on feedback from stakeholders, Indiana’s communities are ready for change and willing to work together to make improvements to the public health system. A total of 49 stakeholders participated in an interview and contributed feedback and/or ideas for improvements to the public health system in Indiana. The review of the scientific evidence for public health
systems change presented in Section 3 and the insights provided by Indiana stakeholders in Section 4 informed the following recommendations. Broadly, the recommendations include considerations for changes to the public health system with notable structural and financing changes. A general estimate of costs needed to make improvements to the public health system is provided along with potential funding mechanisms for consideration.
Indiana’s public health system needs substantial funding increases at both the state and local levels. Four overarching recommendations are made. The two tables below present implementation steps necessary to improve the capacity and effectiveness of Indiana’s public health system. Cost estimates for two of the recommendations are provided below the table.
Overarching Recommendations1. Create a uniform approach to deliver the
Foundational Public Health Services (FPHS) across the state (see steps 12 and 15 below)
2. Create a district-level mechanism to enable resource sharing among LHDs (see steps 12-14 below)
3. Strengthen the State Health Department’s oversight and enabling capacity to support the local public health delivery system (see steps 1-11 below)
4. Under the auspices of the state board of health, create a multi-disciplinary state-wide implementation committee tasked with executing the implementation steps below (see step 1 below)

65 IU Richard M. Fairbanks School of Public Health
S E C T I O N 5 : R E C O M M E N D AT I O N S F O R P U B L I C H E A LT H S Y S T E M C H A N G E
State Level Implementation Steps to Improve Public Health Capacity and Effectiveness Step Description Evidence and Considerations
1. Convene a public health strategic planning committee to begin implementing the recommendations and steps.
The committee should include stakeholders from state and local agencies as well as public health systems experts, representatives from state, city, and county leadership, local healthcare delivery systems, and other key partners. This committee should focus on implementing the recommendations and steps in this report.
The committee should propose to the State Health Commissioner and Governor a comprehensive state strategic plan for public health every three years. The strategic plan should have specific and measurable objectives. The State Health Commissioner should report progress toward the strategic plan to the legislature each year.
Stakeholder calls for a state-wide strategic plan were consistent. Given the extent of public health system improvements necessary, a planning committee needs to be convened along with implementation teams and funding to move the recommendations and steps forward.
2. Enhance formal training of public health staff across state and local public health agencies through the establishment of a tuition reimbursement program.
Support/tuition reimbursement for employee enrollment in professional degree programs and certificates should be made available and should have specified employment commitment requirements after funding is complete. Such programs should support current employees and can aid in the recruitment of new employees.
With few exceptions, executive management (commissioner, deputy commissioners, commission/office heads) should have doctoral level training with a minimum of 5 years of experience leading large and complex organizations. While helpful, a doctoral degree in medicine or law alone is insufficient without substantial experience or formal training in public health. In addition, program heads should also have a minimum of a master’s degree in public health with strong preference for a doctoral degree in public health with a minimum of 5 years of experience in governmental public health.
Similarly, experienced and trained experts should be available in a SHD office dedicated to supporting program implementation at the local level as noted in step #7.
Currently, less than a quarter of the executive staff and division leaders at the SHD have doctoral-level degrees and 20% have formal public health training.
While it is preferable that leadership at the SHD have significant technical expertise in public health, it is also recognized that for various reasons related to transition and feasibility that this will take several years to achieve. Nevertheless, a commitment should be made to only replace current positions with the appropriate credentials moving forward.
3. Revise the title and requirements for the Commissioner of Health through a revised public health law.
The title of the Commissioner of Health should be changed to Secretary of Health and State Health Officer and should be a Cabinet-level position, recognizing the importance of public health to the state’s wellbeing. Further, the state department of health should be maintained as a stand-alone agency. Additional language should specify and require that the Secretary of Health have a minimum of a master’s degree in public health with experience in governmental public health. These requirements compliment the requirement noted in step #2 that the Secretary of Health have formal public health training and a minimum of 5 years of experience leading large and complex organizations.
This recommendation for state public health to be a stand-alone agency is consistent with national recommendations contained in the numerous iterations of the Institute of Medicine (IOM) Reports on Public Health.
1, 11, 139
4. Develop and adopt a uniform data set and provide and require the use of a common data platform for integrated real-time reporting at all levels of the public health system.
A uniform data set should include defined and comparable health, workforce, and financial metrics. A uniform data set and common data platform would create efficiencies in reporting and ensure consistent and reliable data across all levels and locations of the public health system. It would also ensure that data collected at the local level will be readily available for evidence-informed decision-making at the local, district, and state and agency levels.
This recommendation is in alignment with national recommendations to improve public health infrastructure. It will be essential to reporting on performance and providing accountability for new funds.
Stakeholders report frustration with a dearth of reliable data and inefficiencies in reporting.

66 IU Richard M. Fairbanks School of Public Health
5. Adopt the Public Health Accreditation Board (PHAB) standards and verification process, requiring accreditation of all LHDs/district health offices within 5 years.
Applying the PHAB standards will assure that public health agencies in Indiana are routinely implementing quality and performance improvement. Continuously meeting accreditation standards will ensure that there are public accountability measures for the investment of taxpayer funds. A summary of the PHAB standards and measures is provided in Appendix A.
Accreditation has been shown to improve LHD capacity and more robust partnerships. LHDs also report better efficiencies and effectiveness. Evidence indicates that state-initiated collaboration and support structures help LHDs navigate the process.
6. Establish performance-based contracts with periodic review for each major public health program and each large LHD/district.
Grants and aid to LHDs should be both performance-based and needs/per-capita-based. Annual state and local public health system performance and capability reports should be provided to the legislature.
Performance-based contracting and accountability are supported by stakeholders with the caveat that step #4, the uniform data and a common data platform, is essential.
7. Establish an Office of Local Support and Technical Assistance within the SHD.
Although not an exhaustive list, this office should provide technical assistance for program implementation, financing issues, legal resources and interpretation, program assessment and evaluation, grant writing, as well as education and training to the local level. It will offer formal mechanisms for consultation/advice and service coordination between the SHD and district offices/LHDs. This office should be led by an experienced public health administrator with a minimum of 5 years of LHD administrative expertise.
The office should have assigned a representative of each major program office and commission on a full-time basis who can act as a liaison and technical advisor for implementation questions and requests for program improvement. This office should act as a clearing house for requests of all sorts arriving from the local level. Where feasible, this office should also integrate directly with agency wide quality improvement efforts and work closely with offices that support communication, legislative liaison and the office of legal affairs.
Stakeholder insights indicate that many LHDs lack important expertise and there is an overall sense of disconnection with the SHD.
As it relates to legal affairs, state law or regulations should be changed to explicitly state that health law information may be provided by the SHD legal department to LHDs/district offices without qualification. This extension of services would not extend representation responsibilities for legal action. It would specifically recognize the specialized knowledge and expertise contained at the SHD is generally not available at the local public health level. State public health attorneys should also be available to act as a resource for local county attorneys on questions related to public health regulations and policy.
8. Assure that state
universities with
accredited schools
of public health are
formally collaborating
with and supporting
all levels of the public
health system.
Formal collaboration should ensure that workforce training programs
provide training that is appropriate and accessible to public health
professionals, internship and practicum opportunities are available
for students and aid health departments in recruitment, and practice-
based research and evaluation is conducted where appropriate and
advantageous to public health.
Academic partnerships have been found
to be mutually beneficial for the local
health department and the academic
institution, resulting in impactful research,
innovative programming, and public
health policies. Additionally, there is
overall stakeholder support for improved
collaboration with academic institutions.
9. Expand social marketing and tailored public health communication.
Communication that targets specific demographic segments with health prevention messaging is needed. Communication should be developed by health communication specialists at the SHD and tailored (as appropriate) and implemented at the local level. Federal grant proposals should routinely request funding to support marketing and communication.
Among the lessons from the COVID-19 pandemic is that public health is not well understood among policymakers or the public. Improvements to public health communication are needed and have been requested by stakeholders.
S E C T I O N 5 : R E C O M M E N D AT I O N S F O R P U B L I C H E A LT H S Y S T E M C H A N G E

67 IU Richard M. Fairbanks School of Public Health
10. Ensure that local public health funding is not supplanted when additional funding is awarded/received.
Local public health funding should not be supplanted (reduced commensurate with new funds) when locals are successful in achieving additional grant funds for specific innovations or programs or when they generate revenue through reimbursement of clinical services. Provisions preventing supplanting of funds should be included in all state to local funding agreements.
Currently, 8.4% of the SHD budget is allocated to programs and services at the local level. LHDs in IN have a higher reliance on local taxes for the delivery of many of the foundational public health services compared to averages among LHDs nationally.
Public health funding has been shown to lead to improved capacity and health outcomes.
Stakeholder insights indicate widespread support for increased local public health funding, in particular as it relates to reduced health care expenditures, reduced employer costs, and population health improvements.
11. Train new and current Local Health Officials.
Local Health Officials are required by law to be physicians, but do not have requirements for either formal public health training or public health experience. An orientation program and ongoing training for local health officials should be developed.
Local health officials acknowledge a need for onboarding and ongoing training. Most would welcome an orientation program and periodic updates delivered in a manner that is accessible and useful to their work.
District Level Implementation Steps to Improve Public Health Capacity and EffectivenessStep Description Evidence and Considerations
12. Add district level offices to the existing public health system structure.
Services and skillsets that are essential to local public health practice, but are often unavailable outside of the SHD or very large LHDs, include: epidemiology, public health preparedness and response, disease intervention specialists, chronic disease program specialists, public health laboratory services, public health risk communication and media relations, public health education and marketing, public health implementation science, evaluation and assessment services. District health offices should provide these services and expertise as shared-resources for the counties within each of the 10 public health preparedness districts. See current district map provided in Appendix D.
The advantage of this model is that district health office staff could be primarily focused on regional public health issues with local buy-in and acceptance and have the ability to marshal SHD resources.
Resource-sharing models such as the recommended district health office model are being implemented in all exemplar states.
Stakeholders unanimously support this model. One reservation was consistent across stakeholders: funding for district models needs to be sustainable. Additionally, the location and governance model for district health offices should be the subject of additional deliberation between the SHD and LHDs within each of the 10 public health preparedness districts.
A trained epidemiologist is essential for acute outbreak investigation and surveillance of infectious and chronic diseases. An improved network of accessible public health laboratory services will ensure capacity for water, food, and infectious diseases testing. Chronic disease program specialists can work to address diabetes, cancer, and heart disease within districts and specific communities.
S E C T I O N 5 : R E C O M M E N D AT I O N S F O R P U B L I C H E A LT H S Y S T E M C H A N G E

68 IU Richard M. Fairbanks School of Public Health
13. Establish leadership and capacity for regional resource sharing and expertise sharing.
An important aspect of regional sharing is the leadership network necessary for the deployment of expertise and resources and improved communication and coordination.
Two elements are recommended for this leadership network. 1) It is recommended that each district employ a District Health Officer. Another title for this role may be Deputy Health Commissioner. The District Health Officer should have doctoral level training (e.g. a MD, PhD, DrPH, etc.) and particular training in public health (e.g., a MPH, MSPH, etc.). 2) To ensure representation across each county within a district, a Regional Health Board should be established and be composed of Local Health Officials/ Administrators. The District Health Officer would have a dual reporting relationship to both the Regional Health Board and a direct reporting relationship to the State Health Commissioner. The District Health Officer would provide each county and district a direct link to the resources and expertise at the SHD.
District health offices may be stand-alone state offices or co-located at an existing LHD. However, large LHDs should play a prominent role in district leadership and resource sharing. Large LHDs with a population of 250,000 or larger should have the ability to remain independent of a district arrangement. It is recommended that large LHDs should be allowed to compete to lead as a “regional referral center” that would serve as the district office. Given the population-level needs of large LHDs, the extent of “in-house” expertise is often greater than most smaller LHDs. A resource adjustment for population should be considered for equity after system configuration for district arrangements. Overall, large LHDs should not have an incentive to spend less per capita than current allocations.
14. District health office employees may be either SHD employees or district/local employees.
Employment level will be of particular importance as it will determine responsibility for the costs associated with salaries and influence the physical location of employees responsible for district services and skills.
If district health office employees, including the District Health Officer, are SHD staff they would be included under the SHD budget and existing reporting structure. In such a model, district health office employees may operate out of a stand-alone office or be incorporated into/work from offices housed within existing LHDs. Such a structure would lend itself to consistent communication between the SHD and district health offices and across the network of district health offices. It may also facilitate the strategic implementation of state-wide initiatives. This structure may also allow for district employees to be located across the LHDs within a district, rather than centralized in one location.
A “regional referral center” model could also be employed where, a LHD would continue to serve their county and local community while also providing the skills and expertise to the region as required of a district health office. In this model, the district health office staff would be local employees.
Should the responsibility for district health employees and services be assigned to a LHD that serves as a “regional referral center”, it would be recommended that funding for such arrangements be provided to the LHD by the SHD and be guaranteed for a pre-determined, set period of time for consistency of operations.
Inconsistency in funding for these responsibilities would erode the sustainability of the district health office model and would interfere with the provision of essential expertise and skills in the district. As an example of consistent funding, the SHD could establish a 5-year district health office fund/grant paid to the “regional referral center” that will house district staff and take responsibility for the provision of regional expertise. In such a model, the existing LHD Health Officer would serve as the District Health Officer with continued local and expanded district responsibility.
S E C T I O N 5 : R E C O M M E N D AT I O N S F O R P U B L I C H E A LT H S Y S T E M C H A N G E

69 IU Richard M. Fairbanks School of Public Health
Local Level Implementation Steps to Improve Public Health Capacity and Effectiveness Step Description Evidence and Considerations
15. Define and ensure the provision of a core package of services that must be provided by each LHD.
Each county should be served by a LHD that provides core public health services specifically designated and funded jointly by the county and/or municipality and the SHD. Regardless of county size, each LHD should be served by a core staff which should be outlined in the state strategic plan (e.g., an administrator, public health nurse, vital records clerk, and environmental health specialist) and provide core public health services (to be defined in alignment with the 10 Essential Public Health Services and the Foundational Public Health Services).
5, 14 Additional staff and services may be required
based on population size, complexity and need.
LHDs in Indiana are currently providing a comprehensive level of services in 11% of LHDs. With adequate funding and systems changes, improving the capacity and effectiveness of the local public health services is feasible. National recommendations support foundational public health services and capabilities.
Existing statutes of what services must be provided at the local and state level and revisions to these should be considered as they relate to the provision of the Foundational Public Health Services.
S E C T I O N 5 : R E C O M M E N D AT I O N S F O R P U B L I C H E A LT H S Y S T E M C H A N G E
Estimates of Cost and Benefits of Public Health System ImprovementsTwo components of the recommendations are needed to support the public health system transformation. Cost estimates for these combined components are provided. The first estimate broadly summarizes the employee salary costs that can be expected if recommendation #2 is implemented. The second cost estimate is the cost of improving the capacity of the LHD public health system to deliver the core package of essential services discussed in recommendation #3.
Costs Associated with Implementation Step 12 - New Expertise and Skills at the District LevelIn particular, the addition of district health offices across the 10 public health preparedness districts would be associated with an additional $10.4 million in employee salaries and facilities and administrative costs or a minimum of $1,036,750 needed to fund district-level health offices in each district. When this is examined on a per capita basis, this translates to an average of $2.27 per capita in additional funds (per capita costs range from $0.57 to $3.73 per district).
Costs Associated with Implementation Step 15 – Delivering the Core Package of Essential Services at the LHD levelThe cost of assuring services, improving capacity of the local public health system is estimated for 1.) an
average availability of comprehensive services and capacity in LHDs and 2.) for state-wide availability of comprehensive services and capacity.193
1. An additional $14 in per capita spending would bring Indiana’s Foundational Public Health Service capabilities to the national average of capacity. This $14 increase in per capita spending translates to an additional $81 million in annual public health spending, but is estimated to provide $168 million in reduced medical costs annually by the tenth year of this investment. Models developed for Indiana in conjunction with this report indicate that increasing per capita public health spending by $14 would result in the prevention of an additional 890 deaths per year and extend life expectancy by nearly 1 year for low and moderate income households in Indiana,
2. To achieve a comprehensive level of public health system capabilities across all levels of public health in Indiana, an additional $55 in per capita public health spending would be required. This translates to $328 million in additional public health spending annually. These investments are expected to reduce medical costs by $350 million by the tenth year of implementation. It is crucial to note, however, that models indicate this would prevent 3,600 deaths annually and add an additional 4.1 years of life for lower-income populations within the state.

70 IU Richard M. Fairbanks School of Public Health
S E C T I O N 5 : R E C O M M E N D AT I O N S F O R P U B L I C H E A LT H S Y S T E M C H A N G E
Funding OpportunitiesState Tax Increase on the Sale of Tobacco Products and Establishment of the Indiana Public Health Trust Fund Polling data supports the notion that voters are generally favorable of an increase in tax on the sale of tobacco products when the increased tax revenue is used to support health needs within the state.194 There are several different mechanisms for tax distribution that should be explored including establishing support for new staff within the Office of the Commissioner of Health at IDOH and the establishment of core roles within regional units. To allow for the new tax revenue to generate interest and to support the phased implementation of public health improvements, an Indiana Public Health Trust Fund should be established. The Trust Fund should be explicitly limited to Foundational Public Health Services and related infrastructure.
Increased Portion of State General Funds Dedicated to Public Health Depending on the percentage of the tobacco tax that is dedicated to public health funding requirements, additional funding from the general fund should be allocated to support core staffing of the Office of the Commissioner of Health at IDOH and the establishment of core roles within regional units.
State Health Care Savings Offset Payment Another potential mechanism to support public health activities is through a savings offset payment. Such a payment has been shown to raise a sufficient amount of funds to support population health in general.1 Minnesota and Vermont are two states that have they have used this type of financing mechanism to generate funds for health-related needs including the expansion of medical care.195-196 Applying this model to Indiana, a 0.2% percent assessment applied to all health care transactions in the state is estimated to yield $149 million in revenue in fiscal year 2020. Note that Indiana’s estimated healthcare transaction base in calendar year 2020 is calculated using the most recently available U.S. National Health Expenditure Accounts estimate of $55.4 billion in personal healthcare expenditures among Indiana medical providers in 2014 and applying observed annual growth rates in personal healthcare spending for the U.S. between 2014-2020.

71 IU Richard M. Fairbanks School of Public Health
This review of Indiana’s public health system was undertaken with the purpose of making recommendations for system improvements. It will be up to stakeholders to determine the exact path forward and to prioritize actions based on funding provided toward these recommendations. Improving the health of Hoosiers is feasible through increased public health funding, transformation of the public health system from the current structure (see Figure 8 in section 2) to the new structure illustrated in Figure 23 below, and enhanced collaboration within public health and with partners external to health departments.
Recommendations in this report should be tailored to state and local preferences and needs. As the report indicates, substantial changes are needed to improve the Indiana public health system, and it is clear that stakeholders are ready and willing to get started. Specific thanks and appreciation are due to the hundreds of
CONCLUSIONSpublic health workers at the state and local levels that toil every day on behalf of the people of the state and who do so without the resources they really need to do the best job they can. This report was written to support their work and give them the tools they need to improve the public health system for Hoosiers. COVID-19 sounded the alarm that the status quo is not sufficient.
As a next step, a statewide taskforce should be established to develop a strategic plan alongside implementation teams charged with moving new initiatives forward. Even with sufficient resources this will be a difficult job and may take years to implement some of the recommendations over phases. Stakeholders around the state, in particular, the Indiana University Richard M. Fairbanks School of Public Health, stand ready and willing to support the state in moving the agenda for public health improvement forward.
Figure 23: Possible Future Responsibilities of a Public Health System with State, District, and Local Levels
S E C T I O N 6 : C O N C L U S I O N S
LHD Responsibilities
Recommended Districts Health Responsibilities
• Deliver or assure the foundational public health services (FPHS).• Vital records and health permits
• Core environmental services
• Infectious disease surveillance/contact tracing
• Immunizations
• Liaison with local hospitals and health professionals
• Develop and maintain emergency preparedness plans
• Execute emergency and recovery responses
• Establish and promote community readiness
• Provide public health education and marketing
• Develop and implement a health education/prevention
strategies and programs
• Ensure access to timely laboratory services
• Risk communication and local media relations
• Evaluation and assessment of program of services
• Identification of district/local health priorities
• Create local partnerships and convene local stakeholders for
collective action
• Collect and employ local public health data evidence-based
strategies and programs
State Responsibilities• Provide grants/funding to local boards of health
• Use data-driven policy for evidence-based activities
• Evaluate public health activities
• Bring essential partners together
• Engage partners in policy making and programming
• Integrate public health and health care activities
• Promote health care quality
• License health care facilities, agencies, clinics, centers, and
providers
• Ensure accurate state vital records/statistics

72 IU Richard M. Fairbanks School of Public Health
T H E F E N C E O R T H E A M B U L A N C E
The Fence or the Ambulance
‘Twas a dangerous cliff, as they freely confessed,
Though to walk near its crest was so pleasant;
But over its terrible edge there had slipped
A duke, and full many a peasant;
So the people said something would have to be done,
But their projects did not all tally.
Some said, “Put a fence around the edge of the cliff;”
Some, “An ambulance down in the valley.”
But the cry for the ambulance carried the day,
For it spread through the neighboring city,
A fence may be useful or not, it is true,
But each heart became brimful of pity
For those who slipped over that dangerous cliff;
And the dwellers in highway and alley
Gave pounds or gave pence, not to put up a fence,
But an ambulance down in the valley.
Then an old sage remarked, “It’s a marvel to me
That people give far more attention
To repairing the results than to stopping the cause,
When they’d much better aim at prevention.
Let us stop at its source all this mischief,” cried he.
“Come, neighbors and friends let us rally:
If the cliff we will fence we might almost dispense
With the ambulance down in the valley.”
Better guide well the young than reclaim them when old,
For the voice of true wisdom is calling:
“To rescue the fallen is good, but ‘tis best
To prevent other people from falling.”
Better close up the source of temptation and crime
Than to deliver from dungeon or galley;
Better put a strong fence ‘round the top of the cliff,
Than an ambulance down in then valley!
73 IU Richard M. Fairbanks School of Public Health
T H E F E N C E O R T H E A M B U L A N C E
The Fence or the Ambulance
This poem, attributed to John N. Hurty, M.D., was published in the American Journal of Public Health and the Nation’s
Health in August 1933.197 Dr. Hurty was the head of the Indiana State Board of Health for more than 25 years, serving as the
Secretary from 1896 to 1922. Under his tenure, a number of public health achievements were made, from ensuring water
quality to collection of vital statistics.198
The poem itself can be seen as an early commentary on the role of public health versus the role of healthcare. In this poem, the
author explains that a great many people have slipped off the edge of a cliff. Although everyone agrees that this is a dangerous
situation, the answer many provide is to devote resources to placing an ambulance at the bottom of the cliff to rescue people
after they have fallen. When an “old sage” points out that that it may be better to address preventing the problem before it
occurs, and that it would be more practical to do so, he is met with resistance. However, there are a “practical few” who agree
with him, emphasizing the idea that prevention is better than cure. The author finishes the poem by encouraging the reader
to be one of these practical people, and advocate for preventive measures, rather than devoting resources to fixing a problem
after it occurs.
This poem has had multiple attributions, including to Joseph Malin, an English temperance activist. Sources estimate he
may have written it in 1895 and published it in the Iowa Health Bulletin in 1912. In the illustration above, the individuals
slipping off the cliff are representative of public health concerns of the time, including (but not limited to) infectious diseases
such as smallpox, typhoid fever, scarlet fever, diphtheria, cholera, or venereal diseases. The two ambulances (one is the City
Ambulance, the other is the State Ambulance), are seen to be loading patients to take them to the hospitals, located next
to graveyards. This illustration again underscores the role of public health- a simple ‘fence’, or preventive measures, could
protect people against adverse events such as hospitalization and/or death.

74 IU Richard M. Fairbanks School of Public Health
R E F E R E N C E S
1. IOM - Institute of Medicine. (2012). For the public’s health: Investing in a healthier future. Washington, DC. National Academies Press. https://www.nap.edu/read/13268/chapter/1
2. Corso, L.C., Lenaway, D., Beitsch, L.M., Landrum, L.B., Deutsch, H. (2010) The national public health performance standards: Driving quality improvement in public health systems. Journal of Public Health Management and Practice. 16(1), 19-23.
3. PHAB – Public Health Accreditation Board. (2020, June). The value and impact of public health department initial accreditation: A review of quantitative and qualitative data. https://phaboard.org/wp-content/uploads/Value-and-Impact-Final-June2020.pdf
4. NACCHO- National Association of County and City Health Officials. (2020). Mobilizing for action through planning and partnerships (MAPP). https://www.naccho.org/programs/public-health-infrastructure/performance-improvement/community-health-assessment/mapp
5. Ten Essential Public Health Services Futures Initiative Task Force. (2020, September 9). 10 essential public health services. https://phnci.org/uploads/resource-files/EPHS-English.pdf
6. Winslow C. E. (1920). The untilled fields of public health. Science, 51(1306), 23–33. https://doi.org/10.1126/science.51.1306.23
7. Bunker JP, Frazier HS, & Mosteller F. (1994). Improving health measuring effects of medical care. Milbank Quarterly, 72, 225-258.
8. CDC- Centers for Disease Control and Prevention. (1999, April 2). Ten great public health achievements -- United States, 1900-1999. MMWR. 48(12), 241-243.
9. TFAH - Trust for America’s Health. (2019, April). The impact of chronic underfunding on America’s public health system: Trends, risks, and recommendations, 2019. https://www.tfah.org/wp-content/uploads/2020/03/TFAH_2019_PublicHealthFunding_07.pdf
10. IOM. (1988). The future of public health. Washington, DC: The National Academies Press. https://www.nap.edu/read/1091/chapter/1
11. IOM. (2003). The Future of the public’s health in the 21st century. Washington, DC: National Academies Press. https://www.nap.edu/read/10548/chapter/1
12. PHAB. (2020, November 13). Who is accredited?. https://phaboard.org/who-is-accredited/
13. DeSalvo K.B., Wang, Y.C., Harris, A., Auerbach, J., Koo, D., & O’Carroll, P. (2017) Public Health 3.0: A call to action for public health to meet the challenges of the 21st century. Preventing Chronic Disease, 14, E78. https://www.cdc.gov/pcd/issues/2017/17_0017.htm
14. PHNCI. (2020). Foundational public health services: Building a strong foundation of public health infrastructure.
https://phnci.org/national-frameworks/fphs
15. PHNCI - Public Health National Center for Innovations. (2018). The 21st Century Learning Community: Transforming public health in three states, lessons for the nation. https://phnci.org/uploads/resource-files/Transforming-Public-Health-in-Three-States-Lessons-for-the-Nation.pdf
16. Indiana Department of Health (2020). Local health department information. Local Health Department Outreach. https://www.in.gov/isdh/24822.htm
17. Indiana Code 16-20-2 (1993). Local Boards of Health. http://iga.in.gov/legislative/laws/2018/ic/titles/016/#16-20-2
18. Indiana Association of Local Boards of Health. (2011). Orientation Manual.
19. Mays, G.P., Mamaril, C.B., & Timsina, L.R. (2016). Preventable death rates fell where communities expanded population health activities through multisector networks. Health Affairs, 35(11), 2005-2013.
20. Brewster, A.L., Kunkel, S., Straker, J., & Curry, L.A. (2018). Cross sectoral partnerships by area agencies on aging: Associations with health care use and spending. Health Affairs 37(1), 15–21.
21. Owsley, K. M., Hamer, M. K., & Mays, G. P. (2020). The growing divide in the composition of public health delivery systems in US rural and urban communities, 2014-2018. American Journal of Public Health, 110(S2), S204–S210.
22. Sellers, K. Leider, J.P., Gould, E., Castrucci, B.C., Beck, A., Bogaert, K., Coronado, F., Shah, G., Yeager, V., Beitsch, L.M., & Erwin, P.C. (2019, May). The state of the US governmental public health workforce, 2014-2017. American Journal of Public Health, 109(5), 674-680.
23. TFAH. (2016, April). Investing in America’s Health: A state-by-state look at public health funding and key health facts. https://www.tfah.org/wp-content/uploads/archive/assets/files/TFAH-2016-InvestInAmericaRpt-FINAL%20REVISED.pdf
24. TFAH. (2017, April). A funding crisis for public health and safety: state-by-state public health funding and key health facts, 2017. https://www.tfah.org/report-details/a-funding-crisis-for-public-health-and-safety-state-by-state-public-health-funding-and-key-health-facts-2017/
25. CDC. (2016). Funding – appropriations/grants total per capita. [map]. State Tobacco Activities Tracking and Evaluation (STATE) System. https://www.cdc.gov/statesystem/appropriations.html
26. TFAH. (2019, February). Ready or not: Protecting the public’s health from diseases, disasters, and bioterrorism, 2019. https://www.tfah.org/report-details/ready-or-not-protecting-the-publics-health-from-diseases-disasters-and-bioterrorism-2019/
27. TFAH. (2019, February). Promoting health and cost control
REFERENCES

75 IU Richard M. Fairbanks School of Public Health
in states: How states can improve community health & well-being through policy change. https://www.tfah.org/report-details/promoting-health-and-cost-control-in-states/
28. McCann, A. (2020, September 14). States that vaccinate the most. WalletHub. https://wallethub.com/edu/states-that-vaccinate-the-most/66237
29. NACCHO. (2019). 2019 National profile of local health departments. https://www.naccho.org/uploads/downloadable-resources/Programs/Public-Health-Infrastructure/NACCHO_2019_Profile_final.pdf
30. Indiana Code 16-46-10 (1993). Local Health Maintenance Fund. http://iga.in.gov/legislative/laws/2018/ic/titles/016/#16-46-10
31. Indiana Code 4-12-7 (2000). Indiana Local Health Department Trust Account. http://iga.in.gov/legislative/laws/2018/ic/titles/004#4-12-7
32. CDC. (2018). Behavioral Risk Factor Surveillance System. https://www.cdc.gov/brfss/annual_data/annual_2018.html
33. CDC. (2019). Behavioral Risk Factor Surveillance System. https://www.cdc.gov/brfss/annual_data/annual_2019.html
34. March of Dimes. (2019). 2019 March of Dimes report card. https://www.marchofdimes.org/mission/reportcard.aspx
35. Kaiser Family Foundation. (2020). Actual tobacco settlement payments received by the States (in millions). State Health Facts. https://www.kff.org/health-costs/state-indicator/tobacco-settlement-payments/?currentTimeframe=0&sortModel=%7B”colId”:”Location”,”sort”:”asc”%7D
36. United Health Foundation. (2018). America’s health rankings: Annual report 2018. https://assets.americashealthrankings.org/app/uploads/2018ahrannual_020419.pdf
37. U.S. News & World Report. (2017). Public health rankings. https://www.usnews.com/news/best-states/rankings/health-care/public-health
38. Kaiser Family Foundation. (2017). American Hospital Association Annual Survey. https://www.ahadata.com/aha-dataquery
39. Mosley, D. & DeBehnke, D. (2109, February). Rural hospital sustainability: New data show worsening situation for rural hospitals, residents. Navigant. https://cqrcengage.com/ancor/file/X09PcoJsPrh/Navigant_Rural_Hospitals_Report_2019.pdf
40. Association of American Medical Colleges. (2019, November). 2019 State physician workforce data report. https://www.aamc.org/data-reports/workforce/report/state-physician-workforce-data-report
41. CDC. (2018). National Health Interview Survey Early Release Program, 2018. https://www.cdc.gov/nchs/nhis/releases/released201905.htm
42. Fronstin, P. (2019, August 1). Self-insured health plans: Recent trends by firm size, 1996-2018. Employee Benefit Research Institute Issue Brief No. 488. https://www.ebri.org/docs/default-source/ebri-issue-brief/ebri_ib_488_selfinsur-1aug19.pdf?sfvrsn=bd7e3c2f_6
43. State Health Access Data Assistance Center (2018). Employer-sponsored health insurance at the state level, 2013-2017. https://www.shadac.org/publications/employer-sponsored-health-insurance-state-level-2013-2017-chartbook-and-state-factref
44. Bryan, B. (2017, September 20). New study shows the Republican healthcare bill would leave up to 18 million more without insurance by 2019. Business Insider. https://www.businessinsider.com/graham-cassidy-health-care-bill-how-many-lose-insurance-coverage-2017-9
45. Lassman, D., Sisko, A.M., Catlin, A., Barron, M.C., Benson, J., Cuckler, G.A., Hartman, M., Martin, A.B., & Whittle, L. (2017, July). Health spending by state 1991-2014: Measuring per capita spending by payers and programs. Health Affairs 36(7), 1318-1327.
46. Sauter, M.B. (2018, August 20). What state spends the most on its residents’ health care? USA Today. https://www.usatoday.com/story/money/economy/2018/08/20/what-your-state-spends-health-care-per-capita/37121541/
47. American Medical Association. (2020). Competition in health insurance: A comprehensive study of U.S. markets. https://www.ama-assn.org/system/files/2020-10/competition-health-insurance-us-markets.pdf
48. Health Care Cost Institute (2019). Healthy Market Place Index. https://healthcostinstitute.org/hcci-originals/healthy-marketplace-index/hmi
49. ASTHO (2019). Profile of state and territorial public health: Individual agency profiles. [dashboard]. https://www.astho.org/profile/
50. Baker Jr. E.L., Potter, M.A., Jones, D.L., Mercer, S.L., Cioffi, J.P., Green, L.W., Halverson, P.K., Lichtveld, M.Y., & Fleming, D.W. (2005). The public health infrastructure and our nation’s health. Annual Review of Public Health, 26, 303-318.
51. Hyde, J.K., & Shortell, S.M. (2012). The structure and organization of local and state public health agencies in the U.S.: a systematic review. American Journal of Preventive Medicine, 42(5 Suppl 1), S29–S41.
52. Beitsch, L.M., Grigg, M., Menachemi, N., & Brooks, R.G. (2006). Roles of local public health agencies within the state public health system. Journal of Public Health Management and Practice, 12(3), 232-241.
53. Richards, T.B., Rogers, J.J., Christenson, G.M., Miller, C.A., Taylor, M.S., & Cooper, A.D. (1995). Evaluating local public health performance at a community level on a statewide basis. Journal of Public Health Management and Practice, 1(4), 70–83.
54. Suen, J., Christenson, G.M., Cooper, A., & Taylor, M. (1995). Analysis of the current status of public health practice in local health departments. American Journal of Preventive Medicine, 11(6 Suppl), 51–54.
55. Mays, G.P., McHugh, M.C., Shim, K., Perry, N., Lenaway, D., Halverson, P.K., & Moonesinghe, R. (2006). Institutional and economic determinants of public health system performance. American Journal of Public Health, 96(3), 523-531.
R E F E R E N C E S

76 IU Richard M. Fairbanks School of Public Health
R E F E R E N C E S
56. Mays, G.P., Halverson, P.K., Baker, E.L., Stevens, R., & Vann, J.J. (2004). Availability and perceived effectiveness of public health activities in the nation’s most populous communities. American Journal of Public Health, 94(6), 1019-1026.
57. Brownson, R.C., Reis, R.S., Allen, P., Duggan, K., Fields, R., Stamatakis, K.A., & Erwin, P.C. (2014). Understanding administrative evidence-based practices: Findings from a survey of local health department leaders. American Journal of Preventive Medicine, 46(1), 49-57.
58. Hays, S.P., Toth, J., Poes, M.J., Mulhall, P.F., Remmert, D.M., & O’Rourke, T.W. (2012). Public health governance and population health outcomes. Frontiers in Public Health Services and Systems Research, 1(1), 4.
59. Scutchfield, F.D., Knight, E.A., Kelly, A.V., Bhandari, M.W., & Vasilescu, I.P. (2004). Local public health agency capacity and its relationship to public health system performance. Journal of Public Health Management and Practice, 10(3), 204–215.
60. Bhandari, M.W., Scutchfield, F.D., Charnigo, R., Riddell, M.C., & Mays, G.P. (2010). New data, same story? Revisiting studies on the relationship of local public health systems characteristics to public health performance. Journal of Public Health Management and Practice, 16(2), 110-117.
61. Mays, G.P., Scutchfield, F.D., Bhandari, M.W., & Smith, S.A. (2010). Understanding the organization of public health delivery systems: An empirical typology. The Milbank Quarterly, 88(1), 81-111.
62. Koh, H.K., Shei, A., Judge, C.M., Stoto, M.A., Elqura, L.J., Cox, H., Gilbert, N., Burstein, J.L., & Condon, S.K. (2008). Emergency preparedness as a catalyst for regionalizing local public health: The Massachusetts case study. Public Health Reports, 123(4), 1-10.
63. Koh, H.K., Elqura, L.J., Judge, C.M., & Stoto, M.A. (2008). Regionalization of local public health systems in the era of preparedness. Annual Review of Public Health, 29, 205-218.
64. Shah, G.H., Badana, A.N., Robb, C., & Livingood, W. C. (2016). Cross-jurisdictional resource sharing in changing public health landscape: Contributory factors and theoretical explanations. Journal of Public Health Management and Practice, 22(2), 110-119.
65. Humphries, D. L., Hyde, J., Hahn, E., Atherly, A., O’Keefe, E., Wilkinson, G., Eckhouse, S., Huleatt, S., Wong, S., & Kertanis, J. (2018). Cross-jurisdictional resource sharing in local health departments: Implications for services, quality, and cost. Frontiers in Public Health, 6, 115.
66. Wetta-Hall, R., Berg-Copas, G.M., Ablah, E., Herrmann, M.B., Kang, S., Orr, S., & Molgaard, C. (2007). Regionalization: Collateral benefits of emergency preparedness activities. Journal of Public Health Management and Practice, 13(5), 469-475.
67. Hoornbeek, J., Morris, M.E., Stefanak, M., Filla, J., Prodhan, R., & Smith, S.A. (2015). The impacts of local health department consolidation on public health expenditures: Evidence from Ohio. American Journal of Public Health, 105(S2), S174-S180.
68. Stoto, M.A., & Morse, L. (2008). Regionalization in local public health systems: Public health preparedness in the Washington metropolitan area. Public Health Reports, 123(4), 461-473.
69. Felton, J., & Golbeck, A.L. (2011). Interjurisdictional collaboration: Local public health officials versus county commissioners. Journal of Public Health Management and Practice, 17(1), E14-E21.
70. Chen, L.W., Jacobson, J., Roberts, S., & Palm, D. (2012). Resource allocation and funding challenges for regional local health departments in Nebraska. Journal of Public Health Management and Practice, 18(2), 141-147.
71. CDC. (1993). The public health system. https://www.cdc.gov/publichealthgateway/publichealthservices/originalessentialhealthservices.html
72. PHAB. (2013, December). Public Health Accreditation Board standards and measures. https://phaboard.org/wp-content/uploads/PHABSM_WEB_LR1-1.pdf
73. Robert Wood Johnson Foundation. (n.d.). Building a Culture of Health. https://www.rwjf.org/en/how-we-work/building-a-culture-of-health.html
74. Yeager, V., Beitsch, L., Kronstadt, J., & Balio, C.P. (2019, November). Accreditation and workforce satisfaction, retention, and training needs in public health agencies. American Public Health Association 2019 Annual Meeting and Expo, Philadelphia, PA.
75. ASTHO - Association of State and Territorial Health Officials. (2017, April). Accreditation leadership guide: Health department accreditation: A guide and perspectives from leaders to their peers. https://www.astho.org/Accreditation-and-Performance/ASTHO-Accreditation-Leadership-Guide/
76. Kittle, A., & Liss-Levinson, R. (2018). State health agencies’ perceptions of the benefits of accreditation. Journal of Public Health Management and Practice, 24 Suppl 3, S98–S101.
77. Meit, M., Siegfried A., Heffernan M., Kennedy M. (2020). Assessing outcomes from public health accreditation. University of Chicago: NORC. https://phaboard.org/wp-content/uploads/NORC_slides-for-web-April-2020.pdf
78. Beitsch, L.M., Carretta, H., McKeever, J., Pattnaik, A., & Gillen, S. (2013). The quantitative story behind the quality improvement storyboards: A synthesis of quality improvement projects conducted by the multi-state learning collaborative. Journal of Public Health Management and Practice, 19(4), 330-340.
79. CDC. (2017). Advancing public health: The story of the National Public Health Improvement Initiative. https://www.cdc.gov/publichealthgateway/docs/nphii/Compendium.pdf
80. McLees, A.W., Thomas, C.W., Nawaz, S., Young, A.C., Rider, N., & Davis, M. (2014). Advances in public health accreditation readiness and quality improvement: Evaluation findings from the National Public Health Improvement Initiative. Journal of Public Health Management and Practice, 20(1), 29.
R E F E R E N C E S

77 IU Richard M. Fairbanks School of Public Health
81. Riley, W., Lownik, B., Halverson, P., Parrotta, C., Godsall, J.R., Gyllstrom, E., Gearin, K.J., & Mays, G. (2012). Developing a taxonomy for the science of improvement in public health. Journal of Public Health Management and Practice, 18(6), 506-514.
82. Siegfried, A., Heffernan, M., Kennedy, M., & Meit, M. (2018). Quality improvement and performance management benefits of public health accreditation: National evaluation findings. Journal of Public Health Management and Practice, 24(1), S3-S9.
83. Kronstadt, J., Meit, M., Siegfried, A., Nicolaus, T., Bender, K., & Corso, L. (2016). Evaluating the impact of national public health department accreditation—United States, 2016. Morbidity and Mortality Weekly Report, 65(31), 803-806.
84. Crawley-Stout, L.A., Ward, K.A., See, C.H., & Randolph, G. (2016). Lessons learned from measuring return on investment in public health quality improvement initiatives. Journal of Public Health Management and Practice, 22(2), E28-E37.
85. Ingram, R.C., Mays, G.P., & Kussainov, N. (2018). Changes in local public health system performance before and after attainment of national accreditation standards. Journal of Public Health Management and Practice, 24(1), S25-S34.
86. Ishcomer, J., Noël, W.H., & Coffman, J. (2018). Public health accreditation and collaborative partnerships. Journal of Public Health Management and Practice, 24, S51-S54.
87. Cain, K.L., & Collins, R.P. (2018). Using quality improvement to improve internal and external coordination and referrals. Journal of Public Health Management and Practice, 24, S69-S71.
88. Tilgner, S., Himes, L., Allan, T., Wasowski, K., Bickford, B., & Burden, W. (2018). Ohio statewide efforts to align public health/health care population health planning. Journal of Public Health Management and Practice, 24, S66-S68.
89. Singh, S.R., & Carlton, E.L. (2017). Exploring the link between completion of accreditation prerequisites and local health departments’ decision to collaborate with tax-exempt hospitals around the community health assessment. Journal of Public Health Management and Practice, 23(2), 138-147.
90. Wilson, K.D., Mohr, L.B., Beatty, K.E., & Ciecior, A. (2014). Describing the continuum of collaboration among local health departments with hospitals around the community health assessments. Journal of Public Health Management and Practice, 20(6), 617-625.
91. Mays, G.P. (2016, October 12). Aligning systems and sectors to improve population health: Emerging findings and remaining uncertainties [Presentation]. New York Academy of Medicine, New York City, NY. https://works.bepress.com/glen_mays/265/
92. Varda, D., Shoup, J.A., & Miller, S. (2012). A systematic review of collaboration and network research in the public affairs literature: Implications for public health practice and research. American Journal of Public Health, 102(3), 564-571.
93. DeSalvo, K.B., & Wang, Y.C. (2018). Public health 3.0:
Supporting local public health in addressing behavioral health. American Journal of Public Health, 108(10), 1279-1280.
94. Nicolaus, T. (2018). Perspectives on the impact of accreditation on the work of governing boards. Journal of Public Health Management and Practice, 24, S89-S91.
95. Shah, G.H., Corso, L., Sotnikov, S., & Leep, C.J. (2019). Impact of local boards of health on local health department accreditation, community health assessment, community health improvement planning, and strategic planning. Journal of Public Health Management and Practice, 25(5), 423-430.
96. Erwin, P.C., Padek, M.M., Allen, P., Smith, R., & Brownson, R.C. (2020). Research full report: The association between evidence-based decision making and accreditation of state health departments. Journal of Public Health Management and Practice, 26(5), 419.
97. Bialek, R. (2018). From talk to action: The impact of public health department accreditation on workforce development. Journal of Public Health Management and Practice, 24, S80-S82.
98. Dunn, K. (2018). Do Accredited state health agency public health workforce development plans align with the public health workforce interests and needs survey?. Journal of Public Health Management and Practice, 24, S83-S85.
99. Grimm, B.L., Brandert, K., Palm, D., & Svoboda, C. (2017). The EDIC method: An engaging and comprehensive approach for creating health department workforce development plans. Health Promotion Practice, 18(5), 688-695.
100. Harper, E., Castrucci, B.C., Bharthapudi, K., & Sellers, K. (2015). Job satisfaction: A critical, understudied facet of workforce development in public health. Journal of Public Health Management and Practice, 21(Suppl 6), S46.
101. Pourshaban, D., Basurto-Dávila, R., & Shih, M. (2015). Building and sustaining strong public health agencies: Determinants of workforce turnover. Journal of Public Health Management and Practice, 21, S80-S90.
102. Walker, C. (2014). Cabarrus Health Alliance: Experiences with state and national accreditation. Journal of Public Health Management and Practice, 20(1), 79-81.
103. Marone, K.P., Joly, B.M., Birkhimer, N., Ricker, V.J., & Riley, B. (2014). Maine center for disease control and prevention: Accreditation readiness review. Journal of Public Health Management and Practice, 20(1), 76-78.
104. Ye, J., Verma, P., Leep, C., & Kronstadt, J. (2018). Public health employees’ perception of workplace environment and job satisfaction: The role of local health departments’ engagement in accreditation. Journal of Public Health Management and Practice, 24(1), S72-S79.
105. Kornfeld, J., Sznol, J., & Lee, D. (2015). Characterizing the business skills of the public health workforce: Practical implications from the Public Health Workforce Interests and Needs Survey (PH WINS). Journal of Public Health Management and Practice, 21, S159-S167.
R E F E R E N C E S
R E F E R E N C E S

78 IU Richard M. Fairbanks School of Public Health
106. Rabarison, K.M., Timsina, L., & Mays, G.P. (2015). Community health assessment and improved public health decision-making: A propensity score matching approach. American Journal of Public Health, 105(12), 2526-2533.
107. Reed, J.F., & Fleming, E. (2014). Using community health needs assessments to improve population health. North Carolina Medical Journal, 75(6), 403-406.
108. CDC. (2019). National voluntary accreditation for public health departments: CDC’s role in accreditation. https://www.cdc.gov/publichealthgateway/accreditation/cdc_role.html
109. PHAB. (2017, June). Public health agency accreditation system logic model. https://phaboard.org/wp-content/uploads/2019/01/Accreditation-LogicModel-201706.pdf
110. Allen, P., Mazzucca, S., Parks, R.G., Robinson, M., Tabak, R.G., & Brownson, R. (2019). Local health department accreditation is associated with organizational supports for evidence-based decision making. Frontiers in Public Health, 7.
111. ASTHO. (2018, November). Health equity and public health department accreditation. https://www.astho.org/ASTHOReports/Health-Equity-and-Public-Health-Dept-Accreditation/11-07-18/
112. Philip, C., Wells, K. T., Eggert, R., Elmore, J., Jean, R., Johnson, J., Lane, J., Lopez, X., Rivera, L., Samir, E., Strokin, N., Villalta, Y., & Ynestroza, R. (2018). Accreditation’s role in bolstering resilience in the face of the zika virus outbreak. Journal of Public Health Management and Practice, 24(1), S92-S94.
113. Davis M.V., Wood B., Mays G.P., Wayne J., Marti C., & Bellamy J (2012, February). Local public health department accreditation associated with preparedness response. North Carolina Preparedness and Emergency Response Research Center. https://sph.unc.edu/files/2015/07/nciph-perrc-accred-prep.pdf
114. Davis, M.V., Bevc, C.A., & Schenck, A.P. (2014). Declining trends in local health department preparedness capacities. American Journal of Public Health, 104(11), 2233-2238.
115. Yeager, V.A., Leider, J.P., Saari, C.K., & Kronstadt, J. (2020). Supporting Increased Local Health Department Accreditation: Qualitative Insights From Accredited Small Local Health Departments. Journal of Public Health Management and Practice, Advance online publication. https://doi.org/10.1097/PHH.0000000000001251.
116. Meit, M., Siegfried, A., Heffernan, M., Kennedy, M., & Nadel, T. (2017). Evaluation of short-term outcomes from public health accreditation. University of Chicago: NORC. https://www.norc.org/Research/Projects/Pages/evaluation-of-short-term-outcomes-from-public-health-accreditation.aspx
117. Yeager, V.A., Ye, J., Kronstadt, J., Robin, N., Leep, C.J., & Beitsch, L.M. (2016). National Voluntary Public Health Accreditation: Are More Local Health Departments Intending to Take Part?. Journal of Public Health Management and Practice, 22(2), 149–156.
118. Harris, J. K., Beatty, K., Leider, J. P., Knudson, A., Anderson,
B. L., & Meit, M. (2016). The Double Disparity Facing Rural Local Health Departments. Annual review of public health, 37, 167–184.
119. Shah, G. H., Leep, C. J., Ye, J., Sellers, K., Liss-Levinson, R., & Williams, K. S. (2015). Public Health Agencies’ level of engagement in and perceived barriers to PHAB National Voluntary Accreditation. Journal of Public Health Management and Practice, 21(2), 107–115.
120. Beatty, K.E., Erwin, P.C., Brownson, R.C., Meit, M., & Fey, J. (2018). Public health agency accreditation among rural local health departments: Influencers and barriers. Journal of Public Health Management and Practice, 24(1), 49–56.
121. Tracking changes in the public health system: What researchers need to know to monitor and evaluate these changes. (1996). Issue brief (Center for Studying Health System Change), (2), 1–8.
122. Kaluzny, A.B., Halverson, P.K., Miller, C.A., Kaluzny, A.D., Fried, BJ., Schenck, S.E., & Richards, T. B. (1996). Performing public health functions: The perceived contribution of public health and other community agencies. Journal of Health and Human Services Administration, 288-303.
123. Wall, S. (1998). Transformations in public health systems: States’ public health systems provide a window through which to observe the rapidly shifting relationships among states, local governments, and private agencies. Health Affairs, 17(3), 64-80.
124. Olson, M. (2009). The logic of collective action: Public goods and the theory of groups, second printing with a new preface and appendix (Vol. 124). Harvard University Press.
125. Lorange, P., & Roos, J. (1993). Strategic alliances: Formation, implementation, and evolution. Blackwell.
126. Ring, P.S., & Van de Ven, A.H. (1994). Developmental processes of cooperative interorganizational relationships. Academy of Management Review, 19(1), 90-118.
127. Mays, G.P., Smith, S.A., Ingram, R.C., Racster, L.J., Lamberth, C.D., & Lovely, E.S. (2009). Public health delivery systems: Evidence, uncertainty, and emerging research needs. American Journal of Preventive Medicine, 36(3), 256-265.
128. Mays, G.P., & Scutchfield, F.D. (2010). Improving public health system performance through multiorganizational partnerships. Preventing Chronic Disease, 7(6).
129. Halverson, P.K., Mays, G.P., & Kaluzny, A. D. (2000). Working together? Organizational and market determinants of collaboration between public health and medical care providers. American Journal of Public Health, 90(12), 1913.
130. Lurie, N., Somers, S.A, Fremont, A., Angeles, J., Murphy, E.K., & Hamblin, A. (2008). Challenges to using a business case for addressing health disparities. Health Affairs (Project Hope), 27(2), 334-338.
131. Pennel, C.L., McLeroy, K.R., Burdine, J.N., Matarrita-Cascante, D., & Wang, J. (2016). Community health needs assessment: Potential for population health improvement. Population Health Management, 19(3), 178-186.
R E F E R E N C E S

79 IU Richard M. Fairbanks School of Public Health
132. Yeager, V.A., Ferdinand, A.O., & Menachemi, N. (2019). The impact of IRS tax policy on hospital community benefit activities. Medical Care Research and Review, 76(2), 167-183.
133. Beatty, K. E., Wilson, K. D., Ciecior, A., & Stringer, L. (2015). Collaboration among Missouri nonprofit hospitals and local health departments: Content analysis of community health needs assessments. American Journal of Public Health, 105 Suppl 2, S337–S344.
134. Hogg, R.A., Mays, G.P., & Mamaril, C.B. (2015). Hospital contributions to the delivery of public health activities in US metropolitan areas: National and longitudinal trends. American Journal of Public Health, 105(8), 1646-1652.
135. Laymon, B., Shah, G., Leep, C.J., Elligers, J.J., & Kumar, V. (2015). The proof’s in the partnerships: Are affordable care act and local health department accreditation practices influencing collaborative partnerships in community health assessment and improvement planning?. Journal of Public Health Management and Practice, 21(1), 12-17.
136. Kirk, C. M., Johnson-Hakim, S., Anglin, A., & Connelly, C. (2017). Putting the community back into community health needs assessments: Maximizing partnerships via community-based participatory research. Progress in Community Health Partnerships: Research, Education, and Action, 11(2), 167-173.
137. Hogg, R.A., & Varda, D. (2016). Insights into collaborative networks of nonprofit, private, and public organizations that address complex health issues. Health Affairs, 35(11), 2014-2019.
138. Baker, E.L., Melton, R.J., Stange, P.V., Fields, M.L., Koplan, J.P., Guerra, F.A., & Satcher, D. (1994). Health reform and the health of the public: Forging community health partnerships. JAMA, 272(16), 1276-1282.
139. Lasker, R.D., Weiss, E.S., & Miller, R. (2001). Partnership synergy: A practical framework for studying and strengthening the collaborative advantage. The Milbank Quarterly, 79(2), 179-205.
140. IOM. (1996). Healthy communities: New partnerships for the future of public health. Washington, DC: National Academies Press. https://www.nap.edu/read/5475/chapter/1
141. Prybil, L., Scutchfield, F.D., Killian, R., Kelly, A., Mays, G.P., Carman, A., Levey, S., McGeorge, A., & Fardo, D.W. (2014). Improving community health through hospital-public health collaboration: Insights and lessons learned from successful partnerships. Health Management and Policy Faculty Book Gallery. 2. https://uknowledge.uky.edu/hsm_book/2
142. Ferrer, R. L., Gonzalez Schlenker, C., Lozano Romero, R., Poursani, R., Bazaldua, O., Davidson, D., Ann Gonzales, M., Dehoyos, J., Castilla, M., Corona, B. A., Tysinger, J., Alsip, B., Trejo, J., & Jaén, C. R. (2013). Advanced primary care in San Antonio: Linking practice and community strategies to improve health. The Journal of the American Board of Family Medicine, 26(3), 288-298.
143. Hamer, M.K., & Mays, G.P. (2020). Public health systems and social services: Breadth and depth of cross-sector
collaboration. American Journal of Public Health, 110(52 Suppl 2), S232-S234.
144. Lindau, S. T., Makelarski, J., Abramsohn, E., Beiser, D. G., Escamilla, V., Jerome, J., Johnson, D., Kho, A. N., Lee, K. K., Long, T., & Miller, D. C. (2016). CommunityRx: A population health improvement innovation that connects clinics to communities. Health Affairs, 35(11), 2020-2029.
145. Morgan, A.U., Dupuis, R., D’Alonzo, B., Johnson, A., Graves, A., Brooks, K.L., McClintock, A., Klusaritz, H., Long, J.A., Grande, D. & Cannuscuio, C.C. (2016). Beyond books: Public libraries as partners for population health. Health Affairs, 35(11), 2030-2036.
146. Fawcett, S.B., Lewis, R.K., Paine-Andrews, A., Francisco, V.T., Richter, K.P., Williams, E.L., & Copple, B. (1997). Evaluating community coalitions for prevention of substance abuse: The case of Project Freedom. Health Education & Behavior: The Official Publication of the Society for Public Health Education, 24(6), 812–828.
147. Roussos, S.T., & Fawcett, S.B. (2000). A review of collaborative partnerships as a strategy for improving community health. Annual Review of Public Health, 21(1), 369-402.
148. Economos, C.D., Hyatt, R.R., Goldberg, J.P., Must, A., Naumova, E.N., Collins, J.J., & Nelson, M. E. (2007). A community intervention reduces BMI z‐score in children: Shape Up Somerville first year results. Obesity, 15(5), 1325-1336.
149. Michael, Y.L., Farquhar, S.A., Wiggins, N., & Green, M.K. (2008). Findings from a community-based participatory prevention research intervention designed to increase social capital in Latino and African American communities. Journal of Immigrant and Minority Health, 10(3), 281-289.
150. Plough, A., & Olafson, F. (1994). Implementing the Boston Healthy Start Initiative: A case study of community empowerment and public health. Health Education Quarterly, 21(2), 221-234.
151. Paine-Andrews, A., Harris, K.J., Fisher, J.L., Lewis, R.K., Williams, E.L., Fawcett, S. B., & Vincent, M. L. (1999). Effects of a replication of a multicomponent model for preventing adolescent pregnancy in three Kansas communities. Family Planning Perspectives, 182-189.
152. The Council on Linkages Between Academia and Public Health Practice. (2011). Academic health departments: Core concepts. http://www.phf.org/resourcestools/Documents/AHD_Concepts_2011Jan14.pdf
153. Neri, E. M., Ballman, M. R., Lu, H., Greenlund, K. J., & Grunbaum, J. A. (2014). Academic-health department collaborative relationships are reciprocal and strengthen public health practice: Results from a study of academic research centers. Journal of Public Health Management and Practice, 20(3), 342-348.
154. Keck, C. W. (2000). Lessons learned from an academic health department. Journal of Public Health Management and Practice, 6(1), 47-52.
155. Livingood, W. C., Goldhagen, J., Bryant III, T., Winterbauer, N., & Woodhouse, L. D. (2007). A community-centered
R E F E R E N C E S

80 IU Richard M. Fairbanks School of Public Health
R E F E R E N C E S
model of the academic health department and implications for assessment. Journal of Public Health Management and Practice, 13(6), 662-669.
156. Livingood, W. C., Goldhagen, J., Little, W. L., Gornto, J., & Hou, T. (2007). Assessing the status of partnerships between academic institutions and public health agencies. American Journal of Public Health, 97(4), 659-666.
157. Erwin, P. C., Parks, R. G., Mazzucca, S., Allen, P., Baker, E. A., Hu, H., Davis-Joyce, J., & Brownson, R. C. (2019). Evidence-based public health provided through local health departments: Importance of academic– practice partnerships. American Journal of Public Health, 109(5), 739-747.
158. Swain, G. R., Bennett, N., Etkind, P., & Ransom, J. (2006). Local health department and academic partnerships: Education beyond the ivy walls. Journal of Public Health Management and Practice, 12(1), 33-36.
159. Butterfoss, F.D., & Kegler, M.C. (2009). The community coalition action theory. Emerging Theories in Health Promotion Practice and Research, 2, 237-276.
160. Levin, B.W., & Fleischman, A.R. (2002). Public health and bioethics: The benefits of collaboration. American Journal of Public Health, 92(2), 165-167.
161. Valente, T.W., Chou, C.P., & Pentz, M.A. (2007). Community coalitions as a system: Effects of network change on adoption of evidence-based substance abuse prevention. American Journal of Public Health, 97(5), 880-886.
162. Mays, G.P., Halverson, P.K., & Kaluzny, A. D. (1998). Collaboration to improve community health: Trends and alternative models. The Joint Commission Journal on Quality Improvement, 24(10), 518-540.
163. Zahner, S.J. (2005). Local public health system partnerships. Public Health Reports, 120(1), 76-83.
164. Cohen, J.T., Neumann, P.J., & Weinstein, M.C. (2008). Does preventive care save money? Health economics and the presidential candidates. New England Journal of Medicine, 358(7), 661-663.
165. Russell, L.B. (2009). Preventing chronic disease: An important investment, but don’t count on cost savings. Health Affairs, 28(1), 42-45.
166. Dranove, D., & Satterthwaite, M.A. (2000). The industrial organization of health care markets. Handbook of Health Economics, 1, 1093- 1139.
167. Mays, G.P., Halverson, P.K., Kaluzny, A.D., & Norton, E.C. (2000). How managed care plans contribute to public health practice. Inquiry, 389-410.
168. Lakdawalla, D., & Philipson, T. (2006). The nonprofit sector and industry performance. Journal of Public Economics, 90(8-9), 1681- 1698.
169. Carande-Kulis, V.G., Getzen, T.E., & Thacker, S.B. (2007). Public goods and externalities: A research agenda for public health economics. Journal of Public Health Management and Practice, 13(2), 227-232.
170. Siegal, G., Siegal, N., & Bonnie, R.J. (2009). An account
of collective actions in public health. American Journal of Public Health, 99(9), 1583-1587.
171. Nonprofit Finance Fund, Center for Health Care Strategies, & Alliance for Strong Families and Communities. (2017). Working together toward better health outcomes. Robert Wood Johnson Foundation. https://www.chcs.org/media/Working-Together-Toward-Better-Health-Outcomes.pdf
172. Brooks, R.G., Beitsch, L.M., Street, P., & Chukmaitov, A. (2009). Aligning public health financing with essential public health service functions and national public health performance standards. Journal of Public Health Management and Practice. 15(4), 299-306.
173. DeSalvo, K., Parekh, A., Hoagland, G.W., Dilley, A., Kaiman, S., Hines, M., & Levi, J. (2019). Developing a financing system to support public health infrastructure. American Journal of Public Health, 109(10), 1358-1361.
174. Mays, G.P., & Mamaril, C.B. (2017). Public health spending and Medicare resource use: A longitudinal analysis of us communities. Health Services Research, 52, 2357-2377.
175. Martin, A. B., Hartman, M., Washington, B., Catlin, A., & National Health Expenditure Accounts Team. (2017). National health spending: Faster growth in 2015 as coverage expands and utilization increases. Health Affairs, 36(1), 166-176.
176. Mays, G.P., & Smith, S.A. (2009). Geographic variation in public health spending: Correlates and consequences. Health Services Research, 44(5p2), 1796-1817.
177. Bernet, P.M. (2007). Local public health agency funding: Money begets money. Journal of Public Health Management and Practice, 13(2), 188-193.
178. Mays, G.P., McHugh, M.C., Shim, K., Lenaway, D., Halverson, P.K., Moonesinghe, R., & Honoré, P. (2004). Getting what you pay for: Public health spending and the performance of essential public health services. Journal of Public Health Management and Practice, 10(5), 435-443.
179. Erwin, P.C., Mays, G.P., & Riley, W.J. (2012). Resources that may matter: The impact of local health department expenditures on health status. Public Health Reports, 127(1), 89-95.
180. Mays, G.P., & Smith, S.A. (2011). Evidence links increases in public health spending to declines in preventable deaths. Health Affairs, 30(8), 1585-1593.
181. Brown, T.T., Martinez-Gutierrez, M.S., & Navab, B. (2014). The impact of changes in county public health expenditures on general health in the population. Health Economics Policy and Law, 9, 251.
182. Moore, J. D. (2014). Public Health. In Bluestein F. S., County and municipal government in North Carolina (2nd ed., pp. 639-663). UNC Chapel Hill School of Government. https://www.sog.unc.edu/sites/www.sog.unc.edu/files/course_materials/CMG%2038_PublicHealth_1.pdf
183. Thielen, L. (2004, October). Exploring public health experience with standards and accreditation. Robert Wood Johnson Foundation. https://www.cdc.gov/nceh/ehs/ephli/resources/exploring_public_health.pdf

81 IU Richard M. Fairbanks School of Public Health
R E F E R E N C E S
184. North Carolina Association of Local Health Directors (NCALHD) Public Health Task Force (2013, June). A blueprint of the future for local public health departments in North Carolina: 2013 statewide public health incubator summary report & recommendations. https://www.ncalhd.org/wp-content/uploads/2015/01/NCALHDBlueprint.pdf
185. Goon, A. (2018, October 29). Ohio’s public health in the 21st Century exploration of shared services: Summary report. https://phsharing.org/wp-content/uploads/2019/06/FPHS-Shared-Services-Survey.pdf
186. PHNCI. (2018, June 15). PHNCI FPHS 21st Century Learning Community Ohio case study: Final report. https://phnci.org/uploads/resource-files/PHNCI-21C-Learning-Community-Case-Study-Ohio.pdf
187. PHNCI. (2016, September). Transforming public health systems: Stories from 21st Century states. https://www.oregon.gov/oha/PH/ABOUT/Documents/phab/PHNCI-Stories-from-21st-Century-States.pdf
188. PHNCI. (2018, June 15). PHNCI FPHS 21st Century Learning Community Oregon case study: Final report. https://phnci.org/uploads/resource-files/PHNCI-21C-Learning-Community-Case-Study-Oregon.pdf
189. Oregon Health Authority (2018). Public health accountability metrics: Baseline report. https://www.oregon.gov/oha/PH/ABOUT/Documents/phab/Accountability-metrics-baseline-report.pdf
190. PHNCI. (2018, June 15). PHNCI FPHS 21st Century Learning Community Washington case study: Final report. https://phnci.org/uploads/resource-files/PHNCI-21C-Learning-Community-Case-Study-Washington.pdf
191. Washington State Association of Local Public Health Officials (2020). Policy. https://www.wsalpho.org/policy/
192. Courogen, M. (2018, September). Foundational public health services. Washington State Department of Health. https://www.doh.wa.gov/Portals/1/Documents/1200/2018%20FPHS%20Fact%20Sheet.pdf
193. Mays, G.P., Halverson, P.K., Riley, W. (2020). Estimating the health and economic effects of a statewide initiative to improve public health system capabilities. Manuscript submitted for publication.
194. World Health Organization. (2015). WHO report on the global tobacco epidemic 2015: Raising taxes on tobacco. https://www.who.int/tobacco/global_report/2015/en/
195. Michael, J. (2011). MinnesotaCare provider taxes. The Research Department of the Minnesota House of Representatives. https://www.house.leg.state.mn.us/hrd/pubs/ss/ssmcpt.pdf
196. Pacific Health Policy Group (PHPG). (2012). Health care-related tax study report. Department of Vermont Health Access. https://legislature.vermont.gov/Documents/2016/WorkGroups/House%20Health%20Care/Provider%20Taxes/W~Department%20of%20Vermont%20Health%20Access~Health%20Care-Related%20Tax%20Study%20Report%E2%80%94Provider%20Tax%20Report,%202012~1-28-2016.pdf
197. Hurty, J. N. (1933). The Fence or the Ambulance. American Journal of Public Health and the Nation’s Health, 23(8), 796.
198. Indiana Historical Bureau (1998, March). Public health in Indiana. The Indiana Historian: A Magazine Exploring Indiana History. https://www.in.gov/history/files/publichealth.pdf

82 IU Richard M. Fairbanks School of Public Health
The Public Health Accreditation Board (PHAB) was formed in 2007 as a national consensus-based entity to implement and oversee national public health department accreditation. The purpose of public health department accreditation is to promote high performance and continuous quality improvement; recognize high performers that meet nationally accepted standards of quality and improvement; illustrate health department accountability to the public and policymakers; increase the visibility and public awareness of governmental public health, leading to greater public trust and increased health department credibility, and ultimately a stronger constituency for public health funding and infrastructure; and clarify the public’s expectations of health departments.
Through input from various think tanks, workgroups, expert panels, and committees, PHAB established standards and measures which a health department (tribal, local, and state) must meet to be accredited. Initially launched in September 2011, the standards and measures were most recently updated to Version 1.5 in December 2013.
The standards are grouped into 12 domains. Domains 1 through 10 address the 10 Essential Public Health Services. Domain 11 addresses management and administration, and Domain 12 is about governance. A standard is the level of achievement that must be met by a health department. Each standard contains at least one measure, to evaluate if the standard was met (validated by required documentation).
Below is a summary of the 12 domains and their respective standards and measures. Full documentation is available for download as a pdf.72
Domain 1 includes 4 standards:
Standard 1.1: Participate in or lead a collaborative process resulting in a comprehensive community health assessment• Measure 1.1.1 S: A state partnership that develops a
comprehensive state community health assessment of the population of the state
• Measure 1.1.1 T/L: Tribal/local partnership that develops a comprehensive community health assessment of the population served by the health department
• Measure 1.1.2 S: A state level community health assessment
• Measure 1.1.2 T/L: A Tribal/local community health assessment
• Measure 1.1.3 A: Accessibility of community health assessment to agencies, organizations, and the general public
Standard 1.2: Collect and maintain reliable, comparable, and valid data that provide information on conditions of public health importance and on the health status of the population• Measure 1.2.1 A: 24/7 surveillance system or set of
program surveillance systems• Measure 1.2.2 A: Communication with surveillance
sites• Measure 1.2.3 A: Primary data
APPENDIX A: PUBLIC HEALTH ACCREDITATION BOARD (PHAB) STANDARDS AND MEASURES
APPENDIX A
Domain 1: Conduct and disseminate assessments focused on population health status and public health issues facing the community
Domain 1 focuses on the ongoing assessment of the health of the population served by the health department. This corresponds with the essential
public health service, “Assess and monitor population health status, factors that influence health, and community needs and assets”.
Features of Domain 1 can include:
• systematic monitoring of health status• collection, analysis, and dissemination of data• use of data to inform public health policies,
processes, and intervention• participation in a collaborative process for the
development of a shared, comprehensive health assessment of the community, its health challenges, and its resources.
A P P E N D I X B : N A T I O N A L L O N G I T U D I N A L
S U R V E Y O F P U B L I C H E A LT H S Y S T E M S
C A P A C I T Y A S S E S S M E N T Q U E S T I O N S

83 IU Richard M. Fairbanks School of Public Health
• Measure 1.2.4 S: Data provided to Tribal and local health departments located in the state
• Measure 1.2.4 L: Data provided to the state health department and Tribal health departments in the jurisdiction the local health department is authorized to serve
• Measure 1.2.4 T: Data provided to the state health department and to local health departments
Standard 1.3: Analyze public health data to identify trends in health problems, environmental public health hazards, and social and economic factors that affect the public’s health• Measure 1.3.1 A: Data analyzed and public health
conclusions drawn• Measure 1.3.2 S: Statewide public health data and their
analysis provided to various audiences on a variety of public health issues
• Measure 1.3.2 L: Public health data provided to various audiences on a variety of public health issues
• Measure 1.3.2 T: Public health data provided to the Tribal community on a variety of public health issues
Standard 1.4: Provide and use the results of health data analysis to develop recommendations regarding public health policy, processes, programs, or interventions• Measure 1.4.1 A: Data used to recommend and inform
public health policy, processes, programs, and/or interventions
• Measure 1.4.2 S: Statewide summaries or fact sheets of data to support health improvement planning processes at the state level
• Measure 1.4.2 T/L: Tribal/community summaries or fact sheets of data to support public health improvement planning processes at the Tribal or local level
• Measure 1.4.3 S: Support provided to Tribal and local health departments in the state concerning the development and use of summaries of community data
Domain 2 includes 4 standards:
Standard 2.1: Conduct timely investigations of health problems and environmental public health hazards • Measure 2.1.1 A: Protocols for investigation process• Measure 2.1.2 S: Capacity to conduct and/or support
investigations of infectious diseases simultaneously• Measure 2.1.2 T/L: Capacity to conduct an investigation
of an infectious disease• Measure 2.1.3 A: Capacity to conduct investigations of
non-infectious health problems, environmental, and/or occupational public health hazards
• Measure 2.1.4 A: Collaborative work through established governmental and community partnerships on investigations of reportable diseases, disease outbreaks, and environmental public health issues
• Measure 2.1.5 A: Monitored timely reporting of notifiable/reportable diseases, lab test results, and investigation results
• Measure 2.1.6 S: Consultation, technical assistance, and/or information provided to Tribal and local health departments in the state regarding the management of disease outbreaks and environmental public health hazards
Standard 2.2: Contain/mitigate health problems and environmental public health hazards • Measure 2.2.1 A: Protocols for containment/
mitigation of public health problems and
APPENDIX A: PUBLIC HEALTH ACCREDITATION BOARD (PHAB) STANDARDS AND MEASURES
Domain 2: Investigate health problems and environmental public health hazards to protect the community
Domain 2 focuses on the investigation of suspected
and identified health problems and environmental public health hazards. This corresponds with the essential public health service, “Investigate, diagnose, and address health problems and hazards affecting the population”.
Features of Domain 2 can include:
• Epidemiologic identification of emerging health problems
• monitoring of disease• availability of public health laboratories • containment and mitigation of outbreaks• coordinated response to emergency situations• communication
A P P E N D I X B : N A T I O N A L L O N G I T U D I N A L
S U R V E Y O F P U B L I C H E A LT H S Y S T E M S
C A P A C I T Y A S S E S S M E N T Q U E S T I O N S

84 IU Richard M. Fairbanks School of Public Health
environmental public health hazards• Measure 2.2.2 A: A process for determining when the
All Hazards Emergency Operations Plan (EOP) will be implemented
• Measure 2.2.3 A: Complete After Action Reports (AAR)
Standard 2.3: Ensure access to laboratory and epidemiologic/environmental public health expertise and capacity to investigate and contain/mitigate public health problems and environmental public health hazards• Measure 2.3.1 A: Provisions for the health department’s
24/7 emergency access to epidemiological and environmental public health resources capable of providing rapid detection, investigation, and containment/mitigation of public health problems and environmental public health hazards
• Measure 2.3.2 A: 24/7 access to laboratory resources capable of providing rapid detection, investigation and containment of health problems and environmental public health hazards
• Measure 2.3.3 A: Access to laboratory and other support personnel and infrastructure capable of providing surge capacity
• Measure 2.3.4 A: Collaboration among Tribal, state, and local health departments to build capacity and share resources to address Tribal, state, and local efforts to provide for rapid detection, investigation, and containment/ mitigation of public health problems and environmental public health hazards
Standard 2.4: Maintain a plan with policies and procedures for urgent and non-urgent communications• Measure 2.4.1 A: Written protocols for urgent 24/7
communications• Measure 2.4.2 A: A system to receive and provide
urgent and non-urgent health alerts and to coordinate an appropriate public health response
• Measure 2.4.3 A: Timely communication provided to the general public during public health emergencies
• Measure 2.4.4 S: Consultation and technical assistance provided to Tribal and local health departments on the accuracy and clarity of public health information associated with a public health emergency
Domain 3 includes 2 standards:
Standard 3.1: Provide health education and health promotion policies, programs, processes, and interventions to support prevention and wellness• Measure 3.1.1 A: Information provided to the public on
protecting their health • Measure 3.1.2 A: Health promotion strategies to mitigate
preventable health conditions• Measure 3.1.3 A: Efforts to specifically address factors
that contribute to specific populations’ higher health risks and poorer health outcomes
Standard 3.2: Provide information on public health issues and public health functions through multiple methods to a variety of audiences • Measure 3.2.1 A: Information on public health mission,
roles, processes, programs, and interventions to improve the public’s health provided to the public
• Measure 3.2.2 A: Organizational branding strategy• Measure 3.2.3 A: Communication procedures to provide
information outside the health department• Measure 3.2.4 A: Risk communication plan• Measure 3.2.5 A: Information available to the public
Domain 3: Inform and educate about public health issues and functions
Domain 3 focuses on informing and educating the public about the role of public health. This corresponds with the essential public health service, “Communicate effectively to inform and educate people about health, factors that influence it, and how to improve it”.
Features of Domain 3 can include:
• Processes for continuing two-way communication with the public as standard operating procedure
• Actionable messaging that is culturally appropriated and trusted, with accessible and easily understood language
• Building and maintaining a positive, trustworthy reputation with diverse communities
APPENDIX A: PUBLIC HEALTH ACCREDITATION BOARD (PHAB) STANDARDS AND MEASURES

85 IU Richard M. Fairbanks School of Public Health
through a variety of methods• Measure 3.2.6 A: Accessible, accurate, actionable, and
current information provided in culturally sensitive and linguistically appropriate formats for target populations served by the health department
Domain 4 includes 2 standards:
Standard 4.1: Engage with the public health system and the community in identifying and addressing health problems through collaborative processes• Measure 4.1.1 A: Establishment and/or engagement
and active participation in a comprehensive community health partnership and/or coalition; or active participation in several partnerships or coalitions to address specific public health issues or populations
• Measure 4.1.2 S: Technical assistance provided to Tribal and local health departments and/or public health
system partners regarding methods for engaging with the community
• Measure 4.1.2 T/L: Stakeholders and partners linked to technical assistance regarding methods of engaging with the community
Standard 4.2: Promote the community’s understanding of and support for policies and strategies that will improve the public’s health• Measure 4.2.1 A: Engagement with the community
about policies and/or strategies that will promote the public’s health
• Measure 4.2.2 A: Engagement with governing entities, advisory boards, and elected officials about policies and/or strategies that will promote the public’s health
Domain 5 includes 4 standards:
Standard 5.1: Serve as a primary and expert resource for establishing and maintaining public health policies, practices, and capacity• Measure 5.1.1 A: The monitoring and tracking of public
Domain 4: Engage with the community to identify and address health problems
Domain 4 focuses on the health department’s community engagement. This corresponds with the essential public health service, “Strengthen, support, and mobilize communities and partnerships to improve health”.
Features of Domain 4 can include:
• Aligning and coordinating efforts towards health promotion, disease prevention, and health equity across a wide range of partners
• Actionable messaging that is culturally appropriated and trusted, with accessible and easily understood language
• Building and maintaining a positive, trustworthy reputation with diverse communities
• Establishing and maintaining community partnerships and collaborations to facilitate public health goals being accomplished, promote community resilience, and advance the improvement of the public’s health
Domain 5: Develop Public Health Policies and Plans
Domain 5 focuses on developing public health policies and plans, which can serve to guide the work done by the health department while bringing structure and organization to the health department. This corresponds with the essential public health service, “Create, champion, and implement policies, plans, and laws that impact health”.
Features of Domain 5 can include developing policies and plans, used for the following:
• Bringing structure and organization to the department
• Serving as a resource to health department staff and the public
• Orienting and training staff• Informing the public and partners• Developing consistency in operations• Noting key areas for improvement
APPENDIX A: PUBLIC HEALTH ACCREDITATION BOARD (PHAB) STANDARDS AND MEASURES
86 IU Richard M. Fairbanks School of Public Health
health issues that are being discussed by individuals and entities that set policies and practices that impact on public health
• Measure 5.1.2 A: Engagement in activities that contribute to the development and/or modification of policy that impacts public health
• Measure 5.1.3 A: Informed governing entities, elected officials, and/or the public of potential intended or unintended public health impacts from current and/or proposed policies
Standard 5.2: Conduct a comprehensive planning process resulting in a tribal/state/community health improvement plan• Measure 5.2.1 S: A process to develop a state health
improvement plan• Measure 5.2.1 L: A process to develop a community
health improvement plan• Measure 5.2.1 T: A process to develop a Tribal community
health improvement plan• Measure 5.2.2 S: State health improvement plan
adopted as a result of the health improvement planning process
• Measure 5.2.2 L: Community health improvement plan adopted as a result of the community health improvement planning process
• Measure 5.2.2 T: Tribal community health improvement plan adopted as a result of the health improvement planning process
• Measure 5.2.3 A: Elements and strategies of the health improvement plan implemented in partnership with others
• Measure 5.2.4 A: Monitor and revise as needed, the strategies in the community health improvement plan in collaboration with broad participation from stakeholders and partners
Standard 5.3: Develop and implement a health department organizational strategic plan• Measure 5.3.1 A: Department strategic planning process• Measure 5.3.2 A: Adopted department strategic plan• Measure 5.3.3 A: Implemented department strategic
plan
Standard 5.4: Maintain an all hazards emergency operations plan• Measure 5.4.1 A: Process for the development and
maintenance of an All Hazards Emergency Operations
Plan (EOP)• Measure 5.4.2 A: Public health emergency operations
plan (EOP)• Measure 5.4.3 S: Consultation and/or technical
assistance provided to Tribal and local health departments in the state regarding evidence-based and/or promising practices/templates in EOP development and testing
Domain 6 includes 3 standards:
Standard 6.1: Review existing laws and work with governing entities and elected/appointed officials to update as needed• Measure 6.1.1 A: Laws reviewed in order to determine
the need for revisions• Measure 6.1.2 A: Information provided to the governing
entity and/or elected/appointed officials concerning needed updates/amendments to current laws and/or proposed new laws
Standard 6.2: Educate individuals and organizations
Domain 6: Enforce Public Health Laws
Domain 6 focuses on the role of public health departments in enforcement of public health related regulations, executive orders, statues, and other public health laws. These laws are important tools for health departments in their work of protecting and promoting public health. This corresponds with the essential public health service, “Utilize legal and regulatory actions designed to improve and protect the public’s health.”
Features of Domain 6 can include:
• Enforcing public health regulations, executive orders, statutes, etc.
• Promoting new laws and revisiting existing laws• Educating regulated entities about the meaning,
purpose, compliance requirements, and benefits of public health laws
• Educating the public about the benefits of public health laws, and the importance of compliance
APPENDIX A: PUBLIC HEALTH ACCREDITATION BOARD (PHAB) STANDARDS AND MEASURES

87 IU Richard M. Fairbanks School of Public Health
on the meaning, purpose, and benefit of public health laws and how to comply• Measure 6.2.1 A: Department knowledge maintained
and public health laws applied in a consistent manner• Measure 6.2.2 A: Laws and permit/license application
requirements are accessible to the public• Measure 6.2.3 A: Information or education provided
to regulated entities regarding their responsibilities and methods to achieve full compliance with public health related laws
Standard 6.3: Conduct and monitor public health enforcement activities and coordinate notification of violations among appropriate agencies• Measure 6.3.1 A: Written procedures and protocols for
conducting enforcement actions• Measure 6.3.2 A: Inspection activities of regulated
entities conducted and monitored according to mandated frequency and/or a risk analysis method that guides the frequency and scheduling of inspections of regulated entities
• Measure 6.3.3 A: Procedures and protocols followed for both routine and emergency situations requiring enforcement activities and complaint follow-up
• Measure 6.3.4 A: Patterns or trends identified in compliance from enforcement activities and complaints
• Measure 6.3.5 A: Coordinated notification of violations to the public, when required, and coordinated sharing of information among appropriate agencies about enforcement activities, follow-up activities, and trends or patterns
Domain 7 includes 2 standards:
Standard 7.1: Assess health care service capacity and access to health care services• Measure 7.1.1 A: Process to assess the availability of
health care services• Measure 7.1.2 A: Identification of populations who
experience barriers to health care services identified• Measure 7.1.3 A: Identification of gaps in access to
health care services and barriers to the receipt of health care services identified
Standard 7.2: Identify and implement strategies to improve access to health care services• Measure 7.2.1 A: Process to develop strategies to
improve access to health care services• Measure 7.2.2 A: Implemented strategies to increase
access to health care services• Measure 7.2.3 A: Implemented culturally competent
initiatives to increase access to health care services for those who may experience barriers to care due to cultural, language, or literacy differences
Domain 7: Promote Strategies to Improve Access to Health Care
Domain 7 focuses on the public’s access to needed health services. This corresponds with the essential public health service, “Assure an effective system that enables equitable access to the individual services and care needed to be healthy”.
Features of Domain 7 can include:
• Assessment of the population’s access to health services
• Promoting new laws and revisiting existing laws
Domain 8: Maintain a Competent Public Health Workforce
Domain 8 focuses on the need for a health department to strategically develop a competent public health workforce. This corresponds with the essential public health service, “Build and support a diverse and skilled public health workforce”.
Features of Domain 8 can include:
• Creating a multidisciplinary workforce, matched to the needs of the population being served
• Aligning workforce development with the health department’s mission and goals
• Developing strategies to acquire, develop, and retain staff
• Educating regulated entities about the meaning, purpose, compliance requirements, and benefits of public health laws
• Educating the public about the benefits of public health laws, and the importance of compliance
APPENDIX A: PUBLIC HEALTH ACCREDITATION BOARD (PHAB) STANDARDS AND MEASURES

88 IU Richard M. Fairbanks School of Public Health
Domain 8 includes 2 standards:
Standard 8.1: Encourage the development of a sufficient number of qualified public health workers• Measure 8.1.1 S: Relationship and collaboration with
educational programs that promote the development of future public health workers
• Measure 8.1.1 T/L: Relationships and/or collaborations that promote the development of future public health workers
Standard 8.2: Ensure a competent workforce through assessment of staff competencies, the provision of individual training and professional development, and the provision of a supportive work environment• Measure 8.2.1 A: Workforce development strategies• Measure 8.2.2 A: A competent health department
workforce• Measure 8.2.3 A: Professional and career development
for all staff• Measure 8.2.4 A: Work environment that is supportive
to the workforce• Measure 8.2.5 S: Consultation and/or technical
assistance provided to Tribal and local health departments regarding evidence-based and/or promising practices in the development of workforce capacity, training, and continuing education
Domain 9 includes 2 standards:
Standard 9.1: Use a performance management system to monitor achievement of organizational objectives• Measure 9.1.1 A: Staff at all organizational levels
engaged in establishing and/or updating a performance management system
• Measure 9.1.2 A: Performance management policy/system
• Measure 9.1.3 A: Implemented performance management system
• Measure 9.1.4 A: Implemented systematic process for assessing customer satisfaction with health department services
• Measure 9.1.5 A: Opportunities provided to staff for involvement in the department’s performance management
• Measure 9.1.6 S: Technical assistance and/or training provided on performance management to Tribal and local health departments
Standard 9.2: Develop and implement quality improvement processes integrated into organizational practice, programs, processes, and interventions• Measure 9.2.1 A: Established quality improvement
program based on organizational policies and direction• Measure 9.2.2 A: Implemented quality improvement
activities
Domain 9: Evaluate and Continuously Improve Processes, Programs, and Interventions
Domain 9 focuses on using and integrating performance management and quality improvement practices or processes to improve health department practices, programs, and interventions. This corresponds with the essential public health service, “Improve and innovate public health functions through ongoing evaluation, research, and continuous quality improvement”.
Features of Domain 9 can include:
• Performance management identifying results against the intended results
• Performance management systems ensure progress is being made towards goals, using collected data to track results, identify opportunities, and target improvements
• Ongoing quality improvement activities to achieve equity and improve the health of the community
APPENDIX A: PUBLIC HEALTH ACCREDITATION BOARD (PHAB) STANDARDS AND MEASURES
Domain 10: Contribute to and Apply the Evidence Base of Public Health
Domain 10 focuses on the role of health departments in building upon and advancing the
89 IU Richard M. Fairbanks School of Public Health
Domain 10 includes 2 standards:
Standard 10.1: Identify and use the best available evidence for making informed public health practice decisions• Measure 10.1.1 A: Applicable evidence-based and/
or promising practices identified and used when implementing new or revised processes, programs, and/or interventions
• Measure 10.1.2 T/S: Fostered innovation in practice and research
Standard 10.2: Promote understanding and use of the current body of research results, evaluations, and evidence-based practices with appropriate audiences• Measure 10.2.1 A: Protection of human subjects
when the health department is involved in or supports research activities
• Measure 10.2.2 A: Access to expertise to analyze current research and its public health implications
• Measure 10.2.3 A: Communicated research findings, including public health implications
• Measure 10.2.4 S: Consultation or technical assistance provided to Tribal and local health departments and other public health system partners in applying relevant research results, evidence-based and/or promising practices
• Measure 10.2.4 T: Technical assistance provided to the state health department, local health departments, and other public health system
partners in applying relevant research results, evidence-based and/or promising practices
Domain 11 includes 2 standards:
Standard 11.1: Develop and maintain an operational infrastructure to support the performance of public health functions • Measure 11.1.1 A: Policies and procedures regarding
health department operations, reviewed regularly, and accessible to staff
• Measure 11.1.2 A: Ethical issues identified and ethical decisions made
• Measure 11.1.3 A: Policies regarding confidentiality, including applicable HIPAA requirements
• Measure 11.1.4 A: Policies, processes, programs, and interventions provided that are socially, culturally, and linguistically appropriate to specific populations with higher health risks and poorer health outcomes.
• Measure 11.1.5 A: A human resources function• Measure 11.1.6 A: Information management function that
supports the health department’s mission and workforce by providing infrastructure for data storage, protection, and management; and data analysis and reporting
• Measure 11.1.7 A: Facilities that are clean, safe, accessible, and secure
Standard 11.2: Establish effective financial
Domain 11: Maintain Administrative and Management Capacity
Domain 11 focuses on management of health departments and the capacity of administration.
Features of Domain 11 can include:
• A well-managed human resources system• Competency in general financial management• Capacity and capability for data management • Knowledge of public health authorities and
mandates• Leaders and staff who are knowledgeable about
structure, organization, and finance of their public health department, as well as other organization and agencies which provide services
APPENDIX A: PUBLIC HEALTH ACCREDITATION BOARD (PHAB) STANDARDS AND MEASURES
science of public health, by adding to the body of evidence for promising practices. This corresponds with the essential public health service, “Build and maintain a strong organizational infrastructure for public health”.
Features of Domain 10 can include:
• Employing evidence-based practices for their effectives and credibility
• Assisting in the development new evidence • Applying innovation and creativity while providing
appropriate public health services

90 IU Richard M. Fairbanks School of Public Health
management systems• Measure 11.2.1 A: Financial and programmatic oversight
of grants and contracts• Measure 11.2.2 A: Written agreements with entities from
which the health department purchases, or to which the health department delegates, services, processes, programs, and/or interventions
• Measure 11.2.3 A: Financial management systems• Measure 11.2.4 A: Resources sought to support
agency infrastructure and processes, programs, and interventions
Domain 12 includes 3 standards:
Standard 12.1: Maintain current operational definitions and statements of the public health roles, responsibilities, and authorities• Measure 12.1.1 A: Mandated public health
operations, programs, and services provided• Measure 12.1.2 A: Operational definitions and/or
statements of the public health governing entity’s roles and responsibilities
Standard 12.2: Provide information to the governing entity regarding public health and the official responsibilities of the health department and of the governing entity• Measure 12.2.1 A: Communication with the
governing entity regarding the responsibilities of the public health department and of the responsibilities of the governing entity
Standard 12.3: Encourage the governing entity’s engagement in the public health department’s
APPENDIX A: PUBLIC HEALTH ACCREDITATION BOARD (PHAB) STANDARDS AND MEASURES
overall obligations and responsibilities• Measure 12.3.1 A: Information provided to the
governing entity about important public health issues facing the community, the health department, and/or the recent actions of the health department
• Measure 12.3.2 A: Actions taken by the governing entity tracked and reviewed
• Measure 12.3.3 A: Communication with the governing entity about health department performance assessment and improvement
Domain 12: Maintain Capacity to Engage the Public Health Governing Entity
Domain 12 focuses on the health department’s support and engagement of its governing entity, in respect to maintaining and strengthening public health infrastructure. There is a significant amount of variation in structure, definition, roles, and responsibilities of governing entities.

91 IU Richard M. Fairbanks School of Public Health
A P P E N D I X B : N A T I O N A L L O N G I T U D I N A L S U R V E Y O F P U B L I C H E A LT H S Y S T E M S C A P A C I T Y A S S E S S M E N T Q U E S T I O N S
APPENDIX B1. In the past three years in your jurisdiction, has a community needs assessment process been conducted that
systematically describes the prevailing status in the community?
2. In the past three years in your jurisdiction, has a survey of the population for behavioral risk factors been
conducted?
3. In the past three years in your jurisdiction, are timely investigations of adverse health events conducted on an
ongoing basis, including communicable disease outbreaks and environment health hazards?
4. Are the necessary laboratory services available to support investigations of adverse health events and meet
routine diagnostic and surveillance needs for your jurisdiction?
5. In the past three years in your jurisdiction, has an analysis been completed of the determinants of and contributing
factors to prioritize health needs, the adequacy of existing health resources, and the population groups most effected?
6. In the past three years in your jurisdiction, has an analysis been completed of age-specific participation in
preventive and screening services?
7. In your jurisdiction, is there a network of support and communication relationships that includes health-related
organizations, the media, and the general public?
8. In the past year in your jurisdiction, have there been formal efforts to inform public officials about the potential
public health impact of decisions under their consideration?
9. In the past three years in your jurisdiction, has there been a prioritization of the community health needs that
have been identified from a community needs assessment?
10. In the past three years in your jurisdiction, have community health initiatives been implemented that are consistent
with priorities established from a community health needs assessment?
11. In the past three years in your jurisdiction, has a community health action plan been developed with community
participation to address community health needs?
12. In the past three years in your jurisdiction, have plans been developed to allocate resources in a manner consistent
with community health action plans?
13. In the past three years in your jurisdiction, have resources been deployed as necessary to address priority health
needs identified in the community health needs assessment?
14. In the past three years in your jurisdiction, has an organizational assessment of the local public health agency
been conducted?
15. In the past three years in your jurisdiction, have age-specific priority health needs been addressed effectively
through the provision of or linkage to appropriate services?

92 IU Richard M. Fairbanks School of Public Health
A P P E N D I X B : N A T I O N A L L O N G I T U D I N A L S U R V E Y O F P U B L I C H E A LT H S Y S T E M S C A P A C I T Y A S S E S S M E N T Q U E S T I O N S
16. In the past three years in your jurisdiction, have there been regular evaluations of the effects of public health
services on community health status?
17. In the past three years in your jurisdiction, have professionally recognized process and outcome measures been
used to monitor public health programs and to redirect resources as appropriate?
18. In the past three years in your jurisdiction, has the public regularly received information about current health
status, health care needs, health behaviors, and health care policy issues?
19. Within the past year in your jurisdiction, has the media received reports on a regular basis about health issues
affecting the community?
20. In the past three years in your jurisdiction, has there been an instance in which a mandated public health program
or service failed to be implemented as required by state or local law, ordinance, or regulation?

93 IU Richard M. Fairbanks School of Public Health
A P P E N D I X C : I N D I A N A L O C A L P U B L I C H E A LT H D E PA R T M E N T R E F E R E N C E TA B L E
Health DepartmentPopulation served
Count of Health Department Employees
Ratio of Population per employee Recent Budget Health Official
Health Official Part/full-time
Department Administrator
Adams County Health
Department
35,636 9 3,943 $397,250.11 Michael Ainsworth, M.D. Part-time Jessica Bergdall
Bartholomew County
Health Department
82,753 26 3,155 $1,694,684.00 Brian Niedbalski, MD Full-time Link Fulp
Benton County Health
Department
8,653 6 1,436 $127,907.66 Joseph Moody, MD Full-time Kathy Sarault
Blackford County
Health Department
11,930 6 1,996 $212,049.73 Lori Skidmore, MD Part-time None
Crawford County
Health Department
10,558 3 3,522 $222,346.17 Devi Pierce, MD Part-time
Decatur County Health
Department
26,794 4 6,684 $437,568.28 Arthur Alunday, MD Full-time Carol Beck
Elkhart County Health
Department
205,560 97 2,114 $5,731,510.34 Lydia Mertz, MD Full-time
Fayette County Health
Department
23,047 7 3,316 $318,380.11 Wayne White, MD Full-time Matthew Sherck
Fishers City Health
Department
93,362 6 15,560 Indy Lane, M.D., FACOG Part-time Monica Heltz
Fountain-Warren
County Health
Department
24,614 6 4,102 $400,958.46 Sean Sharma, MD Full-time None
Gary City Health
Department
74,879 15 4,992 $423,079.44 Roland Walker, MD Veronica Collins
Gibson County Health
Department
33,452 6 5,596 $508,044.12 Bruce Brink Jr, DO Part-time Diane Hornby
Hancock County
Health Department
76,351 8 9,373 $557,441.91 Sandra L. Aspy, MD Part-time Crystal Baker
Henry County Health
Department
48,271 10 4,848 $545,880.29 John Miller, MD Part-time Angela Cox
Huntington County
Health Department
36,240 6 6,056 $290,880.23 Thomas Ringenberg, DO Full-time Tami Hurlburt
Jackson County Health
Department
44,111 10 4,388 $664,154.96 Christopher Bunce, MD Part-time Karla Hubbard
Jay County Health
Center
20,764 8 2,618 $394,408.28 Jerry Whetzel, MD Part-time Heath Butz
Jennings County
Health Department
27,611 7 3,947 $313,328.06 Gregory Heumann, MD Part-time Peggy Roe
Johnson County Health
Department
156,225 20 7,695 $1,444,207.12 Craig Moorman, MD Full-time Elizabeth
Swearingen
Lake County Health
Department
381,715 35 10,906 $2,658,852.89 Chandana Vavilala, MD Full-time Nick Doffin
Lawrence County
Health Department
45,668 12 3,806 $532,974.35 Alan F. Smith, M.D. Full-time None
Marion County Health
Department
954,670 801 1,192 $74,039,579 Virginia A. Caine, M.D. Full-time Karen Holly
APPENDIX C

94 IU Richard M. Fairbanks School of Public Health
A P P E N D I X C : I N D I A N A L O C A L P U B L I C H E A LT H D E PA R T M E N T R E F E R E N C E TA B L E
Health DepartmentPopulation served
Count of Health Department Employees
Ratio of Population per employee Recent Budget Health Official
Health Official Part/full-time
Department Administrator
Marshall County Health
Department
46,248 8 5,812 $752,171.85 Byron Holm, MD and Joel
Schumacher, MD
Full-time Ashley Garcia
Martin County Health
Department
10,217 4 2,554 $108,998.00 Larry Sutton, DO Part-time David Miller
Miami County Health
Department
35,567 5 7,169 $279,761.35 Christi Redmon, MD Part-time None
Morgan County Health
Department
70,116 15 4,648 $661,509.12 Paul Broderick, DO Full-time Jeanne LaFary
Newton County Health
Department
14,011 4 3,533 $263,308.77 Gonzolo Florido, MD Full-time None
Noble County Health
Department
47,532 7 6,779 $526,642.47 Terry Gaff, MD Part-time Cheryl Munson
Parke County Health
Department
16,927 4 4,232 $144,943.71 Franklin Swaim, MD Part-time None
Perry County Health
Department
19,102 5 3,816 $363,162.26 William Marcrum, MD Part-time Sarah Gehlhausen
Pike County Health
Department
12,410 6 2,061 $284,035.31 Nathanial Grow, MD Part-time Amy Gladish
Porter County Health
Department
169,594 33 5,103 $2,142,360.34 Maria L. Stamp, M.D. Full-time Letty Zepeda
Posey County Health
Department
25,540 8 3,199 $521,811.01 Kyle Rapp, MD Part-time Denny Schaffer
Pulaski County Health
Department
12,469 3 4,156 $205,859.69 Rex Allman, MD Part-time Teresa Hansen
Putnam County Health
Department
37,779 7 5,386 $444,953.58 Robert Heavin, MD Full-time Joni Young
Randolph County
Health Department
24,851 5 4,984 $257,062.54 Kenneth Sowinski, MD Part-time Debbie Weimer
Starke County Health
Department
22,935 4 5,723 $292,994.23 Thomas Browne, MD Part-time Frank Lynch
Sullivan County Health
Department
20,690 4 5,187 $327,223.87 Michael Gamble, MD, MBA Full-time Ryan Irish
Tipton County Health
Department
15,128 5 3,026 $201,968.76 Mary Compton, MD Part-time Lindsey Ogden
Union County Health
Department
7,037 6 1,200 $216,466.04 Susan Bantz, MD Part-time
Vigo County Health
Department
107,386 31 3,468 $1,700,729.64 Darren Brucken, MD Full-time Joni Wise
Washington County
Health Department
27,943 8 3,478 $340,214.87 Jeffery Morgan, MD Full-time Susan Green
Wayne County Health
Department
65,936 45 1,471 $5,246,496.20 David Jetmore, M.D. Full-time Christine Stinson
White County Health
Department
24,133 5 4,836 $298,133.07 Charles R. Tribbett, M.D Part-time Mary Grace Winkle
Note: Budget data are from the most recent year available on Indiana Gateway Annual Financial Reports, Disbursements by Fund Report. Health department
related funds were summed to estimate a recent budget.

95 IU Richard M. Fairbanks School of Public Health
Figure 24. Indiana Public Health Preparedness District Map
A P P E N D I X D : I N D I A N A P U B L I C H E A LT H P R E PA R E D N E S S D I S T R I C T M A P
APPENDIX D

I N D I A N A U N I V E R S I T Y
R I C H A R D M . F A I R B A N K S S C H O O L O F P U B L I C H E A LT H
1050 Wishard Blvd. | Indianapolis, IN 46202(317) 274-2000 | fsph.iupui.edu