Non-equilibrium statistical mechanics I The Boltzmann transport equation.pdf
Upload
truongtramCategory
view
235download
3
March 2016
OIES PAPER: CL 3
Indian Steam Coal Imports:
The Great Equation
Sylvie Cornot-Gandolphe,
OIES Research Associate

February 2016: Indian Steam Coal Imports
i
The contents of this paper are the authors’ sole responsibility. They do not
necessarily represent the views of the Oxford Institute for Energy Studies or any of
its members.
Copyright © 2016
Oxford Institute for Energy Studies
(Registered Charity, No. 286084)
This publication may be reproduced in part for educational or non-profit purposes without special
permission from the copyright holder, provided acknowledgment of the source is made. No use of this
publication may be made for resale or for any other commercial purpose whatsoever without prior
permission in writing from the Oxford Institute for Energy Studies.
ISBN 978-1-78467-052-8
About the author
Sylvie Cornot-Gandolphe is an independent consultant on energy and raw materials, focussing on
international issues. Since 2014, she has collaborated with the Oxford Institute for Energy Studies
(OIES) as a Research Fellow. She also works with the Energy Centre of the French Institute of
International Relations (IFRI) as a Research Associate, with CyclOpe, the reference publication on
commodities, and with CEDIGAZ, the international centre of information on natural gas of IFPEN.
Sylvie Cornot-Gandolphe has a long and proven experience in global gas and energy markets, gained
during her past positions at IFPEN/CEDIGAZ, the UN/ECE, the IEA and ATIC Services. She is the
author of several reference publications on energy markets. Her latest publications include reports on
gas, coal and shale oil and gas: COP21, Haro sur le charbon (IFRI, January 2016), The European
Gas Market Looking for its Golden Age? (IFRI, October 2015, co-author), US coal exports: the long
road to Asian markets (OIES, March 2015), The US shale oil revolution: the test of the business
model is underway (IFRI, January 2015), China’s Coal Market: Can Beijing Tame ‘King Coal’? (OIES,
December 2014), China’s Gas Strategy (IFRI, November 2014), Gas and Coal Competition in the EU
Power Sector (CEDIGAZ, June 2014), The impact of the US shale gas revolution on Europe’s
petrochemical industries (IFRI, November 2013), Underground gas storage in the world (CEDIGAZ,
June 2013), Global coal trade: from tightness to oversupply (IFRI, January 2013).

February 2016: Indian Steam Coal Imports
ii
Acknowledgements
I would like to thank the Oxford Institute for Energy Studies (OIES) for giving me the opportunity to
write this report on Indian steam coal imports, a topic that has gained special interest in view of its
implications for global coal exporting and importing countries. I am very grateful to Bassam Fattouh
for his guidance and encouraging support. I would like to sincerely thank Anupama Sen, OIES Senior
Research Fellow, for sharing with me her deep knowledge on India and energy, and for reviewing the
first draft of this report. Her insightful comments, but also hard questions, prompted me to widen my
research from various perspectives. My special thanks to Matthew Holland, who edited the final draft
of this report and made valuable comments and improvements. All remaining errors are mine.
February 2016: Indian Steam Coal Imports
iii
Contents
Acknowledgements .............................................................................................................................. ii
Contents ................................................................................................................................................ iii
Executive Summary .............................................................................................................................. 1
1. Introduction ....................................................................................................................................... 6
2. Rising coal imports and national concerns ................................................................................... 8
2.1 The recent surge of Indian coal imports ........................................................................................ 8
2.1.1 Growing import dependence ................................................................................................... 8
2.1.2 A surge in steam coal imports in FY2015 ............................................................................... 9
2.1.3 Power supplies are increasingly dependent on imports ....................................................... 10
2.1.4 Steam coal imports driven by the power sector, but recently by other sectors too .............. 12
2.1.5 Indonesia is the leading supplier, but the share of other suppliers is growing ..................... 13
2.2 Macro/microeconomic dimensions of coal imports ..................................................................... 15
2.2.1 Impact on the current account deficit .................................................................................... 15
2.2.2 Volatility of coal prices and changes in foreign export policy ............................................... 16
2.2.3 Security and independence of supply ................................................................................... 18
2.2.4 The new policy is a turnaround from past policies which ‘built’ import demand ................... 19
3. Coal demand and the new energy policy ..................................................................................... 23
3.1 Coal demand is dominated by the power sector ......................................................................... 23
3.2 Challenges in the coal power sector ........................................................................................... 25
3.2.1 Low quality of Indian coals .................................................................................................... 25
3.2.2 Low efficiency of the current coal power fleet ....................................................................... 28
3.2.3 Competition from renewables ............................................................................................... 31
3.2.4 Economic and financial challenges faced by the power sector ............................................ 33
3.3 An upcoming major reform: auctions of coal linkages ................................................................ 36
3.3.1 Four options for domestic coal supplies ............................................................................... 36
3.3.2 Different prices for coal in India ............................................................................................ 37
3.3.3 Auctions of coal linkages ...................................................................................................... 39
3.4 Future coal demand: focus on the power sector ......................................................................... 42
3.4.1 Energy reforms and their impact on electricity demand ....................................................... 42
3.4.2 New coal-fired power plants ................................................................................................. 43
3.4.3 Coal demand scenarios ........................................................................................................ 46
4. Coal production: a paradigm shift ................................................................................................ 51
4.1 New ambitious production targets ............................................................................................... 51
4.2 CIL’s roadmap to 1 Gt production ............................................................................................... 52
4.3 Measures taken to attain the production goal ............................................................................. 55
4.3.1 Government initiatives to speed up delayed projects ........................................................... 55
4.3.2 Land acquisition and rehabilitation and resettlement issues ................................................ 56
4.3.3 Easing of environmental and forest clearances .................................................................... 58
4.3.4 Removing transportation bottlenecks ................................................................................... 61

February 2016: Indian Steam Coal Imports
iv
4.3.5 Adequacy of coal reserves and accelerated exploration ...................................................... 65
4.3.6 Going deeper: underground mining ...................................................................................... 66
4.3.7 Going bigger: a huge need for modern equipment and improved efficiency ........................ 68
4.4 Commercial coal mining and coal block re-allocations ............................................................... 69
4.4.1 The captive mines policy and the cancellation of coal blocks .............................................. 69
4.4.2 Commercial mining: the 2015 Coal Mines Bill ...................................................................... 70
4.4.3 A two-step approach to open up the coal sector .................................................................. 71
4.4.4 Allocation of coal mines to private companies and PSU with specified use ........................ 73
4.4.5 Revenues from the auctions and allotment .......................................................................... 76
4.4.6 Outcome of the auctions for the private sector ..................................................................... 77
4.5 Assessments of coal production to FY2020 ............................................................................... 78
4.5.1 Main assumptions ................................................................................................................. 78
4.5.2 CIL ........................................................................................................................................ 79
4.5.3 SCCL .................................................................................................................................... 79
4.5.4 Coal blocks ........................................................................................................................... 80
4.5.5 Coal production scenarios to FY2020................................................................................... 81
5. Towards steam coal self-sufficiency ............................................................................................ 83
5.1 A slowdown in steam coal imports and self-sufficiency on the horizon ...................................... 83
5.2 Main constraints to India’s independence from steam coal imports ........................................... 86
5.2.1 Power plants designed on imported coal .............................................................................. 86
5.2.2 Environmental and quality constraints .................................................................................. 88
5.2.3 Competition between imported and domestic coal ............................................................... 88
6. Conclusion ....................................................................................................................................... 90
Annex 1: Coal in the energy and electricity mix in india ................................................................ 94
1. Primary energy sources ................................................................................................................ 94
2. CO2 emissions ............................................................................................................................... 95
3. Installed power capacity ................................................................................................................ 95
4. Electricity generation ..................................................................................................................... 97
5. Electricity consumption ................................................................................................................. 97
Annex 2: Coal industry structure in India ......................................................................................... 99
1. CIL ................................................................................................................................................. 99
2. SCCL ........................................................................................................................................... 100
3. Coal blocks .................................................................................................................................. 100
4. NLC ............................................................................................................................................. 100
5. Breakdown of Indian coal production .......................................................................................... 100
Annex 3: Classification of Coal in India .......................................................................................... 102
Annex 4: Norms for coal consumption of power plants ............................................................... 103
Annex 5: Results of e-auctions ....................................................................................................... 104
Annex 6: Coal blocks allotted to PSUs ........................................................................................... 105
Annex 7: Exchange rates ................................................................................................................. 106
List of tables, figures, boxes and maps .......................................................................................... 107
References ......................................................................................................................................... 109

February 2016: Indian Steam Coal Imports
1
Executive Summary
Since 2012, Indian steam coal imports have more than doubled, reaching 168 million metric tons (Mt)
in the fiscal year 2014–15 (FY2015), making India the world’s second-largest coal importer after
China. With the decline of Chinese import demand since 2014, India has been considered by many to
be the last bastion of significant coal import growth. However, India’s government has announced its
intention to cease steam coal imports by the end of 2017. Given the general consensus that India’s
coal demand will remain robust, these two diverging positions are thus based on differing perceptions
of future coal production in India.
In considering the ‘coal equation’ of supply and demand in relation to India’s coal policy, this report
seeks to answer two key questions:
What is the future role of India in the global steam coal trade?
Could India significantly decrease its steam coal imports, and if so under what conditions?
To answer these questions, the report analyzes the major drivers of future coal demand and
particularly focuses on the power sector, given its overwhelming share of coal demand (70 per cent in
FY2015). It also looks at the reforms currently underway in the mining sector and their potential to
make the sector more efficient, thus facilitating the dramatic growth that will be required in production.
The analysis is supplemented by quantitative assessments of steam coal supply and demand to
FY2020. The results of these assessments indicate that the government is likely to reach its self-
sufficiency goal, but this will be towards the end of the decade rather than in the next two to three
years as desired. In order to achieve this goal and cease coal imports, India’s government will
specifically need to address constraints relating to the low quality of Indian coal, in addition to
resolving problems linked with transportation and land acquisition. The main findings of this report are
summarized below.
High cost of steam coal imports for the economy
In a country where electricity and coal shortages are recurrent, imports help to secure supplies.
However, steam coal imports in India have come at a high cost for power utilities, state distribution
companies, and the economy at large. While international coal prices have declined significantly since
the middle of 2011, the price of coal imports into India surged after 2011 due to a change in pricing
regulation in Indonesia, its main steam coal supplier. While Indian power utilities built power plants
based on low Indonesian coal prices, the alignment of Indonesian coal prices with international coal
prices, for both existing and new contracts, derailed this strategy and forced the power utilities to
renegotiate their contracts with state distribution companies. This transferred the losses of the power
plants to state distribution companies, which were unable or unwilling to pass through the cost to end-
user customers. The increase in imported coal prices was exacerbated by the depreciation of the
rupee. The coal import bill consequently jumped from $9.1 billion in FY2011 to $16.5 billion in
FY2012, and it has remained elevated since then. In FY2015, surging coal imports erased the 18 per
cent decline in import prices observed that year and have seen the coal import bill reach $17.1 billion.
While this represents only 3.8 per cent of India’s trade balance, it adds an important financial
dimension to security of supply.
Import growth has occurred due to a rising shortfall between demand and indigenous coal supply.
Demand increased significantly over the last five years, driven by a massive increase in coal-based
power capacity, which almost doubled from 84 GW at the end of March 2010 to 165 GW at the end of
March 2015. Despite significant coal reserves, domestic production was not able to keep pace with
this tremendous increase and rose by only 15 per cent during the same period. As a result, imports of
steam coal by the power sector surged from 25 Mt in FY2010 to 91 Mt in FY2015. Today, 17 per cent
of coal supplies to the sector are dependent on foreign suppliers, thus exposing this vital sector –
February 2016: Indian Steam Coal Imports
2
responsible for meeting 76 per cent of India’s electricity supply – to the volatility of international prices
and to changes in trade policy in supplying countries.
Coal demand to remain robust despite massive growth in renewables
India’s energy demand is expected to increase significantly, driven by a growing economy,
urbanization and demographic trends, and Prime Minister Narendra Modi’s commitment to provide
‘24/7 electricity for all’ by the end of this decade. The low cost of coal compared with natural gas and
its abundance in India make it a preferred energy source for strategic industries such as power, steel,
and cement. Coal requirements by the power sector will continue growing, given large thermal coal-
based capacity additions coupled with the expected increase in power demand. Even with global
pressures on environmental concerns and a call to move away from coal, coal-based generation will
remain strategic for the Indian power generation sector in order to serve India’s rising energy needs.
While coal consumption will continue growing, the share of coal in the power mix is expected to
decline to 55 per cent by 2040, but it will nevertheless remain large relative to other energy sources.
The successful development of renewable energy sources (a target of 175 GW of new capacity by
FY2022) will lower India’s dependence on coal-fuelled electricity. New renewable power capacities,
when fully developed, have the potential to reduce the need for 70 GW of coal-based capacity, saving
about 250–300 million tons of coal and avoiding around 500 Mt of CO2 emissions. Energy-saving
measures on the demand side are expected to further reduce the growth of power demand.
Reduction of electricity transmission and distribution losses, which currently account for more than 21
per cent of electricity generation, also offer significant potential for energy savings.
Improvements in the coal fleet’s energy efficiency will further reduce coal consumption per unit of
electricity generated. While its first supercritical power plant only came into service at the end of 2010,
the installed power capacity of supercritical plants now accounts for 16 per cent of the coal fleet. More
than half of the power plants currently under construction are based on this technology, and all plants
built during the 13th Five-Year Plan (2017–22) will be supercritical plants. Coal consumption per unit
will also be reduced by an environmental regulation adopted in 2012 and reinforced in January 2014,
according to which power stations located more than 750 km (500 km from June 2016) away from
coal mines, and those located in sensitive and urban areas, are required to use coal containing not
more than 34 per cent of ash.
Due both to the financial difficulties encountered by state distribution companies and the power crisis
in general, the growth in electricity demand may also be lower than expected. Distribution companies
across all states had incurred accumulated losses of $46 billion in FY2013 due to the provision of
below-cost electricity. They are so indebted that they are unable, despite recurrent blackouts and
load-shedding, to sign new long-term offtake commitments with power producers. In turn, the
utilization rate of power plants has deteriorated (less than 65 per cent in FY2015 for coal-based power
plants, falling to 61 per cent in the first half of FY2016), leading to financial losses for power
producers. The situation has led to a vicious circle in which power developers cannot pay their fuel
costs to Coal India Limited (CIL), commission new assets, or repay their debt to lenders. Thermal
power capacity additions are expected to slow down when the current plants under construction are
commissioned, as power utilities focus on improving power plant utilization rather than investing in
‘stranded’ assets.
The government has initiated reforms of the power distribution sector and revision of the national tariff
policy to make the sector viable and introduce more competition and transparency. However, the
financial weakness of state distribution companies can only be addressed gradually with tariff
increases and, because electricity policy lies primarily under their purview, the full cooperation of state
governments. These issues mean that power plants are likely to continue to remain underutilized and
power plant projects at the very early stages of construction are likely to be postponed or even
cancelled.
The scenarios discussed in this paper are based on an analysis of coal-based capacity build-up, as
announced by power producers, and assumptions on plant utilization. They take into account an

February 2016: Indian Steam Coal Imports
3
improvement in the average efficiency of the power fleet, thanks to the commissioning of supercritical
plants, and improvements in the quality of coal. Steam coal demand by power utilities and the non-
regulated sector amounts to 1,035 Mt by FY2020 in the ‘low plant load factors’ scenario (around 65
per cent, dropping marginally lower in FY2016 and FY2017), while it reaches 1,090 Mt by FY2020 in
the ‘Improved Plant Load Factors’ scenario (Plant Load Factor, or PLF, gradually recovering to 70 per
cent) compared with 754 Mt in FY2015. This corresponds to Compound Annual Growth Rates
(CAGRs) ranging from 6.6 to 7.7 per cent over the period, respectively.
An ambitious but not impossible target for Indian coal production
Faced with surging imports and the adverse effect of the coal import bill on the economy, the new
government (elected in May 2014) has announced plans to increase domestic coal production
dramatically and address the coal shortage issue. It has asked CIL, the state-owned company
responsible for supplying 80 per cent of domestic production, to double its output to 1 billion tons.
Production from other mines, operated by public and private companies, is expected to reach 500
million tons by the same date, thus taking India’s total coal output to 1.5 billion tons by 2020
compared with 612 Mt in FY2015. These targets are challenging given the weak performance of coal
mining companies in the past few years, the difficulty in land acquisition for mining, environmental and
forest clearance issues, and transportation bottlenecks. But the government has introduced major
reforms in the coal mining sector to encourage competition and boost efficiency. The Coal Mines
(Special Provisions) Bill, adopted by parliament in March 2015, together with the adoption of the
‘Mining Law’ (Mines and Minerals [Development and Regulation] Amendment Act 2015), has opened
up the sector to domestic and foreign companies for commercial mining, thus ending 40 years of state
monopoly on coal sales. It has also introduced the possibility of allocating (using auctions) coal blocks
for captive mining in a transparent and effective manner. These new laws were adopted after the
Supreme Court in September 2014 cancelled the allocation of 204 coal blocks, out of a total of 218
allocated since 1993, on the grounds that the allocation process was arbitrary and illegal.
The government has taken a progressive and strategic approach to open up the sector. First, it is re-
allocating coal blocks to domestic private and public companies with a specified end-use (captive
mining). In the first three months of 2015, 29 mines were auctioned and 38 mines were allotted,
totalling 67 blocks (three additional mines were awarded in August 2015 and a further eight to ten
blocks are to be auctioned within the next few months). The revenues for the state governments, from
royalty and auction proceeds from the mines auctioned to private companies in the first two rounds,
total an estimated $33 billion over the next 30 years, surpassing the Comptroller and Auditor
General’s earlier estimates of losses of $30 billion incurred due to allocations without auctions. In a
second phase, the government will auction coal blocks for commercial mining, whereby state-owned
and standalone private and foreign companies will be allowed to mine and sell coal without any end-
use restrictions. Auctions for commercial mining are expected to start in FY2016.
In response to the billion-ton target, CIL has developed a comprehensive mine-wise plan, focusing on
the development of large opencast mines with modern mechanized equipment, and will seek foreign
expertise to raise coal output. The central government has provided assistance to clear the hurdles
(mentioned above) that have stalled these mining and infrastructure projects in the past.
As its attempt to reform the land acquisition law failed to achieve a consensus in parliament, CIL has
been working directly with state governments on a case-by-case basis to facilitate the acquisition of
land needed for the mining and transportation of coal. The federal government has also expedited
environmental and forest clearances for new mines by instituting the fast-tracking and real-time
monitoring of mine-by-mine progress. Regulations have also been relaxed for capacity expansion of
existing mines which have passed environmental assessment. Furthermore, the federal government
has fast-tracked the construction of three critical railway lines to remove evacuation bottlenecks and
facilitate the matching of supply with demand. Joint ventures between CIL, Indian Railways, and the
coal-bearing states have been set up to finance and expedite the construction of these lines. The first
of these, which had been stalled for years, is expected to start in June 2016.

February 2016: Indian Steam Coal Imports
4
Already, there are visible indications that Indian coal production is entering a new phase of growth.
After healthy growth of 7 per cent in FY2015, CIL’s production increased 9 per cent in the first half of
FY2016. Singareni Collieries Company Limited (SCCL), the only other state-owned hard-coal mining
company in the country, increased its production by 14 per cent during the same period. However,
there are still barriers to be overcome, especially state-level administrative procedures that have
delayed the re-commissioning of newly allocated coal blocks.
In the assessments of future coal production, this report has factored in the active role taken by the
central government to assist coal miners in resolving the hurdles that have prevented production
growth. It has also taken into account the time necessary to ramp up production and factored in the
many hurdles that persist, such as the absence of a consensus on the land acquisition ordinance and
the administrative hurdles that delayed the production of newly allocated coal blocks. This report
presents two scenarios for coal production. Overall, the new ‘business-as-usual’ assessment, which
assumes that the growth of CIL’s production will continue but also takes into account some delay in
the ramp-up of newly allocated coal blocks for captive mining, steam coal production reaches 996 Mt
by FY2020. In the more optimistic assessment, the ‘roadmap’, which considers that CIL will achieve
its mine-wise plan to produce 908 Mt by FY2020 and assumes a more rapid ramp-up of coal blocks
production, steam coal production reaches 1,178 Mt by FY2020.
Towards steam coal self-sufficiency
Under these assumptions, Indian coal imports would plateau in the short term before declining sharply
by the end of the decade. While Indian steam coal imports have increased at a steep rate over the
past three years, FY2016 may be a turning point for the coal sector in India, marked by a slowdown in
the pace of growth, or even a slight decline, of steam coal imports. Government policy to reduce
steam coal imports has been boosted by the environment ministry’s Expert Appraisal Committee
(EAC), which in October 2015 recommended the easing of the restriction on maximum permissible
ash content for imported coal (which has been stricter than for domestic coal). As this report shows,
this will enable the import of higher (calorific value) grades of coal, thus allowing the same amount of
electricity to be produced with less imported coal.
The report presents two scenarios assessing steam coal imports. In the first scenario, steam coal
imports are expected to continue increasing in FY2016, by 14 per cent to 192 Mt (a much lower
growth than in previous years), before gradually declining to 41 Mt at the end of the decade. The
overall dependence on steam coal imports would fall to only 4 per cent in FY2020. In the second
scenario, steam coal imports decline slightly in FY2016 (down 5 per cent to 160 Mt) and sharply from
FY2017 (to only 38 Mt in FY2019). Projected steam coal production exceeds demand in FY2020,
which means that India would be fully self-sufficient in steam coal and would only need to import
coking coal.
Both scenarios indicate that the government is likely to achieve its self-sufficiency goal, although
towards the end of the decade rather than in the announced time-frame.
One prerequisite of these outcomes is the simultaneous development of transportation infrastructure,
in particular three key rail lines from major mines to customers, and also rail lines from the mines to
the ports given the large number of coal-fired power plants located in coastal areas.
However, these import projections need to be strongly qualified by a set of constraints which need to
be addressed in order for steam coal imports to be ended:
Some power plants were designed and built to be operated on imported coal only – that is, on high-quality coal (low ash content). In the short term, in the absence of the required quality in India, these plants will continue burning imported coal. This is reinforced by the existence of long-term contracts with foreign suppliers or participation of Indian companies in mining activities overseas. This means that a certain level of steam coal imports (which was around 40 Mt in FY2015) will still be needed in the short/medium term. In the longer term, it could be eliminated with the procurement of better quality domestic coal, either washed coal or coal produced in
February 2016: Indian Steam Coal Imports
5
underground mines – which is better quality than current coal production which comes mainly from opencast mines.
New regulations, adopted in 2012 and reinforced in 2014, limiting the use and transportation of coal with high ash content, and the inadequate availability of such coal from indigenous sources, requires the blending of imported coal of low ash content. This issue can be overcome with the washing of coal, and coal miners have responded to the new regulation by building new washeries. However, in the short term, the capacity of existing washeries is limited and low-ash coal has to be imported to comply with environmental regulations.
The commercial optimization of fuel supply at power and industrial plants in coastal locations also favours imported coal in view of constraints on transport logistics and declining import prices. This commercial strategy may limit the fall in coal imports because their price is currently at an historic low (due to global oversupply) and Indian steam coal buyers arbitrage between domestic and imported coal. With import demand in major countries, especially China, falling in line with lower economic growth and stringent environmental measures, the rebalancing of the market does not appear likely in the short term, despite cuts in production. The competition between domestic coal and imported coal (for certain grades of coal and some customers: for instance those who rely on e-auction sales, which are sold with a premium of 40 to 60 per cent on regulated prices) is a new phenomenon, as Indian coal prices have been much lower than imported prices so far.
Greater interaction between the Indian and global steam coal markets
India is also reforming its coal market to introduce more competition and transparency. The
government intends to auction Fuel Supply Agreements (FSAs) to the non-regulated sector which will
allow Indian coal prices to be set by the market rather than being determined by CIL. In theory, they
should thus align with international coal prices. However, the government will need to assess the
evolution of the global steam coal market carefully in preparing its reform policy. In the oversupplied
global market, foreign suppliers in distressed situations may undercut their supplies in order to find
outlets for their coal cargoes. This could lead to a price war between domestic and foreign suppliers,
as was observed in the Chinese coal market in 2013/2014.
As India is likely to reduce its steam coal imports significantly and rapidly, the impact on the already
depressed international coal market will be profound. International coal exporters must also factor in
another setback: India will not be the growth engine for imported coal that it was widely expected to
be at the beginning of this decade, when Indian steam coal imports were forecasted to increase
dramatically. Instead, the market should expect additional output cuts in coal-exporting countries and
persistently low international prices, which will in turn be increasingly dependent on India’s energy
policy and CIL’s monthly production.

February 2016: Indian Steam Coal Imports
6
1. Introduction
Since 2010 India's coal imports1 have tripled, thus making India the world's second-largest coal
importer after China. In the future, India is widely seen as the next engine of growth in the
international steam coal trade at a time when China’s coal imports are declining. Most commodity
analysts project that India will overtake China as the world's top coal importer as soon as 2015, faster
than previously expected.2
On the demand side, coal is of strategic importance for the country, accounting for 56 per cent of the
primary commercial energy supply and 76 per cent of power generation.3 The price of steam coal in
India is less than alternative fuels such as diesel or natural gas/LNG. Coal demand is therefore
expected to continue increasing significantly, driven by the needs of a growing economy,
urbanization, and demography, and reinforced by Prime Minister Narendra Modi’s commitment to
eradicate poverty and provide 24/7 electricity for all by 2019.
On the supply side, despite significant coal reserves, domestic coal production, dominated by state-
owned Coal India Limited (CIL), has not been able to cope with increasing demand from the power
sector, leading to recurrent fuel shortages and electricity blackouts. Under the ‘captive coal mine’
policy introduced in 1993, a large number of captive coal blocks, with reserves constituting some 40
gigatons (Gt), were allocated during the period 1993–2011, but the production from these mines has
been well short of expectations. In September 2014, in a move adding uncertainty to their future
contribution to domestic production, the Indian Supreme Court cancelled the allocation of 204 coal
blocks, out of a total of 218 allocated since 1993, on the grounds that the allocation process was
arbitrary and illegal.
Surging coal imports, in particular by the vital power sector, has reinforced the focus on energy
security. Moreover, the coal import bill is an additional burden to the Indian trade balance, adding a
financial dimension to energy security. It is in this challenging context that the new government has
announced its willingness to cease steam coal imports, which according to the Minister of State for
Power, Coal & New and Renewable Energy ‘could be eliminated within two or three years’.4 The
ambition is to double CIL’s coal production to 1 Gt by FY20205 and that from other producers,
including coal blocks, now under re-allocation in a transparent manner, to 500 Mt.
The success of this new coal policy is of great significance, not only for energy security in India, but
also for the world’s coal-exporting countries and, ultimately, coal-consuming countries, as the trends
in Indian coal imports will influence future international coal prices. The announced targets are
certainly challenging in the face of the many hurdles that the Indian coal sector faces, in particular the
delays in environmental approval for coal mines, the difficulty of acquiring new lands for mining, the
congestion of the railway network, and the issue of coal and power sector reforms in general.
This report investigates whether India is going to be the next engine of growth for the global steam
coal trade or, on the contrary, if India might fully cease its steam coal imports, as announced by the
government. It analyzes the potential future impact on India’s coal balance of recent reforms and
measures taken by India’s government (elected in May 2014) to reduce India’s steam coal6 imports –
1 ‘Total coal imports’ refers to coking coal and steam coal (also referred to non-coking coal in Indian statistics). 2 Reuters, ‘India to eclipse China as top coal importer in 2015’, 20 May 2015, http://in.reuters.com/article/2015/05/20/india-
china-coal-idINKBN0O51CD20150520 3 Coal Controller’s Organisation (CCO), Coal Statistics 2013-2014, April 2015, Ministry of Coal,
http://coal.nic.in/sites/upload_files/coal/files/coalupload/coaldir13-14.pdf 4 Reuters, ‘Piyush Goyal Says Possible to Stop Imports of Thermal Coal in 2-3 Years’, 12 November 2014,
http://profit.ndtv.com/news/industry-papers/article-piyush-goyal-says-possible-to-stop-imports-of-thermal-coal-in-2-3-years-
692265 5 Fiscal year: from 1 April to end of March (FY2020: from 1 April 2019 to end of March 2020). 6 The report focuses only on steam coal (used as fuel in the power sector and other industries), although coking coal (used as
raw material in the iron and steel industry) is also mentioned when relevant.

February 2016: Indian Steam Coal Imports
7
and even cease them in the next two or three years – whilst simultaneously basing its economic
development strategy heavily on coal.
Chapter 2 opens the report with a review of the evolution of India’s coal imports and their impact on
the economy and on India’s security of supply. The report then goes on to analyze the two key
determinants of future coal imports in the country: supply and demand.
Chapter 3 is dedicated to the demand side of the equation. It assesses how steam coal demand will
be impacted by India’s new energy policy targets, in particular its ambitious goal for renewables, and
the renewed growth in economic activity. Sections 3.1 and 3.2 investigate the main technical,
economic, and financial challenges faced by the coal-based power sector. Section 3.3 explains how
coal prices are differentiated according to different customers and routes of supply. It also analyzes
the proposed reforms for coal fuel supply agreements (FSAs). Section 3.4 provides an assessment of
coal demand by FY2020, mainly focusing on the power sector.
Chapter 4 looks at the supply side. It reviews how the government, as well as CIL, are attempting to
address the challenges that have historically prevented significant growth in coal production. CIL’s
roadmap to 1 Gt of coal production by FY2020 is analyzed, as are the major steps taken by the
company and the government towards this ambitious target (Sections 4.2 and 4.3). The new
legislative environment for coal mining and the first auctions and allotments of coal blocks are
reviewed in Section 4.4, before the chapter ends with the presentation of two assessments of coal
production in FY2020 (under rather different assumptions) in Section 4.5.
Chapter 5 discusses what the outcome of these supply and demand trends could be on Indian steam
coal imports in the short (FY2016) and medium term (FY2020). Section 5.1 presents the results of the
scenarios for coal steam imports. Section 5.2 discusses the main barriers that could prevent India
from attaining self-sufficiency in coal production.
Chapter 6 contains concluding remarks on future coal imports in India and their impact on the
international coal market.

February 2016: Indian Steam Coal Imports
8
2. Rising coal imports and national concerns
2.1 The recent surge of Indian coal imports
2.1.1 Growing import dependence
India’s total coal imports have increased tenfold since FY2004 – from 21.7 Mt to 212.1 Mt in FY2015.7
India now ranks second in global coal import demand, having outpaced Japan in 2014, and accounts
for 16.7 per cent of total coal imports.
Figure 1: India’s coal imports in the global context
Note: Calendar year.
Source: Australian Government, Resources and Energy Quarterly, September 2015.
Recent trends show an increasing dependence on coal imports, which have surged since FY2012. As
seen in Figure 2, import dependence (measured as the share of total imports in total supply of hard
coal8) increased from 11.5 per cent in FY2011 to 25.7 per cent in FY2015.
Figure 2: Evolution of coal imports and import dependence in India (FY2004–FY2015)
Note: Import dependence is calculated as the share of imports in total supply of hard coal, calculated as the sum
of domestic hard coal production and imports. Data are not adjusted for different calorific values of coal,
particularly between domestic and imported coal. In such an adjustment, the share of imports in total domestic
supply would be higher as imported coal has a higher calorific value than Indian coal.
Source: Coal Controller’s Organisation, October 2015.
7 Coal Controller’s Organisation (CCO), Provisional Coal Statistics, October 2015,
http://coal.nic.in/sites/upload_files/coal/files/webform/notices/Provisional_Coal_Statistics_2014-15.pdf 8 Hard coal: coking coal and steam coal, excludes lignite.
China20%
India17%
Japan12%
South Korea9%
Taiwan5%
European Union18%
Others19%
Global steam coal trade in 2014: 1125 Mt
China20%
India16%
Japan16%
South Korea11%
Eurpean Union16%
Others20%
Global coking coal trade in 2014: 310 Mt
February 2016: Indian Steam Coal Imports
9
Since the 1980s, India has imported coking coal due to inadequate domestic reserves of the required
quality. Coking coal imports, mainly from Australia, totalled 44 Mt in FY2015. However, an important
feature of the trend in imports has been the sharp rise in the purchase of steam coal since the
beginning of this decade. Steam coal now accounts for 79 per cent of Indian coal imports compared
with 42 per cent in FY2005. Steam coal imports rose considerably in FY2015, surging by 30 per cent
to 168.4 Mt as demand increased faster than available domestic supplies. Coal consumption rose by
an estimated 11 per cent, but Indian coal production increased by only 8 per cent.
Due to recurrent shortages, coal (both coking and steam coal) has been placed under open general
licence and can be freely imported by the end-users themselves, according to their needs and based
on their commercial prudence. Over the years, the government has reduced the import duty on coal
imports, and in the Union Budget for FY2015 it rationalized the import duty for all types of coal and
coke to 2.5 per cent.
Box 1: Data on coal imports in India
Coal data for India used in this report comes from official figures published by the Ministry of Coal
(MoC), the Ministry of Power (MoP), the Central Statistics Office (CSO), the Central Electricity
Authority (CEA), and the Ministry of Commerce & Industry (MoCI), as well as from statements by the
Minister of State for Power, Coal & New and Renewable Energy (MPCNRE) in the Lok Sabha (the
lower house of parliament).
As far as coal imports are concerned, apart from official data published by the MoCI, there is monthly
data published by mjunction, an online trader, based on information from shipping companies, ports,
and other sources. The data quoted above is official and differs from that published by mjunction,
which estimated Indian coal imports at 242.4 Mt in FY20159 compared with the official figure of 212.1
Mt. The difficulty in accurately assessing coal imports in India stems not only from different
estimations but also the huge difference in calorific values between domestically produced and
imported coal.
2.1.2 A surge in steam coal imports in FY2015
Steam coal is imported by power utilities 10 (regulated sector) and also by captive power plants,
cement, aluminium, and other industries (non-regulated sector).
9 Reuters, ‘Coal imports jump 34 percent in 2014/15’, 14 April 2015, http://in.reuters.com/article/2015/04/14/india-coal-imports-idINKBN0N50ZM20150414 10 The power sector includes two segments: the regulated power utilities sector, which includes central, state, and private /
Independent Power Producer power plants, and sells power at regulated tariffs; and the non-regulated sector, which includes
captive power plants (CPP) developed by industrial and commercial users for their own consumption. Other industrial
consumers (steel, cement, paper, etc.) also belong to the non-regulated sector.

February 2016: Indian Steam Coal Imports
10
Figure 3: Steam coal imports by power utilities and the non-regulated sector, FY2015 vs.
FY2014
Sources: Coal Controller’s Organisation; Central Electricity Authority.
While the sharp rise of steam coal imports in FY2015 was mainly explained by the growing gap
between domestic coal production and demand, specific factors also contributed to it. In 2014, in
order to reduce the gap between domestic supply and demand by power utilities, the government
requested that CIL reduce its e-auction sales11 and prioritize deliveries to the power utilities sector. In
response, CIL’s supplies to power utilities increased by 8.9 per cent (31.6 Mt) to reach 385.4 Mt in
FY2015. 12 Despite that, power utilities increased their imports by 14 per cent to 91 Mt. The
dramatically low level of coal stocks at power plants forced power utilities to increase their imports to
rebuild coal stocks. At the end of June 2014, the number of thermal power plants (TPPs) with a critical
coal stock position (less than seven days) was 42 out of 100 plants.13 In order to replenish stocks
during the monsoon season and meet domestic power demand, power utilities ramped up imports
during the months when they traditionally decline – between July and September 2014. Coal stock
rebuilding in the last quarter of FY2015 also raised coal imports and allowed the number of TPPs with
a critical stock position to come down to 12 at the end of March 2015, when stocks at TPPs totalled
26.1 Mt.14
In contrast, domestic coal dispatches (actual sales) were limited by transportation constraints leading
to rising stockpiles at pithead and lower availability of domestic coal. While CIL’s output grew by 7 per
cent in FY2015, its dispatches grew only 3.8 per cent to 489 Mt. CIL’s coal stocks at pithead rose by 5
Mt in FY2015 despite the shortfall in coal supply. Coal stocks at ports also increased significantly
(totalling 12 Mt at the end of March 2015) due to a lack of railcars to move coal from the ports to the
consuming plants. This issue is currently being addressed by the government and CIL through
investments in new transportation railways and the optimization of coal contracts between CIL and
power plants.
2.1.3 Power supplies are increasingly dependent on imports
Steam coal imports by power utilities have been increasing dramatically over the last few years due to
a combination of surging demand and relatively stagnant domestic production. The demand surge
has been primarily driven by the rapid increase in installed coal-based power capacity, mainly by
11 Part of CIL’s production is sold through e-auctions to the non-regulated sector (45 Mt in FY2015), in addition to sales sold
under contracts (Fuel Supply Agreements). See Sections 3.3 for a discussion on e-auction sales and prices. 12 CIL, 2014-15 Annual Report and Accounts, August 2015,
https://www.coalindia.in/DesktopModules/DocumentList/documents/Annual_Report_&_Accounts_2014-
15_Shareholder_version_03082015(1).pdf 13 CEA, Daily Coal Report, June 2014, http://www.cea.nic.in/reports/daily/coal/2014/June/30.pdf 14 CEA, Daily Coal Report, March 2015, http://www.cea.nic.in/reports/daily/coal/2015/March/31.pdf
February 2016: Indian Steam Coal Imports
11
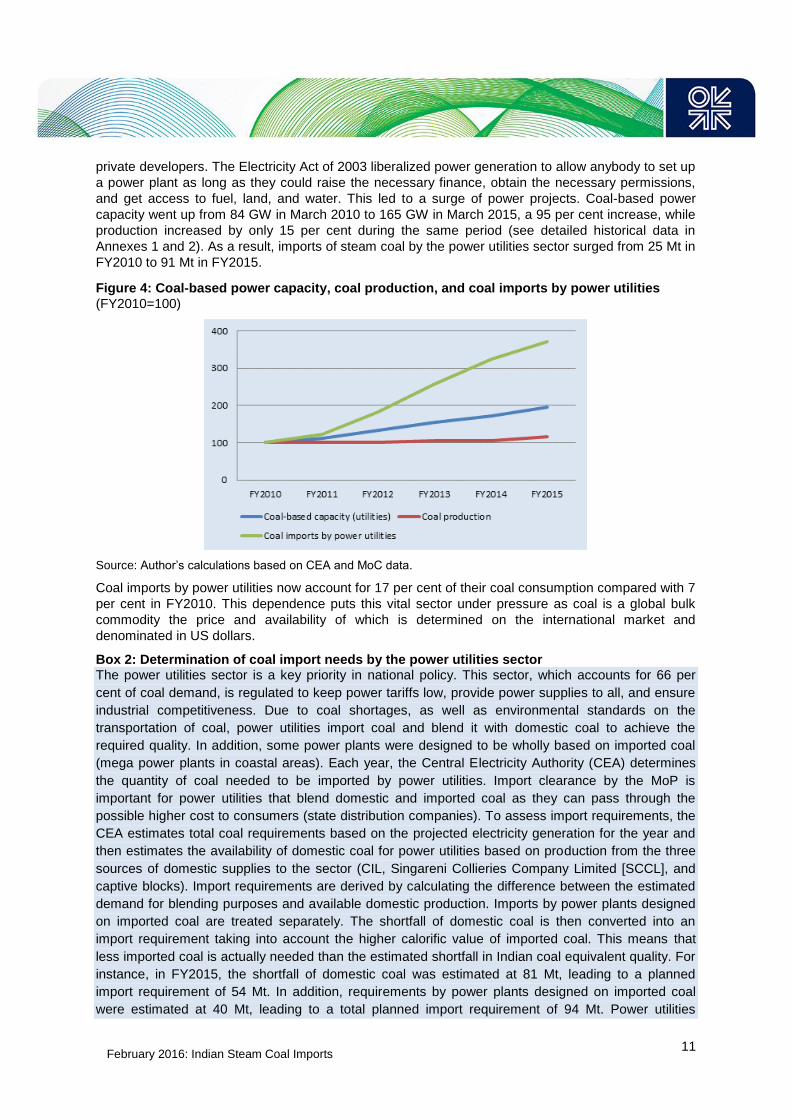
private developers. The Electricity Act of 2003 liberalized power generation to allow anybody to set up
a power plant as long as they could raise the necessary finance, obtain the necessary permissions,
and get access to fuel, land, and water. This led to a surge of power projects. Coal-based power
capacity went up from 84 GW in March 2010 to 165 GW in March 2015, a 95 per cent increase, while
production increased by only 15 per cent during the same period (see detailed historical data in
Annexes 1 and 2). As a result, imports of steam coal by the power utilities sector surged from 25 Mt in
FY2010 to 91 Mt in FY2015.
Figure 4: Coal-based power capacity, coal production, and coal imports by power utilities
(FY2010=100)
Source: Author’s calculations based on CEA and MoC data.
Coal imports by power utilities now account for 17 per cent of their coal consumption compared with 7
per cent in FY2010. This dependence puts this vital sector under pressure as coal is a global bulk
commodity the price and availability of which is determined on the international market and
denominated in US dollars.
Box 2: Determination of coal import needs by the power utilities sector The power utilities sector is a key priority in national policy. This sector, which accounts for 66 per
cent of coal demand, is regulated to keep power tariffs low, provide power supplies to all, and ensure
industrial competitiveness. Due to coal shortages, as well as environmental standards on the
transportation of coal, power utilities import coal and blend it with domestic coal to achieve the
required quality. In addition, some power plants were designed to be wholly based on imported coal
(mega power plants in coastal areas). Each year, the Central Electricity Authority (CEA) determines
the quantity of coal needed to be imported by power utilities. Import clearance by the MoP is
important for power utilities that blend domestic and imported coal as they can pass through the
possible higher cost to consumers (state distribution companies). To assess import requirements, the
CEA estimates total coal requirements based on the projected electricity generation for the year and
then estimates the availability of domestic coal for power utilities based on production from the three
sources of domestic supplies to the sector (CIL, Singareni Collieries Company Limited [SCCL], and
captive blocks). Import requirements are derived by calculating the difference between the estimated
demand for blending purposes and available domestic production. Imports by power plants designed
on imported coal are treated separately. The shortfall of domestic coal is then converted into an
import requirement taking into account the higher calorific value of imported coal. This means that
less imported coal is actually needed than the estimated shortfall in Indian coal equivalent quality. For
instance, in FY2015, the shortfall of domestic coal was estimated at 81 Mt, leading to a planned
import requirement of 54 Mt. In addition, requirements by power plants designed on imported coal
were estimated at 40 Mt, leading to a total planned import requirement of 94 Mt. Power utilities

February 2016: Indian Steam Coal Imports
12
actually imported 91.2 Mt, with their demand mainly driven by blending needs (48.5 Mt) to cover coal
shortage and meet environmental regulations. The new regulations, which limit the transportation of
coal with ash content above 34 per cent, have led more power plants to blend imported coal, pending
the commissioning of new washeries.
Table 1: Coal consumption and imports by power utilities
Sources: CEA; Ministry of Coal; Ministry of Power; Author’s calculations.
So far, imports have been less than the estimated requirements for the year, mainly due to the higher
cost of imported coal compared with CIL’s prices and, as a result, the higher cost of power
generation. Due to their weak financial situation, state distribution companies (Discoms) are reluctant
to buy costlier power despite recurrent power shortfalls and load-shedding. Given transportation costs
and congestion of the railway system, this is particularly the case for power utilities located far away
from ports. The other reasons for this discrepancy include: technical limitation of boiler design to
blend imported coal; port capacity constraints and congestion; and electricity generated on imported
coal not getting scheduled in merit order operation for power merchant plants, resulting in sub-optimal
utilization of plant capacity.15
2.1.4 Steam coal imports driven by the power sector, but recently by other sectors too
The non-regulated sector (sponge iron, captive power plants, cement, etc.) dramatically increased its
steam coal imports in FY2015 – by 54 per cent to 77 Mt – due to increasing demand and the
reduction of CIL’s e-auction coal sales – 45 Mt compared with 58 Mt in FY2014 – forcing non-
regulated users to resort to the international market. The move was also explained by strategic
commercial considerations, as the low price of international coal made it less expensive than CIL’s
sales of high-grade coal to the non-regulated sector or industrial plants located far away from mines.
Overall, power utilities were taking a larger share of total steam coal imports, reaching 61 per cent in
FY2014. In FY2015, it declined to 54 per cent in view of the surging imports by the non-regulated
sector.
15 Lok Sabha, Ministry of Power, Fuel supply, Answer to question N° 5004, 23 April 2015, http://164.100.47.132/LssNew/psearch/QResult16.aspx?qref=16840
Steam coal
Coal consumption by
power util ities (Mt) Planned (Mt) Actual (Mt)
% of coal
imports in
total
consumption
Blending (Mt)
Actual and (Target)
Power plants designed
on imported coal (Mt)
Actual and (Target)
FY2010 367.3 28.7 24.6 7% 20.2 (25.7) 4.4 (3)
FY2011 386.6 44 30.3 8% 21.8 (35) 8.5 (9)
FY2012 417.6 55 44.9 11% 27 (35) 17.9 (20)
FY2013 464.5 70 63.2 14% 31.5 (46) 31.7 (24)
FY2014 486.4 82 80.1 16% 36.9 (50) 43.2 (32)
FY2015 (prov.) 531.5 94 91.2 17% 48.5 (54) 42.7 (40)
Purpose of imports by power utilitiesImports by power utilities
February 2016: Indian Steam Coal Imports
13
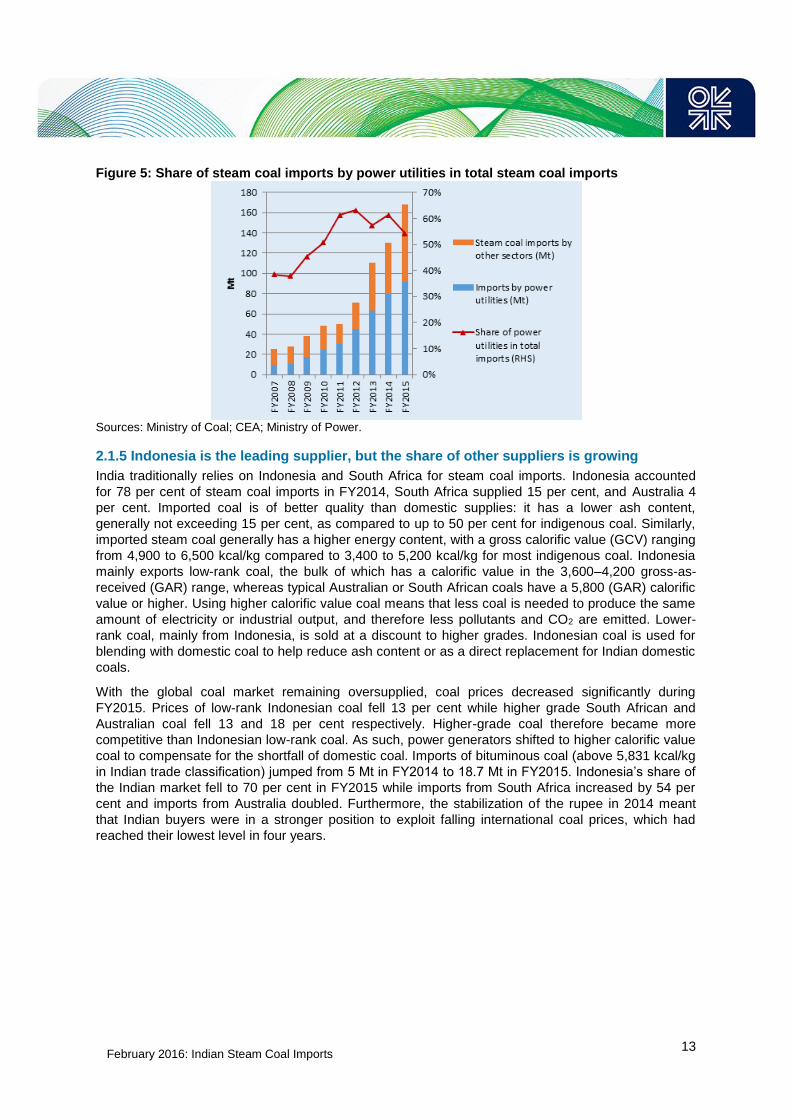
Figure 5: Share of steam coal imports by power utilities in total steam coal imports
Sources: Ministry of Coal; CEA; Ministry of Power.
2.1.5 Indonesia is the leading supplier, but the share of other suppliers is growing
India traditionally relies on Indonesia and South Africa for steam coal imports. Indonesia accounted
for 78 per cent of steam coal imports in FY2014, South Africa supplied 15 per cent, and Australia 4
per cent. Imported coal is of better quality than domestic supplies: it has a lower ash content,
generally not exceeding 15 per cent, as compared to up to 50 per cent for indigenous coal. Similarly,
imported steam coal generally has a higher energy content, with a gross calorific value (GCV) ranging
from 4,900 to 6,500 kcal/kg compared to 3,400 to 5,200 kcal/kg for most indigenous coal. Indonesia
mainly exports low-rank coal, the bulk of which has a calorific value in the 3,600–4,200 gross-as-
received (GAR) range, whereas typical Australian or South African coals have a 5,800 (GAR) calorific
value or higher. Using higher calorific value coal means that less coal is needed to produce the same
amount of electricity or industrial output, and therefore less pollutants and CO2 are emitted. Lower-
rank coal, mainly from Indonesia, is sold at a discount to higher grades. Indonesian coal is used for
blending with domestic coal to help reduce ash content or as a direct replacement for Indian domestic
coals.
With the global coal market remaining oversupplied, coal prices decreased significantly during
FY2015. Prices of low-rank Indonesian coal fell 13 per cent while higher grade South African and
Australian coal fell 13 and 18 per cent respectively. Higher-grade coal therefore became more
competitive than Indonesian low-rank coal. As such, power generators shifted to higher calorific value
coal to compensate for the shortfall of domestic coal. Imports of bituminous coal (above 5,831 kcal/kg
in Indian trade classification) jumped from 5 Mt in FY2014 to 18.7 Mt in FY2015. Indonesia’s share of
the Indian market fell to 70 per cent in FY2015 while imports from South Africa increased by 54 per
cent and imports from Australia doubled. Furthermore, the stabilization of the rupee in 2014 meant
that Indian buyers were in a stronger position to exploit falling international coal prices, which had
reached their lowest level in four years.
February 2016: Indian Steam Coal Imports
14
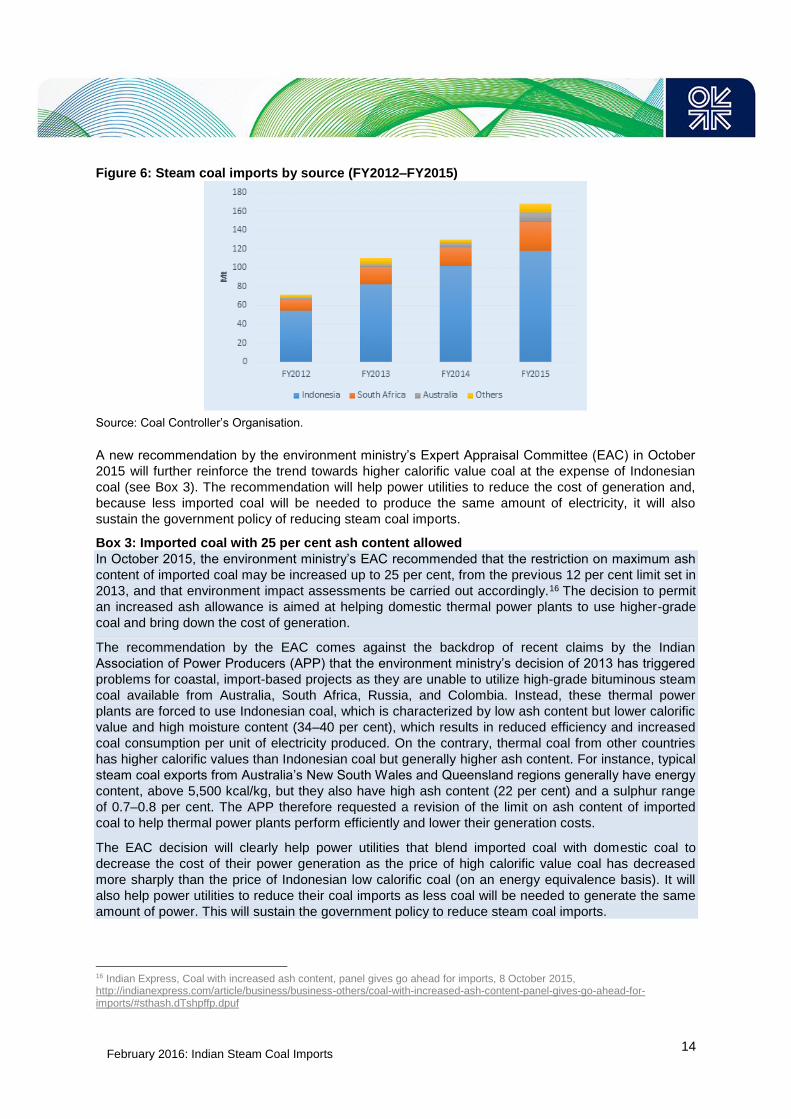
Figure 6: Steam coal imports by source (FY2012–FY2015)
Source: Coal Controller’s Organisation.
A new recommendation by the environment ministry’s Expert Appraisal Committee (EAC) in October
2015 will further reinforce the trend towards higher calorific value coal at the expense of Indonesian
coal (see Box 3). The recommendation will help power utilities to reduce the cost of generation and,
because less imported coal will be needed to produce the same amount of electricity, it will also
sustain the government policy of reducing steam coal imports.
Box 3: Imported coal with 25 per cent ash content allowed
In October 2015, the environment ministry’s EAC recommended that the restriction on maximum ash
content of imported coal may be increased up to 25 per cent, from the previous 12 per cent limit set in
2013, and that environment impact assessments be carried out accordingly.16 The decision to permit
an increased ash allowance is aimed at helping domestic thermal power plants to use higher-grade
coal and bring down the cost of generation.
The recommendation by the EAC comes against the backdrop of recent claims by the Indian
Association of Power Producers (APP) that the environment ministry’s decision of 2013 has triggered
problems for coastal, import-based projects as they are unable to utilize high-grade bituminous steam
coal available from Australia, South Africa, Russia, and Colombia. Instead, these thermal power
plants are forced to use Indonesian coal, which is characterized by low ash content but lower calorific
value and high moisture content (34–40 per cent), which results in reduced efficiency and increased
coal consumption per unit of electricity produced. On the contrary, thermal coal from other countries
has higher calorific values than Indonesian coal but generally higher ash content. For instance, typical
steam coal exports from Australia’s New South Wales and Queensland regions generally have energy
content, above 5,500 kcal/kg, but they also have high ash content (22 per cent) and a sulphur range
of 0.7–0.8 per cent. The APP therefore requested a revision of the limit on ash content of imported
coal to help thermal power plants perform efficiently and lower their generation costs.
The EAC decision will clearly help power utilities that blend imported coal with domestic coal to
decrease the cost of their power generation as the price of high calorific value coal has decreased
more sharply than the price of Indonesian low calorific coal (on an energy equivalence basis). It will
also help power utilities to reduce their coal imports as less coal will be needed to generate the same
amount of power. This will sustain the government policy to reduce steam coal imports.
16 Indian Express, Coal with increased ash content, panel gives go ahead for imports, 8 October 2015, http://indianexpress.com/article/business/business-others/coal-with-increased-ash-content-panel-gives-go-ahead-for-imports/#sthash.dTshpffp.dpuf

February 2016: Indian Steam Coal Imports
15
Clear environmental impact assessments will also be needed. Last year, Beijing took the opposite
course when the Chinese National Development Reform Commission implemented a ban on the sale
and import of low-grade coal with high ash and sulphur content (Coal business regulatory approach,
Order N° 13, 6 August 2014). The directive, which has been applied since 1 January 2015, bans
import and sales of coal with low calorific values, high ash and sulphur content (with different
thresholds applied to lignite and bituminous coal), and coal transported inland beyond 600 km from
either a port or a mine. The decision was triggered by China’s increasing air pollution problems. It
should be noted, however, that the Chinese restrictions on ash content are less stringent than the 25
per cent endorsed by the Indian EAC (with thresholds of 30 per cent and 40 per cent depending on
the quality of coal when coal is consumed at the port) except for three target regions, Beijing-Tianjin-
Hebei, the Pearl River Delta, and the Yangtze River Delta, where the regulation restricts coal with ash
above 16 per cent and sulphur above 1 per cent.17 Just as in India, the Chinese regulation is different
for coal transported across the country and coal consumed near the import terminals.
2.2 Macro/microeconomic dimensions of coal imports
Coal imports increase the availability of coal in India and enable a reduction of coal and power
shortages. However, the surge in coal imports had become a major source of concern, especially in
light of the widening of the current account deficit (CAD) from FY2012 to FY2014, the depletion of
foreign exchange reserves, and pressure on the exchange rates. Other problems associated with
dependence on imports include the volatility of imported coal prices and changes in supply nations’
export policies, which are both seen as a threat to critical and secured supply of the power industry.18
2.2.1 Impact on the current account deficit
At the macroeconomic level, the increase in coal imports has been increasingly viewed as a source of
vulnerability for the Indian economy.19 In relation to the total imports by India ($448 billion in FY2015),
the value of coal imports remains modest (3.8 per cent), but the large-scale import of fossil fuels,
including coal, has had an adverse impact on Indian economy. India's current account has been
consistently in deficit over the last 10 years, and the deficit widened after 2011, partly due to
increasing oil prices but also rising coal imports. The sharp depreciation of the rupee against the US
dollar, from the middle of 2011 to 2013, also significantly raised the cost of imported energy. The
trade deficit narrowed in FY2014 and further improved in FY2015 thanks to falling oil and energy
prices, among other factors.20
The coal import bill jumped from $9.1 billion in FY2011 to $16.5 billion in FY2012 due both to surging
imports and coal prices as well as the rupee depreciation. It has remained elevated since then,
despite the fall in coal prices, and amounted to $17.1 billion in FY2015, an increase of 12 per cent
over FY2014. The corresponding amount in rupees increased by 13.2 per cent to INR 1,045 billion.
17 See OIES, China’s coal market : Can Beijing tame King Coal, CL1, December 2014,
http://www.oxfordenergy.org/2014/12/chinas-coal-market-can-beijing-tame-king-coal-2/ 18 Anand M.R., Prasad D.N, Recent trends in production and import of coal in India, Ministry of Coal Occasional Working paper
Series No. 1, 13 October 2013 http://www.coal.nic.in/sites/upload_files/coal/files/coalupload/wp101014.pdf 19 Anand M.R., Prasad D.N, Recent trends in production and import of coal in India, Ministry of Coal Occasional Working paper
Series No. 1, 13 October 2013 http://www.coal.nic.in/sites/upload_files/coal/files/coalupload/wp101014.pdf 20 The country’s crude oil import bill fell to $112 billion in FY2015 from $143 billion in FY2014 due to lower prices.

February 2016: Indian Steam Coal Imports
16
Figure 7: Coal import bill (FY2009–FY2015)
Source: Author’s calculations from Ministry of Commerce & Industry databank.
The Indian rupee fell by 32 per cent against the US dollar between July 2011 and September 2013,
before stabilizing at around INR 62–64/$. This depreciation almost entirely erased the 26 per cent
drop in Indonesian coal prices observed during the same period. In contrast, the relative stabilization
of the rupee in 2014 allowed Indian coal importers to benefit from the drop in coal prices registered
that year.
Figure 8: Impact of exchange rate on imported coal prices 100=January 2011
Source: Author’s calculations from McCloskey and x-rates.com.
2.2.2 Volatility of coal prices and changes in foreign export policy
The high degree of import dependence is also a matter of concern at the microeconomic level for end-
users, particularly in the vital power sector, due to the uncertainties arising from the volatility in import
prices and changes in export policies in supplying countries.21
The price of imported coal has been highly volatile over the past 10 years. After reaching record highs
in July 2008 and at the beginning of 2011, the price of coal has been trending downwards since. The
21 Anand M.R., Prasad D.N, Recent trends in production and import of coal in India, Ministry of Coal Occasional Working paper
Series No. 1, 13 October 2013 http://www.coal.nic.in/sites/upload_files/coal/files/coalupload/wp101014.pdf

February 2016: Indian Steam Coal Imports
17
FOB22 price of steam coal exported from Indonesia (4,900 kcal/kg) has fallen by half in the past four
years, from $92/t in January 2011 to $43.4/t in July 2015. Though there were brief spikes,
international steam coal prices declined under the combined effect of slow growth in international
trade (particularly Chinese import demand), the expansion of coal supply in traditional supplying
countries (especially in Australia) and new suppliers (Mozambique), and the US shale gas revolution,
which pushed US coal mining companies to turn to the overseas market. In the short term,
international coal supply is expected to remain abundant and prices subdued. In the medium term,
international coal suppliers are expected to reduce their coal production in reaction to the low-price
environment and prices are expected to recover somewhat, although not to the level seen in 2011.
Therefore, the current low level of imported coal prices cannot be taken for granted in the long term,
whilst at the same time there are major uncertainties on future levels, which could also be influenced
by the level of Indian imports.
Figure 9: Evolution of steam coal FOB prices (January 2000 – July 2015)
Note: Australia FOB Newcastle – 6,700 kcal/kg beginning year 2011, 6,300 kcal/kg for period 2002–10, and
6,667 kcal/kg before 2002; South Africa FOB Richards Bay – 6,000 kcal/kg beginning year 2006, 6,200 kcal/kg
during 2002–05, and 6,390 kcal/kg before 2002; Indonesia FOB Southeast Kalimantan – sub-bituminous coal,
4,900 kcal/kg Net-as-received (NAR).
Sources: World Bank; McCloskey
India was already hurt by the rise in coal prices in 2009/10, when China suddenly emerged as a key
importing country and the market turned from oversupply to tightness. Despite its decreasing imports,
China’s influence on global coal prices is still determinant. In 2014/15, it played in favour of coal
buyers because the overcapacity on the Chinese coal market reduced its import demand and
consequently international coal prices.23
As India learnt to its cost with changes in the Indonesian export policy, changes in the regulatory
regime in exporting countries also impact the price and availability of coal. Indonesia's vast coal
reserves had attracted large investments by Indian companies, such as Tata Power, Adani Power,
and Reliance Power, who bought assets in the country to fuel their ultra-mega power plants (UMPP)
projects in India, while others, such as Lanco Infratech, have long-term agreements with miners and
traders in the country. But in September 2011 Indonesia adopted a new pricing regulation that aligned
its export price on international benchmark prices for all new and existing contracts. The sudden
doubling of the Indonesian coal price raised the cost of generation for Indian power utilities and thus
upset the economics of UMPPs being set up by Tata Power and Reliance Power. The power
companies won competitive bids for power supply based on a price of Indonesian coal of $24/t, while
22 FOB: Free on Board (does not include maritime transportation cost). 23 See OIES (2014), ‘China’s coal market: Can Beijing tame “King coal”?’, December 2014,
http://www.oxfordenergy.org/2014/12/chinas-coal-market-can-beijing-tame-king-coal-2/
February 2016: Indian Steam Coal Imports
18
the new benchmark price at the end of 2011 was closer to $60/t. Since there were no provisions for
passing through increased fuel costs in their power purchase agreements24 (PPAs), this led both to
lengthy renegotiations of contracts and losses for power generators. Finally, the UMMPs were
allowed to increase power rates due to the rise in Indonesian coal prices.
As India depends on Indonesian coal to a large extent to provide coal at an affordable price to key
consuming sectors, any change in Indonesian coal policy may hurt Indian buyers. Although Indonesia
is the world’s largest steam coal exporter, the government has tried several times to limit coal exports
to feed its growing domestic demand. In 2009, the Indonesian government established a Domestic
Market Obligation (DMO) scheme to guarantee coal supply to the domestic market. Since 2014, the
government has also tried to curb production to counter weak prices and the oversupply in the global
market. Some Indonesian mines have already closed due to weak market conditions and falling
prices; with increasing domestic demand for coal, there is an expected upward price pressure in the
medium term, though the market remains oversupplied in the short term. While a cap on coal
production has not yet been adopted in view of weak international market demand, newly introduced
rules in the coal industry (such as a ‘listed exporter’25 status and the obligation to use letters of credit
for all export deals) may limit coal exports. In addition, and in order to boost mining revenues,
Indonesia plans to raise coal royalties due by holders of Mining Business Permits (IUPs) to 7–13.5
per cent from 3–7 per cent previously, depending on the coal grades.
Delivered coal prices in India are also impacted by exchange rates, as seen in Figure 8, as well as by
maritime transportation costs and bunker prices. Maritime transportation costs are currently extremely
low but their future levels are very uncertain. For instance, the typical freight rate from Indonesia to
Indian eastern coast ports was $8.5/t at the beginning of 2014, but it had collapsed to $4–5/t in the
first half of 2015. Shipping costs have been at a record low, with the Baltic Dry Index26 falling to its
lowest level since 1986 at the beginning of 2015 and remaining at low levels since. Coal freight costs
on the South Africa–India route have declined from $15/t in 2014 to $8–10/t. Apart from falling crude
oil prices, the drop in the index is caused by an oversupply of dry bulkers combined with weak
demand for dry bulks, mainly explained by slower import demand of raw materials in China.
2.2.3 Security and independence of supply
In addition to economic concerns associated with coal imports, reducing the dependence on imported
coal is also rooted in considerations of energy security. For a large economy and large coal reserve
holder such as India, maintaining coal self-reliance and security is viewed as a strategic need in its
own right.27 This is particularly crucial as power generation relies on coal for 76 per cent of total
supplies.
Moreover, India is increasingly dependent on imported fuels to satisfy its requirements. Its import
dependence reached 43 per cent of commercial energy supply in FY2014 from 40 per cent in
FY2010. India’s dependence on foreign crude oil is very high, with 83 per cent of its crude oil
requirements met by imports in FY2014.
24 Power price under PPAs with Discoms are determined after rate-based bidding and approved by the state regulator (see Box
6). 25 A government list of companies which hold coal export licences. 26 The Baltic Exchange’s main dry bulk index is calculated from average daily earnings of Capesize, Panamax, Supramax, and
Handysize vessels. 27 Anand M.R., Prasad D.N (2013), op.cit. Anand M.R., Prasad D.N, Recent trends in production and import of coal in India,
Ministry of Coal Occasional Working paper Series No. 1, 13 October 2013
http://www.coal.nic.in/sites/upload_files/coal/files/coalupload/wp101014.pdf

February 2016: Indian Steam Coal Imports
19
Table 2: Energy import dependence in FY2010 and FY2014
Source: Central Statistics Office, 2015.
In a business-as-usual scenario, the government has estimated that the energy import bill of around
$150 billion would double to $300 billion by 2030.28 That this could be a major bottleneck to sustaining
economic growth has not been missed by the government, and Prime Minister Narendra Modi has
announced an ambitious roadmap for India’s energy self-sufficiency aiming at reducing energy
imports by 10 per cent by 2022 and by a further 50 per cent by 2030. In addition to energy
conservation measures, the roadmap focuses on developing domestic energy production and
encouraging alternate energy sources to fossil fuels.
2.2.4 The new policy is a turnaround from past policies which ‘built’ import demand
A certain amount of demand for imported coal was built-in and encouraged by previous energy/power
policies and strategies.
During the 10th and 11th Five-Year Plans (FYPs), one of the strategies adopted for increasing the
power generation capacity involved setting up UMPPs and large coal power plants in coastal areas.
Some of these projects were based on imported coal and their boilers designed to burn coal of higher
calorific value and lower ash content than other domestic plants. Furthermore, in view of the
shortages of coal and/or transportation bottlenecks, the Central Electricity Authority (CEA) in 2011
recommended that all new coal-based projects be designed for a blend of domestic and imported coal
up to a blending ratio of 30 per cent.29
In response to coal shortages, the previous government adopted a strategy aimed at acquiring coal
mines and assets overseas, mainly in Mozambique, Indonesia, South Africa, and Australia. A joint
venture company, ICVL30 (International Coal Ventures Private Limited), was accordingly formed in
2009 for securing coal assets overseas and thus ensure supply of imported metallurgical coal and
high-quality steam coal. A number of Indian ventures, members of ICVL or private companies, have
expanded into international coal markets since then. However, the interest in acquiring overseas
assets has declined over the past year with a refocus on domestic resources. Simultaneously, with
the gap between the global and domestic price of coal narrowing, the financial viability and returns on
investments from overseas projects are also being squeezed.
28 Livemint.com, ‘NITI Aayog making a blueprint to tackle India’s energy woes’, 8 April 2015, http://www.livemint.com/Politics/x5rDmnYkkY4lAuUVCEnBsI/NITI-Aayog-making-a-blueprint-to-tackle-Indias-energy-woes.html 29 National Thermal Power Corp. (NTPC), Blending of imported/high grade coal with domestic coal,
http://www.eecpowerindia.com/codelibrary/ckeditor/ckfinder/userfiles/files/Blending%20of%20Imprted%20%26%20Domestic%2
0Coals%20-%20Mr_%20I_K%20Rajdeva.pdf 30 ICVL is owned by Steel Authority of India (SAIL), CIL, Rashtriya Ispat Nigam Ltd (RINL), National Mineral Development Corp.
(NMDC) and NTPC, http://icvl.in/aboutus.php?tag=company-aboutus
Total primary energy
supply Net imports Import dependence (%)
Crude oil (Mt)
FY2010 193 159.3 83%
FY2014 227 189.2 83%
Natural gas (bcm)
FY2010 55.67 9.15 16%
FY2014 47.67 13.03 27%
Coal (excl. lignite) (Mt)
FY2010 602.9 70.8 12%
FY2014 732 166.3 23%
Total commercial energy sources (Mtoe)
FY2010 507.2 200.8 40%
FY2014 596.4 257.2 43%
February 2016: Indian Steam Coal Imports
20
Box 4: Overseas investment
CIL was one of the five members of ICVL, but in February 2015 its board decided to withdraw from
ICVL citing a conflict of interest.31 Over the past few years, CIL had earmarked $5.46 billion of its total
free cash flow to acquire and develop coal assets overseas.32 Its experience in Mozambique, where
the company explored two concessions in the Tete region, has revealed the high risks involved in
developing mineral assets in foreign countries and uncertainties over their quality. In July 2015, the
company relinquished part of its exploratory assets in Tete after disappointing exploratory results.
Besides Mozambique, CIL’s other overseas acquisitions which failed to take off at the negotiations
stage over the past few years include assets of Peabody Energy in the US and PT Dian Swastatika
Sentosa in Indonesia.
ICVL and Tata Steel Limited acquired 65 per cent stake of the Benga coking coal mine (also in
Mozambique) from Rio Tinto in July 2014 for $50 million. The mine, however, has started incurring
losses due to low prices of coking coal and high mining and transportation costs.33
While CIL is withdrawing from overseas activity, there is still interest from Indian companies for
overseas investment, led by Adani’s investment in Australia.
In Queensland, Adani is aiming to build the Carmichael Mine and a port expansion at Abbot Point.
Estimated to be worth about $12 billion, the Carmichael project is the largest (60 mtpa – million tons
per annum) of nine super-mines proposed for the Galilee Basin, one of Australia's richest coal
reserves. The company has invested $900 million so far in the Australian mine, and in May 2011 it
acquired the Abbot Point Coal Terminal in North Queensland for $1.8 billion. The mine, approved in
2014, was again given the green light by the Australian federal government in October 2015, two
months after the previous approval was challenged by a federal court. However, despite major
contracts awarded to develop the mine, financial issues strengthen doubts about the viability of the
project since the National Australia Bank announced it would not fund the mine.34 Adani remains
highly committed to the development of the Carmichael Mine and the associated North Galilee Basin
Rail Project.35
Adani has also acquired assets in Indonesia, where it holds a mine at Bunyu in East Kalimantan with
reserves estimated at 269 Mt and peak production capacity of 7 mtpa.
Other companies which acquired assets in overseas markets at the beginning of the decade include
Tata Power, Essar Energy, Jindal Steel and Power, Reliance, GVK Power and Infrastructure, and
Lanco Infratech.36 Recently, Reliance decided to sell its three mines in Indonesia to focus its coal
mining activity in India.37
In April 2015, SCCL announced its intention to acquire majority stakes in coal mines in Australia,
Indonesia, South Africa, and Mozambique and floated a global expression of interest (EoI).38 The
company is looking for mines with annual production capacities of at least 2 Mt and reserves of at
31 The coal age, CIL Withdraws from ICVL, 26 March 2015, http://www.coalage.com/news/world-news/4309-cil-withdraws-from-
icvl.html#.VRyI4PmsXuI 32 Mining Weekly, CIL shifts overseas funding to domestic markets, 28 July 2015, http://www.miningweekly.com/article/cil-shifts-overseas-funding-to-domestic-markets-2015-07-28 33 4-traders.com, ‘Mozambique mine eating into assets of ICVL, Tata’s’, 13 April 2015, http://www.4-traders.com/TATA-STEEL-LIMITED-9058836/news/MOZAMBIQUE-MINE-EATING-INTO-ASSETS-OF-ICVL-TATAS-20193549/ 34 BBC, ‘Adani's Australian coal prospects in doubt’, 9 August 2015, http://www.bbc.com/news/world-australia-33815059 35 Australian Financial Review, Adani granted approval for Carmichael mine, 15 October 2015,
http://www.afr.com/business/mining/adani-granted-approval-for-carmichael-mine-20151015-gk9wz5 36 See http://www.sourcewatch.org/index.php/Indian_company_investments_in_overseas_coal_mines 37 Money Control, ‘Reliance Power to sell off three Indonesian coal mines’, 1 October 2015,
www.moneycontrol.com/news/business/reliance-power-to-sell-off-three-indonesian-coal-
mines_3354861.html?utm_source=ref_article 38 4-traders.com, ‘Singareni eyes coal mines abroad’, 11 April 2015, http://www.4-traders.com/COAL-INDIA-LTD-9060008/news/Coal-India--Singareni-eyes-coal-mines-abroad-20181100/

February 2016: Indian Steam Coal Imports
21
least 50 Mt. SCCL aims at increasing its supplies and becoming the sole supplier to any planned
power plants or other coal-consuming projects in the Telangana state.
Should steam coal imports in India cease completely, the projects are at risk of becoming stranded
due to the oversupplied global market.
The New Coal Distribution Policy (NCDP), adopted in 2007, introduced a system of coal allocation
based on the issuance of letters of assurance (LoAs) upon recommendation of the Inter-Ministerial
Standing Linkage Committee (Long-Term), or the SLC-LT.39 Earlier, power projects were directly
granted coal linkages. The NCDP included a provision envisaging coal imports by CIL to cover its coal
supply agreements (Fuel Supply Agreements, known as FSAs or coal linkages) with power plants.
Due to coal shortages and increasing number of applicants for FSAs, a presidential directive of July
2013 revised the norms for FSAs to be signed with power companies. The directive stated that for
power plants which have been commissioned or will be commissioned during the period from 1
September 2009 to 31 March 2015, with an aggregate capacity of 78,000 MW, CIL will supply 80 per
cent of the annual contracted quantity (ACQ) of the FSA commitment. Due to fuel constraints, 65 per
cent will be supplied through CIL’s own production while the remaining 15 per cent will be supplied
through imports. The quantity supplied by CIL from its production will gradually increase from 65 per
cent of ACQ until FY2015 to 67 per cent in FY2016 and further to 75 per cent from FY2017. To meet
its remaining FSA obligations, CIL will need to import and supply coal to willing thermal coal plants on
a cost plus basis, but it is not responsible for the transportation of coal from the port to the plant.
Imports, however, are not the sole prerogative of CIL, and the power producers with whom the FSAs
have been signed have the right to import coal directly. CIL has appointed Metals and Minerals
Trading Corporation (MMTC), a public trading house and import agency, to import coal supply on its
behalf.40
This has created two different FSA models with varying assured levels of supply for the power utility
sector, pre-2009 plants and post-2009 power plants. For power plants commissioned prior to 31
March 2009, the government had decided in 2013 to supply coal for a period of 20 years entirely with
domestic coal and with an assured level of 90 per cent of the FSA commitment. For the power plants
commissioned after 1 April 2009, the level of assured domestic supply at regulated prices is reduced
to 65 per cent. In FY2015, CIL increased its FSA deliveries to all thermal power plants (TPPs) to 386
Mt, compared with commitment of 452 Mt (that is, 85 per cent of its commitments).
Following a long debate on how to allocate the higher costs of imported coal and a proposed coal
pooling formula, the government finally decided to pass through the additional cost to the state
consumers. However, due to their financial situation, state Discoms are not able to pay or pass
through the additional cost.
This policy largely explains the surge in steam coal imports by the power sector registered in the past
three years, as CIL only provided 65 per cent of the requirements of the power plants commissioned
after March 2009 (this will rise to 67 per cent in FY2016). Likewise, imports of coal by the power
sector should ‘automatically’ decrease (in relative terms) from FY2017, when the quantity delivered by
CIL on its own production is increased to 75 per cent by 2017. It also partly explains the fall in
utilization of power plants registered in the past two years (see Section 3.2), as state Discoms are
39 So far 177 LoAs have been issued to various power plants including the central/state government sector as well as IPPs
covering capacity of 108,000 MW. Out of this capacity, the competent authority in 2013 had approved signing of FSAs in
respect of 78,000 MW of capacity from power plants which had been commissioned or were likely to be commissioned by
31.03.2015. The CCEA further directed that coal may also be supplied to specified power plants of 4,660 MW capacity and
other similarly placed power plants that did not have any fuel linkage subject to availability of coal. Altogether, these 82,466
MW requires around 430 Mt of coal per year on the basis of 5.2 Mt/MW (i.e. considering an average coal consumption of 0.7
kg/kWh at 85 per cent PLF). The power projects of the remaining capacity of 30,000 MW are yet to be authorized for signing of FSAs. In view of the negative coal balance reported by CIL’s subsidiaries, new linkages/LoAs have not been granted to any of the sectors since 2010. 40 In FY2015, CIL planned to import 5 Mt to meet its annual contractual obligations. It actually received orders for only 0.5 Mt. In
FY2016, imports by CIL could amount 1.6 Mt.

February 2016: Indian Steam Coal Imports
22
financially incapable of purchasing additional power based on costlier imported coal because they are
unable to raise domestic power tariffs for state consumers (particularly residential and agricultural)
due to political factors.
Despite clear signs that imports would surge – the Working Group on Coal and Lignite for the
formulation of the 12th FYP reported in November 2011 a projected a gap of 265 Mt between demand
and indigenous supply by FY2017, of which 230 Mt was steam coal – there was no comprehensive
import policy designed, nor any corrective actions to reduce these imports.41
Table 3: 12th FYP projected gap between coal demand and indigenous supply
Source: MoC, Working Group on coal and lignite for formulation of the 12th FYP, 2011.
This is suggestive of a circular debt problem. On the one hand, CIL was mandated to import coal to
comply with its FSA agreements, and state electricity consumers were required to pay for the
additional cost relative to domestic coal. But on the other hand, the high cost of imported coal has led
to economic and energy security issues. In addition to the trade deficit issue, the inability of state
Discoms to pay for their supplies or sign long-term PPAs with power generators has compromised the
security of electricity supply in the country and led to a vicious circle in which power plants have not
been able to pay for coal supplies nor repay their debt vis-a-vis their lenders.
In a sharp contrast with previous policies, the new government aims to cease steam coal imports.42
This was announced by Piyush Goyal, Minister of State for Power, Coal & New and Renewable
Energy, at the World Economic Forum in New Delhi in November 2014. While recalling the goal set
for CIL to double its coal production by FY2020, the minister stated his confidence that India might be
able to stop steam coal imports within the next three years. The steam coal self-sufficiency policy was
reiterated in May 2015, when the minister stated that ‘the growth in coal production would match the
growing requirement of electricity, expected to be two trillion units [that is, 2,000 TWh] by 2019’.43 The
minister also announced that ‘the declining trend would begin during the current fiscal year [FY2016,
from April 2015 to end of March 2016], with thermal coal imports ceasing in about two to two-and-a-
half years’ time; the higher calorific coal (coking coal) imports needed for steel plants would be likely
to continue’.44
The new policy represents a major strategic change in direction for India’s electricity sector. Its
success, combined with other reforms in the power sector, may allow the new government to fulfil its
main objectives of expanding access to energy while improving energy security and the balance of
payments. The road to steam coal independence, however, is a challenging one with major hurdles
on both sides of the supply-demand equation.
41 See Prayas (Energy Group), ‘Largesse that wasn’t: the story of coal shortages in India’, March 2014,
http://www.indiaenvironmentportal.org.in/files/file/Coal_Shortages_Report.pdf 42 The intention to stop coal imports refers to steam coal, and in priority to steam coal imports by power utilities. 43 Financial Express, ‘India to stop imports of low grade thermal coal in two years, says Piyush Goyal’, 15 May 2015,
http://www.financialexpress.com/article/economy/india-to-stop-imports-of-low-grade-thermal-coal-in-two-years-says-piyush-
goyal/72786/ 44 Business Line, ‘Thermal coal imports will stop by 2017: Goyal’, 15 May 2015,
http://www.thehindubusinessline.com/economy/thermal-coal-imports-must-be-stopped-
goyal/article7209584.ece?ref=relatedNews
Mt
Scenario I
(BAU)
Scenario II
(Optimistic)
Scenario I
(BAU)
Scenario II
(Optimistic)
Demand
Indigenous supply 715 795 950 1102
Gap 265.5 185.5 423 271
980.5 1373
12th FYP (FY2017) 13th FYP (FY2022)

February 2016: Indian Steam Coal Imports
23
3. Coal demand and the new energy policy
3.1 Coal demand is dominated by the power sector
India’s total coal consumption45 (hard coal, or ‘raw coal’ as referred to in Indian statistics, and lignite)
has almost doubled in the past 10 years, primarily driven by the needs of the power sector, reaching
around 865 Mt in FY2015, up 11 percent from 782 Mt in FY2014.46 Steam coal47 accounts for 88 per
cent, or 760 Mt, of India’s coal consumption. Coking coal48 (58 Mt) and lignite (47 Mt) make up the
balance.
Figure 10: Evolution of total coal consumption (FY2005–FY2015)
Source: Coal Controller’s Organisation.
The electricity sector is the largest user of coal in India, with the central generation utility NTPC
(National Thermal Power Corporation Limited) being the largest single buyer (75 per cent of NTPC’s
generation is fuelled by coal). The power sector (utilities and captive power plants) accounts for 69
per cent of India’s coal use. Its consumption is estimated at 600 Mt (FY2015), of which 40 Mt is
lignite.49 Despite the rise in domestic coal production, the sector suffers from chronic coal shortages
which previous governments have attempted to address, with little success so far. As mentioned
before, the shortages were not due to coal-power capacities, which surged from 84 GW in March
2010 to 165 GW in March 2015 – a 95 per cent increase. During the same period, coal-based power
generation increased from 540 TWh in FY2010 to 836 TWh in FY2015, which was an impressive rise
of 55 per cent but still left generation lagging behind the growth in capacity.
45 In international statistics, ‘coal’ consumption refers to hard coal plus lignite (for instance in IEA energy balances), as both
hard coal and lignite are used in the power sector. In Indian statistics lignite is treated separately. This report relates to hard
coal, except for this section. 46 Coal Controller’s Organisation, Provisional Coal Statistics 2014–2015, October 2015 and CCO, Coal Directory of India 2013–
2014, April 2015 47 Steam coal: coal used in power stations and industries, excluding as a raw material for the production of iron and steel. 48 The figure refers to metallurgical coal only. India produced 57.4 Mt of ‘coking coal’ in FY2015, of which only 14 Mt was of
metallurgical quality. The remaining was used in all sectors, including power plants. 49 According to CEA, the power utilities imported 91.2 Mt in FY2015. According to CCO, the power sector (utility + captive)
consumed 469.7 Mt of domestic hard coal production and 39.5 Mt of domestic lignite production.
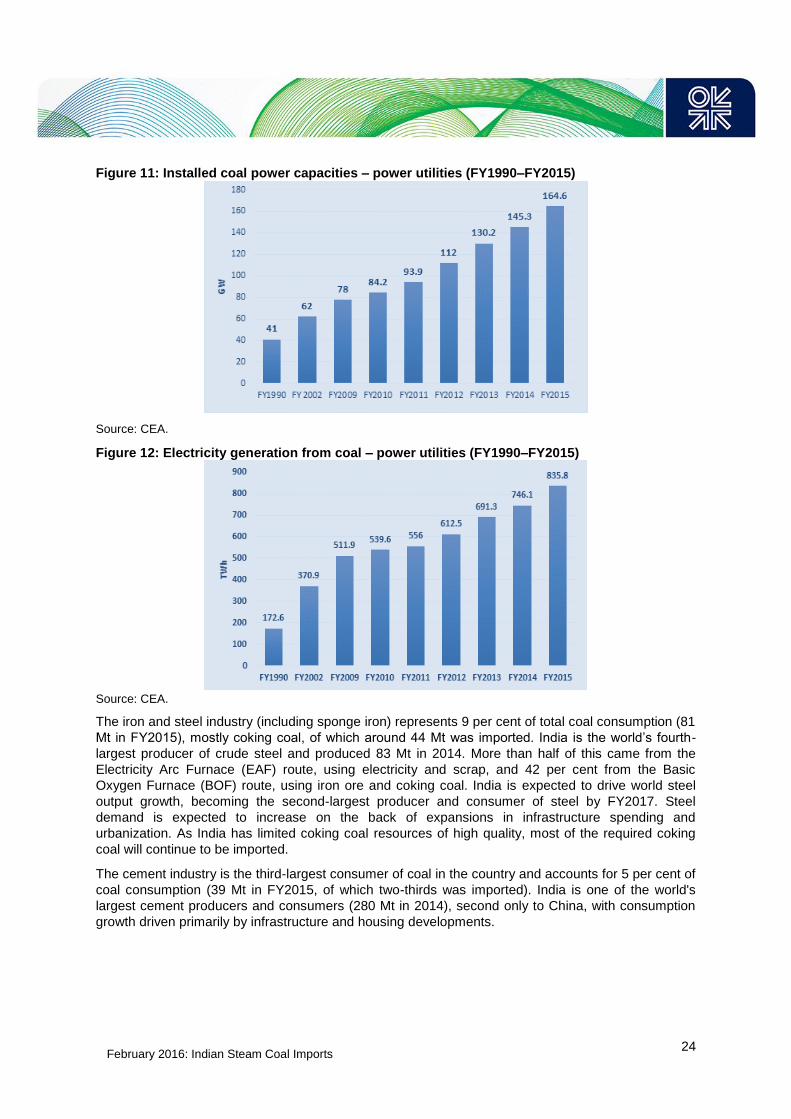
February 2016: Indian Steam Coal Imports
24
Figure 11: Installed coal power capacities – power utilities (FY1990–FY2015)
Source: CEA.
Figure 12: Electricity generation from coal – power utilities (FY1990–FY2015)
Source: CEA.
The iron and steel industry (including sponge iron) represents 9 per cent of total coal consumption (81
Mt in FY2015), mostly coking coal, of which around 44 Mt was imported. India is the world’s fourth-
largest producer of crude steel and produced 83 Mt in 2014. More than half of this came from the
Electricity Arc Furnace (EAF) route, using electricity and scrap, and 42 per cent from the Basic
Oxygen Furnace (BOF) route, using iron ore and coking coal. India is expected to drive world steel
output growth, becoming the second-largest producer and consumer of steel by FY2017. Steel
demand is expected to increase on the back of expansions in infrastructure spending and
urbanization. As India has limited coking coal resources of high quality, most of the required coking
coal will continue to be imported.
The cement industry is the third-largest consumer of coal in the country and accounts for 5 per cent of
coal consumption (39 Mt in FY2015, of which two-thirds was imported). India is one of the world's
largest cement producers and consumers (280 Mt in 2014), second only to China, with consumption
growth driven primarily by infrastructure and housing developments.
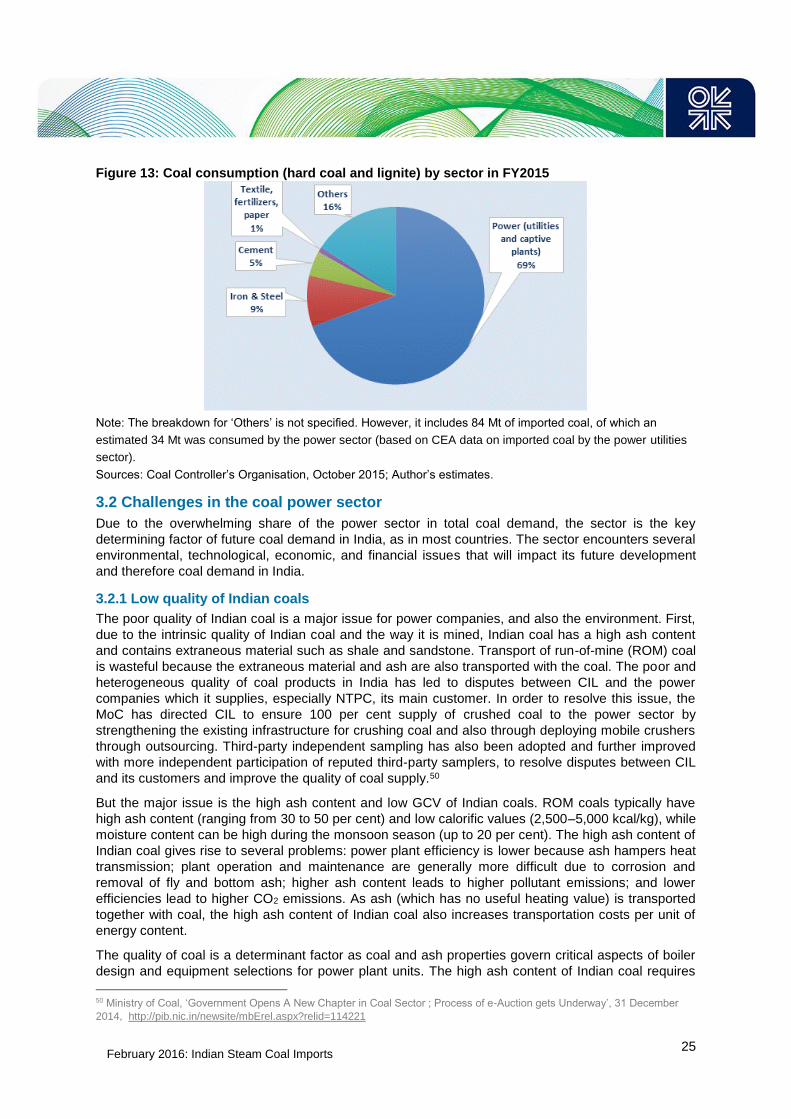
February 2016: Indian Steam Coal Imports
25
Figure 13: Coal consumption (hard coal and lignite) by sector in FY2015
Note: The breakdown for ‘Others’ is not specified. However, it includes 84 Mt of imported coal, of which an
estimated 34 Mt was consumed by the power sector (based on CEA data on imported coal by the power utilities
sector).
Sources: Coal Controller’s Organisation, October 2015; Author’s estimates.
3.2 Challenges in the coal power sector
Due to the overwhelming share of the power sector in total coal demand, the sector is the key
determining factor of future coal demand in India, as in most countries. The sector encounters several
environmental, technological, economic, and financial issues that will impact its future development
and therefore coal demand in India.
3.2.1 Low quality of Indian coals
The poor quality of Indian coal is a major issue for power companies, and also the environment. First,
due to the intrinsic quality of Indian coal and the way it is mined, Indian coal has a high ash content
and contains extraneous material such as shale and sandstone. Transport of run-of-mine (ROM) coal
is wasteful because the extraneous material and ash are also transported with the coal. The poor and
heterogeneous quality of coal products in India has led to disputes between CIL and the power
companies which it supplies, especially NTPC, its main customer. In order to resolve this issue, the
MoC has directed CIL to ensure 100 per cent supply of crushed coal to the power sector by
strengthening the existing infrastructure for crushing coal and also through deploying mobile crushers
through outsourcing. Third-party independent sampling has also been adopted and further improved
with more independent participation of reputed third-party samplers, to resolve disputes between CIL
and its customers and improve the quality of coal supply.50
But the major issue is the high ash content and low GCV of Indian coals. ROM coals typically have
high ash content (ranging from 30 to 50 per cent) and low calorific values (2,500–5,000 kcal/kg), while
moisture content can be high during the monsoon season (up to 20 per cent). The high ash content of
Indian coal gives rise to several problems: power plant efficiency is lower because ash hampers heat
transmission; plant operation and maintenance are generally more difficult due to corrosion and
removal of fly and bottom ash; higher ash content leads to higher pollutant emissions; and lower
efficiencies lead to higher CO2 emissions. As ash (which has no useful heating value) is transported
together with coal, the high ash content of Indian coal also increases transportation costs per unit of
energy content.
The quality of coal is a determinant factor as coal and ash properties govern critical aspects of boiler
design and equipment selections for power plant units. The high ash content of Indian coal requires
50 Ministry of Coal, ‘Government Opens A New Chapter in Coal Sector ; Process of e-Auction gets Underway’, 31 December
2014, http://pib.nic.in/newsite/mbErel.aspx?relid=114221

February 2016: Indian Steam Coal Imports
26
that boilers provide additional residence time for the carbon to burn out and must be around 20 per
cent larger than boilers sized for imported lower-ash coal.
Coal beneficiation (coal washing and/or coal blending) is a necessary measure for improving the
quality of ROM coal. This is usually done by crushing the coal and putting it in a liquid to separate the
lighter coal (low ash content) from the heavier coal (high ash content) and the extraneous material.
Washing increases the calorific value of coal and consequently its price. Washing makes coal more
suitable for consumers because it provides more consistent quality, increases the energy efficiency of
coal combustion boilers, reduces the required size of the power plant, reduces wear and tear because
extraneous material has been removed, and reduces the amount of fly ash that is produced. It also
makes transportation more efficient. For instance, the freight composition of Indian Railways is 47 per
cent coal by tonnage and 44 per cent by net ton-km, and 40−45 per cent of this is mineral content
(ash or non-coal). Moving washed coal with half of the mineral content/ash could free up 20 per cent
of the railway's freight carrying capacity.
Despite these benefits, very little coal is actually washed in India. The cost of washing (estimated at
$5/ton51) is too high and cannot be entirely passed through to consumers. Moreover, Indian coals
wash poorly due to their high inherent ash content.52 Currently, less than 20 per cent of the coal
produced is washed, as against the global average of over 50 per cent, and most washed coal is
coking coal. The capacity of washeries for steam coal is 100.7 mtpa, of which 13.5 mtpa is in three of
CIL’s washeries and 87.2 mtpa in 31 private steam coal washeries. Though their utilization rate is low,
this is expected to change in the coming years as India plans to make coal washing mandatory as
part of its effort to tackle climate change and air pollution.53
Quality and environmental concerns are already causing a shift towards higher utilization of washed
coal. As per the directives of MoEF in 2012, power stations located more than 1,000 km away from
coal mines, and those located in sensitive and urban areas, are required to use coal containing not
more than 34 per cent of ash on a quarterly average basis. According to amendments to the
Environment Protection Rules 20/4 (Environment [Protection] Amendment Rules, adopted in January
2014), the distance has been reduced to 750 km from 1 January 2015 and will be further reduced to
500 km from June 2016. Under a January 2015 amendment to the Environment Protection Rules
2014, besides the consumers, coal producers/suppliers are also responsible for ensuring that coal of
ash content not exceeding 34 per cent is supplied to the power plants. Also, the central and state
pollution control enforcement agencies now have power to act against coal suppliers and power
plants which do not comply with the new regulation.
CIL intends to implement the directive by building new washeries, through rationalization of coal
linkages (coal agreements) with power plants, and by utilizing washing capacities available in the
private sector.54 CIL is planning to open 15 new washeries with a total capacity of 93.1 mtpa, and nine
of these are for steam coal with a total proposed capacity of 74.5 mtpa. Out of these nine, three are
under construction. Beneficiation of steam coal in washeries has been planned on a ‘build, operate
and maintain’ (BOM) basis through global tenders. Furthermore, it has been decided that all new
opencast (OC) projects of 2.5 mtpa-capacity and above that are not linked to pithead power stations
should be designed with integrated washeries.
These developments will allow India to increase the efficiency of its thermal coal power fleet, reduce
pressure on the railway system, and save coal at the consuming point as less coal will be needed to
51 IEA, ‘Why most coal avoids a bath’, 15 July 2014, http://www.iea.org/ieaenergy/issue6/why-most-coal-avoids-a-bath.html 52 A major part of the ash in Indian coals is finely distributed within the coal’s structure, so-called inherent ash: washing such
coal to reduce ash content can be only partially successful (IEA, 2014). 53 Economic Times, ‘IPCC for phasing out coal, but India plans to make coal washing mandatory’, 8 November 2014,
http://articles.economictimes.indiatimes.com/2014-11-08/news/55836080_1_coal-washeries-coal-mining-projects-unwashed-
coal 54 MoC, Meeting of the IMC to formulate a policy on coal rejects allocation for washery reject based power plants – reg, Office
memorandum, 7 November 2014.
February 2016: Indian Steam Coal Imports
27
produce the same level of electricity. However, while beneficiation of coal provides many benefits, it
comes at a cost, besides the cost of washing itself.
First, coal and ash discrimination is not perfect, so the result is two fractions with higher and lower
calorific value than the original raw coal.55 ‘Washery by-products’ are highly polluting and have a very
low calorific value (between 1,000 kcal/kg and 2,200 kcal/kg). Unless a nearby power plant can burn
the rejected fraction, part of the coal’s energy is lost. While it is difficult to assign a number to that
rejection fraction, it tends to range from 5 per cent to 20 per cent. For example, raw coal of 4,000
kcal/kg and 38 per cent ash can produce two fractions: fourth-fifths of the raw coal that now has 4,500
kcal/kg and 30 per cent ash, and the remaining one-fifth with 2,000 kcal/kg and 70 per cent ash. If the
poorer fraction is not burned, 10 per cent of the raw coal’s energy is lost, which in a country like India
is significant considering the coal shortage. In addition, if unburned, this fraction must be disposed of
in an environmentally friendly manner, which can be problematic.
Therefore, beneficiation must be optimized to allow enough calorific value in the rejects to use them
and avoid their wastage. Coal rejects can be used in circulating fluidized bed combustion (CFBC)
furnaces for steam and power generation. At present, there are six washery rejects-based power
plants in India. The Environment Protection Rules 20/4 are not applicable to the transportation of
these rejects, provided they are used in CFBC or any other clean technologies. Currently CIL’s
washeries generate 1.3 mtpa of coal rejects, thought this is expected to increase to 18–19 mtpa after
the new washeries are commissioned.56 The MoP and CIL have stated they will encourage setting up
of washeries along with rejects-based power plants so that the rejects could be consumed in situ,
obviating the need to transport them for long distances.57
Finally, beneficiation of coal usually uses a lot of water. In addition, the used water is polluted with
coal dust, which is harmful to the local environment. To address this issue, the use of dry processes is
being considered, and while this may provide better performance, it does so at a higher cost.58
Coal blending in the power sector is also used by some power plants for meeting environmental
norms as well as sustaining power generation, due to the shortfalls in domestic coal supply and the
progressive degradation in coal quality (lower calorific values). High-grade coals from South Africa
and Australia have about twice the calorific value and carbon content of Indian coals and ash content
typically in the 15–25 per cent range (coal with less than 15 per cent is also available but in lower
quantities). Lower-rank Indonesian coal has a lower calorific value than Australian and South African
coals, but its ash content is low compared with Indian coal, typically 3 to 6 per cent.
Typically, imported coal is blended with domestic coal up to 15 per cent, subject to feasibility of
technical parameters of boiler design and other constraints. The boiler design is the main technical
constraint limiting the percentage of blending low-ash coal – the boilers are typically designed for a
particular coal specification.59 Coal blending may cause technical issues, such as melting of ash in
furnace and initiate slag formation; both issues will reduce the efficiency of the plant requiring
additional maintenance. The proportion of domestically produced coal and imported coal must
therefore be optimized so that the resultant coal blend has the desired composition (ash content,
percentage of volatile matters, and gross calorific value). These physical constraints typically impede
the use of blending coal in a proportion higher than 30 per cent, despite its environmental benefit and
possible commercial interest (in case of lower international prices), or requirements for rationalization
55 IEA, ‘Why most coal avoids a bath’, 15 July 2014, http://www.iea.org/ieaenergy/issue6/why-most-coal-avoids-a-bath.html 56 MoC, Meeting of the IMC to formulate a policy on coal rejects allocation for washery reject based power plants – reg, Office
memorandum, 7 November 2014. 57 MoC, ibid. 58 National Transport Development Policy Committee (NTDPC), Transportation of energy commodities, 2013,
http://tripp.iitd.ernet.in/publications/NTDPC/Vol%2002-2/NTDPC%20Vol%2002_Part%202%20Ch%2008.pdf 59 The GCV of coal considered for the design of boilers using domestic coal is about 3,300 kcal/kg, with performance
guarantees based on this specific coal. Boilers supplied by Bharat Heavy Electricals Limited (BHEL) can provide the rated
output with a coal quality variation of about 1,000 kcal/kg (e.g. from 3,000 kcal/kg to 4,000 kcal/kg), thus offering some
flexibility. IEA, ‘Why most coal avoids a bath’, 15 July 2014, http://www.iea.org/ieaenergy/issue6/why-most-coal-avoids-a-
bath.html

February 2016: Indian Steam Coal Imports
28
of coal sources. A KPMG study for the Inter-Ministerial Task Force (IMTF) on coal linkage
rationalization concluded that higher blending ratios of 50 percent to 100 per cent would require
technical changes to the power plant.60 In addition, the willingness to cease steam coal imports and
increased domestic production may limit the blending of imported coal (see Section 5.2.2).
3.2.2 Low efficiency of the current coal power fleet
Although the Indian coal fleet is relatively young, the average efficiency of India’s coal-fired power
plants is low: 33.1 per cent (High Heating Value [HHH], gross).61 India only commissioned its first
supercritical plant (efficiency of up to 40 per cent) in December 2010. The majority of India’s coal-fired
power plants is still based on subcritical technology with efficiencies of 31–33 per cent, although the
share of power plants based on supercritical technology is increasing rapidly (16 per cent at the end
of March 2015).
In addition to the high share of low-efficiency plants, there are a number of factors which contribute to
the low efficiency of Indian coal-based power plants.
The efficiency of a coal-fired power generation unit is broadly proportional to the temperature
difference between the internal heat source and the external environment.62 The high temperature of
cooling water in India’s tropical climate reduces the efficiency of power generation plants compared
with power plants built in other regions.
But a major factor is the poor quality of Indian coal as seen in the previous section. The lower heat
content requires that more coal is burnt for the same electrical output, leading to an increase in
specific local emissions of sulphur dioxide (SO2), nitrogen oxide (NOx) and particulate matters (PM),
and higher CO2 emissions.
For a number of reasons, primarily the poor quality of coal and the supply shortage, unexpected and
unscheduled maintenance outages, and longer commissioning periods for new units, India’s coal-fired
plants are also prone to low plant load factors (PFL).63 After increasing steadily through the 1990s and
2000s to load factors over 78 per cent, a drop to less than 65 per cent was reported in FY2015,
mainly due to the combination of the surge in installed power capacity and the inability of state
Discoms to buy more power. Low load factors are another cause of the low efficiency of power plants.
60 MoC, Report of the new Inter-Ministerial Task Force (IMTF) on Rationalization of sources of Coal to Power plants, 2 February
2015, http://www.indiaenvironmentportal.org.in/files/file/Report%20of%20the%20new%20Inter-
Ministerial%20Task%20Force%20(IMTF)%20on%20Rationalization%20of%20sources%20of%20Coal%20to%20Power%20Se
ctor.pdf 61 IEA, Energy Technology Perspectives, IEA/OECD, 2014 62 IEA, ibid 63 IEA, Energy Technology Perspectives, IEA/OECD, 2014.

February 2016: Indian Steam Coal Imports
29
Figure 14: Evolution of coal-based plant load factor (FY2010–FY2015)
Source: CEA, 2015.
The combination of high dependence on coal and inefficient generation means that India’s power
generation is highly carbon intensive. India’s power generation (all fuels and technologies) emitted
925 gCO2/kWh in 2012, well above the global average level (589 gCO2/kWh), and the carbon intensity
of the coal fleet is even worse (1,030 gCO2/kWh in FY2014).64 The power sector therefore presents
huge opportunities to reduce CO2 emissions. Modernizing thermal power plants and reducing the coal
usage per unit of electricity generation (kg/kWh) could decrease CO2 emissions by 13 per cent, and
even 30 per cent if advanced ultra-supercritical (AUSC) plants are adopted, as shown in Figure 15.
Figure 15: Effects of different technologies on coal use and carbon emissions
Note: Impact of different steam-cycle conditions on an 800-MW power station boiler burning hard coal and
operating at an 80 per cent capacity factor. Such a unit would generate 6 TWh of electricity annually and emit the
quantities of CO2 shown in the figure, depending on its steam-cycle conditions and corresponding efficiency.
Source: Barnes, 2015.
In the Indian context, moving from subcritical to supercritical plants can result in savings of coal usage
per unit of electricity generation in the region of 15 per cent (see Annex 4). Therefore, increasing the
average efficiency of the coal fleet and using washed coal are two methods that should be given
priority in order to reduce India’s CO2 intensity.
64 Lok Sabha, Ministry of Power, Answer to Question No 601, Pollution from thermal power plants, 23 July 2015.

February 2016: Indian Steam Coal Imports
30
Box 5: Government initiatives to improve the efficiency of coal-fired power plants
The government has already taken major initiatives to improve the efficiency of its coal-fired power
plants and to reduce the carbon footprint of the power sector.65
Supercritical technology is being adopted to enhance the efficiency of coal fired power generation and
reduce the specific coal consumption per kWh. A capacity addition of 24,750 MW based on
supercritical technology has already been achieved until the end of March 2015 (16 per cent of the
utilities coal fleet). Out of about 84 GW of coal-based power capacity under construction at the
beginning of April 2015, about 50 GW is based on supercritical technology.66
Supercritical technology has been made mandatory for Ultra Mega Power Projects (UMPPs). In the
13th FYP (2017 and beyond), all coal-fired capacity additions must be through supercritical units.
The shift towards supercritical technology has driven manufacturing capacity addition in this space.
Several domestic players have added supercritical manufacturing capacity, either on their own or in
joint ventures with global players. Specific boilers are designed to use domestic coal. Going a step
further, an advanced ultra-supercritical (AUSC) technology R&D project has been approved by the
government at a cost of around $240 million involving Bharat Heavy Electricals Limited (BHEL),
NTPC, and Indira Gandhi Centre for Atomic Research (IGCAR) to achieve higher efficiency, reduce
CO2 emissions, and reduce coal consumption for coal-based power plants. Under the project, BHEL
is to develop AUSC equipment which would then be commercialized, thus allowing India to build high-
efficiency in-house power plants.
There is a $25 billion proposed plan to revamp power plants older than 25 years into large/UMMP
projects.67
Renovation, modernization, and life extension of old thermal power generating units and retirement of
old and inefficient thermal generation units, in a phased manner, is being undertaken. A total capacity
of 3 GW was retired until the beginning of 2015. The government has issued a policy on automatic
transfer of coal linkage in case of scrapping of old units and replacing them with new supercritical
plants. A capacity of 32 GW of old units is being progressively retired.
The Ministry of Environment, Forest, and Climate Change (MoEF) has mandated the use of
beneficiated coal68 with a reduced ash content of 34 per cent (or lower) in power plants located
beyond 1,000 km from their coal source, or based in urban, eco-sensitive, or other critically polluted
areas. The distance has been reduced to 750 km from 1 January 2015 and will be further reduced to
500 km effective June 2016.
Under the ‘National Mission on Enhanced Energy Efficiency’, India implemented its ‘Perform, Achieve
and Trade (PAT)’ Mechanism. The scheme is a demand-side trading scheme in energy efficiency
certificates – it covers energy-intensive industry sectors which are encouraged to make targeted
achievements in energy efficiency over three-year periods. It covers the country’s largest industrial
and power generation facilities that, in total, cover more than 50 per cent of fossil fuel use in India.
The target is to achieve a 4 to 5 per cent reduction of energy consumption of the participating facilities
in 2015 (below 2010 levels). Sixty per cent of this is to stem from the power sector and 40 per cent
from the industrial sector. Under this scheme, individual targets for improving energy efficiency have
been assigned to 144 thermal units.
The government has also doubled the tax (cess) levied on coal production and imports – to INR 200/t.
65 Ministry of Power, ‘Initiatives to Improve the Efficiency of Coal Based Power Plants’, 12 March 2015, http://pib.nic.in/newsite/PrintRelease.aspx?relid=116893 66 Ministry of Power, CO2 emissions from thermal power plants, Statement at Rajya Sabha, 27 April 2015 67 Bloomberg, ‘World’s Worst Air Spurs Modi’s $25 Billion Utility Clean-Up Push’, 4 May 2015,
http://www.bloomberg.com/news/articles/2015-05-04/world-s-worst-air-spurs-modi-s-25-billion-utility-clean-up-push 68 ‘Beneficiated coal’ is coal containing higher calorific value but lower ash than the original ash content in the raw coal obtained
through physical separation or washing process.

February 2016: Indian Steam Coal Imports
31
Standards for local pollutants have also been proposed. Of the total pollution from the industrial
sector, the coal-based power sector currently accounts for approximately 60 per cent of particulate
matter (PM) emissions, 45–50 per cent of sulphur dioxide (SO2) emissions, 30 per cent of oxide of
nitrogen (NOx) emissions, and more than 80 per cent of mercury (Hg) emissions.69 Currently, India
only has standards for PM emissions from the power sector. With the aim of tightening emission
norms, the MoEF has proposed to tighten norms for emissions of PM and introduce standards for
SO2, NOx, and mercury and cut water use by coal-based thermal power plants.70 The new proposed
standards differ for new plants and existing ones according to their vintage. For new plants to be
installed from 1 January 2017, the proposed limits are: 30 mg/Nm3 for PM; 100 mg/Nm3 for SO2; 100
mg/Nm3 for NOx; and 0.03/Nm3 for Hg. Plants that were established after 2003 will need to meet
lower standards, while plants older than 2003 will be required to meet even less stringent norms.
3.2.3 Competition from renewables
In order to generate more electricity from clean energy sources, the government has announced a
massive target of 175 GW of renewable-based power generation capacity by 2022 (excluding large
hydropower), which is a major increase compared with the 36 GW of installed capacity at the end of
March 2015, and the 4 GW added in FY2015. 100 GW of this total is to be solar, 60 GW wind, 10 GW
biomass-based power, and 5 GW small hydropower projects. The ambitious target for solar energy is
a fivefold increase compared with the previous target of 20 GW set in the National Solar Mission,
launched in 2010.
To achieve the solar power target, the government aims at developing ultra-mega solar parks with a
combined capacity of 60 GW and 40 GW from roof-top solar projects. At the end of 2014, the
government had approved plans for 25 mega solar parks, with a combined capacity of over 20 GW, to
be developed in the following five years. 71 The government has also approved 15 GW of grid-
connected solar power projects to be added by NTPC. The implementation of the ‘Green Energy
Corridor Scheme’ – aimed at the transmission of renewable energy from generation points to the load
centres by creating intra-state and inter-state transmission infrastructure – has also been accelerated,
with capital raised from overseas, most recently from Germany.72
Power generation from renewable energy is expected to reach 300 TWh by FY2020 compared with
60 TWh in FY2015. This goal corresponds to the 15 per cent target for power supplies from
renewable sources set in India’s National Action Plan on Climate Change and represents a significant
increase from the 6 per cent share in FY2015.
The government needs to attract $100 billion of investment to help achieve its ambitious solar goal.73
In a first step, the government is providing $20 billion as a capital subsidy to promote solar capacity
additions in India. In addition, at the first Renewable Energy Global Investors Meet and Expo, ‘Re-
invest 2015’, held in February 2015 and initiated by the government to attract domestic and foreign
private investment in renewables, 293 local and foreign companies committed to generate 266 GW of
renewable energy over the next five to ten years. The initiative would entail an investment of about
$310–350 billion, potentially making India the world’s top investment destination for renewable
ventures.
69 EPR, ‘How to reduce emissions in coal-based power plants’, 15 July 2015, http://www.eprmagazine.com/article.php?ItemId=1209%20&%20CategoryId=5 70 Urbanemissions, ‘Thermal Power Plants - Emissions and Health Impacts of India's Coal Expansion’, April 2015,
http://www.urbanemissions.info/images/UEI/publications/draft%20Notification%20for%20public%20comments%20for%20the%
20Coal%20TPP.pdf 71 Climate Action Tracker, Countries: India, 2015, http://climateactiontracker.org/countries/india.html 72 PVTech, ‘India to build green energy corridors’, 8 June 2015,
http://www.pvtech.org/news/india_to_build_green_energy_corridors 73 Climate policy initiative, ‘Three ways to attract domestic institutional investment for renewable energy projects in India’,
September 2015, http://climatepolicyinitiative.org/2015/09/10/three-ways-to-attract-domestic-institutional-investment-for-
renewable-energy-projects-in-india/
February 2016: Indian Steam Coal Imports
32
The government has also encouraged the setting up of solar power projects through targeted policy
measures, such as: granting of a subsidy on off-grid applications; provision for a renewable purchase
obligation (RPO) for solar in the national tariff policy; concessional import and excise duty exemption;
accelerated depreciation and tax holiday; generation-based incentives and facility for bundled power
for grid-connected solar power; and priority sector lending. However, concerns remain over the ability
of state Discoms to purchase costlier green power on account of their poor finances. The government
is attempting to address this issue by revising its national tariff policy and through the launch of a debt
restructuring plan for Discoms in partnership with state governments.
The government has proposed an 8 per cent RPO by March 2019 for solar energy, up from the
previous target of 3 per cent by FY2022. This is a guideline, however, and the state electricity
regulators will eventually stipulate state targets. It has also proposed a renewable generation
obligation (RGO) for future coal/lignite project developers, under which developers of coal plants
would have to simultaneously develop the equivalent of 10 per cent of the coal plant capacity based
on renewable energy sources. Judging by the investment plans of major power utilities in India (NTPC
and Adani for instance), this diversification is already in progress.
The government also expects the cost of solar power to continue decreasing. Tariffs of solar
electricity have already dropped 60 per cent over the last four years, from INR 14.9/kWh in 2010 to
almost INR 5.75/kWh in 2015,74 and the government expects a further reduction to below 4.5/kWh.75
To achieve this reduction, the government is considering bidding in dollar-denominated tariffs to make
solar tariffs more competitive against foreign loans, which are cheaper than those offered by local
banks and financial institutions.
A Deutsche Bank report forecasts that solar power capacity will reach 34 GW by 2020 or 5 GW
capacity additions per annum, much lower than the government target which requires 15–16 GW
capacity addition per annum.76 By 2020, however, the report estimates that annual solar capacity
additions and investments could surpass those in coal power projects – mainly due to a slowdown in
coal plant construction – and reduce coal requirements by 70 Mt, largely impacting the highest-cost
power (imported coal).
Considering international state-of-the-art capacity factors of solar, wind, and other renewables, the
175 GW of renewables capacity could generate a maximum of around 500 TWh when fully
developed, which is unlikely to happen before the 2022 target date. This is equivalent to the
production of about 70 GW of coal-based power plants, and it would allow a reduction of around 500
Mt CO2 as well as saving of 300 Mt of coal. 77 This indicates how renewables will contribute to
expanding power generation and lowering India’s dependence on coal-fuelled electricity. However,
while renewable power development will slow down the need for additional coal capacities (or allow
the retirement of old, inefficient capacities), the growth of power demand means that India will still
need large conventional capacities.
74 Deutsche Bank, ‘Make way for the sun’, 19 July 2015, https://www.db.com/cr/en/docs/Deutsche-Bank-report-Make-way-for-
the-Sun.pdf 75 Niti Aayog, Infrastructure: Powering Growth through Connectivity, May 2015,
http://niti.gov.in/mgov_file/presentations/infrastructure-slides.pdf 76 Deutsche Bank, ‘Make way for the sun’, 19 July 2015, https://www.db.com/cr/en/docs/Deutsche-Bank-report-Make-way-for-
the-Sun.pdf 77 The calculation is based on a capacity factor of 85 per cent and coal consumption of 4.87 Mt/1,000 MW for old subcritical
plants and 4.19 Mt/1,000 MW for new supercritical plants, as per the new norms for coal consumption in TPPs issued on 15
January 2015. The coal saving amounts to 341 Mt in case renewable power capacity replaces old plants (retirement) or 293 Mt
if renewable power capacity reduces the need for building new supercritical plants. All results are the maximum achievable.
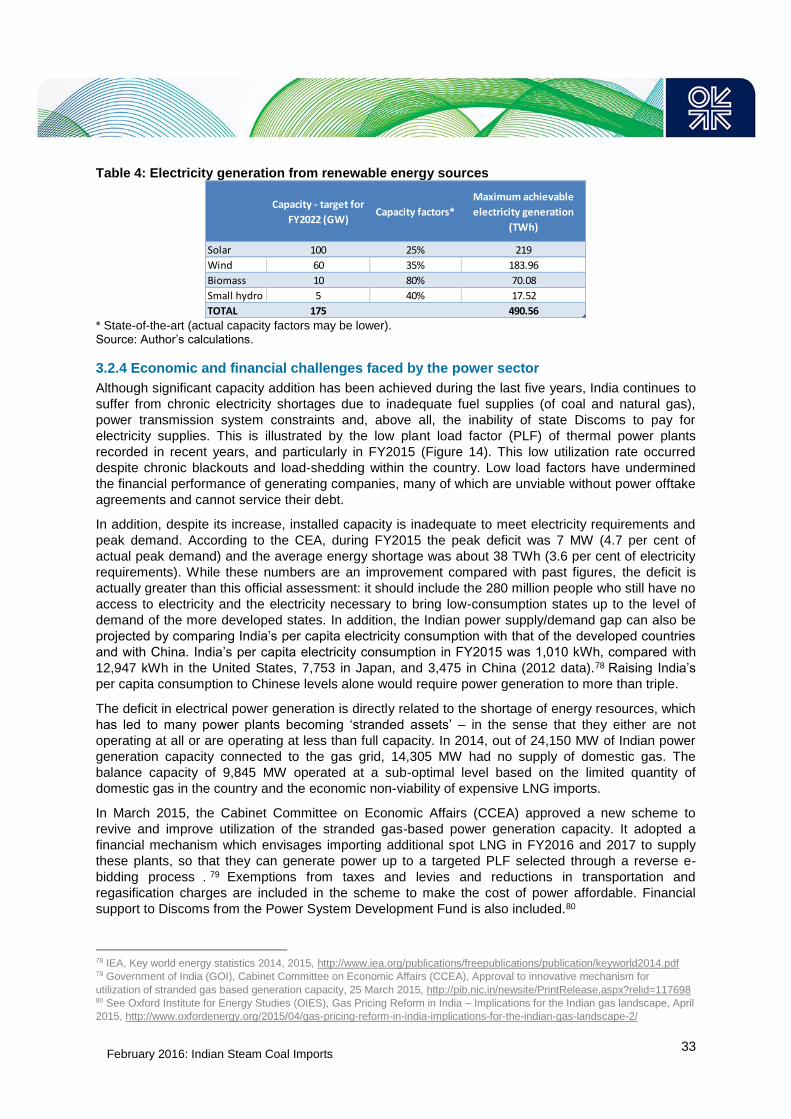
February 2016: Indian Steam Coal Imports
33
Table 4: Electricity generation from renewable energy sources
* State-of-the-art (actual capacity factors may be lower). Source: Author’s calculations.
3.2.4 Economic and financial challenges faced by the power sector
Although significant capacity addition has been achieved during the last five years, India continues to
suffer from chronic electricity shortages due to inadequate fuel supplies (of coal and natural gas),
power transmission system constraints and, above all, the inability of state Discoms to pay for
electricity supplies. This is illustrated by the low plant load factor (PLF) of thermal power plants
recorded in recent years, and particularly in FY2015 (Figure 14). This low utilization rate occurred
despite chronic blackouts and load-shedding within the country. Low load factors have undermined
the financial performance of generating companies, many of which are unviable without power offtake
agreements and cannot service their debt.
In addition, despite its increase, installed capacity is inadequate to meet electricity requirements and
peak demand. According to the CEA, during FY2015 the peak deficit was 7 MW (4.7 per cent of
actual peak demand) and the average energy shortage was about 38 TWh (3.6 per cent of electricity
requirements). While these numbers are an improvement compared with past figures, the deficit is
actually greater than this official assessment: it should include the 280 million people who still have no
access to electricity and the electricity necessary to bring low-consumption states up to the level of
demand of the more developed states. In addition, the Indian power supply/demand gap can also be
projected by comparing India’s per capita electricity consumption with that of the developed countries
and with China. India’s per capita electricity consumption in FY2015 was 1,010 kWh, compared with
12,947 kWh in the United States, 7,753 in Japan, and 3,475 in China (2012 data).78 Raising India’s
per capita consumption to Chinese levels alone would require power generation to more than triple.
The deficit in electrical power generation is directly related to the shortage of energy resources, which
has led to many power plants becoming ‘stranded assets’ – in the sense that they either are not
operating at all or are operating at less than full capacity. In 2014, out of 24,150 MW of Indian power
generation capacity connected to the gas grid, 14,305 MW had no supply of domestic gas. The
balance capacity of 9,845 MW operated at a sub-optimal level based on the limited quantity of
domestic gas in the country and the economic non-viability of expensive LNG imports.
In March 2015, the Cabinet Committee on Economic Affairs (CCEA) approved a new scheme to
revive and improve utilization of the stranded gas-based power generation capacity. It adopted a
financial mechanism which envisages importing additional spot LNG in FY2016 and 2017 to supply
these plants, so that they can generate power up to a targeted PLF selected through a reverse e-
bidding process . 79 Exemptions from taxes and levies and reductions in transportation and
regasification charges are included in the scheme to make the cost of power affordable. Financial
support to Discoms from the Power System Development Fund is also included.80
78 IEA, Key world energy statistics 2014, 2015, http://www.iea.org/publications/freepublications/publication/keyworld2014.pdf 79 Government of India (GOI), Cabinet Committee on Economic Affairs (CCEA), Approval to innovative mechanism for
utilization of stranded gas based generation capacity, 25 March 2015, http://pib.nic.in/newsite/PrintRelease.aspx?relid=117698 80 See Oxford Institute for Energy Studies (OIES), Gas Pricing Reform in India – Implications for the Indian gas landscape, April
2015, http://www.oxfordenergy.org/2015/04/gas-pricing-reform-in-india-implications-for-the-indian-gas-landscape-2/
Capacity - target for
FY2022 (GW)Capacity factors*
Maximum achievable
electricity generation
(TWh)
Solar 100 25% 219
Wind 60 35% 183.96
Biomass 10 80% 70.08
Small hydro 5 40% 17.52
TOTAL 175 490.56

February 2016: Indian Steam Coal Imports
34
The capacity of the transmission power grid is also inadequate. Grid infrastructure investments have
lagged behind investments made in the power generation sector, with the result that many thermal
power projects face constraints in evacuation. This limits the possibility to transfer electricity from
surplus states to those with acute power shortages and consequently limits growth in power
generation. There is insufficient inter-regional transmission capacity between west and the north and
between the west and the south. New corridors are planned to increase inter-regional transmission
capacity between these regions by the end of 12th FYP.
However, the weakest link in the power sector is at the distribution level, with an abnormal level of
electricity losses and the inability of state Discoms to pay for electricity supplies.
Aggregate technical and commercial transportation and distribution (AT&C) losses were estimated by
the CEA at 21 per cent of gross electricity generation in FY2015, a figure much higher than the 9 per
cent estimated at global level.81 If AT&C losses were at average global levels, India would have saved
133 TWh (author’s calculation based on electricity generation produced by utilities in FY2015). The
causes of the high level of losses are multiple and include theft of electricity, lack of metering, and the
outdated state of the distribution network. Utilities cannot invest in improving and upgrading the
network as they are insolvent. The lack of incentive regulation has also contributed to the
deterioration.
In order to reduce AT&C losses, the government has announced its intention to invest in the
distribution networks.82 Linked with the ‘24/7 Electricity for All’ program, two schemes have been
launched: the first, the Deen Dayal Upadhyaya Gram Jyoti Yojana (DDUGJY), was approved in
December 2014 with a total outlay of INR 430 billion ($7 billion) for feeder separation, augmentation
of sub-transmission, and distribution networks and metering, including electrification in rural areas;
and the second, established in November 2014, the Integrated Power Development Scheme (IPDS),
with an outlay of INR 326 billion ($5 billion), aiming at reducing AT&C losses and improving sub-
transmission and distribution networks and metering in urban areas.
The crisis occurring at state level is nothing new. In FY2013, Discoms across all states had incurred
accumulated losses of $46 billion.83 This was due to the provision of below-cost electricity to groups
such as agricultural and rural consumers. After realizing the gravity of the situation, in 2012 the
government implemented a scheme for financial restructuring of Discoms. However, they have
continued to face financial constraints because of the reluctance of state governments to revise tariffs
periodically. The average gap between power generation costs and tariffs charged by state Discoms
in FY2013 was INR 1.25/kWh or $23/MWh, making generation economically unviable. 84 These
companies are also often bankrupt due to lax implementation of bill collection, pilferage, and sharing
of the subsidy burden on state governments.85 Due to the tariff structure, the price realized from the
sale of electricity is less than the cost for procuring it, which means most Discoms prefer to undertake
load-shedding rather than buy more power, thus creating an artificial lack of demand for power.
The poor financial situation of state Discoms has also lead to delayed or non-payment to power
generators for the electricity supplied. In turn, power producers are in a difficult situation and owed
CIL around $1.4 billion at the end of 2014. Discoms’ inability to pay for electricity also prevents them
from signing long-term PPAs (power purchase agreements) with power producers; thus many power
projects are ready for commissioning but unable to find Discoms to sell power to. The construction of
81 CEA, Growth of Electricity Sector in India from 1947-2015, April 2015,
http://www.cea.nic.in/reports/planning/dmlf/growth_2015.pdf 82 Times of India, ‘India to invest $4 billion to tackle power theft’, 21 November 2014,
http://timesofindia.indiatimes.com/business/india-business/India-to-invest-4-billion-to-tackle-power-
theft/articleshow/45227741.cms 83 Niti Aayog, ‘Infrastructure: Powering Growth through Connectivity’, May 2015,
http://niti.gov.in/mgov_file/presentations/infrastructure-slides.pdf
84 CEA, Executive Power Summary September 2015. 85 Economic Times, ‘India sees lowest plant load factor in 15 years; power capacities operating at 65%’, 29 May 2015, http://economictimes.indiatimes.com/articleshow/47463610.cms?utm_source=contentofinterest&utm_medium=text&utm_campaign=cppst

February 2016: Indian Steam Coal Imports
35
28 GW of coal capacity was completed by the end of March 2015, but it has not been commissioned
yet as the plants have no fuel supply or power offtake agreements, thus rendering them unviable.86
An example of the problem of stranded power plants despite increases in generation capacity can be
found in NTPC, the country’s largest electricity generator, also considered a top performer. In the last
quarter of FY2015, its generation declined 2.1 per cent year on year, and the PLF of its coal-fired
plants fell to 82.7 per cent, a fall of six percentage points from a year ago. The company highlighted
that the fall in generation was due to lower demand from state electricity boards rather than shortages
of coal supply.87 This is also illustrated by the rising accumulated coal stocks at power plants (30 Mt at
the beginning of July 2015).
Unless Discoms are made financially viable and tariff reforms are pursued by state governments, the
central government's ‘power for all’ commitment for 2019 will face a serious challenge. To make the
sector viable and introduce more competition and transparency, the government introduced an
amendment of the Electricity Act 2003 (Amendment Bill 2014) in the Lok Sabha in December 2014
and a proposed revision of the power tariff. The Amendment Bill seeks to unbundle distribution
companies and introduce multiple supply licencees in the market, thereby introducing retail
competition and efficiency in the distribution sector and expanding the role of the private sector at the
distribution level. Other proposed amendments cover strengthening of grid safety and security, a
Renewable Generation Obligation (RGO) for new coal- and lignite-based thermal generating plants,
rationalization of the tariff determination process, performance oversight of Regulatory Commissions,
and strict enforcement of distribution utilities’ Renewable Purchase Obligations (RPO). At present, the
central government’s tariff policy is seen as a guide for state regulators, but it is not binding. Under
the 2014 Amendment Bill, the provisions of tariff policy are proposed to be made mandatory for the
determination of tariff by regulators. A revision of the national tariff, opened for consultation in April
2015, has also been proposed to allow an increase in fuel cost accounting for imported/market-based
e-auction coal in the rate structure. According to the amendment, ‘in case of reduced quantity of coal
supplied by CIL, vis-a-vis the assured quantity of 85 per cent, the higher cost of imported/market-
based e-auction coal for making up the shortfall shall be considered for being made a pass-through
by CERC/SERCs, on a case-to-case basis, to the extent of shortfall’.88
Making Discoms viable and ensuring adequate fuel supplies would allow India to generate an
additional 200 TWh without adding any new capacity.89 Obviously, the two issues can be solved only
gradually and with the participation of state governments.
Box 6: Power tariff regulations The power tariff is determined under Sections 61 to 64 of the 2003 Electricity Act by the appropriate
regulatory commission in line with the provisions of the act and the policies made thereunder.90
Whereas the tariff for generation and transmission companies owned or controlled by the central
government is regulated by the Central Electricity Regulatory Commission (CERC), the tariff for
generation, supply, and transmission within each state is determined by the respective State
Electricity Regulatory Commissions. State/Joint Electricity Regulatory Commissions (SERCs/JERCs)
notify the terms and conditions of tariff fixation for both public and private distribution licencees. The
act provides for guiding principles which the appropriate commission is required to consider for
specifying the terms and conditions of tariffs. SERCs are also guided by the tariff policy notified by the
86 Geonesis, ‘FIS lenders helping developers in coal auctions to avoid bad assets’, Volume 2, Issue 4, March 2015. 87 Livemint, ‘Lack of power demand hits NTPC in Q4’, 1 June 2015,
http://www.livemint.com/Money/Da7HXF37MWKMOX3FVRPWRM/Lack-of-power-demand-hits-NTPC-in-Q4.html 88 Business Standard, ‘Power charges: Leeway to be tightened’, 17 April 2015, http://www.business-
standard.com/article/economy-policy/power-charges-leeway-to-be-tightened-115041400889_1.html 89 The figure is based on the coal and gas-fired electricity generation achieved in FY2015 by power utilities (800 TWh and 41
TWh respectively). It takes into account a PLF of 75 per cent for coal plants (instead of 65 per cent) and 60 per cent for gas
plants (instead of 21 per cent). 90 Lok Sabha, Ministry of Power, Answer to Question No 59, Power tariff, 23 July 2015 and Energy Global, Power tariff
regulations and thermal coal demand, 29 July 2013, http://www.energyglobal.com/upstream/special-
reports/29072013/Salva_Report_India_power_tariff_regulations_and_thermal_coal_demand_285/
February 2016: Indian Steam Coal Imports
36
central government while specifying the terms and conditions of a tariff. An amendment to the act has
proposed to make these guidelines mandatory.
In contrast with international practice, prices paid by industrial customers are much higher than those
paid by domestic users. This is because industrial consumers cross-subsidize residential and
agricultural consumers. Average industrial tariffs amounted to INR 6.26/kWh in FY2014 compared to
INR 4.08/kWh for domestic users ($102.6/MWh and 66.9/MWh, respectively). 91 Power tariffs for
industrial users are on par with tariffs found in the Netherlands and Poland.
Before 2011, commissions regulated tariffs for power companies, considering a government-specified
return on equity or, alternatively, power companies themselves bid certain tariffs for the life of a
project or for a contract period. Since January 2011, all power generation projects are awarded based
on a competitive bidding process which requires developers to bid a lifetime tariff for a project. The
developer bidding the lowest tariff is selected and a power purchase agreement (PPA) is signed with
the distribution companies which is approved by the state regulatory commission. A power plant can
be built through either the DBFOO (design, build, finance, own, and operate) model92 (previously
known as Case-1) or Case-2 bidding route. In DBFOO model, land, water, fuel, and other project
related clearances are to be obtained by the project developer. In Case-2, these are the
responsibilities of the state government, except for fuel procurement, which is the responsibility of the
bidder in case of imported fuels. In both cases, the power plant developer can opt for either domestic
or imported fuels or, alternatively, have them prescribed by the government.
The tariff bid contains tariff components and escalation rates for the entire contract period, which is
typically 25 years. The bid is composed of several components: capacity, energy (fuel and non-fuel),
transportation, and fuel handling charges. In turn, these are sub-divided into a capacity charge and an
energy (fuel) charge. Variable sub-components can increase biannually with certain escalation rates
prescribed by the CERC. However, bidders differentiate by quoting different ratios as scalable and
non-scalable sub-components. A bidder quoting 100 per cent of the increase in fuel costs as scalable
will be able to pass through the complete fuel cost in the tariff.
3.3 An upcoming major reform: auctions of coal linkages
3.3.1 Four options for domestic coal supplies
Coal in India is supplied in four main ways,93 according to the New Coal Distribution Policy (NCDP)
adopted by the government in October 2007:
Fuel supply agreements (FSAs) or coal linkages. Linkages are assured supply commitments from state-owned producers, CIL and Singareni Collieries Company Limited (SCCL), to a company that has an end-use plant and needs fuel to run its operations. FSAs constitute about 82–85 per cent of the total coal which CIL supplies. CIL notifies prices of different grades of coal and supplies coal to its customers under FSAs (see below).
E-auctions. The consumers not covered by FSAs are supplied through e-auctions, wherein about 10 per cent of CIL annual production is offered for sale.94 This provides access to coal to consumers who are not able to source coal through FSAs for reasons like seasonality of coal requirement, limited requirement of coal not warranting long-term linkage, and shortage of coal under FSAs. Two e-auction schemes are offered: spot e-auctions for spot procurement of coal;
91 Lok Sabha, Ministry of Power, Answer to Question No 59, Power tariff, 23 July 2015,
http://164.100.47.132/LssNew/psearch/QResult16.aspx?qref=19191 92 Business Standard, ‘Power purchase rules changed’, 7 May 2015, http://www.business-standard.com/article/economy-
policy/centre-amends-rules-for-power-procurement-by-distribution-licensees-from-coal-based-projects-115050600662_1.html 93 Prayas (Energy Group), Largesse that wasn’t: the story of coal shortages in India, March 2014,
http://www.indiaenvironmentportal.org.in/files/file/Coal_Shortages_Report.pdf 94 In FY2014, CIL sold 58 Mt of coal through e-auctions. In FY2015, CIL cut its e-auction sales, as directed by the government, to increase deliveries to the power utilities sector.

February 2016: Indian Steam Coal Imports
37
and forward e-auction for consumers who wish to have assured supply over a longer period (one year for instance). The price of coal under e-auctions is market-driven.
Captive coal blocks. The third way of obtaining coal supplies is through owning a captive coal block, coal from which can only be used the block owner. Hence, the cost of coal is just the cost of mining the coal, including taxes paid to the state governments. Following the cancellation of 204 captive coal blocks by the Indian Supreme Court in September 2014, the government has begun re-allocating these blocks through transparent e-auctions (see Section 4.5). The price of coal in that case is the bidding price, and taxes are paid to state governments.
Imports. The fourth source of supply is imports, with prices negotiated between the buyer and the seller and based on prevailing international market prices, adjusted for quality.
Coal can also be obtained using a combination of the four options. For example, a power plant based
on a captive mine can get a ‘tapering linkage’95. Similarly, a power plant with coal linkages less than
coal requirements can import coal to make up the shortfall.
Coal is also supplied to power plants under best-effort MoU (Memorandum of Understanding) basis in
the case of ‘contingent’ situations (such as critically low stocks at power plants). In addition, in order
to facilitate liquidation of CIL coal stocks unable to reach the market due to logistical constraints, the
government has authorized power companies short of coal supplies to lift coal stocks on an ‘as is
where is’ basis, with these companies arranging their own transportation logistics.
3.3.2 Different prices for coal in India
India’s coal prices were officially partly deregulated in 2000, potentially allowing coal producers to set
their own coal prices based on an escalation formula under a cost-plus approach. However, in the
absence of an independent regulator and meaningful competitors the monopolistic status of CIL
means that, in practice, CIL sets coal prices in consultation with the MoC by taking into consideration
the following factors: production costs, inflation index, capacity of the market to absorb the coal price,
demand and supply scenario, landed cost of imported coal, requirement of capital for investments in
upcoming projects, and modernization of existing mines for augmentation of production.
In a price revision effective from 27 February 2011, the concept of dual pricing was adopted for the
first time by CIL: one price for consumers in the power utilities segment (including IPPs), fertilizers,
and defence (regulated sectors) and another one for consumers outside the regulated sector (iron
and steel, cement, CPPs, etc.). Prices for the non-regulated sector (except for higher grades) are
higher by around 35 per cent relative to the regulated sector.
Until 2011, Indian coal was priced based on useful heat value (UHV) measures, under which coal was
categorized and priced into seven grades in accordance with their heating values. As UHV is not an
internationally used measure, it caused difficulty in aligning the price and quality of Indian coal with
imported coal, and the pricing system was shifted from UHV to the international norm of using gross
calorific value (GCV) at the beginning of 2012. Under the new pricing system, the price of coal is
determined for 17 GCV bands (G1 to G17) and the bands are narrower (3,000 kcal/kg) than in the
UHV system. The new price system applies uniformly to all CIL’s subsidiaries, except Western
Coalfields Limited (WCL), whereas prices differed from one subsidiary to another under the previous
system. For WCL, there is a 10 per cent add-on above the applicable price for GCV bands due to the
higher mining cost in the states in which it operates. CIL last revised coal prices on 27 May 2013, but
prices are expected to increase in the medium term in line with rising costs of production.
The following table shows CIL’s price applicable to pithead ROM non-coking coal (referred to as
steam coal in this report) to the regulated sector (power plants, including IPPs, and fertilizer and
defence sectors) and non-regulated sectors (all other end-users, included CPPs). CIL also sells
washed coal at the price indicated below for each grade increased by INR 180/t (around $3/t).
95 A tapering linkage is the short-term linkage provided to those coal consumers who have been allocated captive coal blocks
for meeting the fuel requirements pending the mines being developed.

February 2016: Indian Steam Coal Imports
38
Table 5: Pithead run-of-mine coal prices of CIL (prices effective since 27 May 2013)
(a) For coal with a GCV exceeding 7,000 kcal/kg, the price is increased by INR 150/t over the price applicable for
G2 coal for every 100 kcal/kg increase.
Source: Ministry of Coal. Data converted in $ (1 US$ = INR 63).
On top of CIL notified prices, consumers have to pay royalties (14 per cent ad valorem) and other
taxes to producing states as well as the ‘cess levy’96 – which was doubled to INR 200/t in the 2015–16
budget presented in March 2015.
For CIL’s e-auctions, the price is market-driven and tends to be 50 to 60 per cent higher than CIL’s
notified price for the same grade. In FY2015, the government directed CIL to cut its e-auction sales to
25 Mt in order to increase deliveries to the power sector. CIL finally managed to sell 45 Mt (7 per cent
of its sales). Due to the reduced volumes of e-auction coal sales in FY2015, prices surged (64 per
cent above CIL’s average price), forcing some customers to resort to imported coal, the price of which
has been declining over FY2015. The MoC removed the cap on CIL’s e-auction sales from April 2015,
allowing the company to sell about 10 per cent of its annual production via e-auction. One of the key
reasons cited by the ministry was the rising pithead stock of CIL. 97 The removal of the cap is
significant for CIL as the company had been proposing an upward revision of notified sales prices
since November 2014 but had failed to get it approved by the government.
Table 6: CIL e-auction sales and prices vs. average sales prices
Sources: CIL; Motilal Oswal, 2015.
The increased volumes of e-auction sales are expected to boost CIL’s profitability. Low-grade steam
coal for the power sector comprises around 80 per cent of CIL’s production. To keep electricity tariffs
low, CIL sells this fuel at very thin margins. Therefore, CIL’s profit mostly comes from the 10 per cent
96 The cess is a tax which applies to coal mined in India as well as imported coal. 97 The company’s offtake in FY2015 at 489 Mt was lower than its output of 494 Mt, resulting in pithead stock increasing to 53 Mt
at the end of FY2015, from 47 Mt at the end of F20Y14, owing to evacuation issues.
Grade of coal GCV Bands (Kcal/Kg) (INR/t) ($/t) (INR/t) ($/t)
G1 Exceeding 7000 (a) (a) (a) (a)
G2 Exceeding 6700 and not exceeding 7000 4,870 77 4,870 77
G3 Exceeding 6400 and not exceeding 6700 3,890 62 3,890 62
G4 Exceeding 6100 and not exceeding 6400 3,490 55 3,490 55
G5 Exceeding 5800 and not exceeding 6100 2,800 44 2,800 44
G6 Exceeding 5500 and not exceeding 5800 1,600 25 2,150 34
G7 Exceeding 5200 and not exceeding 5500 1,400 22 1,890 30
G8 Exceeding 4900 and not exceeding 5200 1,250 20 1,690 27
G9 Exceeding 4600 and not exceeding 4900 970 15 1,310 21
G10 Exceeding 4300 and not exceeding 4600 860 14 1,160 18
G11 Exceeding 4000 and not exceeding 4300 700 11 950 15
G12 Exceeding 3700 and not exceeding 4000 660 10 890 14
G13 Exceeding 3400 and not exceeding 3700 610 10 820 13
G14 Exceeding 3100 and not exceeding 3400 550 9 740 12
G15 Exceeding 2800 and not exceeding 3100 510 8 680 11
G16 Exceeding 2500 and not exceeding 2800 450 7 610 10
G17 Exceeding 2200 and not exceeding 2500 400 6 540 9
Power utilities (including
IPP), fertilizers, and defence
sectors
Other sectors
FY2011 FY2012 FY2013 FY2014 FY2015
Auctions volumes (Mt) 48 51 44 58 45
Average e-auction price (INR/t) 1846 2599 2544 2182 2450
CIL's average sales price (INR/t) 1183 1443 1472 1463 1472
Average e-auction price ($/t) 41 54 47 36 40
CIL's average sales price ($/t) 26 30 27 24 24

February 2016: Indian Steam Coal Imports
39
e-auction offerings, sales of 5 per cent of high-quality fuel at import-parity price, and supplies to the
non-regulated sector at 35 per cent more than the rate for the power sector.98 While a small part of
overall volumes, e-auction sales contribute 35–40 per cent of CIL’s total Ebitda (earnings before
interest, taxes, depreciation, and amortization).
CIL’s sale prices are at a discount to global prices, except for high grade coal, partly due to low
calorific value and partly on account of the government directive to keep power tariffs low. While, until
recently, the majority of CIL’s coal sales were sold at a price around 50 per cent lower than global
prices (on an energy adjusted basis), the fall in international coal prices has narrowed the discount,
which nevertheless remains comfortable for low-grade coal. However, the low quality of Indian coal
and its high ash content, and the cost of transportation across the country, make some grades of
imported coal a more economic option for customers, particularly those located far away from the
mines but close to coastal ports. Table 7 compares the prices of delivered coal in India. It shows that
for customers of the non-regulated sector located at coastal ports and far away from domestic mines
(1,000km), international prices are currently lower than domestic prices.
Table 7: Price comparison between imported and domestic coal (July 2015)
(a) CFR – Cost and Freight.
(b) Assuming e-auction price is 64 per cent higher than CIL’s notified price.
Sources: Ministry of Coal; ICRA; McCloskey; Author’s estimates.
At current depressed international prices and low maritime freight rates, importing coal, which is also
of better quality (lower ash content) looks viable for non-regulated users based in the western regions
that are far away from the main mines. This development will need to be carefully monitored by the
government to avoid a surge in imports by users from the non-regulated sectors.
3.3.3 Auctions of coal linkages
Up to now, coal linkages have been allocated to power plants and other customers upon
recommendation of the Inter-Ministerial Standing Linkage Committee Long-Term (SLC-LT). To
increase transparency in the coal sector and provide a level playing field for supply of coal to different
users, the government intends to auction coal linkages/LoAs through competitive bidding instead of
allocating coal through the SLC-LT. In June 2015, the MoC released a draft methodology for the
proposed auctions. In a first step, only sales to the non-regulated sector (iron and steel, sponge iron,
cement, CPPs) would be auctioned.99 This represented 58 Mt, or 12 per cent, of CIL’s sales in
FY2015. Going forward, linkages for incremental sales to the power sector, and eventually all
linkages, would be allocated through the auction route only. This would be a key move toward market-
based pricing.
3.3.3.1 Non-regulated sector
With increasing coal shortages, the non-regulated sector has not received any coal linkage since
2009. It has made up its additional coal requirements through CIL’s e-auctions, captive coal mines,
98 Business Line, ‘Delay in price hike hits Coal India profits’, 4 March 2015,
http://www.thehindubusinessline.com/companies/delay-in-price-hike-hits-coal-india-profits/article6959717.ece 99 MoC, Minutes of the fifth meeting of the Inter-Ministerial Committee for proposed auction of coal linkages/LoAs through competitive bidding held on 04.06.2015, Office Memorandum, 24 June 2015
Indonesian
Coal
Domestic coal
regulated
sector
Domestic coal
non-regulated
sector
E-auctions
GCV (kcal/kg) 4200 G11 (4000-4300) G11 (4000-4300) G11 (4000-4300)
Run-of-Mine prices /CFR (a) prices, inc. Import duty ($/t) 40.0 11.1 15.1 18.2
Port Handling cost ($/t) 4.0
Royalty + other duties + Cess ($/t) 3.2 6.4 7.5 8.3Transportation cost from mine to coastal plants (1000 km) ($/t)
+ Sizing and handling charges0.0 25.3 25.3 25.3
Delivered price ($/t) 47.1 42.8 47.9 51.8

February 2016: Indian Steam Coal Imports
40
and imports. For instance, the cement industry imported 27 Mt in FY2015, two-thirds of its coal
requirements.100
In the non-regulated sector, the aim of the reform is therefore to encourage market-based pricing of
domestic coal in order to incentivize both coal production and the purchase of domestic coal by the
sector. The MoC has stated that because the sectors are not regulated and the price of final products
are determined by market forces, there is no justification of providing coal at less than the market
price.101 To determine the price to the non-regulated sector, the MoC would adopt the methodology of
bidding on volumes at progressively increasing prices set by the auctioneer (supplier-controlled
Ascending Market Clearing Auction System, or AMCAS), with the CIL-notified ROM price set as the
initial floor price. The FSAs of non-regulated sectors which are expiring/maturing in FY2016 onwards
may not be renewed and the coal quantities pertaining to these may be made available for linkage
auction. Besides this, 25 per cent of incremental production of CIL during FY2016 over FY2015 and
subsequent years may also be auctioned as linkages.102 Auctions would be conducted by CIL, and
the tenure of the linkage would be five years. The final bidding price would be adjusted according to a
price adjustment clause taking into account any changes in the cost of production. Despite requests
from several industry segments, the MoC has decided against reserving volumes of coal for
auctioning to specific coal-consuming sectors as was initially envisaged. Likewise, the latest draft on
linkages to the non-regulated sector excludes sales to PSUs and sales to the fertilizer sector.103
While the government move would create a level playing field between private players, by aligning the
price determination for all consumers, the non-regulated industry has expressed concerns over an
increase in the price of their domestic coal supplies,104 which is likely to be the case under the
AMCAS system. Since the methodology is to match the number of bidders with the quantity of coal
being bid, it is likely that the final price will be higher than the previous coal linkage price. In addition,
in case of higher bid prices, the AMCAS approach may prevent small and financially weaker
companies from bidding in the auctions to obtain their coal supplies.105 To address these issues, the
government has decided to earmark 25 per cent incremental coal produced by CIL each year and has
also reserved some coal blocks to be auctioned for exclusive use by small- and medium-scale
manufacturing plants.
The rationale behind charging market prices for coal auctioned to the non-regulated sector is that it
would allow the government to keep coal prices to the regulated sector low, thus ensuring a low
power tariff. At the same time, it would not compromise CIL’s financial situation and would allow
further investment in new mines. However, prices to non-regulated users also need to remain
competitive with international coal prices so as not to encourage the non-regulated sector to resort to
coal imports, thereby defeating the purpose of coal sector reform. The impact on coal imports will also
depend on the quantity of coal that will be available at auction. As mentioned earlier, the non-
regulated sector imported 77 Mt of steam coal in FY2015, a jump of 54 per cent over FY2014, due to
reduced e-auction sales. A key question therefore is whether the 25 per cent of incremental
production of CIL intended to be earmarked for auction of linkage will be sufficient to cover the needs
of the sector. The current mismatch between supply and demand may lead to a high price of coal in
the auction of coal linkages, reflecting the shortage of coal and not the correct value of coal, a
situation which may compromise Indian competitiveness and lead non-regulated consumers located
100 CCO, Provisional Coal Statistics 2014-2015, Ministry of Coal,
http://coal.nic.in/sites/upload_files/coal/files/webform/notices/Provisional_Coal_Statistics_2014-15.pdf 101 MoC, Minutes of the fifth meeting of the Inter-Ministerial Committee for proposed auction of coal linkages/LoAs through
competitive bidding held on 04.06.2015, Office Memorandum, 24 June 2015 102 MoC, Minutes of the seventh meeting of the Inter-Ministerial Committee for proposed auction of coal linkages/LoAs through
competitive bidding held on 24th September, 2015, Office Memorandum, 28 September 2015 103 MoC, 28 September 2015, ibid 104 Business Line, ‘Will coal linkage auctions really help the deregulated sector?’, 10 June 2015,
http://www.thehindubusinessline.com/economy/will-coal-linkage-auction-really-help-the-deregulated-sector/article7306238.ece 105 Indian Express, ‘Small bidders wary of methodology for CIL output auction’, 15 June 2015,
http://indianexpress.com/article/business/business-others/small-bidders-wary-of-methodology-for-cil-output-
auction/#sthash.gG6QrNd9.dpuf

February 2016: Indian Steam Coal Imports
41
far from domestic mines to favour coal imports. Auctioning of FSAs to the non-regulated sector is
expected to start in June 2016. The timing of the proposed reform is important, and the government
will have to take into account both the domestic and global supply-demand balance.
3.3.3.2 Regulated sector
For the regulated sector,106 the reform aims at eventually replacing all existing and new coal supply
contracts through a power tariff-based e-auction model under which the lowest-cost power producer
would get coal supplies from CIL.107
Future coal linkages in the regulated sector, after meeting existing commitments, could be granted
through allocating coal linkages to states/Discoms, who in turn would auction these linkages in tariff-
based bidding and assign them to the successful bidders.108 Thus the power tariff would be the sole
determinant for awarding coal linkages to the power plants through a transparent auction process.
Any escalations in the cost of coal, rail tariff, or any other cost would be a pass-through.
Linkages would be earmarked through various Discoms, based on the demand-supply situation. The
linkages would be for long-term periods (seven to 25 years) in order to give stability for planning and
investment. CIL could earmark a coalfield/mine area and Indian Railways could ensure coal
evacuation infrastructure so as to have more bid certainty and lower tariffs. The MoC has also
recommended that Discoms would arrange all the clearances and invite the bid on a plug-and-play
basis (that is, after all regulatory clearances have been granted).109
This new allocation method puts Discoms at the centre of the decision-making process through
allocation of coal linkages according to their supply-demand situation instead of allocating coal
linkage to power plants on the basis of SLC-LT recommendation. It goes hand in hand with ongoing
reform at the distribution level aiming at introducing competition in the sector and allowing multiple
suppliers.
In addition, to make coal available for power plants which are stressed or in short supply of coal for
the reason that they do not have coal blocks, linkages, or long-term PPAs, the government has
earmarked a separate portion within the e-auction quantity to prevent these assets from turning into
non-performing assets.110 Two separate e-auction sales were envisaged: first, for PPA holders (long
and medium term) by offering a quantity of 5 Mt and for others (short-term PPAs/without PPA) offering
a quantity of 5 Mt. The floor price for the e-auction window for PPA holders has been set at CIL
notified price plus 20 per cent premium and at CIL notified price plus 40 per cent premium for others.
To begin with, the MoC has decided to test the model for new power plants that were in short supply
of coal despite having fuel supply agreements. A first special e-auction sales for 5 Mt took place at the
beginning of October 2015 with a floor price at 20 per cent of CIL’s notified price. The tepid response
by power utilities (only 2.4 Mt sold) led the government to modify the norms of future auctions.111 The
remaining quantity of around 8.4 Mt up to March 2016 will be offered through forward e-auction and
the conditions for participation have been relaxed. There are no requirements for bidders to hold any
type of PPAs to be eligible to participate in the forward e-auction. Captive power plants may also be
allowed to bid, as one-time exception.
106 The regulated sector (central, state, and private power plants) gets coal either through linkages from CIL/SCCL or by mining
their own captive coal blocks, or through imports. 107 In the proposed auction methodology, a bidder would be required to quote separate figures for variable charges (escalable
and non-escalable) and fixed charges of electricity supplies at the delivery points specified by the Discoms. Taking an average
of both the charges, a levelized tariff would be fixed to select bidders and the lowest bidder would be declared as the preferred
bidder. 108 MoC, Minutes of the seventh meeting of the Inter-Ministerial Committee for proposed auction of coal linkages/LoAs through
competitive bidding held on 24th September, 2015, Office Memorandum, 28 September 2015 109 Indian Express, ‘Coal Ministry may ask Discoms to get clearances before bidding’, 28 June 2015, http://indianexpress.com/article/business/companies/coal-ministry-may-ask-discoms-to-get-clearances-before-bidding/ 110 MoC, Coal supplies for power projects beyond 30.6.2015, Office Memorandum, 30 June 2015, http://coal.nic.in/sites/upload_files/coal/files/webform/notices/300615.pdf 111 DNA India, ‘Centre relaxes norms after coal e-auction flops’, 19 October 2015, http://www.dnaindia.com/money/report-
centre-relaxes-norms-after-coal-e-auction-flops-2136266

February 2016: Indian Steam Coal Imports
42
With current low international coal prices, the premium of 20 per cent and 40 per cent for the power
and non-power sectors are higher than prices of imported coal. The depressed global coal market
reduces the government’s margin of manoeuvrability.
3.3.3.3 A new trading platform
Linked with the introduction of commercial mining in the country, which is expected to begin in
FY2016, the government is working on a common coal trading platform112 for CIL as well as private
and public companies (see Section 4.4). The electronic platform is likely to be an extension of CIL’s e-
auctions, where all the coal mined in the country, excluding from coal blocks allocated for captive use,
would be traded. The proposed platform could trade CIL’s auctioned supplies, the uncontracted
output of Public State Undertakings (PSUs), imported coal, and the output of private companies from
coal mines that will be auctioned for commercial use.
A common electronic platform will ensure transparent trading and facilitate competition between
different sources of domestic supplies (when private coal production takes off) – and also between
domestic and imported coal, based on price as opposed to imports based only on fuel shortage.
3.4 Future coal demand: focus on the power sector
3.4.1 Energy reforms and their impact on electricity demand
Several scenarios have been developed to assess India’s future energy and electricity demand. While
they all foresee a tremendous increase in power demand,113 most of them were prepared before key
government reform initiatives, including the fivefold increase of solar power capacity or doubling of
CIL’s production, or before the outcome of economic reforms could be assessed.
Despite a slight slowdown in the second quarter of FY2016, India is one of the fastest-growing major
economies in the world.114 According to the World Bank, India’s economic growth is expected to be
7.5 per cent in 2015, followed by further accelerations to 7.9 per cent in 2016 and 8.0 per cent in
2017.115 The Indian Economic Survey 2015 projects a growth rate of 8–8.5 per cent in FY2016 and in
double-digits thereafter.116 There is therefore a need to reassess future energy and electricity demand
in view of higher economic growth, the government commitment to give energy access to all, the
major push towards urbanization (central planners expect the urbanization rate to reach 60 per cent
as early as 2030, from around 30 per cent currently), and the priority given to electrification to ease
import dependence. The government has also set energy conservation targets in the new energy
policy.
Indian energy policy planners are working towards a growth rate of 8–10 per cent in the next 15
years,117 which would translate into rapid expansion in electricity demand. Specifically, the ambition of
the government is to double electricity generation to 2,000 TWh by FY2020 (1,105 TWh in FY2015) to
enable economic development at a price that makes Indian manufacturing competitive and electricity
affordable for Indian households.118 This growth represents a new paradigm. To meet this target,
112 Ventura, ‘Government mulls common coal trading platform for Coal India and private companies’, 23 June 2015, http://content1.acesphere.com/newscontentventura/NewsDetailsPointer.aspx?NewsId=381084&SecId=7&subsecId=15 113 For instance, in the IEA WEO 2014 New Policy Scenario (NPS), Indian electricity demand is expected to rise at a CAGR of
4.4 per cent from 869 TWh in 2012 (the reference year in WEO 2014) to 2,915 TWh in 2040. Indian coal demand is projected to
rise from 354 Mtoe in 2012 to 604 Mtoe in 2040, while coal production would increase from 260 Mtoe in 2012 to 465 Mtoe in
2040. In 2030 coal demand will reach approximately 1,342 Mt (604 Mtoe) under the NPS and 1,547 Mt (696 Mtoe) under the
CPS (Current Policy Scenario), assuming calorific value of 4 500 kcal/kg for Indian coal. India’s GDP growth is assumed to
average 6 per cent a year in the projected period (2013–2040). 114 Economic growth reached 7.5 per cent in the first quarter of FY2016, but slowed down to 7 per cent in the second quarter. 115 World Bank, Global Economic Prospects, June 2015,
http://pubdocs.worldbank.org/pubdocs/publicdoc/2015/9/961521443473555360/Global-Economic-Prospects-June-2015-Global-
economy-in-transition.pdf 116 Government of India, Economic Survey 2014-15, February 2015, http://indiabudget.nic.in/es2014-15/echapter-vol1.pdf 117 NITI Aayog, India Energy Security Scenarios, 2047 Version 2.0, Call for evidence, June 2015,
http://niti.gov.in/mgov_file/Call%20for%20Evidence-IESS%20V2/Call_for_evidence_15.06.pdf 118 Financial Express, ‘India to stop imports of low grade thermal coal in two years, says Piyush Goyal’, 15 May 2015,
http://www.financialexpress.com/article/economy/india-to-stop-imports-of-low-grade-thermal-coal-in-two-years-says-piyush-

February 2016: Indian Steam Coal Imports
43
while also reducing imports of fuels, the government aims at maximizing the potential of power
generation through all energy sources, solar, wind, hydro, nuclear, gas, and coal. A thorough look at
the development of coal power plants under construction shows that coal demand by the power
sector as projected in most scenarios is likely to be exceeded, despite the massive push towards
renewables. Recently, the government announced that coal demand would reach 1,200 Mt by
FY2020,119 which represents a CAGR of 7.9 per cent over the estimated demand of 820 Mt in
FY2015.
A huge investment of nearly $250 billion in the energy sector over the next four to five years will be
needed to increase energy supplies, including $100 billion in renewables and $50 billion in
transmission and distribution.120
Box 7: India’s INDC
At the end of September 2015, India submitted its INDC (intended nationally determined contribution)
setting out its approach to GHG mitigation ahead of COP21 in Paris.121 India has pledged to reduce
its carbon intensity by 33 to 35 per cent by 2030 compared to 2005 levels. India has also pledged that
40 per cent of the country’s electricity would come from non-fossil fuels by 2030, if the international
community helps with technology transfer and low-cost finance. India intends to introduce new, more
efficient, and cleaner technologies in thermal power generation, reduce emissions from the
transportation sector, and promote energy efficiency, mainly in industry, transportation, buildings, and
appliances.
Specifically, India has confirmed the goal to install 175 GW of solar, wind and biomass electricity by
2022, and to scale up further in following years. The country will also aggressively pursue
development of hydropower and also aims to achieve the target of 63 GW of installed nuclear power
capacity by 2032.
India intends to create an additional carbon sink of 2.5–3 GtCO2eq (carbon dioxide equivalent) by
2030 through additional forest and tree cover.
3.4.2 New coal-fired power plants
3.4.2.1 Coal-based capacity additions by FY2020
While investment in renewable energy sources is undoubtedly on the rise, there is even greater
investment already underway into coal-fired electricity generation which indicates that India’s coal
consumption is likely to rise for some time.
During the past three years, 53 GW of coal-based capacity was added to the fleet (that is, 18 GW per
year). According to the CEA, at the beginning of April 2015, there was 84 GW of announced coal
goyal/72786/. According to NITI Aayog, power generation from conventional sources is expected to increase from 1,048 TWh in
FY2015 to 1,491 TWh by FY2020, rising at a CAGR of 7.3 per cent in the next five years. Niti Aayog, Infrastructure: Powering
Growth through Connectivity, May 2015, http://niti.gov.in/mgov_file/presentations/infrastructure-slides.pdf 119 Financial Express, ‘Coal India goes for makeover’, 3 June 2015,
http://www.financialexpress.com/article/industry/companies/coal-india-goes-for-makeover/79443/ . CILs’ roadmap indicates
coal demand at 1,215 Mt by FY2020, CIL, Roadmap for enhancement of coal production, 26 May 2015,
http://coal.nic.in/sites/upload_files/coal/files/webform/notices/RoadMap_for_Enhancement_of_Coal_Production_26052015.pdf.
Higher figures (as high as 1.6 Gt) have also been quoted by the government. See for instance: Rediff.com, Govt to tap private
sector to meet 1.6 bn tonne coal demand, 20 December 2014, http://www.rediff.com/money/report/govt-to-tap-private-sector-
to-meet-16-bn-tonne-coal-demand/20141220.htm 120 Reuters, ‘Power minister says $250 billion needed to tackle energy crunch’, 6 November 2014,
http://in.reuters.com/article/2014/11/06/india-energy-investment-idINKBN0IQ0AK20141106 121 UNFCC, India’s intended nationally determined contribution,
http://www4.unfccc.int/submissions/INDC/Published%20Documents/India/1/INDIA%20INDC%20TO%20UNFCCC.pdf

February 2016: Indian Steam Coal Imports
44
capacity under construction and likely to be commissioned during the 12th FYP and beyond.122 Of this,
30 GW are planned to be commissioned during the 12th FYP (so in FY2016 and FY2017), although
some projects have been delayed. 123 In order to speed up these projects, the government has
decided to fast-track 10 projects, with 15.6 GW of capacity, which have hitherto been held up by land-
related issues.124 The remaining capacity under construction (54 GW) consists of additional projects
which were not originally included in the 12th FYP target. These power plants, mostly developed by
the private sector, are expected to be commissioned during the 12th FYP and beyond. They include
around 30 projects linked with captive blocks,125 with almost 18 GW of capacity, which are either
completed (10 GW) or close to completion but lack PPAs (see Section 3.2.4).126
Table 8: Coal-fired power plants under construction at the end of March 2015
Source: Ministry of Power, Answer to Question No. 501, Lok Sabha; Annex II: Details of thermal power projects
lying incomplete (under construction) in the country, 23 July 2015.
Based on the announced commissioning dates of the projects, most of the 84 GW of capacity is to be
commissioned in the next three to four years, except 11 projects with a combined capacity of 12.6
GW which are stalled due to financing and land issues. Therefore, projected capacity at the end of
FY2020 could increase by around 70 GW and reach 230 GW, assuming some delays in the actual
commissioning dates of the plants but no cancellations. New projects announced after FY2015 will
enter into service after FY2020 as it takes around five years to complete a new power plant from its
inception.
3.4.2.2 The UMMPs policy
In addition, the finance minister announced in February 2015 the setting up of five more ultra-mega
power projects (UMPPs) of 4,000 MW each.127 They entail investments of about INR 1 trillion ($16
122 Lok Sabha, Ministry of Power, Answer to Question No. 501, Annex II: Details of thermal power projects lying incomplete
(under construction) in the country, 23 July 2015. The list includes 82 thermal projects aggregating to 81.7 GW. For this
analysis, we have removed gas-fired power plants from the list, and added coal-fired power plants commissioned during the
first months of FY2016 to assess the situation from FY2016. 123 For instance, according to the CEA, 17.4 GW are expected to be commissioned in FY2016, while the detailed list of
identified projects under construction mentioned above includes 25 GW of capacity to be commissioned that year. 124 Economic Times, Government decides to speed up Rs 90,000 crore power projects, 9 March 2015,
http://articles.economictimes.indiatimes.com/2015-03-09/news/59931864_1_land-acquisition-law-lakh-crore-nabinagar. NTPC,
which intends to double its current capacity within the next ten years, is developing eight of the 10 projects. The company has
21 projects under construction, including joint-venture projects. Of this, 16 projects are coal-based. They would add 22 GW of
capacity, of which 14.4 GW from FY2016 to FY2018. 125 As the mines recently put up for auction will not be brought into production immediately, these projects have been given
assurances by the government on coal supplies from CIL, initially through tapering linkage and then through e-auctions. 126 New Indian Express, ‘Coal India Asked to Light up 30 Ongoing Power Projects’, 31 March 2015, http://www.newindianexpress.com/business/news/Coal-India-Asked-to-Light-up-30-Ongoing-Power-Projects/2015/03/31/article2738644.ece 127 Livemint, ‘Five ultra-mega power projects feature in Union Budget 2015’, 28 February 2015,
http://www.livemint.com/Politics/4PHOZ3Q2sSC1JZ3gth8mfM/Budget-2015-Finance-minister-announces-plan-for-ultra-
mega.html
GW Commissioned at end March 2015 To be commissioned Total
Projects to be commissioned during the 12th FYP (2012-2017)
Central government 8.5 5.5 14.1
States 9.9 2.4 12.2
Private 21.3 22.2 43.5
Total 1 39.7 30.1 69.8
Additional projects likely to be commissioned during the 12th FYP and beyond
Central government 0.0 20.1 20.1
States 0.3 16.8 17.1
Private 13.9 17.1 31.0
Total 2 14.2 54.0 68.2
Grand total 53.9 84.0 138.0

February 2016: Indian Steam Coal Imports
45
billion). The projects are proposed to be executed on a ‘plug-and-play’ model (all regulatory
clearances and coal linkage for the projects will be put in place before they are awarded to private
developers through a transparent auction). As it takes around five years to complete a project after its
award, the five UMMPs announced by the finance minister would add 20 GW of coal capacity towards
the end of the 13th FYP.
Box 8: The UMMPs policy
In order to meet the growing gap between demand and supply of power, the government introduced
the concept of UMPPs in November 1995. These large-scale projects, each with a capacity of about
4,000 MW, were aimed at building power capacities at low costs, benefitting from significant
economies of scale which could consequently facilitate the sale of power at low tariffs to consumers.
The projects were awarded to developers on tariff-based competitive bidding on a ‘build-own-operate’
basis. They use supercritical technology to achieve higher levels of efficiency, which results in coal
savings and lower CO2 emissions. They were developed as integrated power projects with dedicated
captive blocks for pithead projects. Coastal projects were designed to use imported coal.
Initially, nine such projects had been identified (four at pithead and five at costal locations). Later,
seven additional UMPPs were identified in various parts of the country. Of the 16 projects, only four
(Sasan in Madhya Pradesh, Mundra in Gujarat, Krishnapatnam in Andhra Pradesh, and Tilaiya in
Jharkhand) have been awarded to the successful bidders,128 and only two are operating (see Table
9). UMPPs have turned out to be more expensive than expected, leading utilities to seek increased
tariffs to recover their costs.129 Private sector interest in UMPPs has waned. The latest two offered up
to investors in 2013, Cheyyur (Tamil Nadu) and Bedabahal (Odisha) UMPPs, had to be
withdrawn due to inadequate investor response. With the proposed plug-and-play model, the
government hopes to revive private investors’ interest and resolve issues of long delays due to land
acquisition problems. The government expects to reopen the bids in 2015–16 for the two withdrawn
UMMPs, while the auction process for the remaining three announced in the Union Budget 2015–16
may be awarded in 2016–17. The government is currently determining the locations and plants that
can be taken up in UMPP mode and examining places where there is adequate land, water,
clearances of environment and forest, and coal block availability.130 The government is also looking at
the option of upgrading existing power plants into larger capacity-UMPPs using clean technology, and
offering them to investors in the plug-and-play mode. Sites where power plants are more than 25
years old could be considered as potential locations for UMPPs.
The exact number and implementation schedule of UMPPs therefore remain uncertain, as some initial
projects have been withdrawn or face environmental or local opposition issues, while new UMPPs
may be identified in the future.
128 Ministry of Power, Status of UMPP, 9 March 2015, http://www.pib.nic.in/newsite/erelease.aspx?relid=25644 129 Especially for UMPP based on imported (Indonesian) coal. See The Hindu, ‘Tata Power, Adani get relief for Mundra UMPP’,
23 February 2014, http://www.thehindu.com/todays-paper/tp-business/tata-power-adani-get-relief-for-mundra-
umpp/article5717910.ece 130 Economic Times, ‘Large projects will ensure 24x7 power for all in next five years: Piyush Goyal’, 18 May 2015, http://economictimes.indiatimes.com/articleshow/47321714.cms?utm_source=contentofinterest&utm_medium=text&utm_campaign=cppst
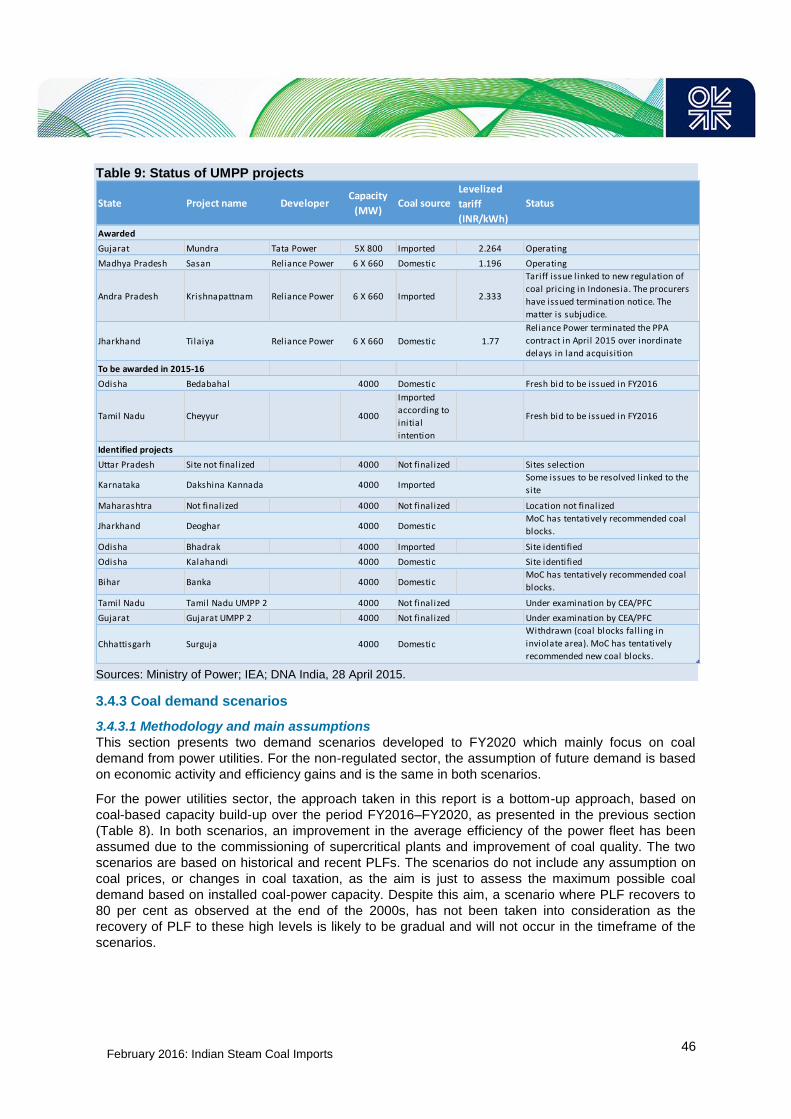
February 2016: Indian Steam Coal Imports
46
Table 9: Status of UMPP projects
Sources: Ministry of Power; IEA; DNA India, 28 April 2015.
3.4.3 Coal demand scenarios
3.4.3.1 Methodology and main assumptions
This section presents two demand scenarios developed to FY2020 which mainly focus on coal
demand from power utilities. For the non-regulated sector, the assumption of future demand is based
on economic activity and efficiency gains and is the same in both scenarios.
For the power utilities sector, the approach taken in this report is a bottom-up approach, based on
coal-based capacity build-up over the period FY2016–FY2020, as presented in the previous section
(Table 8). In both scenarios, an improvement in the average efficiency of the power fleet has been
assumed due to the commissioning of supercritical plants and improvement of coal quality. The two
scenarios are based on historical and recent PLFs. The scenarios do not include any assumption on
coal prices, or changes in coal taxation, as the aim is just to assess the maximum possible coal
demand based on installed coal-power capacity. Despite this aim, a scenario where PLF recovers to
80 per cent as observed at the end of the 2000s, has not been taken into consideration as the
recovery of PLF to these high levels is likely to be gradual and will not occur in the timeframe of the
scenarios.
State Project name DeveloperCapacity
(MW)Coal source
Levelized
tariff
(INR/kWh)
Status
Awarded
Gujarat Mundra Tata Power 5X 800 Imported 2.264 Operating
Madhya Pradesh Sasan Reliance Power 6 X 660 Domestic 1.196 Operating
Andra Pradesh Krishnapattnam Reliance Power 6 X 660 Imported 2.333
Tariff issue linked to new regulation of
coal pricing in Indonesia. The procurers
have issued termination notice. The
matter is subjudice.
Jharkhand Tilaiya Reliance Power 6 X 660 Domestic 1.77
Reliance Power terminated the PPA
contract in April 2015 over inordinate
delays in land acquisition
To be awarded in 2015-16
Odisha Bedabahal 4000 Domestic Fresh bid to be issued in FY2016
Tamil Nadu Cheyyur 4000
Imported
according to
initial
intention
Fresh bid to be issued in FY2016
Identified projects
Uttar Pradesh Site not finalized 4000 Not finalized Sites selection
Karnataka Dakshina Kannada 4000 ImportedSome issues to be resolved linked to the
site
Maharashtra Not finalized 4000 Not finalized Location not finalized
Jharkhand Deoghar 4000 DomesticMoC has tentatively recommended coal
blocks.
Odisha Bhadrak 4000 Imported Site identified
Odisha Kalahandi 4000 Domestic Site identified
Bihar Banka 4000 DomesticMoC has tentatively recommended coal
blocks.
Tamil Nadu Tamil Nadu UMPP 2 4000 Not finalized Under examination by CEA/PFC
Gujarat Gujarat UMPP 2 4000 Not finalized Under examination by CEA/PFC
Chhattisgarh Surguja 4000 Domestic
Withdrawn (coal blocks fall ing in
inviolate area). MoC has tentatively
recommended new coal blocks.

February 2016: Indian Steam Coal Imports
47
Table 10: Main assumptions for steam coal demand by power utilities
(1) Excludes 6 GW of lignite-based capacity.
Source: Author’s calculations.
First, the capacity build-up each year has been estimated, broken down into subcritical and
supercritical plants. It has been estimated that half of the plants commissioned during the 12th FYP
(2012–2017), and all capacity after 2017 (13th FYP), are based on supercritical technology, as
announced by the government. Only half of the additional capacity built in one year is available during
the year.
Then, plant load factors (PLF) have been applied to derive electricity generation each year, taking into
account auxiliary consumption of the plants. As stated, the scenarios are based on historical and
recent PLFs. In the first, the ‘low plant load factors’ scenario, the current low utilization of coal plants
(less than 65 per cent in FY2015, and even 61 per cent in the first half of FY2016131) continues over
the period. The PLF is assumed to fall to 63 per cent on average in FY2016 before recovering to 64
per cent in FY2017 and remaining at 65 per cent for the rest of the period. In the second scenario
(called ‘Improved PLF’), plant utilization gradually improves to 70 per cent by FY2020, although a low
PLF is assumed at the beginning of the period (see table 10).
The estimated coal demand is then calculated by applying specific average coal consumption per
KWh, which is currently 0.7 kg/kWh for subcritical plants and of 0.6 kg/kWh for supercritical plants.132
Current efforts to improve coal quality by washing coal is estimated to decrease the specific coal
consumption per kWh by 15 per cent from FY2017. This is applied to half of the coal power fleet.133
This implies that from FY2017 the specific average consumption is 0.65 kg/kWh for subcritical plants
and 0.56 kg/kWh for supercritical plants.
3.4.3.2 Estimation of capacity addition each year
The estimated capacity addition each year has been assessed based on the assessment of total
additional capacity by FY2020 (Table 8, Section 3.4.3.1), and taking into account the announced
commissioning date of each plant and some delays as observed in the past (30 per cent of the
announced capacity each year is delayed by one year). While there is still a significant number of coal
power plants under construction to be commissioned from FY2016 to FY2018, the number of plants to
be commissioned will fall after these dates. As some delays in the actual commissioning have been
131 CEA, Executive Summary, Power Sector, September 2015. The drop in the PLF since the beginning of FY2016 is sharp for
state power plants (PFL of 53.6 per cent in June 2015, compared with 61.6 per cent in June 2014) and private plants (55.4 per
cent versus 61.7 per cent). This may be explained by ‘lack’ of demand, but also by the non-availability of coal from coal blocks
as only 7 mines on the 67 auctioned/allotted at the end of March 2015 were in operation at the beginning of July 2015.
132 Niti Aayog, India Energy Security Scenarios, 2047 Version 2.0, Call for evidence, June 2015,
http://niti.gov.in/mgov_file/Call%20for%20Evidence-IESS%20V2/Call_for_evidence_15.06.pdf 133 According to a study of the National Transport Development Policy Committee, published in 2013, when the distance is
reduced to 500 km, about 90 GW of capacity would require about 360 mtpa of washed coal (National Transport Development
Policy Committee (NTDPC), Transportation of energy commodities, 2013,
http://tripp.iitd.ernet.in/publications/NTDPC/Vol%2002-2/NTDPC%20Vol%2002_Part%202%20Ch%2008.pdf). See also
Sections 3.2.1 and 5.2.2.
FY 2015
(provisional)FY2016 FY2017 FY2018 FY2019 FY2020
Installed capacity (GW at the end of the year) (1) 159 176 196 212 222 228
SubC 134 143 153 153 153 153
SC 25 33 43 59 69 76
Specific coal consumption (kg/kWh)
SubC 0.7 0.7 0.65 0.65 0.65 0.65
SC 0.6 0.6 0.56 0.56 0.56 0.56
Plant Load Factor
Low PLF Scenario 0.65 0.63 0.64 0.65 0.65 0.65
Improved PLF Scenario 0.65 0.63 0.65 0.66 0.68 0.70

February 2016: Indian Steam Coal Imports
48
assumed, the capacity addition in FY2019 is still significant but falls sharply in FY020. The result of
the assessment is presented in Figure 16.
The outcome is consistent with the current strategy of major power utilities. Their strategy consists in
improving utilization rates of existing thermal power plants rather than adding incremental capacity
above the projects currently under construction. This will slow down the rate of capacity build-up after
pending projects are completed in the next two to three years. It could even lead to cancellations of
projects ‘under construction’, which are at an early stage. A more efficient utilization of existing
capacity implies that less additional capacity would be required, leading to savings in capital costs.134
In addition, investments in solar power projects will further reduce the need for additional thermal
power capacity additions, as observed in Section 3.2.3. Therefore, coal-based capacity additions are
expected to decrease after FY2018, as most of the power plants currently under construction will be
commissioned.
Figure 16: Coal-based power capacity additions by FY2020
Source: author’s calculations based on CEA’s list of thermal power plants under construction as of 23 July 2015
3.4.3.3 Estimated demand by the power utilities sector
In the low PLF scenario (Scenario 1), power generation reaches around 1,200 TWh in FY2020 (a
CAGR of 8.1 per cent over the period) and requires coal supplies of around 730 Mt in FY2020. In
Scenario 2 (‘Improved PLF’), coal-based generation reaches around 1,300 TWh in FY2020 – a CAGR
of 9.7 per cent over the period FY2015–FY2020. This high level of electricity generation would require
coal supplies of almost 790 Mt in FY2020 – a CAGR of 8.2 per cent over the next five years.
Table 11 presents the results of our analysis, showing annual electricity generation and coal demand
over the period FY2016–FY2020, compared with actual (provisional) data in FY2015. Our projected
electricity generation for FY2016 is lower than the CEA estimated output, which in March 2015
estimated that coal-based power generation by utilities would rise by 11 per cent to 888.75 TWh in
FY2016 compared with 800.3 TWh in FY2015.135
134 If the current coal-based capacity (159 GW at end of March 2015) was utilized at 80 per cent, instead of 65 per cent,
electricity generation would increase to more 1,000 TWh compared with 800 TWh generated in FY2015. 135 Revision of electricity generation target of 2015–16, 5 May 2015,
http://www.cea.nic.in/reports/articles/god/generation_target_1516.pdf

February 2016: Indian Steam Coal Imports
49
Table 11: Estimated coal demand by the power utilities sector (FY2015–FY2020)
Sources: 2015 CEA (provisional), 2016-2020; Author’s calculations.
3.4.3.4 Estimated coal demand by the non-regulated sector
For the other sectors (non-regulated sectors: steel, captive power plants, cement, sponge iron, etc.),
the scenarios assume that demand increases in line with economic growth, expected at a CAGR of
7.5 per cent during the period in both scenarios. Efficiency gains reduce this growth rate by one
percentage point in both scenarios. Under these assumptions, total coal demand by non-regulated
sectors increases from 288 Mt in FY2015136 to 395 Mt in FY2020. This total coal demand includes
both steam and coking coal.
3.4.3.5 Estimated steam coal demand
Total steam and coking coal demand (which is the sum of demand by power utilities and the non-
regulated sector) reaches 1,127–1,183 Mt in FY2020. These potential high levels correspond to a
CAGR of 6.6 and 7.6 per cent over the five-year period.
To estimate steam coal demand from total coal demand, trends in coking coal demand, used as a raw
material, have been estimated based on actual level in FY2015. Coking coal demand (only
metallurgical coal production and coking coal imports137) was 67 Mt in FY2015 and could reach 92 Mt
by FY2020 (under the assumptions taken for non-regulated sectors – a 6.5 per cent growth per year
during the period).
Therefore, steam coal demand (which is total coal demand minus coking coal demand) may reach
1,035–1,091 Mt by FY2020 (that is, a CAGR of 6.6–7.7 percent over the period).
136 This is calculated consumption based on total consumption coal demand, published by the Coal Controller’s Organisation,
less coal demand by power utilities. This certainly includes stocks at industrial plants, but there is no data on the level of these
stocks. Likewise, while coal demand for major sectors, steel, cement, CPPs, sponge iron, is detailed in the Coal Controller’s
Organisation data, there is a large part of demand by ‘others’ which is not detailed. 137 Coking coal demand, based on provisional data published by the Coal Controller’s Organisation, only includes domestic
metallurgical coal demand (22.7 Mt in FY2015) and coking coal imports (43.7 Mt in FY2015). The production of coking coal
totaled 57.4 Mt in FY2015. However, a large share of this is consumed as a fuel and not as a raw material in the iron and steel
industry.
FY 2015
(provisional)FY2016 FY2017 FY2018 FY2019 FY2020
CAGR
(FY2015-
FY2020) %
Installed capacity (GW at the end of the year) 158.6 176 196 212 222 228 7.5
Scenario 1 "Low PLF"
Plant Load Factor 0.65 0.63 0.64 0.65 0.65 0.65
Electricity generation (TWh) (2) 800 849 959 1068 1135 1179 8.1
Coal demand (Mt) (3) 531.5 580 606 670 708 732 6.6
Scenario 2 "Improved PLF"
Plant Load Factor 0.65 0.63 0.65 0.66 0.68 0.70
Electricity generation (TWh) (2) 800 849 974 1084 1188 1269 9.7
Coal demand (Mt) (3) 531.5 580 615 680 740 788 8.2

February 2016: Indian Steam Coal Imports
50
Table 12: Steam coal demand Scenarios
Source: Author’s calculations.
These high levels of coal demand – although lower than in a scenario without renewables – are based
on four assumptions: that economic growth continues to improve; that all announced coal power
projects likely to be built are actually built; that coal quality improves; and that PLF improves
(Scenario 2). This requires that the government fast-tracks projects that are currently stalled due to
land acquisitions, or other issues, and requires that reforms in the power sector enable state Discoms
to sign long-term PPAs. These levels can be considered as maximum levels of future steam coal
demand, except in a scenario where the utilization factor of coal power plants increases to more than
70 per cent, an assumption that does not currently appear realistic.
These high levels of coal demand require a massive increase in domestic coal production as the
government has made it very clear that its priority is to lower India’s dependence on fuel and steam
coal imports. They also indicate that the announced target of 1.5 Gt of domestic production by
FY2020 exceeds India’s actual coal requirements. The next chapter analyzes how domestic
production could evolve by FY2020.
MtFY2015
estimatedFY2016 FY2017 FY2018 FY2019 FY2020
CAGR
(FY2015-
FY2020) %
Scenario 1
Demand by power utilities 532 580 606 670 708 732 6.6
Demand by non-regulated consumers 288 307 327 348 371 395 6.5
Total Coal demand 820 887 932 1,018 1,078 1,127 6.6
of which coking coal 67 71 76 81 86 92 6.5
of which Steam coal demand 753 815 856 937 992 1,035 6.6
Scenario 2
Demand by power utilities 532 580 615 680 740 788 8.2
Demand by non-regulated consumers 288 307 327 348 371 395 6.5
Total Coal demand 820 887 942 1,028 1,111 1,183 7.6
of which coking coal 67 71 76 81 86 92 6.5
of which Steam coal demand 753 815 866 947 1,025 1,091 7.7
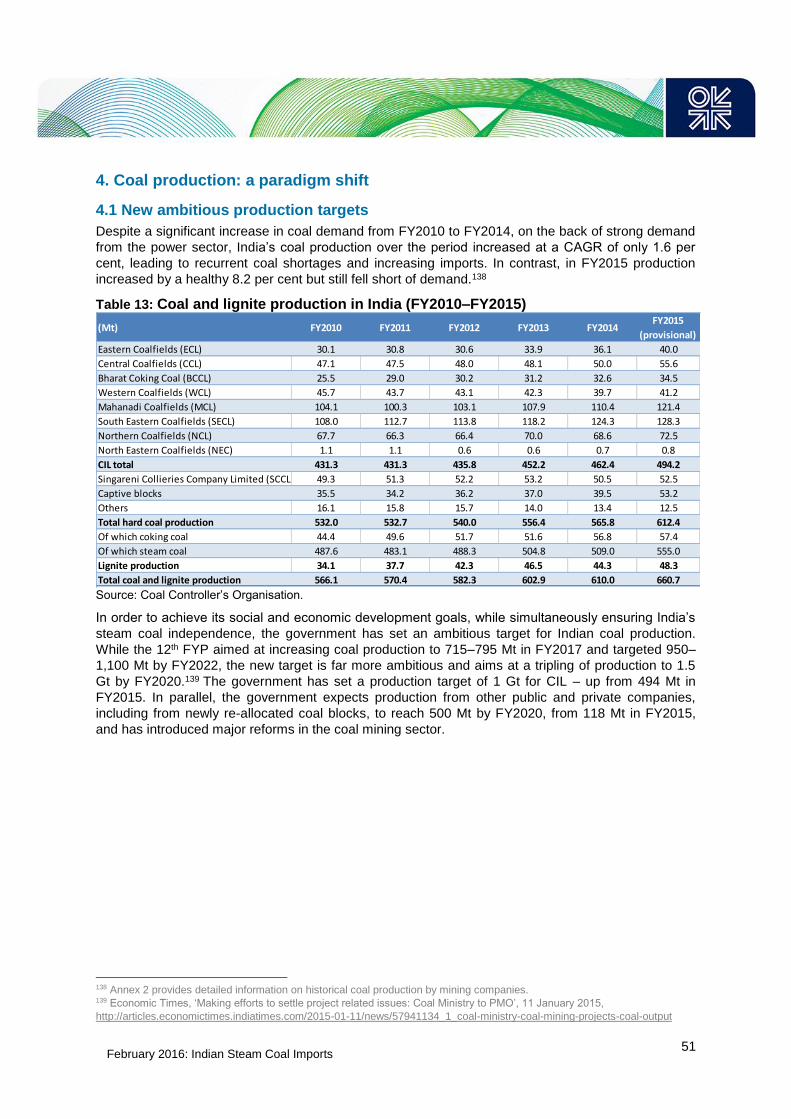
February 2016: Indian Steam Coal Imports
51
4. Coal production: a paradigm shift
4.1 New ambitious production targets
Despite a significant increase in coal demand from FY2010 to FY2014, on the back of strong demand
from the power sector, India’s coal production over the period increased at a CAGR of only 1.6 per
cent, leading to recurrent coal shortages and increasing imports. In contrast, in FY2015 production
increased by a healthy 8.2 per cent but still fell short of demand.138
Table 13: Coal and lignite production in India (FY2010–FY2015)
Source: Coal Controller’s Organisation.
In order to achieve its social and economic development goals, while simultaneously ensuring India’s
steam coal independence, the government has set an ambitious target for Indian coal production.
While the 12th FYP aimed at increasing coal production to 715–795 Mt in FY2017 and targeted 950–
1,100 Mt by FY2022, the new target is far more ambitious and aims at a tripling of production to 1.5
Gt by FY2020.139 The government has set a production target of 1 Gt for CIL – up from 494 Mt in
FY2015. In parallel, the government expects production from other public and private companies,
including from newly re-allocated coal blocks, to reach 500 Mt by FY2020, from 118 Mt in FY2015,
and has introduced major reforms in the coal mining sector.
138 Annex 2 provides detailed information on historical coal production by mining companies. 139 Economic Times, ‘Making efforts to settle project related issues: Coal Ministry to PMO’, 11 January 2015,
http://articles.economictimes.indiatimes.com/2015-01-11/news/57941134_1_coal-ministry-coal-mining-projects-coal-output
(Mt) FY2010 FY2011 FY2012 FY2013 FY2014FY2015
(provisional)
Eastern Coalfields (ECL) 30.1 30.8 30.6 33.9 36.1 40.0
Central Coalfields (CCL) 47.1 47.5 48.0 48.1 50.0 55.6
Bharat Coking Coal (BCCL) 25.5 29.0 30.2 31.2 32.6 34.5
Western Coalfields (WCL) 45.7 43.7 43.1 42.3 39.7 41.2
Mahanadi Coalfields (MCL) 104.1 100.3 103.1 107.9 110.4 121.4
South Eastern Coalfields (SECL) 108.0 112.7 113.8 118.2 124.3 128.3
Northern Coalfields (NCL) 67.7 66.3 66.4 70.0 68.6 72.5
North Eastern Coalfields (NEC) 1.1 1.1 0.6 0.6 0.7 0.8
CIL total 431.3 431.3 435.8 452.2 462.4 494.2
Singareni Collieries Company Limited (SCCL) 49.3 51.3 52.2 53.2 50.5 52.5
Captive blocks 35.5 34.2 36.2 37.0 39.5 53.2
Others 16.1 15.8 15.7 14.0 13.4 12.5
Total hard coal production 532.0 532.7 540.0 556.4 565.8 612.4
Of which coking coal 44.4 49.6 51.7 51.6 56.8 57.4
Of which steam coal 487.6 483.1 488.3 504.8 509.0 555.0
Lignite production 34.1 37.7 42.3 46.5 44.3 48.3
Total coal and lignite production 566.1 570.4 582.3 602.9 610.0 660.7

February 2016: Indian Steam Coal Imports
52
Figure 17: Government targeted coal production to FY2020
Source: Government of India.
4.2 CIL’s roadmap to 1 Gt production
CIL has developed a mine-wise roadmap for the next five years to augment output to 1 Gt by FY2020
from 494 Mt in FY2015.140 The company has approved a plan to raise production to 908 Mt by
FY2020, which is a CAGR of 12.9 per cent from FY2015 (see Figure 18). Existing coal projects are
envisaged to contribute 165 Mt and projects under implementation are likely to contribute 561 mtpa.
In FY2015, CIL’s Board approved seven projects which are expected to add a total capacity of 73
mtpa.141
CIL is also working on a strategy to add new projects (with an estimated capacity of 182 mtpa) to
reach the target of 1 Gt. As of February 2015, 35 of these new projects are under preparation and are
expected to add a production capacity of around 60 mtpa by FY2020.142
140 CIL, Roadmap for enhancement of coal production, 26 May 2015,
http://coal.nic.in/sites/upload_files/coal/files/webform/notices/RoadMap_for_Enhancement_of_Coal_Production_26052015.pdf 141 CIL, 2014-15 Annual Report and Accounts, August 2015,
https://www.coalindia.in/DesktopModules/DocumentList/documents/Annual_Report_&_Accounts_2014-
15_Shareholder_version_03082015(1).pdf. While the commissioning dates are not specified, it can be expected that these new
mines will start production from FY2016. 142 CMPDI, Preparations for 925 Million Tonne Production from CIL in 2019-20, February 2015,
http://coal.nic.in/sites/upload_files/coal/files/coalupload/cil/CMPDI%20presentation%20for%2020%20Jan%202015.pptx
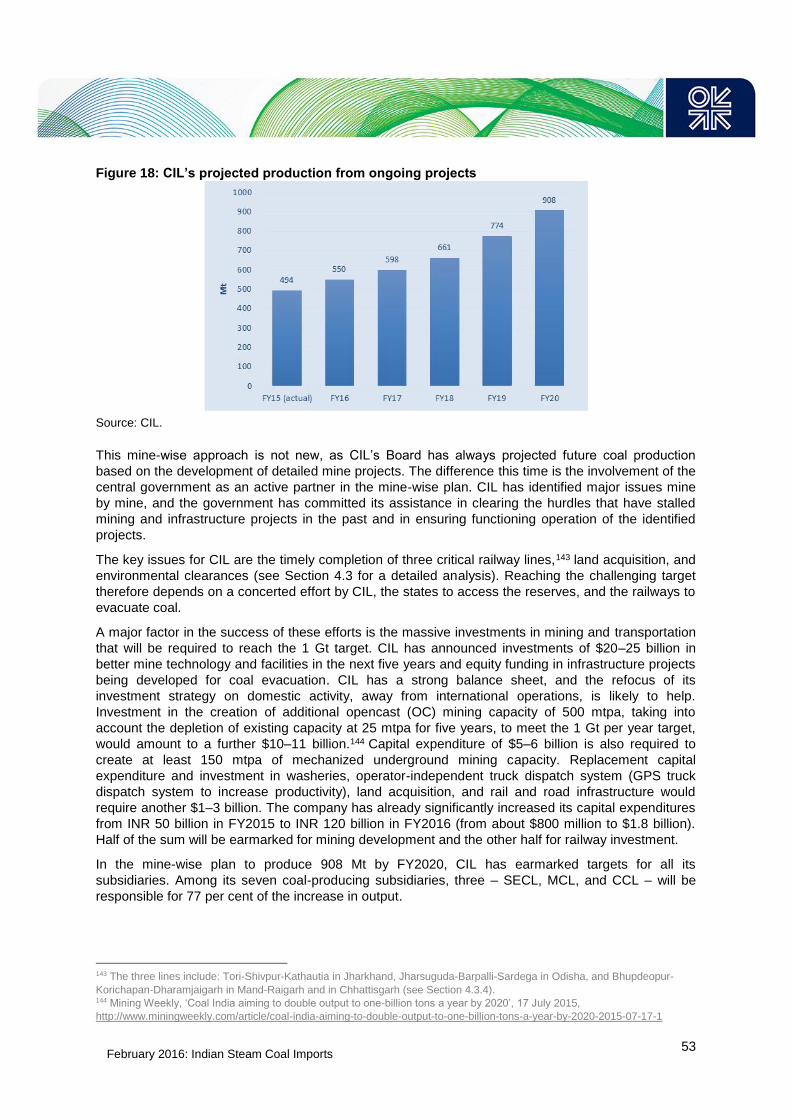
February 2016: Indian Steam Coal Imports
53
Figure 18: CIL’s projected production from ongoing projects
Source: CIL.
This mine-wise approach is not new, as CIL’s Board has always projected future coal production
based on the development of detailed mine projects. The difference this time is the involvement of the
central government as an active partner in the mine-wise plan. CIL has identified major issues mine
by mine, and the government has committed its assistance in clearing the hurdles that have stalled
mining and infrastructure projects in the past and in ensuring functioning operation of the identified
projects.
The key issues for CIL are the timely completion of three critical railway lines,143 land acquisition, and
environmental clearances (see Section 4.3 for a detailed analysis). Reaching the challenging target
therefore depends on a concerted effort by CIL, the states to access the reserves, and the railways to
evacuate coal.
A major factor in the success of these efforts is the massive investments in mining and transportation
that will be required to reach the 1 Gt target. CIL has announced investments of $20–25 billion in
better mine technology and facilities in the next five years and equity funding in infrastructure projects
being developed for coal evacuation. CIL has a strong balance sheet, and the refocus of its
investment strategy on domestic activity, away from international operations, is likely to help.
Investment in the creation of additional opencast (OC) mining capacity of 500 mtpa, taking into
account the depletion of existing capacity at 25 mtpa for five years, to meet the 1 Gt per year target,
would amount to a further $10–11 billion.144 Capital expenditure of $5–6 billion is also required to
create at least 150 mtpa of mechanized underground mining capacity. Replacement capital
expenditure and investment in washeries, operator-independent truck dispatch system (GPS truck
dispatch system to increase productivity), land acquisition, and rail and road infrastructure would
require another $1–3 billion. The company has already significantly increased its capital expenditures
from INR 50 billion in FY2015 to INR 120 billion in FY2016 (from about $800 million to $1.8 billion).
Half of the sum will be earmarked for mining development and the other half for railway investment.
In the mine-wise plan to produce 908 Mt by FY2020, CIL has earmarked targets for all its
subsidiaries. Among its seven coal-producing subsidiaries, three – SECL, MCL, and CCL – will be
responsible for 77 per cent of the increase in output.
143 The three lines include: Tori-Shivpur-Kathautia in Jharkhand, Jharsuguda-Barpalli-Sardega in Odisha, and Bhupdeopur-
Korichapan-Dharamjaigarh in Mand-Raigarh and in Chhattisgarh (see Section 4.3.4). 144 Mining Weekly, ‘Coal India aiming to double output to one-billion tons a year by 2020’, 17 July 2015,
http://www.miningweekly.com/article/coal-india-aiming-to-double-output-to-one-billion-tons-a-year-by-2020-2015-07-17-1
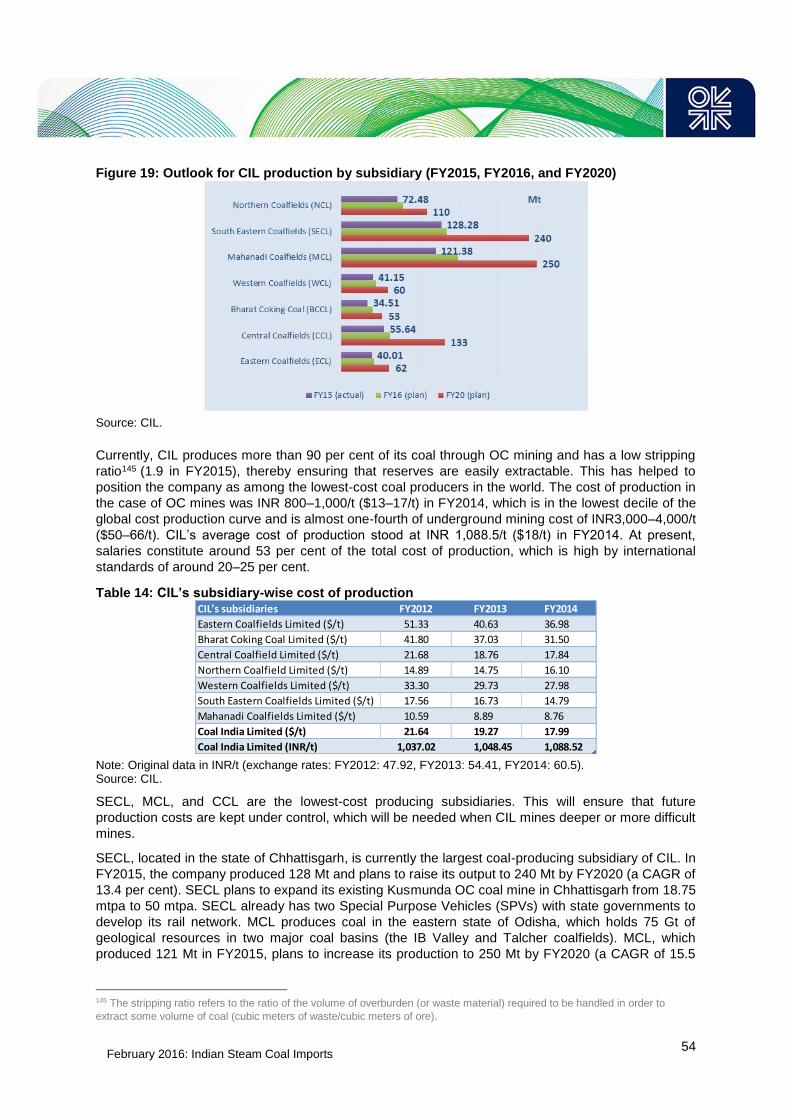
February 2016: Indian Steam Coal Imports
54
Figure 19: Outlook for CIL production by subsidiary (FY2015, FY2016, and FY2020)
Source: CIL.
Currently, CIL produces more than 90 per cent of its coal through OC mining and has a low stripping
ratio145 (1.9 in FY2015), thereby ensuring that reserves are easily extractable. This has helped to
position the company as among the lowest-cost coal producers in the world. The cost of production in
the case of OC mines was INR 800–1,000/t ($13–17/t) in FY2014, which is in the lowest decile of the
global cost production curve and is almost one-fourth of underground mining cost of INR3,000–4,000/t
($50–66/t). CIL’s average cost of production stood at INR 1,088.5/t ($18/t) in FY2014. At present,
salaries constitute around 53 per cent of the total cost of production, which is high by international
standards of around 20–25 per cent.
Table 14: CIL’s subsidiary-wise cost of production
Note: Original data in INR/t (exchange rates: FY2012: 47.92, FY2013: 54.41, FY2014: 60.5). Source: CIL.
SECL, MCL, and CCL are the lowest-cost producing subsidiaries. This will ensure that future
production costs are kept under control, which will be needed when CIL mines deeper or more difficult
mines.
SECL, located in the state of Chhattisgarh, is currently the largest coal-producing subsidiary of CIL. In
FY2015, the company produced 128 Mt and plans to raise its output to 240 Mt by FY2020 (a CAGR of
13.4 per cent). SECL plans to expand its existing Kusmunda OC coal mine in Chhattisgarh from 18.75
mtpa to 50 mtpa. SECL already has two Special Purpose Vehicles (SPVs) with state governments to
develop its rail network. MCL produces coal in the eastern state of Odisha, which holds 75 Gt of
geological resources in two major coal basins (the IB Valley and Talcher coalfields). MCL, which
produced 121 Mt in FY2015, plans to increase its production to 250 Mt by FY2020 (a CAGR of 15.5
145 The stripping ratio refers to the ratio of the volume of overburden (or waste material) required to be handled in order to
extract some volume of coal (cubic meters of waste/cubic meters of ore).
CIL's subsidiaries FY2012 FY2013 FY2014
Eastern Coalfields Limited ($/t) 51.33 40.63 36.98
Bharat Coking Coal Limited ($/t) 41.80 37.03 31.50
Central Coalfield Limited ($/t) 21.68 18.76 17.84
Northern Coalfield Limited ($/t) 14.89 14.75 16.10
Western Coalfields Limited ($/t) 33.30 29.73 27.98
South Eastern Coalfields Limited ($/t) 17.56 16.73 14.79
Mahanadi Coalfields Limited ($/t) 10.59 8.89 8.76
Coal India Limited ($/t) 21.64 19.27 17.99
Coal India Limited (INR/t) 1,037.02 1,048.45 1,088.52

February 2016: Indian Steam Coal Imports
55
per cent), almost all of which is in OC mines at current and planned projects.146 Eighteen projects
totalling 151 mtpa-capacity (capital investment of $1.3 billion) are under implementation. MCL will
resort to outsourcing to mine two large projects. CCL, located in Jharkhand, operates 58 mines
comprising 21 UG mines and 37 OC mines. The company produced 56 Mt in FY2015 and plans to
raise output to 133 Mt by FY2020 (a CAGR of 18.9 per cent). For this, CCL will rely on recently
commissioned ongoing projects, which will add 35 mtpa of capacity by FY2020, and on new large
projects to be commissioned from FY2017, including: Sanghamitra OC, 20 mtpa; Pachra OC, 15
mtpa; and Chatti-Baratu, Kerandari OC, 13 mtpa. The increase in production depends on the timely
completion of the Tori–Shivpur–Kathutia railway line for coal evacuation.
4.3 Measures taken to attain the production goal
While the government and CIL have taken major logistical, technical, and regulatory steps to raise
production rapidly, there are still further challenges to overcome to reach the ambitious production
targets, in addition to the time required to build and ramp up production at new mines. Bureaucratic
delays in land acquisition, ‘green’ (environmental and forest) clearances, and transportation
bottlenecks have so far resulted in a time lag for the actual implementation of new mine projects and
production growth. Local agitations and law and order problems have also restricted the production of
CCL and MCL. At the beginning of April 2015, CIL had 49 coal mining projects facing delay due to
land acquisition and associated ‘Rehabilitation & Resettlement’ (R&R) issues, as well as
environmental clearance (EC) and forestry clearance (FC) issues.147 In addition, 33 projects were
running behind schedule due to lack of railway infrastructure for coal evacuation and other issues.
4.3.1 Government initiatives to speed up delayed projects
The government is attempting to address these challenges by changing the tone of the debate from
why things have not worked in the past to what can be done to make it happen. It has taken major
initiatives to speed up the implementation of coal projects and remove the hurdles that prevented CIL
from raising its production. In November 2014, the government fast-tracked 90 of CIL’s ongoing
projects, entailing an investment of INR 880 billion ($14.2 billion). 148 The MoC sought faster
clearances for these outstanding projects, some of which had been on the drawing board for decades.
Hurdles, such as EC and FC, stalling 28 projects with a capacity of 95 mtpa have been lifted. The
remaining 62 fast-track projects could add 400 mtpa.
With the government’s assistance, CIL opened the remote Amrapali mine in eastern India in July
2014.149 This had been delayed for a decade due to poor rail links. In FY2015, CIL has opened four
more big mines (Makardhokra 1, Bhanegaon, Panganga in Western Coalfields, and Jampali in South
Eastern Coalfields) and expanded others. In addition, 15 new projects, with a capacity of 41 mtpa, are
in the pipeline for FY2016. This includes CCL’s Magadh mine expansion (20 mtpa).
146 MCL, Workshop on Technology Development for reaching 250 MT (19-20), February 2015. 147 CIL, 2014-15 Annual Report and Accounts, August 2015,
https://www.coalindia.in/DesktopModules/DocumentList/documents/Annual_Report_&_Accounts_2014-
15_Shareholder_version_03082015(1).pdf 148 Economic Times, ‘Centre puts 90 of Coal India's mining projects worth Rs 88k crore on fast track’, 3 November 2014,
http://articles.economictimes.indiatimes.com/2014-11-03/news/55720014_1_coal-ministry-coal-india-limited-coal-block. There
is no detail about the projects which have been fast-tracked, so it is not possible to reconcile the figures given by CIL in its
Annual Report and the announced fast-tracked projects. 149 The Amrapali coal mine in Jharkhand is CIL's first major new project in the last five years and has a capacity of 12 mtpa.
The coal produced from the mine will be transported through the Tori-Shivpur railway line, which is yet to be completed.
Pending completion of the rail line, CIL has allowed power companies to pick up coal directly from the mine without signing any
FSAs.
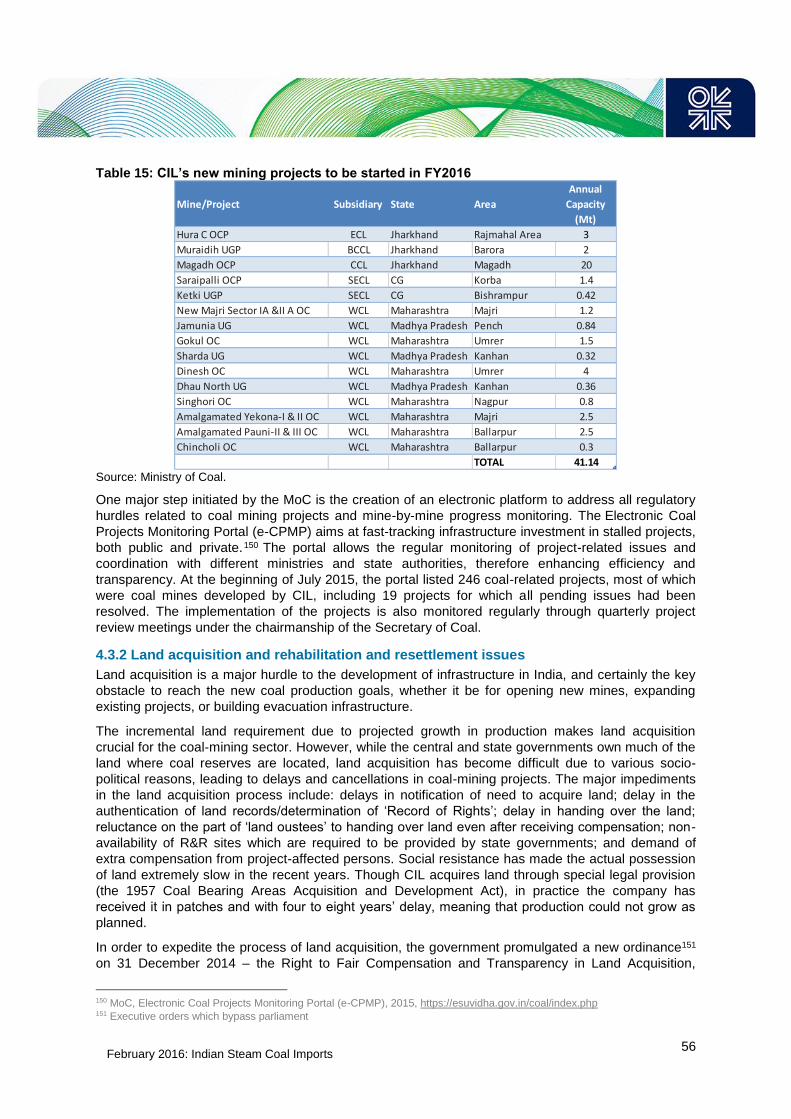
February 2016: Indian Steam Coal Imports
56
Table 15: CIL’s new mining projects to be started in FY2016
Source: Ministry of Coal.
One major step initiated by the MoC is the creation of an electronic platform to address all regulatory
hurdles related to coal mining projects and mine-by-mine progress monitoring. The Electronic Coal
Projects Monitoring Portal (e-CPMP) aims at fast-tracking infrastructure investment in stalled projects,
both public and private.150 The portal allows the regular monitoring of project-related issues and
coordination with different ministries and state authorities, therefore enhancing efficiency and
transparency. At the beginning of July 2015, the portal listed 246 coal-related projects, most of which
were coal mines developed by CIL, including 19 projects for which all pending issues had been
resolved. The implementation of the projects is also monitored regularly through quarterly project
review meetings under the chairmanship of the Secretary of Coal.
4.3.2 Land acquisition and rehabilitation and resettlement issues
Land acquisition is a major hurdle to the development of infrastructure in India, and certainly the key
obstacle to reach the new coal production goals, whether it be for opening new mines, expanding
existing projects, or building evacuation infrastructure.
The incremental land requirement due to projected growth in production makes land acquisition
crucial for the coal-mining sector. However, while the central and state governments own much of the
land where coal reserves are located, land acquisition has become difficult due to various socio-
political reasons, leading to delays and cancellations in coal-mining projects. The major impediments
in the land acquisition process include: delays in notification of need to acquire land; delay in the
authentication of land records/determination of ‘Record of Rights’; delay in handing over the land;
reluctance on the part of ‘land oustees’ to handing over land even after receiving compensation; non-
availability of R&R sites which are required to be provided by state governments; and demand of
extra compensation from project-affected persons. Social resistance has made the actual possession
of land extremely slow in the recent years. Though CIL acquires land through special legal provision
(the 1957 Coal Bearing Areas Acquisition and Development Act), in practice the company has
received it in patches and with four to eight years’ delay, meaning that production could not grow as
planned.
In order to expedite the process of land acquisition, the government promulgated a new ordinance151
on 31 December 2014 – the Right to Fair Compensation and Transparency in Land Acquisition,
150 MoC, Electronic Coal Projects Monitoring Portal (e-CPMP), 2015, https://esuvidha.gov.in/coal/index.php 151 Executive orders which bypass parliament
Mine/Project Subsidiary State Area
Annual
Capacity
(Mt)
Hura C OCP ECL Jharkhand Rajmahal Area 3
Muraidih UGP BCCL Jharkhand Barora 2
Magadh OCP CCL Jharkhand Magadh 20
Saraipalli OCP SECL CG Korba 1.4
Ketki UGP SECL CG Bishrampur 0.42
New Majri Sector IA &II A OC WCL Maharashtra Majri 1.2
Jamunia UG WCL Madhya Pradesh Pench 0.84
Gokul OC WCL Maharashtra Umrer 1.5
Sharda UG WCL Madhya Pradesh Kanhan 0.32
Dinesh OC WCL Maharashtra Umrer 4
Dhau North UG WCL Madhya Pradesh Kanhan 0.36
Singhori OC WCL Maharashtra Nagpur 0.8
Amalgamated Yekona-I & II OC WCL Maharashtra Majri 2.5
Amalgamated Pauni-II & III OC WCL Maharashtra Ballarpur 2.5
Chincholi OC WCL Maharashtra Ballarpur 0.3
TOTAL 41.14

February 2016: Indian Steam Coal Imports
57
Rehabilitation and Resettlement (Amendment) Ordinance, hereafter referred to as ‘LARR’ – which
amended the Land Acquisition, Rehabilitation and Resettlement Act (LARR Act, 2013) adopted by the
former UPA government. The LARR Bill was passed by the Lok Sabha on 10 March 2015, but it failed
to be passed in the Rajya Sabha (the upper house of India’s parliament) during its March/April
session. The government had to re-promulgate the Land Ordinance for the third time at the beginning
of June 2015. The bill was debated in the summer session of the parliament. However, due to the
absence of a consensus in parliament, the government decided at the end of August 2015 to let the
Land Acquisition Ordinance lapse and adopted an alternative route providing greater flexibility to the
states to deal with the issue.152 One suggestion, by Niti Aayog153 Vice-Chairman Arvind Panagariya,
has been to ask states to frame land acquisition laws as per their needs as in Tamil Nadu, which has
an amended Act in place since January 2015.154 On the whole, although this could lead to regional
imbalances, it could partially resolve the deadlock on land acquisition in coal-bearing states which
have a financial interest developing coal production.
Box 9: The land acquisition debate
Some of the major changes proposed by the 2015 LARR Bill155 (as passed by the Lok Sabha on 10
March 2015) related to provisions, including: obtaining the consent of land owners; conducting a
Social Impact Assessment (SIA); return of unutilized land; inclusion of private entities instead of
private companies in the former act.156 The 2015 LARR Bill amended the previous act to include 13
laws previously exempted from payment of compensation as well as R&R, including Coal Bearing
Areas Acquisition and Development Act 1957. Their exclusion could have made the bill applicable in a
relatively small number of cases.
The LARR Bill exempted five categories of projects from the required consent of communities, and
from requirement of an SIA: projects vital to national security; rural infrastructure including
electrification; affordable housing and housing for the poor; industrial corridors set up by the
government and government undertakings; and infrastructure projects, including those under public-
private partnerships (PPP) where the ownership of land continues to be vested with the government.
The government stated that these exemptions were being made in order to expedite the process of
land acquisition in these specific areas of public interest. However, the opponents of the LARR Bill
pointed out that these five exempted categories could cover a majority of projects for which land could
be acquired, and consent and SIA would not therefore apply for these projects. As the government
was trying to build a consensus on the LARR Bill prior to its passage by the Lok Sabha (lower house)
and the Rajya Sabha (upper house), a campaign against the legislation developed based on tribal
and forest land, despite the fact that tribal and forest land did not come under the ambit of the bill.
Nine amendments were introduced when the LARR Bill was adopted on 10 March 2015 by the Lok
Sabha, including provisions for mandatory employment for at least one member from each family
displaced by land acquisition, ensuring that the land acquired is the bare minimum required for a
project, and undertaking a survey of the nation’s wastelands.
While addressing the issues of land acquisition at the central level, the government has also worked
at the state level on specific coal-mining projects directly with coal-bearing states. For instance, the
government has negotiated with West Bengal, where the state government has responded favourably
152 Indian Express, ‘Not to re-promulgate land ordinance is not a setback for government’, says Arun Jaitley, 31 August 2015,
http://indianexpress.com/article/india/india-others/not-to-re-promulgate-land-ordinance-is-not-a-setback-for-government-says-
arun-jaitley/ 153 A policy making body set up by the Modi government. 154 Times of India, ‘Frame own land law: Panagariya to states’, 11 September 2015,
http://timesofindia.indiatimes.com/india/Frame-own-land-law-Panagariya-to-states/articleshow/48907137.cms 155 PRS legislative, The Right to Fair Compensation and Transparency in Land Acquisition, Rehabilitation and Resettlement
(Amendment) Bill, 2015, March 2015,
http://www.prsindia.org/administrator/uploads/media/Land%20and%20R%20and%20R/Bill%20Summary%2019%20LARR%20
Bill%202015.pdf 156 According to the Companies Act, 2013, a 'private company' means a company with a paid-up share capital of at least INR
100,000. It excluded other entities such as proprietorships, partnerships, corporations and non-profit organizations.

February 2016: Indian Steam Coal Imports
58
to the land acquisition process for coal projects that have been stuck for several years. 157 The
government has also attempted to ensure that compensations for land acquired are being paid as per
the revised rates notified by the state governments. This approach has allowed the resumption of
stalled projects despite the lack of an overarching framework at the central government level.
4.3.3 Easing of environmental and forest clearances
In addition to land acquisition issues, the growth of coal production has also been constrained by
difficulties in obtaining environmental clearance (EC), restrictions arising out of imposition of
Comprehensive Environmental Pollution Index (CEPI) guidelines, and non-availability of forest
clearances (FC) in time. Obtaining EC and FC for coal-mining projects can be very cumbersome. It
involves prescribed procedures that can take years and often get delayed due to the involvement of
multiple agencies, delays in finalizing ToR (Terms of Reference), and delays in conducting public
hearings (for new mines). More than 15 agencies need to be involved at various stages of the
clearance process such as the MoEF, the Coal Controller’s Organisation (CCO), and the MoC at
central level and various state government agencies, such as the mining department, revenue
department, forest department, State Pollution Control Board (SPCB), and district authorities.
In the past, the issue of FC was amplified by the policy of ‘no-go’ areas adopted by the environment
ministry in 2009, banning mining in forest areas with canopy cover of more than 70 per cent, resulting
in the banning of mining projects in major coal-bearing areas. The move blocked the development of
allocated coal blocks with reserves of 660 Mt.158 Apart from CIL’s projects, blocks allocated to private
and public companies, including NTPC, Hindalco Industries, Essar Power, and Adani Power, were
also affected under the ‘no-go’ zones. The ‘no-go’ classification was scrapped in September 2011,
since which time FC has been based on the Forest Conservation Act. In addition, under the Forest
Rights Act, community forest rights must be recognized before consent is sought for diversion of
forest land for any mining or infrastructure project. The ‘no-go’ policy, however, stalled almost every
big coal-mining project in India for two years (2009–11) and has resulted in long delays, through a
knock-on effect, for new projects located in the so-called no-go areas. Overall EC and FC approvals
granted fell significantly after 2009, adversely affecting CIL’s production volume growth (see Figures
20 and 21). FC has remained an issue in dense forest lands. For instance, the Mahan coal block (8.5
mtpa of capacity) in Madhya Pradesh was withdrawn from the recent auctions of coal blocks as it fell
in ‘inviolate forests’.159
The new government has been driving efforts to improve the ease of doing business and ensure
predictable and expeditious green clearances. This is a pre-condition for CIL to be able to reach the 1
Gt target as mines are expected to be productive about three years after being granted regulatory
clearances for production. EC and FC issues have been addressed at district, state, and central level,
particularly at the MoEF level.
Coal-mining projects have been the focus of the MoEF. Among 187 development projects that were
granted EC between June 2014 and April 2015, some 37 projects were coal-mining projects.160 Most
of these were awarded to CIL’s subsidiaries and SCCL, and they cumulatively represent production
capacity of 96.6 mtpa.
157 Economic Times, ‘Making efforts to settle project related issues, Coal Ministry to PMO’, 11 January 2015,
http://articles.economictimes.indiatimes.com/2015-01-11/news/57941134_1_coal-ministry-coal-mining-projects-coal-output 158 Business Standard, ‘No-go ghost still haunts Coal India’, 22 May 2012, http://www.business-
standard.com/article/companies/no-go-ghost-still-haunts-coal-india-112052200055_1.html 159 Responding to Climate Change (RTCC), ‘Coal mining banned in India’s Mahan forest’, 25 March 2015,
http://www.rtcc.org/2015/03/24/coal-mining-banned-in-indias-mahan-forest 160 Centre for Science and Environment (CSE), First year of NDA rule, 2015, http://cseindia.org/userfiles/Factsheet-One-year-
review.pdf

February 2016: Indian Steam Coal Imports
59
Figure 20: Coal mining projects granted environmental clearance (2007–2015)
Source: Green Clearance Watch.
The government has taken new initiatives to ease the process of granting green clearances. Similar to
the coal platform created by the MoC, the MoEF has put in place an online system for submission and
monitoring of EC and FC proposals, in an effort to improve efficiency, accountability, and
transparency in the granting of regulatory clearances.161 In addition, the MoC and CIL’s subsidiaries
regularly communicate with the MoEF and state agencies to review the status of clearance. Projects
with pending issues are also monitored by the MoC and the Project Monitoring Group (PMG) to
expedite various processes for obtaining clearances.
The government has further facilitated capacity expansion for existing coal mines by relaxing the
requirements for public hearings in case of large mines.162 This policy is an acceleration of the policy
initiated by the former government in December 2012 and will allow CIL to increase its production
from existing mines by around 25 per cent. Although these exemptions relate to capacity expansion
within the same lease area, meaning that public hearings have already been held for these mines, the
exemption has been seen as a move to exclude peoples’ participation in the EC process.163
161 Economic Times, ‘Environment ministry unveils online system for submission and monitoring of forest clearance proposals’, 16 July 2014, http://articles.economictimes.indiatimes.com/2014-07-16/news/51600486_1_clearance-environment-ministry-forest-rights-act 162 Ministry of Environment, Forests and Climate Change (MoEF), Guidelines for granting Environment Clearance for expansion
of Coal Mining Projects involving one time Production Capacity Expansion in the existing operation - reg., OFFICE
MEMORANDUM No. J-IIOI5/30/2004-IA.I1 (M), 28 July 2014,
http://www.moef.nic.in/sites/default/files/OM%20dated%2028.07.2014%20one%20time%20expansion.pdf and The New Indian
Express, ‘MoEF Eases Norms for Coal Mining Projects’, 4 September 2014, http://www.newindianexpress.com/nation/MoEF-
Eases-Norms-for-Coal-Mining-Projects/2014/09/04/article2413949.ece 163 Centre for Science and Environment (CSE), First year of NDA rule, 2015, http://cseindia.org/userfiles/Factsheet-One-year-
review.pdf

February 2016: Indian Steam Coal Imports
60
Table 16: Public hearing exemptions for coal mining expansion within the same lease area
Source: MoEF.
In a more controversial move, the MoEF has allowed expansion capacity of existing mines in
Chandrapur – a critically polluted area (CPA) in Maharashtra. 164 The action was taken following
observations that ‘coal mining activities do not seem to be major contributor of pollution load in the
area’, as other sources of pollution (paper and chemical industries) appeared to contribute much
higher levels. This decision is temporary and subject to certain conditions165.
Turning to FC, between June 2014 and May 2015, eight coal-mining projects received Stage II FC
(final FC clearance). This corresponds to 1,245 hectares (ha) of forest land diverted for coal-mining
projects.
Figure 21: Coal mining projects granted forest clearance (2007–2015)
Sources: MoEF; Green Clearance Watch.
Some of the notable changes made by the new government to expedite FC include making it easier to
identify land for projects and compensatory afforestation and providing guidelines for the diversion of
forest land. The MoEF has reduced the forest area where mineral extraction is forbidden, thus
opening up larger areas of the forest for mining. Although it is a positive sign for coal mining projects,
this does not mean that it is a green signal for all such enterprises, as the recommendation whether
forests should be diverted for a particular coal-mining project will still be made by the Forest Advisory
164 MoEF, Office Memorandum J11013/5/2010-IA II, 1 September 2014,
http://www.moef.gov.in/sites/default/files/Chandrapur_OM%20dated%2001.09.2014.pdf 165 Among the conditions imposed by the government, it is stated that: 1) All project proposals for expansion of existing mines
will be considered at the level of MoEF; 2) There is no additional mine lease area involved; 3) There is no change in mining
method; 4) Monitoring of Actions plans on pollution control and their implementation will be pursued by the MoEF (see the full
list of conditions in the Office Memorandum of 1 September 2014, cited above).
Dates Exemption provisions
19 December 2012Coal mines seeking one time capacity expansion of up to 25 per cent within the same lease area —with
a ceiling of 2 mtpa additional production
7 January 2014Coal mines with up to 8 mtpa production capacity, seeking one time capacity expansion up to 50 per
cent within the same lease area (or incremental production of 1 mtpa, whichever is more)
30 May 2014Coal mines with production capacity over 8 mtpa and up to 16 mtpa, seeking one time capacity
expansion within the same lease area with production enhancement up to 4 mtpa
28 July 2014Coal mines with production capacity more than 16 mtpa, seeking one time capacity expansion within
the same lease area with production enhancement up to 5 mtpa
2 September 2014Coal mines with production capacity more than 20 mtpa, seeking one time capacity expansion within
the same lease area with production enhancement up to 6 mtpa

February 2016: Indian Steam Coal Imports
61
Committee, which is the statutory body for forest clearances. The government has placed the
Compensatory Afforestation Fund Bill (2015) in the Lok Sabha, which could potentially give states a
large amount of funds for afforestation166 as the bill essentially seeks to establish compensatory
afforestation funds at the national and state level.
4.3.4 Removing transportation bottlenecks
4.3.4.1 Rail transportation dominates but is heavily congested
In addition to land issues, the transportation of coal is a significant barrier to increasing domestic
production. While the largest coal deposits are in the east, southeast, and central parts of the country,
the areas of highest demand are in the west and northwest regions. Due to this geographical
mismatch, power plants in the north and west are served by long-distance rail routes from mines in
the eastern and central regions. Imported coal is also carried to power producers over long distances
from western ports to the north of the country.
Rail transportation dominates coal transportation. Half of domestic coal production is transported
through railways, 16 per cent through MGR (Merry-Go-Round systems – block trains of hopper
wagons which load and unload cargoes while moving and are mainly used for power plants located
close to mines), 29 per cent by roads, and the rest is moved by conveyor belts and ropeways.167 In
FY2015, Indian Railways, the federal government-run monopoly, transported 508 Mt of domestically
produced and imported coal.168 However, growing domestic production and the rapid increase in
import volumes have stretched the railways’ capacities.
Due to the overwhelming share of rail transportation, adequate rail capacity is critical. But although
India has one of the largest railway systems in the world, it is inefficient, inadequate, and relatively
expensive for coal consumers. The rail tariff for coal increased from INR 1.35/t-km in FY15 to 1.44/t-
km in FY2016 ($0.023/t-km).169 Although the rate per km is low by international standards, railway
transportation costs are expensive for consumers located far away from the mines: they can double or
triple the pithead price when that coal is transported across the country. The average cost for
transporting coal between production areas in the east and electricity demand centres in Delhi,
Mumbai, or Chennai (around 1,500 km) is close to INR 2,000/t, based on the new rail tariff. Moreover,
relative to imported coal, domestic coals are of poorer quality and have lower heat content. On an
energy equivalent basis, the cost of transporting domestic coal is around 15 to 30 per cent higher.
The existing system is arguably insufficient to transport domestic and imported coal. A shortage of
railcars limited coal offtake in FY2015 despite the growth achieved in coal production. Coal
transportation is also constrained by rail congestion and the delayed implementation of three critical
railway lines to evacuate coal production from existing mines. The railway system will therefore
require massive capacity augmentation to handle the projected growth in coal production.
To overcome the immediate hurdle of lack of ‘rakes’ (a goods train consisting of 59 wagons), CIL has
decided to purchase 250 additional rakes worth $800 million to expeditiously evacuate greater
quantities of coal, primarily to power plants. The company purchased 37 rakes in March 2015 and
now has access to 220 rakes per day. However, it will require 450 rakes per day to move 1 Gtpa. In
addition, CIL is realigning its logistics management, for instance by transporting coal to the southern
states of Tamil Nadu and Karnataka through eastern ports and leveraging multi-modal transport.170
166 PRS Legislative Research, The Compensatory Afforestation Fund Bill, 2015, 29 May 2015,
http://www.prsindia.org/uploads/media/Compensatory%20Afforestation/Bill%20Summary-
%20Compensatory%20Afforestation.pdf 167 CCO, Coal Statistics 2013-2014, April 2015, http://coal.nic.in/sites/upload_files/coal/files/coalupload/coaldir13-14.pdf 168 Platts, ‘India’s coal industry,’ 27 May 2015, http://www.platts.com/news-feature/2015/coal/india-coal-transport/index?wt.mc_id=coap201505we_indiarail&wt.tsrc=eloqua 169 Coal Junction, ‘Rail freight on grains, coal, cement to increase from April 1’, 31 March 2015, http://www.coaljunction.in/news/n_newsdetail/Rail-freight-on-grains-coal-cement-to-increase-from-April-1_1#sthash.btJqebmj.dpuf 170 Economic Times, ‘Coal India draws logistics strategy to push coal evacuation’, 19 April 2015, http://articles.economictimes.indiatimes.com/2015-04-19/news/61303962_1_coal-india-sutirtha-bhattacharya-eastern-coalfields
February 2016: Indian Steam Coal Imports
62
Coast-to-coast shipment by ports owned by the central government (‘major ports’) and private ports
(‘minor ports’, as they are known), is limited. The share of the cargo handled through coastal
movement is almost stagnant at around 15–20 per cent of total cargo traffic handled by ports over the
last 10 years. Coast-to-coast shipment of steam coal can alleviate coal transportation problems,
removing pressure on railway transportation, and can also mitigate environmental pollution
engendered by land movement of coal. Coastal transportation of steam coal thus has tremendous
scope for expansion in India.
River transportation could also become a new source of coal transportation, reducing the burden on
the railways. River transportation is completely undeveloped in India, but a new scheme involving
NTPC, Inland Waterways Authority of India (IWAI), and Jindal ITF Ltd has started to move imported
coal unloaded from Kolkata port to NTPC’s Farakka power plant in West Bengal by river.171 According
to NTPC, the waterway would cost 15–20 per cent less than land transportation. Encouraged by this
experiment, IWAI has drawn up plans to develop a longer water route between Haldia and Allahabad
in Uttar Pradesh, measuring 1,620 km, which could carry imported coal to 11 existing power plants
and the 10 more which are likely to be constructed in the next five to six years.
4.3.4.2 Three critical railway links
To remove evacuation bottlenecks at existing mines, the government fast-tracked construction of
three critical railway lines in June 2014, and concerted efforts have been made between the ministries
of coal and railways to expedite laying out of the lines and clear remaining land and environmental
clearance issues. The three rail lines, Tori-Shivpur-Kathautia in Jharkhand, Jharsuguda-Barpalli-
Sardega in Odisha, and Bhupdeopur-Korichapan-Dharamjaigarh – Mand-Raigarh, in Chhattisgarh,
are crucial: they connect the growth areas for mining that are expected to account for about 70 per
cent of CIL’s incremental production, and they could provide access to 200 mtpa of coal each year
(and 300 mtpa at peak capacity). The three states (Jharkhand, Odisha, and Chhatisgarh) together
produce more than 50 per cent of India’s steam coal and hold two-thirds of the country’s proved
reserves. Over the years, construction of these lines has been delayed due to challenges related to
land acquisition and environment-related clearances. Consequently, the associated mines have not
been able to be developed to their full potential. The lines are now expected to be completed from
2016 to 2018.
171 Platts, ‘New schemes to transport coal in India’, 27 May 2015, http://www.platts.com/news-feature/2015/coal/india-coal-
transport/transport-schemes

February 2016: Indian Steam Coal Imports
63
Table 17: Critical railway lines
Source: Daiwa Capital Markets, 3 November 2014 (updated by author).
Funding for the three rail lines is vital to increasing CIL’s production. To expedite the construction of
the new lines, CIL is participating in their development and financing through dedicated companies
(Special Purpose Vehicles, SPVs) with Indian Railways and coal-bearing states.172 CIL has 64 per
cent equity in each of the SPVs, the Indian Railways Construction Company (IRCON) 26 per cent,
and the coal-bearing state 10 per cent. SECL has signed two SPVs with the state of Chhattisgarh to
develop the east and west corridors. In April 2015, CIL and the MoC signed a MoU with the state of
Odisha to form an SPV and undertake project development, financing, and implementation of seven
identified projects.173 Among them are: the doubling of the Sambalpur-Talcher (174 km), Sambalpur-
Titlagarh (182 km), and Raipur-Titlagarh (203 km) lines; and the Champa-Jharsuguda third line
(165km). A similar MoU was signed at the beginning of May 2015 with the state of Jharkhand for the
construction of two railway lines.174 CIL will invest $950 million in infrastructure in FY2016, and most
of this funding will go into setting up the three rail networks.
In addition, CIL is to form a major joint venture with Indian Railways to co-develop a number of railway
projects to extract coal.175 CIL is expected to provide the funds, while Indian Railways will provide the
labour force creating the infrastructure, including the tracks, sidings, and related infrastructure. The
MoC has identified 60 new railway lines to connect coal blocks.
172 Time of India, ‘CIL will double capex to Rs 10,000 crore in FY16 to meet production target’, 27 March 2015,
http://timesofindia.indiatimes.com/business/india-business/CIL-will-double-capex-to-Rs-10000-crore-in-FY16-to-meet-
production-target/articleshow/46714064.cms 173 Orissa Diary, ‘MoU signed between Odisha govt Coal, Railway ministries for implementation of common rail corridor projects
for coal evacuation’, 20 April 2015, http://www.orissadiary.com/CurrentNews.asp?id=58783#sthash.rcKmxDSi.dpuf 174 Economic Times, ‘Coal Ministry, Railways, Jharkhand government pact to build railway lines’, 4 May 2015,
http://articles.economictimes.indiatimes.com/2015-05-04/news/61800422_1_railway-line-central-coalfields-ltd-tori-shivpur-
kathotia 175 Global CemFuels, ‘Coal India to form coal joint venture with India Railways’, 1 April 2015, http://www.cemfuels.com/news/item/2856-coal-india-to-form-coal-joint-venture-with-india-railways
Rail link Tori-Shivpur-Kathautia Jharsuguda-Barpalli-SardegaBhupdeopur-Raigarh-Mand (east
corridor)
Coal field North Karanpura IB Valley Mand-Raigarh
Coal subsidiary CCL MCL SECL
State Jharkhand Odisha Chhattisgarh
Length of rail link (km) 93 52
180
(the full project includes 3 stretches: east
corridor, 180 km, north corridor, 77 km and
east-west corridor, 122 km)
Project cost (INR billion) 35.7 10 25
Mines involved (mtpa)Magadh (20), Amrapali (12). Koed Manatu
(10) and Pachra (15)
Basundhara (7), Garjanbahal (10), Siarmal
(14), Kulda (10-15), Chaturdhara (4)Mines of Gare-Pelma block
Volumes to be
transported (mtpa)80-100 50 (potential: 90 mtpa)
40
(potential: 100 mtpa for the full project)
Current status
(as of June 2015)
The Tori-Shivpur section is likely to be
completed by December 2016. The Shivpur
to Kathautia section is waiting for stage-I
clearance from MoEF.
The line will be developed by an SPV (MoU
signed in May 2015).
CIL has received stage-I clearance from
the MoEF and survey work has begun.
Stage-II clearance and land acquisition are
due.
The line will be developed by an SPV (MoU
signed in April 2015).
CIL's Board gave its in-principle approval to
the east corridor project in February 2015.
The east corridor will be developed by SPV
Chhattisgarh East Rail Ltd.
The east-west corridor has also been
planned by another SPV, Chhattisgarh East-
West Rail Ltd. CIL's board is yet to clear
this project.
Expected completion
dateDec-16 (Tori-Shivpur)
2016/17 (June 2016 for the 1st phase of
Jharsuguda-Barpalli) Dec-16
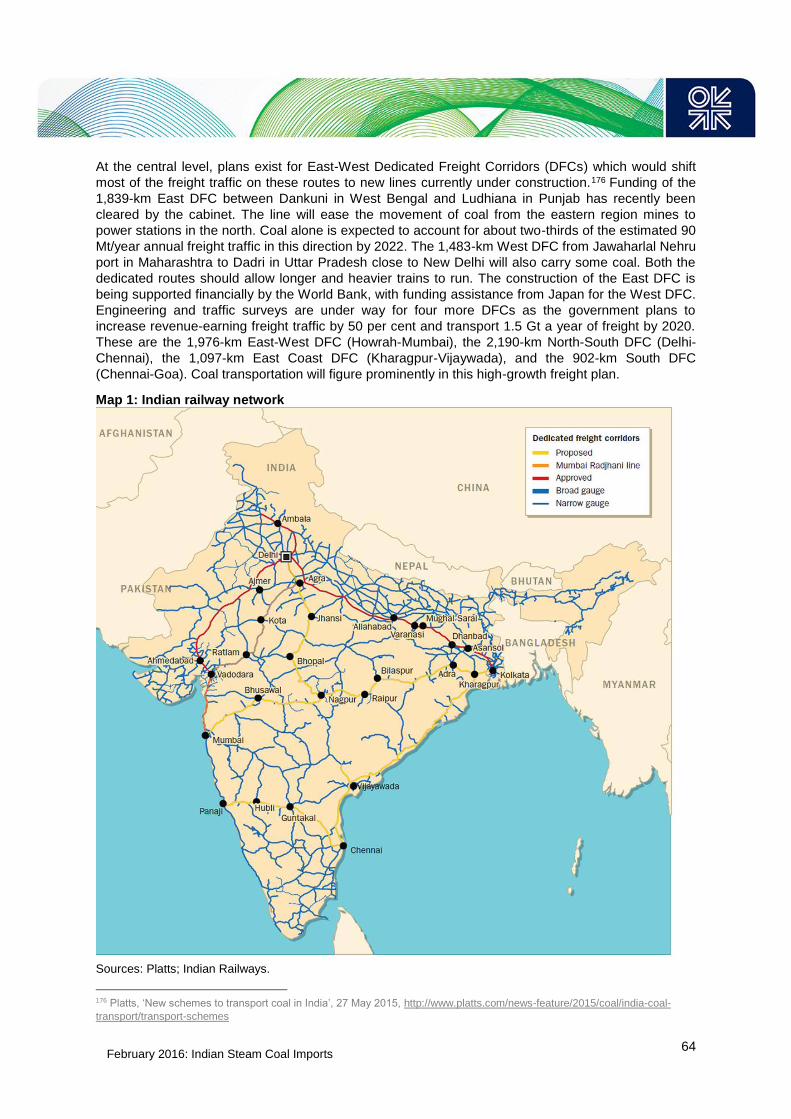
February 2016: Indian Steam Coal Imports
64
At the central level, plans exist for East-West Dedicated Freight Corridors (DFCs) which would shift
most of the freight traffic on these routes to new lines currently under construction.176 Funding of the
1,839-km East DFC between Dankuni in West Bengal and Ludhiana in Punjab has recently been
cleared by the cabinet. The line will ease the movement of coal from the eastern region mines to
power stations in the north. Coal alone is expected to account for about two-thirds of the estimated 90
Mt/year annual freight traffic in this direction by 2022. The 1,483-km West DFC from Jawaharlal Nehru
port in Maharashtra to Dadri in Uttar Pradesh close to New Delhi will also carry some coal. Both the
dedicated routes should allow longer and heavier trains to run. The construction of the East DFC is
being supported financially by the World Bank, with funding assistance from Japan for the West DFC.
Engineering and traffic surveys are under way for four more DFCs as the government plans to
increase revenue-earning freight traffic by 50 per cent and transport 1.5 Gt a year of freight by 2020.
These are the 1,976-km East-West DFC (Howrah-Mumbai), the 2,190-km North-South DFC (Delhi-
Chennai), the 1,097-km East Coast DFC (Kharagpur-Vijaywada), and the 902-km South DFC
(Chennai-Goa). Coal transportation will figure prominently in this high-growth freight plan.
Map 1: Indian railway network
Sources: Platts; Indian Railways.
176 Platts, ‘New schemes to transport coal in India’, 27 May 2015, http://www.platts.com/news-feature/2015/coal/india-coal-
transport/transport-schemes

February 2016: Indian Steam Coal Imports
65
4.3.4.3 Rationalization of coal linkages
In a further effort to improve coal transportation, the government, through a dedicated Inter-Ministerial
Task Force (IMTF), has undertaken a comprehensive review of existing coal sources and feasibility
for rationalization of coal linkages with a view to optimizing transportation costs and improve
availability of coal at consuming plants.177 Coal blocks mostly have arrangements with power plants
located at a considerable distance, with an average distance of almost 600 km, which leads to heavy
carriage expenses. The rationalization of coal linkages is aimed to link power plants to the nearest
mines and involves swapping of coal between power plants to optimize transportation logistics and
costs.
The IMTF review, carried out by consultancy firm KPMG,178 has listed several proposals for coal
swapping arrangements in the power sector. These include bilateral and multilateral swaps for 114
power plants of more than 100 GW capacity.179 Between $700 and $950 million in logistics cost could
be saved annually through these proposals. It would also result in decongestion of the railway
network by helping to reduce the average distance travelled by coal from 597 km/t to 416 km/t.180
The rationalization of coal linkages nevertheless remains a complex exercise as it involves the
agreement of all stakeholders (mines, power utilities, and railways) to implement the swaps. The IMTF
has therefore recommended a step-by-step approach. In a first stage, which is under implementation,
the MoC has directed bilateral swapping arrangements for 19 thermal power plants (TPPs) of public
companies, like NTPC and Damodar Valley Corp (DVC) and electricity generation utilities of the
states of Haryana, Rajasthan, Gujarat, Maharashtra, Telengana, and Punjab. These swapping
arrangements could save $160 million annually thanks to optimized distances and will maximize
dispatches of coal. The second stage, to be implemented in the short run, consists of bilateral swaps
between utilities of six states – Uttar Pradesh, Haryana, Rajasthan, Gujarat, Tamil Nadu,
Maharashtra, and Punjab – and power stations of NTPC and DVC and involves swaps between
imported and domestic coal. In Stage III, to be implemented in the long run, a cluster-wise approach
based on multilateral arrangements has been recommended by the task force to achieve further
rationalization and a net reduction of the overall costs.
4.3.5 Adequacy of coal reserves and accelerated exploration
India has huge coal resources: a total of 306.6 Gt of geological hard coal resources181 at a maximum
depth of 1,200m are estimated by the Geological Survey of India (GSI) as of 1 April 2015, of which
131.6 Gt are proved reserves. At current production rates (612 Mt in FY2015), the ratio of reserves to
production (R/P) exceeds 200 years. The major hard coal deposits of the country are located in the
eastern and southeastern parts of the country. Jharkhand, Chhattisgarh, Odisha, and West Bengal
account for 79 per cent of the country’s coal reserves. Telangana, Madhya Pradesh, and Maharashtra
are the other significant coal states in India. In addition, India has 44 Gt of lignite resources, of which
6.2 Gt are proven. The southern state of Tamil Nadu hosts most of the country’s lignite deposits.
177 MoC, Report of the new Inter-Ministerial Task Force (IMTF) on Rationalization of sources of Coal to Power plants, 2
February 2015, http://coal.nic.in/sites/upload_files/coal/files/webform/notices/030215a.pdf 178 MoC, 2 February 2015, ibid 179 The linkage rationalization exercise included CIL and SCCL linked TPPs only. It assumed that 5.2 Mt (at 4,000 kcal/kg GCV)
was required per 1,000 MW at 90 per cent PLF. 180 MoC, Report of the new Inter-Ministerial Task Force (IMTF) on Rationalization of sources of Coal to Power plants, 2
February 2015, http://coal.nic.in/sites/upload_files/coal/files/webform/notices/030215a.pdf 181 Based on the results of regional/promotional exploration, where the boreholes are normally placed 1–2km apart, geological
resources are classified into ‘Indicated’ or ‘Inferred’ category. Subsequent detailed exploration in selected blocks, where
boreholes are less than 400m apart, upgrades the resources into the more reliable ‘Proved’ category.

February 2016: Indian Steam Coal Imports
66
Table 18: Geological resources and proved reserves of hard coal in India, as of 1 April 2015
Source: Geological Survey of India.
That most of India’s coal reserves are located at depths of less than 300m is reflected by the focus of
most exploration work, which has thus far been done at depths of less than 600m. Some 76 per cent
of proved reserves and 58 per cent of geological resources are located at depths of less than 300m.
Most proved coal reserves (107 Gt or 85 per cent) consist of steam coal (data for FY2014). As
mentioned before, India lacks coking coal reserves of good quality.
Within India’s endowment, CIL has a huge geological resource and extractable reserve base (64 Gt
and 22 Gt respectively). Its extractable coal reserves can suffice for the current production level (494
Mt) for the next 44 years – a figure similar to international mining companies such as Peabody, which
has an R/P ratio of 33 years. At 1 Gtpa the R/P ratio is reduced to 22 years, meaning that CIL will
need to invest in coal exploration to transform its resource base into extractable reserves.
The Central Mine Planning & Design Institute Limited (CMPDI), which carries out exploration,
invested $50 million in exploration in FY2014 (in CIL and non-CIL blocks). Thanks to its detailed
exploration, about 3 Gt of proved reserves are being added each year. In the past, the pace of
exploration has been constrained due to limitation on the boreholes in areas under forest cover and
also due to law and order problems prevailing in some areas. Exploration investment has also been
much lower than the level in other coal-bearing countries. These issues are being addressed by the
new government, which has targeted a doubling of exploration activities from 700 km in FY2014 to
1,500 km in FY2016. In FY2015, CMPDI achieved record exploration, adding 3.6 Gt to total proved
reserves.182 In order to reach the target set by the MoC for FY2016, which requires the preparation of
26 new project reports assessing the economic viability of new mines, CMPDI has signed a MoU with
Mineral Exploration Corporation Limited (MECL) to enhance its exploration capacity and has also
outsourced exploration in some blocks. It is also strengthening its drilling capacity through
mechanizing and modernizing drilling operations. CMPDI envisages an increasing usage of
hydrostatic drill rigs, adoption of 3D seismic surveys with high resolution, and advanced software tools
for geological modelling and mine planning. CMPDI is focusing on establishing coal reserves lying
between 300–600m depths with a special focus on proving dip side extension of already established
coal mines/blocks.
4.3.6 Going deeper: underground mining
Part of CIL’s plan to increase production to 1 Gt is based on the development of underground (UG)
mining. In India, where 93 per cent of CIL’s production is from shallow-depth opencast mines, UG
mining is a ‘new’ technology. The clear preference for OC mining is due to difficult geological
conditions, lack of expertise and technology in deep mining, and costs. However, with 42 per cent of
182 Economic Times, ‘Coal India arm achieves record exploration in FY15’, 13 April 2015, http://articles.economictimes.indiatimes.com/2015-04-13/news/61102903_1_coal-india-arm-cmpdi-ak-debnath
State Proved reserves
(Gt)
Indicated (Gt) Inferred (Gt) Total geological
resources (Gt)
West Bengal 13.5 13.0 4.9 31.4
Jharkhand 41.5 33.0 6.6 81.0
Bihar 0.0 0.0 0.2 0.2
Madhya Pradesh 10.4 12.8 3.3 26.5
Chhattisgarh 18.2 34.4 2.3 54.9
Uttar Pradesh 0.9 0.2 0.0 1.1
Maharashtra 6.0 3.2 2.1 11.3
Odisha 30.7 36.5 8.5 75.8
Telengana 9.8 8.8 2.6 21.2
Assam 0.5 0.0 0.0 0.5
Others 0.1 0.1 0.8 1.1
Total India 131.6 143.2 31.7 306.6
February 2016: Indian Steam Coal Imports
67
Indian geological resources located at depths beyond 300m, thus accessible only by UG mechanized
mining, CIL will need to exploit deeper seams in existing OC mines and significantly invest in UG
mining. In addition, UG mining has lower environmental effects and requires less land than OC
mining. It also allows the production of better quality coal and overcomes hurdles related to working in
areas that are not suitable for OC operations for surface reasons – be it forest cover or cultivated
fields and habitation.
UG coal mining is a challenging area in India.183 The most efficient way to carry out UG mining is to
extract long panels of coal with the use of massive shearers and a roof support system through long-
wall mining. This mining technique has not been successful in India because there are no large areas
of continuous coal deposits underground. One of the ways in which UG mining could be boosted in
India is through continuous miner (CM) technology, which requires less investment than long-wall
mining and can work in difficult conditions, even in the absence of a long stretch of continuous coal
seams.
Currently, CIL operates 231 UG mines and 28 mixed mines, corresponding to half of its operating
mines. However, production at UG mines totalled only 35 Mt in FY2015. Production per mine is very
small: 0.1 to 0.2 mtpa for most of them, and only one has a production above 1 Mt (in the main coal-
producing countries, UG mines have production capacity above 10 mtpa). In addition, CIL operations
are highly intensive in their use of unskilled labour. The productivity for CIL’s UG mines, measured
through output per man-shift (OMS), was 0.78 tons in FY2015. The corresponding figure for OC
mines was 13.16.
UG mining is thus more costly than OC mining. According to CIL, the cost of production from
operational UG mines had gone up to about $54 per ton in FY2014, thus making small-capacity UG
mines inviable. CIL’s UG production has therefore decreased from 47 Mt in FY2005 to 35 Mt in
FY2015.
Despite these challenging conditions, CIL intends to arrest the drop in UG production by identifying
more productive mines, introducing heavy mechanization and skilled manpower to operate the
equipment, and improving efficiencies and safety standards. The company also intends to reopen
mines that have been abandoned but can be made productive with mechanization. As CIL does not
have the technology to mine UG efficiently, it plans to undertake a study of 90 UG mines with the help
of global experts.
By FY2020, CIL is expected to achieve UG production of 52.20 Mt by using improved technology to
limit upward pressure on extraction costs.184 The company intends to introduce CM technology at
large-scale long-wall technology at selected mines where the technology can be implemented, man-
riding systems in major mines to utilize shift hours fully, and the use of tele-monitoring techniques.185
183 Coal Junction, ‘Govt’s underground coal mining plan hits hurdles’, 3 July 2015, http://www.coaljunction.in/news/n_newsdetail/Govt-s-underground-coal-mining-plan-hits-hurdles_1#sthash.EB5heJle.dpuf 184 Business Standard, CIL's underground coal output declines 3% to 35 MT in FY15, 18 May 2015, http://www.business-
standard.com/article/pti-stories/cil-s-underground-coal-output-declines-3-to-35-mt-in-fy15-115051801299_1.html 185 Economic Times, Coal India plans to utilize underground resources for boosting production figures, 13 October 2014, http://articles.economictimes.indiatimes.com/2014-10-13/news/54970708_1_underground-mines-new-mines-coal-india ; Energysector.in, ‘Steps to increase coal production from underground mines’, 2 August 2014, http://www.energysector.in/coal-news/steps-to-increase-coal-production-from-underground-mines-august-2014

February 2016: Indian Steam Coal Imports
68
Figure 22: CIL’s underground coal production, historical and planned
Source: CIL; Business Standard, 18 May 2015.
In order to grow UG production, there is a need for huge technology absorption and competence in
addition to capital investments. This is already underway at three of CIL’s subsidiaries. BCCL has
taken the strategic initiative for exploitation of deeper deposits by UG methods, and in 2010/11 it
invited global bids for the development and operation of six high-capacity UG mines with the latest
global technology. Six tenders were finalized for a total output of 8 mtpa. In addition, another six UG
mines with tenders are in the pipeline and are envisaged to add 6 mtpa of capacity. Through the
operation of these high-capacity UG mines, BBCL expects to develop indigenous capability in UG
mining, similar to the indigenization of OC technology which has taken place over the last two
decades. SECL and ECL have identified underground mines where high-technology mining is
required. They are expected to be the first to award mines under the new Mine Development &
Operator (MDO) model.186
Despite the potential revival in UG production, CIL’s plan does not constitute a major shift from OC to
UG mining. Most of the mines planned to be developed in CIL’s roadmap are primarily OC in nature,
so there will be no shift from low-cost OC to higher-cost UG production in the short term. In addition, it
takes almost six years of planning to develop new UG mines, so efforts undertaken in this decade will
not actually materialize until after 2020.
4.3.7 Going bigger: a huge need for modern equipment and improved efficiency
In order to rapidly ramp up its production, CIL needs to upgrade and modernize its coal mining
technology. Mega OC projects have been planned with large-scale equipment for excavation,
transportation, drilling, and other auxiliary operations187 (such as high-capacity Heavy Earth Moving
Machinery [HEMM] for coal extraction and removal of ‘overburden’, 188 in-pit crushing technology,
deployment of surface miners,189 and operator independent truck dispatch system using GPS to
reduce time for loading). Adoption of different types of conveyers for transportation of coal from pit to
surface and installation of more coal handling plants with large capacity silos for faster loading of coal
into the wagons are also planned.
One of the basic constraints to increasing production is the availability of HEMM and spare parts for
all kinds of equipment to remove the overburden and produce and evacuate coal. The massive
increase in production requires a paradigm shift in HEMM procurement and maintenance, which so
186 Mining Weekly, ‘Longwall mining making a comeback in India’, 9 June 2015, http://www.miningweekly.com/article/long-wall-
mining-making-a-comeback-in-india-2015-06-09 187 Business Standard, ‘Coal India designs roadmap for 1-bn-tonne coal production’, 20 February 2015, http://www.business-standard.com/article/companies/coal-india-designs-roadmap-for-1-bn-tonne-coal-production-115022000986_1.html 188 The layer of the sedimentary rock material that covers coal seams 189 Surface miners cut, crush, and load the material in one single machine pass – meaning that one single machine completes the job of many different pieces of equipment.
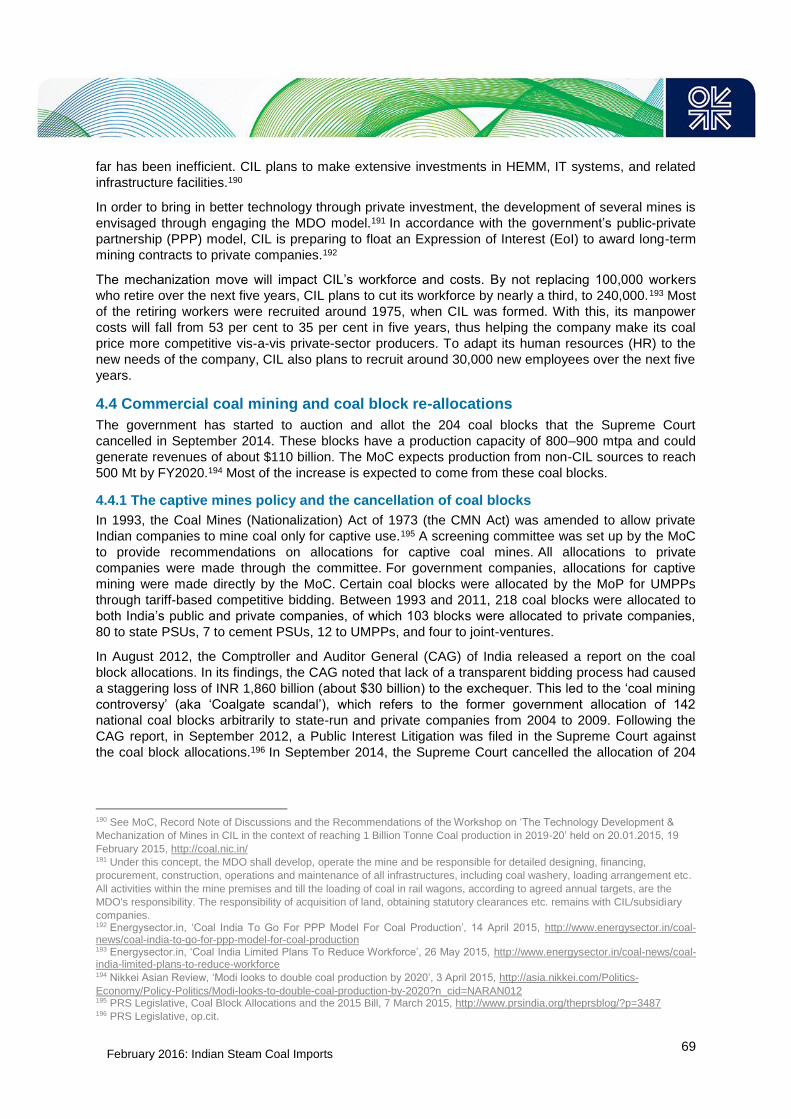
February 2016: Indian Steam Coal Imports
69
far has been inefficient. CIL plans to make extensive investments in HEMM, IT systems, and related
infrastructure facilities.190
In order to bring in better technology through private investment, the development of several mines is
envisaged through engaging the MDO model.191 In accordance with the government’s public-private
partnership (PPP) model, CIL is preparing to float an Expression of Interest (EoI) to award long-term
mining contracts to private companies.192
The mechanization move will impact CIL’s workforce and costs. By not replacing 100,000 workers
who retire over the next five years, CIL plans to cut its workforce by nearly a third, to 240,000.193 Most
of the retiring workers were recruited around 1975, when CIL was formed. With this, its manpower
costs will fall from 53 per cent to 35 per cent in five years, thus helping the company make its coal
price more competitive vis-a-vis private-sector producers. To adapt its human resources (HR) to the
new needs of the company, CIL also plans to recruit around 30,000 new employees over the next five
years.
4.4 Commercial coal mining and coal block re-allocations
The government has started to auction and allot the 204 coal blocks that the Supreme Court
cancelled in September 2014. These blocks have a production capacity of 800–900 mtpa and could
generate revenues of about $110 billion. The MoC expects production from non-CIL sources to reach
500 Mt by FY2020.194 Most of the increase is expected to come from these coal blocks.
4.4.1 The captive mines policy and the cancellation of coal blocks
In 1993, the Coal Mines (Nationalization) Act of 1973 (the CMN Act) was amended to allow private
Indian companies to mine coal only for captive use.195 A screening committee was set up by the MoC
to provide recommendations on allocations for captive coal mines. All allocations to private
companies were made through the committee. For government companies, allocations for captive
mining were made directly by the MoC. Certain coal blocks were allocated by the MoP for UMPPs
through tariff-based competitive bidding. Between 1993 and 2011, 218 coal blocks were allocated to
both India’s public and private companies, of which 103 blocks were allocated to private companies,
80 to state PSUs, 7 to cement PSUs, 12 to UMPPs, and four to joint-ventures.
In August 2012, the Comptroller and Auditor General (CAG) of India released a report on the coal
block allocations. In its findings, the CAG noted that lack of a transparent bidding process had caused
a staggering loss of INR 1,860 billion (about $30 billion) to the exchequer. This led to the ‘coal mining
controversy’ (aka ‘Coalgate scandal’), which refers to the former government allocation of 142
national coal blocks arbitrarily to state-run and private companies from 2004 to 2009. Following the
CAG report, in September 2012, a Public Interest Litigation was filed in the Supreme Court against
the coal block allocations.196 In September 2014, the Supreme Court cancelled the allocation of 204
190 See MoC, Record Note of Discussions and the Recommendations of the Workshop on ‘The Technology Development &
Mechanization of Mines in CIL in the context of reaching 1 Billion Tonne Coal production in 2019-20’ held on 20.01.2015, 19
February 2015, http://coal.nic.in/ 191 Under this concept, the MDO shall develop, operate the mine and be responsible for detailed designing, financing,
procurement, construction, operations and maintenance of all infrastructures, including coal washery, loading arrangement etc.
All activities within the mine premises and till the loading of coal in rail wagons, according to agreed annual targets, are the
MDO's responsibility. The responsibility of acquisition of land, obtaining statutory clearances etc. remains with CIL/subsidiary
companies. 192 Energysector.in, ‘Coal India To Go For PPP Model For Coal Production’, 14 April 2015, http://www.energysector.in/coal-news/coal-india-to-go-for-ppp-model-for-coal-production 193 Energysector.in, ‘Coal India Limited Plans To Reduce Workforce’, 26 May 2015, http://www.energysector.in/coal-news/coal-india-limited-plans-to-reduce-workforce 194 Nikkei Asian Review, ‘Modi looks to double coal production by 2020’, 3 April 2015, http://asia.nikkei.com/Politics-
Economy/Policy-Politics/Modi-looks-to-double-coal-production-by-2020?n_cid=NARAN012 195 PRS Legislative, Coal Block Allocations and the 2015 Bill, 7 March 2015, http://www.prsindia.org/theprsblog/?p=3487 196 PRS Legislative, op.cit.

February 2016: Indian Steam Coal Imports
70
coal blocks, out of a total of 218 allocated since 1993,197 on the grounds that the allocation process
made through the screening committee and government dispensation was arbitrary and illegal.
Further, the court said that the cancellation of 42 coal blocks that were operational or near-operational
at that time would be effective from 31 March 2015.198 The court has also directed that an additional
levy of INR 295/t be paid by these 42 coal blocks for the coal extracted since the commencement of
production until 31 March 2015.
The cancellation of the 204 blocks impacts around 40–50 Mt of production, and much more on the
basis of future production: the 12th FYP envisaged that captive mines would produce 100 Mt in
FY2017 and 315 Mt by FY2022. Despite ambitious plans, however, coal production from the allocated
captive blocks has grown at very slow pace over the past 20 years on account of constraints like
delays in forest and environmental clearances, problems of land acquisition and R&R, lack of
business expertise, and various other issues. Production from captive blocks was 52.8 Mt in FY2015.
Figure 23: Evolution of production from captive mines (FY1998–2015)
Source: Coal Controller’s Organisation, 2015.
4.4.2 Commercial mining: the 2015 Coal Mines Bill
Following the Supreme Court decision, the government acted swiftly to reduce coal supply uncertainty
emerging from the de-allocation of the coal blocks. Soon after the Supreme Court judgment, on 21
October 2014, the government promulgated the Coal Mines (Special Provisions) Ordinance 2014, for
the management and re-allocation of all cancelled blocks. The chosen route was competitive bidding,
using electronic auctions to make the allocation process fully transparent. In order to implement the
provisions of the ordinance, rules were issued in December 2014, namely the Coal Mines (Special
Provisions) Rules. The ordinance, which was replaced by the 2014 Coal Mines (Special Provisions)
Bill, could not be passed by parliament since it was not in session, and lapsed. The government then
promulgated the Coal Mines (Special Provisions) Second Ordinance, 2014 on 26 December 2014,
allowing the government to start the allocation process in line with the ordinance and rules. The
ordinance was then introduced in the parliament in its spring session and the Coal Mines (Special
Provisions) Bill, 2015 (the Coal Bill) was passed by the Lok Sabha (lower house) on 4 March 2015. It
won parliamentary approval on 21 March 2015 when the Rajya Sabha (upper house), passed the
legislation.199
197 14 blocks were not cancelled: Tasra coal block allocated to SAIL, Pakri Barwadih block to NTPC and 12 blocks allocated to
UMPPs via competitive bidding for lowest tariffs. 198 Among the 218 coal blocks, 40 were under production and six were ready to start production. Of the 40 blocks under
production, 37 were cancelled and of the six ready to produce, five were cancelled. 199 Although the central government National Democratic Alliance (NDA) is in a minority in the Rajya Sabha, the revenues expected from the auctions of the coal blocks, which are transferred to the state governments where the mines are located, have helped the passage of the bill.

February 2016: Indian Steam Coal Imports
71
While the primary aim of the Coal Bill is to swiftly re-allocate the cancelled operational blocks, the
government took this as an opportunity to rationalize coal mining operations, consumption, and sale.
The step with the most significant long-term implications is the introduction of a provision allowing
commercial mining. This is a major shift from previous policies where only CIL was allowed to sell coal
to other companies.
Further, the Mines and Minerals (Development and Regulation) Amendment Act 2015,200 hereafter
‘the Mining Law’, introduced a system of auction for mines, instead of government allocations, and
allowed commercial mining by removing the restriction of end use from the eligibility to undertake coal
mining. The Mining Law also allows the central government to increase the maximum area of one
mining lease, previously limited to 10 sq km, instead of providing additional leases, a key criteria for
the expansion of OC mines. The Mining Law was passed by the Rajya Sabha on 21 March 2015.
Box 10: Commercial mining in India: the Coal Mines (Special Provisions) Bill, 2015
The Coal Bill (and previous ordinances) primarily seeks to allocate the coal mines that were cancelled
by the Supreme Court. It provides details for the auction process, compensation for the previous
licence holders, the process for transfer of mines, and details of authorities that would conduct the
auction. In addition, and in a complete shift with the practice of the past 40 years, the Coal Bill opens
the sector for commercial mining.
The Coal Bill creates three categories of mines, Schedule I, II, and III. In Schedule I, all the 204
cancelled blocks are listed. Of these 204 blocks, Schedule II includes the 42 blocks currently under
production or about to start production. Schedule III mines includes Schedule I mines that have been
earmarked for a specified end-use (power, iron and steel, and cement). Initially, there were 32 blocks
in Schedule III in the Coal Bill. The MoC added 36 blocks in Schedule III transferred from Schedule I
mines. Schedule III blocks are substantially developed coal blocks and are expected to be operational
within 1–2 years, reaching peak production capacity in another 2–3 years to reach peak production
capacity.
Schedule I mines can be allocated by way of either public auction or government allotment. For the
public auction route, any government, private, or joint-venture company can bid for the coal
blocks. They can use the coal mined from these blocks for their own consumption, sale, or for any
other purpose as specified in their mining lease. The government may also choose to allot Schedule I
mines to any government company or any company that was awarded a power plant project
(including UMPP) on the basis of competitive bidding for tariff. In such a case, a government company
can use the coal mined for its own consumption or sale.
For Schedule II and III mines, only government, private, and joint-venture companies with a specified
end-use are eligible to bid. The allocations can be made only through auction by competitive bidding.
The Coal Bill also allows the government to allot a coal mine without bidding to a government
company or to an electricity generator that has been awarded a power project on the basis of
competitive bids for tariffs.
4.4.3 A two-step approach to open up the coal sector
Rather than privatizing CIL to foster competition and attract private investment in the coal sector – a
political decision which was expected to trigger considerable opposition from political parties201 and
trade unions in the coal sector – the government has taken a less radical approach, but still a
transformative and strategic one, to open up the sector.
In a first step, the government is allocating blocks for captive mining where PSUs and private
domestic companies that run power, steel, or cement plants are allowed to mine coal specifically to
200 PRS Legislative, The Mines and Minerals (Development and Regulation) Amendment Ordinance, 2015
http://www.prsindia.org/billtrack/the-mines-and-minerals-development-and-regulation-amendment-ordinance-2015-3601/ 201 As the government lacks a majority in India’s upper house of parliament, such an approach would have certainly failed.
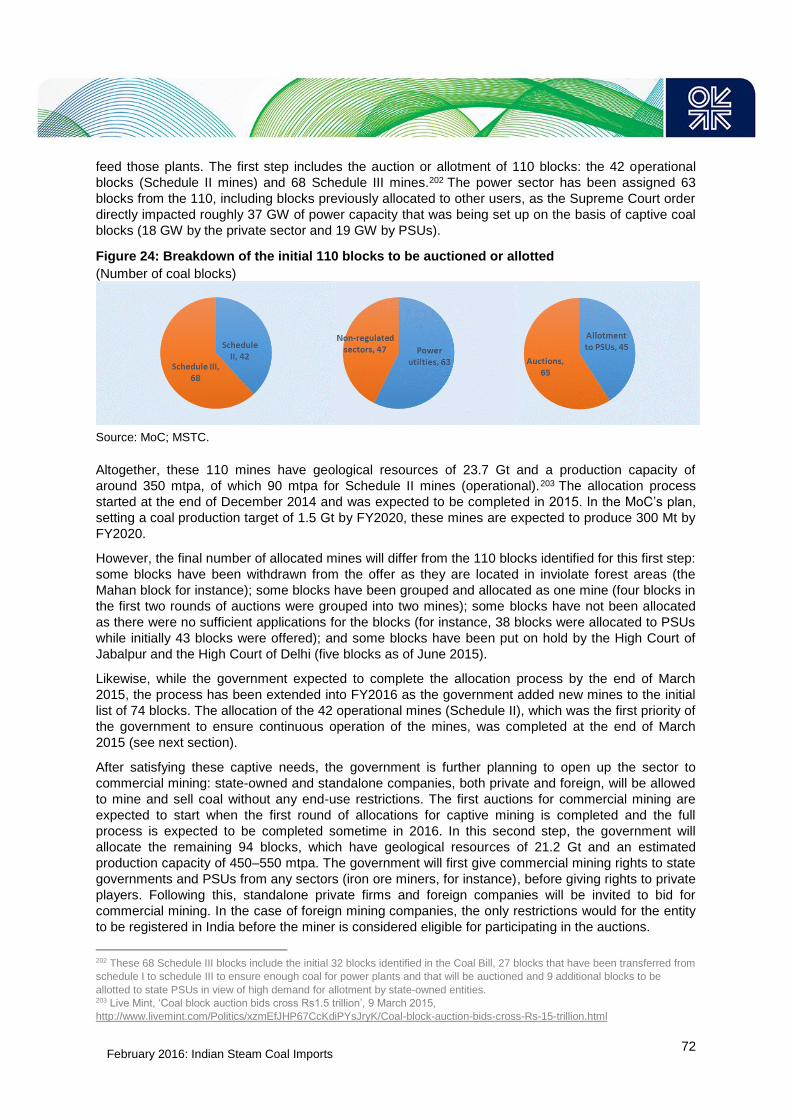
February 2016: Indian Steam Coal Imports
72
feed those plants. The first step includes the auction or allotment of 110 blocks: the 42 operational
blocks (Schedule II mines) and 68 Schedule III mines.202 The power sector has been assigned 63
blocks from the 110, including blocks previously allocated to other users, as the Supreme Court order
directly impacted roughly 37 GW of power capacity that was being set up on the basis of captive coal
blocks (18 GW by the private sector and 19 GW by PSUs).
Figure 24: Breakdown of the initial 110 blocks to be auctioned or allotted
(Number of coal blocks)
Source: MoC; MSTC.
Altogether, these 110 mines have geological resources of 23.7 Gt and a production capacity of
around 350 mtpa, of which 90 mtpa for Schedule II mines (operational).203 The allocation process
started at the end of December 2014 and was expected to be completed in 2015. In the MoC’s plan,
setting a coal production target of 1.5 Gt by FY2020, these mines are expected to produce 300 Mt by
FY2020.
However, the final number of allocated mines will differ from the 110 blocks identified for this first step:
some blocks have been withdrawn from the offer as they are located in inviolate forest areas (the
Mahan block for instance); some blocks have been grouped and allocated as one mine (four blocks in
the first two rounds of auctions were grouped into two mines); some blocks have not been allocated
as there were no sufficient applications for the blocks (for instance, 38 blocks were allocated to PSUs
while initially 43 blocks were offered); and some blocks have been put on hold by the High Court of
Jabalpur and the High Court of Delhi (five blocks as of June 2015).
Likewise, while the government expected to complete the allocation process by the end of March
2015, the process has been extended into FY2016 as the government added new mines to the initial
list of 74 blocks. The allocation of the 42 operational mines (Schedule II), which was the first priority of
the government to ensure continuous operation of the mines, was completed at the end of March
2015 (see next section).
After satisfying these captive needs, the government is further planning to open up the sector to
commercial mining: state-owned and standalone companies, both private and foreign, will be allowed
to mine and sell coal without any end-use restrictions. The first auctions for commercial mining are
expected to start when the first round of allocations for captive mining is completed and the full
process is expected to be completed sometime in 2016. In this second step, the government will
allocate the remaining 94 blocks, which have geological resources of 21.2 Gt and an estimated
production capacity of 450–550 mtpa. The government will first give commercial mining rights to state
governments and PSUs from any sectors (iron ore miners, for instance), before giving rights to private
players. Following this, standalone private firms and foreign companies will be invited to bid for
commercial mining. In the case of foreign mining companies, the only restrictions would for the entity
to be registered in India before the miner is considered eligible for participating in the auctions.
202 These 68 Schedule III blocks include the initial 32 blocks identified in the Coal Bill, 27 blocks that have been transferred from
schedule I to schedule III to ensure enough coal for power plants and that will be auctioned and 9 additional blocks to be
allotted to state PSUs in view of high demand for allotment by state-owned entities. 203 Live Mint, ‘Coal block auction bids cross Rs1.5 trillion’, 9 March 2015,
http://www.livemint.com/Politics/xzmEfJHP67CcKdiPYsJryK/Coal-block-auction-bids-cross-Rs-15-trillion.html

February 2016: Indian Steam Coal Imports
73
The government has recently begun to identify suitable coal blocks to be put up for auction for
commercial mining.204 Consultations with industry stakeholders to lay out an enabling roadmap for
commercial mining are also underway. The fiscal terms of contracts need to be specified, including
whether commercial miners will be asked to sign a revenue sharing contract or a profit sharing
contract. As part of the consultations, the Federation of Indian Chambers of Commerce and Industry
(FICCI) – the related industry body – has recommended three options for commercial mining.205 The
government is also working on including some restrictions, including a ban on exports of coal and a
regulated pricing regime, to offer protection to CIL. Specifically, the MoC has ruled out any kind of free
pricing regime, considering the shortage of coal in the country, and miners would not have the power
to set coal sale prices to final end-users.206 This regulated price regime has yet to be defined. The
government has also appointed a special committee to negotiate with trade unions operating in
the coal industry with a view to getting around workers’ opposition to opening up coal mining to
private investors.207
In the MoC’s plan setting a coal production target of 1.5 Gt by FY2020, blocks allocated for
commercial mining are expected to produce 200 Mt by FY2020. It is therefore imperative for the
government to lay out a roadmap to attracting private miners, foreign and domestic, especially since
the current global low-price environment does not encourage international mining companies to invest
in new projects. However, India is the biggest growth market for global coal demand, which should aid
government efforts.
Another key issue is regulation. Currently, the coal sector is regulated by the Coal Controller’s
Organisation, under the MoC.208 The Coal Bill does not establish an independent regulator to ensure
a level playing field for both private and government companies bidding for mines at auction. For the
conduct of the process of auction and allotment, the central government has appointed a nominated
authority.209 It remains that with the fundamental changes that are occurring in the coal sector, a
regulatory authority will be necessary to implement and oversee coal sector reforms. As the definition
of the regulatory framework and pricing policy for mines to be offered for commercial mining are
ongoing at the time of writing, it is not possible to assess the attractiveness of the chosen model.
4.4.4 Allocation of coal mines to private companies and PSU with specified use
Under the auspices of the Coal Secretary, the allocations of the 110 coal blocks dedicated to private
companies, state governments, and PSUs with captive use in the power, cement, and steel sectors
204 Mining Weekly, ‘India’s coal block auction to be ready by June’, 27 February 2015, www.miningweekly.com/article/indias-coal-block-auction-to-be-ready-by-june-2015-02-27 205 The three approaches are: 1) The mining lease be auctioned against an adjustable up-front price and production-linked
payments for classified and explored blocks; 2) Auction of prospecting licence-cum-mining leases for blocks having deposit
identification and blocks where reserves are ‘proved’ but where mining has not started; 3) FICCI suggested a two-stage
process commencing with an exploration contract followed by auctioning of mining leases for areas where reserves are yet to
be proved and detailed exploration is pending.
Business Standard, ‘FICCI designs model for commercial mining’, 22 June 2015; http://www.business-
standard.com/article/economy-policy/ficci-designs-model-for-commercial-coal-mining-115062200030_1.html; Business Line,
‘Commercial mining: Coal Ministry seeks to finalise model for contracts’, 24 June 2015,
http://www.thehindubusinessline.com/news/stakeholder-consultations-on-roadmap-for-commercial-coal-
miningbegin/article7345959.ece 206 Mining Weekly, ‘India won’t consider free pricing regime for commercial coal miners’, 13 April 2015,
http://www.miningweekly.com/article/india-wont-consider-free-pricing-regime-for-commercial-coal-miners-2015-04-13 207 In a major victory for the government, CIL’s workers unions in January 2015 called off a five-day strike on its second day. The five powerful unions of the company opposed the government's move to sell a stake and open up the industry, but cancelled the strike after the Minister of State for Power, Coal & New and Renewable Energy assured them that a committee would be formed to address their concerns. 208 An independent regulator was established by the Coal Regulatory Authority Bill, 2013. However, the bill introduced in the Lok Sabha lapsed with the dissolution of the 15th Lok Sabha on 18 May 2014. The government has considered re-introducing the bill in the Lok Sabha but no concrete actions have been taken thus far. 209 According to the Coal Bill, functions of the nominated authority include: (i) conducting the process of auction and allotment, (ii) executing the vesting and allotment orders, (iii) collecting the auction proceeds and transferring them to the respective state
governments.

February 2016: Indian Steam Coal Imports
74
started at the end of December 2014. In the first three months of 2015, the government conducted
two rounds of auctions to private companies and one allotment to state governments and PSUs. A
third round of auctions, including five blocks, was held in August 2015.210 The government also
intends to add eight to 10 more mines in a fourth auction.
Box 11: Rules for auctions, conditions for bidding and monitoring of coal production
The auctions are electronic and use a dedicated platform managed by state-owned MSTC Limited.211,
212 In view of its impact on coal prices in each sector, the auction process has been designed
differently for different categories of end-use consumers:
For the regulated sector (power utilities), a reverse auction method is applicable, where the winning
bidder is the one who quotes the lowest bid below a ceiling price determined by the government
(the objective is to reduce electricity tariffs).
For the non-regulated sector (iron and steel, sponge iron, cement, CPPs, etc.), forward bidding is
applicable, where qualified bidders quote incremental bids above the pre-determined floor price (the
objective is to maximize revenues for the states).
The auction offer is the bid price per ton of coal produced. Such bid prices shall be above the floor
price (fixed at INR 150/t) in case of forward bidding or a below-the-ceiling price, which is the prevailing
CIL notified price for each block, in case of reserve bidding. In that case, the lowest bidder wins the
auction. This price would only be allowed as a pass through of fuel cost in the determination of the
power tariff by the appropriate regulatory commission to ensure that the benefit of lower bid prices is
passed on to the consumers. Additionally, for power projects having Power Purchase Agreements
(PPAs), a fixed reserve payment of INR 100/t has to be made on actual production by the successful
bidder. In case the reverse bidding amount reaches zero, the bidders are required to bid on an
‘additional premium’ over and above the fixed reserve price. This premium is payable to the state
government concerned and is not allowed as a pass through of fuel cost in the power tariff.
The level of readiness of end-use plants is one of the qualifying requirements. For the auction bid, at
least 80 per cent of the investment in the end-use project, and at least 40 per cent of investment in
other units if it is a multiple unit project, should have been incurred for Schedule II mines, and a
similar condition of 60 per cent and 30 per cent investment have been imposed for Schedule III
mines.
In order to monitor the efficient development of the allocated mines, milestones for development and
production of coal from the allocated mines have been prescribed under the Coal Mines Development
and Production Agreement (CMPDA)213 signed with the successful bidders/allottees. According to the
CMPDA, the successful bidders have to report periodically to the nominated authority and state
governments during the various stages of mining and shall conduct mining operations at the coal
mine in accordance with the defined milestones or ‘efficiency parameters’. The most important of
these is to reach the rated production capacity defined in the mining plan. Failure to comply with the
efficiency parameters would result in appropriation of the bank guarantee. In case of shortfall in
210 Initially, the government intended to auction 10 mines, but four mines were withdrawn due to lack of bids and one mine, Jamkhani, due to ongoing litigation. Economic Times, ‘Third tranche of coal auctions from Tuesday; 22 bids qualify’, 8 August 2015, http://articles.economictimes.indiatimes.com/2015-08-08/news/65350952_1_coal-auction-coal-block-marki-mangli 211 DNA, ‘Government issues draft rules for coal block auction’, 19 December 2014, http://www.dnaindia.com/money/report-government-issues-draft-rules-for-coal-block-auction-2045211 212 MSTC Limited, Coal mine allocation, 2014 and 2015, http://www.mstcecommerce.com/auctionhome/coalblock/index.jsp 213 Business Standard, ‘Coal Ministry issues mine development, production agreement for upcoming e-auction’, 23 January 2015, http://www.business-standard.com/article/economy-policy/coal-ministry-issues-mine-development-production-agreement-for-upcoming-e-auction-115012300710_1.html

February 2016: Indian Steam Coal Imports
75
production, the government will deduct the bank guarantee214 in proportion to the shortfall in any year.
The CMPDA also provides for conditions of withdrawal/cancellation of the mining rights. It is therefore
expected that the mine operators will efficiently develop and ramp up production to the production
capacity defined in the CMPDA in order not to lose their bank guarantee, or even their coal supply.
In the event that the operator mines coal in excess of its annual requirement, surplus coal has to be
sold to CIL at the bid price (non-regulated sector) or at the prevailing CIL-notified price for similar
grades (power utilities).
The winning bidder in the power sector is allowed to sell 15 per cent of power in the merchant market,
while the remaining capacity has to be contracted through long- and medium-term PPAs.
The first two rounds of auctions to allocate mines to the private sector for captive mining were held in
February and March 2015. Nineteen blocks (Schedule II mines) from the first auction were allocated
in March 2015, and they are expected to produce 34 mtpa. In the second auction, 14 blocks
(Schedule III mines) were allocated, and they are expected to produce 29 Mt (see Annex 5).
The government has re-examined nine bids out of the 33 coal mines allocated in these two rounds of
auctions. Although the winning bids for these mines were the highest in their individual auctions, they
were low by comparison with the winning bids for other similar blocks. In addition, the bidding process
was quickly completed and the winning bid prices were in the vicinity of opening prices. Bids for five of
those mines were finally accepted, but four bids were rejected (Jindal’s bids for 2 Schedule II blocks,
Gare Palma IV/ 2 and 3, and one Schedule III block, Tara; and BALCO’s bid for Schedule II block,
Gare Palma IV/1).215 Despite the sensible message delivered to the market ahead of more auctions,
the government took this decision to avoid any complaints regarding cartelization in bidding. The
blocks will have to be re-auctioned. In the meantime, and following the judgement of the Supreme
Court of September 2014,216 CIL has interim custody of these blocks.217 The number of allocated
blocks in the first two rounds of auctions was therefore 29.218 Out of these 29 coal mines, 16 are
operational coal mines included in Schedule II and 13 are Schedule III mines.
In addition, 43 blocks (17 under the Schedule II category and 26 under the Schedule III category)
were offered to central and state PSUs, such as NTPC and State Electricity Boards, for the power and
steel sector. In March 2015, the government allotted 38 mines to central and state PSUs, as there
were no applications for some coal blocks.219 37 blocks were allotted to the power sector, and one
block was allotted to the Steel Authority of India (SAIL). Almost all PSUs that lost their producing coal
blocks following the Supreme Court judgment have got back the same in the re-allocation undertaken
by the government (see Annex 6).
214 To calculate the bank guarantee, the intrinsic value of the blocks is calculated by computing its Net Present Value based on
discounted cash flow method. The winning bidder has to pay 10 per cent of this intrinsic value upfront and the balance
annuitized and paid on a per ton basis. 215 NDTV, ‘Government Rejects Low Winning Bids for 4 'Outlier' Coal Mines’, 21 March 2015, http://profit.ndtv.com/news/industries/article-government-rejects-low-winning-bids-for-4-outlier-coal-mines-748453 216 According to the judgement of the Supreme Court, for the operating mines which have not been auctioned till 31 March 2015, or not successfully, the government may appoint a custodian, to operate and manage the mine, on behalf of the central government, till the completion of auction or allotment, so that the production of those mines are not disrupted. In addition to the four mines where the bids were rejected by the government, CIL has been appointed as Designated Custodian of other Schedule II mines, which could not be auctioned successfully (Marki Mangli-II, Namchik Namphuk, Gotitoria (East) and Gotitoria (West)).
217 Energysector.in, ‘CIL Gets Interim Custody of 3 Coal Blocks’, 30 March 2015, http://www.energysector.in/coal-news/cil-gets-interim-custody-of-3-coal-blocks 218 Or even 28, as one mine, (Ardhagram with a peak rated capacity of 0.4 mtpa), where successful bidder was declared, has
been handed over to Designated Custodian, in view of a Court Case. 219 Money Control, ‘Govt allots 38 coal mines to central’, state PSUs, 24 March 2015, http://www.moneycontrol.com/news/economy/govt-allots-38-coal-mines-to-central-state-psus_1338504.html?utm_source=ref_article; Business Standard, ‘Coal block re-allocation: States, PSUs get back lost mines’, 25 March 2015, http://www.business-standard.com/article/economy-policy/coal-block-re-allocation-states-psus-get-back-lost-mines-115032500025_1.html
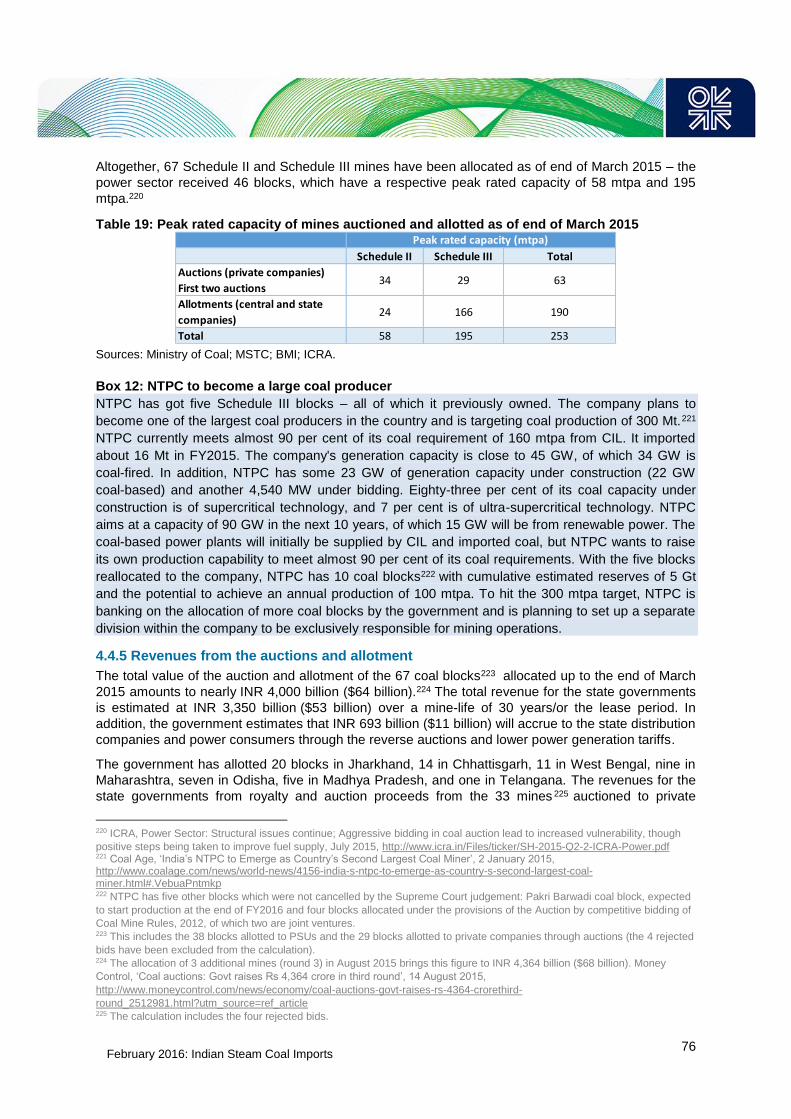
February 2016: Indian Steam Coal Imports
76
Altogether, 67 Schedule II and Schedule III mines have been allocated as of end of March 2015 – the
power sector received 46 blocks, which have a respective peak rated capacity of 58 mtpa and 195
mtpa.220
Table 19: Peak rated capacity of mines auctioned and allotted as of end of March 2015
Sources: Ministry of Coal; MSTC; BMI; ICRA.
Box 12: NTPC to become a large coal producer
NTPC has got five Schedule III blocks – all of which it previously owned. The company plans to
become one of the largest coal producers in the country and is targeting coal production of 300 Mt.221
NTPC currently meets almost 90 per cent of its coal requirement of 160 mtpa from CIL. It imported
about 16 Mt in FY2015. The company's generation capacity is close to 45 GW, of which 34 GW is
coal-fired. In addition, NTPC has some 23 GW of generation capacity under construction (22 GW
coal-based) and another 4,540 MW under bidding. Eighty-three per cent of its coal capacity under
construction is of supercritical technology, and 7 per cent is of ultra-supercritical technology. NTPC
aims at a capacity of 90 GW in the next 10 years, of which 15 GW will be from renewable power. The
coal-based power plants will initially be supplied by CIL and imported coal, but NTPC wants to raise
its own production capability to meet almost 90 per cent of its coal requirements. With the five blocks
reallocated to the company, NTPC has 10 coal blocks222 with cumulative estimated reserves of 5 Gt
and the potential to achieve an annual production of 100 mtpa. To hit the 300 mtpa target, NTPC is
banking on the allocation of more coal blocks by the government and is planning to set up a separate
division within the company to be exclusively responsible for mining operations.
4.4.5 Revenues from the auctions and allotment
The total value of the auction and allotment of the 67 coal blocks223 allocated up to the end of March
2015 amounts to nearly INR 4,000 billion ($64 billion).224 The total revenue for the state governments
is estimated at INR 3,350 billion ($53 billion) over a mine-life of 30 years/or the lease period. In
addition, the government estimates that INR 693 billion ($11 billion) will accrue to the state distribution
companies and power consumers through the reverse auctions and lower power generation tariffs.
The government has allotted 20 blocks in Jharkhand, 14 in Chhattisgarh, 11 in West Bengal, nine in
Maharashtra, seven in Odisha, five in Madhya Pradesh, and one in Telangana. The revenues for the
state governments from royalty and auction proceeds from the 33 mines 225 auctioned to private
220 ICRA, Power Sector: Structural issues continue; Aggressive bidding in coal auction lead to increased vulnerability, though
positive steps being taken to improve fuel supply, July 2015, http://www.icra.in/Files/ticker/SH-2015-Q2-2-ICRA-Power.pdf 221 Coal Age, ‘India’s NTPC to Emerge as Country’s Second Largest Coal Miner’, 2 January 2015, http://www.coalage.com/news/world-news/4156-india-s-ntpc-to-emerge-as-country-s-second-largest-coal-miner.html#.VebuaPntmkp 222 NTPC has five other blocks which were not cancelled by the Supreme Court judgement: Pakri Barwadi coal block, expected
to start production at the end of FY2016 and four blocks allocated under the provisions of the Auction by competitive bidding of
Coal Mine Rules, 2012, of which two are joint ventures. 223 This includes the 38 blocks allotted to PSUs and the 29 blocks allotted to private companies through auctions (the 4 rejected
bids have been excluded from the calculation). 224 The allocation of 3 additional mines (round 3) in August 2015 brings this figure to INR 4,364 billion ($68 billion). Money
Control, ‘Coal auctions: Govt raises Rs 4,364 crore in third round’, 14 August 2015,
http://www.moneycontrol.com/news/economy/coal-auctions-govt-raises-rs-4364-crorethird-
round_2512981.html?utm_source=ref_article 225 The calculation includes the four rejected bids.
Schedule II Schedule III Total
Auctions (private companies)
First two auctions 34 29 63
Allotments (central and state
companies)24 166 190
Total 58 195 253
Peak rated capacity (mtpa)

February 2016: Indian Steam Coal Imports
77
companies in the first two rounds total an estimated to $33 billion over the next 30 years based on
estimated production of the mines, surpassing CAG's earlier estimates of losses of $30 billion on
allotment without auction.
Coal-rich eastern states such as Jharkhand, Chhattisgarh, Odisha, West Bengal, and Madhya
Pradesh will benefit most from the proceeds of coal auctions, which will help them to develop their
infrastructure. Higher revenue to the states may also help the central government to solve pending
land acquisitions and green clearances.
Table 20: Estimated state-wise revenues from the first two rounds of auctions
Note: Original data in INR (exchange rate: 63).
Source: Ministry of Coal.
4.4.6 Outcome of the auctions for the private sector
The first two rounds of auctions226 have been a huge success for the government, by fetching high
revenues for state governments and lowering power tariffs.227 The government has also demonstrated
its willingness and capacity to conduct the process in a fully transparent way. The auction results also
send a strong message that investors are willing to invest when a clear and transparent policy and
regulatory framework is offered. The outcome for the industry is mixed: while successful bidders are
ensured greater control over their coal supplies, the aggressive bidding of power companies in the
reverse bidding auctions raises doubts about the viability of their projects.
The blocks were auctioned at much higher prices than expected. Prices paid by successful bidders
are high compared to CIL’s notified prices, on par or higher than CIL e-auction prices, and in some
cases similar to imported coal prices (Hindalco’s bid for Gare-Palma IV-5 at INR 3,500/t, or $55/t, is
the highest bid in Schedule II mines). The value of the blocks depends on individual cases of quality
of coal from specific mines (coking or steam coal), the reserve left, the location of the mine relative to
end-use consumers, and whether companies tried to retain, own, or acquire blocks from others. The
winning bids also reflect the value of capital invested in end-use plants (especially for Schedule II
mines). Unreliable coal supply has forced large investments in several power, aluminium, and steel
plants to operate below capacity, besides putting their expansion plans on hold. A secure supply
enables end-use plants to operate to their full potential.
Bid prices are higher in the first auction as it relates to operating mines. In the second and third
auctions related to yet-to-be-developed mines, bid prices include discounting for development risks. In
the auctions for commercial mining, it can be expected that bids will be higher as there will be no
restriction on the final use of coal.
Bidding has been very aggressive in the power sector, with bids being negative (that is, an ‘additional
premium’ was being offered above the INR 100/t reserve price). While companies have bid ‘zero’ for
226 The analysis was done before the allotment of 3 mines in September 2015 which were allocated to the non-regulated sector
at prices around INR 1,200/t. 227 Economic Times, ‘Coal auction lessons: Investors are willing to bet capital when transparent policy is offered’, 22 February
2015, http://articles.economictimes.indiatimes.com/2015-02-22/news/59386540_1_coal-auction-schedule-ii-coal-mines-end-use
Total E-auction
proceeds
(estimated)
$ billion
Total Royalty
(estimated)
$ billion
Upfront Payment
(10% of intrinsic
value) (estimated)
$ million
Odisha 4.6 0.7 43.5
Madhya Pradesh 6.0 0.7 19.4
Maharashtra 0.4 0.1 1.8
Jharkhand 6.8 0.9 47.8
Chhattisgarh 9.5 1.2 41.0
West Bengal 1.8 0.3 22.8
Total 29.1 4.0 176.2
Total (in INR billion) 1,836 250 11.10

February 2016: Indian Steam Coal Imports
78
the cost of coal to determine their power tariff, they have also agreed to pay INR 302 to 1,100/t ($4.8
to 17.5/t) to state governments. This ‘additional premium’ will not be allowed to be a pass-through and
will have to be borne by the successful bidders.228 In the first two rounds of auctions, private power
producers won nine operating coal mines. The blocks are estimated to ensure fuel supplies to an
aggregate 6 GW of capacity. While winning the mines ensures companies are able to run their power
plants without disruption and at higher PLF, the ‘additional premiums’ are estimated to lead to
significant under-recovery in fuel cost for the successful bidders.229 According to rating agency ICRA,
some of the bidders could face under-recovery estimated to vary between INR 0.39/kWh and 1.2/kWh
on a levelized basis over 25-year period. The viability of these power plants is therefore not ensured.
The same situation was already observed in the past, when UMPPs developers bid very aggressively
but projects were stalled thereafter.
The real financial impact on power companies will be known only after they sign PPAs and, indeed,
depends on the production costs of each mine, the quality of coal, and its distance from consumers.
As such, efficient mining, cost control, and maximum recovery are key for success. However, there is
a risk that the price to be paid for the blocks, with the lack of supply agreement, leads to losses and
non-performing assets. Around 75 per cent of projects which won captive mines in the auction do not
have PPAs. If PPAs are not eventually signed, these projects risk becoming non-performing assets
for the banks involved.230
In the non-regulated sector, bid prices have been similar to, and sometimes higher than, the price of
CIL’s coal offered through e-auctions and in some cases close to the landed cost of imported coal.
This indicates that participants have focused on the prospects of ramping up output, higher utilization
of end-use plants, and lack of volatility in fuel costs rather than low prices. They have hedged
themselves against the risk of future rise in international prices with a secure steady supply at a fixed
price for 30 years.
4.5 Assessments of coal production to FY2020
4.5.1 Main assumptions
Major policy reforms, such as commercial mining and transparency in auctions of coal blocks,
regulatory changes, such as easing of capacity expansions of existing mines, as well as efforts to
remove environmental clearances and logistical issues, have the potential to transform the coal
mining sector and allow a new phase of growth of Indian production. However, reaching 1.5 Gt by
FY2020 seems quite challenging when taking into account the time required to develop and ramp-up
new mines even with the most optimistic assumptions on land acquisitions, upgrade of transportation
capacity, and rapid re-allocation of coal blocks.
This section presents two assessments of domestic production by FY2020 (the ‘new business-as-
usual’ assessment and the ‘roadmap’) which factor the recent development in production for CIL,
SCCL, and coal blocks (see sections 4.2. to 4.4 for the full set of changes taken into account in these
assessments). These are assessments, rather than scenarios, as they include a large part of personal
judgement on what is achievable in a five-year period. We now sum up our main assumptions from
each source of production.
228 The government has amended guidelines for long-term procurement of Discoms to make sure that power tariffs are reduced
in already concluded PPAs when coal is being procured from coal mines auctioned or allocated under Coal Mines (Special
Provision) Ordinance, 2014. For PPAs to be signed, a resolution of 16 April 2015 requires the stipulation of an upper ceiling for
the first year fixed/capacity charges. Lok Sabha, Ministry of Power, Answer to Question No 2908, Procurement cost of power, 6
August 2015. 229 Coaljunction, ‘Aggressive bidding for coal mines detrimental to returns: ICRA’, 31 Mar 2015 http://www.coaljunction.in/news/n_newsdetail/Aggressive-bidding-for-coal-mines-detrimental-to-returns-ICRA_1#sthash.ixjrQDHR.dpuf 230 India Energy Forum, ‘Post Coal Auction Worries for Power Sector’, Total Energy, Vol 9, Issue II, March–April 2015

February 2016: Indian Steam Coal Imports
79
4.5.2 CIL
The 1 Gt target set for CIL’s production requires a CAGR of 15.1 per cent in the next five years (even
15.4 per cent if calculated on despatches and not production), which seems unrealistic in view of
CIL’s performance in the past five years. However, the government and CIL have taken major steps
to make it achievable. Specifically, due to government intervention, the procedures for land
acquisition and grant of various clearances required for development and operation of coal mines
have been streamlined and expedited. CIL received 37 ECs and eight FCs from June 2014 to the
beginning of July 2015. It started five mines in FY2015 and plans to work on 15 new projects in
FY2016, while the CIL board has approved seven projects with a total capacity of 73 mtpa in FY2015.
The government’s commitment to ensure that both ongoing and new projects get requisite land and
green clearance in time is crucial since it takes about three years to ramp up production after the
possession of land. Work has begun on three critical railway lines, which were stalled for years, and
the first line is expected to be in service by June 2016. CIL has also started to rationalize its coal
linkages to optimize transportation and manages its transportation logistics to increase dispatches.
Last but not least, CIL plans to invest $25 billion in the next five years to meet the output target. The
company has a strong balance sheet, and the decision to redirect funds earmarked for international
operations to domestic operations will help.
The first encouraging results have already emerged. CIL increased its production by almost 7 per cent
in FY2015, or 32 Mt, the biggest incremental rise in four decades. During the first half of FY2016, its
production increased by 8.9 per cent to 230 Mt. Dispatches increased by 9.3 per cent to 251 Mt
thanks to increasing railcar availability and better management of logistics.
CIL’s roadmap to 1 Gt is a clear and comprehensive plan, analyzing output performance at mine level
and areas of improvement. The exercise involves the development of large OC mines with modern
mechanized equipment. This is a major shift from the past when the average size of new mines was
very small and development lacked modern mechanized equipment. To develop new large mines, the
company will partly resort to outsourcing and external expertise. Enhancing coal exploration and
improving efficiency and productivity also figure high in the company’s agenda. CIL has also
developed an HR plan to recruit the needed workforce.
It remains the case that matters related to land acquisition, R&R, green clearances, and rail links
need substantial and coordinated efforts by central/state authorities, and the risk of delays cannot be
underestimated. While a CAGR of 15.1 per cent over the next five years is required to reach 1 Gt by
FY2020, most experts estimate that 10 per cent would be the maximum achievable. This is the
assumption of the first assessment (new business-as-usual). In such a case, CIL’s production would
reach 788 Mt in FY2020. Although less than the 1 Gt target, this already constitutes a paradigm-
shifting increase of 300 Mt over the five years. In the second assessment, the roadmap, CIL’s
production increases as planned in its mine-wise plan to produce 908 Mt by FY2020 (this does not
include new projects that CIL intends to develop to reach the goal of 1 Gt).
4.5.3 SCCL
While the company produced only 9 per cent of domestic hard coal production (52.5 Mt) in FY2015, it
expects to enhance its production capacity to 80 mtpa by FY2020 and was recently asked to set
higher production targets by the Coal Secretary.231 Its production target for FY2016 has already been
raised to 56 Mt, a growth of 7 per cent compared with FY2015. In the first half of FY2016, SCCL
increased its dispatches by 14 per cent. In both production assessments, it is assumed that SCCL is
able to achieve an annual 7 per cent growth rate until FY2020, when its production reaches 74 Mt.
231Business Line, ‘Singareni Collieries set to set higher production target’, 16 July 2015,
http://www.thehindubusinessline.com/companies/centre-assures-support-to-singareni-projects-expansion/article7429962.ece

February 2016: Indian Steam Coal Imports
80
4.5.4 Coal blocks
In assessing future coal production, the main difficulty arises from the estimation of production from
coal blocks, the allocation process for which is ongoing. The estimates therefore include some
personal judgements/estimates by the author on how fast the government will allocate the remaining
blocks, how many will be successfully allocated, and how fast Schedule III mines will start and ramp
up production.
Overall, the 204 coal blocks have a potential capacity of 800–900 mtpa. When the re-allocation
process started, the government expected that blocks allocated for captive mining would produce
around 300 Mt by FY2020 and those allocated for commercial mining would add a further 200 Mt. The
timing of this projection now seems to be unachievable as auctions for commercial mining has not
started yet. However, the legislative framework is in place and the government has started
consultations with stakeholders to formulate a realistic commercial coal mining policy and give a
secure environment to the private sector.
As allocation of coal blocks for commercial mining has not started yet, their contribution to future
production has not been taken into account in our assessments as it is not possible to assess the
interest of domestic and foreign private companies to develop these mines, nor the expected
production. Obviously, they can only raise future production, but this will only take place two to three
years after their allocation as these mines are not developed, and some are only partly explored.
Production from captive blocks and other mines232 reached 65.7 Mt in FY2015 and is expected to
reach 94 Mt in FY2016, but obstacles continue to plague production from captive blocks. Only seven
of the 67 coal mines successfully auctioned/allotted by the end of March 2015 were in operation at the
beginning of July 2015. 233 In FY2015, production from operating blocks (Schedule II) was not
impacted by the Supreme Court judgement, as mining from these blocks was permitted until end of
March 2015. However, while the central government has urged states to re-allocate the cancelled
mines, the effective transfer of operatorship rights to the winning bidders has been delayed by
administrative procedures at state level.
This report’s assessments have factored in a decrease (new business as usual) or only a slight
increase (roadmap) in coal block production in FY2016, due to delayed transfer of operatorship rights
to allottees and the cancellation of the allocation of three large producing blocks (Gare Palma IV/ 1, 2,
and 3, with an estimated production of 12–13 Mt). The slowdown is followed by a ‘catch-up’ effect in
FY2017/FY2018. The expected lower performance of coal blocks will partly be compensated by CIL,
which benefits from its role of designated custodian of the operating mines (Schedule II) that have not
been allocated so far or whose bids were rejected by the government. But the impact of the possible
non-performance of captive blocks in FY2016 may be high, particularly for the non-regulated sector.
The actual production from coal blocks by FY2020 will mainly depend on how quickly the remaining
blocks are allocated, how many blocks (Schedule III) will solve land and green clearance issues
quickly enough to be able to ramp up production by FY2020, and how efficient the new operators of
the mines will be.
As of June 2015, 67 blocks have been allocated from the 110 blocks earmarked for captive mining. A
third round of auctions took place in August 2015 (three mines allocated) and a fourth one (eight to 10
mines) has been announced. But as mentioned previously, not all the 110 blocks will be allocated:
some blocks fall in inviolate forest areas and some mines have been withdrawn from auctions due to
ongoing litigation. While the peak rated capacity of the 110 blocks earmarked for captive mining is
232 ‘Other mines’ corresponds to production by other state companies, such as PANEM in Jharkhand. In FY2015, this
production totalled 12.5 Mt and has declined (16 Mt in FY2010). 233 Lok Sabha, Ministry of Coal, Answer to Question No. 584, 23 July 2015. At the beginning of August 2015, 12 out of the 28 (29 mines were allocated but one is subject to Court decision) auctioned blocks were awaiting green clearances and state-level approvals to begin mining (Business Line, Coal mine auctions: 12 out of 28 winners wait for clearances to start mining, 14 July 2015, http://www.thehindubusinessline.com/economy/coal-mine-auctions-12-out-of-28-winners-wait-for-clearances-to-start-miningcoal-mine-auctions-12-out-of-28-winners-wait-for-clearances-to-start-mining/article7422041.ece).

February 2016: Indian Steam Coal Imports
81
estimated at 350 mtpa, the assessments in this report have assumed that blocks with a peak rated
capacity of 300 mtpa will be allocated, of which 90 mtpa for Schedule II mines234 (operational or ready
to commence production) and 210 mtpa for Schedule III mines.235 Schedule III mines are expected to
be operational within one or two years and would take another two to three years to reach their peak
rated capacity.
Schedule II mines produce 60 Mt by FY2020 in the new business-as-usual assessment and 80 Mt in
the roadmap. The assumption is that Schedule III mines start production from FY2018 only and reach
40 per cent of their peak rated capacity in FY2020 in new business-as-usual. In the roadmap
assessment, they start production from FY2017 and reach 60 per cent of their peak rated capacity in
FY2020. With these assumptions, production from coal blocks allocated or not yet allocated for
captive mining reach 157 Mt in FY2020 in new business-as-usual and 219 Mt in roadmap.236 As
mentioned above, production from the mines to be allocated for commercial mining has not been
taken into account.
4.5.5 Coal production scenarios to FY2020
The main assumptions for the two assessments are summarized below:
The new business-as-usual assessment factors the higher growth rate of CIL’s production as registered recently. It is based on the following assumptions: a) CAGR of 10 per cent in CIL’s output (despatches) over the period; b) some delay in the start-up and ramping-up of coal blocks mines – production from Schedule II mines reach 60 Mt in FY2020, while Schedule III mines start production from FY2018 and reach 40 per cent of their peak rated capacity in FY2020; c) in SCCL’s production reaches 74 Mt in FY2020.
The roadmap assessment presents an optimistic view of future production, based on the assumption of: a) CIL’s mine-wise plan to 908 Mt by FY2020 being achieved; b) fast development of coal blocks, with production from Schedule II mines reaching 80 Mt in FY2020, while production of Schedule III mines starts from FY2017 and reaches 60 per cent of peak rated capacity in FY2020; and c) SCCL’s production reaches 74 Mt in FY2020 – same as in the first assessment.
With these assumptions, total steam and coking coal production reaches 1,018 Mt in FY2020 in new
business as usual and 1,201 Mt in roadmap – implying CAGRs of 10.9 per cent and 14.6 per cent
respectively from FY2015 to FY2020. These growth rates are impressive, but they are dependent on
a larger number of new blocks being put into production.
To estimate steam coal production from total coal production, metallurgical coal production (22.65 Mt
in FY2015) has been subtracted from total coal production. Steam coal production reaches 996 Mt in
FY2020 in new business-as-usual projections and 1,178 Mt in the roadmap – respective CAGRs of
11.2 per cent and 15 per cent. The annual data is detailed in Table 21.
234 36 Schedule II blocks have been auctioned/allotted in the first two rounds of auctions/allotment and two mines are auctioned
in the third round. One block was withdrawn from the auctions due to technical reasons (Namchik Namphuk, with peak rated
capacity of 0.1 mtpa) and one block (Ardhagram, with peak rated capacity of 0.4 mtpa), where a successful bidder was
declared, has been handed over to the Designated Custodian, in view of a court case. 235 30 Schedule III blocks were auctioned/allotted in the first two rounds of auctions/allotment (195 mtpa of rated capacity) and 3
blocks are auctioned in August 2015. 8 to 10 more blocks should be auctioned soon. 236 Including 13 Mt of production from other mines (flat level until FY2020).
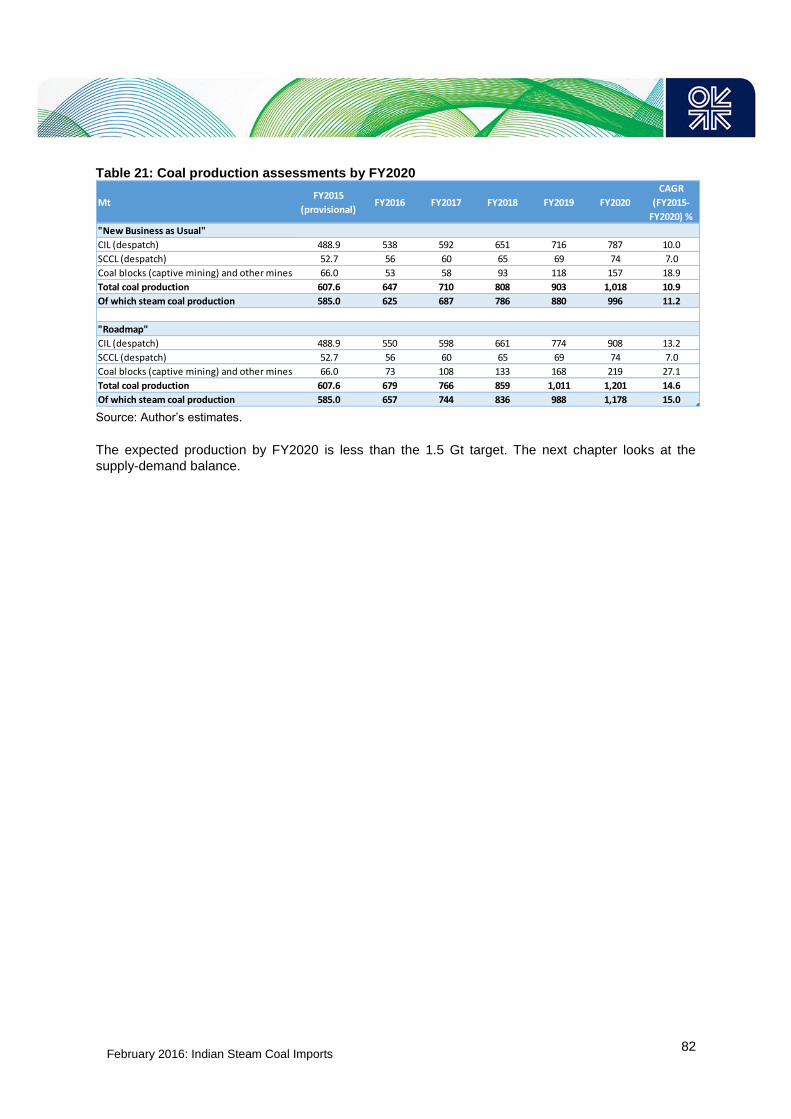
February 2016: Indian Steam Coal Imports
82
Table 21: Coal production assessments by FY2020
Source: Author’s estimates.
The expected production by FY2020 is less than the 1.5 Gt target. The next chapter looks at the
supply-demand balance.
MtFY2015
(provisional)FY2016 FY2017 FY2018 FY2019 FY2020
CAGR
(FY2015-
FY2020) %
"New Business as Usual"
CIL (despatch) 488.9 538 592 651 716 787 10.0
SCCL (despatch) 52.7 56 60 65 69 74 7.0
Coal blocks (captive mining) and other mines 66.0 53 58 93 118 157 18.9
Total coal production 607.6 647 710 808 903 1,018 10.9
Of which steam coal production 585.0 625 687 786 880 996 11.2
"Roadmap"
CIL (despatch) 488.9 550 598 661 774 908 13.2
SCCL (despatch) 52.7 56 60 65 69 74 7.0
Coal blocks (captive mining) and other mines 66.0 73 108 133 168 219 27.1
Total coal production 607.6 679 766 859 1,011 1,201 14.6
Of which steam coal production 585.0 657 744 836 988 1,178 15.0

February 2016: Indian Steam Coal Imports
83
5. Towards steam coal self-sufficiency
Over the past few months, the government has emphasized its intention to cease steam coal imports
in order to increase security of supply of the strategically important power sector and reduce the
burden on India’s trade deficit. Considering the low quality of coal in India and the level of steam coal
imports in FY2015 (168 Mt – a 30 per cent jump over FY2014), this requires an increase in
indigenous production of about 220–250 Mt,237 ceteris paribus. However, steam coal demand is likely
to increase significantly, making the objective even more demanding. Moreover, in addition to the
supply challenge to ramp up production and increase transportation capacity, there are some
technical, environmental, and economic barriers that may thwart the government’s plan to completely
end steam coal imports in the short term.
5.1 A slowdown in steam coal imports and self-sufficiency on the horizon
Table 22 shows the steam coal supply-demand balance by FY2020 based on the assessments of
domestic production and demand provided in Chapters 3 and 4.
Table 22: Scenarios for steam coal supply/demand balance by FY2020
Source: Author’s calculations.
In Scenario 1,238 steam coal imports are expected to continue increasing in FY2016 by 14 per cent to
192 Mt – a much lower growth than in previous years – before gradually declining to 41 Mt at the end
of the decade. The overall dependence on steam coal imports would fall to only 4 per cent in FY2020.
In Scenario 2,239 steam coal imports decline slightly in FY2016 (minus 5 per cent to 160 Mt) and
sharply from FY2017 to only 38 Mt in FY2019. Projected steam coal production exceeds demand in
FY2020, which means that India would be fully self-sufficient for steam coal and would only need to
import coking coal.
Both scenarios indicate that the government is likely to achieve its self-sufficiency goal, but they show
this is likely to be towards the end of the decade rather than in the announced time-frame.
Easing of the transportation constraints with the commissioning of new railways, including to supply
coal to coastal power plants, is a prerequisite to achieving these reduced levels of imports. Recently,
CIL has been able to increase its dispatches significantly (see Box 13), thanks to optimized
management of railcar availability and rationalization of coal linkages.
237 When imported coal of high calorific value is replaced by domestic coal with less calorific value. 238 In Scenario 1, CIL’s dispatches rise at a CAGR of 10 per cent from FY2016 to FY2020, SCCL production rises at a CAGR of
7 per cent, and coal blocks auctioned/allotted for captive mining are delayed and reach 40 per cent of their peak rated capacity
by FY2020. 239 In Scenario 2, CIL’s mine-wise plan to produce 908 Mt by FY2020 is attained, SCCL production rises at a CAGR of 7 per
cent, and output from coal blocks auctioned/allotted for captive mining reaches 60 per cent of their peak rated capacity by
FY2020.
MtFY2015
(provisional)FY2016 FY2017 FY2018 FY2019 FY2020
CAGR
(FY2015-
FY2020) %
Scenario 1
Steam coal demand (a) 753 816 857 938 993 1,036 6.6
Steam coal production 585 625 687 786 880 996 11.2
Supply/demand gap or excess (b) 168 192 170 152 113 41 -24.7
Steam coal import dependence (%) (b/a) 22% 23% 20% 16% 11% 4% -
Scenario 2
Steam coal demand (a) 753 816 867 948 1,026 1,093 7.7
Steam coal production 585 657 744 836 988 1,178 15.0
Supply/demand gap or excess (b) 168 160 123 112 38 -86 -
Steam coal import dependence (%) (b/a) 22% 20% 14% 12% 4% - -
February 2016: Indian Steam Coal Imports
84
The import projections, however, need to be strongly qualified by a set of constraints which need to
be specifically addressed in order for India to cease steam coal imports. They are discussed in the
next section.
Over the period, the impact on the CAD of steam coal imports will be limited by the decline in
international coal prices. India’s steam coal import bill was $9.5 billion in FY2014 and jumped to $11.6
billion in FY2015.240 If India is able to keep its steam coal imports at 160–190 Mt this year and next,
the import bill in dollars may be reduced despite the current rupee depreciation241 as international
steam coal prices are expected to remain subdued due to the sharp decline in Chinese coal imports.
Global steam coal prices have continued to decline since the beginning of 2015. The price of high-
grade South African coal was $57/t in July 2015, a 17 per cent drop compared with its average price
in FY2015. The price of Indonesian coal (4,900 kcal/kg) was $43/t in July 2015, an 18 per cent drop
compared with its average price in FY2015. Despite these already weak levels, some analysts
forecast even lower prices in the near term: Credit Suisse Commodities forecasts that global FOB
coal prices will not recover before 2018, and even then at a much lower level than in the past ($60–
65/t for high-grade coal).242
Box 13: FY2016 – a turning point for Indian steam coal imports
FY2016 may be a turning point for the coal sector in India, marked by a slowdown in the pace of
growth or even a slight decline of steam coal imports. The MoC projects coal demand will reach 910
Mt in 2016, a 10 per cent increase over FY2015.243 Despite the planned 15 per cent growth in
domestic production to 700 Mt (of which 550 Mt produced by CIL, 56 Mt by SCCL, and 94 Mt by the
coal blocks’ operators), the supply/demand gap covered by imports is expected to amount 210 Mt.
This level, which includes coking and steam coal imports, represents a slight decrease (-1 per cent)
compared with FY2015 (212.1 Mt).
Coal imports in the first quarter of FY2016 (April 2015 to June 2015) already gives an indication of the
capacity of CIL’s production to better keep pace with growing steam coal demand. During the quarter,
total coal imports (coking and steam coaI) totalled 56.3 Mt, an increase of 2.5 per cent compared with
the same period in FY2015.244 However, all the increase was due to increasing coking coal imports;
steam coal imports stagnated at 45 Mt. Imports by power utilities even decreased by 4 per cent to
21.5 Mt,245 which is a very encouraging outcome for the government but also means that steam coal
imports by the non-regulated sector increased during the quarter.
In March 2015, the CEA estimated steam coal imports by power utilities at 115 Mt in FY2016, a 26
per cent jump over FY2015.246 The import level included 73 Mt imported for blending purposes at 37
power plants (a 35 per cent increase from FY2015)247 and 42 Mt for power plants designed on
imported coal.
240 This does not include coking coal imports, which added $5.8 billion in FY2014 and $5.5 billion in FY2015. 241 Money Control, ‘Rupee may weaken more on China currency depreciation: Citi’, 13 August 2015
http://www.moneycontrol.com/news/rupee/rupee-may-weaken-morechina-currency-depreciation-
citi_2504561.html?utm_source=ref_article 242 Credit Suisse, India Utilities Sector, 14 May 2015, Credit Suisse Equity Research, https://doc.research-and-
analytics.csfb.com/docView?language=ENG&source=ulg&format=PDF&document_id=1048655381&serialid=iiSMLBOelBNI6a
B3r5Kd4X3PYZnVWl6pkOLi%2BWR7%2BFM%3D 243 Lok Sabha, Ministry of Coal, Answer to Question No. 514, ‘Shortage of Coal’, 23 July 2015, http://164.100.47.132/LssNew/psearch/QResult16.aspx?qref=19240
244 Reuters, ‘India coal imports flat in June as local supply jumps –trade’, 2 July 2015,
http://af.reuters.com/article/energyOilNews/idAFL3N0ZI40M2015072 245 Platts, ‘Indian utilities' Apr-Jun coal imports down 4% on year to 21.5 mil mt’, 17 July 2015, http://www.platts.com/latest-
news/coal/newdelhi/indian-utilities-apr-jun-coal-imports-down-4-26151475 246 Times of India, ‘India raises coal import by 35% to aid power plants’, 5 April 2015
http://timesofindia.indiatimes.com/city/chennai/India-raises-coal-import-by-35-to-aid-power-plants/articleshow/46809633.cms 247 MoP, ‘Import of coal target for the year 2015-16 –reg’, Office Memorandum, 30 March 2015,
http://www.cea.nic.in/reports/planning/coal_import_1516.pdf

February 2016: Indian Steam Coal Imports
85
However, imports by power utilities may be much lower. Already, during the period April-September
2015, they have declined by 6 per cent to 41.5 Mt compared with the same period in 2014.248 On the
demand side, the growth in electricity generation by coal power plants slowed down in the first half of
FY2016, with a rise of only 5 per cent over the same period of FY2015.249 This led to a very low PLF
(61 per cent on average in first half of FY2016 against 64 per cent in the same period last year),
which again shows that state Discoms are unable to increase their purchase despite the increased
power capacity. On the supply side, there are clear indications that Indian production is entering a
new phase of growth. CIL has raised its production by 8.9 per cent in the first half of FY2016 and its
despatches even grew by 9.3 per cent to 251.4 Mt. SCCL despatches during the same period grew by
14.4 per cent to 28.3 Mt. Coal stocks at power plants have also impacted the trend in coal imports.
For instance, NTPC, which has been allocated a quota of 22 Mt of imported coal for FY2016, reduced
its imports in the first quarter of FY2016 and indicated that it would not book any imported coal in the
second quarter in view of adequate supplies from CIL and full coal stockyards.250 At the end of
September 2015, coal stocks at power stations reached 26 Mt.251
The recommendation by the environment ministry’s expert appraisal committee (EAC) in October
2015 to ease the restriction on maximum ash content of imported coal (see Box 3) will further facilitate
the government policy to reduce steam coal imports for blending purposes of power utilities, as less
imported coal will be needed to produce the same amount of electricity.
On the contrary, imports by the non-regulated sector could still increase from the 77 Mt imported in
FY2015. The sector relies on FSAs, e-auctions sales from CIL, coal blocks output, and imports. Its
imports surged last year due to lower e-auction sales. The reduced volumes of e-auctions raised their
price by 12 per cent to an average of around $40/t in FY2015. Faced with uncertain availability of
domestic supplies, non-regulated consumers have booked more supplies from foreign suppliers. Now
that CIL’s production is growing fast, it has earmarked a higher volume of sales to the non-regulated
sector, estimated at 21–22 per cent of its planned production. A large part may be sold through e-
auctions as the cap on such sales has been removed by the government. However, these volumes
become available at a time when consumers have already booked imported cargoes. So despite
available domestic supplies, imports by the non-regulated sector may still increase. The significant
decline in international coal prices since the beginning of 2015 has also made imported coal cheaper
than CIL’s e-auction sales for some grades of coal, to which royalties and other taxes, and high
transportation costs, must be added. Low-rank Indonesian coal delivered at Indian ports was available
at $38/t at the beginning of July 2015. The price of CIL’s e-auction sales has started to drop to reflect
this tough competition: it declined to INR 2,184/t (around $35/t) in the first quarter of FY2016.252
Overall, the level of steam coal imports in FY2016 will depend on the ability of the new operators of
captive blocks to re-commission the mines and ramp up production quickly, but above all it will
depend on the price spread between imported coal and CIL’s e-auction sales. Under the best
assumptions, steam coal imports may be reduced only marginally in FY2016.
248 Platts, ‘India utilities’ thermal coal imports fall 6% on year in Apr-Sep’, 13 October 2015, http://www.platts.com/latest-
news/coal/newdelhi/indian-utilities-thermal-coal-imports-fall-6-27877928 249 CEA, Executive Summary Power Sector September-15,
http://www.cea.nic.in/reports/monthly/executivesummary/2015/exe_summary-09.pdf 250 Economic Times, ‘NTPC not to import coal in Q1, cites sufficient CIL supply’, 27 April 2015,
http://articles.economictimes.indiatimes.com/2015-04-27/news/61578134_1_coal-india-coal-stock-coal-supply 251 CEA, http://www.cea.nic.in/reports/daily/coal/2015/September/30.pdf 252 Economic Times, ‘Coal India to tweak e-auctions to check falling prices’, 18 August 2015,
http://articles.economictimes.indiatimes.com/2015-08-18/news/65530391_1_coal-production-state-run-coal-india-e-auctions
February 2016: Indian Steam Coal Imports
86
5.2 Main constraints to India’s independence from steam coal imports
While the key driver of rising steam coal imports can be attributed to the increasing gap between
demand and indigenous availability of steam coal, other factors are also at play:
Power plants designed to be operated on imported coal only – that is, on high-quality coal, especially low-ash coal.
Environmental considerations requiring blending imported coal of low ash content with indigenous coal of high ash content to comply with the amendments to the Environment Protection Rules 20/4 (Environment (Protection) Amendment Rules, 2014) and inadequate availability of such coal from indigenous sources.
Commercial optimization of fuel supply at power plants in coastal locations in view of constraints on transport logistics and declining import prices.
These factors need to be addressed specifically to cease steam coal imports.
5.2.1 Power plants designed on imported coal
Due to coal shortages in the past, a number of power plants were designed and built to operate on
imported coal only, which has a higher calorific value and lower ash content than domestic coals.
Major public and private companies (NTPC, Adani Power, Essar Power, and Tata Power) have built,
or are building, power plants at coastal locations with boilers designed for imported coal and have
either signed long-term contracts with overseas suppliers or acquired foreign assets (mainly in
Indonesia, South Africa, and Australia) to feed these plants. Most of these plants are supercritical
power plants located in the western states of Maharashtra and Gujarat, which are far away from the
northeastern mines.
As the boilers of these plants were designed for low-ash coal, burning high-ash domestic coal would
require the facilities to be revamped, which does not make economic or environmental sense. These
plants, which import around 40 Mt/year, are therefore expected to continue importing coal. This is
reinforced by the existence of long-term contracts/foreign assets and the lack of railway
capacity/congestion of railway lines from mines to ports.
In addition, plant expansions or new plants designed on imported coal may increase import demand.
In January 2015, despite its plans to rely on its own production and CIL’s increased output, NTPC
issued a tender for the long-term (15 years plus options) procurement of imported coal for its
proposed 4-GW Pudimadaka project.253 NTPC was seeking the supply of coal of 5,000 kcal GAR
minimum with maximum ash content of 12 per cent, a quality that is not easily found on the domestic
market. The Pudimadaka project is a proposed UMPP project located in Nakapalli, Andhra Pradesh,
near the Bay of Bengal and, as currently designed, may import 14 Mt/year. The project received
clearance from the MoEF to start environmental studies in March 2015 and is expected to be
completed during the 13th FYP.254, 255
253 McCloskey Coal Report (MCR), ‘India’s NTPC issues long-term tender’, 9 January 2015, MCR Issue N° 351 254 The Hindu, ‘NTPC Pudimadaka project cleared by MoEF’, 25 March 2015,
http://www.thehindu.com/news/cities/Hyderabad/tor-for-ntpc-pudimadaka-project-cleared-by-moef/article7032086.ece 255 The Hindu, ‘NTPC to finalise bids for Pudimadaka plant’, 8 July 2015,
http://www.thehindu.com/news/cities/Visakhapatnam/ntpc-to-finalise-price-bids-for-pudimadaka-plant/article7397023.ece

February 2016: Indian Steam Coal Imports
87
Figure 25: Imports by power plants designed on imported coal in FY2015
Source: CEA.
Adani, the biggest coal importer and trader in India, does not expect a reduction in Indian coal imports
during this decade.256 In a financial presentation in June 2015,257 the company estimated that Indian
steam coal imports could in fact double by FY2020 with an additional need of 200 Mt compared with
current imports. Adani projects that demand from the power sector will increase faster than domestic
supplies, and the profile of that demand is going to be changed by the coming generation of power
plants. It should be noted, however, that while supercritical power plants have a higher efficiency and
a better environmental performance when burning high-quality coal, as Adani rightly argues,
supercritical power plants can also burn low-quality coal, provided their boilers have been designed
for such coal and several supercritical plants, now under construction in India, are based on domestic
coal.
Adani has built its strategy on coal imports and trading. The company has invested in overseas mines
and built receiving coal terminals in India. It is the owner of the two largest ‘non-major’ (private) ports:
Mundra, the largest port in India, handles over 100 Mt of cargo per year and hosts one of the world's
biggest coal import terminals, boasting a 60 mtpa capacity. On the east coast, Adani bought the newly
built Dhamra port in Odisha in May 2014 and announced a second phase of development to take
cargo handling capacity to 100 mtpa by 2020. The group is also the largest private power producer in
India, operating over 11 GW of capacity, including 4.6 GW near Mundra port. It has a target of 20 GW
by 2020. The company is involved in the development of one of the largest mines in the world, the
Carmichael mine in Central Queensland to export the coal to India (see Box 3), and believes that the
quality of Australian coal better fits the new needs of supercritical plants that will become the norm in
India from FY2017.
While plants designed and built on imported coal are likely to continue importing coal in the short
term, these plants may turn to domestic coal in the medium/long term if washed coal or higher-quality
coal (higher calorific value and low ash content) is produced in sufficient quantities in India and
transportation bottlenecks from mines to coastal areas are removed. Blending domestic coal at plants
designed to use imported coal is a possibility, though it depends on the design of the boilers. Since
Indonesia increased its prices in 2011, Tata Power has been blending low-grade domestic coal with
imported coal to bring down the fuel cost at Mundra UMPP, where the boilers have been designed to
256 ABC, ‘Adani CEO says India will remain an importer of coal’, 25 May 2015, http://www.abc.net.au/news/2015-05-25/adani-ceo-speaks-to-faithful-in-mackay/6494536; AFR, ‘India to fuel Adani's coal expansion’, 16 June 2015, http://www.afr.com/business/mining/coal/india-to-fuel-adanis-coal-expansion-20150616-ghpg3x#ixzz3jupRRhxV (subscription only) 257 Adani, ‘Adani group: new form and new substance’, 20 June 2015,
http://www.adani.com/Common/Uploads/InvestorRelationTemplate/19_InvBotDL_Adani%20Group%20Presentation%20Jun%2
015.pdf

February 2016: Indian Steam Coal Imports
88
burn sub-bituminous coal from MCL and imported coal from Indonesia. Moreover, in the 1970s, when
Indian production mostly came from UG mines, the quality of coal was much better than it is today,
with an average GCV of 5,900 kcal/kg. Increasing UG production may allow India to mine better
quality coal. The transportation bottleneck from mines to coastal areas may be dealt with by using
coast-to-coast shipment. In a scenario with less coal imports, coal terminals could be used to move
coal across the country and thus reduce the pressure on the railway system.
5.2.2 Environmental and quality constraints
For plants built with blending possibilities, imports of higher-quality coal (low ash content and high
calorific value) allow more efficient operation of the plants, leading to lower coal consumption and
lower emissions of local pollutants and CO2. From June 2016, power plants located at more than 500
km from mines will have to use coal containing not more than 34 per cent of ash, compared with a
current distance of 750 km. To implement the directive, CIL is raising its washing capacity for steam
coal to 88 Mt and will use capacities at private washeries (see Section 3.2.1). According to a 2013
study of the National Transport Development Policy Committee, 258 published in 2013, when the
distance is reduced to 500 km, about 90 GW of capacity would require about 360 mtpa of washed
coal. New washeries (CIL and private) may be sufficient, but they are unlikely to be completed by
June 2016. The time required to establish the new washeries may lead to a temporary increase in
coal blending and imports to comply with the regulation after June 2016.
Rationalization of coal linkages could help in resolving the issue by decreasing the distance travelled
by coal. As stated earlier, a study carried out by consultancy firm KPMG for the Inter-Ministerial Task
Force on rationalization of coal linkages concluded that rationalization of coal linkages would reduce
the average distance travelled by coal to 416 km/t from 597 km/t.259 It also showed that import needs
for the TPPs considered in the study were lower post-rationalization than pre-rationalization (79.8 Mt
compared with 103.5 Mt260). However, as mentioned previously, the rationalization of coal linkages is
a complex exercise that involves the agreement of all stakeholders (mines, power utilities, railways) to
implement the swaps. Therefore, there is a risk that the limit imposed on the transportation of coal
with ash above 34 per cent could lead to a temporary increase in steam coal imports. The strategy of
coal producers may reinforce this trend. For instance, in March 2015, SCCL announced its intention
to import coal of high calorific value to blend it with its own coal production in order to provide its
customers better quality products.261
5.2.3 Competition between imported and domestic coal
Thus far, import needs are calculated as a residual: that is, projected demand minus the projected
supply of a given year. This calculation assumes that domestic prices are lower than international
ones and that consumers do not arbitrage between domestic production and imports, as is common in
large producing and consuming countries, like China and the USA, which are both producers and
importers of coal based on commercial and transportation considerations. Up to now, domestic coal
prices at the pithead have been much cheaper than imported coal of a corresponding variety for most
coals, favouring domestic coal against imports, except for high grades. But the evolution of domestic
and international prices over the past few months makes a huge difference. In some circumstances,
domestic prices for power utilities, including inland transportation costs, are higher than current import
prices of coal delivered at coastal ports. With the decline in Indonesian prices from $61/t in January
2014 to $43/t in July 2015, the competitiveness of domestic washed coal transported to western coast
258 National Transport Development Policy Committee (NTDPC), Transportation of energy commodities, 2013,
http://tripp.iitd.ernet.in/publications/NTDPC/Vol%2002-2/NTDPC%20Vol%2002_Part%202%20Ch%2008.pdf
259 MoC, Report of the new Inter-Ministerial Task Force (IMTF) on Rationalization of sources of Coal to Power plants, 2
February 2015, http://coal.nic.in/sites/upload_files/coal/files/webform/notices/030215a.pdf 260 Import needs for 114 TTPs were calculated based on a targeted PLF of 83 per cent on average. 261 Express News Service, ‘Singareni to Blend Its Coal with Exotic Coal’, 13 March 2015, http://www.newindianexpress.com/states/andhra_pradesh/Singareni-to-Blend-Its-Coal-with-Exotic-Coal/2015/03/13/article2711155.ece
February 2016: Indian Steam Coal Imports
89
ports is no longer ensured. This makes the import of better quality coal more viable for those western
power plants, such as those in Gujarat and Maharashtra, located at considerable distances from the
main northeastern mines. For non-regulated users, imported coal can be much cheaper than
domestic supplies from e-auctions, which sell at a premium of 40–60 per cent to CIL’s average price
(see Table 6).
The notified prices of CIL’s sales have been kept low to enable low power tariffs. However, Indian
coal prices are expected to increase to reflect higher production costs (UG mines, deeper and wider
seams requiring to remove more overburden, salaries increase, and rising costs related to land
acquisition and R&R). Besides the cost of mining, higher taxes can also be expected. There are
ongoing studies to review the royalty rate, currently at 14 per cent ad valorem. Furthermore, the cess
on coal is expected to increase in the future to better reflect the environmental cost of coal production.
However, because it is applied to both coal production and imports, any future rise will be neutral in
the competitiveness between indigenous and imported coal.
Simultaneously, international coal prices are not expected to fully recover from their low levels due to
the current global oversupply, the shift away from coal in a number of importing countries, and the
slowdown in China. The assumption that Indian coal prices will remain much lower than international
prices cannot be taken for granted, especially when coal is transported from far away mines and sold
to the non-regulated sector through e-auctions that include premium of 40 to 60 per cent above
regulated prices. In such a situation, arbitrage between CIL’s e-auction sales and imported coal may
favour coal imports.
February 2016: Indian Steam Coal Imports
90
6. Conclusion
India’s steam coal imports have more than doubled over the past four years, reaching 168 Mt in
FY2015 and making India the world’s second-largest steam coal importer after China. With Chinese
demand for seaborne coal falling,262 India has become the great hope of the seaborne coal market.
However, in November 2014, the government announced its intention to cease steam coal imports in
the next two to three years. This report has tried to assess whether India could become the next
engine of growth in world steam coal trade or, on the contrary, cease its steam coal imports by the
end of FY2017 in line with its government’s policy ambitions. The report analyzed the main drivers of
steam coal imports: increasing demand by power utilities and non-regulated sectors and the new
trend in domestic coal production in the light of the reform of the coal mining sector.
Following a review of the challenges encountered on both sides of the supply-demand equation in
India, it is difficult to arrive at a firm number for the future level of Indian steam coal imports, but the
general direction is clear. Steam coal imports are likely to level off in FY2016 or FY2017 before
declining sharply as CIL’s production ramps up, more mines are opened up, and production from
auctioned/allocated coal blocks takes off. Indeed, FY2016 could be the turning point for Indian steam
coal imports, which this report shows are likely to increase at a much lower rate than in previous
years, or even decrease slightly.
These results are based on an analysis of coal demand and production in India in the context of the
new coal policy and coal sector reforms initiated in early 2015 and the government’s strong emphasis
on, and pragmatic approach towards, making the country self-sufficient in coal. Reforms in the coal
mining sector, adopted in March 2015, constitute a major policy breakthrough and, as shown in this
report, will allow India to raise its coal production to record high levels. Even in the event that the 1.5
Gt target for FY2020 is not met, this paper has shown that strong growth in coal production will be
adequate to make India almost self-sufficient in steam coal production, albeit by the end of the
decade rather than in the time-frame announced by the government.
The scenarios used to consider future steam coal demand to FY2020 show that demand will remain
robust, with power and industrial demand expected to grow significantly, in line with economic growth,
urbanization and demographic trends, and the government’s commitment to provide energy access to
all citizens by 2019. Specifically, growth in coal demand from the power sector is assured by a
massive increase in coal installed capacity as seen during the last five years, when coal capacity
increased from 84 GW to 165 GW, as well as additional capacity currently under construction and
expected to be commissioned in two or three years.
However, the rate of increase in coal demand will be offset to an extent by several factors. First, it will
slow down due to energy efficiency measures in the power and industrial sectors, and also in the coal
sector itself, where clean coal technologies offer huge opportunities for efficiency improvements and
reduction of coal demand per unit of electricity generated. Additionally, the growth of renewable power
will slow down the reliance of the power sector on coal. The financial weaknesses of state Discoms
will also limit the growth of coal demand and can only be addressed gradually with tariff increases and
the full cooperation of state governments, which oversee electricity policy at the state level. This key
constraint was clearly visible in FY2015, when PLFs declined to 65 per cent, and even more in recent
months (PLFs of 61 per cent in the first half of FY2016) despite recurrent blackouts and load-
shedding in the country. The steam coal demand scenarios used are based on an analysis of coal-
based capacity build-up, as announced by power producers, and assumptions on plant utilization.
They take into account an improvement in the average efficiency of the coal power fleet due to the
commissioning of supercritical plants and improvements in coal quality. Steam coal demand by power
utilities and the non-regulated sector amounts to 1,035 Mt by FY2020 in the ‘low plant load factors’
262 China’s coal imports have collapsed – Over January-August 2015, the country imported a total 138.59 Mt of coal, down 31.3
per cent year on year. Reuters, ‘China August coal imports drop nearly 18 pct on month’, 8 September 2015,
http://www.reuters.com/article/2015/09/08/china-economy-trade-coal-idUSL4N11E1P920150908
February 2016: Indian Steam Coal Imports
91
(around 65 per cent, but dropping marginally in FY2016 and FY2017) scenario, while it reaches 1,090
Mt by FY2020 in the ‘improved plant load factors’ scenario (PLF gradually recovering to 70 per cent)
compared with 754 Mt in FY2015. This corresponds to respective CAGRs of 6.6–7.7 per cent over the
period.
On the supply side of the equation, a paradigm shift is currently under way. It cannot be better
illustrated than by the reforms of the coal mining sector that took place in the first quarter of 2015. The
Coal Bill adopted by the parliament in March 2015, with the parallel adoption of the Mining Law, has
opened the sector up to domestic and foreign companies for commercial mining, ending 40 years of
state monopoly on coal sales. It has also introduced the possibility of allocating coal blocks for captive
mining in a transparent and effective manner, with the use of auctions to allocate mines to the private
sector. The government’s swift re-allocation of coal blocks is likely to ensure further growth in
production. While barriers still exist to increasing coal production as planned – for instance, the lack of
a consensus on land acquisition, implying further hurdles for the development of new mines – the
pragmatic approach adopted by the government, such as direct negotiations with coal-bearing states,
relaxation of environmental norms for expansion of existing mines which have already passed
environmental assessment, fast-tracking, and real-time monitoring of mine and transportation
projects, has already begin to yield some positive results. CIL’s dispatches increased by a healthy
9.3 per cent in the first half of FY2016, a record incremental increase in the last 40 years, and SCCL’s
despatches increased by 14 per cent during the same period. However, there are still barriers to be
overcome – especially at the state level, where administrative procedures have delayed the re-
commissioning of newly allocated coal blocks.
In the assessments of future coal production used in this paper, the most difficult aspect has been to
assess future production from coal blocks, as their allocation for captive mining is ongoing at the time
of writing and the economic framework for commercial mining is as yet unannounced. The
assessments therefore included some personal judgment and did not take into account potential
production from coal blocks to be auctioned for commercial mining. Overall, in the new business-as-
usual assessment, which assumes that the renewal with growth of CIL’s production will continue and
takes into account delays in the ramp-up of newly allocated coal blocks for captive mining, steam coal
production reaches 996 Mt by FY2020. In the more optimistic roadmap assessment, which considers
that CIL will achieve its mine-wise plan to reach 908 Mt by FY2020, and also assumes a more rapid
ramp-up of coal blocks production, steam coal production reaches 1,178 Mt by FY2020.
The supply-demand balance is therefore clear: under these assumptions, Indian coal imports would
plateau in the short term before falling sharply by the end of the decade. While Indian steam coal
imports have increased at a steep rate over the past three years, FY2016 could be a turning point for
the coal sector in India, marked by a slowdown in the pace of growth, or even a slight decline, of
steam coal imports. The recent recommendation by the environment ministry’s Expert Appraisal
Committee (EAC) in October 2015 to ease the restriction on maximum ash content of imported coal
will further facilitate the government’s attempts to reduce steam coal imports. It will allow the import of
higher (calorific) grades of coal, implying that less imported coal will be needed in power plants
blending imported coal with domestic supplies in order to produce the same amount of electricity.
The report presented two broad scenarios for steam coal imports to 2020. In our first scenario, steam
coal imports are expected to continue increasing in FY2016 by 14 per cent to 192 Mt before gradually
declining to 41 Mt at the end of the decade. The overall dependence on steam coal imports would fall
to only 4 per cent in FY2020. In our second scenario, steam coal imports decline slightly in FY2016
(minus 5 per cent to 160 Mt) and sharply from FY2017 to only 38 Mt in FY2019. Projected steam coal
production exceeds demand in FY2020, which means that India would be fully self-sufficient in steam
coal supply and would only need to import coking coal.
Both scenarios indicate that the government is likely to achieve its self-sufficiency goal, although this
is likely to be towards the end of the decade rather than within the announced time-frame.
February 2016: Indian Steam Coal Imports
92
One prerequisite to these outcomes is the simultaneous development of transportation infrastructure,
in particular three key rail lines from major mines to customers, but also rail lines from the mines to
the ports, as a large number of coal-fired power plants are located in coastal areas.
The import projections, however, need to be strongly qualified by a set of constraints:
Some power plants were designed and built to be operated on imported coal only – high-quality coal, especially low-ash coal. In the short term, in the absence of the required quality in India, these plants will continue burning imported coal. This is reinforced by the existence of long-term contracts with foreign suppliers or participation of Indian companies in mining activities overseas. This means that a certain level of steam coal imports (40 Mt in FY2015) will still be needed in the short/medium term. In the longer term, it could be eliminated with the procurement of better quality domestic coal, either washed coal, or coal produced in underground mines, which in the past was of better quality than the current coal production, which comes mainly coming from opencast mines.
New environmental regulations, limiting the use and transportation of coal with high ash content, adopted in 2012 and reinforced in 2014, and the inadequate availability of such coal from indigenous sources requires blending of imported coal of low ash content. This issue can be overcome with the washing of coal. Coal miners have responded to the new regulation by building new washeries. However, in the short term, the capacity of existing washeries is limited and coal with low ash content will continue to be imported to comply with environmental regulations.
The commercial optimization of fuel supply at power and industrial plants in coastal locations favours imported coal, in view of the constraints on transport logistics and declining import prices. This commercial strategy may limit the fall in coal imports as historically low coal import prices mean that Indian steam coal buyers (mainly from the non-regulated sector) arbitrage between domestic coal and coal imports. The global steam coal market remains oversupplied. Despite cuts in production, the rebalancing of the market does not appear likely in the short term as import demand in major countries, in China especially, is falling in line with lower economic growth and stringent environmental measures. The competition between domestic coal and imported coal (for certain grades of coal and some customers) is a new phenomenon, as so far Indian coal prices have been much lower than imported prices.
These constraints will need to be considered and addressed by the government in the implementation
of policies targeted at ending steam coal imports.
India is also reforming its domestic coal market to introduce more competition and transparency.
Under the proposed reforms (which are still under review), Fuel Supply Agreements for the non-
regulated sector will be auctioned, instead of being allocated upon the recommendation of the Inter-
Ministerial Standing Linkage Committee. Prior to finalizing this policy, the government will need to
carefully assess the evolution of the global steam coal market. The proposed auctioning of FSAs in
the non-regulated sector will allow Indian coal prices to be set by the market. They should, therefore,
align with international coal prices, a move facilitated by the envisaged creation of a common platform
for domestic and imported supplies. This move may allow higher prices and margins for Indian
producers, as international prices have so far been higher than domestic prices for most grades of
coal, except high grades. However, in the oversupplied global market, imported coal is less expensive
than domestic coal in some cases. In addition, the reform may lead to aggressive bidding from
distressed foreign suppliers seeking outlets for their coal cargoes. This situation was observed in
China in 2014 and led to a price war between domestic and foreign suppliers (falling prices and
margins) before the Chinese government intervened to try to stabilize its market.
In the regulated sector, the reform is aimed at eventually replacing all existing and new coal supply
contracts through a power tariff-based e-auction model under which the lowest-cost power producer
would obtain coal supplies from CIL and SCCL. Auctions of FSAs by states/Discoms through tariff-
based bidding and more competition at the distribution level would allow the government to keep
power tariffs as low as possible and in turn provide coal supplies to the sector as cheaply as possible.
Coal prices will nevertheless need to ensure the financial health of coal producers. Although this can

February 2016: Indian Steam Coal Imports
93
be most easily done through reductions in the cost of production, this strategy is unlikely to yield
results, as CIL has one of the lowest costs of production in the world. Therefore, CIL will need to
increase its revenues from the non-regulated sector, which will require additional sales to the sector at
attractive prices compared with foreign supplies. In the oversupplied global market, this narrows the
room for manoeuvre.
Finally, although there is likely to be greater interaction between the Indian and global steam coal
market, international coal exporters have to factor in a major setback going forward: India will not be
the promised growth market for steam coal that it was expected to be at the beginning of this decade,
when Indian steam coal imports were forecasted to jump to 400 Mt by 2030.263 Additional output cuts
in coal-exporting countries can be expected, as can a persistent low level of international prices which
will be increasingly dependent on India’s coal (and energy) policy and CIL’s monthly coal
production.264
263 See for instance Wood Mackenzie, ‘Wood Mackenzie Says Global Thermal Trade Flow Changes Will Ensure Security of
Thermal Coal Supply, Albeit At a High Price’, 14 March 2012, http://www.woodmacresearch.com/cgi-
bin/wmprod/portal/corp/corpPressDetail.jsp?oid=10441615 264 CIL’s monthly coal production is available at https://www.coalindia.in/en-us/performance/physical.aspx
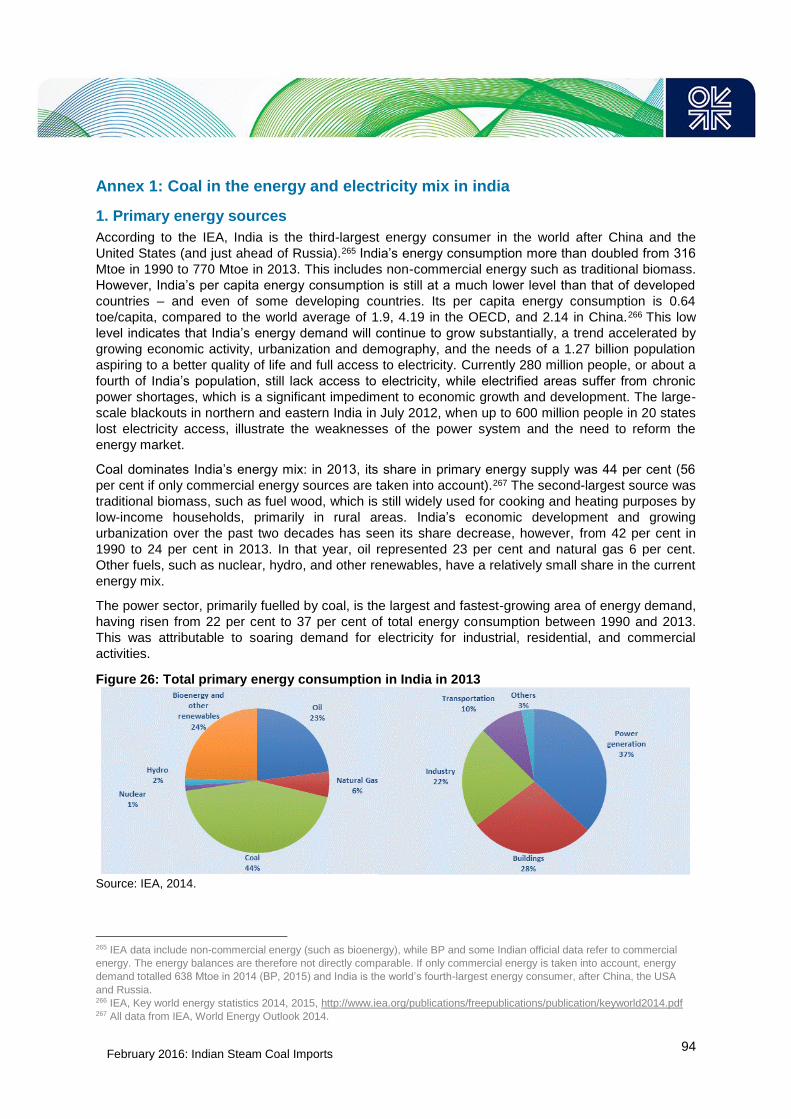
February 2016: Indian Steam Coal Imports
94
Annex 1: Coal in the energy and electricity mix in india
1. Primary energy sources
According to the IEA, India is the third-largest energy consumer in the world after China and the
United States (and just ahead of Russia).265 India’s energy consumption more than doubled from 316
Mtoe in 1990 to 770 Mtoe in 2013. This includes non-commercial energy such as traditional biomass.
However, India’s per capita energy consumption is still at a much lower level than that of developed
countries – and even of some developing countries. Its per capita energy consumption is 0.64
toe/capita, compared to the world average of 1.9, 4.19 in the OECD, and 2.14 in China.266 This low
level indicates that India’s energy demand will continue to grow substantially, a trend accelerated by
growing economic activity, urbanization and demography, and the needs of a 1.27 billion population
aspiring to a better quality of life and full access to electricity. Currently 280 million people, or about a
fourth of India’s population, still lack access to electricity, while electrified areas suffer from chronic
power shortages, which is a significant impediment to economic growth and development. The large-
scale blackouts in northern and eastern India in July 2012, when up to 600 million people in 20 states
lost electricity access, illustrate the weaknesses of the power system and the need to reform the
energy market.
Coal dominates India’s energy mix: in 2013, its share in primary energy supply was 44 per cent (56
per cent if only commercial energy sources are taken into account).267 The second-largest source was
traditional biomass, such as fuel wood, which is still widely used for cooking and heating purposes by
low-income households, primarily in rural areas. India’s economic development and growing
urbanization over the past two decades has seen its share decrease, however, from 42 per cent in
1990 to 24 per cent in 2013. In that year, oil represented 23 per cent and natural gas 6 per cent.
Other fuels, such as nuclear, hydro, and other renewables, have a relatively small share in the current
energy mix.
The power sector, primarily fuelled by coal, is the largest and fastest-growing area of energy demand,
having risen from 22 per cent to 37 per cent of total energy consumption between 1990 and 2013.
This was attributable to soaring demand for electricity for industrial, residential, and commercial
activities.
Figure 26: Total primary energy consumption in India in 2013
Source: IEA, 2014.
265 IEA data include non-commercial energy (such as bioenergy), while BP and some Indian official data refer to commercial
energy. The energy balances are therefore not directly comparable. If only commercial energy is taken into account, energy
demand totalled 638 Mtoe in 2014 (BP, 2015) and India is the world’s fourth-largest energy consumer, after China, the USA
and Russia. 266 IEA, Key world energy statistics 2014, 2015, http://www.iea.org/publications/freepublications/publication/keyworld2014.pdf 267 All data from IEA, World Energy Outlook 2014.
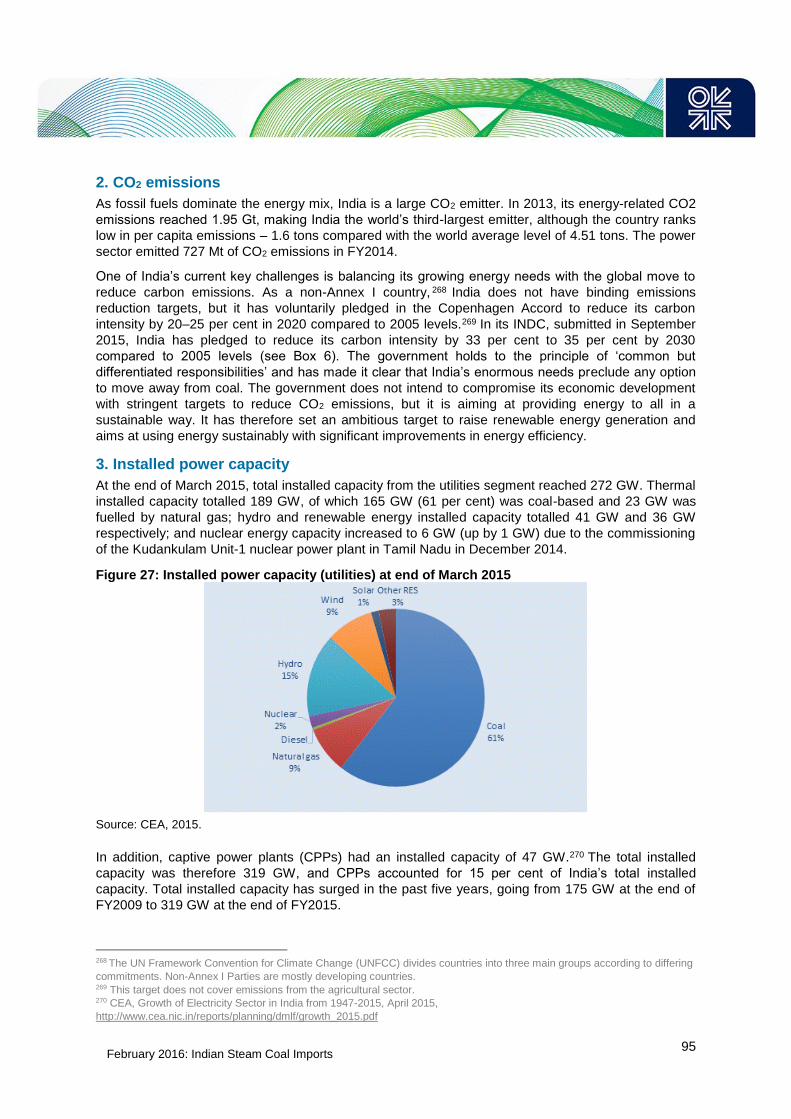
February 2016: Indian Steam Coal Imports
95
2. CO2 emissions
As fossil fuels dominate the energy mix, India is a large CO2 emitter. In 2013, its energy-related CO2
emissions reached 1.95 Gt, making India the world’s third-largest emitter, although the country ranks
low in per capita emissions – 1.6 tons compared with the world average level of 4.51 tons. The power
sector emitted 727 Mt of CO2 emissions in FY2014.
One of India’s current key challenges is balancing its growing energy needs with the global move to
reduce carbon emissions. As a non-Annex I country, 268 India does not have binding emissions
reduction targets, but it has voluntarily pledged in the Copenhagen Accord to reduce its carbon
intensity by 20–25 per cent in 2020 compared to 2005 levels.269 In its INDC, submitted in September
2015, India has pledged to reduce its carbon intensity by 33 per cent to 35 per cent by 2030
compared to 2005 levels (see Box 6). The government holds to the principle of ‘common but
differentiated responsibilities’ and has made it clear that India’s enormous needs preclude any option
to move away from coal. The government does not intend to compromise its economic development
with stringent targets to reduce CO2 emissions, but it is aiming at providing energy to all in a
sustainable way. It has therefore set an ambitious target to raise renewable energy generation and
aims at using energy sustainably with significant improvements in energy efficiency.
3. Installed power capacity
At the end of March 2015, total installed capacity from the utilities segment reached 272 GW. Thermal
installed capacity totalled 189 GW, of which 165 GW (61 per cent) was coal-based and 23 GW was
fuelled by natural gas; hydro and renewable energy installed capacity totalled 41 GW and 36 GW
respectively; and nuclear energy capacity increased to 6 GW (up by 1 GW) due to the commissioning
of the Kudankulam Unit-1 nuclear power plant in Tamil Nadu in December 2014.
Figure 27: Installed power capacity (utilities) at end of March 2015
Source: CEA, 2015.
In addition, captive power plants (CPPs) had an installed capacity of 47 GW.270 The total installed
capacity was therefore 319 GW, and CPPs accounted for 15 per cent of India’s total installed
capacity. Total installed capacity has surged in the past five years, going from 175 GW at the end of
FY2009 to 319 GW at the end of FY2015.
268 The UN Framework Convention for Climate Change (UNFCC) divides countries into three main groups according to differing
commitments. Non-Annex I Parties are mostly developing countries. 269 This target does not cover emissions from the agricultural sector. 270 CEA, Growth of Electricity Sector in India from 1947-2015, April 2015,
http://www.cea.nic.in/reports/planning/dmlf/growth_2015.pdf
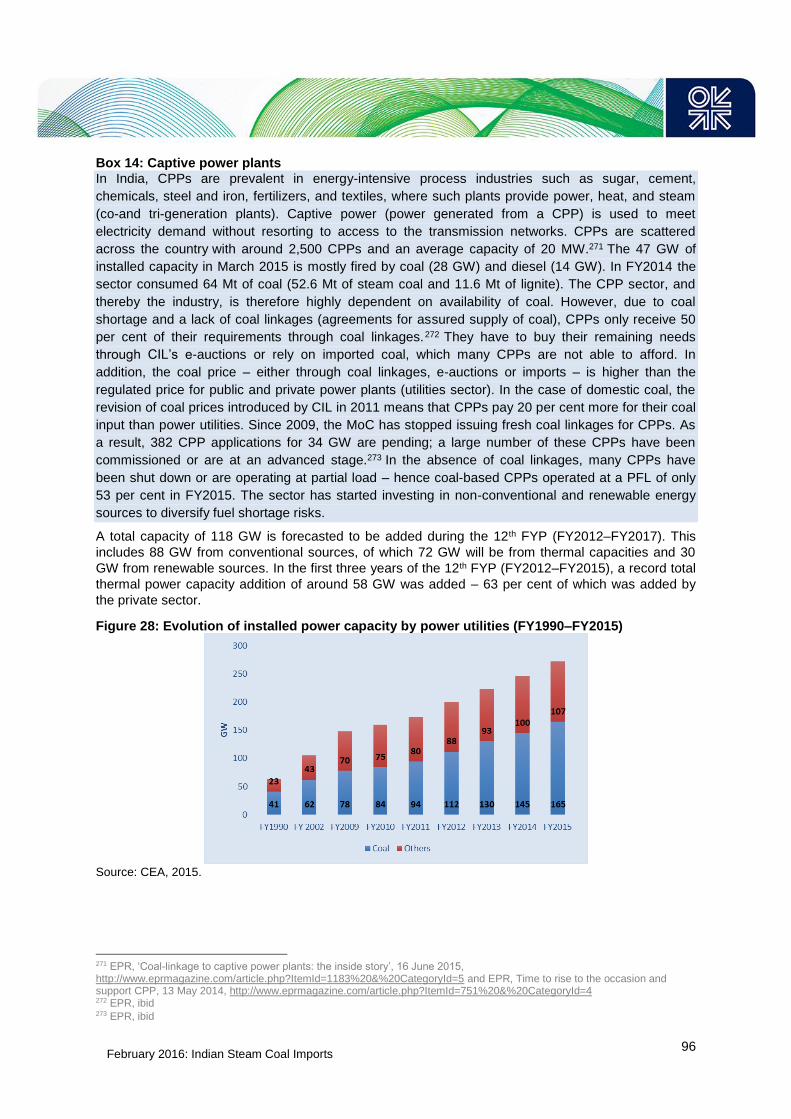
February 2016: Indian Steam Coal Imports
96
Box 14: Captive power plants
In India, CPPs are prevalent in energy-intensive process industries such as sugar, cement,
chemicals, steel and iron, fertilizers, and textiles, where such plants provide power, heat, and steam
(co-and tri-generation plants). Captive power (power generated from a CPP) is used to meet
electricity demand without resorting to access to the transmission networks. CPPs are scattered
across the country with around 2,500 CPPs and an average capacity of 20 MW.271 The 47 GW of
installed capacity in March 2015 is mostly fired by coal (28 GW) and diesel (14 GW). In FY2014 the
sector consumed 64 Mt of coal (52.6 Mt of steam coal and 11.6 Mt of lignite). The CPP sector, and
thereby the industry, is therefore highly dependent on availability of coal. However, due to coal
shortage and a lack of coal linkages (agreements for assured supply of coal), CPPs only receive 50
per cent of their requirements through coal linkages.272 They have to buy their remaining needs
through CIL’s e-auctions or rely on imported coal, which many CPPs are not able to afford. In
addition, the coal price – either through coal linkages, e-auctions or imports – is higher than the
regulated price for public and private power plants (utilities sector). In the case of domestic coal, the
revision of coal prices introduced by CIL in 2011 means that CPPs pay 20 per cent more for their coal
input than power utilities. Since 2009, the MoC has stopped issuing fresh coal linkages for CPPs. As
a result, 382 CPP applications for 34 GW are pending; a large number of these CPPs have been
commissioned or are at an advanced stage.273 In the absence of coal linkages, many CPPs have
been shut down or are operating at partial load – hence coal-based CPPs operated at a PFL of only
53 per cent in FY2015. The sector has started investing in non-conventional and renewable energy
sources to diversify fuel shortage risks.
A total capacity of 118 GW is forecasted to be added during the 12th FYP (FY2012–FY2017). This
includes 88 GW from conventional sources, of which 72 GW will be from thermal capacities and 30
GW from renewable sources. In the first three years of the 12th FYP (FY2012–FY2015), a record total
thermal power capacity addition of around 58 GW was added – 63 per cent of which was added by
the private sector.
Figure 28: Evolution of installed power capacity by power utilities (FY1990–FY2015)
Source: CEA, 2015.
271 EPR, ‘Coal-linkage to captive power plants: the inside story’, 16 June 2015, http://www.eprmagazine.com/article.php?ItemId=1183%20&%20CategoryId=5 and EPR, Time to rise to the occasion and support CPP, 13 May 2014, http://www.eprmagazine.com/article.php?ItemId=751%20&%20CategoryId=4 272 EPR, ibid 273 EPR, ibid

February 2016: Indian Steam Coal Imports
97
4. Electricity generation
Electricity generation from power utilities totalled 1,105 TWh in FY2015 (gross generation), a healthy
growth of 8.4 per cent compared with FY2014, 76 per cent of which was generated by coal and 12 per
cent by hydro. Other renewables generated 6 per cent, nuclear 3 per cent, and natural gas only 4 per
cent. The contribution of gas has decreased over the past two years due to fuel shortages linked to
the decline in domestic gas output and the high cost of LNG imports. In addition to gross generation
from utilities, CPPs generated 166 TWh, adding up to a total gross electricity generation of 1,272 TWh
in FY2015.274
Figure 29: Evolution of electricity generation by power utilities (FY1990–FY2015)
Source: CEA, 2015.
As reported by the CEA, during FY2015, as against a target of 784.2 TWh, power utilities achieved
coal-based generation of 800.3 TWh (not including lignite) – 102 per cent of the target, recording a
growth of 12 per cent over FY2014. The CEA expects coal-based generation to increase by 11.1 per
cent to 889 TWh in FY2016.
5. Electricity consumption
Electricity consumption more than doubled, at a CAGR of 8.2 per cent, in the past 10 years and
reached 939 TWh in FY2015, driven by the growing needs of the industrial sector, which accounts for
42 per cent of total consumption.
274 CEA, Growth of Electricity Sector in India from 1947-2015, April 2015,
http://www.cea.nic.in/reports/planning/dmlf/growth_2015.pdf

February 2016: Indian Steam Coal Imports
98
Figure 30: Electricity consumption in India in FY2015
Source: CEA, 2015.

February 2016: Indian Steam Coal Imports
99
Annex 2: Coal industry structure in India
India is the third-largest coal producer in the world and produced 660 Mt in FY2015, 612 Mt of which
was hard coal (steam and coking coal) and 48 Mt was lignite. For four decades, mining in India has
been dominated by state-owned CIL, which is the world’s largest coal miner and boasts annual
production of about 500 Mt. CIL produces 80 per cent of India’s hard coal and fuels more than 70 per
cent of India’s power generation.
In 1973 the coal industry was nationalized, and since then CIL has enjoyed a quasi-monopoly on the
production of coal and until recently was the only entity in India allowed to sell coal commercially to
other companies. A first amendment to the Coal Mines Nationalization Act in 1976 permitted
companies in the iron, steel, or power industries to produce coal from designated mines for their end-
use, or so-called ‘captive’ consumption. In 1993, the government adopted the National Mineral Policy
aimed at encouraging foreign and private investment in India’s mineral sector. Eligibility for captive
production was expanded to cement producers and coal washing, and then to coal gasification and
liquefaction in a 2007 amendment. Until March 2015, when the Coal Bill was adopted by the
parliament, the produced coal was only for self-consumption and was not commercially tradable or
exportable.
1. CIL
CIL, which is 79.65 per cent state-owned,275 operates 431 mines across eight states, with marketable
coal reserves of 22 Gt and geological resources of 64 Gt.276 Its mandate is to mine and sell coal on
the basis of FSAs/MoUs to consumers having valid linkages/LoAs. CIL, which employs about 35,000
people, has eight subsidiaries: Bharat Coking Coal Limited (BCCL), Central Coalfields Limited (CCL),
Eastern Coalfields Limited (ECL), Western Coalfields Limited (WCL), South Eastern Coalfields
Limited (SECL), Northern Coalfields Limited (NCL), Mahanadi Coalfields Limited (MCL), and the
Central Mine Planning & Design Institute Limited (CMPDI). After four years of weak production
growth, CIL’s production rose 32 Mt to 494 Mt in FY2015 (a 6.9 per cent rise from FY2014). Though
this was the biggest incremental increase in four decades, output was 13 Mt below the target set by
the government (507 Mt). Around 90 per cent of coal produced by CIL is steam coal.277
275 In January 2015, the government sold a 10 per cent stake in Coal India for about $3.6 billion. The government intends to sell
another 10 per cent share in FY2016. 276 Motilal Oswal, ‘Coal India: Share of higher margin volumes to rise sharply’, 20 August 2015,
http://www.motilaloswal.com/Financial-Services/Research/Detailed-Report/Company-Updates/13832 277 The figure is even higher if international classification of coal is used. Under international classification, coking coal has
coking properties and is mainly used in steel making and metallurgical industries as raw material. In FY2014, CIL produced 50
Mt of coking coal, of which 38 Mt was sold to the power utilities sector (COO, 2015). As coking coal is a scarce resource in
India, this ‘coking coal’ has no coking coal properties.

February 2016: Indian Steam Coal Imports
100
Map 2: Location of major coal-producing companies
Source: Central Statistics Office (from ECL).
2. SCCL
The Singareni Collieries Company Limited (SCCL), India’s oldest mining company, is the only other
state-owned hard-coal mining company in the country. The company produced 52.5 Mt of steam coal
in FY2015, representing approximately 9 per cent of India’s coal production. The output rose 2.5 Mt
thanks to the opening, in October 2014, of the country’s biggest underground mine, boasting a
capacity of 2.8 mtpa. SCCL mainly supplies steam coal to southern India (Telangana,278 Maharashtra,
Andhra Pradesh, and Karnataka). It is jointly managed by the central government and the Telangana
state. SCCL operates 16 opencast (OC) and 32 underground (UG) mines in four districts of
Telangana in the Godavari Valley, which has proved reserves of 9.6 Gt of coal.
3. Coal blocks
Coal production from public and private power, steel, and cement companies at captive blocks
totalled 53 Mt in FY2015, of which more than half was produced by private companies. Almost all of it
was steam coal. In addition, some 13 Mt is produced by other state companies, such as PANEM in
Jharkhand.
4. NLC
India also produced some 48 Mt of lignite in FY2015, 26.5 Mt of which was produced by Neyveli
Lignite Corporation Limited (NLC), which is based in Tamil Nadu and owned by the central
government.
5. Breakdown of Indian coal production
Steam coal makes up the bulk of Indian hard coal production. Despite significant resources of coking
coal, and its growing domestic production (57 Mt in FY2014, 16 Mt of which was metallurgical coal),
the quality of most Indian coking coal is insufficient for metallurgical use. Therefore India is expected
to continue importing large quantities of prime coking coal.
278 On 2 June 2014, Telangana was separated from Andhra Pradesh as a new 29th state of India, with the city of Hyderabad as its capital.

February 2016: Indian Steam Coal Imports
101
As mining in India is mostly limited to a depth of less than 300m, the majority of Indian production
comes from opencast (OC) mining. OC mining typically has lower production costs and is less
dangerous for workers, but it causes environmental damage and requires large surface areas of land.
Despite the fact that most mines are OC, productivity in India is very poor. CIL produces 1,100 tons of
coal per employee a year, compared with 36,700 tons for Peabody Energy and 12,700 tons for
China’s Shenhua Energy. This is mainly due to the lack of mechanization of coal mines, but it is also
due to frequent strikes and a strong unionized workforce that is resisting mechanization for fear of job
losses. The resulting inefficiencies have been partly responsible for years of missed output targets.
India’s coal mines are mainly located in seven states: Jharkhand and West Bengal in the east, Odisha
to the south, Madhya Pradesh and Chhattisgarh in the central region, Maharashtra in the west, and
the newly created state of Telengana in the south. During FY2014, Chhattisgarh accounted for 22.4
per cent of steam coal production in the country, followed by Odisha (20 per cent), Madhya Pradesh
(13.3 per cent), Jharkhand (10 per cent), Telangana (9 per cent), and Maharashtra (6.6 per cent).279
279 More information: Coal Controller’s Organisation, Provisional Coal Statistics 2014-2015, Ministry of Coal,
http://coal.nic.in/sites/upload_files/coal/files/webform/notices/Provisional_Coal_Statistics_2014-15.pdf
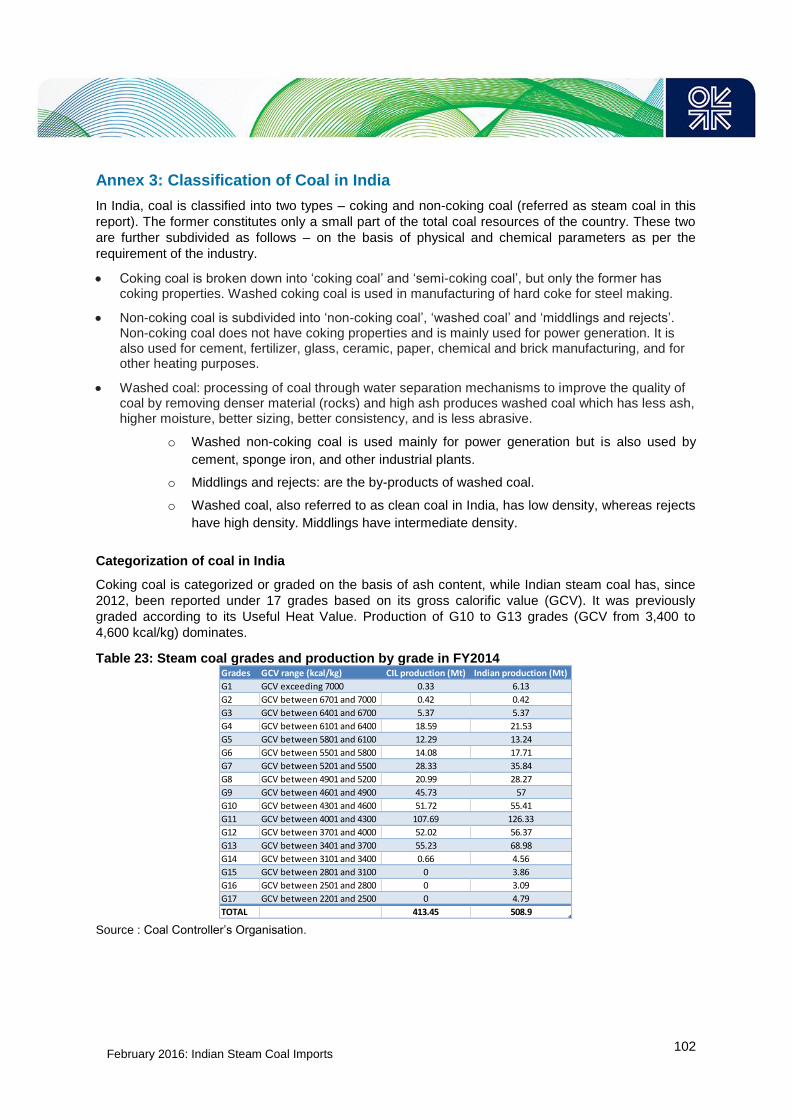
February 2016: Indian Steam Coal Imports
102
Annex 3: Classification of Coal in India
In India, coal is classified into two types – coking and non-coking coal (referred as steam coal in this
report). The former constitutes only a small part of the total coal resources of the country. These two
are further subdivided as follows – on the basis of physical and chemical parameters as per the
requirement of the industry.
Coking coal is broken down into ‘coking coal’ and ‘semi-coking coal’, but only the former has coking properties. Washed coking coal is used in manufacturing of hard coke for steel making.
Non-coking coal is subdivided into ‘non-coking coal’, ‘washed coal’ and ‘middlings and rejects’. Non-coking coal does not have coking properties and is mainly used for power generation. It is also used for cement, fertilizer, glass, ceramic, paper, chemical and brick manufacturing, and for other heating purposes.
Washed coal: processing of coal through water separation mechanisms to improve the quality of coal by removing denser material (rocks) and high ash produces washed coal which has less ash, higher moisture, better sizing, better consistency, and is less abrasive.
o Washed non-coking coal is used mainly for power generation but is also used by
cement, sponge iron, and other industrial plants.
o Middlings and rejects: are the by-products of washed coal.
o Washed coal, also referred to as clean coal in India, has low density, whereas rejects
have high density. Middlings have intermediate density.
Categorization of coal in India
Coking coal is categorized or graded on the basis of ash content, while Indian steam coal has, since
2012, been reported under 17 grades based on its gross calorific value (GCV). It was previously
graded according to its Useful Heat Value. Production of G10 to G13 grades (GCV from 3,400 to
4,600 kcal/kg) dominates.
Table 23: Steam coal grades and production by grade in FY2014
Source : Coal Controller’s Organisation.
Grades GCV range (kcal/kg) CIL production (Mt) Indian production (Mt)
G1 GCV exceeding 7000 0.33 6.13
G2 GCV between 6701 and 7000 0.42 0.42
G3 GCV between 6401 and 6700 5.37 5.37
G4 GCV between 6101 and 6400 18.59 21.53
G5 GCV between 5801 and 6100 12.29 13.24
G6 GCV between 5501 and 5800 14.08 17.71
G7 GCV between 5201 and 5500 28.33 35.84
G8 GCV between 4901 and 5200 20.99 28.27
G9 GCV between 4601 and 4900 45.73 57
G10 GCV between 4301 and 4600 51.72 55.41
G11 GCV between 4001 and 4300 107.69 126.33
G12 GCV between 3701 and 4000 52.02 56.37
G13 GCV between 3401 and 3700 55.23 68.98
G14 GCV between 3101 and 3400 0.66 4.56
G15 GCV between 2801 and 3100 0 3.86
G16 GCV between 2501 and 2800 0 3.09
G17 GCV between 2201 and 2500 0 4.79
TOTAL 413.45 508.9
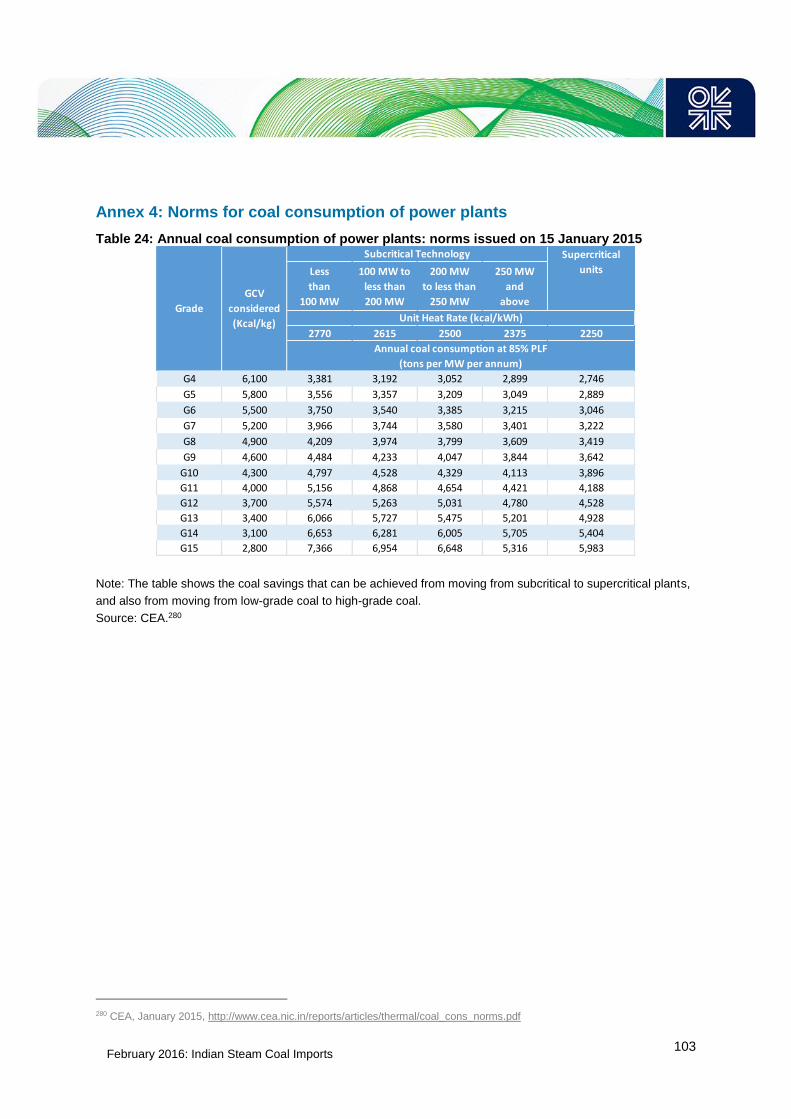
February 2016: Indian Steam Coal Imports
103
Annex 4: Norms for coal consumption of power plants
Table 24: Annual coal consumption of power plants: norms issued on 15 January 2015
Note: The table shows the coal savings that can be achieved from moving from subcritical to supercritical plants,
and also from moving from low-grade coal to high-grade coal.
Source: CEA.280
280 CEA, January 2015, http://www.cea.nic.in/reports/articles/thermal/coal_cons_norms.pdf
Less
than
100 MW
100 MW to
less than
200 MW
200 MW
to less than
250 MW
250 MW
and
above
2770 2615 2500 2375 2250
G4 6,100 3,381 3,192 3,052 2,899 2,746
G5 5,800 3,556 3,357 3,209 3,049 2,889
G6 5,500 3,750 3,540 3,385 3,215 3,046
G7 5,200 3,966 3,744 3,580 3,401 3,222
G8 4,900 4,209 3,974 3,799 3,609 3,419
G9 4,600 4,484 4,233 4,047 3,844 3,642
G10 4,300 4,797 4,528 4,329 4,113 3,896
G11 4,000 5,156 4,868 4,654 4,421 4,188
G12 3,700 5,574 5,263 5,031 4,780 4,528
G13 3,400 6,066 5,727 5,475 5,201 4,928
G14 3,100 6,653 6,281 6,005 5,705 5,404
G15 2,800 7,366 6,954 6,648 5,316 5,983
Subcritical Technology
GCV
considered
(Kcal/kg)
Grade
Supercritical
units
Annual coal consumption at 85% PLF
(tons per MW per annum)
Unit Heat Rate (kcal/kWh)
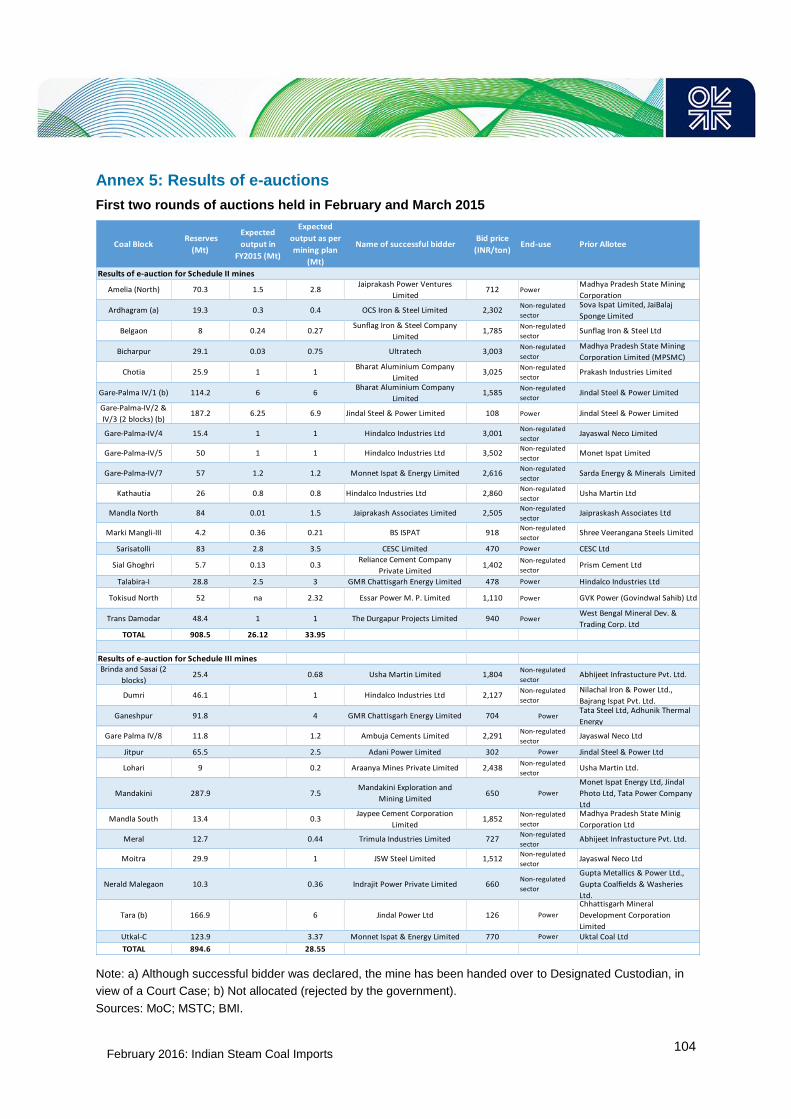
February 2016: Indian Steam Coal Imports
104
Annex 5: Results of e-auctions
First two rounds of auctions held in February and March 2015
Note: a) Although successful bidder was declared, the mine has been handed over to Designated Custodian, in
view of a Court Case; b) Not allocated (rejected by the government).
Sources: MoC; MSTC; BMI.
Coal Block Reserves
(Mt)
Expected
output in
FY2015 (Mt)
Expected
output as per
mining plan
(Mt)
Name of successful bidderBid price
(INR/ton)End-use Prior Allotee
Results of e-auction for Schedule II mines
Amelia (North) 70.3 1.5 2.8Jaiprakash Power Ventures
Limited712 Power
Madhya Pradesh State Mining
Corporation
Ardhagram (a) 19.3 0.3 0.4 OCS Iron & Steel Limited 2,302Non-regulated
sector
Sova Ispat Limited, JaiBalaj
Sponge Limited
Belgaon 8 0.24 0.27Sunflag Iron & Steel Company
Limited1,785
Non-regulated
sectorSunflag Iron & Steel Ltd
Bicharpur 29.1 0.03 0.75 Ultratech 3,003Non-regulated
sector
Madhya Pradesh State Mining
Corporation Limited (MPSMC)
Chotia 25.9 1 1Bharat Aluminium Company
Limited3,025
Non-regulated
sectorPrakash Industries Limited
Gare-Palma IV/1 (b) 114.2 6 6Bharat Aluminium Company
Limited1,585
Non-regulated
sectorJindal Steel & Power Limited
Gare-Palma-IV/2 &
IV/3 (2 blocks) (b)187.2 6.25 6.9 Jindal Steel & Power Limited 108 Power Jindal Steel & Power Limited
Gare-Palma-IV/4 15.4 1 1 Hindalco Industries Ltd 3,001Non-regulated
sectorJayaswal Neco Limited
Gare-Palma-IV/5 50 1 1 Hindalco Industries Ltd 3,502Non-regulated
sectorMonet Ispat Limited
Gare-Palma-IV/7 57 1.2 1.2 Monnet Ispat & Energy Limited 2,616Non-regulated
sectorSarda Energy & Minerals Limited
Kathautia 26 0.8 0.8 Hindalco Industries Ltd 2,860Non-regulated
sectorUsha Martin Ltd
Mandla North 84 0.01 1.5 Jaiprakash Associates Limited 2,505Non-regulated
sectorJaipraskash Associates Ltd
Marki Mangli-III 4.2 0.36 0.21 BS ISPAT 918Non-regulated
sectorShree Veerangana Steels Limited
Sarisatolli 83 2.8 3.5 CESC Limited 470 Power CESC Ltd
Sial Ghoghri 5.7 0.13 0.3Reliance Cement Company
Private Limited1,402
Non-regulated
sectorPrism Cement Ltd
Talabira-I 28.8 2.5 3 GMR Chattisgarh Energy Limited 478 Power Hindalco Industries Ltd
Tokisud North 52 na 2.32 Essar Power M. P. Limited 1,110 Power GVK Power (Govindwal Sahib) Ltd
Trans Damodar 48.4 1 1 The Durgapur Projects Limited 940 PowerWest Bengal Mineral Dev. &
Trading Corp. LtdTOTAL 908.5 26.12 33.95
Results of e-auction for Schedule III minesBrinda and Sasai (2
blocks)25.4 0.68 Usha Martin Limited 1,804
Non-regulated
sectorAbhijeet Infrastucture Pvt. Ltd.
Dumri 46.1 1 Hindalco Industries Ltd 2,127Non-regulated
sector
Nilachal Iron & Power Ltd.,
Bajrang Ispat Pvt. Ltd.
Ganeshpur 91.8 4 GMR Chattisgarh Energy Limited 704 PowerTata Steel Ltd, Adhunik Thermal
Energy
Gare Palma IV/8 11.8 1.2 Ambuja Cements Limited 2,291Non-regulated
sectorJayaswal Neco Ltd
Jitpur 65.5 2.5 Adani Power Limited 302 Power Jindal Steel & Power Ltd
Lohari 9 0.2 Araanya Mines Private Limited 2,438Non-regulated
sectorUsha Martin Ltd.
Mandakini 287.9 7.5Mandakini Exploration and
Mining Limited650 Power
Monet Ispat Energy Ltd, Jindal
Photo Ltd, Tata Power Company
Ltd
Mandla South 13.4 0.3Jaypee Cement Corporation
Limited1,852
Non-regulated
sector
Madhya Pradesh State Minig
Corporation Ltd
Meral 12.7 0.44 Trimula Industries Limited 727Non-regulated
sectorAbhijeet Infrastucture Pvt. Ltd.
Moitra 29.9 1 JSW Steel Limited 1,512Non-regulated
sectorJayaswal Neco Ltd
Nerald Malegaon 10.3 0.36 Indrajit Power Private Limited 660Non-regulated
sector
Gupta Metallics & Power Ltd.,
Gupta Coalfields & Washeries
Ltd.
Tara (b) 166.9 6 Jindal Power Ltd 126 Power
Chhattisgarh Mineral
Development Corporation
LimitedUtkal-C 123.9 3.37 Monnet Ispat & Energy Limited 770 Power Uktal Coal Ltd
TOTAL 894.6 28.55
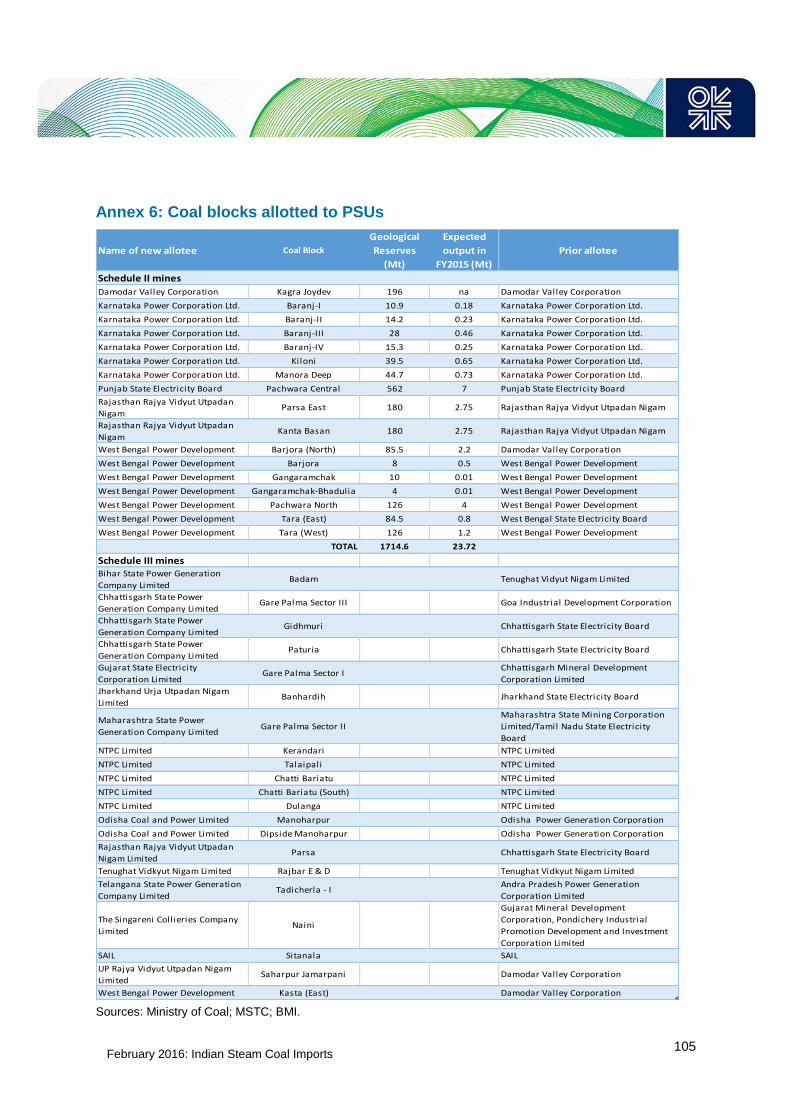
February 2016: Indian Steam Coal Imports
105
Annex 6: Coal blocks allotted to PSUs
Sources: Ministry of Coal; MSTC; BMI.
Name of new allotee Coal Block
Geological
Reserves
(Mt)
Expected
output in
FY2015 (Mt)
Prior allotee
Schedule II mines
Damodar Valley Corporation Kagra Joydev 196 na Damodar Valley Corporation
Karnataka Power Corporation Ltd. Baranj-I 10.9 0.18 Karnataka Power Corporation Ltd.
Karnataka Power Corporation Ltd. Baranj-II 14.2 0.23 Karnataka Power Corporation Ltd.
Karnataka Power Corporation Ltd. Baranj-III 28 0.46 Karnataka Power Corporation Ltd.
Karnataka Power Corporation Ltd. Baranj-IV 15.3 0.25 Karnataka Power Corporation Ltd.
Karnataka Power Corporation Ltd. Kiloni 39.5 0.65 Karnataka Power Corporation Ltd.
Karnataka Power Corporation Ltd. Manora Deep 44.7 0.73 Karnataka Power Corporation Ltd.
Punjab State Electricity Board Pachwara Central 562 7 Punjab State Electricity Board
Rajasthan Rajya Vidyut Utpadan
NigamParsa East 180 2.75 Rajasthan Rajya Vidyut Utpadan Nigam
Rajasthan Rajya Vidyut Utpadan
NigamKanta Basan 180 2.75 Rajasthan Rajya Vidyut Utpadan Nigam
West Bengal Power Development Barjora (North) 85.5 2.2 Damodar Valley Corporation
West Bengal Power Development Barjora 8 0.5 West Bengal Power Development
West Bengal Power Development Gangaramchak 10 0.01 West Bengal Power Development
West Bengal Power Development Gangaramchak-Bhadulia 4 0.01 West Bengal Power Development
West Bengal Power Development Pachwara North 126 4 West Bengal Power Development
West Bengal Power Development Tara (East) 84.5 0.8 West Bengal State Electricity Board
West Bengal Power Development Tara (West) 126 1.2 West Bengal Power Development
TOTAL 1714.6 23.72
Schedule III minesBihar State Power Generation
Company LimitedBadam Tenughat Vidyut Nigam Limited
Chhattisgarh State Power
Generation Company LimitedGare Palma Sector III Goa Industrial Development Corporation
Chhattisgarh State Power
Generation Company LimitedGidhmuri Chhattisgarh State Electricity Board
Chhattisgarh State Power
Generation Company LimitedPaturia Chhattisgarh State Electricity Board
Gujarat State Electricity
Corporation LimitedGare Palma Sector I
Chhattisgarh Mineral Development
Corporation Limited
Jharkhand Urja Utpadan Nigam
LimitedBanhardih Jharkhand State Electricity Board
Maharashtra State Power
Generation Company LimitedGare Palma Sector II
Maharashtra State Mining Corporation
Limited/Tamil Nadu State Electricity
Board
NTPC Limited Kerandari NTPC Limited
NTPC Limited Talaipali NTPC Limited
NTPC Limited Chatti Bariatu NTPC Limited
NTPC Limited Chatti Bariatu (South) NTPC Limited
NTPC Limited Dulanga NTPC Limited
Odisha Coal and Power Limited Manoharpur Odisha Power Generation Corporation
Odisha Coal and Power Limited Dipside Manoharpur Odisha Power Generation Corporation
Rajasthan Rajya Vidyut Utpadan
Nigam LimitedParsa Chhattisgarh State Electricity Board
Tenughat Vidkyut Nigam Limited Rajbar E & D Tenughat Vidkyut Nigam Limited
Telangana State Power Generation
Company LimitedTadicherla - I
Andra Pradesh Power Generation
Corporation Limited
The Singareni Collieries Company
LimitedNaini
Gujarat Mineral Development
Corporation, Pondichery Industrial
Promotion Development and Investment
Corporation Limited
SAIL Sitanala SAIL
UP Rajya Vidyut Utpadan Nigam
LimitedSaharpur Jamarpani Damodar Valley Corporation
West Bengal Power Development Kasta (East) Damodar Valley Corporation

February 2016: Indian Steam Coal Imports
106
Annex 7: Exchange rates
India reports financial data in lakh and crore.
1 Lakh = INR 100,000
1 crore = 100 Lakh = INR 10,000,000
Data in lakh and crore have been converted in US$, with the following exchange rates:
FY2010: 47.4
FY2011: 45.6
FY2012: 47.9
FY2013: 54.4
FY2014: 60.5
(Economic Survey 2014–2015)
FY2015: 61.1 (x-rates)
Beginning of FY2016: 63

February 2016: Indian Steam Coal Imports
107
List of tables, figures, boxes and maps
Tables
Table 1: Coal consumption and imports by power utilities .................................................................... 12
Table 2: Energy import dependence in FY2010 and FY2014 ............................................................... 19
Table 3: 12th FYP projected gap between coal demand and indigenous supply .................................. 22
Table 4: Electricity generation from renewable energy sources ........................................................... 33
Table 5: Pithead run-of-mine coal prices of CIL (prices effective since 27 May 2013) ........................ 38
Table 6: CIL e-auction sales and prices vs. average sales prices ........................................................ 38
Table 7: Price comparison between imported and domestic coal (July 2015) ..................................... 39
Table 8: Coal-fired power plants under construction at the end of March 2015 ................................... 44
Table 9: Status of UMPP projects ......................................................................................................... 46
Table 10: Main assumptions for steam coal demand by power utilities ............................................... 47
Table 11: Estimated coal demand by the power utilities sector (FY2015–FY2020) ............................. 49
Table 12: Steam coal demand Scenarios ............................................................................................. 50
Table 13: Coal and lignite production in India (FY2010–FY2015) ........................................................ 51
Table 14: CIL’s subsidiary-wise cost of production ............................................................................... 54
Table 15: CIL’s new mining projects to be started in FY2016 .............................................................. 56
Table 16: Public hearing exemptions for coal mining expansion within the same lease area .............. 60
Table 17: Critical railway lines............................................................................................................... 63
Table 18: Geological resources and proved reserves of hard coal in India, as of 1 April 2015 ........... 66
Table 19: Peak rated capacity of mines auctioned and allotted as of end of March 2015 ................... 76
Table 20: Estimated state-wise revenues from the first two rounds of auctions ................................... 77
Table 21: Coal production assessments by FY2020 ............................................................................ 82
Table 22: Scenarios for steam coal supply/demand balance by FY2020 ............................................. 83
Table 23: Steam coal grades and production by grade in FY2014..................................................... 102
Table 24: Annual coal consumption of power plants: norms issued on 15 January 2015 .................. 103
Figures
Figure 1: India’s coal imports in the global context ................................................................................. 8
Figure 2: Evolution of coal imports and import dependence in India (FY2004–FY2015) ....................... 8
Figure 3: Steam coal imports by power utilities and the non-regulated sector, FY2015 vs. FY2014 ... 10
Figure 4: Coal-based power capacity, coal production, and coal imports by power utilities ................ 11
Figure 5: Share of steam coal imports by power utilities in total steam coal imports ........................... 13
Figure 6: Steam coal imports by source (FY2012–FY2015) ................................................................. 14
Figure 7: Coal import bill (FY2009–FY2015) ........................................................................................ 16
Figure 8: Impact of exchange rate on imported coal prices .................................................................. 16
Figure 9: Evolution of steam coal FOB prices (January 2000 – July 2015) .......................................... 17
Figure 10: Evolution of total coal consumption (FY2005–FY2015) ...................................................... 23
Figure 11: Installed coal power capacities – power utilities (FY1990–FY2015) ................................... 24
Figure 12: Electricity generation from coal – power utilities (FY1990–FY2015) ................................... 24
Figure 13: Coal consumption (hard coal and lignite) by sector in FY2015 ........................................... 25
Figure 14: Evolution of coal-based plant load factor (FY2010–FY2015) .............................................. 29
Figure 15: Effects of different technologies on coal use and carbon emissions ................................... 29
Figure 16: Coal-based power capacity additions by FY2020 ............................................................... 48
Figure 17: Government targeted coal production to FY2020 ................................................................ 52
Figure 18: CIL’s projected production from ongoing projects ............................................................... 53
February 2016: Indian Steam Coal Imports
108
Figure 19: Outlook for CIL production by subsidiary (FY2015, FY2016, and FY2020) ........................ 54
Figure 20: Coal mining projects granted environmental clearance (2007–2015) ................................. 59
Figure 21: Coal mining projects granted forest clearance (2007–2015) ............................................... 60
Figure 22: CIL’s underground coal production, historical and planned ................................................ 68
Figure 23: Evolution of production from captive mines (FY1998–2015) ............................................... 70
Figure 24: Breakdown of the initial 110 blocks to be auctioned or allotted ........................................... 72
Figure 25: Imports by power plants designed on imported coal in FY2015 .......................................... 87
Figure 26: Total primary energy consumption in India in 2013 ............................................................. 94
Figure 27: Installed power capacity (utilities) at end of March 2015 ..................................................... 95
Figure 28: Evolution of installed power capacity by power utilities (FY1990–FY2015) ........................ 96
Figure 29: Evolution of electricity generation by power utilities (FY1990–FY2015) ............................. 97
Figure 30: Electricity consumption in India in FY2015 .......................................................................... 98
Boxes
Box 1: Data on coal imports in India ....................................................................................................... 9
Box 2: Determination of coal import needs by the power utilities sector .............................................. 11
Box 3: Imported coal with 25 per cent ash content allowed .................................................................. 14
Box 4: Overseas investment ................................................................................................................. 20
Box 5: Government initiatives to improve the efficiency of coal-fired power plants .............................. 30
Box 6: Power tariff regulations .............................................................................................................. 35
Box 7: India’s INDC ............................................................................................................................... 43
Box 8: The UMMPs policy ..................................................................................................................... 45
Box 9: The land acquisition debate ....................................................................................................... 57
Box 10: Commercial mining in India: the Coal Mines (Special Provisions) Bill, 2015 .......................... 71
Box 11: Rules for auctions, conditions for bidding and monitoring of coal production ......................... 74
Box 12: NTPC to become a large coal producer .................................................................................. 76
Box 13: FY2016 – a turning point for Indian steam coal imports .......................................................... 84
Box 14: Captive power plants ............................................................................................................... 96
Maps
Map 1: Indian railway network .............................................................................................................. 64
Map 2: Location of major coal-producing companies ......................................................................... 100

February 2016: Indian Steam Coal Imports
109
References
ABC, Adani CEO says India will remain an importer of coal, 25 May 2015,
http://www.abc.net.au/news/2015-05-25/adani-ceo-speaks-to-faithful-in-mackay/6494536
Adani, Adani group: new form and new substance, 20 June 2015,
http://www.adani.com/Common/Uploads/InvestorRelationTemplate/19_InvBotDL_Adani%20Group%2
0Presentation%20Jun%2015.pdf
Australian Financial Review (AFR), Adani granted approval for Carmichael mine, 15 October 2015,
http://www.afr.com/business/mining/adani-granted-approval-for-carmichael-mine-20151015-gk9wz5
AFR, India to fuel Adani's coal expansion, 16 June 2015,
http://www.afr.com/business/mining/coal/india-to-fuel-adanis-coal-expansion-20150616-
ghpg3x#ixzz3jupRRhxV
Anand M.R., Prasad D.N, Recent trends in production and import of coal in India, Ministry of Coal
Occasional Working paper Series No. 1, 13 October 2013
http://www.coal.nic.in/sites/upload_files/coal/files/coalupload/wp101014.pdf
Australian Government, Office of the Chief Economist, Coal in India, 2015, Department of Industry
and Science, http://www.industry.gov.au/Office-of-the-Chief-Economist/Publications/Pages/Coal-in-
India.aspx
Australian Government, Office of the Chief Economist, Resources and Energy Quarterly, September
Quarter 2015, September 2015Department of Industry and Science,
http://www.industry.gov.au/Office-of-the-Chief-Economist/Publications/Pages/Resources-and-energy-
quarterly.aspx
Barnes Ian, Upgrading the efficiency, IEA Clean Coal Centre 2014, Cornerstonemag.com, Volume 3,
Issue 1, Spring 2015, http://cornerstonemag.net/upgrading-the-efficiency-of-the-worlds-coal-fleet-to-
reduce-co2-emissions/
BBC news, Adani's Australian coal prospects in doubt, 9 August 2015,
http://www.bbc.com/news/world-australia-33815059
Bloomberg, World’s Worst Air Spurs Modi’s $25 Billion Utility Clean-Up Push, 4 May 2015,
http://www.bloomberg.com/news/articles/2015-05-04/world-s-worst-air-spurs-modi-s-25-billion-utility-
clean-up-push
BMI, Industry Trend Analysis - India Coal Crackdown: Sector Implications, November 2014, BMI
Research, http://www.mining-insight.com/industry-trend-analysis-india-coal-crackdown-sector-
implications-nov-2014
BP, Statistical Review of World Energy 2015, June 2015,
http://www.bp.com/en/global/corporate/about-bp/energy-economics/statistical-review-of-world-
energy.html
Business Line, Singareni Collieries set to set higher production target, 16 July 2015,
http://www.thehindubusinessline.com/companies/centre-assures-support-to-singareni-projects-
expansion/article7429962.ece
Business Line, Coal mine auctions: 12 out of 28 winners wait for clearances to start mining, 14 July
2015, http://www.thehindubusinessline.com/economy/coal-mine-auctions-12-out-of-28-winners-wait-
for-clearances-to-start-miningcoal-mine-auctions-12-out-of-28-winners-wait-for-clearances-to-start-
mining/article7422041.ece

February 2016: Indian Steam Coal Imports
110
Business Line, Commercial mining: Coal Ministry seeks to finalise model for contracts, 24 June 2015,
http://www.thehindubusinessline.com/news/stakeholder-consultations-on-roadmap-for-commercial-
coal-miningbegin/article7345959.ece
Business Line, Will coal linkage auctions really help the deregulated sector? 10 June 2015,
http://www.thehindubusinessline.com/economy/will-coal-linkage-auction-really-help-the-deregulated-
sector/article7306238.ece
Business Line, Thermal coal imports will stop by 2017: Goyal, 15 May 2015,
http://www.thehindubusinessline.com/economy/thermal-coal-imports-must-be-stopped-
goyal/article7209584.ece?ref=relatedNews
Business Line, Delay in price hike hits Coal India profits, 4 March 2015,
http://www.thehindubusinessline.com/companies/delay-in-price-hike-hits-coal-india-
profits/article6959717.ece
Business Standard, New power plants face strain on insufficient off-take agreements: India Ratings, 4
August 2015, http://www.business-standard.com/article/companies/new-power-plants-face-strain-on-
insufficient-off-take-agreements-india-ratings-115080300281_1.html
Business Standard, FICCI designs model for commercial mining, 22 June 2015; http://www.business-
standard.com/article/economy-policy/ficci-designs-model-for-commercial-coal-mining-
115062200030_1.html
Business Standard, CIL's underground coal output declines 3% to 35 MT in FY15, 18 May 2015,
http://www.business-standard.com/article/pti-stories/cil-s-underground-coal-output-declines-3-to-35-
mt-in-fy15-115051801299_1.html
Business Standard, Power purchase rules changed, 7 May 2015, http://www.business-
standard.com/article/economy-policy/centre-amends-rules-for-power-procurement-by-distribution-
licensees-from-coal-based-projects-115050600662_1.html
Business Standard, Power charges: Leeway to be tightened, 17 April 2015, http://www.business-
standard.com/article/economy-policy/power-charges-leeway-to-be-tightened-115041400889_1.html
Business Standard, Coal block re-allocation: States, PSUs get back lost mines, 25 March 2015,
http://www.business-standard.com/article/economy-policy/coal-block-re-allocation-states-psus-get-
back-lost-mines-115032500025_1.html
Business Standard, Efficiency of India’s coal based power plants way below global, 21 February
2015, http://www.business-standard.com/article/pti-stories/efficiency-of-india-s-coal-based-power-
plants-way-below-global-115022100510_1.html
Business Standard, Coal India designs roadmap for 1-bn-tonne coal production, 20 February 2015,
http://www.business-standard.com/article/companies/coal-india-designs-roadmap-for-1-bn-tonne-
coal-production-115022000986_1.html
Business Standard, ‘Coal Ministry issues mine development, production agreement for upcoming e-
auction’, 23 January 2015, http://www.business-standard.com/article/economy-policy/coal-ministry-
issues-mine-development-production-agreement-for-upcoming-e-auction-
115012300710_1.htmlBusiness Standard, No-go ghost still haunts Coal India, 22 May 2012,
http://www.business-standard.com/article/companies/no-go-ghost-still-haunts-coal-india-
112052200055_1.html
Central Electricity Authority (CEA), http://www.cea.nic.in/new_website/
CEA, Monthly generation reports, June 2015,
http://www.cea.nic.in/reports/monthly/generation_rep/actual/jun15/opm_11.pdf and
http://www.cea.nic.in/reports/monthly/generation_rep/actual/jun15/opm_01.pdf

February 2016: Indian Steam Coal Imports
111
CEA, Revision of electricity generation target of 2015-16, 5 May 2015,
http://www.cea.nic.in/reports/articles/god/generation_target_1516.pdf
CEA, Load generation balance report 2015-16, May 2015,
http://www.cea.nic.in/reports/yearly/lgbr_report.pdf
CEA, Growth of Electricity Sector in India from 1947-2015, April 2015,
http://www.cea.nic.in/reports/planning/dmlf/growth_2015.pdf
CEA, Monthly Report on broad status of thermal power projects in the country, April 2015,
http://www.cea.nic.in/reports/proj_mon/broad_status.pdf
CEA, Executive Summary, Power Sector, various issues, monthly,
http://www.cea.nic.in/exesum_cood.html
Central Statistics Office, Energy Statistics 2015, March 2015,
http://mospi.nic.in/mospi_new/upload/energy_stats_2015_26mar15.pdf
Centre for Science and Environment (CSE), First year of NDA rule, 2015,
http://cseindia.org/userfiles/Factsheet-One-year-review.pdf
Climate Action Tracker, countries: India, 2015, http://climateactiontracker.org/countries/india.html
Climate policy initiative, Three ways to attract domestic institutional investment for renewable energy
projects in India, September 2015, http://climatepolicyinitiative.org/2015/09/10/three-ways-to-attract-
domestic-institutional-investment-for-renewable-energy-projects-in-india/
Coal Age, CIL Withdraws from ICVL, 26 March 2015, http://www.coalage.com/news/world-
news/4309-cil-withdraws-from-icvl.html#.VRyI4PmsXuI
Coal Age, India’s NTPC to Emerge as Country’s Second Largest Coal Miner, 2 January 2015,
http://www.coalage.com/news/world-news/4156-india-s-ntpc-to-emerge-as-country-s-second-largest-
coal-miner.html#.VebuaPntmkp
Coal Controller’s Organisation (CCO), Provisional Coal Statistics 2014-2015, Ministry of Coal,
http://coal.nic.in/sites/upload_files/coal/files/webform/notices/Provisional_Coal_Statistics_2014-15.pdf
CCO, Coal Statistics 2013-2014, April 2015, (and previous issues) Ministry of Coal,
http://coal.nic.in/sites/upload_files/coal/files/coalupload/coaldir13-14.pdf
Coal India Limited (CIL), 2014-15 Annual Report and Accounts, August 2015,
https://www.coalindia.in/DesktopModules/DocumentList/documents/Annual_Report_&_Accounts_201
4-15_Shareholder_version_03082015(1).pdf
CIL, Roadmap for enhancement of coal production, 26 May 2015,
http://coal.nic.in/sites/upload_files/coal/files/webform/notices/RoadMap_for_Enhancement_of_Coal_P
roduction_26052015.pdf
CIL, Monthly production: https://www.coalindia.in/en-us/performance/physical.aspx
Coal Junction, Govt’s underground coal mining plan hits hurdles, 3 July 2015,
http://www.coaljunction.in/news/n_newsdetail/Govt-s-underground-coal-mining-plan-hits-
hurdles_1#sthash.EB5heJle.dpuf
Coal Junction, Aggressive bidding for coal mines detrimental to returns: ICRA, 31 Mar 2015,
http://www.coaljunction.in/news/n_newsdetail/Aggressive-bidding-for-coal-mines-detrimental-to-
returns-ICRA_1#sthash.ixjrQDHR.dpuf
Coal Junction, Rail freight on grains, coal, cement to increase from April 1, 31 Mar 2015,
http://www.coaljunction.in/news/n_newsdetail/Rail-freight-on-grains-coal-cement-to-increase-from-
April-1_1#sthash.btJqebmj.dpuf

February 2016: Indian Steam Coal Imports
112
CMPDI, Preparations for 925 Million Tonne Production from CIL in 2019-20, February 2015,
http://coal.nic.in/sites/upload_files/coal/files/coalupload/cil/CMPDI%20presentation%20for%2020%20
Jan%202015.pptx
Credit Suisse, India Utilities Sector, 14 May 2015, Credit Suisse Equity Research,
https://doc.research-and-
analytics.csfb.com/docView?language=ENG&source=ulg&format=PDF&document_id=1048655381&s
erialid=iiSMLBOelBNI6aB3r5Kd4X3PYZnVWl6pkOLi%2BWR7%2BFM%3D
Daiwa Capital Market, Coal India, New volume target: 1 bn tonnes by 2019, 3 November 2014,
http://asiaresearch.daiwacm.com/eg/cgi-bin/files/Coal_India_141103.pdf
Deutsche Bank, Make way for the sun, 19 July 2015, https://www.db.com/cr/en/docs/Deutsche-Bank-
report-Make-way-for-the-Sun.pdf
DNA India, Centre relaxes norms after coal e-auction flops, 19 October 2015,
http://www.dnaindia.com/money/report-centre-relaxes-norms-after-coal-e-auction-flops-2136266
DNA India, Land Acquisition Delays: Reliance Power terminates 3,960 MW Tilaiya power plant, 28
April 2015, http://www.dnaindia.com/money/report-land-acquisition-delays-reliance-power-terminates-
3960-mw-tilaiya-power-plant-2081351
DNA, Government issues draft rules for coal block auction, 19 December 2014,
http://www.dnaindia.com/money/report-government-issues-draft-rules-for-coal-block-auction-2045211
Economic Times, Coal India to tweak e-auctions to check falling prices, 18 August 2015,
http://articles.economictimes.indiatimes.com/2015-08-18/news/65530391_1_coal-production-state-
run-coal-india-e-auctions
Economic Times, ‘Third tranche of coal auctions from Tuesday; 22 bids qualify’, 8 August 2015,
http://articles.economictimes.indiatimes.com/2015-08-08/news/65350952_1_coal-auction-coal-block-
marki-mangli
Economic Times, Imported coal stocks pile up at a record high of 16 Mt as power firms stop spot buy,
15 June 2015, http://economictimes.indiatimes.com/industry/indl-goods/svs/metals-mining/imported-
coal-stocks-pile-up-at-a-record-high-of-16-mt-as-power-firms-stop-spot-
buy/articleshow/47670179.cms
Economic Times, Auctioning linkages to bring in transparency, not necessarily to benefit Coal India:
Anil Swarup, Coal Secretary, 5 June 2015,
http://economictimes.indiatimes.com/articleshow/47551545.cms?utm_source=contentofinterest&utm_
medium=text&utm_campaign=cppst
Economic Times, India sees lowest plant load factor in 15 years; power capacities operating at 65%,
29 May 2015, http://economictimes.indiatimes.com/industry/energy/power/india-sees-lowest-plant-
load-factor-in-15-years-power-capacities-operating-at-
65/articleshow/47463610.cms?utm_source=contentofinterest&utm_medium=text&utm_campaign=cpp
st
Economic Times, Large projects will ensure 24x7 power for all in next five years: Piyush Goyal, 18
May 2015,
http://economictimes.indiatimes.com/articleshow/47321714.cms?utm_source=contentofinterest&utm_
medium=text&utm_campaign=cppst
Economic Times, NTPC not to import coal in Q1, cites sufficient CIL supply, 27 April 2015,
http://articles.economictimes.indiatimes.com/2015-04-27/news/61578134_1_coal-india-coal-stock-
coal-supply
February 2016: Indian Steam Coal Imports
113
Economic Times, Coal India draws logistics strategy to push coal evacuation, 19 April 2015,
http://articles.economictimes.indiatimes.com/2015-04-19/news/61303962_1_coal-india-sutirtha-
bhattacharya-eastern-coalfields
Economic Times, Coal India arm achieves record exploration in FY15, 13 April 2015,
http://articles.economictimes.indiatimes.com/2015-04-13/news/61102903_1_coal-india-arm-cmpdi-ak-
debnath
Economic Times, Government decides to speed up Rs 90,000 crore power projects, 9 March 2015,
http://articles.economictimes.indiatimes.com/2015-03-09/news/59931864_1_land-acquisition-law-
lakh-crore-nabinagar
Economic Times, India to add 1,00,000 MW clean coal tech-based power capacity, 3 March 2015,
http://articles.economictimes.indiatimes.com/2015-03-03/news/59725414_1_power-generation-coal-
market-total-installed-capacity
Economic Times, Coal auction lessons: Investors are willing to bet capital when transparent policy is
offered, 22 February 2015, http://articles.economictimes.indiatimes.com/2015-02-
22/news/59386540_1_coal-auction-schedule-ii-coal-mines-end-use
Economic Times, Scheme to swap coal supplies with nearest fuel source gets government nod, 4
February 2015, http://articles.economictimes.indiatimes.com/2015-02-04/news/58795878_1_coal-
india-ltd-coal-supplies-damodar-valley-corp
Economic Times, Making efforts to settle project related issues: Coal Ministry to PMO, 11 January
2015, http://articles.economictimes.indiatimes.com/2015-01-11/news/57941134_1_coal-ministry-coal-
mining-projects-coal-output
Economic Times, IPCC for phasing out coal, but India plans to make coal washing mandatory, 8
November 2014, http://articles.economictimes.indiatimes.com/2014-11-08/news/55836080_1_coal-
washeries-coal-mining-projects-unwashed-coal
Economic Times, Centre puts 90 of Coal India's mining projects worth Rs 88k crore on fast track, 3
November 2014, http://articles.economictimes.indiatimes.com/2014-11-03/news/55720014_1_coal-
ministry-coal-india-limited-coal-block
Economic Times, Coal India plans to utilise underground resources for boosting production figures, 13
October 2014, http://articles.economictimes.indiatimes.com/2014-10-
13/news/54970708_1_underground-mines-new-mines-coal-india
Economic Times, Environment ministry unveils online system for submission and monitoring of forest
clearance proposals, 16 July 2014, http://articles.economictimes.indiatimes.com/2014-07-
16/news/51600486_1_clearance-environment-ministry-forest-rights-act
Energy Global, Power tariff regulations and thermal coal demand, 29 July 2013,
http://www.energyglobal.com/upstream/special-
reports/29072013/Salva_Report_India_power_tariff_regulations_and_thermal_coal_demand_285/
Energysector.in, Coal India Limited Plans To Reduce Workforce, 26 May 2015,
http://www.energysector.in/coal-news/coal-india-limited-plans-to-reduce-workforce
Energysector.in, Coal India To Go For PPP Model For Coal Production, 14 April 2015,
http://www.energysector.in/coal-news/coal-india-to-go-for-ppp-model-for-coal-production
Energysector.in, CIL Gets Interim Custody of 3 Coal Blocks, 30 March 2015,
http://www.energysector.in/coal-news/cil-gets-interim-custody-of-3-coal-blocks
Energy sector.in, Steps to increase coal production from underground mines, 2 August 2014,
http://www.energysector.in/coal-news/steps-to-increase-coal-production-from-underground-mines-
august-2014

February 2016: Indian Steam Coal Imports
114
EPR, How to reduce emissions in coal-based power plants, 15 July 2015,
http://www.eprmagazine.com/article.php?ItemId=1209%20&%20CategoryId=5
EPR, Coal-linkage to captive power plants: the inside story, 16 June 2015,
http://www.eprmagazine.com/article.php?ItemId=1183%20&%20CategoryId=5
EPR, Time to rise to the occasion and support CPP, 13 May 2014,
http://www.eprmagazine.com/article.php?ItemId=751%20&%20CategoryId=4
Express News Service, Singareni to Blend Its Coal with Exotic Coal, 13 March 2015,
http://www.newindianexpress.com/states/andhra_pradesh/Singareni-to-Blend-Its-Coal-with-Exotic-
Coal/2015/03/13/article2711155.ece
Financial Express, Coal India goes for makeover, 3 June 2015,
http://www.financialexpress.com/article/industry/companies/coal-india-goes-for-makeover/79443/
Financial Express, India to stop imports of low grade thermal coal in two years, says Piyush Goyal, 15
May 2015, http://www.financialexpress.com/article/economy/india-to-stop-imports-of-low-grade-
thermal-coal-in-two-years-says-piyush-goyal/72786/
Financial Express, Coal India mines SPVs for 1-bn-tonne mark, 21 February 2015,
http://www.financialexpress.com/article/economy/coal-india-mines-spvs-for-1-bn-tonne-mark/45499/
Geological Survey of India, Coal resources in India, 2015,
http://www.portal.gsi.gov.in/portal/page?_pageid=127,721708&_dad=portal&_schema=PORTAL
Geonesis, FIS lenders helping developers in coal auctions to avoid bad assets, Volume 2, Issue 4,
March 2015
Global CemFuels, Coal India to form coal joint venture with India Railways, 1 April 2015,
http://www.cemfuels.com/news/item/2856-coal-india-to-form-coal-joint-venture-with-india-railways
Government of India (GOI), Cabinet Committee on Economic Affairs (CCEA), Approval to innovative
mechanism for utilization of stranded gas based generation capacity, 25 March 2015,
http://pib.nic.in/newsite/PrintRelease.aspx?relid=117698
GOI, Economic Survey 2014-15, February 2015, http://indiabudget.nic.in/es2014-15/echapter-vol1.pdf
GOI, Budget 2015-2016, Speech of Arun Jaitley, Minister of Finance, February 28, 2015,
http://indiabudget.nic.in/bspeecha.asp
GOI, Press Information Bureau (PIB), http://pib.nic.in/newsite/mainpage.aspx
Green Clearance Watch, http://www.greenclearancewatch.org/
Hindustan Times, Modi govt's energy policy to now focus on renewable supply, 3 May 2015,
http://www.hindustantimes.com/india-news/modi-govt-s-energy-policy-to-now-focus-on-renewable-
supply/article1-1343629.aspx
ICRA, Power Sector: Structural issues continue; Aggressive bidding in coal auction lead to increased
vulnerability, though positive steps being taken to improve fuel supply, Executive Summary, July
2015, ICRA Research Services, http://www.icra.in/Files/ticker/SH-2015-Q2-2-ICRA-Power.pdf
India Energy Forum, Post Coal Auction Worries for Power Sector, Total Energy, Vol-9, Issue II,
March-April 2015,
Indian Express, Coal with increased ash content, panel gives go ahead for imports, 8 October 2015,
http://indianexpress.com/article/business/business-others/coal-with-increased-ash-content-panel-
gives-go-ahead-for-imports/#sthash.dTshpffp.dpuf

February 2016: Indian Steam Coal Imports
115
Indian Express, Not to re-promulgate land ordinance is not a setback for government, says Arun
Jaitley, 31 August 2015, http://indianexpress.com/article/india/india-others/not-to-re-promulgate-land-
ordinance-is-not-a-setback-for-government-says-arun-jaitley/
Indian Express, Coal Ministry may ask Discoms to get clearances before bidding, 28 June 2015,
http://indianexpress.com/article/business/companies/coal-ministry-may-ask-discoms-to-get-
clearances-before-bidding/
Indian Express, Small bidders wary of methodology for CIL output auction, 15 June 2015,
http://indianexpress.com/article/business/business-others/small-bidders-wary-of-methodology-for-cil-
output-auction/#sthash.gG6QrNd9.dpuf
Indian Express, Integrated energy policy soon to meet growing demand: NITI, 14 April 2015,
http://indianexpress.com/article/business/business-others/integrated-energy-policy-soon-to-meet-
growing-demand-niti/#sthash.dFXgAg4Y.dpuf
Institute for Energy Economics and Financial Analysis (IEEFA), India’s electricity-sector
transformation, August 2015, http://ieefa.org/wp-content/uploads/2015/08/IEEFA-Indian-Electricity-
Sector-Transformation-11-August-2015.pdfInternational Coal Ventures Private Limited (ICVL),
http://icvl.in/aboutus.php?tag=company-aboutus
International Energy Agency (IEA), Key world energy statistics 2014, 2015,
http://www.iea.org/publications/freepublications/publication/keyworld2014.pdf
IEA, Medium-Term Coal Market Report, IEA/OCDE, December 2014,
https://www.iea.org/bookshop/495-Medium-Term_Coal_Market_Report_2014
IEA, World Energy Outlook 2014, IEA/OCDE, November 2014,
http://www.worldenergyoutlook.org/publications/weo-2014/
IEA, Energy Technology Perspectives, IEA/OCDE, 2014, http://www.iea.org/etp/etp2014/
IEA, Why most coal avoids a bath, 15 July 2014, http://www.iea.org/ieaenergy/issue6/why-most-coal-
avoids-a-bath.html
IEA, Understanding energy challenges in India, IEA/OCDE, 2012,
https://www.iea.org/publications/freepublications/publication/India_study_FINAL_WEB.pdf
Livemint, Lack of power demand hits NTPC in Q4, 1 June 2015,
http://www.livemint.com/Money/Da7HXF37MWKMOX3FVRPWRM/Lack-of-power-demand-hits-
NTPC-in-Q4.html
Livemint, Coal block auction bids cross Rs1.5 trillion, 9 March 2015,
http://www.livemint.com/Politics/xzmEfJHP67CcKdiPYsJryK/Coal-block-auction-bids-cross-Rs-15-
trillion.html
Livemint, Five ultra-mega power projects feature in Union Budget 2015, 28 February 2015,
http://www.livemint.com/Politics/4PHOZ3Q2sSC1JZ3gth8mfM/Budget-2015-Finance-minister-
announces-plan-for-ultra-mega.html
Lok Sabha, Question search, http://164.100.47.132/LssNew/psearch/Qtextsearch.aspx
Lok Sabha, Ministry of Coal, Answer to Question No. 4042, Production of coal, 8 August 2015,
http://164.100.47.132/LssNew/psearch/QResult16.aspx?qref=23216
Lok Sabha, Ministry of Power, Answer to Question No 2835 on power generation, 6 August 2015,
http://164.100.47.132/LssNew/psearch/QResult16.aspx?qref=22128
Lok Sabah, Ministry of Power, Answer to Question No 2908, Procurement cost of power, 6 August
2015, http://164.100.47.132/LssNew/psearch/QResult16.aspx?qref=22143
February 2016: Indian Steam Coal Imports
116
Lok Sabha, Ministry of Coal, Answer to Question No. 1712, Supply of coal, 30 July 2015,
http://164.100.47.132/LssNew/psearch/QResult16.aspx?qref=20616
Lok Sabha, Ministry of Coal, Answer to Question No. 514, Shortage of Coal, 23 July 2015,
http://164.100.47.132/LssNew/psearch/QResult16.aspx?qref=19240
Lok Sabha, Ministry of Coal, Answer to Question No. 584, Auction of coal blocks, 23 July 2015,
http://164.100.47.132/LssNew/psearch/QResult16.aspx?qref=19268
Lok Sabha, Ministry of Power, Answer to Question No. 501, Setting up of UMPP, Annex II: Details of
thermal power projects lying incomplete (under construction) in the country, 23 July 2015,
http://164.100.47.132/LssNew/psearch/QResult16.aspx?qref=19432
Lok Sabha, Ministry of Power, Answer to Question No 59, Power tariff, 23 July 2015,
http://164.100.47.132/LssNew/psearch/QResult16.aspx?qref=19191
Lok Sabha, Ministry of Power, Answer to Question No 601, Pollution from thermal power plants, 23
July 2015, http://164.100.47.132/LssNew/psearch/QResult16.aspx?qref=19438
Lok Sabha, Ministry of Power, Answer to question N° 5004, Fuel supply, 23 April 2015,
http://164.100.47.132/LssNew/psearch/QResult16.aspx?qref=16840
Mahanadi Coalfields Limited (MCL), Workshop on Technology Development for reaching 250 MT (19-
20), February 2015,
http://www.coal.nic.in/sites/upload_files/coal/files/coalupload/cil/Mahanadi%20Coalfields%20Ltd.ppt
McCloskey Coal Report (MCR), India’s NTPC issues long-term tender, 9 January 2015, MCR Issue
N° 351, and various issues
Mining Weekly, CIL shifts overseas funding to domestic markets, 28 July 2015,
http://www.miningweekly.com/article/cil-shifts-overseas-funding-to-domestic-markets-2015-07-28
Mining Weekly, Coal India aiming to double output to one-billion tons a year by 2020, 17 July 2015,
http://www.miningweekly.com/article/coal-india-aiming-to-double-output-to-one-billion-tons-a-year-by-
2020
Mining Weekly, Longwall mining making a comeback in India, 9 June 2015,
http://www.miningweekly.com/article/long-wall-mining-making-a-comeback-in-india-2015-06-09
Mining Weekly, CIL incremental production to be offered under auctioned supply linkages, 29 May
2015,
http://www.miningweekly.com/article/cil-incremental-production-to-be-offered-under-auctioned-supply-
linkages
Mining Weekly, India won’t consider free pricing regime for commercial coal miners, 13 April 2015,
http://www.miningweekly.com/article/india-wont-consider-free-pricing-regime-for-commercial-coal-
miners-2015-04-13
Mining Weekly, India’s coal block auction to be ready by June, 27 February 2015,
www.miningweekly.com/article/indias-coal-block-auction-to-be-ready-by-june-2015-02-27
Ministry of Coal (MoC), http://www.coal.nic.in/coal/index.html
MoC, Annual Report 2014-15, 2015, http://coal.nic.in/content/annual-report-2014-15
MoC, Coal supplies for power projects beyond 30.6.2015, Office Memorandum, 30 June 2015,
http://coal.nic.in/sites/upload_files/coal/files/webform/notices/300615.pdf

February 2016: Indian Steam Coal Imports
117
MoC, Minutes of the fifth meeting of the Inter-Ministerial Committee for proposed auction of coal
linkages/LoAs through competitive bidding held on 04.06.2015, Office Memorandum, 24 June 2015,
http://coal.nic.in/sites/upload_files/coal/files/webform/notices/250615.pdf
MoC, Report of the new Inter-Ministerial Task Force (IMTF) on Rationalization of sources of Coal to
Power plants, 2 February 2015,
http://www.indiaenvironmentportal.org.in/files/file/Report%20of%20the%20new%20Inter-
Ministerial%20Task%20Force%20(IMTF)%20on%20Rationalization%20of%20sources%20of%20Coa
l%20to%20Power%20Sector.pdf
MoC, Record Note of Discussions and the Recommendations of the Workshop on "The Technology
Development & Mechanization of Mines in CIL in the context of reaching 1 Billion Tonne Coal
production in 2019-20" held on 20.01.2015. 19 February 2015
MoC, Electronic Coal Projects Monitoring Portal (e-CPMP), 2015,
https://esuvidha.gov.in/coal/index.php
MoC, Government Opens A New Chapter in Coal Sector; Process of e-Auction gets Underway, 31
December 2014, http://pib.nic.in/newsite/mbErel.aspx?relid=114221
MoC, Meeting of the IMC to formulate a policy on coal rejects allocation for washery reject based
power plants – reg, Office memorandum, 7 November 2014,
http://coal.nic.in/sites/upload_files/coal/files/webform/notices/101114.pdf
MoC, Report of the Working Group on coal and lignite for formulation of the twelfth five year plan
(2012-2017), 2011, http://planningcommission.nic.in/aboutus/committee/wrkgrp12/wg_Coal1406.pdf
Ministry of Commerce & Industry, Import Export Data Bank, http://commerce.nic.in/eidb/icomq.asp
Ministry of Environment, Forests and Climate Change (MoEF), Office Memorandum J11013/5/2010-IA
II, 1 September 2014,
http://www.moef.gov.in/sites/default/files/Chandrapur_OM%20dated%2001.09.2014.pdf
MoEF, Guidelines for granting Environment Clearance for expansion of Coal Mining Projects involving
one time Production Capacity Expansion in the existing operation - reg., OFFICE MEMORANDUM
No. J-IIOI5/30/2004-IA.I1 (M), 28 July 2014,
http://www.moef.nic.in/sites/default/files/OM%20dated%2028.07.2014%20one%20time%20expansion
MoEF, Office Memorandum, F.No. J-11013/41/2006-IA-II (I), 5 February 2013
Ministry of Power (MoP), http://powermin.nic.in/
MoP, CO2 emissions from thermal power plants, Statement at Rajya Sabha, 27 April 2015,
http://powermin.nic.in/upload/pdf/RS_27072015_Eng.pdf
MoP, Import of coal target for the year 2015-16 –reg, Office Memorandum, 30 March 2015,
http://www.cea.nic.in/reports/planning/coal_import_1516.pdf
MoP, ‘Initiatives to Improve the Efficiency of Coal Based Power Plants’, 12 March 2015,
http://pib.nic.in/newsite/PrintRelease.aspx?relid=116893
MoP, Status of UMPP, 9 March 2015, http://www.pib.nic.in/newsite/erelease.aspx?relid=25644
Money Control, Reliance Power to sell off three Indonesian coal mines, 1 October 2015,
www.moneycontrol.com/news/business/reliance-power-to-sell-off-three-indonesian-coal-
mines_3354861.html?utm_source=ref_article
February 2016: Indian Steam Coal Imports
118
Money Control, Rupee may weaken more on China currency depreciation: Citi, 13 August 2015,
http://www.moneycontrol.com/news/rupee/rupee-may-weaken-morechina-currency-depreciation-
citi_2504561.html?utm_source=ref_article
Money Control, Coal auctions: Govt raises Rs 4,364 crore in third round, 14 August 2015,
http://www.moneycontrol.com/news/economy/coal-auctions-govt-raises-rs-4364-crorethird-
round_2512981.html?utm_source=ref_article
Money Control, Govt allots 38 coal mines to central, state PSUs, 24 March 2015,
http://www.moneycontrol.com/news/economy/govt-allots-38-coal-mines-to-central-state-
psus_1338504.html?utm_source=ref_article
Motilal Oswal, Coal India: Share of higher margin volumes to rise sharply, 20 August 2015,
http://www.motilaloswal.com/Financial-Services/Research/Detailed-Report/Company-Updates/13832
MSTC Limited, Coal mine allocation, 2014 and 2015,
http://www.mstcecommerce.com/auctionhome/coalblock/index.jsp
National Transport Development Policy Committee (NTDPC), Transportation of energy commodities,
2013, http://tripp.iitd.ernet.in/publications/NTDPC/Vol%2002-
2/NTDPC%20Vol%2002_Part%202%20Ch%2008.pdf
NDTV, Government Rejects Low Winning Bids for 4 'Outlier' Coal Mines, 21 March 2015,
http://profit.ndtv.com/news/industries/article-government-rejects-low-winning-bids-for-4-outlier-coal-
mines-748453
New Indian Express, Coal India Asked to Light up 30 Ongoing Power Projects, 31 March 2015,
http://www.newindianexpress.com/business/news/Coal-India-Asked-to-Light-up-30-Ongoing-Power-
Projects/2015/03/31/article2738644.ece
New Indian Express, MoEF Eases Norms for Coal Mining Projects, 4 September 2014,
http://www.newindianexpress.com/nation/MoEF-Eases-Norms-for-Coal-Mining-
Projects/2014/09/04/article2413949.ece
Nikkei Asian Review, Modi looks to double coal production by 2020, 3 April 2015,
http://asia.nikkei.com/Politics-Economy/Policy-Politics/Modi-looks-to-double-coal-production-by-
2020?n_cid=NARAN012
Niti Aayog, India Energy Security Scenarios, 2047 Version 2.0, Call for evidence, June 2015,
http://niti.gov.in/mgov_file/Call%20for%20Evidence-IESS%20V2/Call_for_evidence_15.06.pdf
Niti Aayog, Infrastructure: Powering Growth through Connectivity, May 2015,
http://niti.gov.in/mgov_file/presentations/infrastructure-slides.pdf
NTPC Limited, http://www.ntpc.co.in/
NTPC Limited, Presentation at the 11th Analysts & Investors Meet held at Mumbai on 03/08/2015, 3
August 2015, http://www.ntpc.co.in/presentations/4215/ntpcinvestorpresentation-03-08-2015
NTPC Limited, Blending of imported/high grade coal with domestic coal,
http://www.eecpowerindia.com/codelibrary/ckeditor/ckfinder/userfiles/files/Blending%20of%20Imprted
%20%26%20Domestic%20Coals%20-%20Mr_%20I_K%20Rajdeva.pdf
Orissa Diary, MoU signed between Odisha govt Coal, Railway ministries for implementation of
common rail corridor projects for coal evacuation, 20 April 2015,
http://www.orissadiary.com/CurrentNews.asp?id=58783#sthash.rcKmxDSi.dpuf
Oxford Institute for Energy Studies (OIES), Gas Pricing Reform in India – Implications for the Indian
gas landscape, April 2015, http://www.oxfordenergy.org/2015/04/gas-pricing-reform-in-india-
implications-for-the-indian-gas-landscape-2/
February 2016: Indian Steam Coal Imports
119
OIES, Energy in India, 9 March 2015, Oxford Energy Forum, Issue 99,
http://www.oxfordenergy.org/wpcms/wp-content/uploads/2015/03/OEF-99.pdf
OIES, China’s coal market: Can Beijing tame “King coal”?, CL1, December 2014,
http://www.oxfordenergy.org/2014/12/chinas-coal-market-can-beijing-tame-king-coal-2/
Planning Commission, Twelfth five year plan (2012-2017), Economic sectors, Volume II,
http://planningcommission.gov.in/plans/planrel/12thplan/pdf/12fyp_vol2.pdf
Platts, Indian utilities' Apr-Jun coal imports down 4% on year to 21.5 mil mt, 17 July 2015,
http://www.platts.com/latest-news/coal/newdelhi/indian-utilities-apr-jun-coal-imports-down-4-
26151475
Platts, India’s coal industry, 27 May 2015, http://www.platts.com/news-feature/2015/coal/india-coal-
transport/index?wt.mc_id=coap201505we_indiarail&wt.tsrc=eloqua
Platts, New schemes to transport coal in India, 27 May 2015, http://www.platts.com/news-
feature/2015/coal/india-coal-transport/transport-schemes
Prayas (Energy Group), Largesse that wasn’t: the story of coal shortages in India, March 2014,
http://www.indiaenvironmentportal.org.in/files/file/Coal_Shortages_Report.pdf
PRS Legislative Research, The Compensatory Afforestation Fund Bill, 2015, 29 May 2015,
http://www.prsindia.org/uploads/media/Compensatory%20Afforestation/Bill%20Summary-
%20Compensatory%20Afforestation.pdf
PRS Legislative, Coal Block Allocations and the 2015 Bill, 7 March 2015,
http://www.prsindia.org/theprsblog/?p=3487
PRS legislative, The Right to Fair Compensation and Transparency in Land Acquisition, Rehabilitation
and Resettlement (Amendment) Bill, 2015, March 2015,
http://www.prsindia.org/administrator/uploads/media/Land%20and%20R%20and%20R/Bill%20Summ
ary%2019%20LARR%20Bill%202015.pdf
PRS Legislative, The Mines and Minerals (Development and Regulation) Amendment Ordinance,
2015 http://www.prsindia.org/billtrack/the-mines-and-minerals-development-and-regulation-
amendment-ordinance-2015-3601/
PVTech, India to build green energy corridors, 8 June 2015, http://www.pv-
tech.org/news/india_to_build_green_energy_corridors
PwC for the Indian Chamber of Commerce, The Indian coal sector: Challenges and future outlook,
November 2012, https://www.pwc.in/assets/pdfs/industries/power-mining/icc-coal-report.pdf
Rediff.com, Govt to tap private sector to meet 1.6 bn tonne coal demand, 20 December 2014,
http://www.rediff.com/money/report/govt-to-tap-private-sector-to-meet-16-bn-tonne-coal-
demand/20141220.htm
Responding to Climate Change (RTCC), Coal mining banned in India’s Mahan forest, 25 March 2015,
http://www.rtcc.org/2015/03/24/coal-mining-banned-in-indias-mahan-forest
Reuters, China August coal imports drop nearly 18 pct on month, 8 September 2015,
http://www.reuters.com/article/2015/09/08/china-economy-trade-coal-idUSL4N11E1P920150908
Reuters, India coal imports flat in June as local supply jumps –trade, 2 July 2015,
http://af.reuters.com/article/energyOilNews/idAFL3N0ZI40M20150702
Reuters, India to eclipse China as top coal importer in 2015, 20 May 2015,
http://in.reuters.com/article/2015/05/20/india-china-coal-idINKBN0O51CD20150520

February 2016: Indian Steam Coal Imports
120
Reuters, Coal imports jump 34 percent in 2014/15, 14 April 2015,
http://in.reuters.com/article/2015/04/14/india-coal-imports-idINKBN0N50ZM20150414
Reuters, Piyush Goyal Says Possible to Stop Imports of Thermal Coal in 2-3 Years, 12 November
2014, http://profit.ndtv.com/news/industry-papers/article-piyush-goyal-says-possible-to-stop-imports-
of-thermal-coal-in-2-3-years-692265
Reuters, Power minister says $250 billion needed to tackle energy crunch, 6 November 2014,
http://in.reuters.com/article/2014/11/06/india-energy-investment-idINKBN0IQ0AK20141106
Source Watch, Indian company investments in overseas coal mines,
http://www.sourcewatch.org/index.php/Indian_company_investments_in_overseas_coal_mines
The Hindu, NTPC to finalise bids for Pudimadaka plant, 8 July 2015,
http://www.thehindu.com/news/cities/Visakhapatnam/ntpc-to-finalise-price-bids-for-pudimadaka-
plant/article7397023.ece
The Hindu, NTPC Pudimadaka project cleared by MoEF, 25 March 2015,
http://www.thehindu.com/news/cities/Hyderabad/tor-for-ntpc-pudimadaka-project-cleared-by-
moef/article7032086.ece
Times of India, Frame own land law: Panagariya to states, 11 September 2015,
http://timesofindia.indiatimes.com/india/Frame-own-land-law-Panagariya-to-
states/articleshow/48907137.cms
Times of India, India plans to have more clean coal technologies- Minister, 29 April 2015,
http://timesofindia.indiatimes.com/home/environment/developmental-issues/India-plans-to-have-more-
clean-coal-technology-Minister/articleshow/47099312.cms
Times of India, NTPC to bring down coal import bill to nil in 5 years, 6 April 2015,
http://timesofindia.indiatimes.com/business/india-business/NTPC-to-bring-down-coal-import-bill-to-nil-
in-5-years/articleshow/46824586.cms
Times of India, India raises coal import by 35% to aid power plants, 5 April 2015
http://timesofindia.indiatimes.com/city/chennai/India-raises-coal-import-by-35-to-aid-power-
plants/articleshow/46809633.cms
Times of India, CIL will double capex to Rs 10,000 crore in FY16 to meet production target, 27 March
2015, http://timesofindia.indiatimes.com/business/india-business/CIL-will-double-capex-to-Rs-10000-
crore-in-FY16-to-meet-production-target/articleshow/46714064.cms
Times of India, India to invest $4 billion to tackle power theft, 21 November 2014,
http://timesofindia.indiatimes.com/business/india-business/India-to-invest-4-billion-to-tackle-power-
theft/articleshow/45227741.cms
Urbanemissions, Thermal Power Plants - Emissions and Health Impacts of India's Coal Expansion,
April 2015,
http://www.urbanemissions.info/images/UEI/publications/draft%20Notification%20for%20public%20co
mments%20for%20the%20Coal%20TPP.pdf
UNFCC, India’s intended nationally determined contribution,
http://www4.unfccc.int/submissions/INDC/Published%20Documents/India/1/INDIA%20INDC%20TO%
20UNFCCC.pdf
Ventura, Government mulls common coal trading platform for Coal India and private companies, 23
June 2015,
http://content1.acesphere.com/newscontentventura/NewsDetailsPointer.aspx?NewsId=381084&SecId
=7&subsecId=15

February 2016: Indian Steam Coal Imports
121
World Bank, Global Economic Prospects, June 2015,
http://pubdocs.worldbank.org/pubdocs/publicdoc/2015/9/961521443473555360/Global-Economic-
Prospects-June-2015-Global-economy-in-transition.pdf
World Bank, India development update: towards a higher growth path, April 2015,
http://www.worldbank.org/en/news/press-release/2015/04/28/economy-upturn-india-unlock-
investments-accelerate-growth
World Bank, Beyond Crisis, The financial performance of India’s power sector, November 2014,
http://www-
wds.worldbank.org/external/default/WDSContentServer/WDSP/IB/2014/11/10/000333037_20141110
051145/Rendered/PDF/924900PUB0978100Box385375B00PUBLIC0.pdf
X-rates, http://x-rates.com
4-traders.com, Mozambique mine eating into assets of ICVL, Tata’s, 13 April 2015, http://www.4-
traders.com/TATA-STEEL-LIMITED-9058836/news/MOZAMBIQUE-MINE-EATING-INTO-ASSETS-
OF-ICVL-TATAS-20193549/
4-traders.com, Singareni eyes coal mines abroad, 11 April 2015, http://www.4-traders.com/COAL-
INDIA-LTD-9060008/news/Coal-India--Singareni-eyes-coal-mines-abroad-20181100/