Indian home textile consumers are special: Strategies to meet their expectations.
25
Indian home textile consumers are special: Strategies to meet their expectations.
-
Upload
sibyl-fleming -
Category
Documents
-
view
217 -
download
2
Transcript of Indian home textile consumers are special: Strategies to meet their expectations.

Indian home textile consumers are special:
Strategies to meet their expectations.
Indian Retail R e f l e c t I o n s
(Source: Images – KSA Technopak Study, 2005-06)
2nd Most Attractive Developing market, ahead of China
Ranked 5th amongst the 30 “Emerging Markets” for new retailers to enter
Country with the Largest Youth population in the world- (around 80%) Over 867 million people below 45 years of age!
Indian English Linguals more than the whole of Europe put together
Over 300 million middle class - the Real consumers - is catching the attention of the world
Over 600 million Effective Consumers by 2010
India to emerge as one of the Largest Consumer Markets of the world by 2010

Indian Retail Story
India – One of the Largest Consumer Base with Diverse Charachteristics
Emerging demographic dispersion favors migration to organized retail transactions – across segments
Limited History makes it Dynamic Iterative Evolution
Late participant among the Emerging Market Peer set – to witness a compressed cycle of evolution
Business of making lesser mistakes and correcting the ones made quickly!!!
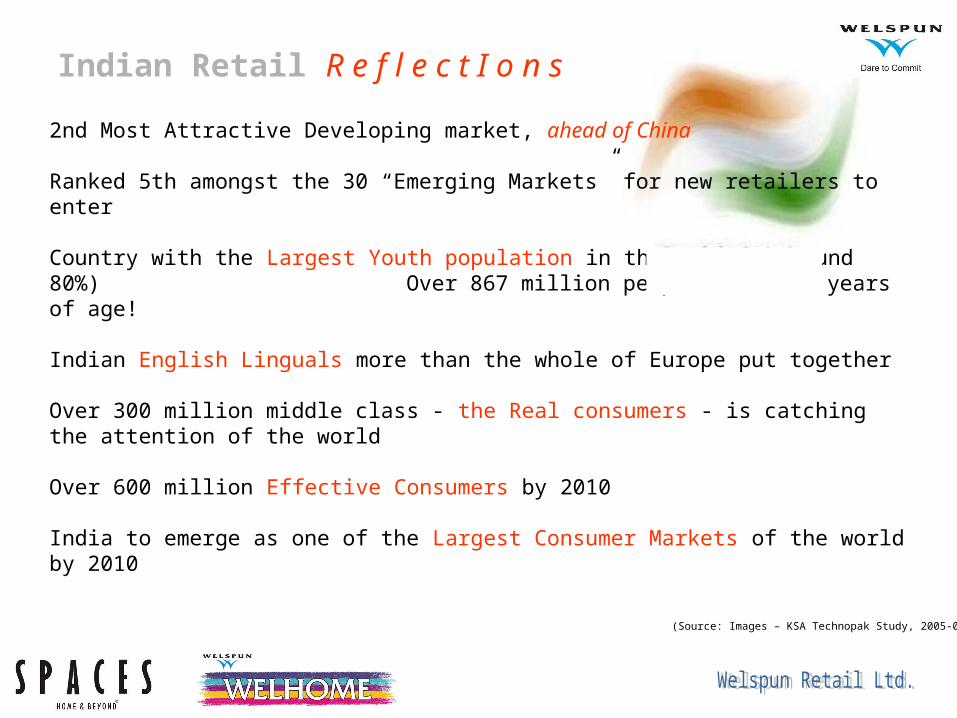
Growth Drivers
Demographic inversion-Average age of an Indian homeowner has fallen to 27 from 40 yearsin the last decade
Demographic inversion-Average age of an Indian homeowner has fallen to 27 from 40 yearsin the last decade Growth of nuclear family
set up leading to shift in preference of home decoration
Growth of nuclear family set up leading to shift in preference of home decoration
Increase in Urbanization and changing fashion concepts
Increase in Urbanization and changing fashion concepts
Increase in number of working women, hence change in the outlook andtastes as also emergence of dual income households
Increase in number of working women, hence change in the outlook andtastes as also emergence of dual income households
Housing boom - An estimated 2.5 Mn new
homes are required every year
Housing boom - An estimated 2.5 Mn new
homes are required every year
Increase in re-location of people for professional & other reasons
Increase in re-location of people for professional & other reasons
GROWTH DRIVERS

804
300
1133
427
1721
637
0
200
400
600
800
1000
1200
1400
1600
1800
GDP Retail Market
2006 2010 2015
All
fig
ure
s i
n U
S$
Bil
lio
ns
Organized retail industry is growing at more than 30% p.a
Source: Technopak Analysis, CSO, BRIC report
All Figures in Current Prices
Indian Retail T h e O p p o r t u n i t y

Organized RetailOrganized Retail
2006 2010
Unorganized Retail Unorganized Retail
Organized retail expected to gain 13% additional share over next five years
Source: Technopak Analysis
97%
3%
16%
84%
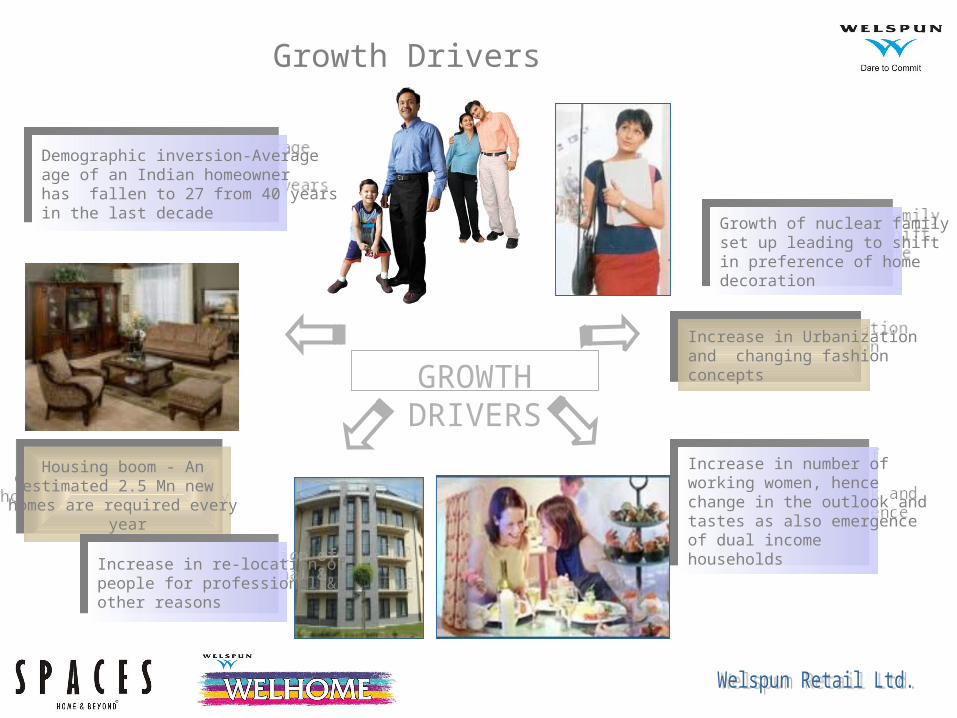
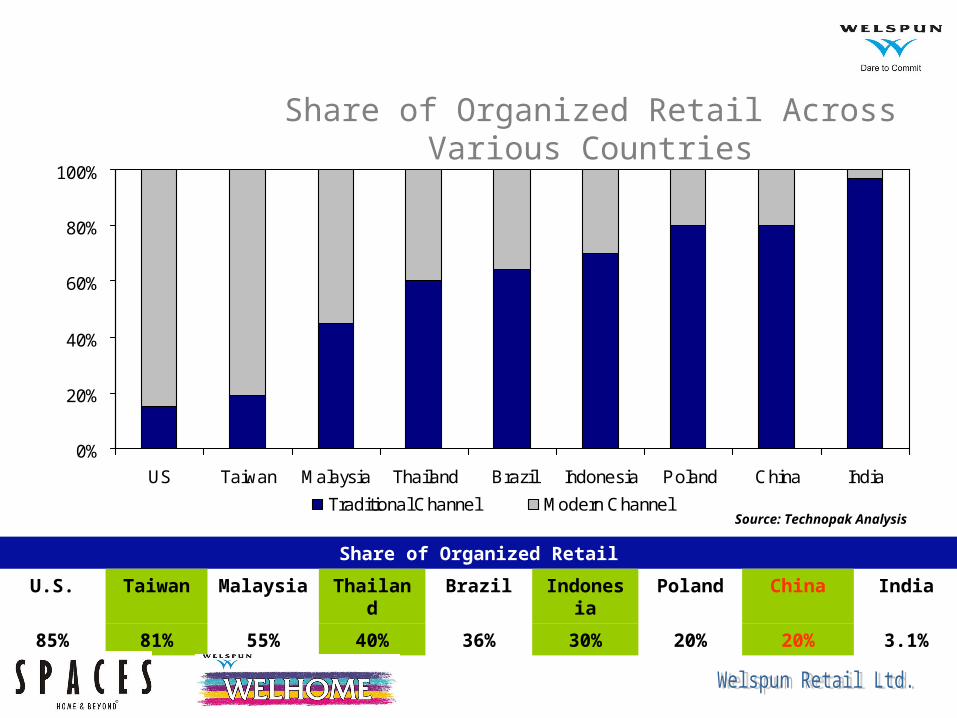
Indian Retail O r g a n i z e d
0%
20%
40%
60%
80%
100%
US Taiwan Malaysia Thailand Brazil Indonesia Poland China India
Traditional Channel Modern Channel
Share of Organized Retail Across Various Countries
Share of Organized Retail
U.S. Taiwan Malaysia Thailand
Brazil Indonesia
Poland China India
85% 81% 55% 40% 36% 30% 20% 20% 3.1%
Source: Technopak Analysis

Structural Growth Drivers
Different Stages in Growth of Organized Retail in India
Source: Paper on Indian Urban Retail
Gro
wth
First Gear 1995
Second Gear2004
Third Gear2007
Fourth Gear2012
New Retail Entrants Driving Growth
Consumers demand organised formats
Retailers strengthening
back end system
Retailers going globalLifestyle Retailing
Value Retailing
Create Awareness
Increase Customer Expectation
Strengthening Back-end Management
Consolidation

Indian Retail The Opportunity
Current Indian Retail Industry estimated to be at USD 300 billion
Retail Industry growing @ 5-6% p.a.
Organized Retail is at barely 3 % of the Total Retail Scenario
However it is growing @ over 30 % p.a.
Highest density of Retail Outlets in the world (12 million +)
However majority of these outlets have “shrink size” retail footage
Organized Retail is here to stay – “Key Advantages”Wide spectrum of choices in each category under one roofLocational Suitability (Accessibility & Size)Economies of Size translating into “price cuts” to the end user
Organized Retail is going to rock !! – Expected Investment commitments of over USD 25 billion in the next 5 years speak about its mammoth potential
Source: Technopak Analysis, WRL Analysis & Industry sources)

Home Retail In Focus
Home Retail is currently estimated to be at INR 9300 crore
Organized market accounts for around 6 % of the Total Home Retail
This translates into a meagre INR 550 crore + Organized Home Retail presence
However our analysis shows that the Potential for Organized Home Retail in India is over INR 8,000 crore by 2011-12
Thus a ‘Huge Potential’ of over USD 1.5 bn !!
And thus a “Great Opportunity” to foray into given thatUnorganized Local Players dominate the market - Major focus on FurnishingsNational Department Stores though present are weak in the Home category; their product profile ignores furnishings though it is a prime category with the exception of Atmosphere which caters only to Furnishings
i n f o c u s

Bath Rs 1200 Cr 13%
Curtains Rs 1000 Cr
11%
Upholstery Rs 1000 Cr, 11%
Kitchen Rs 300Cr
3%
Bed Rs 5000Cr
53%
Others, Rs 800Cr.
9%
Home Furnishings Market Size And Growth
• Urban home textiles market is estimated to be Rs 9,300 Crores
and expected to grow to Rs 20,000 Crores by 2011. Only 6% of
the market is organized.
• Bed and Bath constitute about two thirds of the market.Home Furnishing Market Size Breakup
Source: Technopak Analysis

Home Furnishings Retail Market
Structure Home Furnishing Market
Organized Market Un-organized Market
General Retailers Category SpecificRetailers
Small Niche Players(2,000-3,000 Sqft)
AUOR(5,000-10,000 Sqft)
Hypermarkets
Department Stores
Others
Small Niche Players(2,000-3,000 Sqft)
Street Markets
94%
share of market

Home Furnishings Retail Market Structure
• Retailers like Maspar, Bombay Dyeing, Welspun, Atmosphere etc. are slowly organizing the home textiles retail business especially in the metro and mini metro cities.
Unorganized• Targeted towards mass market
• Crammed and clumsy store frontage
• More emphasis on price than towards quality of merchandise
Organized• Targeted towards medium and high
end
• Emphasis on visual merchandising, branding and retail imagery and quality of merchandise on offer.

Home Furnishings Retail Market Structure
• Unorganized players are mostly in small size stores (<1000 sq ft.) selling unbranded products or export surplus. These stores are typically in high streets or furniture markets but lack any “quality retail” positioning or imagery.
Unorganized• Cluttered product display
• Dependence on store staff for showing products
Organized• In-store Visual Merchandising and
Ambience
• Emphasis on product display and customer service

Fluid Landscape
(Home Retail)Market Evolution
Retailer EvolutionBuyer Evolution
200 Mn + Households
% Spend on Home – insignificant currently –
Home is dominant high-ticket segment and hence needs special attention
Categories of preference are yet to get fully defined – making it an Iterative process
How does one buy?
What Matters to him/her!!!
What drives the Purchase – Utility/ Value/ Fashion
The Right Price Points!!!
Buying Habits and Merchandise preference are still to evolve – an iterative process
How to be consistent? Positioning/ Experience/ Delivery
How To be Relevant? Location/ Formats / Channels
How To Churn MONEY? Cash/ Profits/ ROI
Early stage of rollout-makes it an iterative process across all key variables.
Revolution~ Rapid Simultaneous Iterations Towards Change

Market Evolution
Fragmented,
Unorganized,
Limited Categories…
Consolidation,
Organization,
Wider Categories…
Forward & Backward Integration,
Strategic Complementary Initiatives
Matured Categories…
Pote
nti
al S
ale
s
Local Tier IRegional National Trade Blocs
Global
Tier I--III
WRL

Buyer Evolution
WRL
Suspect Prospect First Timer Repeat Loyal Advocate
Comes by Chance…
Comes by Choice…
Comes by Compulsion…
Right Location
Right Positioning
Right Merchandise Mix- Depth- Width
Right-Priced Merchandise
Differentiated Service/ Experience
Continuous Innovation
Avera
ge T
icket
Siz
e
(ATS
)

Retailer Evolution
WRL
Retu
rn o
n I
nvestm
en
t (R
OI)
COMPETE
COMPLEMENT
COMPLETE
No Defined Formats Format Refinement Defined Formats
Erratic Delivery Mechanism
Evolved Supply Chain Management
Product Focus & Awareness
Build Positioning & Merchandise to fit that Positioning
Take-Off with Refined Positioning & Continuous Innovation
Refined Supply Chain Management
Informal Organization
Learning Organization
Knowledge Organization

Welspun Retail Ltd…The Story so far
Novice… Reactive Participant…
Adaptive Player…
Proactive Veteran…
No Prior History
Presence of a few Established Home Brands
Different Untested Proposition
Format Refinements
Intuitive Site Selection
Merchandise Experiments
Scientific Revisit of –
• Formats
• Locations
• Brands
Segmentation
- Value
• WELHOME
- Lifestyle
• SPACES
Defined Source-code for
• Site Selection
• Merchandise
• Formats
• Pricing
Modular approach to build scale

Who is your TARGET?The one who BUYS
it ?The one who DECIDES to buy it ?
The one who USES it ?
BUYER DECISION
MAKER END USER
Challenge is to aim 3 Birds with 1 Arrow !
Sensory Appeal
Mind Share
Wallet Share

There is a fabric for every space and a space for every fabric. There is a reason to decorate, or perhaps spontaneity. For all of this, simple, elaborate, beautiful, functional and a vivid sense of
style, there is
Spaces, Home and Beyond celebrates the joie- de vivre of a young
professional, home maker and entertainer...
fulfilling the aspirations of a decorator as an Individual or Family. The brand targets
the middle and upper middle class of India’s Metros.
We retail through 2 flagship stores, MBO’s and Shop in Shops: Lifestyle, Shoppers
Stop and @ Home
The brand dwells on the many manifestations of our heritage, craftsmanship, ever evolving pioneers, maverick and bohemian tempraments. Indian perhaps, always Modern though and certainly International.


Welspun Retail Ltd…Our thoughts
SPACES – 3 %
WELHOME –22 %
A Booming Opportunity !!
SPACES – 6 mn Households
WELHOME – 46mn Households
200 mn + Households

A Multi-Dimensional Boom
Talent Boom
Real EstateBoom
Process Boom
Capital Boom
Retail Boom

FinallyHow we define a Home is evolving each day…
How we define a Home Maker is evolving each day…
How we define Home Products is evolving each day…
Home Retailers who are poised to deal with this evolving phase will strike a
Home-Run
thank you