Indian Cement Industry Outlook: Business … Indian Cement Industry Outlook: Business Opportunities...
17
www.bricdata.com Indian Cement Industry Outlook: Business Opportunities and Future Growth Potential to 2016 Industry Forecast Report Reference code: CN0509MR Published: June 2012 BRICdata John Carpenter House 7 Carmelite Street London EC4Y 0BS United Kingdom Tel: +44 (0) 20 7936 6400 Fax: +44 (0) 20 7336 6813 www.bricdata.com
Transcript of Indian Cement Industry Outlook: Business … Indian Cement Industry Outlook: Business Opportunities...

www.bricdata.com
Indian Cement Industry Outlook:
Business Opportunities and
Future Growth Potential to 2016
Industry Forecast Report
Reference code: CN0509MR
Published: June 2012
BRICdata
John Carpenter House
7 Carmelite Street
London EC4Y 0BS
United Kingdom
Tel: +44 (0) 20 7936 6400
Fax: +44 (0) 20 7336 6813
www.bricdata.com
EXECUTIVE SUMMARY
Indian Cement Industry Outlook: Business Opportunities and Future Growth Potential to 2016 Page 2
© BRICdata. This product is licensed and is not to be photocopied Published: June 2012
1 Executive Summary
Market size and growth potential
The Indian cement industry is expected to value INRX trillion (US$XX billion) in 2012, after recording an annual
growth rate of X%. The industry increased in value at a compound annual growth rate (CAGR) of XX% during the
review period (2007–2011), and is projected to grow at a CAGR of XX% over the forecast period (2012–2016), to
reach INRX trillion (US$XX billion) in 2016. This growth is primarily attributed to the government’s high level of
infrastructure spending, and the country’s increasing number of residential and commercial construction
activities.
The refractory cements, mortars and concretes is expected to remain the largest product category in cement
industry over the forecast period. This category was also the fastest-growing category during the review period,
after recording a CAGR of XX%. However, prefabricated structural components is projected to be the fastest-
growing cement category over the forecast period, after recording an anticipated CAGR of XX%.
Trends
Builders have traditionally preferred to use on-site mix rather than ready-mixed concrete, although the use of
ready-mix concrete is increasing as the industry dynamics are changing. The acceptance of ready-mixed cement
is particularly strong in urban centers. The reliability of supply and consistent quality of ready-mixed concrete are
the main reasons for the increasing popularity of the product, as these product qualities improve the productivity
of builders. Leading Indian cement suppliers, such as Lafarge, are capitalizing on the increasing demand for
ready-mixed concrete in the country.
The Indian cement industry is expected to become more consolidated over the forecast period. Large companies
are acquiring small firms, mostly regional firms, to increase their presence across the country and gain instant
access to more production facilities. Meanwhile, smaller firms are exiting the industry due to either attractive
acquisition deals from large companies or due to the difficulty in sustaining operations following rising input costs.
The Indian cement industry transformed notably during the last two decades as a result of the increased adoption
of energy-efficient technologies and processes. Around 93% of the total cement industry capacity utilizes
environmentally friendly dry process technology.
Growth drivers
Shorter deadlines for builders to complete projects, labor shortages, space constraints in large cities, the growing
need for mechanization and the backlog of infrastructure projects are the main factors driving the increased use
of ready-mixed concrete (RMC) in India. Large township projects in the suburbs of India’s leading cities where IT
zones are prominent are also generating more demand for RMC. Upcoming infrastructure projects, including
energy, roads, ports and airport projects, across India will continue to drive the growth of RMC in India over the
forecast period.
The Indian government invested US$XXX billion on infrastructure during the Eleventh Five-Year Plan (2007–
2012) and revealed plans to invest a further US$X trillion on infrastructure during the Twelfth Five-Year Plan
(2012–2017). The large-scale investment on various infrastructure projects, including roads, railways, bridges
and ports, will generate a huge demand for cement over the forecast period.
The total investment in real estate is projected to reach US$X trillion over the forecast period. This high level of
investment indicates the large demand for residential, retail and commercial real estate. There is also demand for
hotel accommodation and better infrastructure in the country. This will drive the growth of the cement industry in
India over the forecast period.
Competitive landscape
The Indian cement industry is fragmented and contains a few large producers and several regional and small-
sized companies. Although there is already surplus capacity in the industry, leading cement producers are
expected to expand their production capacity over the forecast period. The majority of Indian cement producers
are regionally focused and only two companies, Holcim and Aditya Birla Group, conduct operations across the
whole of India.
EXECUTIVE SUMMARY
Indian Cement Industry Outlook: Business Opportunities and Future Growth Potential to 2016 Page 3
© BRICdata. This product is licensed and is not to be photocopied Published: June 2012
Regulations
Up to 100% foreign direct investment (FDI) is allowed in the Indian mining industry under the automatic route for
cement production. The Ministry of Mines regulates the country’s mining industry, while the regional states own
the minerals in their respective territories.
TABLE OF CONTENTS
Indian Cement Industry Outlook: Business Opportunities and Future Growth Potential to 2016 Page 4
© BRICdata. This product is licensed and is not to be photocopied Published: June 2012
TABLE OF CONTENTS
1 Executive Summary .................................................................................................................................. 2 2 BRIC Comparison ..................................................................................................................................... 8
2.1 Market Opportunity ..................................................................................................................................... 8
2.2 Macroeconomic Drivers .............................................................................................................................. 9
3 Analyst Opinion and Future Outlook .................................................................................................... 10 4 Cement Industry Market Dynamics ....................................................................................................... 12
4.1 Key Trends and Emerging Areas .............................................................................................................. 12
4.2 Imports and Exports .................................................................................................................................. 14
4.2.1 Total cement industry................................................................................................................................ 14
4.2.2 Cement clinker .......................................................................................................................................... 15
4.2.3 Factory-made mortars............................................................................................................................... 16
4.2.4 Portland cement ........................................................................................................................................ 17
4.2.5 Refractory cements, mortars and concrete .............................................................................................. 18
4.2.6 Other hydraulic cements ........................................................................................................................... 19
4.2.7 Ready-mixed concrete .............................................................................................................................. 20
4.2.8 Prefabricated structural components ........................................................................................................ 21
5 Analysis of Market Drivers ..................................................................................................................... 22
5.1 Economic Drivers ...................................................................................................................................... 22
5.2 Business Drivers ....................................................................................................................................... 26
6 Cement Industry Opportunity and Future Potential ............................................................................ 27
6.1 Cement Industry Market Size and Forecast ............................................................................................. 27
6.2 Breakdown by Category............................................................................................................................ 30
6.2.1 Cement clinker .......................................................................................................................................... 30
6.2.2 Factory-made mortars............................................................................................................................... 32
6.2.3 Portland cement ........................................................................................................................................ 34
6.2.4 Refractory cements, mortars and concrete .............................................................................................. 36
6.2.5 Other hydraulic cements ........................................................................................................................... 38
6.2.6 Ready-mixed concrete .............................................................................................................................. 40
6.2.7 Prefabricated structural components ........................................................................................................ 42
6.3 Capacity Utilization ................................................................................................................................... 44
6.3.1 Existing capacity ....................................................................................................................................... 44
6.3.2 Capacity addition in future ........................................................................................................................ 44
7 Industry Structure and Competitive Landscape .................................................................................. 45
7.1 Industry Structure ...................................................................................................................................... 45
7.2 Leading Companies .................................................................................................................................. 46
7.3 Porter Five Forces Analysis ...................................................................................................................... 47
8 Business and Operational Strategy ...................................................................................................... 48
8.1 Regulation ................................................................................................................................................. 48
8.2 Market Entry Strategy ............................................................................................................................... 49
8.3 Growth Strategy ........................................................................................................................................ 50
8.4 Operational Strategy ................................................................................................................................. 51
TABLE OF CONTENTS
Indian Cement Industry Outlook: Business Opportunities and Future Growth Potential to 2016 Page 5
© BRICdata. This product is licensed and is not to be photocopied Published: June 2012
9 Appendix .................................................................................................................................................. 52
9.1 About BRICdata ........................................................................................................................................ 52
9.1.1 Areas of expertise ..................................................................................................................................... 52
9.2 Methodology ............................................................................................................................................. 53
9.3 Definitions ................................................................................................................................................. 54
9.4 Disclaimer ................................................................................................................................................. 54
TABLE OF CONTENTS
Indian Cement Industry Outlook: Business Opportunities and Future Growth Potential to 2016 Page 6
© BRICdata. This product is licensed and is not to be photocopied Published: June 2012
LIST OF FIGURES
Figure 1: BRIC Countries’ Cement Industry Comparison, 2007–2016 .................................................................................................... 8 Figure 2: Indian Cement Industry Outlook, 2011–2016 ......................................................................................................................... 10 Figure 3: Indian Installed Cement Production Capacity by Region (% Share), FY2009−2010 ............................................................ 12 Figure 4: Indian Cement Industry Imports and Exports (INR Million), 2007–2011 ............................................................................... 14 Figure 5: Indian Cement Clinker Imports and Exports (INR Million), 2007–2011 ................................................................................. 15 Figure 6 Indian Factory-Made Mortars Imports and Exports (INR Million), 2007–2011 ....................................................................... 16 Figure 7: Indian Portland Cement Imports and Exports (INR Million), 2007–2011 ............................................................................... 17 Figure 8: Indian Refractory Cements, Mortars and Concrete Imports and Exports (INR Million), 2007–2011 ................................... 18 Figure 9: Indian Other Hydraulic Cements Imports and Exports (INR Million), 2007–2011 ................................................................. 19 Figure 10: Indian Ready-Mixed Concrete Imports and Exports (INR Million), 2007–2011 ................................................................... 20 Figure 11: Indian Prefabricated Structural Components Imports and Exports (INR Million), 2007–2011 .......................................... 21 Figure 13: Indian Urban and Rural Population (%), 2007–2016 ............................................................................................................ 23 Figure 14: Indian Construction Net Output (US$ Billion), 2007–2016................................................................................................... 24 Figure 15: Indian Number of Households (Million), 2007–2016 ............................................................................................................ 25 Figure 17: Indian Cement Industry Market Size by Category (INR Billion), 2012–2016 ....................................................................... 29 Figure 18: Indian Cement Industry – Cement Clinker (INR Billion), 2007–2011 ................................................................................... 30 Figure 19: Indian Cement Industry – Cement Clinker (INR Billion), 2012–2016 ................................................................................... 31 Figure 20: Indian Cement Industry – Factory-Made Mortars (INR Billion), 2007–2011 ........................................................................ 32 Figure 21: Indian Cement Industry – Factory-Made Mortars (INR Billion), 2012–2016 ........................................................................ 33 Figure 22: Indian Cement Industry – Portland Cement (INR Billion), 2007–2011................................................................................. 34 Figure 23: Indian Cement Industry – Portland Cement (INR Billion), 2012–2016................................................................................. 35 Figure 24: Indian Cement Industry – Refractory Cements, Mortars and Concrete (INR Billion), 2007–2011 ..................................... 36 Figure 25: Indian Cement Industry – Refractory Cements, Mortars and Concrete (INR Billion), 2012–2016 ..................................... 37 Figure 26: Indian Cement Industry – Other Hydraulic Cements (INR Billion), 2007–2011................................................................... 38 Figure 27: Indian Cement Industry – Other Hydraulic Cements (INR Billion), 2012–2016................................................................... 39 Figure 28: Indian Cement Industry – Ready-Mixed Concrete (INR Billion), 2007–2011 ....................................................................... 40 Figure 29: Indian Cement Industry – Ready-Mixed Concrete (INR Billion), 2012–2016 ....................................................................... 41 Figure 30: Indian Cement Industry – Prefabricated Structural Components (INR Billion), 2007–2011 .............................................. 42 Figure 31: Indian Cement Industry – Prefabricated Structural Components (INR Billion), 2012–2016 .............................................. 43 Figure 32: Installed Cement Production Capacity Vs Production (Million Tons), 2010−2012 ............................................................. 44 Figure 33: Indian Cement Industry – Installed Production Capacity by Leading Companies (% Share), 2011 .................................. 45 Figure 34: Indian Cement Industry Dynamics........................................................................................................................................ 47
TABLE OF CONTENTS
Indian Cement Industry Outlook: Business Opportunities and Future Growth Potential to 2016 Page 7
© BRICdata. This product is licensed and is not to be photocopied Published: June 2012
LIST OF TABLES
Table 1: BRIC Countries’ Cement Industry Comparison (US$ Billion), 2007–2011 ............................................................................... 8 Table 2: BRIC Countries’ Cement Industry Comparison (US$ Billion), 2012–2016 ............................................................................... 8 Table 3: BRIC Countries’ Macroeconomic Indicators, 2011 ................................................................................................................... 9 Table 4: BRIC Countries’ Macroeconomic Indicators, 2011 ................................................................................................................... 9 Table 5: Indian Cement Industry Imports and Exports (US$ Million), 2007–2011 ................................................................................ 14 Table 6: Indian Cement Industry Imports and Exports (INR Million), 2007–2011 ................................................................................. 14 Table 7: Indian Cement Clinker Imports and Exports (US$ Million), 2007–2011 .................................................................................. 15 Table 8: Indian Cement Clinker Imports and Exports (INR Million), 2007–2011 .................................................................................. 15 Table 9: Indian Factory-Made Mortars Imports and Exports (US$ Million), 2007–2011 ....................................................................... 16 Table 10: Indian Factory-Made Mortars Imports and Exports (INR Million), 2007–2011 ...................................................................... 16 Table 11: Indian Portland Cement Imports and Exports (US$ Million), 2007–2011 ............................................................................. 17 Table 12: Indian Portland Cement Imports and Exports (INR Million), 2007–2011 .............................................................................. 17 Table 13: Indian Refractory Cements, Mortars and Concrete Imports and Exports (US$ Million), 2007–2011 .................................. 18 Table 14: Indian Refractory Cements, Mortars and Concrete Imports and Exports (INR Million), 2007–2011 ................................... 18 Table 15: Indian Other Hydraulic Cements Imports and Exports (US$ Million), 2007–2011 ............................................................... 19 Table 16: Indian Other Hydraulic Cements Imports and Exports (INR Million), 2007–2011 ................................................................ 19 Table 17: Indian Ready-Mixed Concrete Imports and Exports (US$ Million), 2007–2011 .................................................................... 20 Table 18: Indian Ready-Mixed Concrete Imports and Exports (INR Million), 2007–2011 .................................................................... 20 Table 19: Indian Prefabricated Structural Components Imports and Exports (US$ Million), 2007–2011 ........................................... 21 Table 20: Indian Prefabricated Structural Components Imports and Exports (INR Million), 2007–2011 ............................................ 21 Table 21: Indian Government Infrastructure Spending during Eleventh Five-Year Plan (US$ Billion), 2007–2012 ........................... 26 Table 22: Indian Cement Industry Market Size by Category (US$ Billion), 2007–2011 ........................................................................ 27 Table 23: Indian Cement Industry Market Size by Category (INR Billion), 2007–2011 ......................................................................... 27 Table 24: Indian Cement Industry Market Size by Category (US$ Billion), 2012–2016 ........................................................................ 29 Table 25: Indian Cement Industry Market Size by Category (INR Billion), 2012–2016 ......................................................................... 29 Table 27: Indian Cement Industry – Cement Clinker (INR Billion), 2007–2011 .................................................................................... 30 Table 28: Indian Cement Industry – Cement Clinker (US$ Billion), 2012–2016 .................................................................................... 31 Table 29: Indian Cement Industry – Cement Clinker (INR Billion), 2012–2016 .................................................................................... 31 Table 30: Indian Cement Industry – Factory-Made Mortars (US$ Billion), 2007–2011 ......................................................................... 32 Table 31: Indian Cement Industry – Factory-Made Mortars (INR Billion), 2007–2011.......................................................................... 32 Table 32: Indian Cement Industry – Factory-Made Mortars (US$ Billion), 2012–2016 ......................................................................... 33 Table 33: Indian Cement Industry – Factory-Made Mortars (INR Billion), 2012–2016.......................................................................... 33 Table 34: Indian Cement Industry – Portland Cement (US$ Billion), 2007–2011 ................................................................................. 34 Table 35: Indian Cement Industry – Portland Cement (INR Billion), 2007–2011 .................................................................................. 34 Table 36: Indian Cement Industry – Portland Cement (US$ Billion), 2012–2016 ................................................................................. 35 Table 37: Indian Cement Industry – Portland Cement (INR Billion), 2012–2016 .................................................................................. 35 Table 38: Indian Cement Industry – Refractory Cements, Mortars and Concrete (US$ Billion), 2007–2011 ...................................... 36 Table 39: Indian Cement Industry – Refractory Cements, Mortars and Concrete (INR Billion), 2007–2011 ....................................... 36 Table 40: Indian Cement Industry – Refractory Cements, Mortars and Concrete (US$ Billion), 2012–2016 ...................................... 37 Table 41: Indian Cement Industry – Refractory Cements, Mortars and Concrete (INR Billion), 2012–2016 ....................................... 37 Table 42: Indian Cement Industry – Other Hydraulic Cements (US$ Billion), 2007–2011 ................................................................... 38 Table 43: Indian Cement Industry – Other Hydraulic Cements (INR Billion), 2007–2011 .................................................................... 38 Table 45: Indian Cement Industry – Other Hydraulic Cements (INR Billion), 2012–2016 .................................................................... 39 Table 46: Indian Cement Industry – Ready-Mixed Concrete (US$ Billion), 2007–2011 ........................................................................ 40 Table 47: Indian Cement Industry – Ready-Mixed Concrete (INR Billion), 2007–2011 ........................................................................ 40 Table 49: Indian Cement Industry – Ready-Mixed Concrete (INR Billion), 2012–2016 ........................................................................ 41 Table 50: Indian Cement Industry – Prefabricated Structural Components (US$ Billion), 2007–2011 ............................................... 42 Table 51: Indian Cement Industry – Prefabricated Structural Components (INR Billion), 2007–2011 ................................................ 42 Table 52: Indian Cement Industry – Prefabricated Structural Components (US$ Billion), 2012–2016 ............................................... 43 Table 53: Indian Cement Industry – Prefabricated Structural Components (INR Billion), 2012–2016 ................................................ 43 Table 54: Indian Cement Industry – Market Entry Strategy of Foreign Companies, 1999–2008 ......................................................... 49 Table 55: Definitions................................................................................................................................................................................ 54
ANALYSIS OF MARKET DRIVERS
Indian Cement Industry Outlook: Business Opportunities and Future Growth Potential to 2016 Page 8
© BRICdata. This product is licensed and is not to be photocopied Published: June 2012
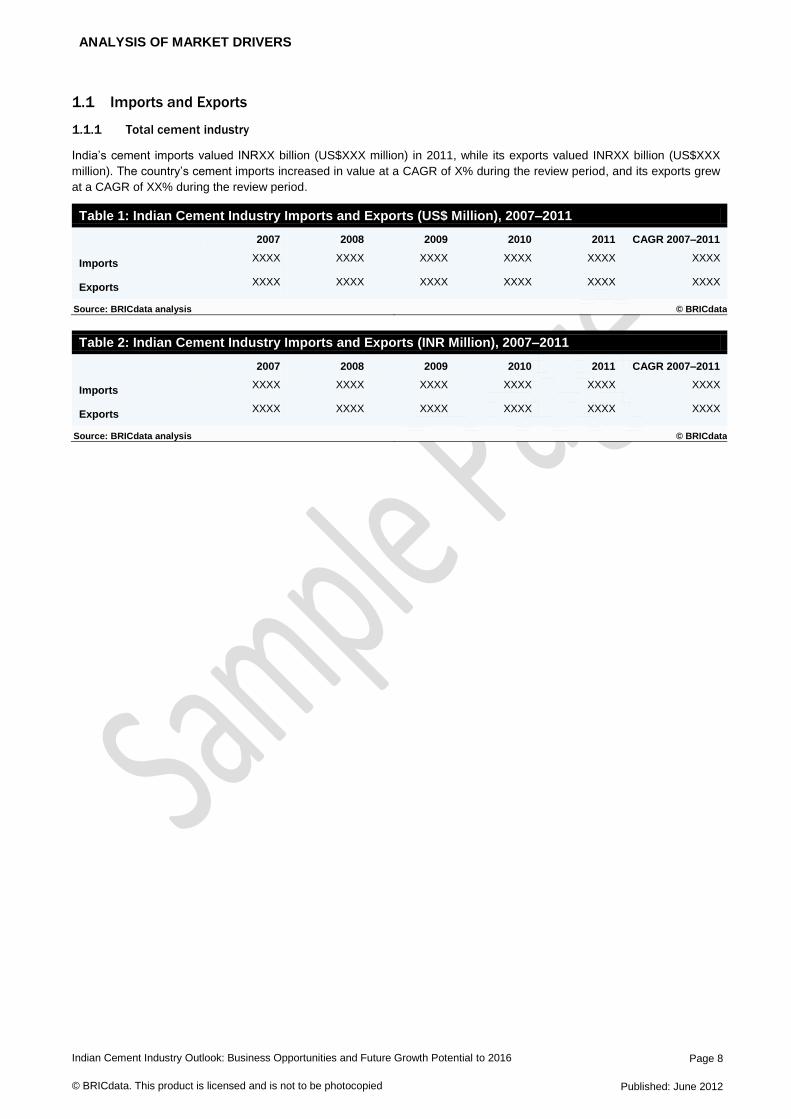
1.1 Imports and Exports
1.1.1 Total cement industry
India’s cement imports valued INRXX billion (US$XXX million) in 2011, while its exports valued INRXX billion (US$XXX
million). The country’s cement imports increased in value at a CAGR of X% during the review period, and its exports grew
at a CAGR of XX% during the review period.
Table 1: Indian Cement Industry Imports and Exports (US$ Million), 2007–2011
2007 2008 2009 2010 2011 CAGR 2007–2011
Imports XXXX XXXX XXXX XXXX XXXX XXXX
Exports XXXX XXXX XXXX XXXX XXXX XXXX
Source: BRICdata analysis © BRICdata
Table 2: Indian Cement Industry Imports and Exports (INR Million), 2007–2011
2007 2008 2009 2010 2011 CAGR 2007–2011
Imports XXXX XXXX XXXX XXXX XXXX XXXX
Exports XXXX XXXX XXXX XXXX XXXX XXXX
Source: BRICdata analysis © BRICdata
CEMENT INDUSTRY OPPORTUNITY AND FUTURE POTENTIAL
Indian Cement Industry Outlook: Business Opportunities and Future Growth Potential to 2016 Page 9
© BRICdata. This product is licensed and is not to be photocopied Published: June 2012
2 Cement Industry Opportunity and Future Potential
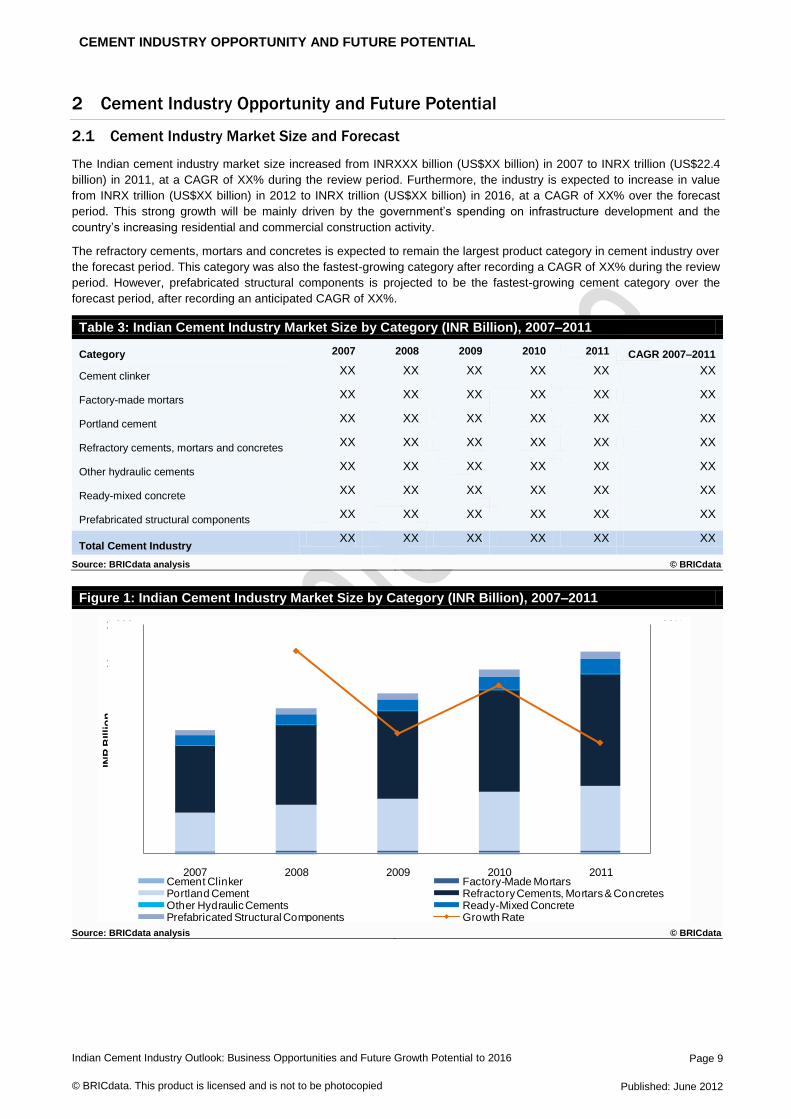
2.1 Cement Industry Market Size and Forecast
The Indian cement industry market size increased from INRXXX billion (US$XX billion) in 2007 to INRX trillion (US$22.4
billion) in 2011, at a CAGR of XX% during the review period. Furthermore, the industry is expected to increase in value
from INRX trillion (US$XX billion) in 2012 to INRX trillion (US$XX billion) in 2016, at a CAGR of XX% over the forecast
period. This strong growth will be mainly driven by the government’s spending on infrastructure development and the
country’s increasing residential and commercial construction activity.
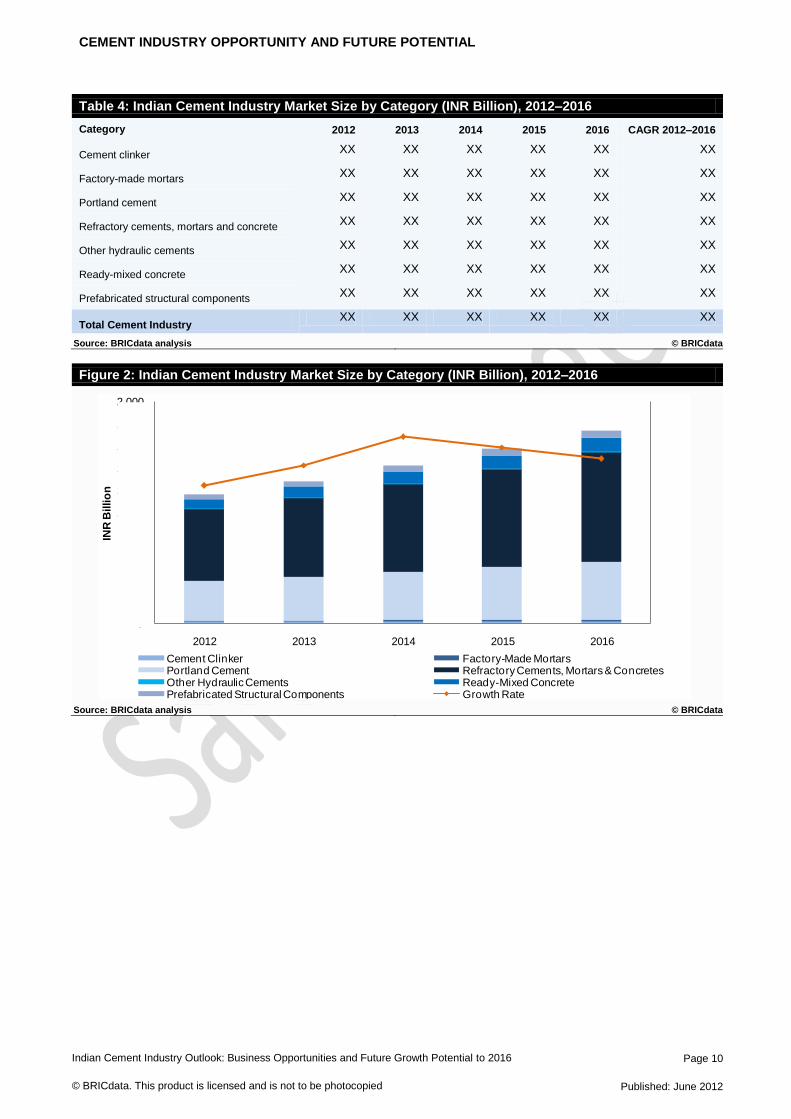
The refractory cements, mortars and concretes is expected to remain the largest product category in cement industry over
the forecast period. This category was also the fastest-growing category after recording a CAGR of XX% during the review
period. However, prefabricated structural components is projected to be the fastest-growing cement category over the
forecast period, after recording an anticipated CAGR of XX%.
Table 3: Indian Cement Industry Market Size by Category (INR Billion), 2007–2011
Category 2007 2008 2009 2010 2011 CAGR 2007–2011
Cement clinker XX XX XX XX XX XX
Factory-made mortars XX XX XX XX XX XX
Portland cement XX XX XX XX XX XX
Refractory cements, mortars and concretes XX XX XX XX XX XX
Other hydraulic cements XX XX XX XX XX XX
Ready-mixed concrete XX XX XX XX XX XX
Prefabricated structural components XX XX XX XX XX XX
Total Cement Industry XX XX XX XX XX XX
Source: BRICdata analysis © BRICdata
Figure 1: Indian Cement Industry Market Size by Category (INR Billion), 2007–2011
Source: BRICdata analysis © BRICdata
0%
2%
4%
6%
8%
10%
12%
14%
16%
18%
20%
0
200
400
600
800
1,000
1,200
2007 2008 2009 2010 2011
INR
BIllio
n
Cement Clinker Factory-Made MortarsPortland Cement Refractory Cements, Mortars & ConcretesOther Hydraulic Cements Ready-Mixed ConcretePrefabricated Structural Components Growth Rate
CEMENT INDUSTRY OPPORTUNITY AND FUTURE POTENTIAL
Indian Cement Industry Outlook: Business Opportunities and Future Growth Potential to 2016 Page 10
© BRICdata. This product is licensed and is not to be photocopied Published: June 2012
Table 4: Indian Cement Industry Market Size by Category (INR Billion), 2012–2016
Category 2012 2013 2014 2015 2016 CAGR 2012–2016
Cement clinker XX XX XX XX XX XX
Factory-made mortars XX XX XX XX XX XX
Portland cement XX XX XX XX XX XX
Refractory cements, mortars and concrete XX XX XX XX XX XX
Other hydraulic cements XX XX XX XX XX XX
Ready-mixed concrete XX XX XX XX XX XX
Prefabricated structural components XX XX XX XX XX XX
Total Cement Industry XX XX XX XX XX XX
Source: BRICdata analysis © BRICdata
Figure 2: Indian Cement Industry Market Size by Category (INR Billion), 2012–2016
Source: BRICdata analysis © BRICdata
6%
7%
8%
9%
10%
11%
12%
0
200
400
600
800
1,000
1,200
1,400
1,600
1,800
2,000
2012 2013 2014 2015 2016
INR
Billio
n
Cement Clinker Factory-Made MortarsPortland Cement Refractory Cements, Mortars & ConcretesOther Hydraulic Cements Ready-Mixed ConcretePrefabricated Structural Components Growth Rate
CEMENT INDUSTRY OPPORTUNITY AND FUTURE POTENTIAL
Indian Cement Industry Outlook: Business Opportunities and Future Growth Potential to 2016 Page 11
© BRICdata. This product is licensed and is not to be photocopied Published: June 2012
2.2 Breakdown by Category
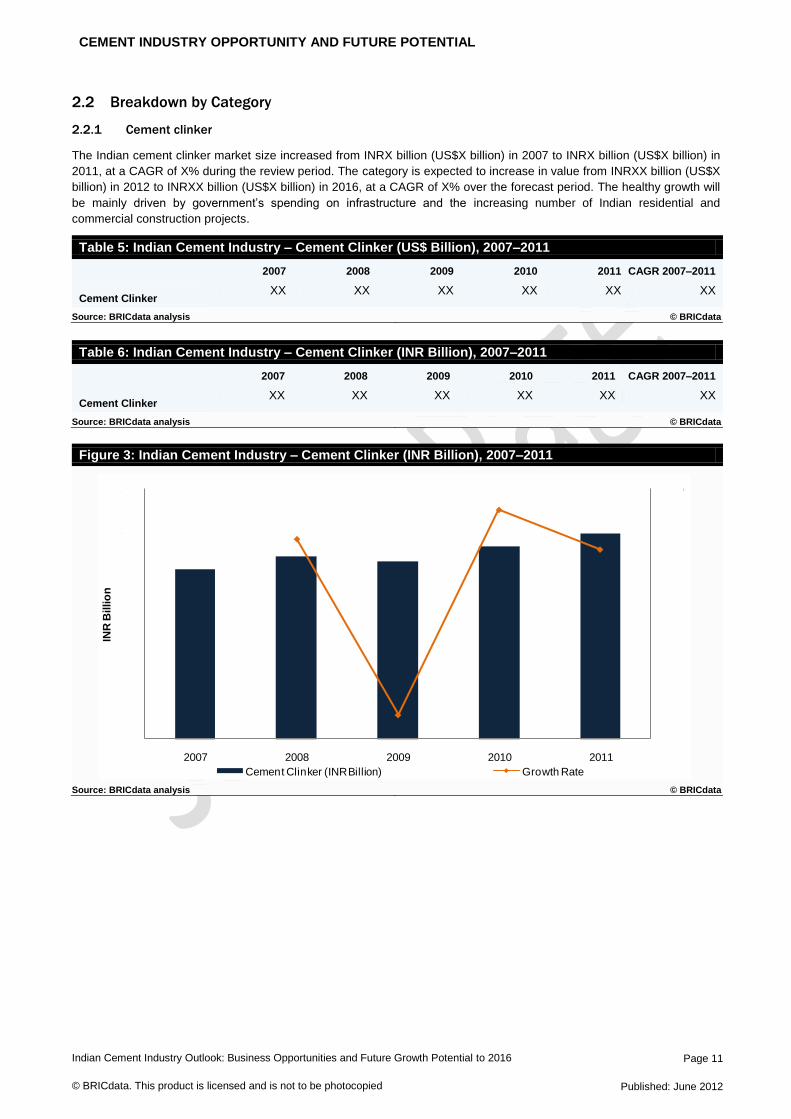
2.2.1 Cement clinker
The Indian cement clinker market size increased from INRX billion (US$X billion) in 2007 to INRX billion (US$X billion) in
2011, at a CAGR of X% during the review period. The category is expected to increase in value from INRXX billion (US$X
billion) in 2012 to INRXX billion (US$X billion) in 2016, at a CAGR of X% over the forecast period. The healthy growth will
be mainly driven by government’s spending on infrastructure and the increasing number of Indian residential and
commercial construction projects.
Table 5: Indian Cement Industry – Cement Clinker (US$ Billion), 2007–2011
2007 2008 2009 2010 2011 CAGR 2007–2011
Cement Clinker XX XX XX XX XX XX
Source: BRICdata analysis © BRICdata
Table 6: Indian Cement Industry – Cement Clinker (INR Billion), 2007–2011
2007 2008 2009 2010 2011 CAGR 2007–2011
Cement Clinker XX XX XX XX XX XX
Source: BRICdata analysis © BRICdata
Figure 3: Indian Cement Industry – Cement Clinker (INR Billion), 2007–2011
Source: BRICdata analysis © BRICdata
-4%
-2%
0%
2%
4%
6%
8%
10%
0
2
4
6
8
10
12
2007 2008 2009 2010 2011
INR
Billio
n
Cement Clinker (INR Billion) Growth Rate
CEMENT INDUSTRY OPPORTUNITY AND FUTURE POTENTIAL
Indian Cement Industry Outlook: Business Opportunities and Future Growth Potential to 2016 Page 12
© BRICdata. This product is licensed and is not to be photocopied Published: June 2012
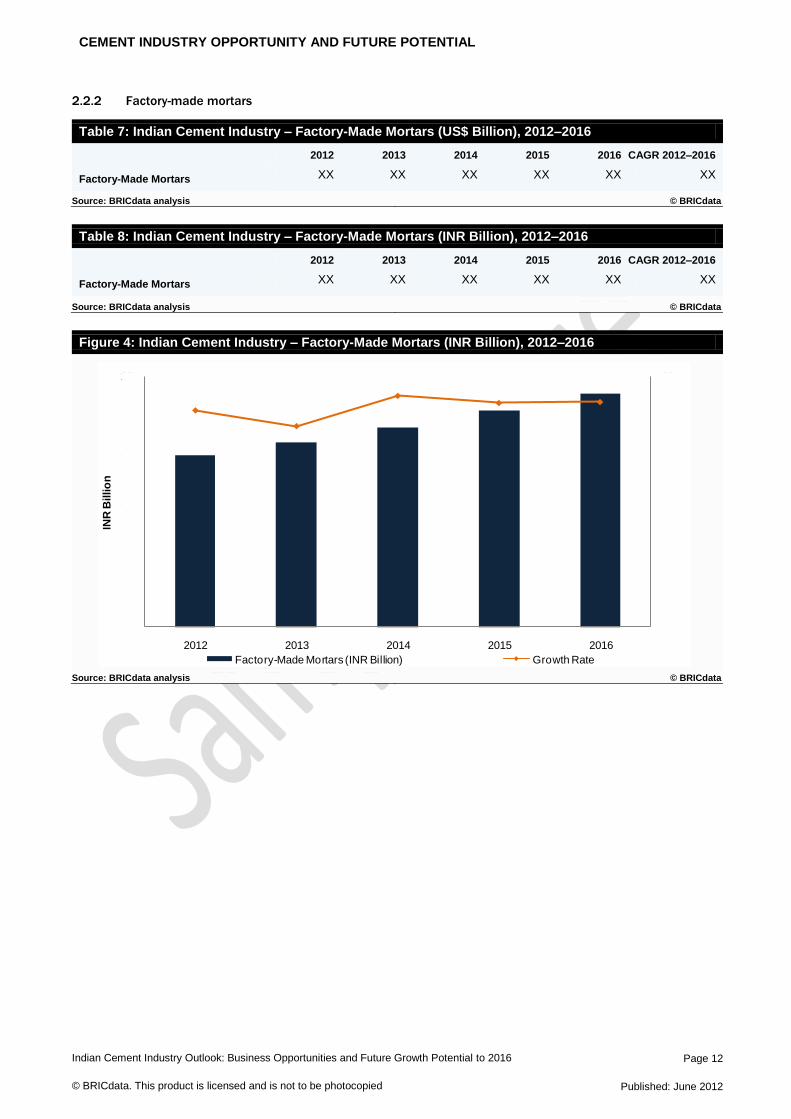
2.2.2 Factory-made mortars
Table 7: Indian Cement Industry – Factory-Made Mortars (US$ Billion), 2012–2016
2012 2013 2014 2015 2016 CAGR 2012–2016
Factory-Made Mortars XX XX XX XX XX XX
Source: BRICdata analysis © BRICdata
Table 8: Indian Cement Industry – Factory-Made Mortars (INR Billion), 2012–2016
2012 2013 2014 2015 2016 CAGR 2012–2016
Factory-Made Mortars XX XX XX XX XX XX
Source: BRICdata analysis © BRICdata
Figure 4: Indian Cement Industry – Factory-Made Mortars (INR Billion), 2012–2016
Source: BRICdata analysis © BRICdata
0%
1%
2%
3%
4%
5%
6%
7%
8%
9%
0
2
4
6
8
10
12
14
16
18
20
2012 2013 2014 2015 2016
INR
Billio
n
Factory-Made Mortars (INR Billion) Growth Rate
CEMENT INDUSTRY OPPORTUNITY AND FUTURE POTENTIAL
Indian Cement Industry Outlook: Business Opportunities and Future Growth Potential to 2016 Page 13
© BRICdata. This product is licensed and is not to be photocopied Published: June 2012
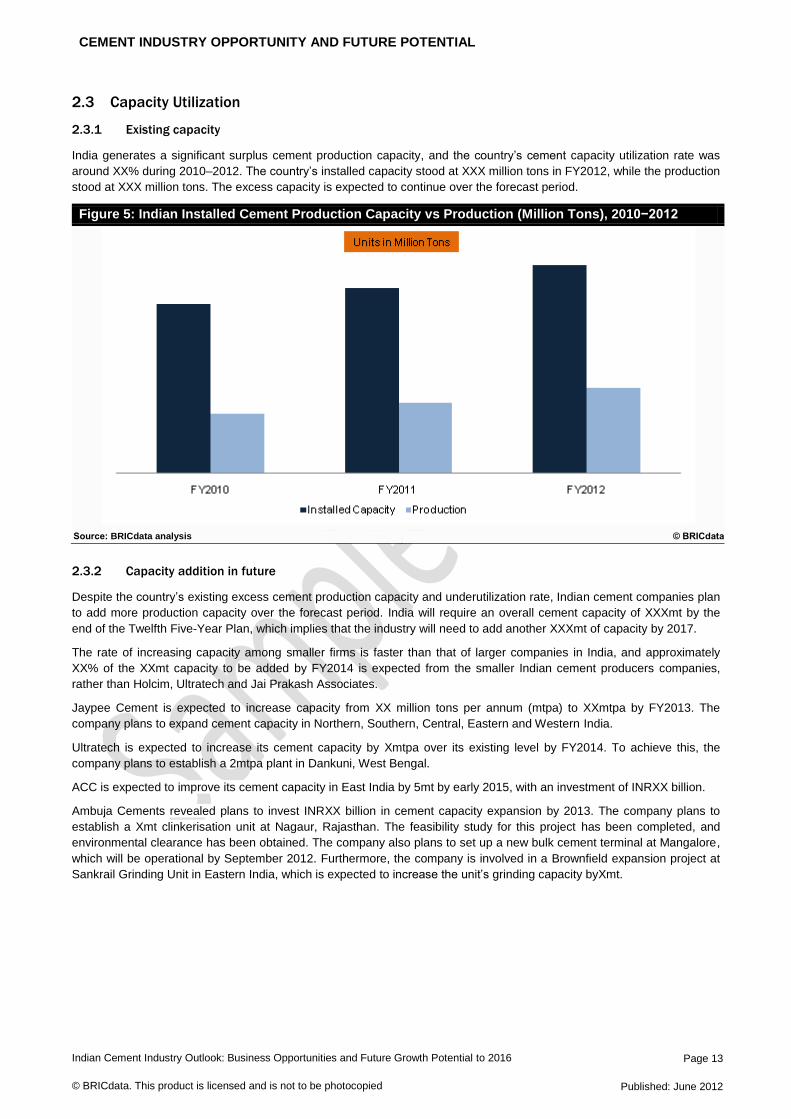
2.3 Capacity Utilization
2.3.1 Existing capacity
India generates a significant surplus cement production capacity, and the country’s cement capacity utilization rate was
around XX% during 2010–2012. The country’s installed capacity stood at XXX million tons in FY2012, while the production
stood at XXX million tons. The excess capacity is expected to continue over the forecast period.
Figure 5: Indian Installed Cement Production Capacity vs Production (Million Tons), 2010−2012
Source: BRICdata analysis © BRICdata
2.3.2 Capacity addition in future
Despite the country’s existing excess cement production capacity and underutilization rate, Indian cement companies plan
to add more production capacity over the forecast period. India will require an overall cement capacity of XXXmt by the
end of the Twelfth Five-Year Plan, which implies that the industry will need to add another XXXmt of capacity by 2017.
The rate of increasing capacity among smaller firms is faster than that of larger companies in India, and approximately
XX% of the XXmt capacity to be added by FY2014 is expected from the smaller Indian cement producers companies,
rather than Holcim, Ultratech and Jai Prakash Associates.
Jaypee Cement is expected to increase capacity from XX million tons per annum (mtpa) to XXmtpa by FY2013. The
company plans to expand cement capacity in Northern, Southern, Central, Eastern and Western India.
Ultratech is expected to increase its cement capacity by Xmtpa over its existing level by FY2014. To achieve this, the
company plans to establish a 2mtpa plant in Dankuni, West Bengal.
ACC is expected to improve its cement capacity in East India by 5mt by early 2015, with an investment of INRXX billion.
Ambuja Cements revealed plans to invest INRXX billion in cement capacity expansion by 2013. The company plans to
establish a Xmt clinkerisation unit at Nagaur, Rajasthan. The feasibility study for this project has been completed, and
environmental clearance has been obtained. The company also plans to set up a new bulk cement terminal at Mangalore,
which will be operational by September 2012. Furthermore, the company is involved in a Brownfield expansion project at
Sankrail Grinding Unit in Eastern India, which is expected to increase the unit’s grinding capacity byXmt.
BUSINESS AND OPERATIONAL STRATEGY
Indian Cement Industry Outlook: Business Opportunities and Future Growth Potential to 2016 Page 14
© BRICdata. This product is licensed and is not to be photocopied Published: June 2012
3 Industry Structure and Competitive Landscape
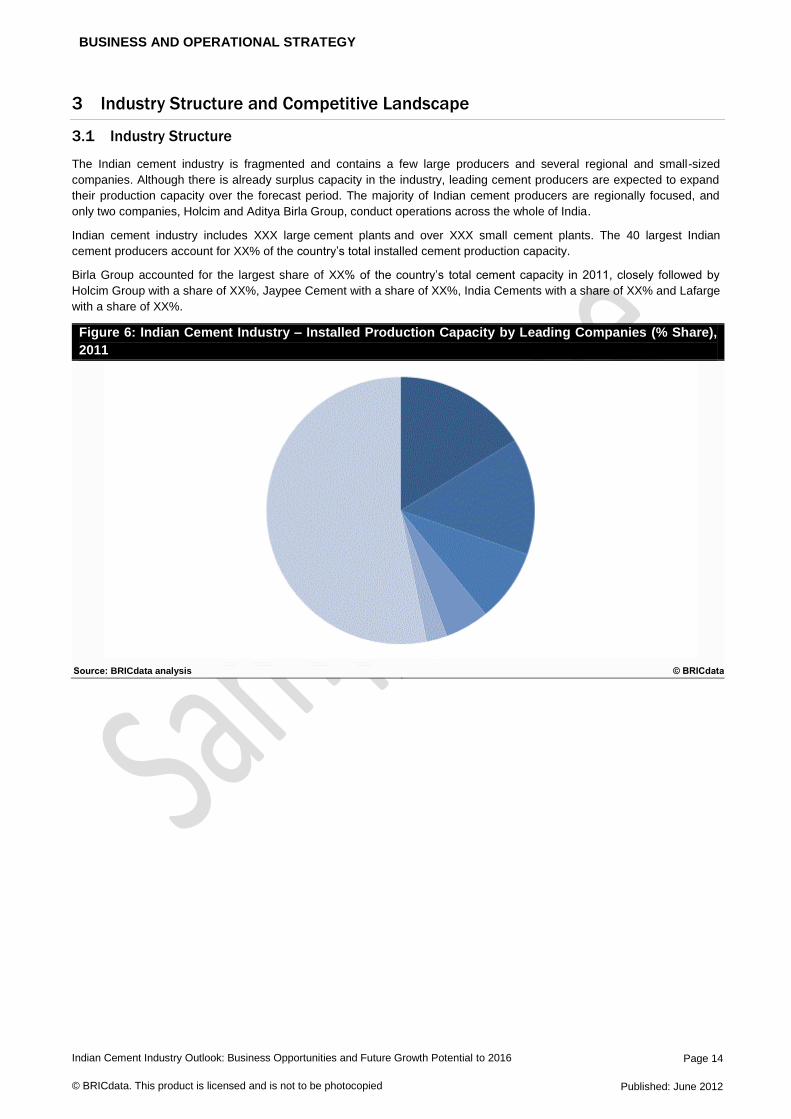
3.1 Industry Structure
The Indian cement industry is fragmented and contains a few large producers and several regional and small-sized
companies. Although there is already surplus capacity in the industry, leading cement producers are expected to expand
their production capacity over the forecast period. The majority of Indian cement producers are regionally focused, and
only two companies, Holcim and Aditya Birla Group, conduct operations across the whole of India.
Indian cement industry includes XXX large cement plants and over XXX small cement plants. The 40 largest Indian
cement producers account for XX% of the country’s total installed cement production capacity.
Birla Group accounted for the largest share of XX% of the country’s total cement capacity in 2011, closely followed by
Holcim Group with a share of XX%, Jaypee Cement with a share of XX%, India Cements with a share of XX% and Lafarge
with a share of XX%.
Figure 6: Indian Cement Industry – Installed Production Capacity by Leading Companies (% Share),
2011
Source: BRICdata analysis © BRICdata
APPENDIX
Indian Cement Industry Outlook: Business Opportunities and Future Growth Potential to 2016 Page 15
© BRICdata. This product is licensed and is not to be photocopied Published: June 2012
4 Appendix
4.1 About BRICdata
BRICdata publishes in-depth strategic intelligence reports that help its customers better understand opportunities in
emerging markets and industry sectors. Its reports provide an independent, expert view supported by primary research
and access to leading data and intelligence sources.
BRICdata is a comprehensive source of insights and analysis, and publishes a broad range of reports across a number of
different industry sectors, including consumer, retail, financial services, technology, telecoms and construction.
BRICdata is headquartered in London with research, analysis and account management teams based across Europe, the
US and Asia-Pacific. Its global research footprint is supported by a network of external associates, data partners and
industry experts to give the clearest possible perspective on emerging markets.
4.1.1 Areas of expertise
BRICdata operates a dedicated, multilingual team of in-house industry analysts with significant experience of global and
country-level research. BRICdata also maintains data and research partnerships with other research companies, industry
experts and trade associations, along with a network of independent industry consultants and former industry participants
contributing research and reports to bring additional insight and expertise in more specialist areas.
BRICdata’s research offering spans the following industry areas:
Construction
BRICdata publishes reports covering the entire construction value chain: construction materials, equipment, construction
services, architectural services and interior design. It also covers the main value sectors of construction activity:
commercial, infrastructure, industrial, institutional and residential.
This comprehensive view of the market enables BRICdata to detail key growth sectors and countries and identify the most
attractive industry opportunities.
Consumer goods
Covering a broad range of areas across the consumer goods market, from interior products to fast-moving consumer
goods (FMCG), ingredients, and packaging, BRICdata offers a comprehensive insight into key consumer sectors across
fast-growing markets, identifying key trends, future innovations and growth opportunities.
Comprehensive data sets including unique primary survey-driven research creates accurate market forecasts and
understanding of the factors driving consumption behavior.
Financial services
Providing detailed insights into insurance and banking markets, BRICdata’s financial services reports identify key market
opportunities, emerging technologies and channel strategies. The reports provide unique data combined with local
examples of best practice and expert insights into the market.
Retail
BRICdata maintains a comprehensive database of forecasts of retail spending, along with a series of unique indicators
enabling a forward view of retailers’ prospects in emerging markets. The reports identify emerging concepts in retail,
including the nascent online and mobile retail sectors in the BRIC countries and other emerging markets.
Technology
BRICdata tracks key trends and innovations, emerging technologies and markets, and the key operators in both emerging
markets and technologies. Covering a range of emerging and disruptive technologies including telecoms, social media,
online and mobile retailing, and telemedicine, BRICdata examines strategies for success, the state of the competitive
landscape and the inherent threats and opportunities in the emerging economies.
APPENDIX
Indian Cement Industry Outlook: Business Opportunities and Future Growth Potential to 2016 Page 16
© BRICdata. This product is licensed and is not to be photocopied Published: June 2012
4.2 Methodology
All BRICdata reports are rigorously sourced and created according to a comprehensive, two-stage methodology. This
includes internal audit and primary research.
A) Internal audit
Review of in-house databases to gather existing data:
o Historic market databases and reports
o Company database
o projects database
B) Primary research
Review of the latest company strategy and asset management trends
1) Research
A. Sources
Collection of the latest market-specific data from a wide variety of industry sources:
o Government statistics
o Industry associations
o Company filings
o Broker reports
o International organizations
B. Expert opinion
Collation of opinion taken from leading industry experts
Analysis of third-party opinion and forecasts:
o Broker reports
o Industry associations
o Official government sources
C. Data consolidation and verification
Consolidation of data and opinion to create historical datasets
Creation of models to benchmark data across sectors and geographies
2) Research Analysis
A. Market forecasts
Feed of forecast data into market models:
o Macroeconomic indicators
o Industry-specific drivers
Analysis of Market Databases to identify trends by sector:
o Latest trends
o Key drivers of the market
3) Report Writing
Analysis of market data
Discussion of company and industry trends and issues
Integration of survey results
APPENDIX
Indian Cement Industry Outlook: Business Opportunities and Future Growth Potential to 2016 Page 17
© BRICdata. This product is licensed and is not to be photocopied Published: June 2012
Annual review of trends
Standardization of market definitions using recognized industry classifications
4) Quality Control
A. Templates
Detailed process manuals
Standardized report templates and accompanying style guides
Complex forecasting tool used to ensure forecast methodologies are consistently applied
QC checklists
B. Quality control process
Peer review
Senior-level QC
Random spot checks on data integrity
Benchmark checks across databases
Market data cross-checked for consistency with accumulated data from company filings
4.3 Definitions
Table 9: Definitions
Terms Definition
Cement clinker A type of concrete and cement which is generally in the form of lumps or granules between 2mm and 30mm in size. For reporting purposes, cement clinker of any size is categorized under this category.
Factory-made mortars Any type of mortar that is produced within the factory rather than on construction sites is assessed under this category. Depending on countries and regions, various types of mortars are produced within this category.
Portland cement The most common type of cement category used in the construction industry. For reporting purposes, any variant of Portland cement is included in this category, ignoring the differences in constituents and standards.
Refractory cements, mortars and concretes
Includes, refractory cements, refractory mortars and refractory concretes in any compositions. Refractory plastics, ramming mixes and gunning mixes are also included within this category. Any kind of carbonaceous pastes are excluded from this category.
Other hydraulic cements Any type of cement within the hydraulic category, with the exception of Portland cements, is categorized under other hydraulic cements
Ready-mixed concrete A type of concrete that is prepared in the factory rather than the construction sites. Compositions of ready-mixed concrete can vary according to requirements and locations.
Prefabricated structural components
Includes all ready-to-use construction components made up of cements, concretes or stones.
Source: BRICdata analysis © BRICdata
4.4 Disclaimer
All rights reserved.
No part of this publication may be reproduced, stored in a retrieval system or transmitted in any form by any means,
electronic, mechanical, photocopying, recording or otherwise, without the prior permission of the publisher, BRICdata.
The facts of this report are believed to be correct at the time of publication but cannot be guaranteed. Please note that the
findings, conclusions and recommendations that BRICdata delivers will be based on information gathered in good faith
from both primary and secondary sources, whose accuracy we are not always in a position to guarantee. BRICdata can,
therefore, accept no liability whatsoever for actions taken based on any information that may subsequently prove to be
incorrect.