India Position Your Products Now to Leverage the ... GAIN Publications...supplier of...
20
THIS REPORT CONTAINS ASSESSMENTS OF COMMODITY AND TRADE ISSUES MADE BY USDA STAFF AND NOT NECESSARILY STATEMENTS OF OFFICIAL U.S. GOVERNMENT POLICY Date: GAIN Report Number: Approved By: Prepared By: Report Highlights: India is a lucrative export market for U.S. agriculture with a large and rapidly expanding middle class, rising disposable incomes, and shifting consumption patterns toward higher-value and processed products. India’s modern retail sector is expanding, food processors want access to a global supply chain, and food service chefs want to innovate and attract consumers. The United States is the largest supplier of consumer-oriented exported products to India. Shubhi Mishra and Varun Anthony Adam Branson Position Your Products Now to Leverage the Demographic Dividend Exporter Guide India IN7155 12/29/2017 Required Report - public distribution
-
Upload
trinhquynh -
Category
Documents
-
view
217 -
download
3
Transcript of India Position Your Products Now to Leverage the ... GAIN Publications...supplier of...

THIS REPORT CONTAINS ASSESSMENTS OF COMMODITY AND TRADE ISSUES MADE BY
USDA STAFF AND NOT NECESSARILY STATEMENTS OF OFFICIAL U.S. GOVERNMENT
POLICY
Date:
GAIN Report Number:
Approved By:
Prepared By:
Report Highlights:
India is a lucrative export market for U.S. agriculture with a large and rapidly expanding middle class,
rising disposable incomes, and shifting consumption patterns toward higher-value and processed
products. India’s modern retail sector is expanding, food processors want access to a global supply
chain, and food service chefs want to innovate and attract consumers. The United States is the largest
supplier of consumer-oriented exported products to India.
Shubhi Mishra and Varun
Anthony
Adam Branson
Position Your Products Now to Leverage the Demographic
Dividend
Exporter Guide
India
IN7155
12/29/2017
Required Report - public distribution


Post:
Executive Summary:
Section 1: Market Overview:
India is the world’s second most populous country with a total population of 1.3 billion and accounts for
17.3 percent of the global population according to Indian data published by the United States Census
Bureau. India is projected to be the world’s most populous country by 2026. It currently is one of the
youngest countries in the world with a median age just under 28 years and nearly 62.3 percent of
Indians are under the age of 35. According to India’s 2011 census, with a population of 18.4 million, the
greater Mumbai area is the most populous urban center in India followed by Delhi (16.3 million),
Kolkata (14.1 million), Chennai (8.7 million), and Bengaluru (8.5 million). There were over 53 urban
areas with a population over 1 million people in India’s 2011 Census.
Nearly half of all Indians are married and live in joint or extended families resulting in an average
household size of 4.8 people. In urban areas, smaller nuclear families are becoming more common as
mobility and employment opportunities increase. However, geographic, cultural, and socio-economic
differences persist throughout the country and create divergent consumer demands and consumer
profiles that are varied and dynamic.
The Government of India reports that the gross domestic product (GDP) is forecast to grow at 7-8
percent per annum over the next few years. According to the International Monetary Fund, between
2016 and 2022, India’s per capita GDP growth will increase by 61 percent and overall economic growth
is predicted to accelerate from 7.1 percent in 2016 to 7.7 percent in 2018. India should become the
world’s third-largest economy by 2025. However, the GDP rate for the first quarter of Indian Fiscal
Year (April-March) 2017-18 was 5.7 percent. Which, although strong, was less than analysts expected
and is attributed to India’s demonetization of specific currency notes in November 2016 which led to a
cash crunch and reduced purchasing which had ripple effects through the economy has factories slowed
down, exports declined, and currency uncertainty persisted.
On July 1, 2017, the Government of India (GOI) instituted a nationwide goods and services tax (GST),
which replaced existing state-by-state taxes and duties. The country’s food safety authorities are moving
to risk-based inspections of imported items. The GOIs, “Make in India” program encourages domestic
manufacturing, including food processing, as a major goal and welcomes Foreign Direct Investment
(FDI). According to the World Bank’s Doing Business 2017 report, India jumped approximately 30
places from the 2016 report and ranked 100th out of 190 countries. Despite efforts to improve the
business environment, the GOI has not lowered tariffs or noticeably improved access for imported food
and agricultural products over the past several years.
In nominal terms, total food expenditures is anticipated to reach $4 trillion by 2025. Demand for
specialty and high value foods such as chocolates, nuts and dried fruits, cakes, fresh fruits,
confectionary items, and fruit juices peaks during the fall festive season, especially at Diwali - the
Hindu festival of lights which occurs during October or November. Industry interlocutors classify this
as the best time to introduce new-to-market food products in India.
New Delhi

Euromonitor information indicates there are nearly 960,000 households with annual incomes in excess
of $150,000, up from 791,000 in 2010. There are a large number of wealthy households in smaller cities
with aspirations similar to their metro counterparts. These consumers are showing increasing interest in
luxury goods. Changing lifestyle trends among these consumers is driving growth for luxury and
imported goods. Wealthy consumers in these smaller as well as major metros cities are increasingly
shopping for goods with mobile or online commerce. Imported value-added and consumer-ready foods
are limited in rural areas, where the majority of India’s population resides, but show promise in metros
and emerging city markets (commonly referred to in India as Tier 1, Tier 2, and Tier 3 cities). Current
opportunities for value-added imported foods are generally limited to higher income consumers in these
markets. Their consumption patterns and preferences are shaped by the emergence of fine dining
restaurants, cafes, quick service restaurants, supermarkets, processed foods, larger refrigerators, 24-hour
television food channels, easier access to imported foods, dual income earning households, larger
disposable incomes and the introduction of international cuisines.
Consumption of processed foods such as domestically produced chips, biscuits and cookies, and
vegetable oils penetrates lower income categories in both rural and urban areas. Rural areas are
emerging as important markets for fast-moving consumer goods and daily staples like edible oils,
pulses, fruits, and vegetables.
Whether rural or urban and regardless of income level, tradition dictates Indian consumer habits.
Traditional Indian consumers (i) prefer small neighborhood mom-n-pop stores over large supermarkets;
(ii) prefer fresh over frozen as their consumption beliefs assert that taste and quality comes from fresh
food and ingredients; and (iii) prefer home cooked meals over food cooked at a restaurant or packaged
in a tin. The seasonal availability of food and geographic setting are additional key factors that shape
consumption patterns and preferences.
For an additional overview of the Indian agricultural market, read the USDA Foreign Agricultural
Service International Agricultural Trade Report from October 2017: Growing Opportunities for U.S.
Agricultural Exports in India.
India’s Agricultural Trade Situation
India continues running a trade surplus in agricultural products. India’s bulk, intermediate, consumer-
oriented, and agricultural related imports grew from $23.1 billion in 2012 to $26.9 billion in 2016.
Imports of consumer-oriented foods, led by tree nuts, are among the fastest growing segment of
imported agricultural products and reached $4.2 billion in 2016. India’s food and agricultural exports
went from $41.7 billion in 2012 to $33.7 billion in 2016 owing largely to a decline in bulk and
intermediate exports that dropped off owing to market conditions and weather-related issues that drove
Indian agricultural product prices higher.
Table 1. India: Imports of Bulk, Intermediate, Consumer Oriented and Agricultural Related
Products from the World (U.S. $ Billion)
Category 2012 2016 2017 (YTD)
Jan- Nov' 17
Bulk 4.422 6.817 6.208

Intermediate 12.780 13.226 11.507
Consumer- Oriented 3.008 4.207 3.748
Agricultural Related Products 2.915 2.676 1.937
Fish Products .071 .065 .048
Forest Products 2.604 2.147 1.493
Total 23.125 26.926 23.401
Source: Ministry of Commerce and Industries, GOI
Table 2. India: Exports of Bulk, Intermediate, Consumer Oriented and Agricultural Related
Products from the World (U.S. $ Billion)
Category 2012 2016 2017 (YTD)
Jan- Nov’17
Bulk 15.877 10.138 9.370
Intermediate 12.547 5.841 5.017
Consumer- Oriented 9.359 11.587 9.098
Agricultural Related Products 3.917 6.174 5.492
Fish Products 3.354 5.516 4.984
Forest Products .250 .397 .309
Total 41.700 33.740 28.977
Source: Ministry of Commerce and Industries, GOI


Advantages Challenges
Expanding number of middle and upper
income consumers willing to diversify diets
and experiment with various cuisines.
Stringent food regulations regarding
biotech foods and ingredients and
certain food additives.
Increasing urbanization and growing
number of working women that has led to
dual-income households.
Diverse agro-industrial base offering
many products at competitive prices
and preference for fresh traditional
foods.
Increasing exposure to international
products and international lifestyle by
media and food channels that increase the
visibility and awareness around imported
food products.
Indian food companies (including
many multinational companies)
produce western-style food products
at competitive prices.
Opportunities for bulk and intermediate
products that can be used by the food
processing sector under the Make in India
campaign.
High tariffs, persistent sanitary and
phyto-sanitary requirements that
effectively prohibit or restrict imports
and competition from other countries.
A slow but, gradual transformation of the
retail food sector in urban and rural areas.
Difficulties in accessing vast semi-
urban and rural markets due to
infrastructure limitations.
U.S. food products are considered safe and
of high quality.
High income consumers are spread
throughout the country.
Strong U.S.-India ties and political stability
in India.
Competition from countries having
geographical proximity and freight
advantage.
Growing domestic and international tourism
and rise in food/lifestyle media creating
opportunities for niche and high-value
products.
Preferential Trade Agreements with
some countries e.g., Chile, affords
them tariff benefits for a similar range
of products.
SECTION II: EXPORTER BUSINESS TIPS
Local Business Customs, Climate, and Etiquette
American companies who are looking towards India as the next destination for their product should take

into consideration many factors:
“Does my product have market access?” is the most important question exporters can ask as
they research the Indian market. See the trade policy section of this report for more details.
If yes, then the next thing to consider is ‘Pricing’ – Exporters need to analyze the landed post-
duty cost of a product. As a rule of thumb, a product is likely to be two to three times more
costly than the U.S. FOB price once it reaches the retail shelf.
Consequently determining whether a product should target the small number of high-income
consumers or larger numbers of middle-income consumers is key in assessing market potential.
Exporters should consider whether they are willing to start small, meet special labeling
requirements, and ship mixed or partial containers. Patience and persistence are key factors for
any exporter or foreign investor who looks to India as a potential market.
When targeting the retail or food service sector, it is a necessity to have an importer or an
importer/distributor as very few retailers or hotels/restaurants import directly. Key
considerations with importers/distributors often are on whether they have a city-by-city, region,
or pan-India presence; their capabilities and experience in handling fresh, perishable products;
and, their interest-level and structure for marketing of your products.
A visit to India to gain a first-hand feel of the Indian market, preferably coinciding with a major
food show at which USDA has an active offers an opportunity to learn about the Indian market
and meet prospective buyers.
It is encouraged that American exporters reach out to USDA’s Foreign Agricultural Service
offices present in India when they are looking towards India as potential market and when they
need to establish a relationship with Indian stakeholders.
Be patient – Be Persistent – Look at India for the Long-Run and not as a One-Off Sale.
For domestically produced foods, clearing and forwarding agents transport merchandise from the
factory or warehouse to “stockists” or distributors. While the agents do not take title to the product, they
receive four to six percent margins, then invoice the stockist, and receive payment on behalf of the
manufacturer. The stockists have exclusive geographical territories and a sales force that calls on both
the wholesalers and on large retailers in urban areas. They usually offer credit to their customers and
receive margins in the range of five to seven percent. The wholesalers provide the final link to those
rural and smaller retailers who cannot purchase directly from the distributors.
Wholesalers receive a margin of four to six percent and margins for retailers vary from 15 to 40 percent,
and the total cost of the distribution network represents between 10 and 20 percent of the final retail
price. As a rule of thumb, retail prices of imported foods are typically two to three times higher than
FOB export prices after tariffs, excise, margins and transportation costs added on. Added costs for
products requiring refrigeration or special handling are even higher.
With the rise of chain restaurants, modern companies specializing in the handling of food have also
emerged. These firms are equipped to comply with rigorous temperature and quality specifications on
behalf of their clients and offer modern warehousing and transportation facilities.
Table 3. India: Imported Food Product Pricing (Margins at Various Channels)
Distribution Channel Margins

Clearing and forwarding agents 4-6 percent
Wholesalers 4-6 percent
Super Stockists 5-7 percent
Distributor 8-12 percent
Importers 10-35 percent
Retailer 15-40 percent
Source: USDA/FAS Analysis
India offers one of the largest English-speaking workforces in the world. Although Hindi is India’s
leading national language, most Indian officials and business people have an excellent command of
English. Most Indian businesspersons have traveled abroad and are familiar with western culture.
Business is not conducted during religious holidays that are observed throughout the many regions and
states of India. Verify holiday information with the Consulate or Embassy before scheduling a visit.
Indian executives prefer late morning or afternoon appointments between 11:00 a.m. and 5:00 p.m.
The climate in India can be hot for most of the year; it is advisable to wear lightweight clothing to avoid
discomfort. Men should wear a jacket and tie (and women should wear corresponding attire) when
making official calls or attending formal occasions. Always present a business card when introducing
yourself and refer to business contacts by their surname, rather than by their given name. Use courtesy
titles such as “Mr.”, “Mrs.”, or “Ms.” Talking about your family and friends is an important part of
establishing a relationship with those involved in the business process. Hospitality is a key part of doing
business in India; most business discussions will not begin until “chai” (tea), coffee, or a soft drink is
served and there has been some preliminary “small talk.” To refuse any beverage outright will likely be
perceived as an insult. Business lunches are preferred to dinners and breakfasts are seldom used for a
meeting. Voice over Internet Protocol (VoIP) tools are used as a more real time means of
communication for Indian businesses especially when time-zones come into play and WhatsApp and
similar other messaging tools are common.
The best time of year to visit India is between October and March, so that the seasons of extreme heat
and rains can be avoided. Although Delhi (the capital) has a cool, pleasant winter (November -
February), summers (April –July) are fierce with temperatures of up to 120 degrees Fahrenheit. Mumbai
(the business hub) and most other major cities have a subtropical climate – hot and humid year around.
Most Indian cities have good hotels and are well connected by domestic airlines.
Advertising and trade promotion in India are creative and well developed. Advertising through
television is especially popular in India and with the growth of cooking shows, there are often
opportunities to co-brand or market products indirectly with the shows or celebrity television chefs.
Although the traditional advertising tools such as radio and television do play an important role in
branding and marketing there is a developing shift and increase in the use of more constant and real-
time social media platforms. With the younger and urban generation of Indian population having an
increased access to technology, social media is becoming a cost effective and penetrative tool of
marketing.
For smaller and new-to-market exporters, targeted promotions are likely a more appropriate and cost-
effective approach to marketing. Indian importers and distributors are generally eager to support
marketing campaigns (e.g., tastings, demonstrations, and point-of-sale information), but often note that
foreign suppliers are unwilling to provide adequate marketing support.
There are a large number of annual trade shows focusing on various aspects of the food sector. These
shows cater to Indian exporters and the domestic food industry, but a few shows are starting to become
viable options for foreign food exporters. Check for FAS India’s GAIN report on agricultural trade
shows for 2017.
General Consumer Tastes and Preferences Twenty to thirty percent of the Indian population remains strictly vegetarian in accordance with the
tenets of Hinduism. Those Hindus who eat meat tend to do so sparingly, either by choice or due to
depressed supplies and distribution, and beef (cow meat) consumption is taboo among Hindus, Jains,
and Sikhs who comprise over 80 percent of India’s population. Furthermore, non-vegetarian food (i.e.,
chicken, lamb/mutton, etc.) is not consumed during special days or religious observances. India’s large
Muslim population (estimated at 160 million) does not consume pork and eats Halal. Many of the non-
vegetarians in India may not eat meat or poultry at home and may consume it only at restaurants or at
food service establishments.
Like its geography and population, India’s cuisine is varied and diverse and is a source of pride to each
region. In general, Indians have a strong preference for freshly cooked products, traditional spices, and
local ingredients. However, the acceptance of packaged, convenience and ready-to-eat food products is
increasing, especially among younger consumers and the urban middle and upper middle class. Many
Indians are willing to try new foods while eating out, but often return to traditional fare at home. Italian,
Chinese, Japanese, Thai, and Mexican foods are among the fastest growing new cuisines in India and
consumers are slowly diversifying their consumption patterns.
Imported food items often spotted in retail stores include dry fruits and nuts, cakes and cake mixes,
chocolates and chocolate syrups, seasonings, biscuits/cookies, canned/packaged fruit juices, canned
soups, pastas/noodles and sauces, olive oils, popcorn, potato chips, canned fish and vegetables, ketchup
and other sauces, breakfast cereals, as well as fresh fruits such as apples, pears, grapes and kiwis. Exotic
items like truffle oil, artisanal cheeses, quinoa, fresh and dried berries like cranberries and blueberries,
etc. are also making their way into the Indian market.
Indian consumers have very traditional habits when it comes to food shopping. They use a variety of
small stores such as bakeries and butchers, as well as push cart vendors, but most dry goods and
household items are purchased from mom-and-pop (or, kirana) stores, which are typically family-
owned outlets found on almost every street corner that usually offer home delivery and a monthly credit
system. The demonetization of 500 and 1000 rupee currency notes in November 2016, led to increased
usage of electronic payment methods including mobile wallets across modern retail as well as kirana
shops and street vendors. Urban, young consumers are bypassing brick-and-mortar retail and
increasingly shopping via e-commerce platforms.
A growing number of people in urban areas are widely travelled and have experienced international
cuisines and branded food products. These consumer groups (mostly young professionals) have higher
levels of disposable income and generally prefer making weekly/monthly purchases of processed foods
and branded products. In general, most of the shopping and food purchasing decisions are made by
women. In households that can afford hired help, domestic employees often do much of the
shopping. Availability of many fresh foods, particularly fruits and vegetables, is seasonal, and people
are accustomed to adjusting their diet to the season.
A typical Indian household will make regular purchases of wheat flours, pulses, rice, edible oils, ghee
(clarified butter), dairy items (milk, butter, yogurt, paneer (cottage cheese), spices and condiments,
pickles, noodles, snack foods, jams and sauces. Most packaged food items are sold in small containers
to keep pricing low and to accommodate limited storage space.
Food Standards and Regulations On August 5, 2011, the Food Safety and Standards Authority of India (FSSAI) formally implemented its
Food Safety and Standards Rules, 2011 as published in the Indian Official Gazette Notification No.
G.S.R. 362 (E). The Food Safety and Standards Rules, 2011 contain the provisions for establishing
enforcement mechanisms, sampling techniques, and other legal aspects instituted under Section 91 of
the Food Safety and Standards Act 2006. The full text of the final Food Safety and Standard Rules,
2011, as well as the later amendments can be accessed on the FSSAI website: www.fssai.gov.in.
On September 11, 2017, India published its new product approval procedures in the Official Gazette of
India and these regulations were termed as Food Safety and Standards (Approval for Non-Specified
Food and Food Ingredients) Regulations, 2017
All food business operators (FBOs) who had earlier submitted applications for approval of their
products before the discontinuation of the product approval system were notified to submit additional
documents/information as per the requirements of the new regulation as well mention their application
number for consideration of their pending applications. The following food and/or food ingredients are
subject to product approval procedures.
a. Novel foods or food containing novel ingredients with no history of human consumption in
India;
b. Food ingredients with a history of human consumption in India, but are not specified under any
other regulations made under the Food Safety and Standards Act, 2006;
c. New additives and processing aids; and
d. Foods manufactured or processed through novel technologies.
For more information on food laws related to food products imported into India please refer to Food and
Agricultural Import Regulations and Standards (FAIRS) - Narrative report (available from the “Exporter
Assistance” category of the FAS GAIN website).
General Import and Inspection Procedures Imported food products can be subject to multiple regulatory authorities that sometimes have
overlapping responsibilities. Importers may need to have an import permit for some consumer-oriented
food products that will subject the item to FSSAI as well as Indian animal health or plant health
scrutiny. Sampling and testing of products is generally coordinated through Indian Customs “Single
Window”. In addition to coordinating product testing, Customs officials will also coordinate with
regulatory authorities to check for items like product label compliance before releasing shipments.

Marketing channels for imported foods often involve several intermediaries. Retailers generally rely on
importers and distributors to handle the clearing and storage of products. Indian firms typically import,
with the help of a clearing and forwarding agent, and distribute food products to retailers or food service
establishments though a few larger, modern retailers have started importing directly for a limited range
of products. While a number of importers have their own warehouses, others may utilize clearing and
forwarding agents to facilitate the storage, movement and distribution of goods given the high cost of
building and maintaining warehouses and maintaining truck fleets. Imported foods enter India from
regional trading hubs such as Dubai, Singapore and Hong Kong as well as directly from supplying
countries. Major importers are located in Mumbai, Delhi, Bengaluru, Hyderabad, and Chennai.
Currently, there are several trade restrictions that limit market access for U.S. food products. Imports of
most animal and livestock-derived food products are effectively banned due to established Indian import
requirements. This includes certain sub-categories in the Harmonized Tariff Schedule under Chapters 2,
3, 4, 5, 16 and 21 (e.g., milk and dairy products, poultry meat, certain seafood, sheep and goat products,
as well as pork products and pet food). Furthermore, imports of beef are banned due to religious
concerns. If allowed, some of these products (e.g., cheeses and poultry) may have good sales potential
for the retail sector.
Effective July 8, 2006, the Government of India’s (GOI) Foreign Trade Policy (2004-2009) specified
that all imports containing products of modern biotechnology must have prior approval from the
Genetic Engineering Approval Committee (GEAC), Ministry of Environment and Forests. The policy
also made a biotech declaration mandatory. Soybean oil and canola oil derived from select events are
the only biotech food/agricultural product currently approved for import. For more information on
India’s biotech import policy, please see –IN7135 Agricultural Biotechnology Annual 2017.
High tariffs on the majority of food items along with prohibitory requirements on certain products
hinder the growth of food imports from the United States. Import tariffs on consumer food products
range from zero to 150 percent, but most products face tariffs in the range of 30 to 40 percent. India’s
tariff structure is such that there is considerable flexibility to raise or lower tariffs as India’s 2016
average bound tariff on agricultural products was 113.5 percent though its average applied tariff was
32.7 percent. Tariffs are subject to review and change, especially at the start of the Indian fiscal year on
April 1. India routinely uses tariff measures to encourage or limit trade and to keep domestic food price
inflation in check and to attempt at ensuring certain commodity prices for local producers.
As mentioned earlier, on July 1, 2017, the GOI enacted a GST, which applies varied rates (zero, five,
twelve, eighteen, and twenty-eight percent) on food products based on their level of importance in the
Indian food basket as well as the level of product processing.

SECTION III: MARKET SECTORS: STRUCTURE AND TRENDS
Food Retail & E-Retail/Online Shopping Growth India’s food retail business is part of the “unorganized” sector and is dominated largely by kirana stores.
These stores account for more than 98 percent of food sales. The emergence of larger chains and stores
began around 2005 and the sector has since grown to over 4,800 supermarkets and 500 hypermarkets
across India.
There are thousands of kirana stores around India and some are the only source of imported food
products in their cities. These small stores are an important sales platform for imported food and
beverages. The modern retail sector, which includes a mix of supermarkets, hypermarkets, specialty and
gourmet stores, and convenience stores, is dominated by large Indian companies. Several foreign
retailers have established wholesale operations or “cash and carry” formats in line with India’s previous
foreign direct investment regulations. (Refer to GAIN IN7166: Foreign Direct Investment in Retail
Permitted with Limitations)
Owing to India’s growing access to the internet, e-retail/online shopping is seeing steady growth. Indian
consumers are gaining confidence when it comes to purchasing products over the internet and
transacting business online. Convenience in shopping from the comfort of one’s home, competitive
pricing, and innovative offers are pulling consumers towards online shopping for groceries and other
fast-moving consumer goods.

For more information, see the GAIN report IN7151 Retail Foods Annual 2017.
Food Service – Hotels, Restaurants and Institutional sector As per the 2016 India food service report published by the National Restaurant Association of India
(NRAI), the total food service market is valued at U.S. $48.3 billion (INR 309,110 crores) and is
expected to grow to U.S. $77.8 billion (INR 498,130 crores) by 2021.
India has strong domestic hotel chains, including Indian Hotels Ltd. (Taj Group), East India Hotels
Company Ltd. (Oberoi Group), ITC Ltd. (Welcome Group), as well as Asian Hotel and Leela Venture.
Several international chains such as Starwood Group, Radisson, Four Seasons, Best Western, Hilton,
Marriott, Country Inn and Suites by Carlson, and Quality Inn have an established presence through
franchising.
India has a vast hotel sector, but only a small percentage of hotels are considered three stars and above.
The overwhelming majority of hotels are small, traditional outlets that provide inexpensive
accommodations for travelers and source all of their food locally. According to the GOI, Ministry of
Tourism, there are over 1903 hotels and resorts in India that constitute the “organized” or modern
sector. Hotels in this segment are concentrated in major metropolitan cities such as New Delhi,
Mumbai, Chennai, Bengaluru, Pune, Hyderabad, and Kolkata, and are now spreading to middle-tier
cities and along major tourist circuits. Most of the 5-star business is generated from business
travelers. The mid-market segment (comprised of 3- and 4-star hotels) caters to a mix of business and
leisure travelers and is concentrated in second-tier cities and in major tourist locations. The budget
segment (2-star ratings or below) is present in most towns and cities and would not be an opportunity
for imported consumer-food products aside from some rare instances.
Premium and mid-market hotels source most of their food needs from local distributors who present the
best opportunity for accessing the hotel sector. Hotels typically contract with local distributors on
centralized annual supply contracts. Some hotels import directly through consolidators in Europe, the
Middle East or Asia. Some hotels have the option of obtaining products duty-free against their foreign
exchange earnings and typically do so via distributors who have bonded warehouses that can supply
duty-free goods. When sourcing imported goods from local distributors, hotels tend to focus on branded
specialty products that are not available in the local market and may often choose to make some goods
in house from both imported and local ingredients.
India has witnessed a sizeable shift in its Casual Ding Restaurant (CDR) and Quick Service Restaurant
(QSR) sector. CDRs and QSRs have gone from largely serving Indian snacks to now serving western
foods with an Indian flavor. Chains and franchises, both international and local, are doing well in major
urban areas and are spreading into smaller cities. Restaurants and hotels are “Indianizing” foods to
better meet consumer preferences Some outlets serve exclusively vegetarian food, catering to the
country’s large vegetarian population.
Although fast food chains source most of their raw materials locally, some ingredients that are not
available in India are imported. In the past few years, the “coffee shop” culture has spread throughout
major cities and seems poised for further growth. While coffee import tariffs are high, suppliers of
specialty ingredients and syrups may find opportunities in this sector.
For additional information, please refer to GAIN report IN7149 Food Service – 2017 Hotel, Restaurant,

and Institutional Annual as well as GAIN report IN7160 – Restaurant Sector Growing Back on Course.
Food Processing According to the India Brand Equity Foundation (IBEF) 2017 Indian Food Processing report, the Indian
food processing industry accounts for 32 percent of the country’s total food market. It contributes
around 8.8 and 8.4 percent of Gross Value Added (GVA) in Manufacturing and Agriculture,
respectively. In addition, it accounts for 13 percent of India’s exports and six percent of total industrial
investment. According to the latest Annual Survey of Industries, there are 37,175 registered food
processing units in the country with 1.7 million people employed in the sector, including substantial
women participation of approximately 0.26 million, in the manufacturing of food products and
beverages. According to the Ministry of Commerce, the food processing industry has attracted
investment valued at U.S. $8.3 million during 2000-17. A large segment of the Indian FPI still operates
in the “unorganized” sector or informal sector.
The almost year-round availability of fresh products across the country, combined with consumers’
preference for fresh products and freshly cooked foods, has tempered the demand for processed food
products in the past. However, changing lifestyle, rising consumer health consciousness and
consumption patterns cited in this report, have proved to be a key influence on the demand for
convenient and hygienic foods is on the rise. Industry sources estimate that over 400 million consumers
consume some type of processed food regularly.
Food processors are introducing new products and traditional recipes using improved technology,
innovative packaging, and aggressive marketing. For ingredients that are not available in India,
processors turn to imports and typically source through importers specializing in food ingredients. Food
ingredients sourced by Indian food processing companies from the U.S. were valued at $160 million in
2016 and include protein concentrates, animal feed preparations, peptones, vegetable seeds, mucilage
and thickeners, mixtures odoriferous substances, palmitic acid, stearic acid, essential oils, vegetable saps
and extracts
Domestic food laws restrict the use of a number of ingredients, flavors, colors, and additives. Exporters
should work with potential importers to ensure that their ingredients have market access. For details
about India’s Food Processing Industry, please see GAIN report IN7150 Food Processing Ingredients
Annual 2017.
SECTION IV. BEST CONSUMER-ORIENTED PRODUCT PROSPECTS: Category 1: Products Present in the Market that Have Good Sales Potential
Product
Types
Import
Value
($
Million
)
CY
2016
Import
Volume
(Metric
Tons)
CY 2016
5–yr.
Impor
t
growt
h by
value
(in %)
Basic
Import
Tariff
Key
Constraints
Market
Attractivenes
s For USA
Tree Nuts
(mainly
Almonds and
1,066 200,384 18 In shell
Almond
(Rs. 35/
Competition
from other
suppliers exists
High demand
and growing
retail industry

walnuts)* Kg)
Pistachi
o (10%)
but is not
substantial
Cocoa and
Cocoa
Preparations
205 53,715 10
30%
Strong
competition
from domestic
and
international
suppliers
Strong quality
and brand
preference
Leguminous
Vegetables,
Dried
Shelled/Pulse
s
3,613 5,414,320 12
30% to
50%
Price
competitiveness
, freight
advantage and
the ability to
produce
specific kind of
pulses
demanded in
India.
Local
production is
inadequate
and more than
20% of total
demand for
pulses is met
through
imports.
Apples, Pears
and Quinces
Fresh
236 215,676 10
Apples
50%
Pears
30%
Competition
from domestic
and foreign
suppliers like
Chile, and New
Zealand
Seasonal
shortages and
high prices,
increasing
interest in
quality fruits
and growth of
organized
retail
Grapes Fresh
or Dried
66 202,259 21
30%
Competition
from domestic
and foreign
suppliers
Seasonal
shortages and
high prices,
increasing
interest in
quality fruits
and growth of
organized
retail
Fruit Juices 33 20,542
liters
3
30%
Competition
from domestic
manufactures
and foreign
suppliers from
neighboring
countries
Increasing
health
awareness and
shortage of
quality
products
Beverages,
Spirits and
569 392,140,30
2 liters
16 150%
High import
duty
Growing
consumption

Vinegar and lack of
domestic
production
SECTION V. POST CONTACT AND FURTHER INFORMATION Foreign Agricultural Service, Embassy of the United States of America
Chanakyapuri, New Delhi - 110 021
Phone: 91-11-2419-8000, Fax: 91-11-2419-8530
E-Mail: [email protected]
Twitter: @USDAIndia
Web: http://newdelhi.usembassy.gov/foreign_agricultural_service.html
Office of Agricultural Affairs, American Consulate General
C-49, G-Block, Bandra Kurla Complex, Bandra (E)
Mumbai - 400 051
Phone: 91-22-2672-4863
E-mail: [email protected]
Twitter: @USDAIndia
Web: http://mumbai.usconsulate.gov/business/agriculture-related-business.html
The following reports may be of interest to U.S. exporters. These, and related reports, can be accessed
via the FAS Home Page: www.fas.usda.gov by clicking on “Data & Analysis” and then selecting GAIN
reports and choosing the “search reports” function.
Report Number Subject
IN 7149 Food Service - HRI 2017
IN 7150 Food Processing Ingredients 2017
IN 7151 Retail Foods 2017
IN 7152 Food and Agricultural Import Regulations and Standards – Narrative
IN 7135 Agricultural Biotechnology Annual 2017
IN 7153 India Food and Agricultural Trade Show Calendar 2017
APPENDIX A – STATISTICS
TABLE A: India. Key Trade and Demographic Information Agricultural imports from all countries (USD billion)
1 / U.S. market share 24/5.35 %
Consumer Food Imports from all countries (USD billion)1 / U.S. market share 4.25/17.26%
Edible fishery imports from all countries3 (USD million)
1/ U.S. market share 64/20.14%
Total Population2 1.282 billion
Urban population2 429 million
Rural population2 853 million
Number of major metropolitan areas3 (with a population of a million or more) 53
Population Density4 (People per square kilometer) 431
Proportion of population below 6 years2/ percentage 10.8 percent
Proportion of population above 7 years2 87.4 percent
Per capita Gross Domestic Product in CY 16 (USD)4 $6,700
Unemployment Rate 20164 8 percent
Exchange Rate Rs. Per USD (as of December 20, 2017) 5 64.0577
Source: USDA/FAS Global Trade Database1 ; U.S. Census Bureau
2 Census of India 2011
3 ; CIA World Factbook
4; Reserve
Bank of India5
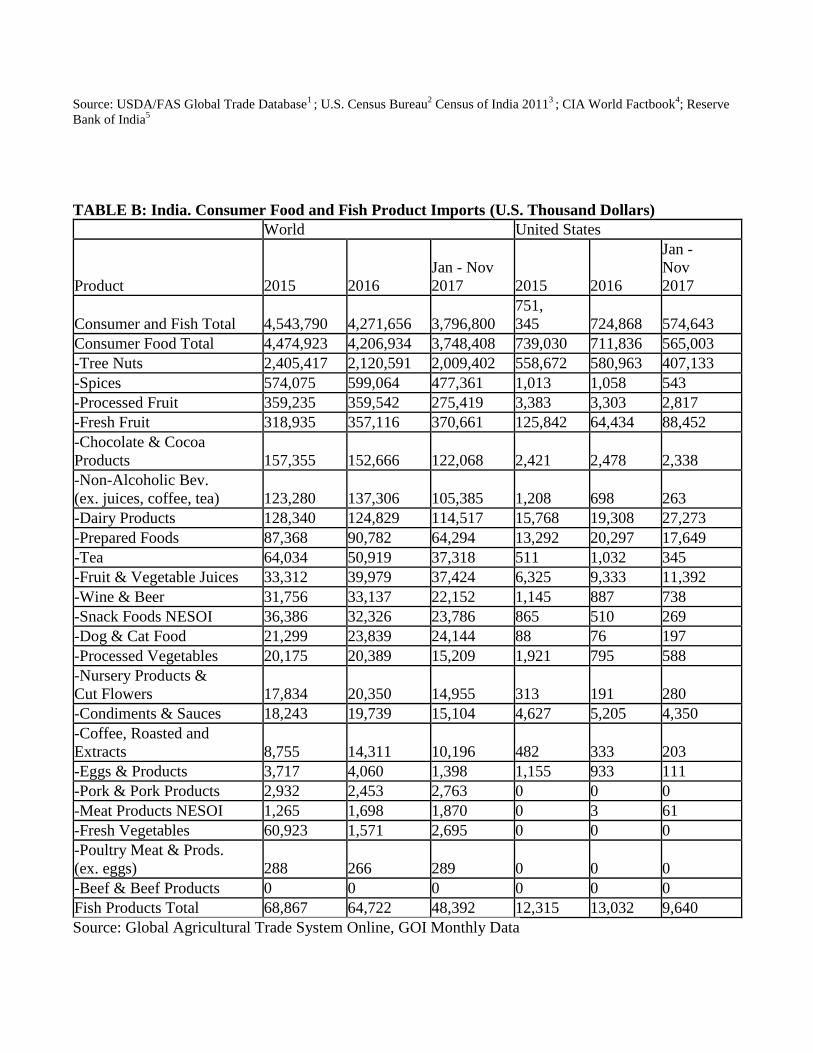
TABLE B: India. Consumer Food and Fish Product Imports (U.S. Thousand Dollars)
World United States
Product 2015 2016
Jan - Nov
2017 2015 2016
Jan -
Nov
2017
Consumer and Fish Total 4,543,790 4,271,656 3,796,800
751,
345 724,868 574,643
Consumer Food Total 4,474,923 4,206,934 3,748,408 739,030 711,836 565,003
-Tree Nuts 2,405,417 2,120,591 2,009,402 558,672 580,963 407,133
-Spices 574,075 599,064 477,361 1,013 1,058 543
-Processed Fruit 359,235 359,542 275,419 3,383 3,303 2,817
-Fresh Fruit 318,935 357,116 370,661 125,842 64,434 88,452
-Chocolate & Cocoa
Products 157,355 152,666 122,068 2,421 2,478 2,338
-Non-Alcoholic Bev.
(ex. juices, coffee, tea) 123,280 137,306 105,385 1,208 698 263
-Dairy Products 128,340 124,829 114,517 15,768 19,308 27,273
-Prepared Foods 87,368 90,782 64,294 13,292 20,297 17,649
-Tea 64,034 50,919 37,318 511 1,032 345
-Fruit & Vegetable Juices 33,312 39,979 37,424 6,325 9,333 11,392
-Wine & Beer 31,756 33,137 22,152 1,145 887 738
-Snack Foods NESOI 36,386 32,326 23,786 865 510 269
-Dog & Cat Food 21,299 23,839 24,144 88 76 197
-Processed Vegetables 20,175 20,389 15,209 1,921 795 588
-Nursery Products &
Cut Flowers 17,834 20,350 14,955 313 191 280
-Condiments & Sauces 18,243 19,739 15,104 4,627 5,205 4,350
-Coffee, Roasted and
Extracts 8,755 14,311 10,196 482 333 203
-Eggs & Products 3,717 4,060 1,398 1,155 933 111
-Pork & Pork Products 2,932 2,453 2,763 0 0 0
-Meat Products NESOI 1,265 1,698 1,870 0 3 61
-Fresh Vegetables 60,923 1,571 2,695 0 0 0
-Poultry Meat & Prods.
(ex. eggs) 288 266 289 0 0 0
-Beef & Beef Products 0 0 0 0 0 0
Fish Products Total 68,867 64,722 48,392 12,315 13,032 9,640
Source: Global Agricultural Trade System Online, GOI Monthly Data

Table C. Top 15 Suppliers of Consumer Foods and Fish Products (U.S. Thousand Dollars)
2015 2016
Jan - Nov
2017
World 4,543,790 4,271,656 3,796,800
1 United States 751,345 724,868 574,643
2 Ivory Coast 414,936 325,977 274,238
3 Tanzania 223,673 241,381 250,824
4 Guinea-Bissau 197,157 210,392 193,906
5 Vietnam 165,481 196,939 145,880
6 Afghanistan 227,563 189,436 166,628
7 Indonesia 170,819 179,074 125,337
8 Nepal 191,676 175,847 128,220
9 China 79,714 164,680 161,727
10 Sri Lanka 260,781 135,478 151,475
12 Pakistan 101,877 123,940 85,506
11 Benin 191,943 123,627 119,981
13 Iran 117,884 111,873 99,895
14 Australia 162,411 97,584 122,861
15 Madagascar 101,694 74,501 73,469
All Others 1,184,836 1,196,059 1,122,210
Source: Global Agricultural Trade System Online, GOI Monthly Data
APPENDIX B: U.S. BASED COOPERATORS OR STATE AND REGIONAL TRADE GROUPS
RECENTLY ACTIVE IN INDIA
Almond Board of California www.almondboard.com
American Pistachio Growers wwwamericanpistachios.org/
American Hardwood Export Council http://www.americanhardwood.org/
California Table Grape Commission www.tablegrape.com
California Walnut Board & Commission http://www.walnuts.org/walnuts/
California Olive Committee http://calolive.org
Cotton Council International www.cottonusa.org
Cranberry Marketing Committee http://www.uscranberries.com/
Distilled Spirits Council of the United States http://www.discus.org/index.asp
Food Export Association of the Midwest USA www.foodexport.org
Food Export USA-Northeast www.foodexport.usa.org
Pear Bureau Northwest www.usapears.org
Softwood Export Council http://www.softwood.org/
Southern United States Trade Association www.susta.org

U.S. Apple Export Council http://www.usaapples.com/en/index.html
U.S. Dry Bean Council https://www.usdrybeans.com/
U.S. Dry Pea and Lentil Council www.pea-lentil.com
U.S. Highbush Blueberry Council http://www.blueberry.us/home.html
U.S. Grains Council www.grains.org
U.S. Pecan Council http://www.uspecans.org/
U.S. Soybean Export Council, Inc. www.ussec.org
Washington State Apple Commission www.bestapples.com