India O˜ce Property Market Overview - Colliers … insights...West LafargeHolcim Gigaplex 50,000...
22
India Office Property Market Overview Q3 2017
Transcript of India O˜ce Property Market Overview - Colliers … insights...West LafargeHolcim Gigaplex 50,000...

India O�ce PropertyMarket OverviewQ3 2017

Positive outlook
despite slowdown
in economy Surabhi Arora Senior Associate Director | India
Although, India's real GDP went further down to 5.7% in Q2 2017, the yearly forecast projection remains above 6.7%. The economy is trying to adjust to the aftermath of several major government reforms executed in 2017 resulting in a temporary slowdown. However, office market remained upbeat with increased investor activity, sustained leasing demand from technology companies and growing leasing interest from various industry occupiers like manufacturing, coworking, logistics and warehousing. We expect the commercial real estate market to remain on track with sustained demand from occupiers in short to medium term.
Forecast at a glance
Demand Primarily dominated by technology, engineering and banking sector; coworking operators and warehousing to gain traction
Supply About 90 million sq ft (0.8 million sq m) is under various stage of construction across India which is likely to complete in next three years, a 16% increase in current total stock
Vacancy rate Vacancy level to remain mostly stable; may shrink by 2-3% in select micromarkets of technology driven cities like Pune, Bengaluru, Chennai and Hyderabad
Rent South city rentals continued the upward growth trajectory; average annual increase of 4-5% over the next three years likely
Price May increase by 2-3% over the next three years as investor activity is set to rise
Sustained leasing momentum in Q3 2017
Notwithstanding the slowdown in the overall economy,
the office market has continued to perform well in 2017
so far. With about 10 million sq ft (0.9 million sq m) of
office leasing in Q3, gross absorption totalled around
28.9 million sq ft (2.7 million sq m) over the first nine
months. Although the number represents a marginal
decline of about 1% from last year's absorption during
the same period, we expect leasing momentum to pick
up in Q4 2017 and maintain our yearly forecast of more
than 40 million sq ft (3.7 million sq m) for 2017.
Bengaluru remained the frontrunner in office leasing with
a 31% share of overall demand followed by the NCR on
25%, Hyderabad and Chennai on 12% each, Mumbai on
10%, Pune on 8% and Kolkata on 2%. The traditional
demand driver of the Indian office market, technology
occupiers, represented 39% of total absorption. Banking,
Financial Services and Insurance (BFSI) also formed the
bulk of transactions and accounted for 17% of total
absorption.
With a 7% share of total leasing volume in Q3 2017,
coworking operators are making their presence felt in the
market. Besides its cost-effectiveness and flexibility, use
of coworking space is becoming more popular due to
increasing uncertainty among occupiers regarding their
future headcount growth. We expect the coworking
concept to expand in the short to medium term, notably
in cities such as Mumbai, Bengaluru and Gurgaon.
According to Oxford Economics Asia City Outlook report,
Indian cities should continue their rapid pace of growth
and dominate the top of the growth rankings. Moreover,
initial reports over GST collections are encouraging, with
the new tax generating larger than anticipated revenues
indicating a revival of the economy soon.
In our opinion, the commercial market is set to remain
stable despite the economic slowdown and increasing
concern about disruption from artificial intelligence,
automation and stringent data security laws. In our view,
while artificial intelligence has the potential to disrupt the
Indian property market significantly, in the long run it
should also drive productivity and create new
opportunities for developers which embrace it early.
Colliers Quarterly
INDIA | OFFICE Q3 2017 24 October 2017
[Type here]
Contents Executive Summary | India | Positive outlook despite slowdown in economy ........................................................... 2
Mumbai | Leasing activity to gain momentum by Q1 2018 ..................... 4
Delhi | Leasing momentum to continue in Q4 .................................................. 6
Gurugram (Gurgaon) | Upcoming supply to complement demand .......... 8
NOIDA | Average rents likley to remain stable ............................................... 10
Bengaluru | Strong upcoming supply to keep up with demand ........................ 12
Chennai | Stable demand scenario likely ................................................. 14
Hyderabad | IT-ITeS expansions to drivedemand............................................. 16
Pune | Optimistic outlook at the back of upcoming supply ............................ 18
Kolkata | Stable leasing momentum to persist .............................................. 20
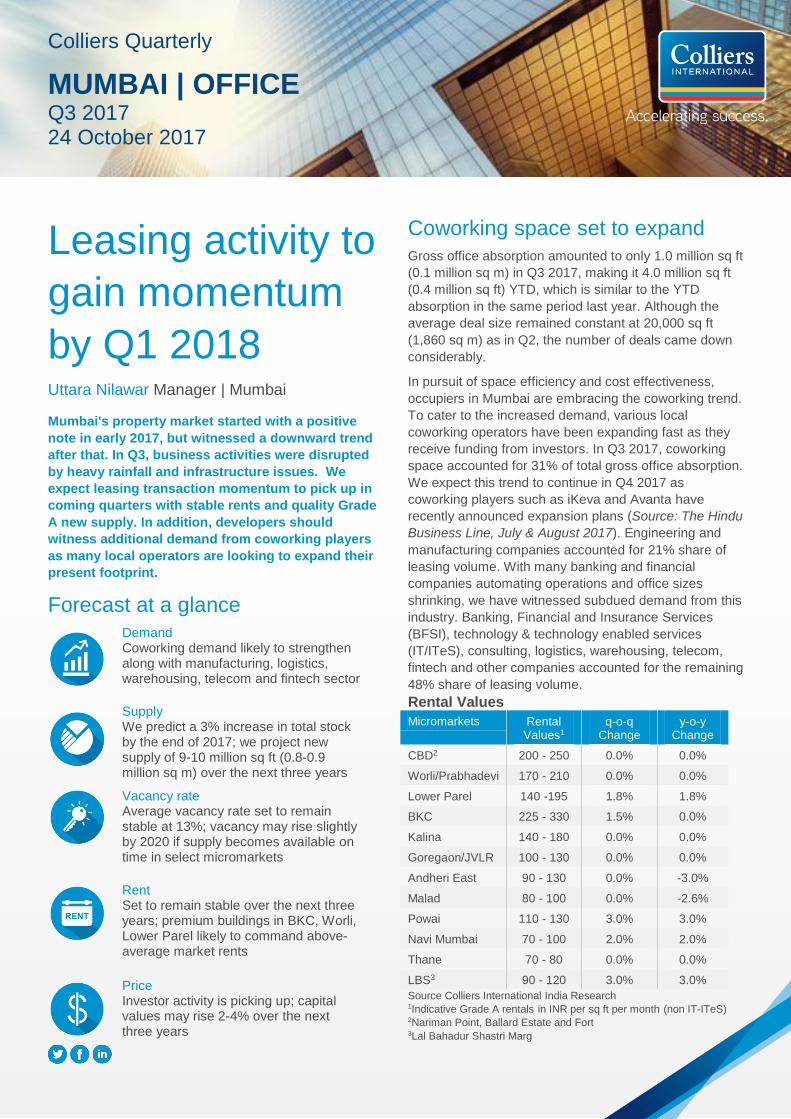
Leasing activity to
gain momentum
by Q1 2018 Uttara Nilawar Manager | Mumbai
Mumbai's property market started with a positive
note in early 2017, but witnessed a downward trend
after that. In Q3, business activities were disrupted
by heavy rainfall and infrastructure issues. We
expect leasing transaction momentum to pick up in
coming quarters with stable rents and quality Grade
A new supply. In addition, developers should
witness additional demand from coworking players
as many local operators are looking to expand their
present footprint.
Forecast at a glance
Demand Coworking demand likely to strengthen along with manufacturing, logistics, warehousing, telecom and fintech sector
Supply We predict a 3% increase in total stock by the end of 2017; we project new supply of 9-10 million sq ft (0.8-0.9 million sq m) over the next three years
Vacancy rate Average vacancy rate set to remain stable at 13%; vacancy may rise slightly by 2020 if supply becomes available on time in select micromarkets
Rent Set to remain stable over the next three years; premium buildings in BKC, Worli, Lower Parel likely to command above-average market rents
Price Investor activity is picking up; capital values may rise 2-4% over the next three years
Coworking space set to expand
Gross office absorption amounted to only 1.0 million sq ft
(0.1 million sq m) in Q3 2017, making it 4.0 million sq ft
(0.4 million sq ft) YTD, which is similar to the YTD
absorption in the same period last year. Although the
average deal size remained constant at 20,000 sq ft
(1,860 sq m) as in Q2, the number of deals came down
considerably.
In pursuit of space efficiency and cost effectiveness,
occupiers in Mumbai are embracing the coworking trend.
To cater to the increased demand, various local
coworking operators have been expanding fast as they
receive funding from investors. In Q3 2017, coworking
space accounted for 31% of total gross office absorption.
We expect this trend to continue in Q4 2017 as
coworking players such as iKeva and Avanta have
recently announced expansion plans (Source: The Hindu
Business Line, July & August 2017). Engineering and
manufacturing companies accounted for 21% share of
leasing volume. With many banking and financial
companies automating operations and office sizes
shrinking, we have witnessed subdued demand from this
industry. Banking, Financial and Insurance Services
(BFSI), technology & technology enabled services
(IT/ITeS), consulting, logistics, warehousing, telecom,
fintech and other companies accounted for the remaining
48% share of leasing volume.
Rental Values
Micromarkets Rental Values1
q-o-q Change
y-o-y Change
CBD2 200 - 250 0.0% 0.0%
Worli/Prabhadevi 170 - 210 0.0% 0.0%
Lower Parel 140 -195 1.8% 1.8%
BKC 225 - 330 1.5% 0.0%
Kalina 140 - 180 0.0% 0.0%
Goregaon/JVLR 100 - 130 0.0% 0.0%
Andheri East 90 - 130 0.0% -3.0%
Malad 80 - 100 0.0% -2.6%
Powai 110 - 130 3.0% 3.0%
Navi Mumbai 70 - 100 2.0% 2.0%
Thane 70 - 80 0.0% 0.0%
LBS3 90 - 120 3.0% 3.0%
Source Colliers International India Research 1Indicative Grade A rentals in INR per sq ft per month (non IT-ITeS) 2Nariman Point, Ballard Estate and Fort 3Lal Bahadur Shastri Marg
Colliers Quarterly
MUMBAI | OFFICE Q3 2017 24 October 2017
2 Colliers Quarterly | Q3 2017
24 October 2017 | mumbai | OFFICE | Colliers International
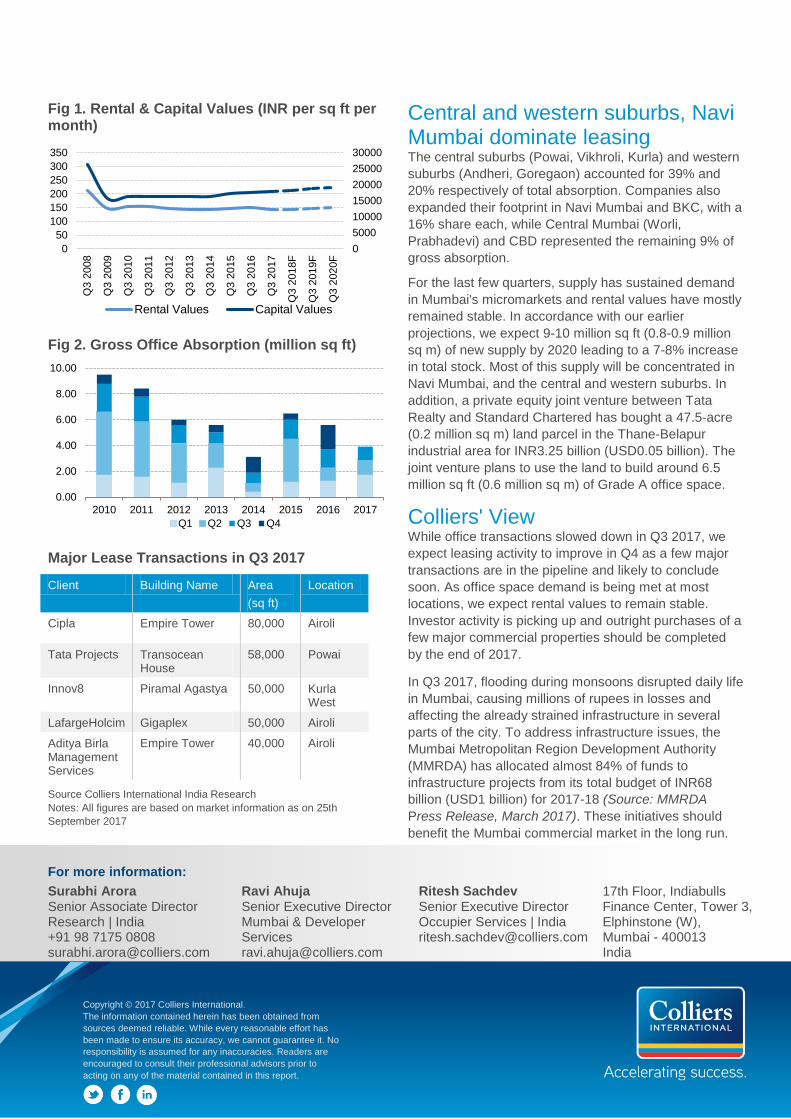
Fig 1. Rental & Capital Values (INR per sq ft per month)
Fig 2. Gross Office Absorption (million sq ft)
Major Lease Transactions in Q3 2017
Client Building Name Area
(sq ft)
Location
Cipla Empire Tower 80,000 Airoli
Tata Projects Transocean House
58,000 Powai
Innov8 Piramal Agastya 50,000 Kurla West
LafargeHolcim Gigaplex 50,000 Airoli
Aditya Birla Management Services
Empire Tower 40,000 Airoli
Source Colliers International India Research
Notes: All figures are based on market information as on 25th
September 2017
Central and western suburbs, Navi Mumbai dominate leasing The central suburbs (Powai, Vikhroli, Kurla) and western
suburbs (Andheri, Goregaon) accounted for 39% and
20% respectively of total absorption. Companies also
expanded their footprint in Navi Mumbai and BKC, with a
16% share each, while Central Mumbai (Worli,
Prabhadevi) and CBD represented the remaining 9% of
gross absorption.
For the last few quarters, supply has sustained demand
in Mumbai's micromarkets and rental values have mostly
remained stable. In accordance with our earlier
projections, we expect 9-10 million sq ft (0.8-0.9 million
sq m) of new supply by 2020 leading to a 7-8% increase
in total stock. Most of this supply will be concentrated in
Navi Mumbai, and the central and western suburbs. In
addition, a private equity joint venture between Tata
Realty and Standard Chartered has bought a 47.5-acre
(0.2 million sq m) land parcel in the Thane-Belapur
industrial area for INR3.25 billion (USD0.05 billion). The
joint venture plans to use the land to build around 6.5
million sq ft (0.6 million sq m) of Grade A office space.
Colliers' View While office transactions slowed down in Q3 2017, we
expect leasing activity to improve in Q4 as a few major
transactions are in the pipeline and likely to conclude
soon. As office space demand is being met at most
locations, we expect rental values to remain stable.
Investor activity is picking up and outright purchases of a
few major commercial properties should be completed
by the end of 2017.
In Q3 2017, flooding during monsoons disrupted daily life
in Mumbai, causing millions of rupees in losses and
affecting the already strained infrastructure in several
parts of the city. To address infrastructure issues, the
Mumbai Metropolitan Region Development Authority
(MMRDA) has allocated almost 84% of funds to
infrastructure projects from its total budget of INR68
billion (USD1 billion) for 2017-18 (Source: MMRDA
Press Release, March 2017). These initiatives should
benefit the Mumbai commercial market in the long run.
0
5000
10000
15000
20000
25000
30000
0
50
100
150
200
250
300
350
Q3 2
008
Q3 2
009
Q3 2
010
Q3 2
011
Q3 2
012
Q3 2
013
Q3 2
014
Q3 2
015
Q3 2
016
Q3 2
017
Q3 2
018F
Q3 2
019F
Q3 2
020F
Rental Values Capital Values
0.00
2.00
4.00
6.00
8.00
10.00
2010 2011 2012 2013 2014 2015 2016 2017
Q1 Q2 Q3 Q4
For more information:
Surabhi Arora Senior Associate Director Research | India +91 98 7175 0808 [email protected]
Ravi Ahuja Senior Executive Director Mumbai & Developer Services [email protected]
Ritesh Sachdev Senior Executive Director Occupier Services | India [email protected]
17th Floor, Indiabulls Finance Center, Tower 3, Elphinstone (W), Mumbai - 400013 India
Copyright © 2017 Colliers International.
The information contained herein has been obtained from
sources deemed reliable. While every reasonable effort has
been made to ensure its accuracy, we cannot guarantee it. No
responsibility is assumed for any inaccuracies. Readers are
encouraged to consult their professional advisors prior to
acting on any of the material contained in this report.
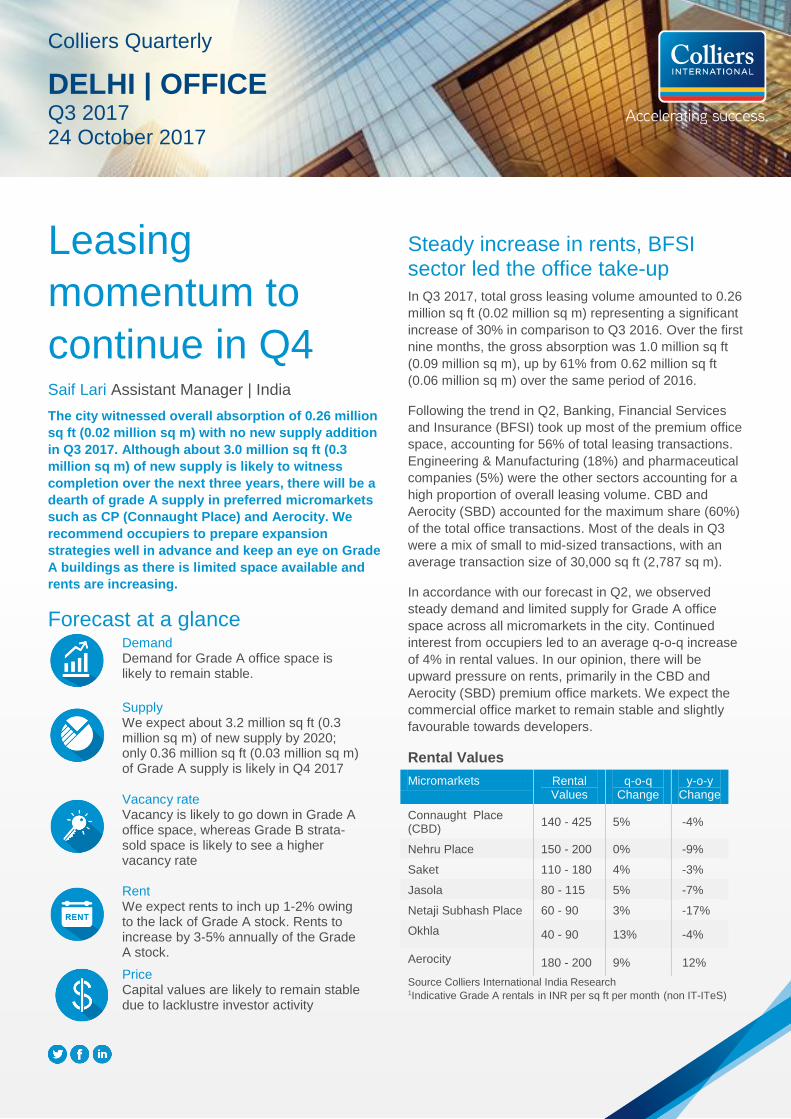
Leasing
momentum to
continue in Q4 Saif Lari Assistant Manager | India
The city witnessed overall absorption of 0.26 million
sq ft (0.02 million sq m) with no new supply addition
in Q3 2017. Although about 3.0 million sq ft (0.3
million sq m) of new supply is likely to witness
completion over the next three years, there will be a
dearth of grade A supply in preferred micromarkets
such as CP (Connaught Place) and Aerocity. We
recommend occupiers to prepare expansion
strategies well in advance and keep an eye on Grade
A buildings as there is limited space available and
rents are increasing.
Forecast at a glance Demand Demand for Grade A office space is likely to remain stable.
Supply We expect about 3.2 million sq ft (0.3 million sq m) of new supply by 2020; only 0.36 million sq ft (0.03 million sq m) of Grade A supply is likely in Q4 2017
Vacancy rate Vacancy is likely to go down in Grade A office space, whereas Grade B strata-sold space is likely to see a higher vacancy rate
Rent We expect rents to inch up 1-2% owing to the lack of Grade A stock. Rents to increase by 3-5% annually of the Grade A stock.
Price Capital values are likely to remain stable due to lacklustre investor activity
Steady increase in rents, BFSI sector led the office take-up
In Q3 2017, total gross leasing volume amounted to 0.26
million sq ft (0.02 million sq m) representing a significant
increase of 30% in comparison to Q3 2016. Over the first
nine months, the gross absorption was 1.0 million sq ft
(0.09 million sq m), up by 61% from 0.62 million sq ft
(0.06 million sq m) over the same period of 2016.
Following the trend in Q2, Banking, Financial Services
and Insurance (BFSI) took up most of the premium office
space, accounting for 56% of total leasing transactions.
Engineering & Manufacturing (18%) and pharmaceutical
companies (5%) were the other sectors accounting for a
high proportion of overall leasing volume. CBD and
Aerocity (SBD) accounted for the maximum share (60%)
of the total office transactions. Most of the deals in Q3
were a mix of small to mid-sized transactions, with an
average transaction size of 30,000 sq ft (2,787 sq m).
In accordance with our forecast in Q2, we observed
steady demand and limited supply for Grade A office
space across all micromarkets in the city. Continued
interest from occupiers led to an average q-o-q increase
of 4% in rental values. In our opinion, there will be
upward pressure on rents, primarily in the CBD and
Aerocity (SBD) premium office markets. We expect the
commercial office market to remain stable and slightly
favourable towards developers.
Rental Values
Micromarkets Rental Values
q-o-q Change
y-o-y Change
Connaught Place (CBD)
140 - 425 5% -4%
Nehru Place 150 - 200 0% -9%
Saket 110 - 180 4% -3%
Jasola 80 - 115 5% -7%
Netaji Subhash Place 60 - 90 3% -17%
Okhla 40 - 90 13% -4%
Aerocity 180 - 200 9% 12%
Source Colliers International India Research 1Indicative Grade A rentals in INR per sq ft per month (non IT-ITeS)
Colliers Quarterly
DELHI | OFFICE Q3 201724 October 2017
2 Colliers Quarterly | Q3 2017 24 October 2017 | delhi | office |
Colliers International
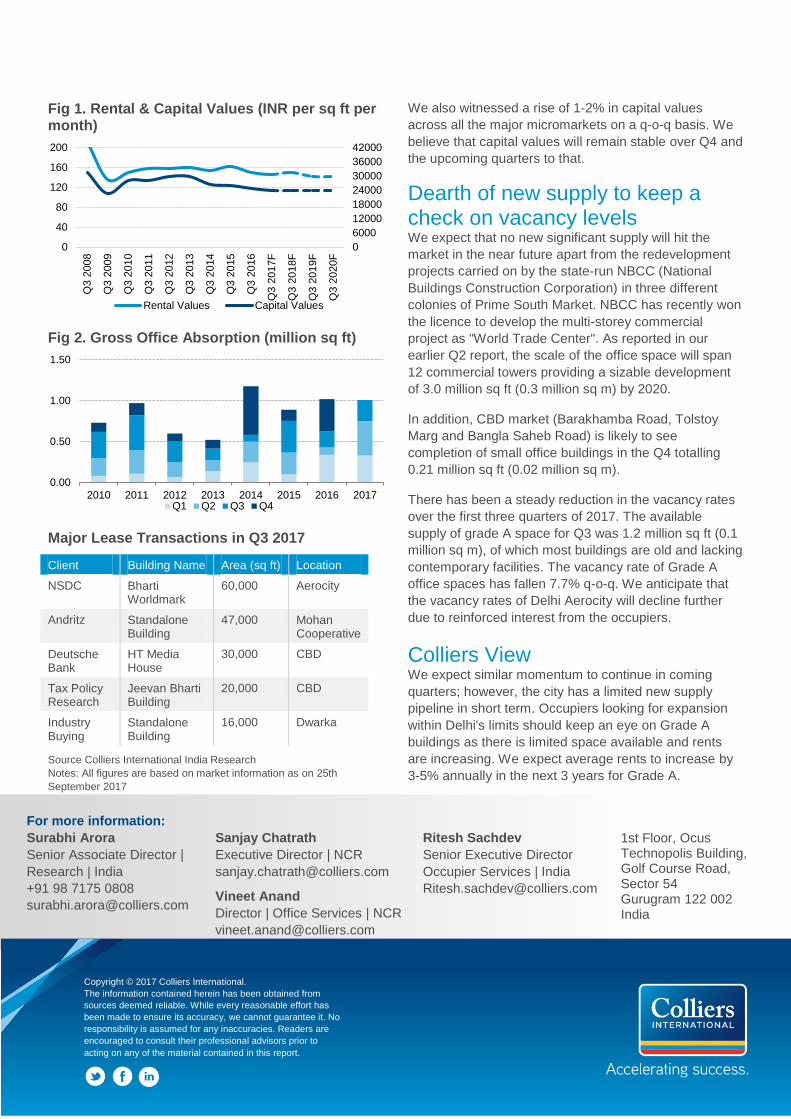
Fig 1. Rental & Capital Values (INR per sq ft per month)
Fig 2. Gross Office Absorption (million sq ft)
Major Lease Transactions in Q3 2017
Client Building Name Area (sq ft) Location
NSDC Bharti Worldmark
60,000 Aerocity
Andritz Standalone Building
47,000 Mohan Cooperative
Deutsche Bank
HT Media House
30,000 CBD
Tax Policy Research
Jeevan Bharti Building
20,000 CBD
Industry Buying
Standalone Building
16,000 Dwarka
Source Colliers International India Research
Notes: All figures are based on market information as on 25th
September 2017
We also witnessed a rise of 1-2% in capital values
across all the major micromarkets on a q-o-q basis. We
believe that capital values will remain stable over Q4 and
the upcoming quarters to that.
Dearth of new supply to keep a check on vacancy levels We expect that no new significant supply will hit the
market in the near future apart from the redevelopment
projects carried on by the state-run NBCC (National
Buildings Construction Corporation) in three different
colonies of Prime South Market. NBCC has recently won
the licence to develop the multi-storey commercial
project as "World Trade Center". As reported in our
earlier Q2 report, the scale of the office space will span
12 commercial towers providing a sizable development
of 3.0 million sq ft (0.3 million sq m) by 2020.
In addition, CBD market (Barakhamba Road, Tolstoy
Marg and Bangla Saheb Road) is likely to see
completion of small office buildings in the Q4 totalling
0.21 million sq ft (0.02 million sq m).
There has been a steady reduction in the vacancy rates
over the first three quarters of 2017. The available
supply of grade A space for Q3 was 1.2 million sq ft (0.1
million sq m), of which most buildings are old and lacking
contemporary facilities. The vacancy rate of Grade A
office spaces has fallen 7.7% q-o-q. We anticipate that
the vacancy rates of Delhi Aerocity will decline further
due to reinforced interest from the occupiers.
Colliers View We expect similar momentum to continue in coming
quarters; however, the city has a limited new supply
pipeline in short term. Occupiers looking for expansion
within Delhi's limits should keep an eye on Grade A
buildings as there is limited space available and rents
are increasing. We expect average rents to increase by
3-5% annually in the next 3 years for Grade A.
0
6000
12000
18000
24000
30000
36000
42000
0
40
80
120
160
200
Q3 2
008
Q3 2
009
Q3 2
010
Q3 2
011
Q3 2
012
Q3 2
013
Q3 2
014
Q3 2
015
Q3 2
016
Q3 2
017F
Q3 2
018F
Q3 2
019F
Q3 2
020F
Rental Values Capital Values
0.00
0.50
1.00
1.50
2010 2011 2012 2013 2014 2015 2016 2017Q1 Q2 Q3 Q4
For more information:
Surabhi Arora
Senior Associate Director |
Research | India
+91 98 7175 0808
Sanjay Chatrath
Executive Director | NCR
Vineet Anand
Director | Office Services | NCR
Ritesh Sachdev
Senior Executive Director
Occupier Services | India
1st Floor, Ocus Technopolis Building, Golf Course Road, Sector 54 Gurugram 122 002 India
Copyright © 2017 Colliers International.
The information contained herein has been obtained from
sources deemed reliable. While every reasonable effort has
been made to ensure its accuracy, we cannot guarantee it. No
responsibility is assumed for any inaccuracies. Readers are
encouraged to consult their professional advisors prior to
acting on any of the material contained in this report.
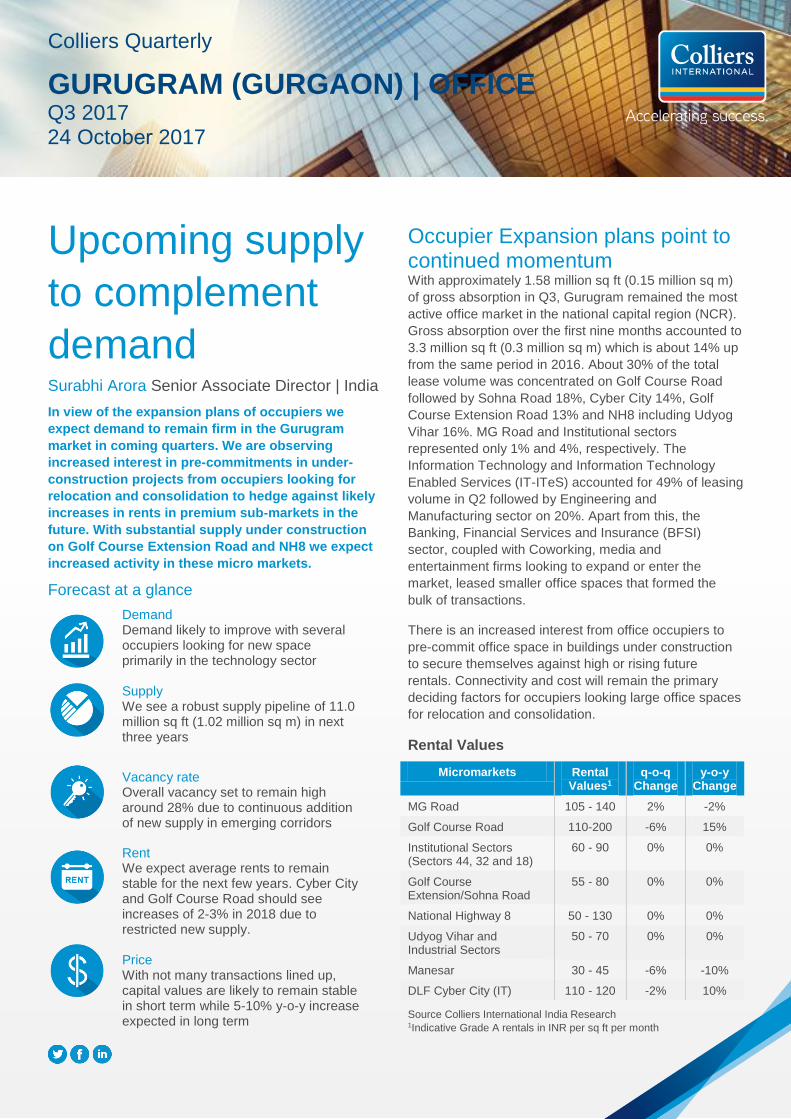
Upcoming supply
to complement
demand Surabhi Arora Senior Associate Director | India
In view of the expansion plans of occupiers we
expect demand to remain firm in the Gurugram
market in coming quarters. We are observing
increased interest in pre-commitments in under-
construction projects from occupiers looking for
relocation and consolidation to hedge against likely
increases in rents in premium sub-markets in the
future. With substantial supply under construction
on Golf Course Extension Road and NH8 we expect
increased activity in these micro markets.
Forecast at a glance
Demand Demand likely to improve with several occupiers looking for new space primarily in the technology sector
Supply We see a robust supply pipeline of 11.0 million sq ft (1.02 million sq m) in next three years
Vacancy rate Overall vacancy set to remain high around 28% due to continuous addition of new supply in emerging corridors
Rent We expect average rents to remain stable for the next few years. Cyber City and Golf Course Road should see increases of 2-3% in 2018 due to restricted new supply.
Price With not many transactions lined up, capital values are likely to remain stable in short term while 5-10% y-o-y increase expected in long term
Occupier Expansion plans point to continued momentum With approximately 1.58 million sq ft (0.15 million sq m)
of gross absorption in Q3, Gurugram remained the most
active office market in the national capital region (NCR).
Gross absorption over the first nine months accounted to
3.3 million sq ft (0.3 million sq m) which is about 14% up
from the same period in 2016. About 30% of the total
lease volume was concentrated on Golf Course Road
followed by Sohna Road 18%, Cyber City 14%, Golf
Course Extension Road 13% and NH8 including Udyog
Vihar 16%. MG Road and Institutional sectors
represented only 1% and 4%, respectively. The
Information Technology and Information Technology
Enabled Services (IT-ITeS) accounted for 49% of leasing
volume in Q2 followed by Engineering and
Manufacturing sector on 20%. Apart from this, the
Banking, Financial Services and Insurance (BFSI)
sector, coupled with Coworking, media and
entertainment firms looking to expand or enter the
market, leased smaller office spaces that formed the
bulk of transactions.
There is an increased interest from office occupiers to
pre-commit office space in buildings under construction
to secure themselves against high or rising future
rentals. Connectivity and cost will remain the primary
deciding factors for occupiers looking large office spaces
for relocation and consolidation.
Rental Values
Micromarkets Rental Values1
q-o-q Change
y-o-y Change
MG Road 105 - 140 2% -2%
Golf Course Road 110-200 -6% 15%
Institutional Sectors (Sectors 44, 32 and 18)
60 - 90 0% 0%
Golf Course Extension/Sohna Road
55 - 80 0% 0%
National Highway 8 50 - 130 0% 0%
Udyog Vihar and Industrial Sectors
50 - 70 0% 0%
Manesar 30 - 45 -6% -10%
DLF Cyber City (IT) 110 - 120 -2% 10%
Source Colliers International India Research 1Indicative Grade A rentals in INR per sq ft per month
Colliers Quarterly
GURUGRAM (GURGAON) | OFFICE Q3 2017 24 October 2017
2 Colliers Quarterly | 24 Oct 2017 | gurUGRAM (GURGAON) | OFFICE | Colliers International
Fig 1. Rental & Capital Values (INR per sq ft per month)
Fig 2. Gross Office Absorption (million sq ft)
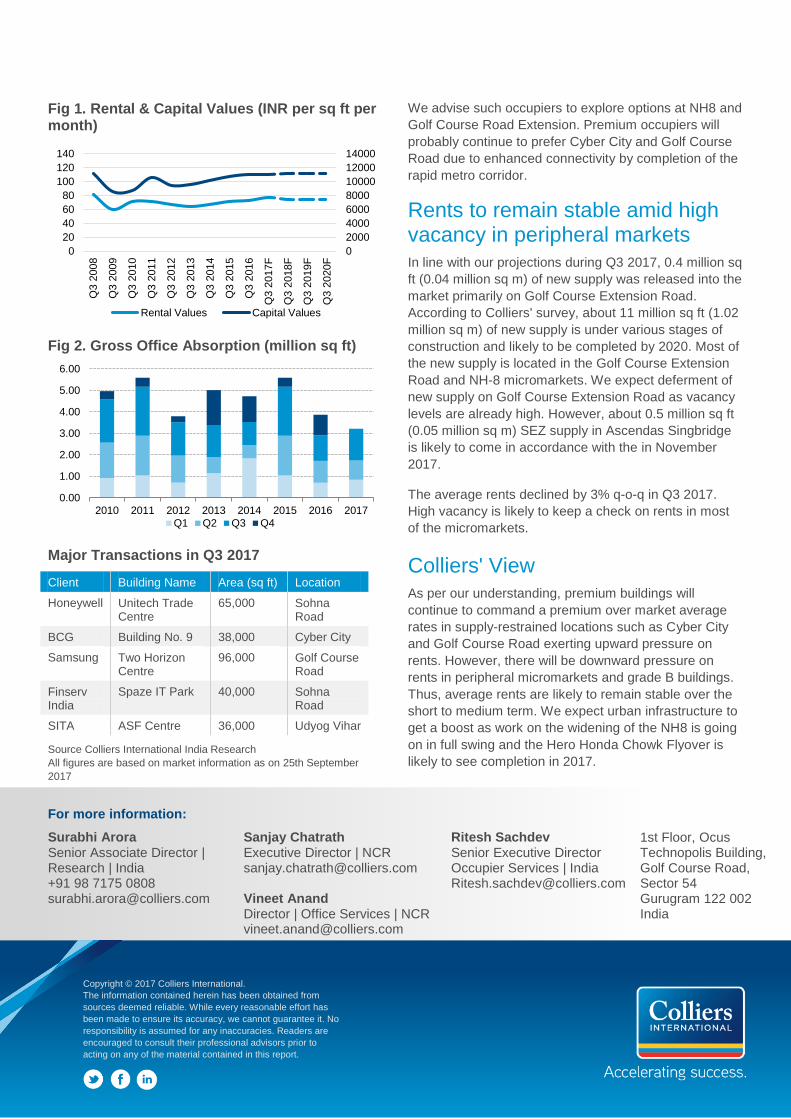
Major Transactions in Q3 2017
Client Building Name Area (sq ft) Location
Honeywell Unitech Trade Centre
65,000 Sohna Road
BCG Building No. 9 38,000 Cyber City
Samsung Two Horizon Centre
96,000 Golf Course Road
Finserv India
Spaze IT Park 40,000 Sohna Road
SITA ASF Centre 36,000 Udyog Vihar
Source Colliers International India Research
All figures are based on market information as on 25th September
2017
We advise such occupiers to explore options at NH8 and
Golf Course Road Extension. Premium occupiers will
probably continue to prefer Cyber City and Golf Course
Road due to enhanced connectivity by completion of the
rapid metro corridor.
Rents to remain stable amid high vacancy in peripheral markets
In line with our projections during Q3 2017, 0.4 million sq
ft (0.04 million sq m) of new supply was released into the
market primarily on Golf Course Extension Road.
According to Colliers' survey, about 11 million sq ft (1.02
million sq m) of new supply is under various stages of
construction and likely to be completed by 2020. Most of
the new supply is located in the Golf Course Extension
Road and NH-8 micromarkets. We expect deferment of
new supply on Golf Course Extension Road as vacancy
levels are already high. However, about 0.5 million sq ft
(0.05 million sq m) SEZ supply in Ascendas Singbridge
is likely to come in accordance with the in November
2017.
The average rents declined by 3% q-o-q in Q3 2017.
High vacancy is likely to keep a check on rents in most
of the micromarkets.
Colliers' View
As per our understanding, premium buildings will
continue to command a premium over market average
rates in supply-restrained locations such as Cyber City
and Golf Course Road exerting upward pressure on
rents. However, there will be downward pressure on
rents in peripheral micromarkets and grade B buildings.
Thus, average rents are likely to remain stable over the
short to medium term. We expect urban infrastructure to
get a boost as work on the widening of the NH8 is going
on in full swing and the Hero Honda Chowk Flyover is
likely to see completion in 2017.
0
2000
4000
6000
8000
10000
12000
14000
0
20
40
60
80
100
120
140
Q3 2
008
Q3 2
009
Q3 2
010
Q3 2
011
Q3 2
012
Q3 2
013
Q3 2
014
Q3 2
015
Q3 2
016
Q3 2
017F
Q3 2
018F
Q3 2
019F
Q3 2
020F
Rental Values Capital Values
0.00
1.00
2.00
3.00
4.00
5.00
6.00
2010 2011 2012 2013 2014 2015 2016 2017
Q1 Q2 Q3 Q4
For more information:
Surabhi Arora Senior Associate Director | Research | India +91 98 7175 0808 [email protected]
Sanjay Chatrath Executive Director | NCR [email protected]
Vineet Anand Director | Office Services | NCR [email protected]
Ritesh Sachdev Senior Executive Director Occupier Services | India [email protected]
1st Floor, Ocus Technopolis Building, Golf Course Road, Sector 54 Gurugram 122 002 India
Copyright © 2017 Colliers International.
The information contained herein has been obtained from
sources deemed reliable. While every reasonable effort has
been made to ensure its accuracy, we cannot guarantee it. No
responsibility is assumed for any inaccuracies. Readers are
encouraged to consult their professional advisors prior to
acting on any of the material contained in this report.
Average rents
likely to remain
stable Surabhi Arora Senior Associate Director | India
We expect demand to remain firm in coming
quarters. Occupiers' interest is likely to remain
inclined towards Grade A developments. Despite
high vacancy, large floorplate options are limited in
well-maintained Grade A buildings. We recommend
that developers keep an eye on the high vacancy
rate and refrain from speculative construction of
Grade B buildings.
Forecast at a glance
Demand Likely to remain concentrated in Sector 62-65 and Noida Expressway; technology and media companies to drive absorption
Supply Supply likely to remain restricted in short term; about 13 million sq ft (1.2 million sq m) is under various stages of construction
Vacancy rate Set to decline marginally in grade A developments given developer's concern over the high vacancy rates
Rent Despite upward bias for grade A buildings, average city rents are likely to remain stable over next three years
Price Likely to remain under pressure due to lower transaction activity in medium term
Sector 62 to 65 and Noida Expressway to remain favoured
In line with our projection, the NOIDA commercial market
witnessed improved occupier interest in Q3 2017. The
market recorded about 0.6 million sq ft (0.05 million sq
m) of gross absorption which was 20% up from the
previous quarter. With this, the YTD absorption in Noida
reached to about 1.48 million sq ft (0.14 million sq m).
The technology sector, the traditional demand driver of
the city, contributed about 55% of total absorption,
followed by media (14%), energy (12%), Banking
Financial Services and Insurance (BFSI) (10%) and
others (9%). Notable transactions included the lease of
45,000 sq ft (4,180 sq m) office space by Tech Mahindra
and the lease of 48,000 sq ft (4,459 sq m) by Kalptaru
Power in sector 63 and 62 respectively.
Following the previous quarter's trend, demand was
concentrated in the institutional and industrial Sectors 62
to 65 and Noida Expressway. Recently, the connectivity
of the Sector 62-65 micromarket with the national capital
has been significantly enhanced by the completion of a
signal-free 6 kilometre elevated road stretch. This stretch
connects the DND (Delhi-Noida-Delhi) toll road to Sector
62 via the Sector 18 underpass and has exit points at
Vishwa Bharti School (Sector 28), City Centre (Sector
32) and Shopprix Mall (Sector 61). We expect that the
completion of the metro line extension from the city
centre to sector 62 will further improve occupier
confidence in this micromarket.
Rental Values (INR per sq ft per month)
Micromarkets Rental Values1
q-o-q Change
y-o-y Change
Commercial Sectors1 75 - 110 2.8% 3.0%
Institutional Sectors (Non IT)2
75 - 95 -5.6% -6.0%
Institutional Sectors (IT)2
45 - 50 0.0% 18%
Industrial Sector (IT)3 35 - 50 0.0% -6%
Source Colliers International India Research 1Sector 18 (hotels, shopping centres, banks, cinemas) 2Sector 16 A,62, 125,126,127,132,135,136,142,143,144,153,154
(Educational, healthcare, technology & Government offices) 3Sector 1-9,57-60, 63-65 (factories, warehouses and IT services)
Colliers Quarterly
NOIDA | OFFICE Q3 2017 24 October 2017
2 Colliers Quarterly | 24 October 2017 | NOIDA | Sector | Colliers International
Fig 1. Rental & Capital Values (INR per sq ft per month)
Fig 2. Gross Office Absorption (million sq ft)
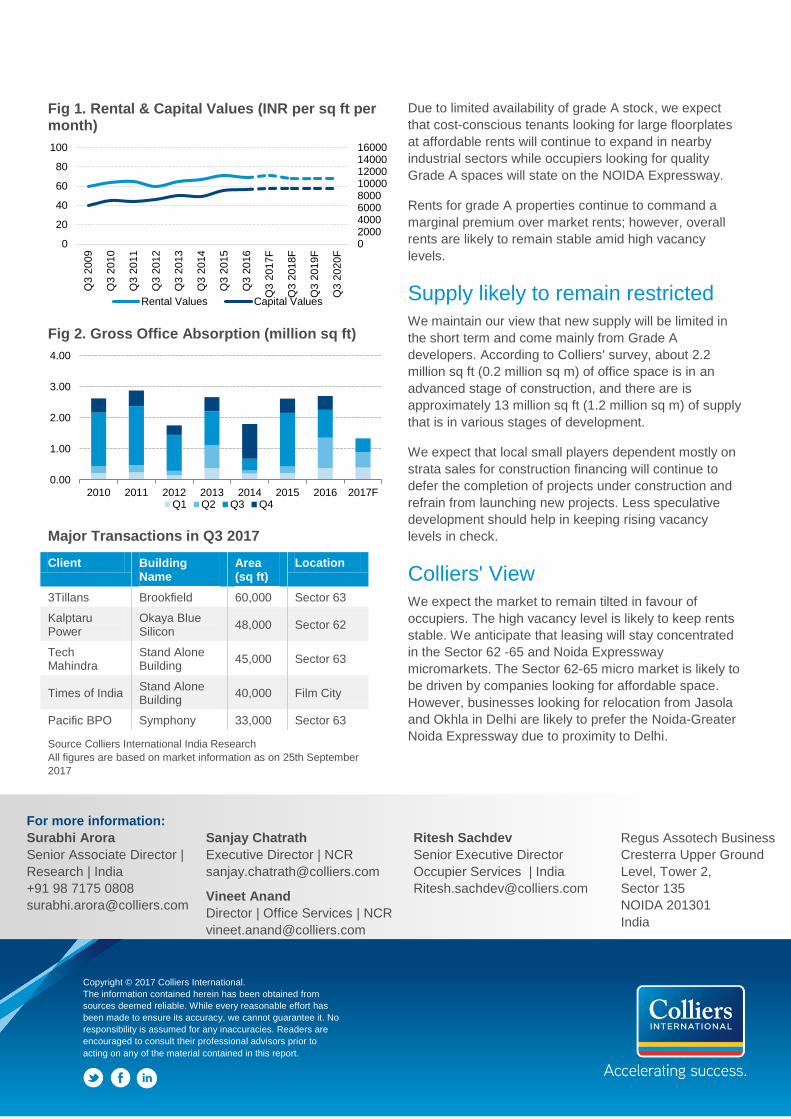
Major Transactions in Q3 2017
Client Building Name
Area (sq ft)
Location
3Tillans Brookfield 60,000 Sector 63
Kalptaru Power
Okaya Blue Silicon
48,000 Sector 62
Tech Mahindra
Stand Alone Building
45,000 Sector 63
Times of India Stand Alone Building
40,000 Film City
Pacific BPO Symphony 33,000 Sector 63
Source Colliers International India Research
All figures are based on market information as on 25th September
2017
Due to limited availability of grade A stock, we expect
that cost-conscious tenants looking for large floorplates
at affordable rents will continue to expand in nearby
industrial sectors while occupiers looking for quality
Grade A spaces will state on the NOIDA Expressway.
Rents for grade A properties continue to command a
marginal premium over market rents; however, overall
rents are likely to remain stable amid high vacancy
levels.
Supply likely to remain restricted
We maintain our view that new supply will be limited in
the short term and come mainly from Grade A
developers. According to Colliers' survey, about 2.2
million sq ft (0.2 million sq m) of office space is in an
advanced stage of construction, and there are is
approximately 13 million sq ft (1.2 million sq m) of supply
that is in various stages of development.
We expect that local small players dependent mostly on
strata sales for construction financing will continue to
defer the completion of projects under construction and
refrain from launching new projects. Less speculative
development should help in keeping rising vacancy
levels in check.
Colliers' View
We expect the market to remain tilted in favour of
occupiers. The high vacancy level is likely to keep rents
stable. We anticipate that leasing will stay concentrated
in the Sector 62 -65 and Noida Expressway
micromarkets. The Sector 62-65 micro market is likely to
be driven by companies looking for affordable space.
However, businesses looking for relocation from Jasola
and Okhla in Delhi are likely to prefer the Noida-Greater
Noida Expressway due to proximity to Delhi.
0200040006000800010000120001400016000
0
20
40
60
80
100
Q3 2
009
Q3 2
010
Q3 2
011
Q3 2
012
Q3 2
013
Q3 2
014
Q3 2
015
Q3 2
016
Q3 2
017F
Q3 2
018F
Q3 2
019F
Q3 2
020F
Rental Values Capital Values
0.00
1.00
2.00
3.00
4.00
2010 2011 2012 2013 2014 2015 2016 2017FQ1 Q2 Q3 Q4
For more information:
Surabhi Arora
Senior Associate Director |
Research | India
+91 98 7175 0808
Sanjay Chatrath
Executive Director | NCR
Vineet Anand
Director | Office Services | NCR
Ritesh Sachdev
Senior Executive Director
Occupier Services | India
Regus Assotech Business
Cresterra Upper Ground
Level, Tower 2,
Sector 135
NOIDA 201301
India
Copyright © 2017 Colliers International.
The information contained herein has been obtained from
sources deemed reliable. While every reasonable effort has
been made to ensure its accuracy, we cannot guarantee it. No
responsibility is assumed for any inaccuracies. Readers are
encouraged to consult their professional advisors prior to
acting on any of the material contained in this report.
Strong upcoming
supply to keep up
with demand Teni Alice Abraham Analyst | Bengaluru
Despite a marginal drop in q-o-q absorption, Q3 2017
has witnessed a substantial 16.5% increase y-o-y in
leasing activity. In view of the office deal pipeline, we
expect leasing to pick up further towards the year-
end. Forthcoming supply is likely to complement
demand. We advise occupiers to prepare expansion
strategies well in advance as limited options are
available in preferred locations.
Forecast at a glance
Demand The dominance of the technology sector is likely to continue with a slight increase in demand from sectors such as engineering and manufacturing and banking sector
Supply City has robust supply pipeline of 26 million sq ft (2.4 million sq m) under various stages of construction for the next 3 years leading to a 19-20% increase in the city's total inventory
Vacancy rate Supply demand equilibrium should keep the vacancy level at around 8% in medium to long term.
Rent Rents to witness marginal increase in Q4. We expect overall city rents to rise up to 8-10% in total over the next three years.
Price In proportion to rental forecast, capital value is set to increase in next 3 years.
Demand to pick up further in Q4
In Q3 2017, Bengaluru witnessed gross absorption of 3.0
million sq ft (0.27 million sq m) indicating a drop of 5% q-
o-q. However, the city recorded gross absorption of 10.0
million sq ft (0.9 million sq m) over the first nine months,
representing a considerable increase of 16.5% from the
same period last year. We are positive about gross
absorption in Q4 as well in view of a robust deal pipeline
and keep our yearly forecast of 13.0 million sq ft (1.2
million sq m) for the Bengaluru office market, marginally
up from last year.
Leasing activity was highest in Information Technology
and Information Technology Enabled Services (IT-ITeS)
Sector (39%), followed by Engineering & Manufacturing
(24%), Banking and Financial Services (BFSI) (18%) and
Coworking (9%). Average rents inched up by 1.2% q-o-q
driven by micromarkets such as EPIP Zone/Whitefield,
Bannerghatta Road and the Outer Ring Road (ORR).
As in Q3 2017, ORR remains the preferred location with
a major contribution of 74% in total absorption followed
by SBD (8%), CBD (5%) and EPIP Zone/Whitefield (4%).
Occupiers such as Paypal, Span Infotech and Paytm
chose to relocate and expand their office spaces to
ORR. We expect this micromarket to remain Bengaluru's
most sought-after office destination as the supply
pipeline is likely to complement strong demand.
Rental Values
Micromarkets Rental Values1
q-o-q change
y-o-y change
CBD 110 - 170 0.0% 16.7%
Outer Ring Road (Sarjapur - Marathahalli)
75 - 85 0.0% 0.0%
Outter Ring Road (K.R. Puram - Hebbal)
70 - 80 2.7% 7.1%
Bannerghatta Road 55 - 70 1.6% 1.6%
Hosur Road 30 - 40 0.0% 7.7%
EPIP Zone/Whitefield 35 - 45 3.9% 6.7%
Electronic City 30 - 40 0.0% 2.9%
Source Colliers International India Research 1Indicative Grade A rentals in INR per sq ft per month
Colliers Quarterly
BENGALURU | OFFICE Q3 201724 October 2017
2 Colliers Quarterly | | bengaluru | office | Colliers International
Fig 1. Rental & Capital Values (INR per sq ft per month)
Fig 2. Gross Office Absorption (million sq ft)
Major Lease Transactions in Q3 2017
Client Building Name Area
(sq ft)
Location
Quintiles Prestige Tech Park
277,300 ORR
Broadcom Limited
Global Technology Park
277,000 ORR
Avila Capital I works 228,000 ORR
State Street Global Services
RMZ Ecoworld Block 6A & 6B
220,334 ORR
Quest Global Embassy Tech Village
330,000 ORR
Source Colliers International India Research
Notes: All figures are based on market information as on 25th
September 2017
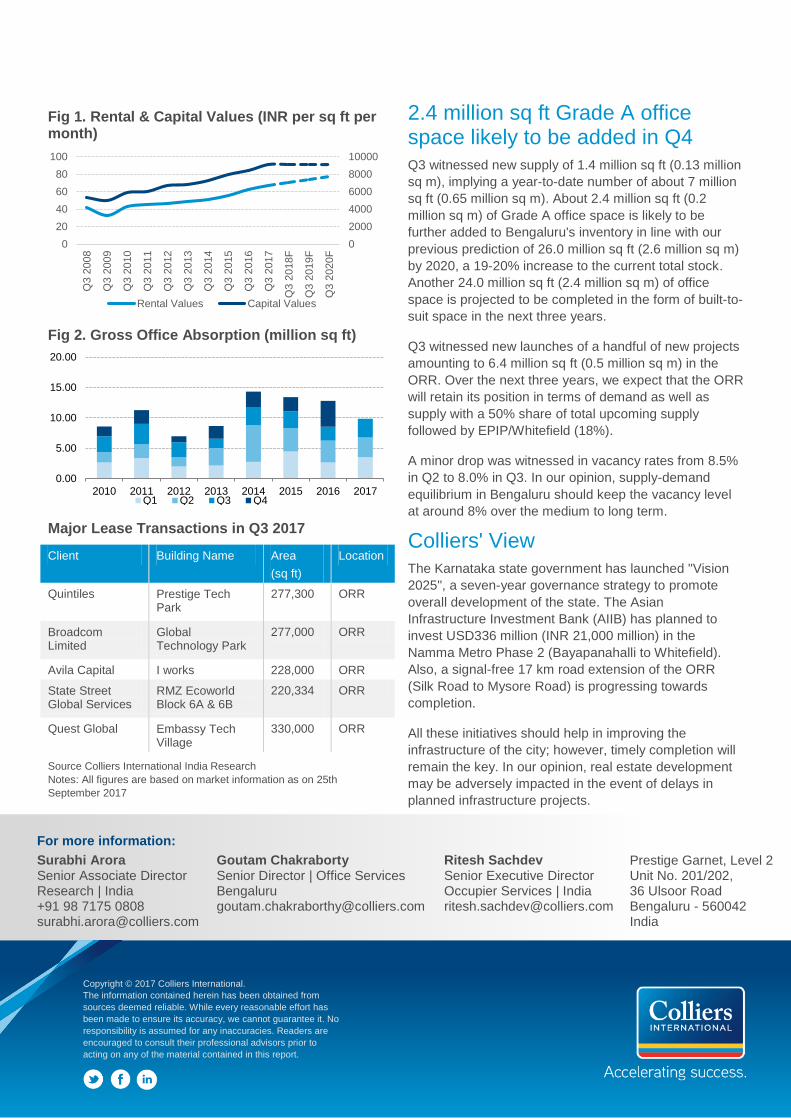
2.4 million sq ft Grade A office space likely to be added in Q4
Q3 witnessed new supply of 1.4 million sq ft (0.13 million
sq m), implying a year-to-date number of about 7 million
sq ft (0.65 million sq m). About 2.4 million sq ft (0.2
million sq m) of Grade A office space is likely to be
further added to Bengaluru's inventory in line with our
previous prediction of 26.0 million sq ft (2.6 million sq m)
by 2020, a 19-20% increase to the current total stock.
Another 24.0 million sq ft (2.4 million sq m) of office
space is projected to be completed in the form of built-to-
suit space in the next three years.
Q3 witnessed new launches of a handful of new projects
amounting to 6.4 million sq ft (0.5 million sq m) in the
ORR. Over the next three years, we expect that the ORR
will retain its position in terms of demand as well as
supply with a 50% share of total upcoming supply
followed by EPIP/Whitefield (18%).
A minor drop was witnessed in vacancy rates from 8.5%
in Q2 to 8.0% in Q3. In our opinion, supply-demand
equilibrium in Bengaluru should keep the vacancy level
at around 8% over the medium to long term.
Colliers' View
The Karnataka state government has launched "Vision
2025", a seven-year governance strategy to promote
overall development of the state. The Asian
Infrastructure Investment Bank (AIIB) has planned to
invest USD336 million (INR 21,000 million) in the
Namma Metro Phase 2 (Bayapanahalli to Whitefield).
Also, a signal-free 17 km road extension of the ORR
(Silk Road to Mysore Road) is progressing towards
completion.
All these initiatives should help in improving the
infrastructure of the city; however, timely completion will
remain the key. In our opinion, real estate development
may be adversely impacted in the event of delays in
planned infrastructure projects.
0
2000
4000
6000
8000
10000
0
20
40
60
80
100
Q3 2
008
Q3 2
009
Q3 2
010
Q3 2
011
Q3 2
012
Q3 2
013
Q3 2
014
Q3 2
015
Q3 2
016
Q3 2
017
Q3 2
018F
Q3 2
019F
Q3 2
020F
Rental Values Capital Values
0.00
5.00
10.00
15.00
20.00
2010 2011 2012 2013 2014 2015 2016 2017Q1 Q2 Q3 Q4
For more information:
Surabhi Arora Senior Associate Director Research | India +91 98 7175 0808 [email protected]
Goutam Chakraborty Senior Director | Office Services Bengaluru [email protected]
Ritesh Sachdev Senior Executive Director Occupier Services | India [email protected]
Prestige Garnet, Level 2 Unit No. 201/202, 36 Ulsoor Road Bengaluru - 560042 India
Copyright © 2017 Colliers International.
The information contained herein has been obtained from
sources deemed reliable. While every reasonable effort has
been made to ensure its accuracy, we cannot guarantee it. No
responsibility is assumed for any inaccuracies. Readers are
encouraged to consult their professional advisors prior to
acting on any of the material contained in this report.
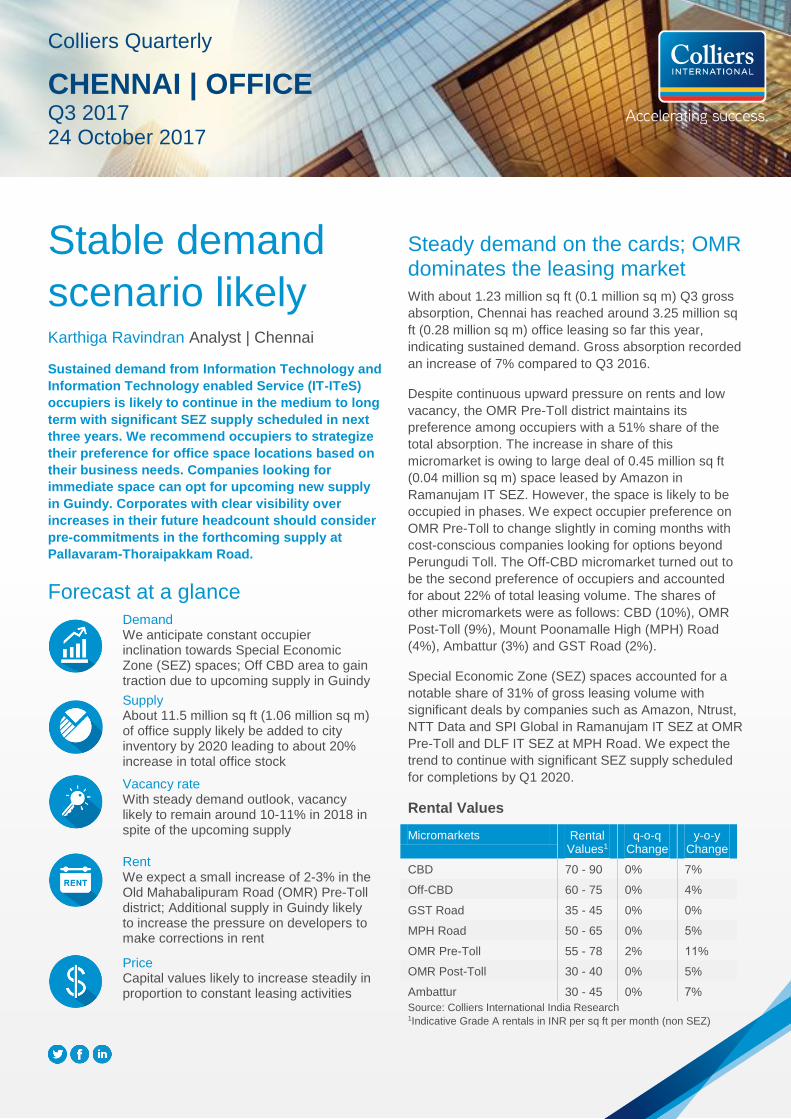
Stable demand
scenario likely Karthiga Ravindran Analyst | Chennai
Sustained demand from Information Technology and
Information Technology enabled Service (IT-ITeS)
occupiers is likely to continue in the medium to long
term with significant SEZ supply scheduled in next
three years. We recommend occupiers to strategize
their preference for office space locations based on
their business needs. Companies looking for
immediate space can opt for upcoming new supply
in Guindy. Corporates with clear visibility over
increases in their future headcount should consider
pre-commitments in the forthcoming supply at
Pallavaram-Thoraipakkam Road.
Forecast at a glance
Demand We anticipate constant occupier inclination towards Special Economic Zone (SEZ) spaces; Off CBD area to gain traction due to upcoming supply in Guindy
Supply About 11.5 million sq ft (1.06 million sq m) of office supply likely be added to city inventory by 2020 leading to about 20% increase in total office stock
Vacancy rate With steady demand outlook, vacancy likely to remain around 10-11% in 2018 in spite of the upcoming supply
Rent We expect a small increase of 2-3% in the Old Mahabalipuram Road (OMR) Pre-Toll district; Additional supply in Guindy likely to increase the pressure on developers to make corrections in rent
Price Capital values likely to increase steadily in proportion to constant leasing activities
Steady demand on the cards; OMR dominates the leasing market
With about 1.23 million sq ft (0.1 million sq m) Q3 gross
absorption, Chennai has reached around 3.25 million sq
ft (0.28 million sq m) office leasing so far this year,
indicating sustained demand. Gross absorption recorded
an increase of 7% compared to Q3 2016.
Despite continuous upward pressure on rents and low
vacancy, the OMR Pre-Toll district maintains its
preference among occupiers with a 51% share of the
total absorption. The increase in share of this
micromarket is owing to large deal of 0.45 million sq ft
(0.04 million sq m) space leased by Amazon in
Ramanujam IT SEZ. However, the space is likely to be
occupied in phases. We expect occupier preference on
OMR Pre-Toll to change slightly in coming months with
cost-conscious companies looking for options beyond
Perungudi Toll. The Off-CBD micromarket turned out to
be the second preference of occupiers and accounted
for about 22% of total leasing volume. The shares of
other micromarkets were as follows: CBD (10%), OMR
Post-Toll (9%), Mount Poonamalle High (MPH) Road
(4%), Ambattur (3%) and GST Road (2%).
Special Economic Zone (SEZ) spaces accounted for a
notable share of 31% of gross leasing volume with
significant deals by companies such as Amazon, Ntrust,
NTT Data and SPI Global in Ramanujam IT SEZ at OMR
Pre-Toll and DLF IT SEZ at MPH Road. We expect the
trend to continue with significant SEZ supply scheduled
for completions by Q1 2020.
Rental Values
Micromarkets Rental Values1
q-o-q Change
y-o-y Change
CBD 70 - 90 0% 7%
Off-CBD 60 - 75 0% 4%
GST Road 35 - 45 0% 0%
MPH Road 50 - 65 0% 5%
OMR Pre-Toll 55 - 78 2% 11%
OMR Post-Toll 30 - 40 0% 5%
Ambattur 30 - 45 0% 7%
Source: Colliers International India Research 1Indicative Grade A rentals in INR per sq ft per month (non SEZ)
Colliers Quarterly
CHENNAI | OFFICE Q3 2017 24 October 2017
2 Colliers Quarterly | Q3 2017
24 October 2017 | Chennai | Office | Colliers International
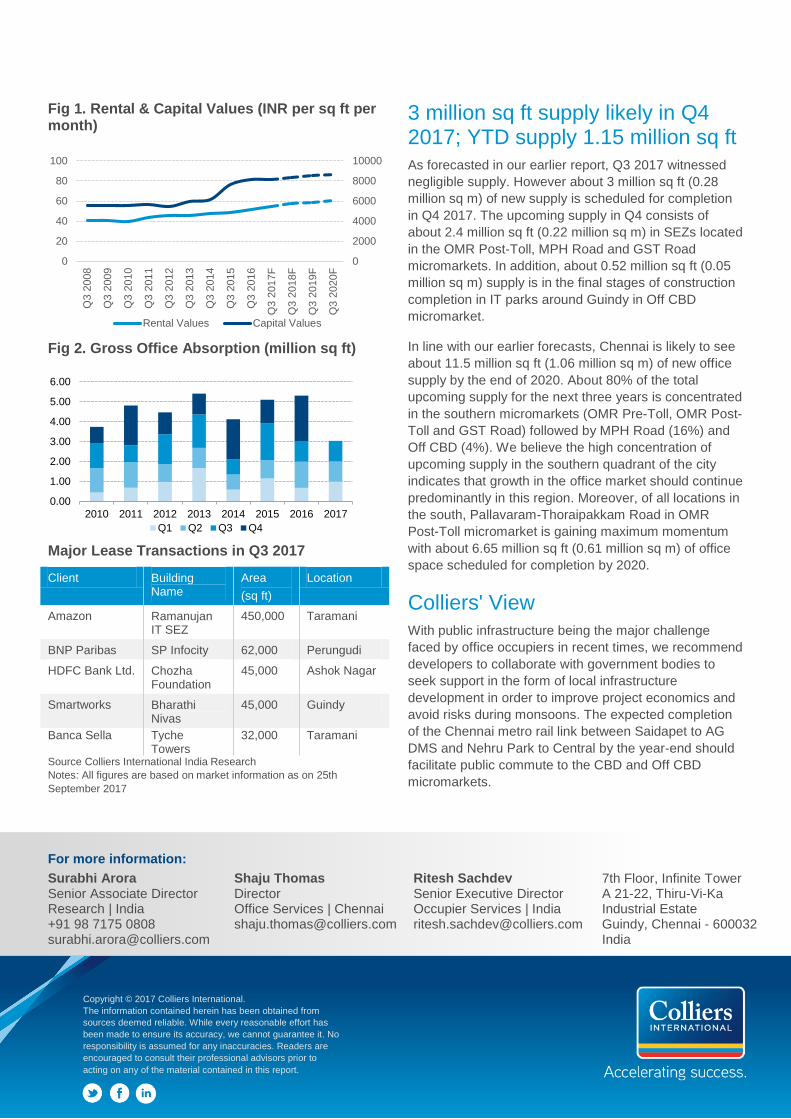
Fig 1. Rental & Capital Values (INR per sq ft per month)
Fig 2. Gross Office Absorption (million sq ft)
Major Lease Transactions in Q3 2017
Client Building Name
Area
(sq ft)
Location
Amazon Ramanujan IT SEZ
450,000 Taramani
BNP Paribas SP Infocity 62,000 Perungudi
HDFC Bank Ltd. Chozha Foundation
45,000 Ashok Nagar
Smartworks Bharathi Nivas
45,000 Guindy
Banca Sella Tyche Towers
32,000 Taramani
Source Colliers International India Research
Notes: All figures are based on market information as on 25th
September 2017
3 million sq ft supply likely in Q4 2017; YTD supply 1.15 million sq ft
As forecasted in our earlier report, Q3 2017 witnessed
negligible supply. However about 3 million sq ft (0.28
million sq m) of new supply is scheduled for completion
in Q4 2017. The upcoming supply in Q4 consists of
about 2.4 million sq ft (0.22 million sq m) in SEZs located
in the OMR Post-Toll, MPH Road and GST Road
micromarkets. In addition, about 0.52 million sq ft (0.05
million sq m) supply is in the final stages of construction
completion in IT parks around Guindy in Off CBD
micromarket.
In line with our earlier forecasts, Chennai is likely to see
about 11.5 million sq ft (1.06 million sq m) of new office
supply by the end of 2020. About 80% of the total
upcoming supply for the next three years is concentrated
in the southern micromarkets (OMR Pre-Toll, OMR Post-
Toll and GST Road) followed by MPH Road (16%) and
Off CBD (4%). We believe the high concentration of
upcoming supply in the southern quadrant of the city
indicates that growth in the office market should continue
predominantly in this region. Moreover, of all locations in
the south, Pallavaram-Thoraipakkam Road in OMR
Post-Toll micromarket is gaining maximum momentum
with about 6.65 million sq ft (0.61 million sq m) of office
space scheduled for completion by 2020.
Colliers' View
With public infrastructure being the major challenge
faced by office occupiers in recent times, we recommend
developers to collaborate with government bodies to
seek support in the form of local infrastructure
development in order to improve project economics and
avoid risks during monsoons. The expected completion
of the Chennai metro rail link between Saidapet to AG
DMS and Nehru Park to Central by the year-end should
facilitate public commute to the CBD and Off CBD
micromarkets.
0
2000
4000
6000
8000
10000
0
20
40
60
80
100
Q3 2
008
Q3 2
009
Q3 2
010
Q3 2
011
Q3 2
012
Q3 2
013
Q3 2
014
Q3 2
015
Q3 2
016
Q3 2
017F
Q3 2
018F
Q3 2
019F
Q3 2
020F
Rental Values Capital Values
0.00
1.00
2.00
3.00
4.00
5.00
6.00
2010 2011 2012 2013 2014 2015 2016 2017
Q1 Q2 Q3 Q4
For more information:
Surabhi Arora Senior Associate Director Research | India +91 98 7175 0808 [email protected]
Shaju Thomas Director Office Services | Chennai [email protected]
Ritesh Sachdev Senior Executive Director Occupier Services | India [email protected]
7th Floor, Infinite Tower A 21-22, Thiru-Vi-Ka Industrial Estate Guindy, Chennai - 600032 India
Copyright © 2017 Colliers International.
The information contained herein has been obtained from
sources deemed reliable. While every reasonable effort has
been made to ensure its accuracy, we cannot guarantee it. No
responsibility is assumed for any inaccuracies. Readers are
encouraged to consult their professional advisors prior to
acting on any of the material contained in this report.
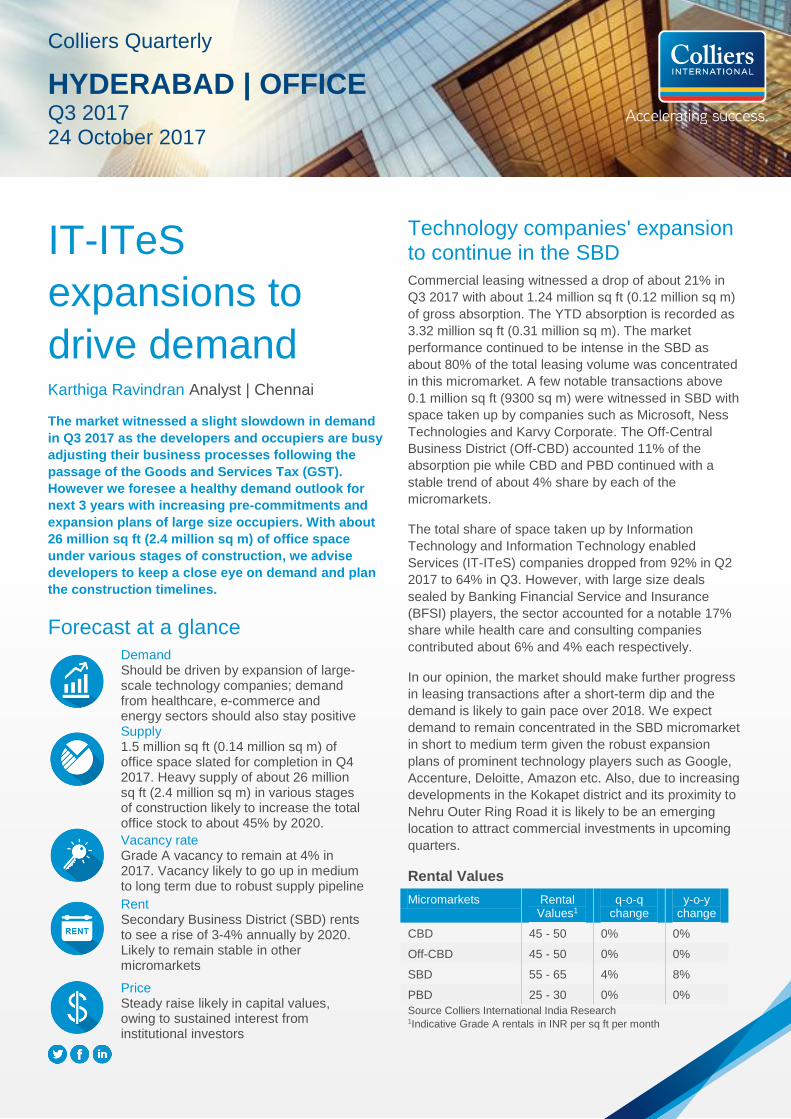
IT-ITeS
expansions to
drive demand Karthiga Ravindran Analyst | Chennai
The market witnessed a slight slowdown in demand
in Q3 2017 as the developers and occupiers are busy
adjusting their business processes following the
passage of the Goods and Services Tax (GST).
However we foresee a healthy demand outlook for
next 3 years with increasing pre-commitments and
expansion plans of large size occupiers. With about
26 million sq ft (2.4 million sq m) of office space
under various stages of construction, we advise
developers to keep a close eye on demand and plan
the construction timelines.
Forecast at a glance
Demand Should be driven by expansion of large-scale technology companies; demand from healthcare, e-commerce and energy sectors should also stay positive Supply 1.5 million sq ft (0.14 million sq m) of office space slated for completion in Q4 2017. Heavy supply of about 26 million sq ft (2.4 million sq m) in various stages of construction likely to increase the total office stock to about 45% by 2020.
Vacancy rate Grade A vacancy to remain at 4% in 2017. Vacancy likely to go up in medium to long term due to robust supply pipeline
Rent Secondary Business District (SBD) rents to see a rise of 3-4% annually by 2020. Likely to remain stable in other micromarkets
Price Steady raise likely in capital values, owing to sustained interest from institutional investors
Technology companies' expansion to continue in the SBD
Commercial leasing witnessed a drop of about 21% in
Q3 2017 with about 1.24 million sq ft (0.12 million sq m)
of gross absorption. The YTD absorption is recorded as
3.32 million sq ft (0.31 million sq m). The market
performance continued to be intense in the SBD as
about 80% of the total leasing volume was concentrated
in this micromarket. A few notable transactions above
0.1 million sq ft (9300 sq m) were witnessed in SBD with
space taken up by companies such as Microsoft, Ness
Technologies and Karvy Corporate. The Off-Central
Business District (Off-CBD) accounted 11% of the
absorption pie while CBD and PBD continued with a
stable trend of about 4% share by each of the
micromarkets.
The total share of space taken up by Information
Technology and Information Technology enabled
Services (IT-ITeS) companies dropped from 92% in Q2
2017 to 64% in Q3. However, with large size deals
sealed by Banking Financial Service and Insurance
(BFSI) players, the sector accounted for a notable 17%
share while health care and consulting companies
contributed about 6% and 4% each respectively.
In our opinion, the market should make further progress
in leasing transactions after a short-term dip and the
demand is likely to gain pace over 2018. We expect
demand to remain concentrated in the SBD micromarket
in short to medium term given the robust expansion
plans of prominent technology players such as Google,
Accenture, Deloitte, Amazon etc. Also, due to increasing
developments in the Kokapet district and its proximity to
Nehru Outer Ring Road it is likely to be an emerging
location to attract commercial investments in upcoming
quarters.
Rental Values
Micromarkets Rental Values1
q-o-q change
y-o-y change
CBD 45 - 50 0% 0%
Off-CBD 45 - 50 0% 0%
SBD 55 - 65 4% 8%
PBD 25 - 30 0% 0%
Source Colliers International India Research 1Indicative Grade A rentals in INR per sq ft per month
Colliers Quarterly
HYDERABAD | OFFICE Q3 201724 October 2017
2 Colliers Quarterly | Q3 2017 24 October 2017 | hyderabad |
OFFICE | Colliers International
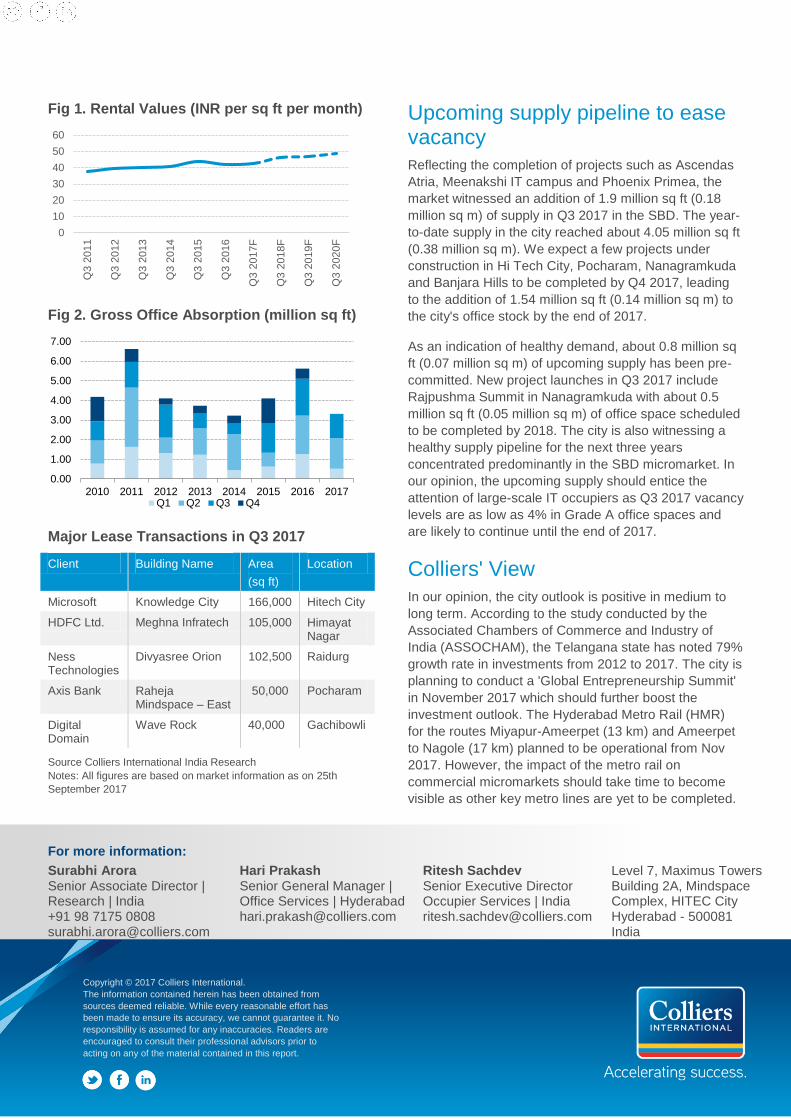
Fig 1. Rental Values (INR per sq ft per month)
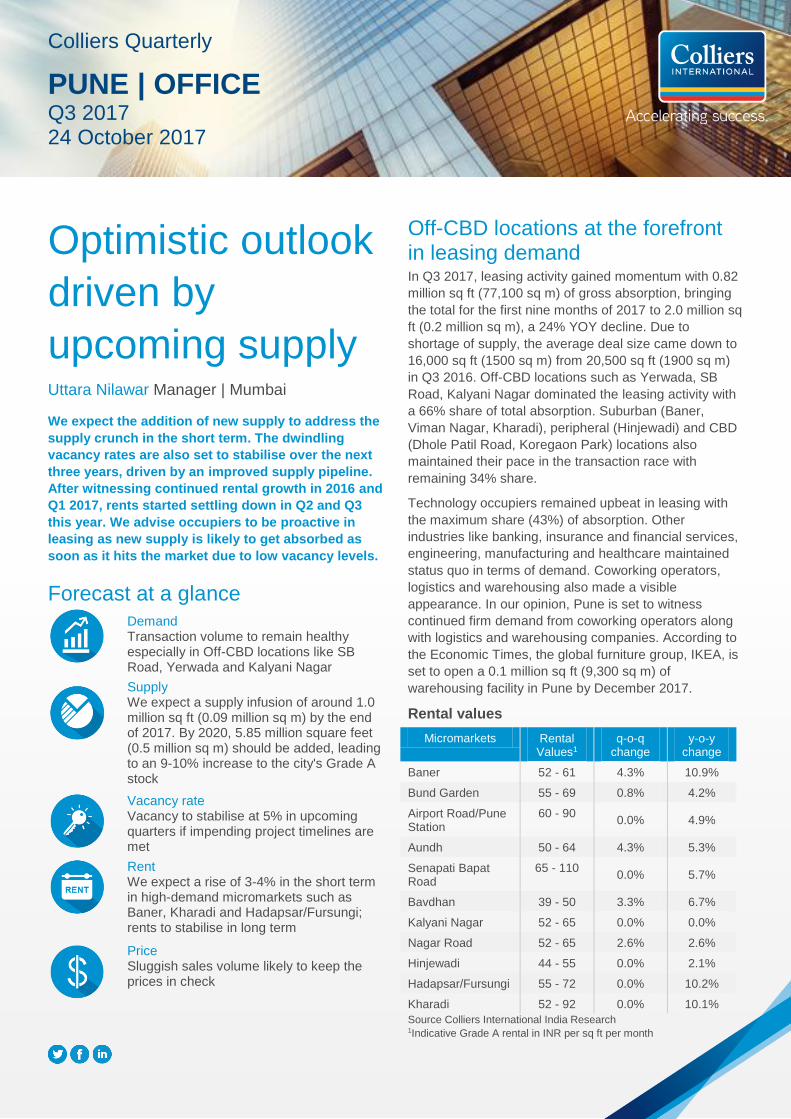
Fig 2. Gross Office Absorption (million sq ft)
Major Lease Transactions in Q3 2017
Client Building Name Area
(sq ft)
Location
Microsoft Knowledge City 166,000 Hitech City
HDFC Ltd. Meghna Infratech 105,000 Himayat Nagar
Ness Technologies
Divyasree Orion 102,500 Raidurg
Axis Bank Raheja Mindspace – East
50,000 Pocharam
Digital Domain
Wave Rock 40,000 Gachibowli
Source Colliers International India Research
Notes: All figures are based on market information as on 25th
September 2017
Upcoming supply pipeline to ease vacancy
Reflecting the completion of projects such as Ascendas
Atria, Meenakshi IT campus and Phoenix Primea, the
market witnessed an addition of 1.9 million sq ft (0.18
million sq m) of supply in Q3 2017 in the SBD. The year-
to-date supply in the city reached about 4.05 million sq ft
(0.38 million sq m). We expect a few projects under
construction in Hi Tech City, Pocharam, Nanagramkuda
and Banjara Hills to be completed by Q4 2017, leading
to the addition of 1.54 million sq ft (0.14 million sq m) to
the city's office stock by the end of 2017.
As an indication of healthy demand, about 0.8 million sq
ft (0.07 million sq m) of upcoming supply has been pre-
committed. New project launches in Q3 2017 include
Rajpushma Summit in Nanagramkuda with about 0.5
million sq ft (0.05 million sq m) of office space scheduled
to be completed by 2018. The city is also witnessing a
healthy supply pipeline for the next three years
concentrated predominantly in the SBD micromarket. In
our opinion, the upcoming supply should entice the
attention of large-scale IT occupiers as Q3 2017 vacancy
levels are as low as 4% in Grade A office spaces and
are likely to continue until the end of 2017.
Colliers' View
In our opinion, the city outlook is positive in medium to
long term. According to the study conducted by the
Associated Chambers of Commerce and Industry of
India (ASSOCHAM), the Telangana state has noted 79%
growth rate in investments from 2012 to 2017. The city is
planning to conduct a 'Global Entrepreneurship Summit'
in November 2017 which should further boost the
investment outlook. The Hyderabad Metro Rail (HMR)
for the routes Miyapur-Ameerpet (13 km) and Ameerpet
to Nagole (17 km) planned to be operational from Nov
2017. However, the impact of the metro rail on
commercial micromarkets should take time to become
visible as other key metro lines are yet to be completed.
0
10
20
30
40
50
60
Q3 2
011
Q3 2
012
Q3 2
013
Q3 2
014
Q3 2
015
Q3 2
016
Q3 2
017F
Q3 2
018F
Q3 2
019F
Q3 2
020F
0.00
1.00
2.00
3.00
4.00
5.00
6.00
7.00
2010 2011 2012 2013 2014 2015 2016 2017Q1 Q2 Q3 Q4
For more information:
Surabhi Arora Senior Associate Director | Research | India +91 98 7175 0808 [email protected]
Hari Prakash Senior General Manager | Office Services | Hyderabad [email protected]
Ritesh Sachdev Senior Executive Director Occupier Services | India [email protected]
Level 7, Maximus Towers Building 2A, Mindspace Complex, HITEC City Hyderabad - 500081 India
Copyright © 2017 Colliers International.
The information contained herein has been obtained from
sources deemed reliable. While every reasonable effort has
been made to ensure its accuracy, we cannot guarantee it. No
responsibility is assumed for any inaccuracies. Readers are
encouraged to consult their professional advisors prior to
acting on any of the material contained in this report.
Optimistic outlook
driven by
upcoming supply Uttara Nilawar Manager | Mumbai
We expect the addition of new supply to address the
supply crunch in the short term. The dwindling
vacancy rates are also set to stabilise over the next
three years, driven by an improved supply pipeline.
After witnessing continued rental growth in 2016 and
Q1 2017, rents started settling down in Q2 and Q3
this year. We advise occupiers to be proactive in
leasing as new supply is likely to get absorbed as
soon as it hits the market due to low vacancy levels.
Forecast at a glance
Demand Transaction volume to remain healthy especially in Off-CBD locations like SB Road, Yerwada and Kalyani Nagar
Supply We expect a supply infusion of around 1.0 million sq ft (0.09 million sq m) by the end of 2017. By 2020, 5.85 million square feet (0.5 million sq m) should be added, leading to an 9-10% increase to the city's Grade A stock
Vacancy rate Vacancy to stabilise at 5% in upcoming quarters if impending project timelines are met
Rent We expect a rise of 3-4% in the short term in high-demand micromarkets such as Baner, Kharadi and Hadapsar/Fursungi; rents to stabilise in long term
Price Sluggish sales volume likely to keep the prices in check
Off-CBD locations at the forefront in leasing demand In Q3 2017, leasing activity gained momentum with 0.82
million sq ft (77,100 sq m) of gross absorption, bringing
the total for the first nine months of 2017 to 2.0 million sq
ft (0.2 million sq m), a 24% YOY decline. Due to
shortage of supply, the average deal size came down to
16,000 sq ft (1500 sq m) from 20,500 sq ft (1900 sq m)
in Q3 2016. Off-CBD locations such as Yerwada, SB
Road, Kalyani Nagar dominated the leasing activity with
a 66% share of total absorption. Suburban (Baner,
Viman Nagar, Kharadi), peripheral (Hinjewadi) and CBD
(Dhole Patil Road, Koregaon Park) locations also
maintained their pace in the transaction race with
remaining 34% share.
Technology occupiers remained upbeat in leasing with
the maximum share (43%) of absorption. Other
industries like banking, insurance and financial services,
engineering, manufacturing and healthcare maintained
status quo in terms of demand. Coworking operators,
logistics and warehousing also made a visible
appearance. In our opinion, Pune is set to witness
continued firm demand from coworking operators along
with logistics and warehousing companies. According to
the Economic Times, the global furniture group, IKEA, is
set to open a 0.1 million sq ft (9,300 sq m) of
warehousing facility in Pune by December 2017.
Rental values
Micromarkets Rental Values1
q-o-q change
y-o-y change
Baner 52 - 61 4.3% 10.9%
Bund Garden 55 - 69 0.8% 4.2%
Airport Road/Pune Station
60 - 90 0.0% 4.9%
Aundh 50 - 64 4.3% 5.3%
Senapati Bapat Road
65 - 110 0.0% 5.7%
Bavdhan 39 - 50 3.3% 6.7%
Kalyani Nagar 52 - 65 0.0% 0.0%
Nagar Road 52 - 65 2.6% 2.6%
Hinjewadi 44 - 55 0.0% 2.1%
Hadapsar/Fursungi 55 - 72 0.0% 10.2%
Kharadi 52 - 92 0.0% 10.1%
Source Colliers International India Research 1Indicative Grade A rental in INR per sq ft per month
Colliers Quarterly
PUNE | OFFICE Q3 2017 24 October 2017
2 Colliers Quarterly | 24 October 2017 | pune | office | Colliers International
Fig 1. Rental & Capital Values (INR per sq ft per month)
Fig 2. Gross Office Absorption (in million sq ft)
Major Transactions in Q3 2017
Client Building Name Area (sq ft)
Location
Western Union Business Bay Phase 1
90,000 Yerwada
Schlumberger India Technology
Commerzone - B6 54,000 Yerwada
Tibco Commerzone - B4 50,000 Yerwada
John Deere Magarpatta Cybercity
Hadapsar/Fursungi
Saba Software Cerebrum - 2 33,000 Kalyani Nagar
Source Colliers International India Research Notes: All figures are based on market information as on 25th September 2017
Supply rising Based on our earlier projection, no new supply was
expected in the Pune market until Q1 2018. However,
facing continuous pressure from occupiers, we are
expecting a supply infusion of at least 1.0 million sq ft
(0.09 million sq m) by the end of 2017. In addition,
according to Colliers' research database, 5.85 million sq
ft (0.5 million sq m) of new developments are slated for
completion over the next three years. This would lead to
a 9-10% increase in the city's current total Grade A
stock.
Investor activity on the rise Investor activity picked up during Q3 2017 with two
prime land transactions and one outright purchase of a
commercial building. Ascendas-Singbridge bought a 16-
acre land parcel for INR2 billion (USD30 million) for a
possible IT SEZ (Special Economic Zone) development.
CPPIB (Canada Pension Plan Investment Board) and
Phoenix Mills' retail platform also bought a land parcel in
West Pune for INR1.6 billion (USD4 million). In an
outright purchase, Milestone Capital Advisors acquired
half of an IT Park building in Kharadi for INR 1.6 billion
(USD 24 million).
Colliers' View The supply scenario is likely to improve in next few
quarters. Due to sustained demand from technology
occupiers in the future, we expect developers to expedite
supply addition. Increased number of land transactions
for commercial development projects should also
facilitate additional office stock infusion. We expect,
rental and capital values to stabilise barring marginal
increase in select micromarkets in the next few quarters.
Recently, the Pimpri-Chinchwad area which comes
under a separate jurisdiction was incorporated in the list
of smart cities. Pune is one of the first few cities where
smart city projects have already picked up, and we
believe that the smart city tag is going to bode well for
the commercial market in Pune.
0
1000
2000
3000
4000
5000
6000
7000
8000
0
20
40
60
80
100
120
Q3 2
011
Q3 2
012
Q3 2
013
Q3 2
014
Q3 2
015
Q3 2
016
Q3 2
017
Q3 2
018F
Q3 2
019F
Q3 2
020F
Rental Values Capital Values
0.00
1.00
2.00
3.00
4.00
5.00
6.00
2011 2012 2013 2014 2015 2016 2017
Q1 Q2 Q3 Q4
For more information:
Surabhi Arora Senior Associate Director Research | India +91 98 7175 0808 [email protected]
Rishav Vij Director | Office Services Pune [email protected]
Ritesh Sachdev Senior Executive Director Occupier Services | India [email protected]
5th Floor, Suyog Platinum Tower, Naylor Road, Off Mangaldas Road Pune - 411001 India
Copyright © 2017 Colliers International.
The information contained herein has been obtained from
sources deemed reliable. While every reasonable effort has
been made to ensure its accuracy, we cannot guarantee it. No
responsibility is assumed for any inaccuracies. Readers are
encouraged to consult their professional advisors prior to
acting on any of the material contained in this report.
Stable leasing
momentum to
persist Uttara Nilawar Manager | Mumbai
In 2017, transaction volume in Kolkata remained
stable. We observed improved enquiries from
occupiers indicating an increase in absorption in
coming quarters. Peripheral locations are likely to
remain most favoured due to availability of grade A
supply at affordable rents. We advise developers to
remain flexible in lease terms in view of high
vacancy.
Forecast at a glance
Demand Demand to remain strong from technology occupiers especially in Sector V and peripheral areas
Supply While no new supply is likely in 2017, we expect a supply addition of 0.5 million sq ft (0.05 million sq m) by Q2 2018, a 2% increase in total stock; 4.2 million sq ft (0.4 million sq m) of supply infusion expected by 2020
Vacancy rate Average city vacancy set to remain stable at 25% in the short term; vacancy may shrink marginally if the upcoming supply is deferred
Rent Rentals may go up by 2-3% by 2020 if there is a decline in vacancy levels
Price Prices are set to remain stable in the short term; sellers will be in a position to negotiate in the long run
Technology occupiers dominate leasing activity in Q3 2017
During Q3 2017, commercial market demand in Kolkata
was in line with Q1 and Q2 absorption numbers, leading
to a gross absorption of 0.2 million sq ft (18,150 sq m).
While the number of deals declined, the average deal
size increased significantly to 15,000 sq ft (1,400 sq m)
in Q3 from 9,000 sq ft (840 sq m) in Q2 due to a few
major transactions. We are likely to witness increased
demand for large floor areas in upcoming quarters.
Tenant appetite remained high for establishments in
Sector V (39%) and peripheral areas like New Town,
Rajarhat, and Salt Lake City (27%). Hence developers
are also shaping their strategies based on occupier
preferences and giving priority to project completions in
these locations. The CBD (Park Street) and the SBD
(Topsia) areas accounted for the remaining 34% of the
total share in absorption. Most transactions were in the
form of relocations and expansions. We expect the trend
of relocation from the congested CBD and SBD districts
to continue among occupiers.
Technology occupiers dominated the leasing demand
with a 65% share of total absorption. Transactions from
Banking, Financial Services and Insurance (BFSI)
companies also remained upbeat with a 20% share of
leasing while coworking, engineering, manufacturing and
healthcare companies accounted for a combined 15%
share of total leasing. Technology companies are likely
to continue to dominate the leasing activity; however, we
may witness increased traction from coworking operators
as they try to make a mark in the Kolkata commercial
market.
Rental Values
Micromarkets Rental Values1
q-o-q Change
y-o-y Change
CBD2 80 - 110 0% -5%
SBD3 60 - 70 0% 0%
Sector V 38 - 45 0% -2%
PBD4 34 - 35 0% 0%
Source Colliers International India Research 1Indicative Grade A rentals in INR per sq ft per month 2Park Street, Camac Street, Chowranghee Road, AJC Bose Road 3EM Bypass, Topsia, Ruby 4Salt Lake, New Town, Rajarhat
Colliers Quarterly
KOLKATA | OFFICE Q3 2017 24 October 2017

2 Colliers Quarterly | | kolkata | Sector | Colliers International
Fig 1. Rental & Capital Values (INR per sq ft per month)
Fig 2. Gross Office Absorption (million sq ft)
Major Transactions in Q3 2017
Client Building Name Area (sq ft) Location
Foster Wheeler
Infinity Benchmark
42,000 Sec V
Reliance Capital
Thapar House 40,000 Rashbehari
Samsung Electronics
DLF IT Park 40,000 New Town
PwC India Millenium 25,000 Sec V
Awfis BioWonder 20,000 SBD
Source Colliers International India Research
Notes: All figures are based on market information as on 25th
September 2017
Supply infusion of 0.5 million sq ft (0.05 million sq m) expected by Q2 2018
In accordance with our earlier projection, no new supply
is scheduled for completion in 2017. However,
completion of projects such as Aurora Waterfront
measuring 0.5 million sq ft (0.05 million sq m) may lead
to supply addition by Q2 2018 if the project timelines are
met leading to a 2% increase in the city's total stock.
With the average city level vacancy hovering at around
25%, office demand is still relatively subdued. Hence
several developers are deferring their projects.
In Q3 2017, a y-o-y dip of 2-5% was witnessed in rental
values in the CBD and Sector V micromarkets as
property owners remained flexible on rents in order to
boost their occupancy levels. Rentals are set to continue
stable in the short term may go up by 2-3% by 2020 if
there is a decline in vacancy levels. Vacancy levels may
come down if project timelines are not met, and there is
limited supply in the market Capital values are set to
remain stable in most micromarkets in the short term due
to subdued investor activity.
Colliers' View The West Bengal government remains one of the very
few states which have not yet finalised Real Estate
(Regulation & Development) Act (RERA) norms.
Although lease transactions do not come under the
ambit of RERA, this delay has affected several
commercial sale transactions.
Infosys is set to start the construction of its proposed
development centre at Rajarhat where it purchased a 50
acre (0.2 million sq m) land parcel back in 2010.
(Source: Livemint) This new development will have the
capacity to seat around 1000 people and ought to act as
a huge motivation for the current commercial market.
0
2000
4000
6000
8000
10000
0
20
40
60
80
100
120
140
Q3 2
008
Q3 2
009
Q3 2
010
Q3 2
011
Q3 2
012
Q3 2
013
Q3 2
014
Q3 2
015
Q3 2
016F
Q3 2
017F
Q3 2
018F
Q3 2
019F
Q3 2
020F
Rental Values Capital Values
0.00
0.50
1.00
1.50
2.00
2010 2011 2012 2013 2014 2015 2016 2017
Q1 Q2 Q3 Q4
For more information:
Surabhi Arora Senior Associate Director | Research | India +91 98 7175 0808 [email protected]
Shubho Routh Senior Associate Director Office Services | Kolkata [email protected]
Ritesh Sachdev Senior Executive Director Occupier Services | India [email protected]
PS Srijan Corporate Park, 14th Floor, GP-2, Block EP & GP, Salt Lake, Sector V, Kolkata 700091 India
Copyright © 2017 Colliers International.
The information contained herein has been obtained from
sources deemed reliable. While every reasonable effort has
been made to ensure its accuracy, we cannot guarantee it. No
responsibility is assumed for any inaccuracies. Readers are
encouraged to consult their professional advisors prior to
acting on any of the material contained in this report.
Copyright © 2017 Colliers International.
ensure its accuracy, we cannot guarantee it. No responsibility is assumed for any inaccuracies. Readers are encouraged to consult their professional advisors prior to acting on any of the material contained in this report.
About Colliers International Group Inc.Colliers International Group Inc. (NASDAQ: CIGI; TSX: CIG) is an industry leading global real estate services company with more than 15,000 skilled professionals operating in 68 countries. With an enterprising culture
occupiers, owners and investors worldwide. Services include strategic advice and execution for property
solutions; appraisal, valuation and tax consulting; customized research; and thought leadership consulting.
help clients accelerate their success. Colliers has been ranked among the tInternational Association of Outsourcing Professionals’ Global Outsourcing for 11 consecutive years, more
colliers.com
396 68 countries on 6 continentsUnited States: 153 Canada: 29 Latin America: 24 Asia : 36 ANZ: 43 EMEA: 111
$2.6billion in annual revenue
2billion square feet under management
15,000professionals
Primary Authors:
Regional Authors:
Uttara Nilawar | Manager
Saif Lari | Assistant Manager
Teni Abraham | Analyst
Karthiga Ravindran | Analyst
Contributors:
Surabhi AroraSenior Associate DirectorResearch | India +91 9871750808surabhi.arora @colliers.com
Amit Oberoi | National DirectorKnowledge Systems | [email protected]
Andrew Haskins | Executive Director Research | [email protected]
For more information, please contact:Ritesh Sachdev | Senior Executive DirectorO�ce Services | [email protected]
Colliers International | IndiaIndiabulls Finance Centre, 17th Floor, Unit No. 1701,Tower 3, Senapati Bapat Marg, Elphinstone (W)Mumbai - 400 013 | India+ 91 224 050 4500