India IT Services
119
1 1. COVID-19 pandemic has reshaped enterprises' priority to adopt new agile business model. We highlight that >70% of enterprises are at early stage of digital adoption. 2. New age/digital services, which comprise of Cloud, Data, Experience and Cyber, are expected to clock 16.5% CAGR and reach US$900bn (67% of total spend) by FY25E. 3. Top-4 Indian IT firms (TCS, Infosys, Wipro and HCLT) are expected to witness strong revenue acceleration driven by higher demand and pay-off from investments in new- age technologies and talent base (reskilling of workforce, innovation centres, digital labs and capability-focused acquisitions). 4. Additionally, the Indian IT companies are likely to benefit from potential captive monetization efforts and vendor consolidation efforts by the global enterprises in the medium-term. 5. Whilst the Biden administration has dovish tone on immigration, we expect localization trend to continue. 6. Resilient operating model (low capex and high variable cost structure) and double-digit revenue growth visibility over FY21E-FY24E deserves premium valuation over broader market. We Initiate Coverage on Top-4 IT Names with BUY f TCS: We believe stock deserves multiple rerating on the back of strong double-digit revenue CAGR of 12.6%, expanding EBIT margin and industry leading return ratios (FY24E). We initiate coverage on TCS with BUY and a 2-Year Target Price of Rs4,180 (valuing the stock at 30x PE on FY24E EPS), which implies 32% upside from the current level. f Infosys: We forecast INFY to witness revenue CAGR of 13.3% over FY21E-24E. The stock deserves multiple rerating considering the industry-leading EPS CAGR of 15.7% over FY21E-24E, higher EBIT margin and attractive dividend yield of 3.1% (FY24E). We initiate coverage on INFY with BUY and a 2-Year Target Price of Rs1,920 (valuing the stock at 27x PE on FY24E EPS), which implies 38% upside from the current level. f HCLT: We forecast HCLT to witness revenue CAGR of 11.7% over FY21E-24E Currently, the stock trades at 15x of FY24E EPS, which is 37% discount to larger peers i.e. Infosys and TCS. We initiate coverage on HCLT with BUY and a 2-Year Target Price of Rs1,320 (valuing the stock at 20x PE of FY24E EPS), which implies 33% upside from the current level. f Wipro: We forecast Wipro to witness revenue CAGR of 13.3% including Capco acquisition. At CMP, the stock trades at 16.3x on FY24 EPS, which is 25% discount to average of larger peers i.e. Infosys and TCS. We initiate coverage on Wipro with BUY and a 2-Year Target Price of Rs565 (valuing the stock at 22x PE on FY24E EPS), which implies 35% upside from the current level. Coverage Summary Company Rating CMP (Rs) 2 Yr TP (Rs) Upside (%) TCS BUY 3,172 4,180 32 Infosys BUY 1,387 1,920 38 HCLT BUY 995 1,320 33 Wipro BUY 420 565 35 Price Performance Mkt. Cap. Absolute Performance Company (Rs bn) 1 M 3 M 12 M TCS 11,905 8.5 9.0 73.7 Infosys 5,913 9.5 11.3 116.4 HCLT 2,700 7.0 5.9 128.2 Wipro 2,396 1.4 9.4 113.2 Key Sectoral Tailwinds: Around 70% of enterprises are at early stage of digital adoption – huge opportunity Digital services are likely to clock 15-20% CAGR in the medium-term led by Cloud adoption Potential acquisition opportunities of captive units and vendor consolidation to help the IT players in gaining market share Strong medium-term growth visibility, resilient business model and consistent cash return policy warrant premium valuation Top-4 Indian IT names are expected to witness 32-38% upside from the current level Click Image for Video Presentation India IT Services - Well-placed to Witness Multi-Year Growth Acceleration Initiating Coverage | 31 March 2021 Institutional Equity Research Research Analyst: Suyog Kulkarni, CFA Contact : (022) 41681371 / 9890966735 Email : [email protected] Research Associate: Chaitanya Panchamatia Contact : (022) 41681371 / 8080782900 Email : [email protected] We have made changes to our Recommendation and Target Price. Please refer to Page no. 118 at the end of the report. Source: RSec Research; Note: CMP as on 30 March 2021 Source: RSec Research; Note: CMP as on 30 March 2021
Transcript of India IT Services

1
1. COVID-19 pandemic has reshaped enterprises' priority to adopt new agile business model. We highlight that >70% of enterprises are at early stage of digital adoption.
2. New age/digital services, which comprise of Cloud, Data, Experience and Cyber, are expected to clock 16.5% CAGR and reach US$900bn (67% of total spend) by FY25E.
3. Top-4 Indian IT firms (TCS, Infosys, Wipro and HCLT) are expected to witness strong revenue acceleration driven by higher demand and pay-off from investments in new-age technologies and talent base (reskilling of workforce, innovation centres, digital labs and capability-focused acquisitions).
4. Additionally, the Indian IT companies are likely to benefit from potential captive monetization efforts and vendor consolidation efforts by the global enterprises in the medium-term.
5. Whilst the Biden administration has dovish tone on immigration, we expect localization trend to continue.
6. Resilient operating model (low capex and high variable cost structure) and double-digit revenue growth visibility over FY21E-FY24E deserves premium valuation over broader market.
We Initiate Coverage on Top-4 IT Names with BUY
f TCS: We believe stock deserves multiple rerating on the back of strong double-digit revenue
CAGR of 12.6%, expanding EBIT margin and industry leading return ratios (FY24E). We initiate coverage on TCS with BUY and a 2-Year Target Price of Rs4,180 (valuing the stock at 30x PE on FY24E EPS), which implies 32% upside from the current level.
f Infosys: We forecast INFY to witness revenue CAGR of 13.3% over FY21E-24E. The stock
deserves multiple rerating considering the industry-leading EPS CAGR of 15.7% over
FY21E-24E, higher EBIT margin and attractive dividend yield of 3.1% (FY24E). We initiate coverage on INFY with BUY and a 2-Year Target Price of Rs1,920 (valuing the stock at 27x PE on FY24E EPS), which implies 38% upside from the current level.
f HCLT: We forecast HCLT to witness revenue CAGR of 11.7% over FY21E-24E Currently, the
stock trades at 15x of FY24E EPS, which is 37% discount to larger peers i.e. Infosys and TCS.
We initiate coverage on HCLT with BUY and a 2-Year Target Price of Rs1,320 (valuing the stock at 20x PE of FY24E EPS), which implies 33% upside from the current level.
f Wipro: We forecast Wipro to witness revenue CAGR of 13.3% including Capco acquisition.
At CMP, the stock trades at 16.3x on FY24 EPS, which is 25% discount to average of larger
peers i.e. Infosys and TCS. We initiate coverage on Wipro with BUY and a 2-Year Target Price of Rs565 (valuing the stock at 22x PE on FY24E EPS), which implies 35% upside from the current level.
Coverage Summary
Company Rating CMP (Rs)
2 Yr TP (Rs)
Upside (%)
TCS BUY 3,172 4,180 32
Infosys BUY 1,387 1,920 38
HCLT BUY 995 1,320 33
Wipro BUY 420 565 35
Price Performance
Mkt. Cap. Absolute Performance
Company (Rs bn) 1 M 3 M 12 M
TCS 11,905 8.5 9.0 73.7
Infosys 5,913 9.5 11.3 116.4
HCLT 2,700 7.0 5.9 128.2
Wipro 2,396 1.4 9.4 113.2
Key Sectoral Tailwinds:Around 70% of enterprises are at early stage of digital adoption – huge opportunity
Digital services are likely to clock 15-20% CAGR in the medium-term led by Cloud adoption
Potential acquisition opportunities of captive units and vendor consolidation to help the IT players in gaining market share
Strong medium-term growth visibility, resilient business model and consistent cash return policy warrant premium valuation
Top-4 Indian IT names are expected to witness 32-38% upside from the current level
Click Image for Video Presentation
India IT Services - Well-placed to Witness Multi-Year Growth Acceleration
Initiating Coverage | 31 March 2021Institutional Equity Research
Research Analyst:
Suyog Kulkarni, CFAContact : (022) 41681371 / 9890966735
Email : [email protected]
Research Associate:
Chaitanya PanchamatiaContact : (022) 41681371 / 8080782900
Email : [email protected]
We have made changes to our Recommendation and Target Price. Please refer to Page no. 118 at the end of the report.
Source: RSec Research; Note: CMP as on 30 March 2021
Source: RSec Research; Note: CMP as on 30 March 2021

2
Table of Contents
Content Page No.
Sector At a Glance 1-30
f (I)ndia (T)omorrow – A Bird's Eye View of Indian IT Industry........................................................... 3
f Sector At a Glance - Key Charts........................................................................................................... 4
f Key Sectoral Dynamics – At a Glance................................................................................................. 6
• Pandemic-led Accelerated Adoption of Technology..................................................................................... 6• Digital IT Services Expected to Clock 15-20% CAGR over FY20-25E............................................................. 10• Top-4 IT Names Score Well on Digital Capabilities....................................................................................... 11• Potential Acquisition Opportunities of Captive Units/ Vendor Consolidation to Increase Market
Share......................... 13
• Analysis of Key US Clients Suggests Revenue Share Opportunities........................................................... 15• Dovish Tone of New US Administration on Immigration - Worst is Over.................................................... 18
f Nifty IT Trades at 1-25% Discount to Nifty/NASDAQ;............................................................................... 23
f Channel Check Takeaways................................................................................................................................ 28
f Investment Decision Matrix (IDM)................................................................................................................... 29
f Environmental, Social & Governance Matrix (ESGM)............................................................................... 30
Company Section 33-118
TCS 34-54
Infosys 55-74
HCL Technologies 75-96
Wipro 97-118
3
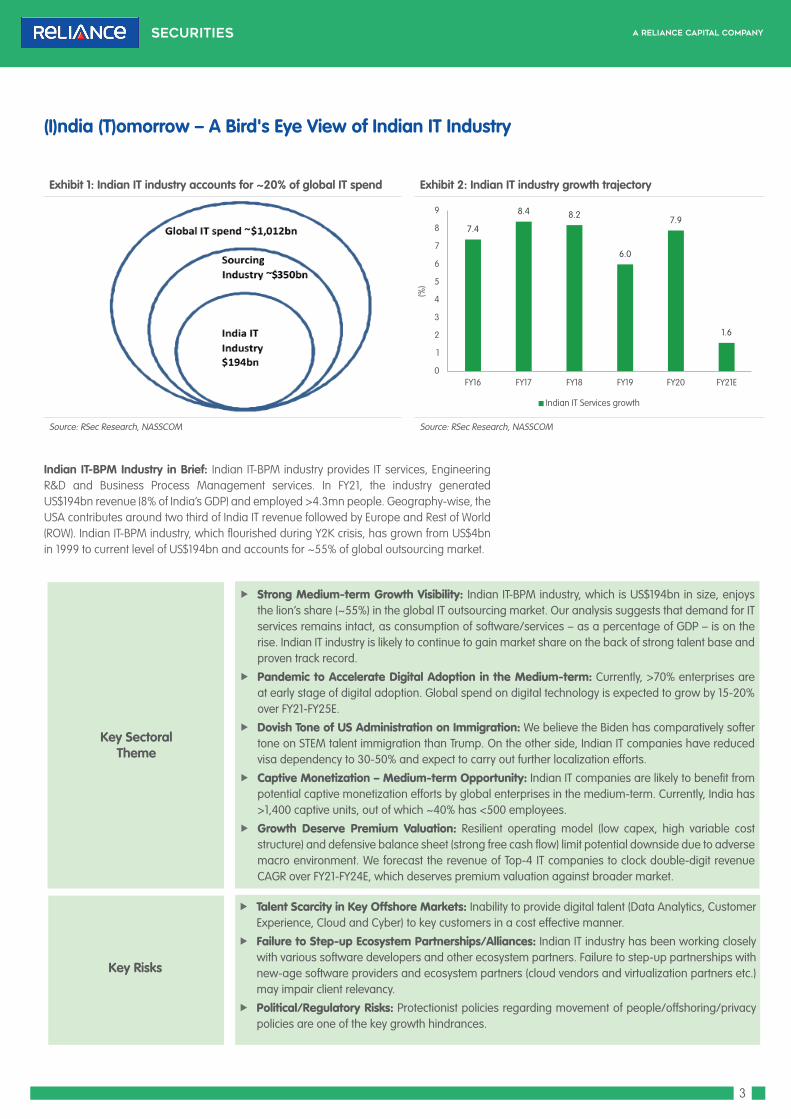
(I)ndia (T)omorrow – A Bird's Eye View of Indian IT Industry
Exhibit 1: Indian IT industry accounts for ~20% of global IT spend Exhibit 2: Indian IT industry growth trajectory
Source: RSec Research, NASSCOM Source: RSec Research, NASSCOM
Indian IT-BPM Industry in Brief: Indian IT-BPM industry provides IT services, Engineering R&D and Business Process Management services. In FY21, the industry generated US$194bn revenue (8% of India’s GDP) and employed >4.3mn people. Geography-wise, the USA contributes around two third of India IT revenue followed by Europe and Rest of World (ROW). Indian IT-BPM industry, which flourished during Y2K crisis, has grown from US$4bn in 1999 to current level of US$194bn and accounts for ~55% of global outsourcing market.
Key Sectoral Theme
f Strong Medium-term Growth Visibility: Indian IT-BPM industry, which is US$194bn in size, enjoys the lion’s share (~55%) in the global IT outsourcing market. Our analysis suggests that demand for IT services remains intact, as consumption of software/services – as a percentage of GDP – is on the rise. Indian IT industry is likely to continue to gain market share on the back of strong talent base and proven track record.
f Pandemic to Accelerate Digital Adoption in the Medium-term: Currently, >70% enterprises are at early stage of digital adoption. Global spend on digital technology is expected to grow by 15-20% over FY21-FY25E.
f Dovish Tone of US Administration on Immigration: We believe the Biden has comparatively softer tone on STEM talent immigration than Trump. On the other side, Indian IT companies have reduced visa dependency to 30-50% and expect to carry out further localization efforts.
f Captive Monetization – Medium-term Opportunity: Indian IT companies are likely to benefit from potential captive monetization efforts by global enterprises in the medium-term. Currently, India has >1,400 captive units, out of which ~40% has <500 employees.
f Growth Deserve Premium Valuation: Resilient operating model (low capex, high variable cost structure) and defensive balance sheet (strong free cash flow) limit potential downside due to adverse macro environment. We forecast the revenue of Top-4 IT companies to clock double-digit revenue CAGR over FY21-FY24E, which deserves premium valuation against broader market.
f Talent Scarcity in Key Offshore Markets: Inability to provide digital talent (Data Analytics, Customer Experience, Cloud and Cyber) to key customers in a cost effective manner.
f Failure to Step-up Ecosystem Partnerships/Alliances: Indian IT industry has been working closely with various software developers and other ecosystem partners. Failure to step-up partnerships with new-age software providers and ecosystem partners (cloud vendors and virtualization partners etc.) may impair client relevancy.
f Political/Regulatory Risks: Protectionist policies regarding movement of people/offshoring/privacy policies are one of the key growth hindrances.
Key Risks
7.4
8.4 8.2
6.0
7.9
1.6
0
1
2
3
4
5
6
7
8
9
FY16 FY17 FY18 FY19 FY20 FY21E
(%)
Indian IT Services growth

4
Sector At a Glance - Key Charts
Exhibit 3: Digital adoption by the enterprises Exhibit 4: Industry experts expect medium term technology uptrend
Source: IT Consultant, RSec Reserach Source: RSec Research, Gartner
Exhibit 5: Digital IT Services Expected to clock 15%-20% CAGR over FY20-FY25E
Source: Wipro
Exhibit 6: Top-40 IT Firms Contribute Only 45% to Global IT Services Industry
Exhibit 7: According to Survey, Financial Stability of IT vendor Remains a Primary Concern of 2021 vs. 2020
Source: RSec Research, Bloomberg Source: RSec Research, Everest Survey
0
5
10
15
20
25
30
35
40
45
50
Early stage Intermediate stage Advanced stage Developed
(%)
Enterprise Digital adoption
53
38
3026 26
14
84
0
10
20
30
40
50
60
Serviceproviderfinancialstability
Serviceprovider
perfomance
Availability ofservice
provider fornew/niche
nees
Cybersecuritythreats
Impact ofservice
providerslong termWFH plan
Lack ofinnovation
from serviceprovider
Decrease inprovider
productivity
Serviceprovider
fraud
(%)
Despite changes there remains concerns such as provider financial stability and performance in 2021
38 39 40 40 40 41
3 4 4 4 4 4
58 58 56 56 56 55
0
20
40
60
80
100
120
58 58 56 56 56 55
(%)
Top 36 global IT names Top 4 Indian IT names Other
3.6
5.0 5.5 5.5 5.4
-2.7
6.0 6.3
8.3 9.1
-4
-2
0
2
4
6
8
10
2020 2021E 2022E 2023E 2024E
(%)
IT Services growth forecast at Jan'20 IT Services growth forecast at Jan'21

5
Exhibit 8: TCS Reported Book to Bill Ratio of 1.4x during 9MFY21 Exhibit 9: Industry experts expect medium term technology uptrend
Source: Company, RSec Research Source: Company, RSec Research
Exhibit 12: Top-4 IT names deserve multiple re-rating, as IT industry is embracing more consumer industry like features
Exhibit 13: US bond yields remain well below historical average
Source: RSec Research, Bloomberg Source: RSec Research, Bloomberg
Exhibit 10: Currently, Nifty IT 12M forward PE trades at 1% discount to Nifty vs. historical peak premium of 40-60%
Exhibit 11: However, NASDAQ (US Technology Index) 12M forward PE trades at 45% premium to S&P500
Source: Rsec Research, Bloomberg Source: Rsec Research, Bloomberg
-30
-20
-10
0
10
20
30
40
50
60
70
01-
07
07-
07
01-
08
07-
08
01-
09
07-
09
01-
10
07-
10
01-
11
07-
11
01-
12
07-
12
01-
13
07-
13
01-
14
07-
14
01-
15
07-
15
01-
16
07-
16
01-
17
07-
17
01-
18
07-
18
01-
19
07-
19
01-
20
07-
20
01-
21
(%)
Nifty IT vs Nifty premium/(discount) Last 10 Yr Average Last 5 Yr Average
0
10
20
30
40
50
60
70
800
1-0
7
08
-07
03
-08
10-0
8
05
-09
12-0
9
07-
10
02
-11
09
-11
04
-12
11-1
2
06
-13
01-
14
08
-14
03
-15
10-1
5
05
-16
12-1
6
07-
17
02
-18
09
-18
04
-19
11-1
9
06
-20
01-
21
(%)
NASDAQ vs S&P premium/(discount) Last 10 Yr Average Last 5 Yr Average
HULGilletteBritania
Nestle
Asian Paints
EPAM
Colgate
TCSInfosysWiproHCLT
8
18
28
38
48
58
68
78
0 5 10 15 20 25 30
FY24
PE
(x)
FY21-FY24E EPS CAGR (%)
0.0
0.5
1.0
1.5
2.0
2.5
3.0
3.5
4.0
4.5
2010 2011 2012 2013 2014 2015 2016 2017 2018 2019 2020 2021
10 year US bond Yield 5 year average 10 year average
(%)
6
Key Sectoral Dynamics – At a GlanceWe are optimistic on the IT Services industry on the back of the following indicators:
f Pandemic-led Accelerated Adoption of Technology
f Digital IT Services Expected to Clock 15-20% CAGR over FY20-25E
f Top Four IT Names Score Well on Digital Capabilities
f Potential Acquisition Opportunities of Captive Units/ Vendor Consolidation to Increase Market Share
f Dovish Tone of New US Administration on Immigration - Worst is Over
I. Pandemic-led Accelerated Adoption of TechnologyIn Jul’20, we highlighted that the levers of medium-term technology demand remained intact, as the demand of IT services/software depends on two factors: (1) level of economic activity; and (2) pace of innovation/introduction of new technology/business model changes. In the early period of the pandemic, though the level of economic activity remained subdued, there was a higher propensity among the enterprises to adopt newer business models and digital technologies. In the medium-term technology landscape, digital technologies (Cloud, Data, Customer Experience and DevOps) were already present but pandemic proved to be a material stimulant in driving the enterprises to adopt agile digital operating model globally. While the digital adoption journey of the enterprises was in much calibrated manner, the pandemic has warranted business case of faster adoption of new age technologies. The pandemic highlighted the downsides of carrying a technology debt and the need for greater resilience, which resulted in accelerated initiative. The enterprises, which were already ahead in digital transformation journey, have managed to respond to pandemic-led challenges better than their peers.
Since our report (July 20, 2020), NIFTY IT has gained 68% and outperformed the broader market by 15%. Going forward, we highlight that the enterprises have committed for medium-term technology transformation programme and we expect accelerated timelines and faster digital transformation for global enterprises. Large Indian IT names are likely to be the key beneficiary of enterprise-wide adoption of new age technology. We forecast USD revenue CAGR of 12.6%/13.3%/13.3%/11.7% for TCS/Infosys/Wipro/HCLT over FY21-24E.
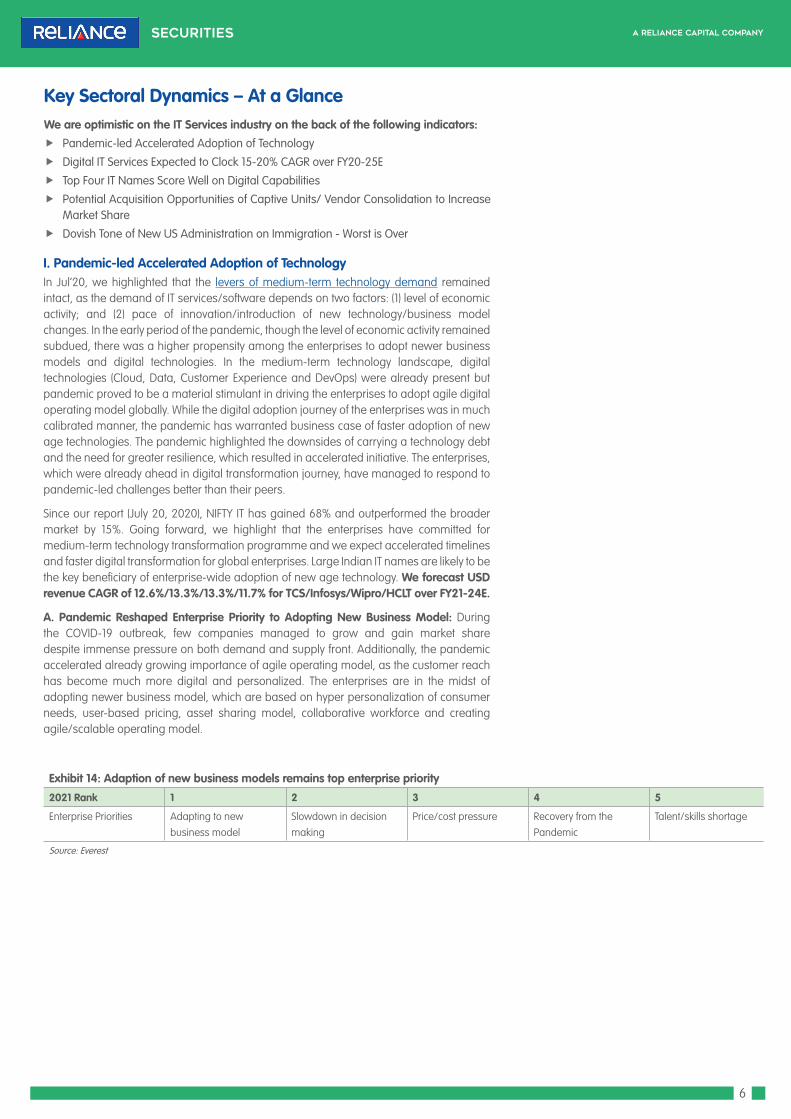
A. Pandemic Reshaped Enterprise Priority to Adopting New Business Model: During the COVID-19 outbreak, few companies managed to grow and gain market share despite immense pressure on both demand and supply front. Additionally, the pandemic accelerated already growing importance of agile operating model, as the customer reach has become much more digital and personalized. The enterprises are in the midst of adopting newer business model, which are based on hyper personalization of consumer needs, user-based pricing, asset sharing model, collaborative workforce and creating agile/scalable operating model.
Exhibit 14: Adaption of new business models remains top enterprise priority
2021 Rank 1 2 3 4 5
Enterprise Priorities Adapting to new business model
Slowdown in decision making
Price/cost pressure Recovery from the Pandemic
Talent/skills shortage
Source: Everest

7
B. Accelerated Digital Timelines & Increased Focus on Digital: The enterprises have stepped up efforts on IT modernization to cope up with new business model and bring in efficiency with cost take out deals. According to Mackenzie’s survey, 60% enterprises – which have witnessed organic growth in last 3 Years – are likely to accelerate their technology up-gradation timeline to maintain their competitive growth leadership. Interestingly, 50% enterprises, which have reported lower decline, increased their focus on digital and large change in technology direction. Enterprise IT transformation remains priority for the leaders (to maintain competitive advantage) as well as for the laggards (for efficiency, growth and survival).
Exhibit 15: Enterprises with strong organic growth in last three years have accelerated transformation timelines
Source: IT Consultant
Exhibit 16: Over 50% of enterprises with declining organic growth have increased focus on digital initiatives
Source: IT Consultant
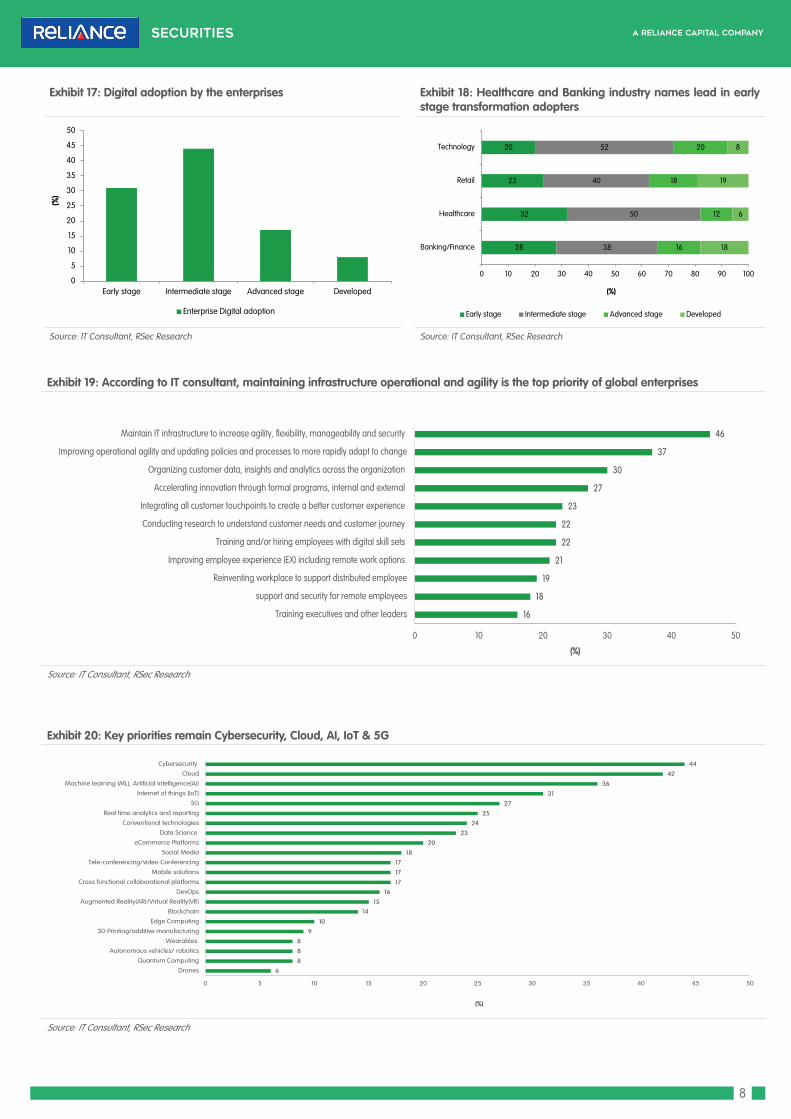
C. Digital Transformation Still at Nascent Stage: Digital adoption by global enterprises is still at inception stage. According to a survey, >70% of enterprises are in the early stage (early stage experiment and small pilots) and intermediate stage (developing foundations and building operations at scale) in term of digital maturity. The enterprises in technology and retail vertical are comparatively in advanced stage compared to financial and healthcare sector in terms of digital maturity. The current digital transformation priorities reflect the current state of capabilities, impact of COVID-19, management motivations and budget constraints. The current digital transformation priorities are: (1) modernizing IT infrastructure to increase agility, flexibility and security; (2) need to rapidly change and adopt; and (3) organizing customer data, analytics and insight across organization. The top priority for technology investments are: (1) Cybersecurity; (2) Cloud; (3) ML/AI; (4) IoT; and (5) 5G roll-out.
61.0
4.0
24.0
2.0
9.0
0
10
20
30
40
50
60
70
Acceleratedtimeline
Deceleratedtimeline
Increased focuson digital
Large change indirection
Don't know
(%)
Revenue increased by >25%
23.0
13.0
45.0
8.011.0
0
5
10
15
20
25
30
35
40
45
50
Acceleratedtimeline
Deceleratedtimeline
Increased focus ondigital
Large change indirection
Don't know
(%)
Revenue decreased by >25%
8
Exhibit 17: Digital adoption by the enterprises Exhibit 18: Healthcare and Banking industry names lead in early stage transformation adopters
Source: IT Consultant, RSec Research Source: IT Consultant, RSec Research
Exhibit 19: According to IT consultant, maintaining infrastructure operational and agility is the top priority of global enterprises
Source: IT Consultant, RSec Research
Exhibit 20: Key priorities remain Cybersecurity, Cloud, AI, IoT & 5G
Source: IT Consultant, RSec Research
0
5
10
15
20
25
30
35
40
45
50
Early stage Intermediate stage Advanced stage Developed
(%)
Enterprise Digital adoption
28
32
23
20
38
50
40
52
16
12
18
20
18
6
19
8
0 10 20 30 40 50 60 70 80 90 100
Banking/Finance
Healthcare
Retail
Technology
(%)
Early stage Intermediate stage Advanced stage Developed
16
18
19
21
22
22
23
27
30
37
46
0 10 20 30 40 50
Training executives and other leaders
support and security for remote employees
Reinventing workplace to support distributed employee
Improving employee experience (EX) including remote work options
Training and/or hiring employees with digital skill sets
Conducting research to understand customer needs and customer journey
Integrating all customer touchpoints to create a better customer experience
Accelerating innovation through formal programs, internal and external
Organizing customer data, insights and analytics across the organization
Improving operational agility and updating policies and processes to more rapidly adapt to change
Maintain IT infrastructure to increase agility, flexibility, manageability and security
(%)
6
8
8
8
9
10
14
15
16
17
17
17
18
20
23
24
25
27
31
36
42
44
0 5 10 15 20 25 30 35 40 45 50
Drones
Quantum Computing
Autonomous vehicles/ robotics
Wearables
3D Printing/additive manufacturing
Edge Computing
Blockchain
Augmented Reality(AR)/Virtual Reality(VR)
DevOps
Cross functional colloborational platforms
Mobile solutions
Tele-conferencing/video Conferencing
Social Media
eCommerce Platforms
Data Science
Conventional technologies
Real time analytics and reporting
5G
Internet of things (IoT)
Machine learning (ML), Artificial Intelligence(AI)
Cloud
Cybersecurity
(%)
9
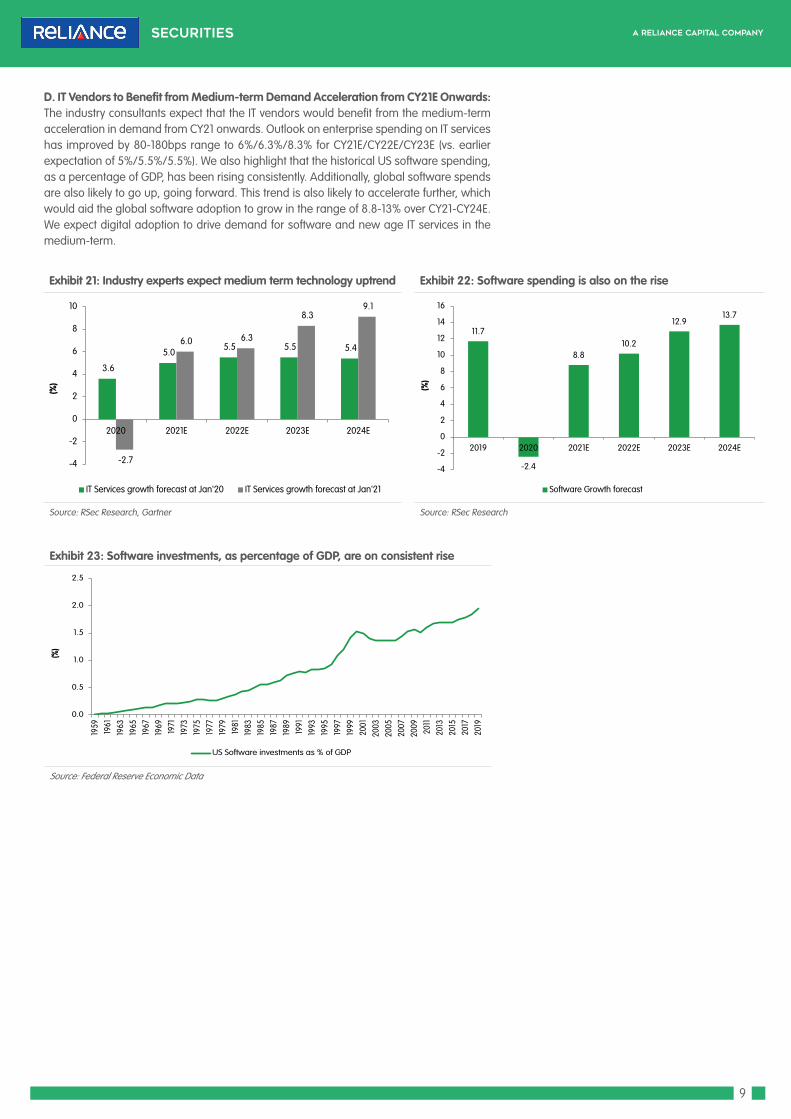
D. IT Vendors to Benefit from Medium-term Demand Acceleration from CY21E Onwards: The industry consultants expect that the IT vendors would benefit from the medium-term acceleration in demand from CY21 onwards. Outlook on enterprise spending on IT services has improved by 80-180bps range to 6%/6.3%/8.3% for CY21E/CY22E/CY23E (vs. earlier expectation of 5%/5.5%/5.5%). We also highlight that the historical US software spending, as a percentage of GDP, has been rising consistently. Additionally, global software spends are also likely to go up, going forward. This trend is also likely to accelerate further, which would aid the global software adoption to grow in the range of 8.8-13% over CY21-CY24E. We expect digital adoption to drive demand for software and new age IT services in the medium-term.
Exhibit 21: Industry experts expect medium term technology uptrend Exhibit 22: Software spending is also on the rise
Source: RSec Research, Gartner Source: RSec Research
Exhibit 23: Software investments, as percentage of GDP, are on consistent rise
Source: Federal Reserve Economic Data
11.7
-2.4
8.810.2
12.913.7
-4
-2
0
2
4
6
8
10
12
14
16
2019 2020 2021E 2022E 2023E 2024E
(%)
Software Growth forecast
0.0
0.5
1.0
1.5
2.0
2.5
1959
1961
1963
1965
1967
1969
1971
1973
1975
1977
1979
1981
1983
1985
1987
1989
1991
1993
1995
1997
1999
2001
2003
2005
2007
2009
2011
2013
2015
2017
2019
(%)
US Software investments as % of GDP
3.6
5.0 5.5 5.5 5.4
-2.7
6.0 6.3
8.3 9.1
-4
-2
0
2
4
6
8
10
2020 2021E 2022E 2023E 2024E
(%)
IT Services growth forecast at Jan'20 IT Services growth forecast at Jan'21

10
II. Digital IT Services Expected to Clock 15-20% CAGR over FY20-25EGlobal IT spend is likely to clock 7% CAGR over FY21-FY25E. While the traditional components (52%) of spend (on-premise data center and non DevOP ADMs) are expected to witness a negative CAGR of 5%, digital components are expected to register 15-20% CAGR over FY21-FY25E. Digital IT services primary comprise of Cloud hosting, Cloud migration, DevOps, Consulting, transformation projects and IoT. New growth areas i.e. 5G, robotics and block chain are likely to witness 30% CAGR over the same period. The key differentiators for digital solutions are: transformation DNA, industry-specific solutions, automation capabilities and availability of digital talent. Digital component likely to become the core component (67%) of IT services budget in FY25E.
Exhibit 24: Digital IT Services are expected to clock 15%-20% CAGR over FY20-FY25E
Source: Wipro
A. Commentary of Large Financial Institutions Seems Promising: Compilation of commentary from large financial intuitions suggest that technology spending is likely to remain the core of business transformation. Historically, the banks were averse to move their workloads on public cloud due to privacy and other regulatory concerns. But recent commentary suggests accelerated efforts in adopting hybrid Cloud model. Additionally, the banks have strengthened their efforts on data analytics front. Geography-wise, the US banks spend ~40-50% of total technology budget on new-age services, whereas the European banks spend ~25-30% of total budget in new areas. We highlight that the European banks must increase their spend on technology budgets to compete against US Fintech peers.

11
Exhibit 25: Global Banks Remain Committed to Modernize Their IT Ecosystem
Banks Comments
JP Morgan f Bank has built many data centers which work efficiently and bank is also planning move stuff to public cloud. Company is refactoring applications working on data, AI to get there. In every meeting we are talking about data, AI and cloud and what we are moving on cloud.
f AI is being used in asset wealth management, CIB, in trading, in Commercial Banking prospecting and it’s literally the tip of the iceberg.
f Whatever we say today, 10 years from now, it will be probably 50 times more than we are doing today and the banks would spend anything to get it done faster.
BofA f Bank is investing $3.5bn in technology next year which includes expansion of new financial centers. Currently, 69% of bank's consumers and wealth management households are digitally active.
US Bancorp f The company has planned to step up investments in digital channels
Citi f During CY20, expenses being up by 2% to 3%. Most of that is likely to be driven by the-the transformation spend
Barclays f Every year, bank invests over £250mn in technology change projects, and we invest as much, if not more, in technology than the world’s leading tech companies. Annual Technology budget was $3.5bn in 2020.
Deutsche Bank f Bank wanted to become a technology company and digital leader, with plans to spend €13bn on IT through 2022
Source: RSec Research
Exhibit 26: US Banks spend ~48% of Technology Budget on New Areas
Source: RSec Research; Statista
III. Top-4 IT Names Score Well on Digital CapabilitiesThe Indian IT companies have stepped up efforts on digital technologies (Cloud, AI, Cybersecurity, DevOps and experience) in last few years driven by: (1) reskilling majority of workforce with new-age technology; (2) co-operation with the universities and setting up innovation centers; (3) injecting digital experts in deal executions and also refreshing deal offerings to provide integrated deals; and (4) stepping up partnerships with the Cloud hyperscalers and US software names. Currently, digital business accounts for >40% of topline, which we expect to grow in high double-digit. Indian large cap IT names have formed separate units to focus on Cloud migration, Cloud native applications and ancillary services. Cloud, as an infrastructure service, has grown in the excess of 30% in last few quarters, as accelerated Cloud adoption continues to benefit the IT services firm as ecosystem partners.
25 26 27 2830
3337
4044
48
1315
1719
2124
2729
3133
0
10
20
30
40
50
60
2013 2014 2015 2016 2017 2018 2019 2020 2021E 2022E
(%)
North America Europe

12
Exhibit 27: Digital is Becoming New Core for Indian IT Names with Revenue Exposure in the Range of 40-50%
Company name Digital as % of revenues
Comments
Accenture 70 (Aug’20)
f It announced the formation of Accenture Cloud First with US$3bn investment over three years to help the clients across industries rapidly. Accenture Cloud First is a new multi-service group of 70,000 cloud professionals. This new group integrates the company’s wide-ranging cloud expertise, including cloud migration, infrastructure and application services and ecosystem partnerships; deep industry and cross-industry insights, data and applied Intelligence capabilities
TCS ~40-50 f The company has also made Cloud as a strategic priority. TCS cloud consulting unit will look at cross
functional and hybrid cloud business opportunities, where the company will apply its contextual knowledge
Infosys 50 f It launched Cobalt-dedicated cloud unit, which has >15,000 cloud assets and >200 micro verticals
solutions. Infosys acquired few cloud based companies i.e. Simplus, Guidevision & Blue Acron
Wipro 41+ f It is working on Cloud related reskilling initiatives. The company is investing in vertical led offerings,
cloud studios and lab to accelerate growth
HCLT 40+
f It launched a new IP to accelerate deployment of SAP environments on Google Cloud Platform. HCLT also became the only certified SAP competency partner for four hyperscalers i.e. Google Cloud, AWS, Azure and IBM. HCL is also now a Microsoft Cloud Adoption Framework Enterprise Scale Certified Partner. HCLT also expanded collaboration with AWS by joining the ISV workload migration programme. On IBM Cloud, it had set up partnership 2 year ago on hybrid cloud; recently, it expanded this partnership to include IBM public cloud with focus on certain regulated industries.
LTI 44.4 f Targets US$1bn revenue form cloud business in next 3 years. It has set independent cloud unit for each
hyperscaler. LTI has aligned teams with focus on both verticals and service lines.
Mphasis 53.8
f “Our hunting teams have also been realigned to focus on high-growth verticals and on a cloud partner-driven go-to-market strategy. We have seen a 3x increase in our cloud pipeline in the last one year. A 300% jump in the cloud pipeline is attributable primarily to the massively increased adoption and consumption. The company does fair bit of work with both AWS and Azure, and that's what is driving that growth in both pipeline and in the actual TCV”
Source: RSec Research
A. Public Cloud Adoption is Growing High Double-digit: Public cloud companies -Infrastructure as a Service (IaaS) has been growing at ~30%. Amazon Web Services enjoys the lion’s share in the ecosystem with 49% market share. Google Cloud and Microsoft Azure are other large players, who are seeing strong growth. Every dollar spent on Cloud leads to additional US$3 spend on ecosystem.
B. Top-4 IT Names have Strong Relationship with Cloud Platform Providers: Large Indian IT firms were one of the early collaborators with Cloud platform providers. Top-4 IT firms have dedicated teams for each Cloud providers with industry-specific professionals. According to IT consultant Everest, Top-4 Indian IT firms have leadership position with all 3 Cloud platform providers. According to Flexera 2020 state of Cloud survey, 93% enterprises have multi-cloud strategy, while 87% enterprises have a hybrid Cloud strategy. Additionally, 59% enterprises expect Cloud usage to exceed prior year plans due to COVID-19. The organizations expect Cloud spend to increase by 47% in CY21E.
Exhibit 28: Top-4 IT Names Enjoy Strong Ecosystem Relationship with Large Cloud Hyperscalers
Accenture TCS Infosys Cognizant Capgemini Wipro HCLT TechM LTI Mphasis Mindtree
Cloud
System Integrator Capabilities on Google Cloud Platform
Leader Leader Leader Contender Contender Leader Leader Contender
System Integrator Capabilities on Microsoft Azure
Leader Leader Leader Leader Leader Leader Leader Contender Contender Contender Contender
System Integrator Capabilities on Amazon WEB Services.
Leader Leader Leader Leader Leader Leader Leader Contender Contender Contender
Source: RSec Research, Everest

13
IV. Potential Acquisition Opportunities of Captive Units/Vendor Consolidation to Increase Market ShareThe IT services industry is fragmented with the Top-40 names contributing only 45% to total market. Enterprises have large internal tech teams and have also set up multiple offshore units. Additionally, the large enterprises generally deploy multiple vendors across different technology sub-verticals and different geographies. We expect the Indian IT names to witness accelerated market share gain driven by: (1) consistent stable performance in pandemic period and in the aftermath; (2) monetization of captive/internal IT teams - cost take out, variable cost operating model; and (3) consolidation of distributed vendors ecosystem - flight to safety/quality. Historically, Indian IT industry has been consistently gaining market share, which currently stands at 19.4% compared to 9.7% in 2010. Recent surge in large employee rebadging IT deals by TCS, Infosys and Wipro are expected to accelerate this trend further, going forward.
Exhibit 29: Top-40 IT Firms Contribute Only 45% to Global IT Services Industry
Exhibit 30: Indian IT Industry Contributes 19.2% to Global IT Spend
Source: RSec Research, Bloomberg Source: Rsec Research, Nasscom
A. Expect Vendor Consolidation Likely to be Medium-term Tend: There is large scope for the IT sector vendor ecosystem, as there are multiple small technology and geography specific midsize IT vendors. The mid-cap IT firms in general work with few large clients and have high client concentration. They enjoy niche specialization but lack scale and full stack capabilities in some cases to win large size deals. In FY20, L&T acquired Indian IT mid-cap firm Mindtree to get access of capabilities in Technology and Travel & Hospitality vertical. L&T already owns 2 IT and ER&D firms i.e. L&T Infotech and L&T Technology. During last year, Baring Private Equity acquired Virtusa for $2bn. Currently, Baring operates 3 IT firms i.e. Virtusa, Coforge and Hexaware (unlisted). Recently, a large European IT service provider also unsuccessfully attempted to merge with DXC technology. We expect consolidation among IT vendors is likely to be medium-term trend, which will enhance scale and gain market share.
Exhibit 31: Key acquisitions in IT industry
Date Acquirer Type Target Consideration Ownership
Jan-19 Capgemini IT company Altran Eur 3.6bn 100%
Apr-19 Baring Private Equity Asia PE player NIIT Technology $709mn 56% (30% from promoter and 26% from open offer)
Mar-19 L&T Conglomerate Mindtree $1550mn 66.3% (20.3% from promoter, 15% from market, 31% open offer)
Jan-19 DXC IT company Luxoft $2bn 100%
Jul-19 Atos IT company Syntel $3.4bn 100%
Apr-17 DXC IT company Merger of Computer Science Corporation and HPE Enterprise segment
$26bn Merger
Apr-16 Blackstone PE player Mphasis $825mn-$1100mn 60%
Mar-16 Virtusa IT company Polaris $166mn 52%
Source: RSec Research
38 39 40 40 40 41
3 4 4 4 4 4
58 58 56 56 56 55
0
10
20
30
40
50
60
70
80
90
100
2014 2015 2016 2017 2018 2019
(%)
Top 36 global IT names Top 4 India IT Other
2.5
19.2
0
5
10
15
20
25
FY01
FY02
FY03
FY04
FY05
FY06
FY07
FY08
FY09
FY10
FY11
FY12
FY13
FY14
FY15
FY16
FY17
FY18
FY19
FY20
FY21
E
(%)
India IT share in Global IT Spend

14
B. Large Indian IT Names to Benefit from Flight to Safety: According to survey conducted by IT services consultant Everest, ~74% enterprises were satisfied with their service providers during COVID-19 shutdown. The primary concern of the enterprises (~53% of respondents) for 2021 is financial stability of service providers vs. niche capability few years back. This suggests that the large Indian IT names backed by strong profitability and net cash balance sheet are likely to be the primary beneficiaries of latest change in enterprise preferences.
Exhibit 32: 74% of Enterprises Satisfied With Their IT Vendors During Pandemic
Exhibit 33: Financial Stability of IT vendor Remains a Primary Concern
Source: RSec Research, Everest Source: RSec Research, Everest
C. Employee Rebadging & Cost Takeout Deals Likely to be Medium-term Trend: We expect trend of large transformation and cost takeout deals to continue in the medium-term driven by: (1) efficiency pressure on enterprises due to COVID-19; (2) better resiliency by IT vendors vs. internal IT/captive teams; and (3) need for integrated transformation approach. There are 1,400 captive units in India, out of which 40% units have <500 employees. Additionally, a glimpse at vendor ecosystem suggests possibility of further vendor consolidation. We believe Top-4 IT names will remain the key beneficiary of monetization of captive unit and Internal IT team. These deals are often large and come with 5-7-year contract duration, which we believe provide strong revenue visibility over the medium-term.
Exhibit 35: TCS reported Book to Bill Ratio of 1.4x during 9MFY21 Exhibit 36: Infosys also reported strong acceleration in large deal orders
Source: RSec Research Source: RSec Research
Exhibit 34: Key Large Deal Wins
Deal Name Size Description
TCS Acquires Postbank Systems Annual run rate of Eur260mn
Driving technology led transformation of bank; ~1,500 employees added
Infosys Daimler Deal US$3.2bn Migration to Hybrid Cloud and Infrastructure Overhaul
Infosys Rolls Royce Deal Not Available Engineering and R&D services
Infosys Transamerica Deal Not Available Enhance digital capabilities
Wipro Metro Deal US$700mn Complete technology, engineering and solutions transformation; ~1,300 employees added
3638
18
4 4
0
5
10
15
20
25
30
35
40
Highly Satisfied ModeratelySatisfied
Neutral ModeratelyDissatisfied
HighlyDissatisfied
(%)
Average Satisfaction with service providers during COVID-19 shutdown
53
38
3026 26
14
84
0
10
20
30
40
50
60
Serviceproviderfinancialstability
Serviceprovider
perfomance
Availability ofservice
provider fornew/niche
nees
Cybersecuritythreats
Impact ofservice
providerslong termWFH plan
Lack ofinnovation
from serviceprovider
Decrease inprovider
productivity
Serviceprovider
fraud(%
)
Despite changes there remains concerns such as provider financial stability and performance in 2021

15
Exhibit 37: TCS' Top 20 US Clients
Client Key Competition
Financial Services f Infosys, LTI, Wipro, Iris Software, Virtusa, NTT data Services, Accenture, Mitchell/Martin, Capgemini, Maveric, Incandescent Tech, Synechron Inc, Oracle Financial Services, E&Y, Photon
Technology f Infosys, Wipro, Quest Global, Cognizant, Deloitte, Red Oak Technologies, DGN Technologies, Antra, Bridgenexus, Compunnel Software, Mastech, Mythri
Retail f KFORCE, Mindtree, Atos, Cognizant, Adecco, Deloitte, Mastech, Ocher Technology, Ugam Solutions
Pharma retail f Cognizant, Photon, GlobalLogic, Accenture, Mastech Digital, Persistent, Populus Group, Multivision, I3 Infotek, E&Y, federal Soft Systems
Financial Services f HCLT, Wipro, IBM, Mastech Digital, Compunnel Software Group, Daman, Populus Group, Inherent Technologies
Financial Services f Atos, Cognizant, KFORCE, Compunnel Software Group, NTT Data, Tech Aspect, Deloitte, Wipro, Capgemini
Healthcare f Cognizant, Headstrong LLC, Randstad, Mastech, Genpact, Computer Software Group, Deloitte, Genpact, Nemo IT, Xsell Resources, Comtek, Kforece, Zensar
Entertainment f Cognizant, Infosys, Mastech Digital, Accenture, MARLABS, Xavient, Wipro, Tata Elexi, E&Y, Virtusa
Financial Services f CSC Covansys Corporation, Cognizant, Accenture, Infostrech, ProKarma, DXC Technology, Perficient, Mastech, Compunnel Software Group, Deloitte, SRS Consulting
Technology f Infosys, SRS Consulting, LTI, Wipro, Zensar, Tech Mahindra, Accenture, Persistent, HCLT, Cognizant, Randstad Technology, Urpan Technology, Capgemini, Enquero, Onstak
Financial Services f Atos, Cognizant, Infosys, Intraedge, IBM, Mastech, Impetus, Deloitte, Humac, M3BI, Virtusa, Computer Software Group, Mindtree
Diversified f Genpact, Tech Mahindra, Capgemini, Accenture, E&Y, Quest Global Services, Hexaware, Headstrong
Financial Services f Mastech, Virtusa, Accenture, Cognizant, E&Y, Randstad, Indotronix, Quiddity Infotech
Financial Services f CGI Technologies, Cognizant, Accenture, Mastech, Randstad, Deloitte, Compunnel Software, EPAM, Mastech, Virtusa, Bradford
Retail f Wipro, Larsen & Toubro Infotech, Cognizant, IBM, Deloitte, HCLT, Capgemini, Accenture, L&T Technology Services, I3 Infotech, Microexcel, BirlaSoft, TechMahindra
Financial Services f HTC Global Services, Capgemini, Accenture, IBM, NTT Data, ARV Systems, Savy Info Systems, Majesco, Global Data
Professional Services f ValuLabs, Infocepts, Maantic, Wave Solutions, Asta CRS
Financial Services f Infosys, Headstrong, Capgemini, Tech mahindra, Synechron, Capgemini, E&Y, Genpact, Deloitte, Virtusa, Mastech Digital
Financial Services f Randstad, Synechron, Diversant, Data INC, Infosys, Mitchell/Martin Collabera, Accenture, Deloitte, E&Y, Genesis Corp
Pharmaceutical f Infosys, Deloitte, Informatica, L&T Technology, Mastech, Deloitte, HCLT, Headstrong, Capgemini, Synechron
Source: RSec Research, Department of Labour (US); Note: Grey highlight denotes common Top-20 client accounts for Top-4 IT names
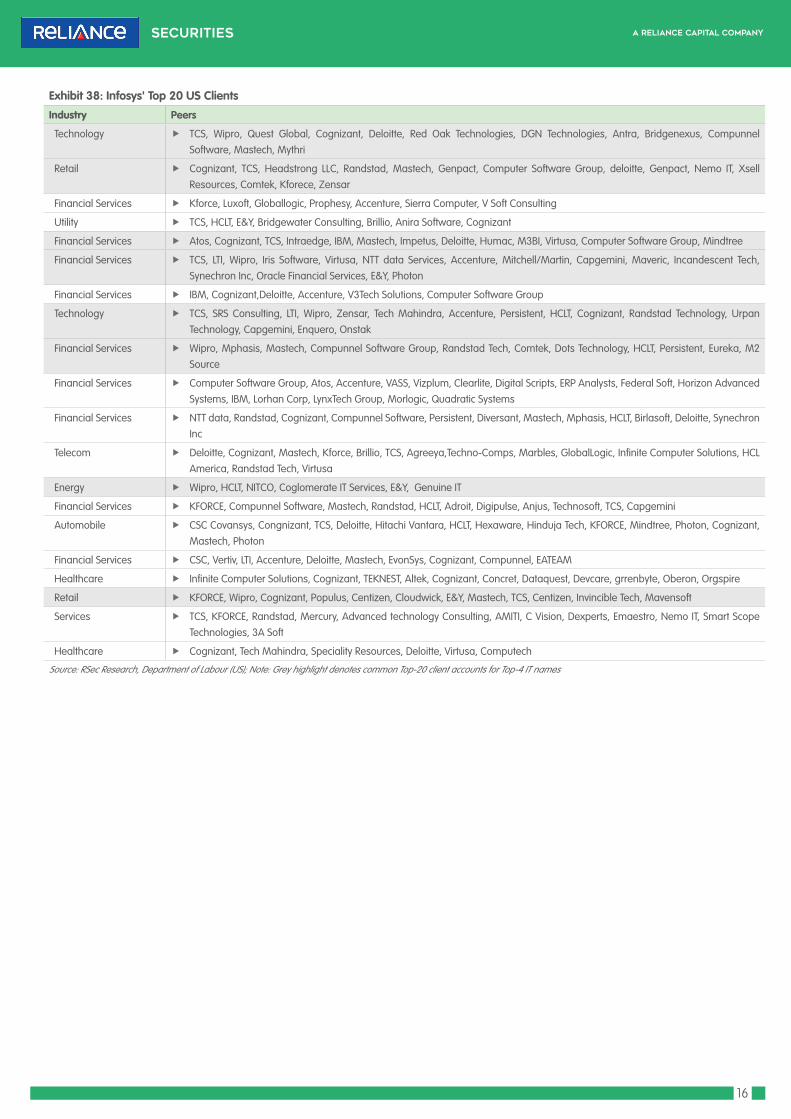
D. Analysis of Key US Clients Suggests Revenue Share Opportunities: We have analyzed Labour Condition Applications (LCAs) of Top-4 IT names for FY20 (Oct’19-Sept’20), which suggests that the Top-20 US clients list is diversified, and it largely comprises of financial services, retail, technology, automobiles and healthcare firms. We have also analyzed key competitors in large accounts. The key conclusions of our analysis are given in the following:
1. There are multiple common client accounts for Top-4 IT names in top-20 US client accounts list.
2. Accenture, Cognizant and Capgemini remains key global IT competitors. Additionally, Mid cap IT names such as Mphasis and Mindtree has made stronger inroads into the client IT ecosystem.
3. We also highlight HR firms such as Randstad and KFORCE have a decent workshare in the key accounts. We believe this rise was driven by protective visa regime in the US. We expect the large Indian IT firms to benefit from comparatively softer tone on immigration front by the Biden Administration.
4. While the IT vendor ecosystem is dominated by larger vendors (4-6 large vendors), there are multiple medium and small unlisted IT vendors as well (5-20 vendors). Thus, we see a huge scope for vendor consolidation in Top-20 US accounts, going forward.
16
Exhibit 38: Infosys' Top 20 US Clients
Industry Peers
Technology f TCS, Wipro, Quest Global, Cognizant, Deloitte, Red Oak Technologies, DGN Technologies, Antra, Bridgenexus, Compunnel Software, Mastech, Mythri
Retail f Cognizant, TCS, Headstrong LLC, Randstad, Mastech, Genpact, Computer Software Group, deloitte, Genpact, Nemo IT, Xsell Resources, Comtek, Kforece, Zensar
Financial Services f Kforce, Luxoft, Globallogic, Prophesy, Accenture, Sierra Computer, V Soft Consulting
Utility f TCS, HCLT, E&Y, Bridgewater Consulting, Brillio, Anira Software, Cognizant
Financial Services f Atos, Cognizant, TCS, Intraedge, IBM, Mastech, Impetus, Deloitte, Humac, M3BI, Virtusa, Computer Software Group, Mindtree
Financial Services f TCS, LTI, Wipro, Iris Software, Virtusa, NTT data Services, Accenture, Mitchell/Martin, Capgemini, Maveric, Incandescent Tech, Synechron Inc, Oracle Financial Services, E&Y, Photon
Financial Services f IBM, Cognizant,Deloitte, Accenture, V3Tech Solutions, Computer Software Group
Technology f TCS, SRS Consulting, LTI, Wipro, Zensar, Tech Mahindra, Accenture, Persistent, HCLT, Cognizant, Randstad Technology, Urpan Technology, Capgemini, Enquero, Onstak
Financial Services f Wipro, Mphasis, Mastech, Compunnel Software Group, Randstad Tech, Comtek, Dots Technology, HCLT, Persistent, Eureka, M2 Source
Financial Services f Computer Software Group, Atos, Accenture, VASS, Vizplum, Clearlite, Digital Scripts, ERP Analysts, Federal Soft, Horizon Advanced Systems, IBM, Lorhan Corp, LynxTech Group, Morlogic, Quadratic Systems
Financial Services f NTT data, Randstad, Cognizant, Compunnel Software, Persistent, Diversant, Mastech, Mphasis, HCLT, Birlasoft, Deloitte, Synechron Inc
Telecom f Deloitte, Cognizant, Mastech, Kforce, Brillio, TCS, Agreeya,Techno-Comps, Marbles, GlobalLogic, Infinite Computer Solutions, HCL America, Randstad Tech, Virtusa
Energy f Wipro, HCLT, NITCO, Coglomerate IT Services, E&Y, Genuine IT
Financial Services f KFORCE, Compunnel Software, Mastech, Randstad, HCLT, Adroit, Digipulse, Anjus, Technosoft, TCS, Capgemini
Automobile f CSC Covansys, Congnizant, TCS, Deloitte, Hitachi Vantara, HCLT, Hexaware, Hinduja Tech, KFORCE, Mindtree, Photon, Cognizant, Mastech, Photon
Financial Services f CSC, Vertiv, LTI, Accenture, Deloitte, Mastech, EvonSys, Cognizant, Compunnel, EATEAM
Healthcare f Infinite Computer Solutions, Cognizant, TEKNEST, Altek, Cognizant, Concret, Dataquest, Devcare, grrenbyte, Oberon, Orgspire
Retail f KFORCE, Wipro, Cognizant, Populus, Centizen, Cloudwick, E&Y, Mastech, TCS, Centizen, Invincible Tech, Mavensoft
Services f TCS, KFORCE, Randstad, Mercury, Advanced technology Consulting, AMITI, C Vision, Dexperts, Emaestro, Nemo IT, Smart Scope Technologies, 3A Soft
Healthcare f Cognizant, Tech Mahindra, Speciality Resources, Deloitte, Virtusa, Computech
Source: RSec Research, Department of Labour (US); Note: Grey highlight denotes common Top-20 client accounts for Top-4 IT names

17
Exhibit 39: Wipro's Top 20 US Clients
Clients Key Competition
Technology f TCS, Infosys, Quest Global, Cognizant, Deloitte, Red Oak Technologies, DGN Technologies, Antra, Bridgenexus,Compunnel Software, Mastech, Mythri
Financial Services f Infosys, Mphasis, Mastech, Compunnel Software Group, Randstad Tech, Comtek, Dots Technology, HCLT, Persistent, Eureka, M2 Source
Financial Services f Cognizant, Compunnel Software Group, Mastech Digital, Deloitte, Vak IT, Federal Soft Systems, Accenture
Financial Services f TCS, LTI, Infosys, Iris Software, Virtusa, NTT data Services, Accenture, Mitchell/Martin, Capgemini, Maveric, Incandescent Tech, Synechron Inc, Oracle Financial Services, E&Y, Photon
Logistics f Atos, Mphasis, HCLT, Deloitte, Sai Technology, KFORCE, Compunnel Software Group, Infogain, Vidorra
Financial Services f Atos, Maxima Consulting, Oracle Financial Services, Cognizant, TCS, Mastech Digital, IBM, Hexaware
Technology f TCS, SRS Consulting, LTI, Infosys, Zensar, Tech Mahindra, Accenture, Persistent, HCLT, Cognizant,Randstand Technology, Urpan Technology, Capgemini, Enquero, Onstak
Retail/Pharma f CGI Technologies, Cognizant, TCS, Accenture, Mastech, Randstad, Deloitte, Compunnel Software, EPAM, Mastech, Virtusa, Bradford
Technology f Deloitee, KFORCE, Mphasis, TCS, Infosys, Inspirisys, Accenture, Capgemini, Quest Global, Unique Key Resources, Adecco, System Soft Technologies, Softcom, ITC Infotech
Professional Services f Accenture, TCS, Randstad, Titan Data Group, Javen Technology, Mastech, Techvision, Javen Technology
Technology f HCLT, Zen3 Infosolutions, Infosys, Couloir, TCS, Cirquetech, Brillio, KFORCE, Accenture, Aricent Tech, Cognizant, Isite Technology, Lasai Technolgogies
Retail f KFORCE, Infosys, Cognizant, Populus, Centizen, Cloudwick, E&Y, Mastech, TCS, Centizen, Invincible Tech, Mavensoft
Financial Services f CSC, TechM, Compunnel Software Group, Mastech, Altimetrik, EPAM, High Quartile, KFORCE, EPAM, Cognizant
Automobile f L&T Infotech, L&T Technology, CSC Covansys, Delta Computer Consulting, Accenture, IBM, Mastech Digital, HCLT, Altair, Product design, Infosys, Cognizant
Financial Services f Capgemini, KFORCE, Cognizant, TCS, Xavient Digital, E&Y, CGI Technology, Conch Technology
Financial Services f Cognizant, Infosys, TCS, Hexaware, Mastech, Americcloud Solutions, Oracle Financial Services Software, Atos, Synopsis, E&Y, Compunnel Software Group, Virtusa, Innovative Consulting
Energy f Infosys, HCLT, NITCO, Conglomerate IT Services, E&Y, Genuine IT
Retail/Consumer Goods f TCS, Larsen & Toubro Infotech, Cognizant, IBM, deloitte, HCLT, Capgemini, Accenture, L&T Technology Services, I3 Infotech, Microexcel, BirlaSoft, TechMahindra
Financial Services f TCS, Cognizant, KFORCE, Mastech Digital, Federal Soft Systems, 8K Miles Health Cloud
Energy f L&T Infotech, Tech Mahindra, Accenture, L&T Technology Services, Compunnel Software Group, EPAM
Financial Services Cognizant, Accenture, Lucent Systems, TCS, IGate Solutions
Source: RSec Research, Department of Labour (US) ; Note: Grey highlight denotes common Top-20 client accounts for Top-4 IT names

18
Exhibit 40: HCLT's Top 20 US Clients
Clients Key Competition
Financial Services f KFORCE, TCS, Wipro, IBM, Mastech Digital, Compunnel Software Group, Daman, Populus Group, Inherent technologies
Pharmaceutical f Cognizant, Accenture, E&Y, deloitte, CGI Technologies, LS Solutions, Infosys, United Pharma Technology, White Collar Technologies, Mastech Digital, Compunnel Software Group
Technology f ETOUCH Systems, Deloitte, Accenture, HCLT, Tech Mahindra, EPAM, Infosys, IBM, Global Logic, KFORCE, TCS
Communication f Capgemini, HCLT, Infosys, Telecom Technology, Pro Karma, UST Global, Tech Democracy, Wipro, Accenture, NTT data, TCS, Amdocs, Compunnel Software Group
Industrial f Infosys, TCS, Accenture, Fujitsu America, Cyient, E&Y, Ruleware, Tech Mahindra, App Soft, TechMagix, Dotcom team
Logistics f Atos, Mphasis, Wipro, Deloitte, Sai Technology, KFORCE, Compunnel Software Group, Infogain, Vidorra
Beverage f E&Y, DEXTEROUSUSA, Altran, Anveta
Media & Entertainment f Accenture, Birlasoft, Cognizant, Capgemini, E&Y, Ciber, Info Services, Deloitte, Genpact, Globant, Affine, Everest
Industrial f L&T Technology Services, Quest Global, Einfochips, Compunnel Software Group, Cyient, Anventa, Blucapsoft, Caltek Solutions, Computer Professionals
Financial Services f Infosys, DXC, Luxoft, Accenture, TCS, Cira Infotech, Ikcon Technologies, Oracle Financial Services, Alttech, Ariston, Inficare
Healthcare f Capgemini, E&Y, Deloitee, Wipro, Horkus Solutions, Katalyst Helthcares
Finance f Capgemini, Incandescent Technologies
Healthcare f Capgemini, Indus USA, Cognizant, Geometric, I3 Infotech, Ilink Systems, Systechcorp
Technology f Zen3 Infosolutions, Infosys, Couloir, TCS, Wipro, Cirquetech, Brillio, KFORCE, Accenture, Aricent Tech, Cognizant, Isite Technology, Lasai Technologies
Healthcare f Cognizant, Capgemini, HCLT, IBM, I3 Infotek, The Fountain Group
Financial Services f TCS, Mphasis, Cognizant, Capgemini, E&Y, Accenture
Financial Services f Infosys, TCS, Hexaware, Cognizant, Photon, Procal Technologies
Technology f Infosys, Aricent, UST Global, Deloitte, L&T Technology, Cerium Systems, TCS, Wipro
Financial Services f Mastech Digital, TCS, Cognizant, I-Link Solutions, ASTA CRS, Astir IT Solutions, Compunnel Software Group, Iris Software
Financial Services f Infosys, Wipro, Deloitte, EPAM, Mastech, Cognizant, Softcom Systems, Cyberthink, Compunnel Software Group, Capgemini
Source for all : RSec Research, Department of Labour (US); Note: Grey highlight denotes common Top-20 client accounts for Top-4 IT names
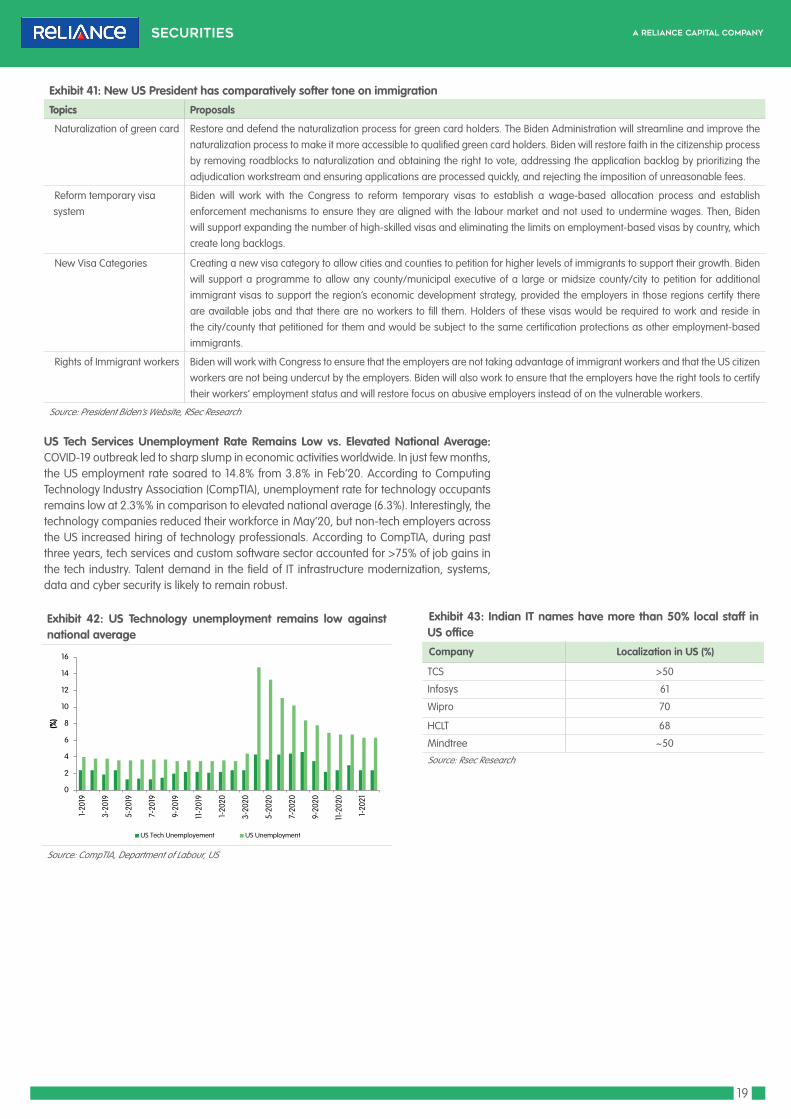
V. Dovish Tone of New US Administration on Immigration - The Worst is OverWe highlight that the new US president has comparatively softer tone on immigration. President Biden has put most of hard Trump era rules on review. New administration has tabled ‘US Citizenship Act 2021’ in the both House and Senate, which proposes to (1) increase country quota of green card from 7% to 20%; and (2) issue H-4 work visas to spouses and children. Notably, any substantial easing of laws is not possible given divided house and senate.
Our View: The Indian IT companies are likely to continue the localization efforts (most of them have already in the range of 50-70%) to reduce medium-term visa dependency. On the other hand, the US technology unemployment remains substantially below its national average, which underscores the United States’ dependency on high skilled technology talent from abroad. While localization remains key part of Top-4 Indian IT companies, incremental spending is likely to be lower than past 2-3 years. Though the new US administration mulls easing STEM visa restrictions, we expect prevailing wage rate to go up.
19
Exhibit 41: New US President has comparatively softer tone on immigration
Topics Proposals
Naturalization of green card Restore and defend the naturalization process for green card holders. The Biden Administration will streamline and improve the naturalization process to make it more accessible to qualified green card holders. Biden will restore faith in the citizenship process by removing roadblocks to naturalization and obtaining the right to vote, addressing the application backlog by prioritizing the adjudication workstream and ensuring applications are processed quickly, and rejecting the imposition of unreasonable fees.
Reform temporary visa system
Biden will work with the Congress to reform temporary visas to establish a wage-based allocation process and establish enforcement mechanisms to ensure they are aligned with the labour market and not used to undermine wages. Then, Biden will support expanding the number of high-skilled visas and eliminating the limits on employment-based visas by country, which create long backlogs.
New Visa Categories Creating a new visa category to allow cities and counties to petition for higher levels of immigrants to support their growth. Biden will support a programme to allow any county/municipal executive of a large or midsize county/city to petition for additional immigrant visas to support the region’s economic development strategy, provided the employers in those regions certify there are available jobs and that there are no workers to fill them. Holders of these visas would be required to work and reside in the city/county that petitioned for them and would be subject to the same certification protections as other employment-based immigrants.
Rights of Immigrant workers Biden will work with Congress to ensure that the employers are not taking advantage of immigrant workers and that the US citizen workers are not being undercut by the employers. Biden will also work to ensure that the employers have the right tools to certify their workers’ employment status and will restore focus on abusive employers instead of on the vulnerable workers.
Source: President Biden’s Website, RSec Research
US Tech Services Unemployment Rate Remains Low vs. Elevated National Average: COVID-19 outbreak led to sharp slump in economic activities worldwide. In just few months, the US employment rate soared to 14.8% from 3.8% in Feb’20. According to Computing Technology Industry Association (CompTIA), unemployment rate for technology occupants remains low at 2.3%% in comparison to elevated national average (6.3%). Interestingly, the technology companies reduced their workforce in May’20, but non-tech employers across the US increased hiring of technology professionals. According to CompTIA, during past three years, tech services and custom software sector accounted for >75% of job gains in the tech industry. Talent demand in the field of IT infrastructure modernization, systems, data and cyber security is likely to remain robust.
Exhibit 42: US Technology unemployment remains low against national average
Source: CompTIA, Department of Labour, US
Exhibit 43: Indian IT names have more than 50% local staff in US office
Company Localization in US (%)
TCS >50
Infosys 61
Wipro 70
HCLT 68
Mindtree ~50
Source: Rsec Research
0
2
4
6
8
10
12
14
16
1-20
19
3-20
19
5-20
19
7-20
19
9-20
19
11-2
019
1-20
20
3-20
20
5-20
20
7-20
20
9-20
20
11-2
020
1-20
21
(%)
US Tech Unemployement US Unemployment

20
Expect Strong Profitability to Continue over FY21E-FY24EA. EBIT Margin Likely to Remain Elevated: During last three quarters, the Top-4 IT names have consistently exceeded street consensus driven by work from home operating model, lower travel and facility cost, controlled hiring with accelerated utilization. We expect the Top-4 IT names to report 50-310bps margin expansion in FY21E. Going ahead, while we forecast margin deceleration from the record 3QFY21 levels, profitability levels are likely to remain elevated vs. FY17-FY20 levels driven by: (1) improved operating leverage with accelerated double-digit topline; (2) rising share of high-margin digital services, which will constitute >50% of revenues; (3) hybrid working model, which is likely to stay with ambitious medium-term work from home plans by large IT names; and (4) automation and efficiency gains. There are clear margin headwinds i.e. (1) step-up in hiring and lower utilization from current peak levels; (2) resumption of partial travel and facility cost from 2HCY21; and (3) rise in attrition levels to pre-pandemic levels. Additionally, we expect the Top-4 IT names to consistently invest in talent, capabilities and sales and marketing teams to improve market positioning, as the demand environment continues to remain buoyant.
B. Flexible Hybrid Work Model Likely to be Future of Work: Multiple large US technology firms have committed permanent work from home for select roles and planning to move on to hybrid working model. Non-technologies companies from India and across globe are also planning to move some roles to remote working. Infosys and TCS have also set medium-term targets for flexible hybrid model. TCS has announced 25x25 work model, under which the company expects only 25% of employees need to work from office. Infosys too plans permanent work from home for 33-50% of workforce.
Additionally, according to PwC’s US Remote Work Survey – Jan 21, remote work has been an overwhelming success for both employees and employers. The shift in positive attitudes toward remote work is evident: 83% of employers now say the shift to remote work has been successful for their company, compared to 73% in June 2020 survey. This suggests increasing adoption of hybrid work model amongst the global enterprises.
Our View: We expect flexible hybrid work model to lead to lower facility and travel cost. Additionally, hybrid working model is likely to be preferred working model for the employees as well as the employers. Additionally, we expect hybrid working options to make Indian IT companies more attractive for innovation culture and talent retention.
Exhibit 44: Expect strong EBIT margin levels to continue (%)
Companies FY20 FY21E FY22E FY23E FY24E
TCS 24.6 25.1 25.8 26.1 26.1
Infosys 21.3 24.4 24.4 24.3 24.6
HCL Tech 19.6 21.2 20.4 20.2 20.2
Wipro 17.1 19.6 17.8 18.5 19.0
Source: RSec Research
Exhibit 45: Recurring PAT margin (%)
Companies FY20 FY21E FY22E FY23E FY24E
TCS 20.6 19.8 20.9 21.5 21.8
Infosys 18.3 19.4 19.9 20.0 20.2
HCL Tech 15.7 17.4 16.5 16.5 16.7
Wipro 15.9 17.1 15.4 15.9 16.4
Source: RSec Research
21
Exhibit 46: Employers Survey on Work from Home and Hybrid model Exhibit 47: Employees Survey on Work from Home and Hybrid model
Source: PwC’s US Remote Work Survey – Jan 21 Source: PwC’s US Remote Work Survey – Jan 21
Exhibit 48: Indian IT Names Plan for Medium Term Hybrid Delivery Model
Company Work from Home Plan
Infosys f Company plans permanent work from home for 33-50% of workforceTCS f Announced the 25x25 work model, through which only 25% of its employees will need to work from office by
2025Wipro f ~98% of employees are working from home. According to website, the company believes that with newer
advents in technology, it will only see the WFH population getting more empowered and robust.HCLT f Majority of employees are working from home with improved efficiency.Source: Rsec Research
C. High-margin Digital Biz & Automation Benefit to Aid on Cost Front: Digital business enjoys attractive pricing versus legacy business. Infosys management has highlighted that the IT services in digital space command pricing premium against legacy services. HCLT has also highlighted that gross profit from Mode 2 business are higher. We expect the IT services names to enjoy margin tailwind, as digital revenue share becomes dominant part of their total revenue. Additionally, they have also stepped up efforts on automation efforts with improved process and introduction of bots. During last three years, Infosys has repurposed >20,000 employees driven by automation efforts, which led to ~100-150bps annualized cost saving.
D. Depreciating INR – A Consistent Medium-term Tailwind: In last decade, INR depreciated against the USD by almost 50%. The INR depreciation was consistent in each year except for 2017. The Indian IT services companies bill their revenues predominantly in USD and majority cost centers are in INR. Amongst the Top-4 Indian IT names, Infosys and TCS have comparatively higher hedging in upcoming couple of quarters and they have higher sensitivity towards USD-INR movement. In general, 1% changes in USD-INR leads to 20-30bps impact on EBIT margin. On EPS front, 1% change in USD-INR leads to 1-1.5% change in earnings. We believe the IT companies are likely to enjoy consistent medium-term tailwind from INR depreciation.
Exhibit 49: INR Witnessed Consistent Depreciation against USD
Source: RSec Research
Exhibit 50: EBIT margin sensitivity for 1% USD INR Change (bps)
TCS 25-30
Infosys 25-30
Wipro 20-30
HCLT 20-30
Source: RSec Research
18.2
3.6
12.8
2.2
4.72.7
-6.0
8.9
2.5 2.5
-10
-5
0
5
10
15
20
2011 2012 2013 2014 2015 2016 2017 2018 2019 2020
(%)
Depreciation in INR
83%
11%
6%
Employers Opinions
Successful Mixed Results Unsuccessful
71%
23%
6%
Employees Opinions
Successful Mixed Results Unsuccessful

22
Accelerated Inorganic Acquisitions by Infosys & WiproHistorically, Accenture and Cognizant have put higher stress on inorganic capability building. Accenture has spent US$1.6bn on M&As in FY20. Accenture has closed >30 acquisitions in the areas of Cloud, data/AI, experience and cyber in CY20. As the technology adoption by global enterprise is on rise, we believe there is inherent limitation in developing capability with internal resources. Recently, Infosys and Wipro have stepped up capability-based acquisitions with focus on Cloud, Experience and partnership SaaS providers. Recently, Wipro acquired Capco, a financial services, which focused on consulting and IT services for $1.4bn. Infosys also spent ~$800mn on acquisitions and joint ventures during CY20. We expect the Indian IT firms need to accelerate inorganic capability building in line with global peers.
Exhibit 51: Indian IT names lag behind US peers on inorganic capability building
Source: RSec Research

23
Nifty IT Trades at 1-25% Discount to Nifty/NASDAQ; Growth Deserves Further ReratingCurrently, Nifty 1-year forward PE multiple stands at 27x, which is 1% discount to the broader market. Additionally, Nifty IT is trading at 25% discount to NASDAQ, which witnessed substantial multiple rerating (~45% premium) compared to S&P-500 owing to disruption by large technology firms. Further, Nifty IT traded at 10-30% premium over broader market during FY10-FY14 when IT names were reporting double digit growth. Looking ahead, we expect Nifty IT to trade at premium to broader index driven by: (1) double-digit revenue growth expectation over FY21E-FY24E and medium-term growth resiliency due to increasing technology adoption; (2) increasing collaboration with large hypersclaers and SaaS companies; and (3) peer set companies (with ~15% revenue growth) are trading at higher multiple.
Exhibit 52: Currently, Nifty IT 12M forward PE trades at 1% discount to Nifty vs. historical peak premium of 40-60%
Source: RSec Research, Bloomberg
Exhibit 53: However, NASDAQ (US Technology Index) 12M forward PE trades at 45% premium to S&P500
Source: RSec Research, Bloomberg
A. IT Industry Embraces Features of Consumer Industry, which Deserves Multiple Re-Rating: We believe the IT industry is embracing more consumer industry like features i.e. growth resiliency, consistency in business cycle, stable EBIT margin and strong cash flow conversation. Currently, Nifty Consumer index trades at 100% premium to Nifty IT and Nifty. We expect Nifty IT to deserve premium multiple on the back of strong EPS expectation over FY21E-FY24E.
-30
-20
-10
0
10
20
30
40
50
60
70
01-0
7
07-0
7
01-0
8
07-0
8
01-0
9
07-0
9
01-10
07-1
0
01-11
07-1
1
01-12
07-1
2
01-13
07-1
3
01-14
07-1
4
01-15
07-1
5
01-16
07-1
6
01-17
07-1
7
01-18
07-1
8
01-19
07-1
9
01-2
0
07-2
0
01-2
1
(%)
Nifty IT vs Nifty premium/(discount) Last 10 Yr Average Last 5 Yr Average
0
10
20
30
40
50
60
70
80
01-0
7
08-0
7
03-0
8
10-0
8
05-0
9
12-0
9
07-10
02-11
09-11
04-12 11-12
06-13
01-14
08-14
03-15
10-15
05-16
12-16
07-17
02-18
09-18
04-19 11-19
06-2
0
01-2
1
(%)
NASDAQ vs S&P premium/(discount) Last 10 Yr Average Last 5 Yr Average

24
0
20
40
60
80
100
120
Sep-
14
Dec
-14
Mar
-15
Jun-
15
Sep-
15
Dec
-15
Mar
-16
Jun-
16
Sep-
16
Dec
-16
Mar
-17
Jun-
17
Sep-
17
Dec
-17
Mar
-18
Jun-
18
Sep-
18
Dec
-18
Mar
-19
Jun-
19
Sep-
19
Dec
-19
Mar
-20
Jun-
20
Sep-
20
Dec
-20
Nifty Consumer Index- 1 YR FWD Nifty 50 1 YR FWD
B. Low Discount Rate & Attractive Dividend Yield to Support Valuation: Additionally, one more variable, which we believe supports premium valuation is low US interest yield rate. The US Fed remains committed to keep the rates at low levels. Additionally, the Indian IT names have consistent cash return policies and dividend yield that generally remains at 3-4%, which make IT sector much more attractive.
Exhibit 56 : US bond yields remains well below historical average Exhibit 57: Top-4 India IT names - dividend yield
Source: RSec Research, Bloomberg Source: RSec Research
0.0
0.5
1.0
1.5
2.0
2.5
3.0
3.5
4.0
4.5
2010 2011 2012 2013 2014 2015 2016 2017 2018 2019 2020 2021
10 year US bond Yield 5 year average 10 year average
Exhibit 54: Nifty Consumer Index 12 Month FWD PE enjoys considerable premium over broad based index due to growth resiliency and consistency across business cycle
Exhibit 55: Top-4 IT names deserve multiple re-rating as IT industry embracing more consumer industry like features
Source: RSec Research, Bloomberg Source: RSec Research, Bloomberg
C. Indian IT Names Lead in Brand Value Perception: According Brand Finance, brand value of the Indian companies has increased considerably in 2021. Leading the pack in Top-10 was Infosys followed by HCL Technologies. Accenture retained the title of world’s most valuable and trusted IT brand. TCS gained 11% in brand value, while IBM lost 24%. With 19% gain in brand value, Infosys entered the Big 4 of IT services club globally and the fastest growing brand in the Top-10.
According to Brand Finance, the COVID-19 pandemic has transformed the IT services landscape, accelerating change across the sectors by 3-5 years. Those brands, which were able and ready to quickly shift from purely operating as service providers to consulting and transformation partners have been reaping the benefits in the face of adversity. The large contract wins for IT services brands in Europe in the last year mark the beginning of a trend, which we expect to continue, going forward. Our analysis suggests that the strongest brands will capture the lion’s share of this expected growth. Higher brand value suggests improving market perception for the top IT names, which should reflect in higher market share, improved customer/employee satisfaction and higher valuation multiple, going forward.
HULGilletteBritania
Nestle
Asian Paints
EPAM
Colgate
TCSInfosysWiproHCLT
8
18
28
38
48
58
68
78
0 5 10 15 20 25 30
FY24
PE (x
)
FY21-FY24E EPS CAGR (%)
2.93.1
3.4
1.9
0.0
0.5
1.0
1.5
2.0
2.5
3.0
3.5
4.0
TCS Infosys HCL Tech Wipro
(%)(%
)

25
Exhibit 58: Top-4 Indian IT names lead in brand value perception
Ranking 2021
Ranking 2020
Name Brand Value 2021($mn)
Brand Value 2020 ($mn)
% YoY
change
1 1 Accenture 26,028 25,294 2.9
2 2 IBM (IT Services) 16,057 21,188 (24.2)
3 3 TCS 14,924 13,499 10.6
4 5 Infosys 8,402 7,087 18.6
5 4 Cognizant 8,032 8,573 (6.3)
6 6 Capgemini 6,750 6,630 1.8
7 9 HCL 5,524 4,889 13.0
8 8 Ntt Data 5,081 5,058 0.5
9 10 Wipro 4,301 4,324 (0.5)
10 11 Samsung SDS 3,693 3,695 (0.1)
Source: Brand Finance, RSec Research
Revenues INR mn
RSec Consensus Delta (%)
FY22E FY23E FY24E FY22E FY23E FY24E FY22E FY23E FY24E
TCS 18,94,520 21,35,089 23,99,003 18,67,834 20,84,489 23,65,068 1.4 2.4 1.4
Infosys 11,80,257 13,42,789 15,03,340 11,56,773 12,99,278 14,36,436 2.0 3.3 4.7
HCLT 8,58,313 9,67,190 10,79,027 8,51,335 9,44,333 10,53,899 0.8 2.4 2.4
Wipro 7,22,507 8,10,897 8,89,804 7,01,154 7,68,187 8,29,642 3.0 5.6 7.3
EBIT margin (%)
RSec Consensus Delta (bp)
FY22E FY23E FY24E FY22E FY23E FY24E FY22E FY23E FY24E
TCS 25.8 26.1 26.1 26.2 26.4 26.4 (46) (25) (22)
Infosys 24.4 24.3 24.6 24.0 24.1 24.1 39 17 48
HCLT 20.4 20.2 20.2 21.3 21.2 21.2 (86) (104) (104)
Wipro 17.8 18.5 19.0 18.4 18.6 18.6 (69) (8) 42
Exhibit 59: RSec vs. Consensus
EPS (Rs)
RSec Consensus Delta (%)
FY22E FY23E FY24E FY22E FY23E FY24E FY22E FY23E FY24E
TCS 105.7 122.3 139.4 105.8 118.0 136.2 (0.1) 3.7 2.3
Infosys 55.3 63.2 71.4 52.8 59.6 64.5 4.8 5.9 10.8
HCLT 52.3 58.8 66.3 53.1 59.2 65.1 (1.6) (0.6) 1.9
Wipro 19.5 22.6 25.8 20.3 22.5 24.5 (3.9) 0.7 5.2
Source: RSec Research

26
Exhibit 60: IT Services Comparison Sheet
Revenue Growth (US$) (%) EBIT margin (%) PE (x) RoE (%)
Stocks Price (Rs/US$)
Mcap US$bn
FY22E FY23E FY24E FY22E FY23E FY24E FY22E FY23E FY24E FY22E FY23E FY24E
TCS 3,172 157.3 15.8 11.2 10.9 25.8 26.1 26.1 30.0 25.9 22.8 45.8 44.1 41.8
Infosys 1,387 77.7 17.4 12.3 10.5 24.4 24.3 24.6 25.1 22.0 19.4 31.5 31.7 31.5
HCLT 995 36.1 14.0 11.2 10.1 20.4 20.2 20.2 19.0 16.9 15.0 22.5 22.3 22.1
Wipro 420 32.4 17.7 11.0 8.5 17.8 18.5 19.0 21.5 18.6 16.3 14.2 14.6 15.7
Tech Mahindra# 1,016 13.1 11.3 9.7 8.4 13.7 15.0 15.0 18.8 15.7 12.8 18.4 19.6 20.3
Average of Top-5 Indian IT names
15.2 11.1 9.7 20.4 20.8 21.0 29.3 25.5 22.3 26.5 26.5 26.3
Accenture* 280 186.0 7.7 7.1 7.5 15.2 15.4 15.4 29.8 27.0 25.1 29.7 29.1 30.8
Cognizant* 78 42.1 6.7 5.6 6.8 14.5 15.3 15.3 21.4 19.6 17.8 14.8 17.3 16.7
EPAM* 388 21.8 24.8 22.6 27.7 17.4 17.7 19.4 52.4 42.0 33.5 19.4 20.2 20.2
Average of US based IT names
13.1 11.8 14.0 15.7 16.1 16.7 34.5 29.6 25.5 21.3 22.2 22.6
Global IT Average 14.4 11.3 11.3 18.6 19.1 19.4 31.3 27.0 23.5 24.5 24.9 24.9Source: RSec Research; Note: # In case of Tech Mahindra, we have used consensus estimates for FY24E; *Bloomberg consensus estimates over FY22-FY24E

27
Exhibit 62: Comparative Analysis - HCLT & Wipro
HCLT Wipro
Financials (Rs Mn) FY20 FY21E FY22E FY23E FY24E FY20 FY21E FY22E FY23E FY24E
Revenues 7,06,780 7,54,112 8,58,313 9,67,190 10,79,027 6,10,232 6,12,005 7,22,507 8,10,897 8,89,804EBIT 1,38,530 1,59,546 1,75,096 1,95,372 2,17,964 1,05,031 1,14,753 1,28,303 1,49,929 1,69,018
Adj PAT 1,11,080 1,32,066 1,41,520 1,59,182 1,79,645 96,985 98,776 1,11,273 1,28,879 1,46,794
Growth (%)
Revenues 15.1 2.4 14.0 11.2 10.1 4.2 0.3 18.1 12.2 9.7EBIT 17.2 15.2 9.7 11.6 11.6 2.5 9.3 11.8 16.9 12.7Adj PAT 11.5 18.9 7.2 12.5 12.9 5.8 1.8 12.7 15.8 13.9
Margin (%)
EBIT 19.6 21.2 20.4 20.2 20.2 17.2 18.8 17.8 18.5 19.0Adj PAT 15.7 17.5 16.5 16.5 16.6 15.9 16.1 15.4 15.9 16.5Per Share (RS)
EPS 41.0 48.7 52.4 58.9 66.4 16.5 18.3 19.5 22.6 25.7DPS 5.0 20.0 24.0 28.0 32.0 1.0 2.0 4.0 6.0 8.0Book value 180.8 218.1 246.0 280.3 318.4 95.4 113.9 129.4 146.0 163.7Valuation (x)
P/E 24.3 20.5 19.0 16.9 15.0 25.4 22.9 21.5 18.6 16.3EV/EBIT 16.7 14.1 13.0 12.0 11.0 20.7 18.7 16.6 14.8 13.8P/BV 5.5 4.6 4.0 3.6 3.1 4.4 3.7 3.2 2.9 2.6Div Yield (%) 0.5 2.0 2.4 2.8 3.2 0.2 0.5 1.0 1.4 1.9Return Ratio (%)
RoCE (%) 22.0 22.4 20.9 20.9 20.9 17.3 16.0 15.0 15.4 15.6RoE (%) 24.1 24.3 22.5 22.3 22.1 16.1 15.1 14.2 14.6 15.7Source: Company, RSec Research
Exhibit 61: Comparative Analysis - TCS & Infosys
TCS Infosys
Financials (Rs Mn) FY20 FY21E FY22E FY23E FY24E FY20 FY21E FY22E FY23E FY24E
Revenues 15,69,490 16,41,676 18,94,520 21,35,089 23,99,003 9,07,910 10,10,910 11,80,257 13,42,789 15,03,340EBIT 3,85,800 4,11,870 4,88,192 5,57,668 6,27,250 1,93,740 2,46,376 2,88,008 3,26,138 3,69,828
Adj PAT 3,23,400 3,24,888 3,96,566 4,59,051 5,23,166 1,65,950 1,95,684 2,34,771 2,68,005 3,02,999
Growth (%)
Revenues 5.4 0.4 15.8 11.2 10.9 8.3 6.3 17.4 12.3 10.5EBIT 3.0 6.8 18.5 14.2 12.5 2.6 27.2 16.9 13.2 13.4Adj PAT 2.8 0.5 22.1 15.8 14.0 7.7 17.9 20.0 14.2 13.1
Margin (%)
EBIT 24.6 25.1 25.8 26.1 26.1 21.3 24.4 24.4 24.3 24.6Adj PAT 20.6 19.8 20.9 21.5 21.8 18.3 19.4 19.9 20.0 20.2Per Share (RS)
EPS 61.4 66.7 67.5 83.0 86.2 39.0 46.1 55.3 63.2 71.4DPS 73.0 58.0 65.0 70.0 80.0 17.5 30.0 33.0 38.0 42.0Book value 219.7 204.7 244.5 295.8 354.0 150.4 160.1 181.9 206.4 235.1Valuation (x)
P/E 36.8 36.6 30.0 25.9 22.8 35.6 30.1 25.1 22.0 19.4EV/EBIT 29.3 27.0 23.3 20.8 18.7 27.9 22.1 19.4 17.5 15.8P/BV 13.7 15.1 12.6 10.5 8.7 9.0 8.4 7.4 6.5 5.8Div Yield (%) 2.3 1.8 2.0 2.2 2.5 1.3 2.2 2.4 2.7 3.0Return Ratio (%)
RoCE (%) 38.3 40.8 46.8 44.9 42.5 23.0 23.0 23.0 23.0 23.0RoE (%) 36.6 39.2 45.8 44.1 41.8 25.4 28.9 31.5 31.7 31.5Source: Company, RSec Research
28
Channel Check Takeaways f COVID-19 pandemic has accelerated the demand for transformation services. The
enterprises, which have invested in IT ecosystem ahead of others, have performed better than others during the pandemic period. Amid multiple technology disruptions, adoption of new business model remains the primary objective of global enterprises.
f The enterprises are moving from current 20% share of Cloud to 80%. According to multiple industry experts, Cloud opportunity varies between US$500mn-1bn. IT services companies have set up their dedicated team with individual Cloud platforms.
f Our analysis of commentary of the large US banks suggests accelerated spend on digital technologies. US banks spend 20-30% higher on digital technologies vs. their European peers. Key transformation areas are Cloud, AI, blockchain, Cyber technology and customer experience.
f The demand environment remains buoyant with the Indian IT services firm witnessing one of the best deal pipelines. During last month, Accenture also echoed this tone and reported 2QFY21 book-to-bill ratio of 1.4x in outsourcing business.
f Accenture also highlighted that revenue from Cloud grew in strong double-digit, while the interactive segment grew in high single digit. Notably, revenue from security segment witnessed a strong double-digit growth during the quarter.
f In case of Accenture, about 50% revenue came from the industries, which were not affected by COVID-19, which grew in low double-digit. Despite sequential moderation, continued pressure was witnessed in COVID-affected verticals i.e. Travel, Energy, High Tech, Retail and Industrials, which declined in mid-single digit and contributed 20% to total revenue.
f IT names have been consistently investing in employee trainings and reskilling efforts. Top-4 IT names have reskilled >50% of employees on new age technologies. Accenture has also reported 28% increase in training hours and 25% increase in hours per person.
f Multiple large global technology firms (Facebook, Salesforce and others) have announced hybrid working model for the future. TCS and Infosys also targets to operate majority of workforce in hybrid model. According to PWC global employees survey, hybrid operating model remains a preferred working model. Additionally, survey also highlighted increased recognition of hybrid model by the employers also.
f Top-10 Indian IT names have highlighted accelerated hiring during CY21.
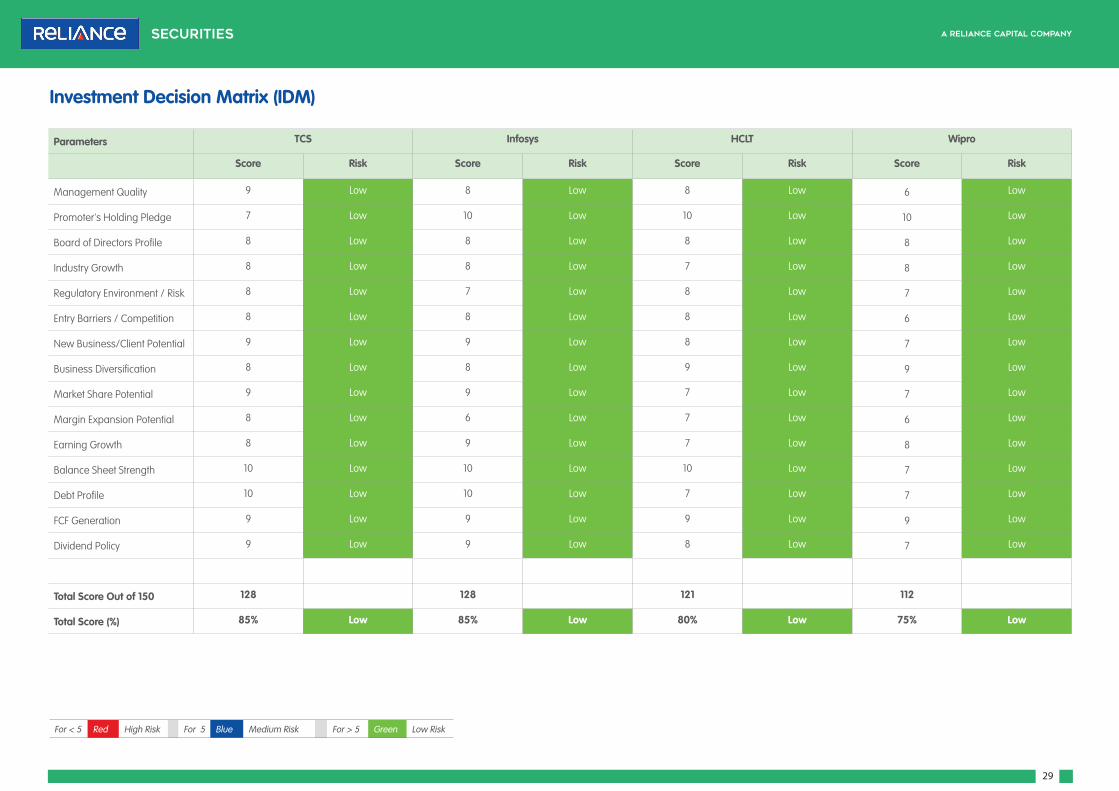
29
Parameters TCS Infosys HCLT Wipro
Score Risk Score Risk Score Risk Score Risk
Management Quality 9 Low 8 Low 8 Low 6 Low
Promoter's Holding Pledge 7 Low 10 Low 10 Low 10 Low
Board of Directors Profile 8 Low 8 Low 8 Low 8 Low
Industry Growth 8 Low 8 Low 7 Low 8 Low
Regulatory Environment / Risk 8 Low 7 Low 8 Low 7 Low
Entry Barriers / Competition 8 Low 8 Low 8 Low 6 Low
New Business/Client Potential 9 Low 9 Low 8 Low 7 Low
Business Diversification 8 Low 8 Low 9 Low 9 Low
Market Share Potential 9 Low 9 Low 7 Low 7 Low
Margin Expansion Potential 8 Low 6 Low 7 Low 6 Low
Earning Growth 8 Low 9 Low 7 Low 8 Low
Balance Sheet Strength 10 Low 10 Low 10 Low 7 Low
Debt Profile 10 Low 10 Low 7 Low 7 Low
FCF Generation 9 Low 9 Low 9 Low 9 Low
Dividend Policy 9 Low 9 Low 8 Low 7 Low
Total Score Out of 150 128 128 121 112
Total Score (%) 85% Low 85% Low 80% Low 75% Low
Investment Decision Matrix (IDM)
For < 5 Red High Risk For 5 Blue Medium Risk For > 5 Green Low Risk
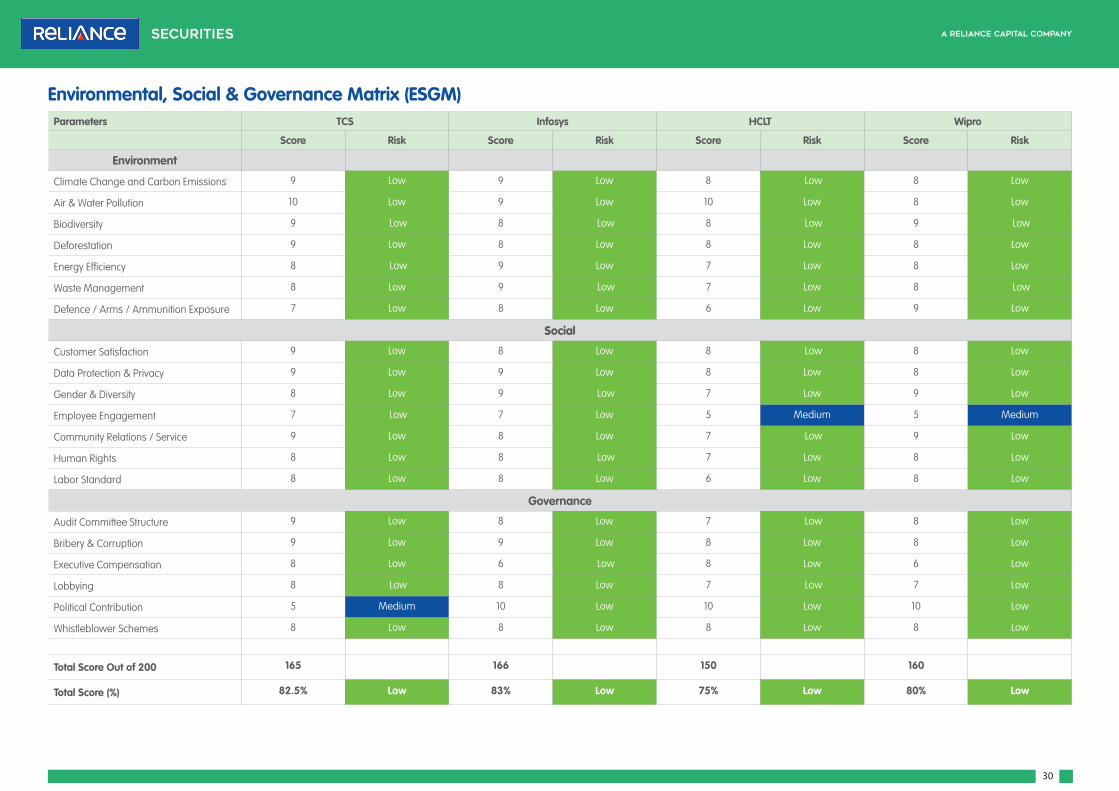
30
Environmental, Social & Governance Matrix (ESGM)Parameters TCS Infosys HCLT Wipro
Score Risk Score Risk Score Risk Score Risk
Environment
Climate Change and Carbon Emissions 9 Low 9 Low 8 Low 8 Low
Air & Water Pollution 10 Low 9 Low 10 Low 8 Low
Biodiversity 9 Low 8 Low 8 Low 9 Low
Deforestation 9 Low 8 Low 8 Low 8 Low
Energy Efficiency 8 Low 9 Low 7 Low 8 Low
Waste Management 8 Low 9 Low 7 Low 8 Low
Defence / Arms / Ammunition Exposure 7 Low 8 Low 6 Low 9 Low
Social
Customer Satisfaction 9 Low 8 Low 8 Low 8 Low
Data Protection & Privacy 9 Low 9 Low 8 Low 8 Low
Gender & Diversity 8 Low 9 Low 7 Low 9 Low
Employee Engagement 7 Low 7 Low 5 Medium 5 Medium
Community Relations / Service 9 Low 8 Low 7 Low 9 Low
Human Rights 8 Low 8 Low 7 Low 8 Low
Labor Standard 8 Low 8 Low 6 Low 8 Low
Governance
Audit Committee Structure 9 Low 8 Low 7 Low 8 Low
Bribery & Corruption 9 Low 9 Low 8 Low 8 Low
Executive Compensation 8 Low 6 Low 8 Low 6 Low
Lobbying 8 Low 8 Low 7 Low 7 Low
Political Contribution 5 Medium 10 Low 10 Low 10 Low
Whistleblower Schemes 8 Low 8 Low 8 Low 8 Low
Total Score Out of 200 165 Low 166 Low 150 Low 160 Low
Total Score (%) 82.5% Low 83% Low 75% Low 80% Low

31
Global Software Company ($mn)
Description 2015 2016 2017 2018 2019
Top Software Companies By Revenues
Microsoft Corp 85320 96571 110360 125843 143015
Oracle Corp 37047 37728 39383 39506 39068
SAP SE 23080 24419 26504 29182 30846
Salesforce.com Inc 6667 8437 10540 13282 17098
VMware Inc 6571 7093 7862 9613 10811
Adobe Systems Inc 4796 5854 7302 9030 11171
Cerner Corp 4425 4796 5142 5366 5693
Intuit Inc 4192 4694 5177 6025 6784
CA Inc (*) 4025 4036 4235
Symantec Corp 3600 4019 2559 2456 2490
Citrix Systems Inc 3276 2736 2825 2974 3011
Dassault Systemes SE 3152 3382 3647 4107 4498
Synopsys Inc 2242 2423 2725 3121 3361
Red Hat Inc (*) 2052 2412 2920 3362
Open Text Corp 1824 2291 2815 2869 3110
Sage Group PLC/The 2218 2235 2173 2484 2471
Constellation Software Inc/Can 1838 2125 2479 3060 3490
Autodesk Inc 2504 2031 2057 2570 3274
Nuance Communications Inc 1931 1949 1728 1842 1521
Cadence Design Systems Inc 1702 1816 1943 2138 2336
Check Point Software Technolog 1630 1741 1855 1917 1995
Workday Inc 1157 1574 2143 2822 3627
ServiceNow Inc 1005 1391 1918 2609 3460
Palo Alto Networks Inc 928 1379 1762 2274 2900
Fortinet Inc 1009 1275 1495 1801 2156
Trend Micro Inc/Japan 1027 1216 1327 1453 1515
PTC Inc 1255 1141 1164 1242 1256
athenhealth Inc (*) 925 1083 1220
ANSYS Inc 943 988 1095 1294 1516
Splunk Inc 668 944 1309 1803 2359
Tableau Software Inc (*) 654 827 877 1155
Ultimate Software Group Inc/Th (*) 618 781 941 1141
FireEye Inc 623 714 780 831 889
Veeva Systems Inc 409 551 691 862 1104
Guidewire Software Inc 381 424 514 653 720
Box Inc 303 399 506 608 696
Proofpoint Inc 265 375 520 717 888
Imperva Inc (*) 234 264 322
MobileIron Inc 149 164 180 193 205
Source: RSec Research; Bloomberg; Note: (*) Company was acquired
Annexure - I

32
Annexure - II
Leading laaS Players ($mn)
IaaS Players 2015 2016 2017 2018 2019
Amazon Web Services 5,428 8,189 11,347 16,719 23,451
Microsoft 711 1,326 2,671 4,326 6,476
Others 2,509 3,206 3,840 4,470 5,004
Alibaba Group 229 555 1,070 1,900 3,260
IBM 733 1,008 1,332 1,719 2,169
Google 208 440 731 1,288 2,134
Tencent 44 100 239 502 925
China Telecom 97 116 176 376 660
Huawei 1 22 166 585
OVHcloud 30 79 181 285 365
Baidu 1 10 37 175 361
Rackspace 520 426 336 297 298
Fujitsu 127 164 206 243 288
Kingsoft 33 82 115 176 280
Oracle 46 70 129 185 244
Digital Ocean 58 110 132 184 241
Inspur 2 18 123 222
Dell Technologies 36 30 120 164 213
JD 2 7 75 204
Orange 101 120 135 158 190
Vodafone 114 116 144 162 186
Ucloud 36 62 102 147 145
CenturyLink 82 91 95 114 135
Dimension Data 58 68 82 98 121
ATOS 41 54 72 93 117
T-Systems 60 69 73 90 109
Telefonica 37 42 48 58 77
China Mobile 20 73
Flexential 15 18 34 53 68
UKCloud 10 27 38 50 66
Spark 19 31 45 57 65
Datacom 19 30 46 56 64
Egenera 43 48 53 58 64
KT 34 51 63 59 54
Telecom Italia 25 29 32 40 47
Navisite/TimeWarner 17 25 26 29 38
INET 6 11 16 23 33
Hewlett Packard Enterprise 10 11 15 21 29
Netmagic 8 10 13 17 21
America Movil 6 8 10 14 20
Chunghwa Telecom 8 11 13 16 19
Singtel 25 29 33 23 19
CapitalOnline Data Service 9 12 13 14 18
True IDC 6 8 9 13 18
Alestra 4 6 8 12 17
Source: RSec Research; Bloomberg; Note: (*) Company was acquired. IaaS=Infrastructure as a Service

33
COMPANY SECTION

34
Share price (%) 1 mth 3 mth 12 mth
Absolute performance 8.5 9.0 73.7
Relative to Nifty 7.9 2.9 1.0
Shareholding Pattern (%) Sept'20 Dec'20
Promoter 72.0 72.0
Public 28.0 28.0
1 Year Stock Price Performance
Note: * CMP as on 30 March 2021
Medium-term Growth Acceleration Deserves Premium
TCSIT | India
Institutional Equity Research
Initiating Coverage | 31 March 2021
BUY2 Year Target Price: Rs.4,180
CMP* (Rs) 3,172
Upside/(Downside) (%) 32
Bloomberg Ticker TCS IN
Market Cap. (Rs bn) 11,905
Free Float (%) 28.0
Shares O/S (mn) 3,753
1. Tata Consultancy Services (TCS) offers full-stack services and enjoys deep-rooted relationship with the large global banks, retailers and technology names. It remains in the leader’s quadrant in terms of capability matrix. Looking ahead, we expect TCS to remain the key beneficiary of accelerated medium-term tech budgets.
2. With scale and best-in-class product base, TCS is expected to gain market share, which will be supported by consolidation of IT vendors and captive monetization efforts.
3. We forecast the company’s revenue to clock 12.6% CAGR over FY21-24E propelled by robust Last Twelve Month (LTM) book-to-bill ratio of 1.4x. We expect the deal environment to remain buoyant in the medium-term.
4. We expect the company’s EBIT margin to expand to 26% in FY22-FY24E (vs. 24.6% in FY20) fuelled by: (1) hybrid working model; (2) increased automation; and (3) higher operating leverage.
5. TCS enjoys industry leading return ratios of >40% (1,000bps higher than Infosys) and consistent cash return policy.
ESG Analysis: While analyzing 20 key criteria (10 points each) under ESG Matrix, we have assigned an overall score of 82.5% to TCS. Under “Environmental Head”, we have assigned 86% score, as the company mulls improving carbon emission and energy efficiency. Under “Social Head”, we have assigned 83% score, as the company scores high on customer satisfaction scores ,high on gender diversity and employee engagement. Under “Governance Head”, we have assigned 79% score due to low score in political contribution, which offsets high score in audit committee and executive compensation (please refer to page no.38 for detailed ESG analysis).
Outlook & ValuationWhilst TCS underperformed Nifty IT by 37% on LTM basis, we expect the company to be one of the key beneficiaries of medium-term uptrend in technology spending. Additionally, the company is expected to gain market share on the back of vendor consolidation and captive monetization efforts. We expect recent surge in large deal wins (LTM book-to-bill ratio of 1.4x vs. 1.1x earlier) is likely to be a medium-term phenomena. We expect the company’s revenue to clock 12.6% CAGR over FY21E-FY24E, its EBIT margin could rise to 26.1% (FY24E). At CMP, the stock trades at 1% discount to its comparable peer, Accenture vs. historical average premium of 9%. The stock deserves multiple rerating on the back of strong double-digit revenue growth, expanding EBIT margin and industry leading return ratios (44% in FY24E). We initiate coverage on TCS with BUY and a 2-Year Target Price of Rs4,180 (valuing the stock at 30x PE on FY24E EPS), which implies 32% upside from the current level.
Key Triggers: Agile business model with superior capability/practices Deep-rooted relationship with large global corporates as technology partners Key beneficiary of vendor consolidation and increased IT outsourcingIndustry-leading operating margin and return ratiosStrong cash flow conversation and growth visibility
Research Analyst:
Suyog Kulkarni, CFAContact : (022) 4303 4000 / 9890966735Email : [email protected]
Research Associate:
Chaitanya PanchmatiaContact : (022) 4303 4000 / 8080782900
Email : [email protected]
Key FinancialsY/E Mar (Rs mn) FY19 FY20 FY21E FY22E FY23E FY24E
Revenue 14,64,630 15,69,490 16,41,676 18,94,520 21,35,089 23,99,003
EBIT 3,74,500 3,85,800 4,11,870 4,88,192 5,57,668 6,27,250
PAT 3,14,720 3,23,400 3,24,888 3,96,566 4,59,051 5,23,166
EPS (Rs) 83.0 86.2 86.6 105.7 122.3 139.4
EBIT Margin (%) 25.6 24.6 25.1 25.8 26.1 26.1
PE (x) 38.2 36.8 36.6 30.0 25.9 22.8
P/BV (x) 13.4 13.7 15.1 12.6 10.5 8.7
Source: Company, RSec Research
1,200
1,700
2,200
2,700
3,200
3,700
Mar
-20
Apr
-20
May
-20
Jun-
20
Jul-2
0
Aug
-20
Sep-
20
Oct
-20
Nov
-20
Dec
-20
Jan-
21
Feb-
21
Mar
-21

35
Our Thesis
f Agile Business Model with Superior Capability/Practices to Aid in Market Share Gain: During the last decade (2010-2020), the company’s revenue clocked 12.9% CAGR ahead of the industry average of 9% driven by: (1) stable leadership and successful succession to next level leadership; (2) diversified industry focused offerings with multiple productized IT solutions; and (3) agile operating and business model backed by best-in-class methods and practices. TCS has successfully transitioned itself as full stack-service provider and digital transformation partner.
f Key Beneficiary of Vendor Consolidation & Higher IT Outsourcing: TCS enjoys longstanding and deep-rooted relationship with the large technology spenders. IT services industry is predominantly fragmented and Top-40 IT services names contribute only 45% to the total market. Enterprises have large internal tech teams and have also set up multiple offshore units. We expect TCS to be the key beneficiary of vendor consolidation and increased outsourcing with its scale and recent surge in employee rebadging deals.
f Industry Leading Operating Margin & Return Ratios: TCS enjoys industry leading EBIT margin of ~26% and solid return ratios of >40%. We expect the company to maintain its industry leading return ratios in the coming years as well.
f Outlook & Valuation: We believe stock deserves multiple rerating on the back of strong double-digit revenue CAGR of 12.6% over FY21E-FY24E, expanding EBIT margin and industry leading return ratios (FY24E). We initiate coverage on TCS with BUY and a 2-Year Target Price of Rs4,180 (valuing the stock at 30x PE on FY24E EPS), which implies 32% upside from the current level.
Key InvestmentTheme
Key Risks
f Aggressive technology spending cuts by the large US banks
f Increased competitive intensity driven by IT players, SaaS companies and Hyperscalers
f Stricter immigration laws may delay project ramp-up and completion
f Lower-than-expected success of continued cost efficiency projects
f Unfavourable currency movement
EPS & Target Price
Source: RSec Research, Bloomberg
67.583.0
86.2 86.6
105.7122.3
139.42,024
2,491 2,585 2,597
3,170
3,673
4,180
0
500
1,000
1,500
2,000
2,500
3,000
3,500
4,000
4,500
0
20
40
60
80
100
120
140
160
FY18 (-3) FY19 (-2) FY20 (-1) FY21 (Base Yr) FY22E (1Yr) FY23E (2Yr) FY24E (3Yr)
EPS (Rs) (LHS) Target Price Rs

36
Price Sensitivity AnalysisEPS (Rs) Growth (%) FWD PE (x) 28 29 30 31
FY17 66.7 47.5 1,868 1,935 2,001 2,068
FY18 67.5 1.1 47.0 1,889 1,956 2,024 2,091
FY19 83.0 23.1 38.2 2,325 2,408 2,491 2,574
FY20 86.2 3.8 36.8 2,413 2,499 2,585 2,671
FY21E 86.6 0.5 36.6 2,424 2,510 2,597 2,684
FY22E 105.7 22.1 30.0 2,959 3,064 3,170 3,276
FY23E 122.3 15.8 25.9 3,425 3,547 3,673 3,792
FY24E 139.4 14.0 22.8 3,903 3,970 4,180 4,321
Source: Company, RSec Research
Price Target ScenarioParticulars Bull Base BearRevenue CAGR (FY21E-FY24E) (%) 15.0 12.6 8.5
EPS CAGR (FY21E-FY24E) (%) 19.2 17.2 9.0
FY24E EPS (Rs) 146.6 139.4 112.1
Target P/E multiple (x) 33.0 30.0 25.0
2-yr Target Price (Rs) 4,838 4,180 2,803
Upside/Downside (%) 52.5 31.8 (11.6)Source: Company, RSec Research
Scenario Analysis
Base Case: In Base Case scenario, we expect the Indian IT services industry to witness high single to double-digit growth over FY21E-FY24E. We expect TCS to clock 17.2% EPS CAGR on the back of 12.6 % CAGR in USD revenue over the same period. Assuming target multiple of 30x on FY24E EPS, we arrive at a target price of Rs.4,180, which is 32% higher than the CMP.
Bull Case: In Bull Case scenario, we expect the Indian IT services industry to witness double-digit growth over FY21E-FY24E. We expect TCS to clock 19.2% EPS CAGR on the back of 15% CAGR in USD revenue over the same period. Assuming target multiple of 33x on FY24E EPS, we arrive at a target price of Rs.4,838, which is 53% higher than the CMP.
Bear Case: In Bear Case scenario, we expect the Indian IT services industry to witness mid to high single digit growth over FY21E-FY24E. We expect TCS to clock 9% EPS CAGR on the back of 8.5% CAGR in USD revenue over the same period. Assuming target multiple of 25x on FY24E EPS, we arrive at a target price of Rs2,803, which is 12% lower than the CMP.

37
Key Criteria Score Risk Comments
Management Quality 9 LowThe management is stable, diversified and experienced in the field of IT, technology and finance; the company in one of the best managed IT services companies in the world
Promoter's Holding Pledge 7 LowTata Sons (promoter group) owns 72% of TCS. Out of which 2.9% of total shares are either pledged or encumbered by promoter group. We don't expect major reduction in promoter shareholding in the medium term
Board of Directors Profile 8 LowIts board comprises of members from diverse background i.e. technology, engineering and finance; every sub-committee within the board has at least one independent director as member
Industry Growth 8 LowIndian IT industry is likely to witness high single digit-double digit growth in the medium-term; Indian IT-BPM industry continues to clock 9.7% CAGR since FY08 (pre-GFC level); notably, the share of Indian IT industry in global IT spends more than doubled from 8.4% in FY08 to 18.5% in FY20
Regulatory Environment / Risk 8 LowAs the IT companies are not regulated by the government/regulators, there is limited regulatory risk; however, key regulatory risks for the Indian IT companies are: worsening of global immigration policies, privacy and intellectual property rights and Indian SEZ acts etc.
Entry Barriers / Competition 8 Low IT services industry is fragmented with multiple players; large-cap companies enjoy scale benefits vs. their mid-cap peers
New Business/Client Potential 9 LowTCS is industry leader in terms of capability, diversification and global presence; we believe TCS enjoys strong new business potential driven by its scale, partnership ecosystem and capability edge
Business Diversification 8 LowThe company’s portfolio is well-diversified, as it receives 31% of revenue from BFSI vertical,14% from Retail & CPG, 9.6% from manufacturing, 6.6% from Communication & Media and 9.8% from Lifescience
Market Share Potential 9 Low We expect the company’s revenue to grow by 12.6% over FY21-FY24E, which is ahead of the industry’s growth rate
Margin Expansion Potential 8 Low EBIT margin is likely to improve to >26% driven by work from home operating model and cost-efficiency measures
Earnings Growth 8 Low EPS is expected to clock 15% CAGR over FY21-24E compared to 9% CAGR over FY17-FY20
Balance Sheet Strength 10 Low Strong balance sheet with almost no debt and net cash and investments of >US$5bn
Debt Profile 10 LowAs of FY20, the company had cash and bank balance in the excess of US$5bn; with negligible debt on balance sheet, it is likely to sustain net cash position
FCF Generation/NWC 9 Low TCS reported a consistent FCF conversation of >80% over the period
Dividend Policy 9 Low Dividend yield stands at ~2%; the company returns 80-100% of FCF to the shareholders by way of dividend and share buy-back
Total Score Out of 150 128
Average Score (%) 85% Low
Investment Decision Matrix (IDM)
Score For < 5 Red High Risk For 5 Blue Medium Risk For > 5 Green Low Risk
Total Score (%) For < 50 Red High Risk For 50 Blue Medium Risk For > 50 Green Low Risk
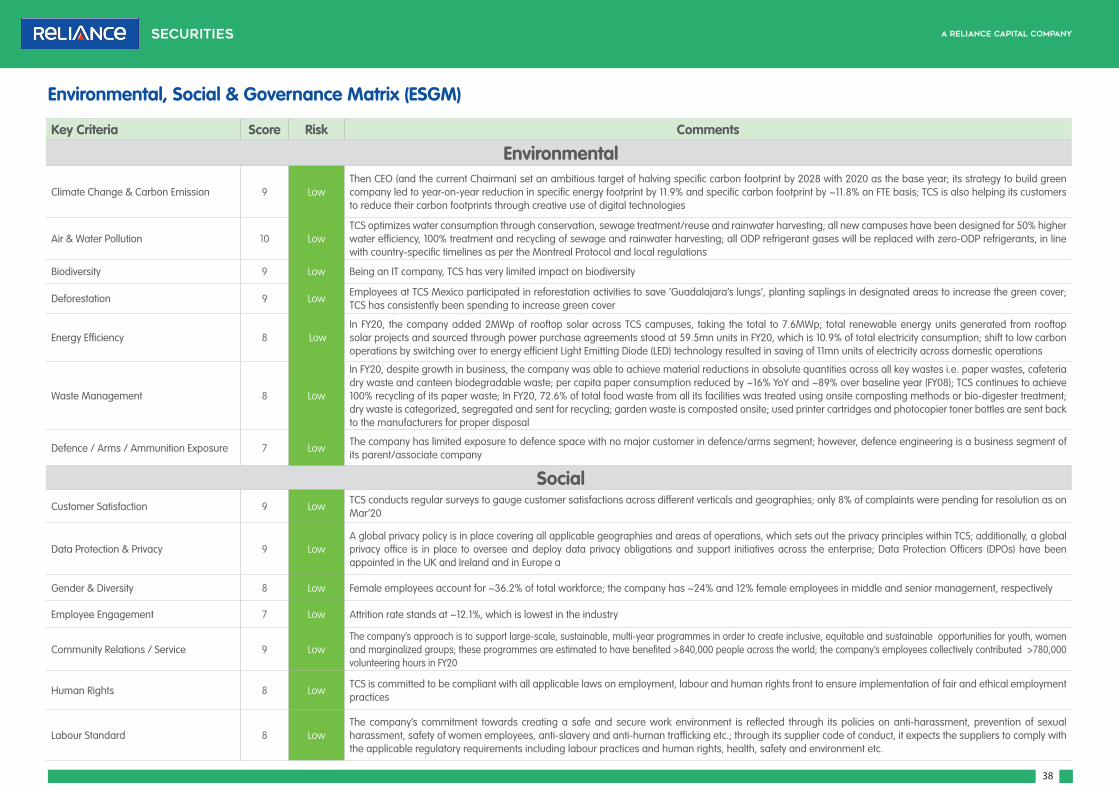
38
Key Criteria Score Risk Comments
Environmental
Climate Change & Carbon Emission 9 LowThen CEO (and the current Chairman) set an ambitious target of halving specific carbon footprint by 2028 with 2020 as the base year; its strategy to build green company led to year-on-year reduction in specific energy footprint by 11.9% and specific carbon footprint by ~11.8% on FTE basis; TCS is also helping its customers to reduce their carbon footprints through creative use of digital technologies
Air & Water Pollution 10 LowTCS optimizes water consumption through conservation, sewage treatment/reuse and rainwater harvesting; all new campuses have been designed for 50% higher water efficiency, 100% treatment and recycling of sewage and rainwater harvesting; all ODP refrigerant gases will be replaced with zero-ODP refrigerants, in line with country-specific timelines as per the Montreal Protocol and local regulations
Biodiversity 9 Low Being an IT company, TCS has very limited impact on biodiversity
Deforestation 9 LowEmployees at TCS Mexico participated in reforestation activities to save ‘Guadalajara’s lungs’, planting saplings in designated areas to increase the green cover; TCS has consistently been spending to increase green cover
Energy Efficiency 8 LowIn FY20, the company added 2MWp of rooftop solar across TCS campuses, taking the total to 7.6MWp; total renewable energy units generated from rooftop solar projects and sourced through power purchase agreements stood at 59.5mn units in FY20, which is 10.9% of total electricity consumption; shift to low carbon operations by switching over to energy efficient Light Emitting Diode (LED) technology resulted in saving of 11mn units of electricity across domestic operations
Waste Management 8 Low
In FY20, despite growth in business, the company was able to achieve material reductions in absolute quantities across all key wastes i.e. paper wastes, cafeteria dry waste and canteen biodegradable waste; per capita paper consumption reduced by ~16% YoY and ~89% over baseline year (FY08); TCS continues to achieve 100% recycling of its paper waste; In FY20, 72.6% of total food waste from all its facilities was treated using onsite composting methods or bio-digester treatment; dry waste is categorized, segregated and sent for recycling; garden waste is composted onsite; used printer cartridges and photocopier toner bottles are sent back to the manufacturers for proper disposal
Defence / Arms / Ammunition Exposure 7 LowThe company has limited exposure to defence space with no major customer in defence/arms segment; however, defence engineering is a business segment of its parent/associate company
SocialCustomer Satisfaction 9 Low
TCS conducts regular surveys to gauge customer satisfactions across different verticals and geographies; only 8% of complaints were pending for resolution as on Mar’20
Data Protection & Privacy 9 LowA global privacy policy is in place covering all applicable geographies and areas of operations, which sets out the privacy principles within TCS; additionally, a global privacy office is in place to oversee and deploy data privacy obligations and support initiatives across the enterprise; Data Protection Officers (DPOs) have been appointed in the UK and Ireland and in Europe a
Gender & Diversity 8 Low Female employees account for ~36.2% of total workforce; the company has ~24% and 12% female employees in middle and senior management, respectively
Employee Engagement 7 Low Attrition rate stands at ~12.1%, which is lowest in the industry
Community Relations / Service 9 LowThe company’s approach is to support large-scale, sustainable, multi-year programmes in order to create inclusive, equitable and sustainable opportunities for youth, women and marginalized groups; these programmes are estimated to have benefited >840,000 people across the world; the company’s employees collectively contributed >780,000 volunteering hours in FY20
Human Rights 8 LowTCS is committed to be compliant with all applicable laws on employment, labour and human rights front to ensure implementation of fair and ethical employment practices
Labour Standard 8 LowThe company’s commitment towards creating a safe and secure work environment is reflected through its policies on anti-harassment, prevention of sexual harassment, safety of women employees, anti-slavery and anti-human trafficking etc.; through its supplier code of conduct, it expects the suppliers to comply with the applicable regulatory requirements including labour practices and human rights, health, safety and environment etc.
Environmental, Social & Governance Matrix (ESGM)

39
GovernanceAudit Committee Structure 9 Low The audit committee comprises of 8 members, out of whom 7 members are independent directors; the committee met 7 times in FY20
Bribery & Corruption 9 LowThe policy relating to ethics, bribery and corruption extends beyond TCS to its all stakeholders; the company has well-defined policies on anti-corruption and bribery as well as code of conduct, which are also applicable to all stakeholders
Executive Compensation 8 Low
The average annual increase was 6% in India; however, during the course of the year (FY20), the total increase was ~7.7% after accounting for promotions and other event-based compensation; employees outside India received a wage increase in the range of 2-6%; while the managerial remuneration decreased by 15% in FY20, executive remuneration for FY20 was lower than FY19 in view of COVID-led economic conditions; the directors decided to moderate their executive remuneration for FY20 to express solidarity and conserve resources
Lobbying 8 LowThe company is a member of National Association of Software and Services Companies (NASSCOM), Confederation of Indian Industries (CII), Federation of India Chambers of Commerce and Industry (FICCI), US India Business Council (USIBC), US chamber of Commerce and Confederation of British Industry (CBI)
Political Contribution 5 Medium In 2019, the company made Rs4.5bn political contribution from the Tata group’s Progressive Electoral Trust
Whistleblower Scheme 8 Low TCS has whistleblower policy in place, which is applicable to employees, directors, consultants, business associates and interns
Total Score Out of 200 165 Low
Total Score (%) 82.5% Low

40
3QFY21 - Management Conference Call – Key Takeaways f Cloud adoption is driving technology transformation and will remain secular driver for
the next 3-5 years.
f The company expects strong opportunity in IT services space, going forward.
f Strong demand from core transformation, market share gain and quick revenue from recently won deal helped TCS to report the strongest growth in seasonally-weak December quarter. This also helped the company to report YoY growth in CC terms one quarter ahead of April target.
f During 3QFY21, Geography-wise, CC growth was led by North America (up 3.3% QoQ), followed by India (up 18% QoQ), the UK (up 4.5% QoQ), Continental Europe (up 2.5% QoQ) and APAC (up 2.6% QoQ). Notably, all verticals witnessed positive growth on sequential comparison.
f BFSI reported one of the best December quarters, while adjusted for seasonal headwind, its performance was at par with 2QFY21. Growth was well-rounded across geographies except for APAC region. BFSI clients increased spend on customer experience enhancement, new product initiatives, regulatory works as well as ESG initiatives. From technology perspective, it translated into call center modernization, analytics and insight, workplace transformation, cloud adoption, core modernization and cyber security etc.
f TCS added a record 15,721 employees in 3QFY21. Out of the total headcount of 469,261, about 36.4% employees are women. About 1,500 employees have joined in new delivery center in Ireland. TCS added 12,000 trainees in 3QFY21. Additionally, the company has talent pool with an inventory of ~40,000 trainees with offer letters.
f The management looks forward to a strong 4QFY21E and double-digit revenue growth in FY22E.

41
HULGilletteBritania
Nestle
Asian Paints
EPAM
Colgate
TCSInfosysWiproHCLT
8
18
28
38
48
58
68
78
0 5 10 15 20 25 30
FY24
PE (x
)
FY21-FY24E EPS CAGR (%)
Exhibit 1: Book-to-bill ratio witnessed substantial expansion driven by improved technology spend...
Exhibit 2: ...which will lead into double-digit topline growth over FY21E-24E
Source: Company, RSec Research Source: Company, RSec Research
Exhibit 3: TCS to remain EBIT margin leader among Top-4 Indian names...
Exhibit 4: ...and also RoCE above 40%
Source: Company, RSec Research Source: Company, RSec Research
Exhibit 5: Top-4 IT names deserve multiple re-rating as IT industry embracing more consumer industry like features
Exhibit 6: TCS trades at 1% discount against Accenture vs historical premium of 9%
Source: RSec Research, Bloomberg Source: RSec Research, Bloomberg
Key Charts
-40
-20
0
20
40
60
80
2010 2011 2012 2013 2014 2015 2016 2017 2018 2019 2020 2021
TCS (discount)\premium over Accenture Average
(%)
5.4
0.4
15.8
11.2 10.9
0.0
2.0
4.0
6.0
8.0
10.0
12.0
14.0
16.0
18.0
FY20 FY21E FY22E FY23E FY24E
(%)
Revenue $ growth (YoY)

42
-2.7
6.0 6.3
8.3 9.1
3.6
5.0 5.5 5.5 5.4
-4
-2
0
2
4
6
8
10
2020 2021E 2022E 2023E 2024E
(%)
IT Services growth forecast at Jan'21 IT Services growth forecast at Jan'20
Our investment thesis is based on the following premises: f Agile Biz Model with Superior Capability/Practices to Boost Market Share
f Deep-rooted Relationship with Large Global Corporates as Technology Partners
f Key Beneficiary of Vendor Consolidation & Higher IT Outsourcing
f Industry-leading Operating Margin & Return Ratios
I. Agile Biz Model with Superior Capability/Practices to Boost Market Share During the last decade (2010-2020), TCS recorded revenue CAGR of 12.9% ahead of the industry average of 9% driven by: (1) stable leadership and successful succession to next layer of leadership; (2) diversified industry focused offerings with multiple productized IT solutions; and (3) agile operating and business model backed by best-in-class methods and practices. TCS has successfully transitioned itself to digital transformation partner and full-stack service provider. Additionally, with a strong employee pool of ~450K IT professionals dispersed across the globe, the company has been able to provide different delivery models i.e. onsite, offshore and near-shore or no-shore. We believe TCS is well-placed to gain market share among the fragmented IT services vendors in the next decade on the back of full-stack offerings with scale (across verticals and geographies) and track record as technology partner of modern complex IT architecture. We expect TCS to continue its superior growth trajectory with >12.6% revenue CAGR over FY21E-FY24E on the back of deft business model (diversified portfolio, scalable strong talent battery and global presence).
Investment Rationale
A. Strong book-to-bill ratio to support medium-term growth visibility: TCS recorded strong order inflow during last 4 quarters. Its LTM book-to-bill ratio remains strong at 1.4x, substantially higher than the average of pre-COVID 11 quarters, which we believe provides near-to-medium-term growth visibility. The management expects that technology demand scenario to remain buoyant in the medium-term. Deal pipeline remains strong and a higher number of medium and large size deals are likely to move to closure in the coming quarters. The management also highlighted increase in closure of large deals in the range of US$50-100mn in 3QFY21. We expect higher book-to-bill ratio and strong commentary on deal pipeline to accelerate revenue CAGR to 12.6% over FY21E-FY24E vs. CAGR of 6.7% over FY17-FY19.
Exhibit 7: Industry-leading growth in last decade owing to agile biz model and full-stack industry solutions
Exhibit 8: Medium-term surge in technology spend post pandemic
Source: RSec Research Source: RSec Research, Gartner
6.7 6.5
9.010.3
12.9
15.5
0.0
2.0
4.0
6.0
8.0
10.0
12.0
14.0
16.0
18.0
Accenture Wipro IndustryRevenueGrowth
Infosys TCS Cognizant
(%)
US$ Revenue CAGR (FY10-FY20)

43
B. Persistent efforts to upgrade offerings with diversified industry specific product portfolio: TCS has a set of diversified industry specific products and platforms. It has stepped up efforts on productized and platform-based IT solutions as well. Its product subsidiary, Digitate was ranked at 37th place among the Top-100 software companies in 2020. TCS has consistently invested in the intellectual capital over the years, which has resulted in significant scaling of its R&D capacity. The company’s investments are spread across: (1) newer adjacent offerings around established intellectual property; (2) platform innovations: AI including enterprise digital twins, drones and machine vision, semantic systems and automation; (3) disruptive innovations: new areas for foundational research in multiple domains i.e. media and advertising, meta-materials, quantum computing and sensing and space technology. As of March 31, 2020, the company filed for 5,216 patents and was granted 1,341.
Exhibit 11: Key Products
Products Details FY20 Deal Wins
TCS BaNCS Banking: Serves ~25% of global population
Capital Markets: Records 10mn trades per day (peak), represents US$40tn worth of AUC across 100 countries
Insurance: Administers over 20mn life, annuity and pension policies; 135mn property and casualty policies
23 new wins (7 for TCS BaNCS Cloud) and 24 go-lives
TCS iON Assessment: 200mn+ candidates assessed till date; 2.4mn candidates assessed in largest single shift
Learning: 3mn+ learners on the platform, 47,000 courses available, 18,000 communities Process management
500+ SMB clients and 1mn+ users
Ignio Manages over 1.5mn technology resources autonomously 54 new wins and 34 go-lives
TCS ADD Comprehensive suite for digital transformation of drug development and clinical trials
6 new offerings enabled by AI and predictive analytics launched in Site Feasibility & Safety domain
9 new wins
TCS HOBS Plug & Play: SaaS-based business platform to digitally transform business, network and revenue management domains of subscription based businesses.
Serving 27+ clients, across Communications, Utilities, Manufacturing and Personal Care; Serving 21 mn+ subscribers, handling 125,000+ devices and processing 1bn+ events.
5 new wins and 4 go-lives in
TCS TwinX AI-powered system of actionable helps the business leaders to simulate and optimize enterprise decisions, predict and proactively manage the outcome
2 new wins and go-lives in
TCS Optumera
AI and ML powered merchandise optimization platform that enables the retailers to unlock exponential value by optimizing their space, mix and price in an integrated manner
4 new wins and 1 go-live in
TCS OmniStore
Unified store suite, which leverages AI to help deliver personalized, interconnected journeys across various touch points for frictionless customer experience and predictive operations
4 new wins and 2 go-lives in
Mastercraft Digital platform to optimally automate and manage IT processes 29 new wins, 1bn+ records cleansed
Jile SaaS-based, scalable Agile DevOps platform to accelerate software development and delivery and integrate DevOps tools
8 new wins and go-lives in
Source: Company, RSec Research
Exhibit 9: Book-to-bill ratio witnessed substantial expansion driven by improved technology spend...
Exhibit 10: ...which will lead into double-digit topline growth over FY21E-24E
Source: Company, RSec Research Source: Company, RSec Research
5.4
0.4
15.8
11.2 10.9
0.0
2.0
4.0
6.0
8.0
10.0
12.0
14.0
16.0
18.0
FY20 FY21E FY22E FY23E FY24E
(%)
Revenue $ growth (YoY)

44
C. Capability leader in digital services and cloud partnership: According to industry consultant Everest, TCS is the leader in digital services (AI, Industry 4.0 and IoT). Additionally, it also enjoys leadership position with all three cloud hyperscalers (Google, Amazon and Microsoft). TCS is capability leader in Indian IT industry.
Exhibit 13: Quarterly net employee addition
Source: Company, RSec Research
D. Acceleration in hiring and strong inventory of talent battery: During 3QFY21, TCS hired 15,000 employees (significantly higher than the previous level), which suggests increasing confidence on demand resiliency. The company has inventory of ~40,000 offer letters (higher than the previous quarter), which suggests likely growth acceleration in FY22E. We expect the employee hiring to increase further in the coming quarters as well.
Exhibit 12: TCS is a capability leader in digital services and cloud partnership
Capability Services
Star Internet of Things Services, Finance and Accounts Outsourcing, Healthcare Payer Digital services
Leader System Integration Capabilities on Google Cloud, Microsoft Azure, Amazon Web Services , AI Services, Industry 4.0, Life Sciences Digital Services, Next Generation Application Management Services, Cloud Native Application Development Service
Source: Everest, RSec Research
14,097
-4,063
1,789
-4,788
9,864
15,721
-10,000
-5,000
0
5,000
10,000
15,000
20,000
2QFY20 3QFY20 4QFY20 1QFY21 2QFY21 3QFY21
45
II. Deep-rooted Relationship with Large Global Corporates as Technology PartnersTCS enjoys deep-rooted relationship with the large global corporate clients with a track record of successful execution for several years. Its business model focuses on long-term technology partnership with deep integration with customers’ ecosystem. TCS works as a Tier-I IT vendor with diversified base of global MNCs, which will aid the company to cash in on increased technology spending. TCS focuses on IT modernization approach based on: (1) cost efficiency and productivity; and (2) growth and new client acquisitions. We highlight the company’s close relationship as technology partner with the large global company provides medium-term revenue visibility, as technology budget continues to witness steady acceleration.
A. Deep dive on top US clients: We have analysed Labour Condition Applications (LCAs) of TCS for FY20 (Oct’19-Sept’20), which suggests that the company’s Top-20 US clients list comprises of firms from financial services, technology, manufacturing and communication verticals. We have also analysed key competitors in large accounts. The key conclusions of our analysis are given in the following:
I. There are 8 client accounts in Top-20 US clients list of TCS, which are common in other large Indian IT peers.
II. TCS remains a dominant IT vendor (among Top-5) in all Top-20 accounts. The company competes with Accenture, Infosys and Cognizant in majority of the key US clients.
III. We also highlight HR firms such as Randstad and KFORCE have a decent workshare in key accounts. We believe this rise was driven by protective visa regime in the US. We expect the large Indian IT firms to benefit from comparatively softer tone of the Biden Administration on immigration front.
IV. TCS is likely to be the key beneficiary of global enterprises focus on large-scale transformation and flight to safety.
46
B. Expanding wallet share with the clients: TCS continues to expand its wallet share with the existing clients, which is evident from consistent growth in US$50mn and US$100mn client bucket. TCS expanded it's US$100mn client count to 48 from 38 in FY18. We believe TCS would be key beneficiary of vendor consolidation and clients preference towards large IT vendors.
Exhibit 15: TCS expanded it's US$100mn client count to 48 from 38 in FY18
Source: Company; RSec Research
Exhibit 14: TCS' Top 20 US Clients
Client Key Competition
Financial Services f Infosys, LTI, Wipro, Iris Software, Virtusa, NTT data Services, Accenture, Mitchell/Martin, Capgemini, Maveric, Incandescent Tech, Synechron Inc, Oracle Financial Services, E&Y, Photon
Technology f Infosys, Wipro, Quest Global, Cognizant, Deloitte, Red Oak Technologies, DGN Technologies, Antra, Bridgenexus, Compunnel Software, Mastech, Mythri
Retail f KFORCE, Mindtree, Atos, Cognizant, Adecco, Deloitte, Mastech, Ocher Technology, Ugam Solutions
Pharma retail f Cognizant, Photon, GlobalLogic, Accenture, Mastech Digital, Persistent, Populus Group, Multivision, I3 Infotek, E&Y, federal Soft Systems
Financial Services f HCLT, Wipro, IBM, Mastech Digital, Compunnel Software Group, Daman, Populus Group, Inherent Technologies
Financial Services f Atos, Cognizant, KFORCE, Compunnel Software Group, NTT Data, Tech Aspect, Deloitte, Wipro, Capgemini
Healthcare f Cognizant, Headstrong LLC, Randstad, Mastech, Genpact, Computer Software Group, Deloitte, Genpact, Nemo IT, Xsell Resources, Comtek, Kforece, Zensar
Entertainment f Cognizant, Infosys, Mastech Digital, Accenture, MARLABS, Xavient, Wipro, Tata Elexi, E&Y, Virtusa
Financial Services f CSC Covansys Corporation, Cognizant, Accenture, Infostrech, ProKarma, DXC Technology, Perficient, Mastech, Compunnel Software Group, Deloitte, SRS Consulting
Technology f Infosys, SRS Consulting, LTI, Wipro, Zensar, Tech Mahindra, Accenture, Persistent, HCLT, Cognizant, Randstad Technology, Urpan Technology, Capgemini, Enquero, Onstak
Financial Services f Atos, Cognizant, Infosys, Intraedge, IBM, Mastech, Impetus, Deloitte, Humac, M3BI, Virtusa, Computer Software Group, Mindtree
Diversified f Genpact, Tech Mahindra, Capgemini, Accenture, E&Y, Quest Global Services, Hexaware, Headstrong
Financial Services f Mastech, Virtusa, Accenture, Cognizant, E&Y, Randstad, Indotronix, Quiddity Infotech
Financial Services f CGI Technologies, Cognizant, Accenture, Mastech, Randstad, Deloitte, Compunnel Software, EPAM, Mastech, Virtusa, Bradford
Retail f Wipro , Larsen & Toubro Infotech, Cognizant, IBM, Deloitte, HCLT, Capgemini, Accenture, L&T Technology Services, I3 Infotech, Microexcel, BirlaSoft, TechMahindra
Financial Services f HTC Global Services, Capgemini, Accenture, IBM, NTT Data, ARV Systems, Savy Info Systems, Majesco, Global Data
Professional Services f ValuLabs, Infocepts, Maantic, Wave Solutions, Asta CRS
Financial Services f Infosys, Headstrong, Capgemini, Tech mahindra, Synechron, Capgemini, E&Y, Genpact, Deloitte, Virtusa, Mastech Digital
Financial Services f Randstad, Synechron, Diversant, Data INC, Infosys, Mitchell/Martin Collabera, Accenture, Deloitte, E&Y, Genesis Corp
Pharmaceutical f Infosys, Deloitte, Informatica, L&T Technology, Mastech, Deloitte, HCLT, Headstrong, Capgemini, Synechron
Source: RSec Research, Department of Labour (US); Note: Grey highlight denotes common Top-20 client accounts for Top-4 IT names
38
20
8
44
25
10
49
28
15
48
29
10
0
10
20
30
40
50
60
TCS Infosys Wipro
FY 18 FY 19 FY 20 3QFY21

47
C. Leadership Position in Europe vs. Large Indian IT Firms: TCS generates ~31.2% of its total revenue from Europe, which is higher than its Indian IT peers. The company has successfully localized itself in the European markets and has proven to be attractive for the European companies, which is evident from reference customers across service lines it operates in Europe. On the back of capability, client orientation and marketing efforts, the company has increased its brand awareness to the level of the global top IT services providers. TCS works with the European companies on the complex IT programmes as key technology partner. The company has recorded a strong growth of 14% in Europe geography during last three years.
Exhibit 16: Revenue contribution from Americas – TCS vs. HCLT, Infosys & Wipro
Exhibit 17: Revenue contribution from Europe – TCS vs. HCLT, Infosys & Wipro
Source: Company, RSec Research Source: Company, RSec Research
III. Key Beneficiary of Vendor Consolidation & Higher IT OutsourcingTCS enjoys longstanding and deep-rooted relationship with the large technology spenders. IT services industry is predominantly fragmented, as the Top-40 IT services names contribute only 45% to the total market. Enterprises have large internal tech teams and have also set up multiple offshore units. Additionally, large enterprises deploy multiple vendors across different technology sub-verticals and different geographies. We expect the Indian IT names to witness accelerated market share gain driven by: (1) consistent stable performance during past years as well as the pandemic period; (2) monetization of captives and internal IT teams; and (3) consolidation of distributed vendors’ ecosystem: flight to safety, quality. Historically, the Indian IT industry have been consistently gaining market share, which currently stands at 18.9% compared to 9.7% in 2010. The recent surge in large employee rebadging IT deals by TCS, Infosys and Wipro is expected to accelerate this trend further.
Exhibit 18: Top-40 IT Firms Contribute Only 45% to Global IT Services Industry
Exhibit 19: Indian IT Industry Contributes 19.2% to Global IT Spend
Source: RSec Research, Bloomberg Source: RSec Research, Nasscom
31.228.7
24.4 24.1
0
5
10
15
20
25
30
35
TCS HCL Infosys Wipro
(%)
Revenue Contribution Europe
63.4 61.659.0
52.1
0
10
20
30
40
50
60
70
HCL Infosys Wipro TCS
(%)
Revenue Contribution Americas
38 39 40 40 40 41
3 4 4 4 4 4
58 58 56 56 56 55
0
10
20
30
40
50
60
70
80
90
100
2014 2015 2016 2017 2018 2019
(%)
Top 36 global IT names Top 4 India IT Other
2.5
19.2
0
5
10
15
20
25
FY01
FY02
FY03
FY04
FY05
FY06
FY07
FY08
FY09
FY10
FY11
FY12
FY13
FY14
FY15
FY16
FY17
FY18
FY19
FY20
FY21
E
(%)
India IT share in Global IT Spend
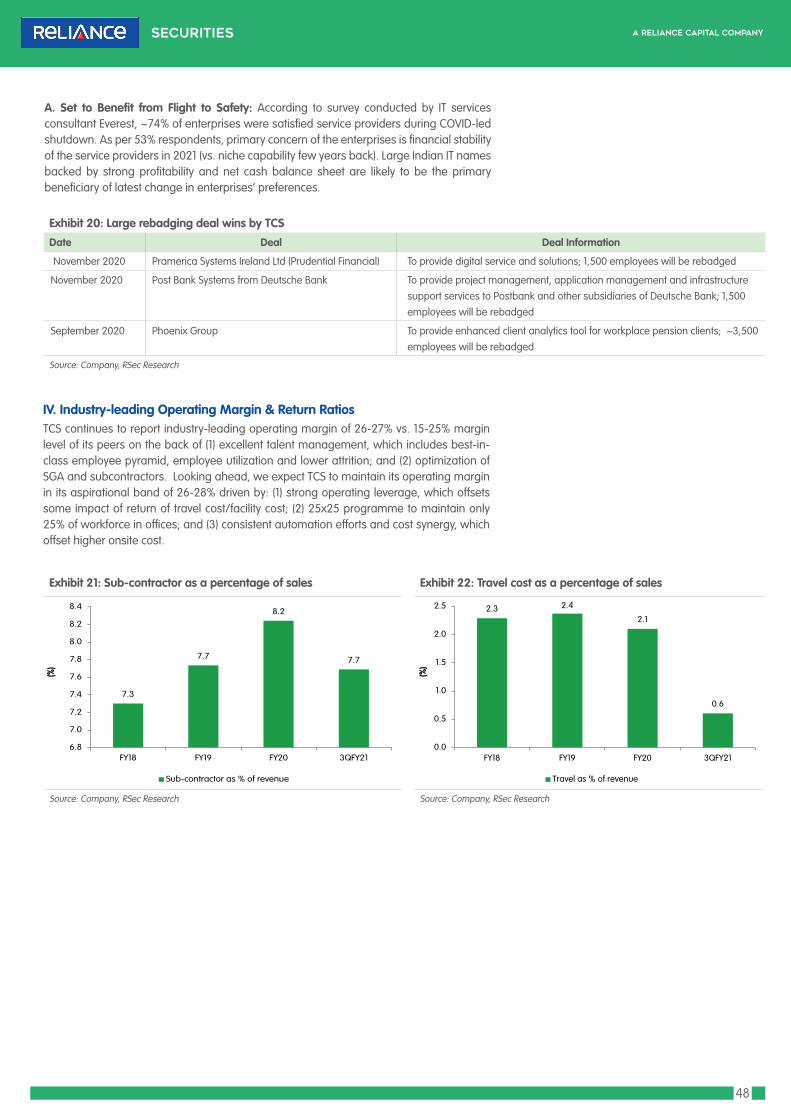
48
A. Set to Benefit from Flight to Safety: According to survey conducted by IT services consultant Everest, ~74% of enterprises were satisfied service providers during COVID-led shutdown. As per 53% respondents, primary concern of the enterprises is financial stability of the service providers in 2021 (vs. niche capability few years back). Large Indian IT names backed by strong profitability and net cash balance sheet are likely to be the primary beneficiary of latest change in enterprises’ preferences.
Exhibit 20: Large rebadging deal wins by TCS
Date Deal Deal Information
November 2020 Pramerica Systems Ireland Ltd (Prudential Financial) To provide digital service and solutions; 1,500 employees will be rebadged
November 2020 Post Bank Systems from Deutsche Bank To provide project management, application management and infrastructure support services to Postbank and other subsidiaries of Deutsche Bank; 1,500 employees will be rebadged
September 2020 Phoenix Group To provide enhanced client analytics tool for workplace pension clients; ~3,500 employees will be rebadged
Source: Company, RSec Research
IV. Industry-leading Operating Margin & Return RatiosTCS continues to report industry-leading operating margin of 26-27% vs. 15-25% margin level of its peers on the back of (1) excellent talent management, which includes best-in-class employee pyramid, employee utilization and lower attrition; and (2) optimization of SGA and subcontractors. Looking ahead, we expect TCS to maintain its operating margin in its aspirational band of 26-28% driven by: (1) strong operating leverage, which offsets some impact of return of travel cost/facility cost; (2) 25x25 programme to maintain only 25% of workforce in offices; and (3) consistent automation efforts and cost synergy, which offset higher onsite cost.
Exhibit 21: Sub-contractor as a percentage of sales Exhibit 22: Travel cost as a percentage of sales
Source: Company, RSec Research Source: Company, RSec Research
7.3
7.7
8.2
7.7
6.8
7.0
7.2
7.4
7.6
7.8
8.0
8.2
8.4
FY18 FY19 FY20 3QFY21
(%)
Sub-contractor as % of revenue
2.3 2.4
2.1
0.6
0.0
0.5
1.0
1.5
2.0
2.5
FY18 FY19 FY20 3QFY21
(%)
Travel as % of revenue
49
Exhibit 23: TCS enjoys strongest EBIT among peers driven by best-in-class practices and cost optimization measures
Source: Company, RSec Research
A. Solid Return Ratios & Cash Conversation Suggest Strong Execution: TCS enjoys one of the best return ratios vs. its peers driven by industry leading EBIT margin, nimble balance sheet and consistent capital allocation policy. Its RoCE is ~1,000bps higher than Infosys. Additionally, the company has returned ~70% of free cash flow to its shareholders via dividend and buy-back.
Looking ahead, we believe TCS would continue to enjoy one of the best return ratios and FCF conversations, which make a case for sustainable premium valuation in the medium-term.
Exhibit 24: TCS enjoys one of the best return ratios
Source: Company, RSec Research
B. Need to Focus on Inorganic Capability Building: TCS is relatively less focused on inorganic capacity building vis-à-vis Indian and global IT peers. Accenture remains a leader in terms of acquisition with >30 acquisitions (during CY20) in Cloud, Data Analytics/AI, Experience & Engineering as well as Design services. Interestingly, both Infosys and Wipro, with new leadership at the helm, have increased focus on M&As. We believe TCS needs to step-up its focus on acquisition to augment its business on digital as well as consulting/strategic advisory side.
Exhibit 25: Inorganic capability building (CY20) - Accenture remains leader
Source: Company, RSec Research
17.1
19.6
21.3
24.6
19.6
21.2
24.4
25.1
17.8
20.4
24.4
25.8
18.5
20.2
24.3
26.1
19.0
20.2
24.6
26.1
0
5
10
15
20
25
30
Wipro HCL Tech Infosys TCS
(%)
FY20 FY21E FY22E FY23E FY24E
17.3
22.0
24.1
38.3
15.8
22.4
26.4
40.8
14.8
20.9
29.0
46.8
13.1
20.9
29.6
44.9
14.1
20.9
29.7
42.5
0
5
10
15
20
25
30
35
40
45
50
Wipro HCL Tech Infosys TCS
(%)
FY20 FY21E FY22E FY23E FY24E

50
0
10
20
30
40
50
60
70
80
01-0
7
08-0
7
03-0
8
10-0
8
05-0
9
12-0
9
07-1
0
02-1
1
09-1
1
04-1
2
11-1
2
06-1
3
01-1
4
08-1
4
03-1
5
10-1
5
05-1
6
12-1
6
07-1
7
02-1
8
09-1
8
04-1
9
11-1
9
06-2
0
01-2
1
(%)
NASDAQ vs S&P premium/(discount) Last 10 Yr Average Last 5 Yr Average
HULGilletteBritania
Nestle
Asian Paints
EPAM
Colgate
TCSInfosysWiproHCLT
8
18
28
38
48
58
68
78
0 5 10 15 20 25 30
FY24
PE (x
)
FY21-FY24E EPS CAGR (%)
Outlook & ValuationWhilst TCS underperformed Nifty IT by 37% on LTM basis , we expect the company to be one of the key beneficiaries of medium-term uptrend in technology spending. Additionally, the company is expected to gain market share on the back of vendor consolidation and captive monetization efforts. We expect recent surge in large deal wins (LTM book-to-bill ratio of 1.4x vs. 1.1x earlier) is likely to be a medium-term phenomena. We expect the company’s revenue to clock 12.6% CAGR over FY21E-FY24E, its EBIT margin could rise to 26.1% (FY24E). At CMP, the stock trades at 1% discount to its comparable peer, Accenture vs. historical average premium of 9%. The stock deserves multiple rerating on the back of strong double-digit revenue, expanding EBIT margin and industry leading return ratios (44% in FY24E). We initiate coverage on TCS with BUY and a 2-Year Target Price of Rs4,180 (valuing the stock at 30x PE on FY24E EPS), which implies 32% upside from the current level.
Exhibit 26: TCS trades at premium valuation vs. historical range Exhibit 27: TCS trades at 1% discount against Accenture vs historical premium of 9%
Source: RSec Research, Bloomberg Source: RSec Research, Bloomberg
Exhibit 28: NADAQ (US Technology Index) 12 month forward PE trades at 45% premium to S&P500
Exhibit 29: Top-4 IT names deserve multiple re-rating as IT industry embracing more consumer industry like features
Source: RSec Research, Bloomberg Source: RSec Research, Bloomberg
-40
-20
0
20
40
60
80
2010 2011 2012 2013 2014 2015 2016 2017 2018 2019 2020 2021
TCS (discount)\premium over Accenture Average
0.0
5.0
10.0
15.0
20.0
25.0
30.0
35.0
2010 2011 2012 2013 2014 2015 2016 2017 2018 2019 2020 2021
BEST_PE_12M_BF 13.9 AVG 19.8 STDEV+1 23.6 STDEV-1 15.9
(%)
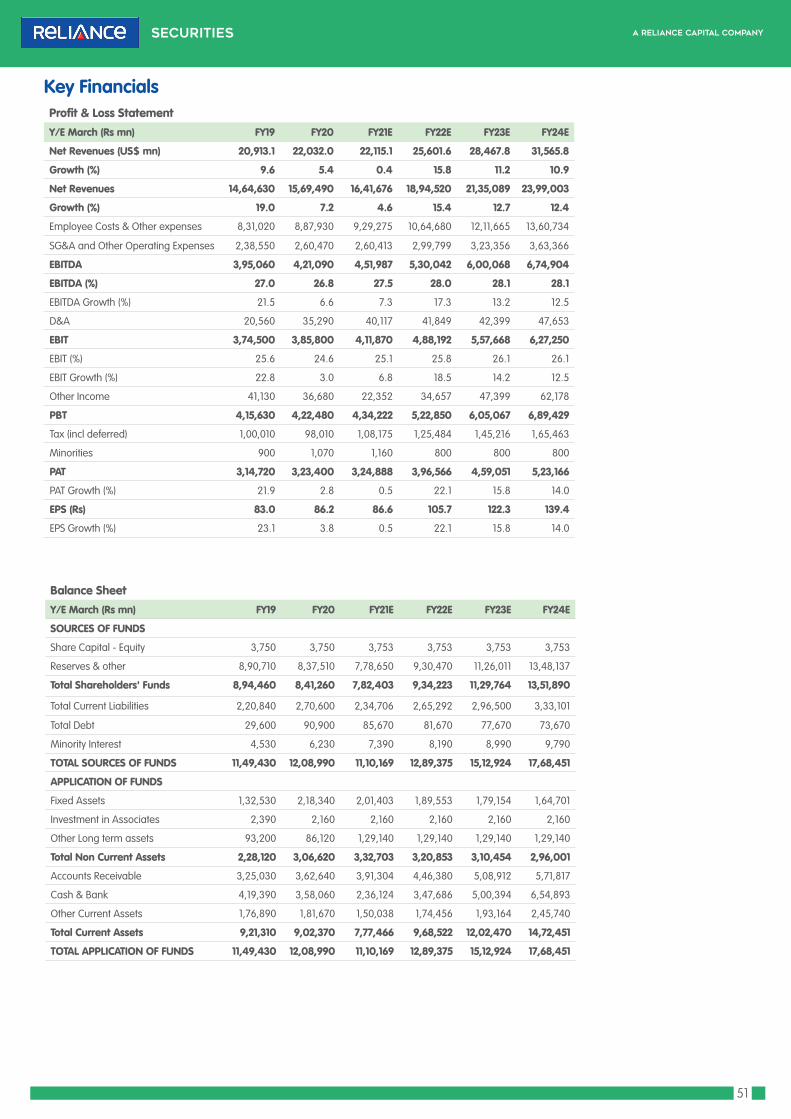
51
Profit & Loss StatementY/E March (Rs mn) FY19 FY20 FY21E FY22E FY23E FY24E
Net Revenues (US$ mn) 20,913.1 22,032.0 22,115.1 25,601.6 28,467.8 31,565.8
Growth (%) 9.6 5.4 0.4 15.8 11.2 10.9
Net Revenues 14,64,630 15,69,490 16,41,676 18,94,520 21,35,089 23,99,003
Growth (%) 19.0 7.2 4.6 15.4 12.7 12.4
Employee Costs & Other expenses 8,31,020 8,87,930 9,29,275 10,64,680 12,11,665 13,60,734
SG&A and Other Operating Expenses 2,38,550 2,60,470 2,60,413 2,99,799 3,23,356 3,63,366
EBITDA 3,95,060 4,21,090 4,51,987 5,30,042 6,00,068 6,74,904
EBITDA (%) 27.0 26.8 27.5 28.0 28.1 28.1
EBITDA Growth (%) 21.5 6.6 7.3 17.3 13.2 12.5
D&A 20,560 35,290 40,117 41,849 42,399 47,653
EBIT 3,74,500 3,85,800 4,11,870 4,88,192 5,57,668 6,27,250
EBIT (%) 25.6 24.6 25.1 25.8 26.1 26.1
EBIT Growth (%) 22.8 3.0 6.8 18.5 14.2 12.5
Other Income 41,130 36,680 22,352 34,657 47,399 62,178
PBT 4,15,630 4,22,480 4,34,222 5,22,850 6,05,067 6,89,429
Tax (incl deferred) 1,00,010 98,010 1,08,175 1,25,484 1,45,216 1,65,463
Minorities 900 1,070 1,160 800 800 800
PAT 3,14,720 3,23,400 3,24,888 3,96,566 4,59,051 5,23,166
PAT Growth (%) 21.9 2.8 0.5 22.1 15.8 14.0
EPS (Rs) 83.0 86.2 86.6 105.7 122.3 139.4
EPS Growth (%) 23.1 3.8 0.5 22.1 15.8 14.0
Balance SheetY/E March (Rs mn) FY19 FY20 FY21E FY22E FY23E FY24E
SOURCES OF FUNDS
Share Capital - Equity 3,750 3,750 3,753 3,753 3,753 3,753
Reserves & other 8,90,710 8,37,510 7,78,650 9,30,470 11,26,011 13,48,137
Total Shareholders' Funds 8,94,460 8,41,260 7,82,403 9,34,223 11,29,764 13,51,890
Total Current Liabilities 2,20,840 2,70,600 2,34,706 2,65,292 2,96,500 3,33,101
Total Debt 29,600 90,900 85,670 81,670 77,670 73,670
Minority Interest 4,530 6,230 7,390 8,190 8,990 9,790
TOTAL SOURCES OF FUNDS 11,49,430 12,08,990 11,10,169 12,89,375 15,12,924 17,68,451
APPLICATION OF FUNDS
Fixed Assets 1,32,530 2,18,340 2,01,403 1,89,553 1,79,154 1,64,701
Investment in Associates 2,390 2,160 2,160 2,160 2,160 2,160
Other Long term assets 93,200 86,120 1,29,140 1,29,140 1,29,140 1,29,140
Total Non Current Assets 2,28,120 3,06,620 3,32,703 3,20,853 3,10,454 2,96,001
Accounts Receivable 3,25,030 3,62,640 3,91,304 4,46,380 5,08,912 5,71,817
Cash & Bank 4,19,390 3,58,060 2,36,124 3,47,686 5,00,394 6,54,893
Other Current Assets 1,76,890 1,81,670 1,50,038 1,74,456 1,93,164 2,45,740
Total Current Assets 9,21,310 9,02,370 7,77,466 9,68,522 12,02,470 14,72,451
TOTAL APPLICATION OF FUNDS 11,49,430 12,08,990 11,10,169 12,89,375 15,12,924 17,68,451
Key Financials
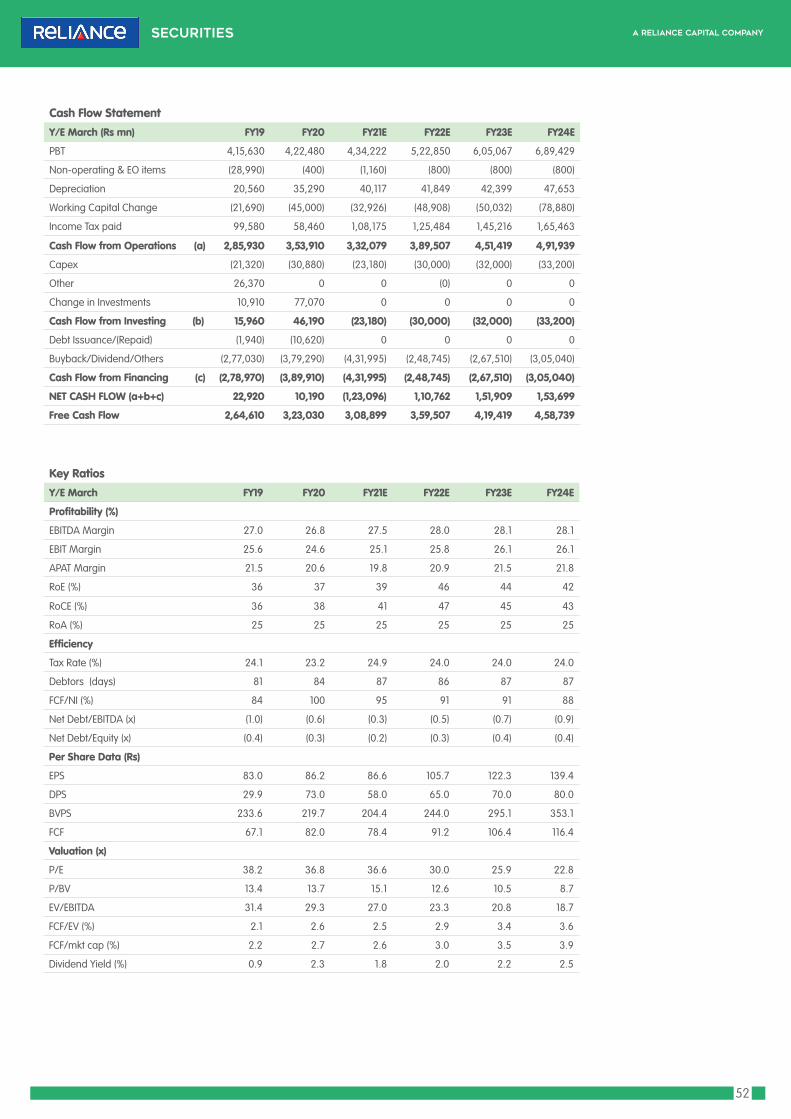
52
Cash Flow StatementY/E March (Rs mn) FY19 FY20 FY21E FY22E FY23E FY24E
PBT 4,15,630 4,22,480 4,34,222 5,22,850 6,05,067 6,89,429
Non-operating & EO items (28,990) (400) (1,160) (800) (800) (800)
Depreciation 20,560 35,290 40,117 41,849 42,399 47,653
Working Capital Change (21,690) (45,000) (32,926) (48,908) (50,032) (78,880)
Income Tax paid 99,580 58,460 1,08,175 1,25,484 1,45,216 1,65,463
Cash Flow from Operations (a) 2,85,930 3,53,910 3,32,079 3,89,507 4,51,419 4,91,939
Capex (21,320) (30,880) (23,180) (30,000) (32,000) (33,200)
Other 26,370 0 0 (0) 0 0
Change in Investments 10,910 77,070 0 0 0 0
Cash Flow from Investing (b) 15,960 46,190 (23,180) (30,000) (32,000) (33,200)
Debt Issuance/(Repaid) (1,940) (10,620) 0 0 0 0
Buyback/Dividend/Others (2,77,030) (3,79,290) (4,31,995) (2,48,745) (2,67,510) (3,05,040)
Cash Flow from Financing (c) (2,78,970) (3,89,910) (4,31,995) (2,48,745) (2,67,510) (3,05,040)
NET CASH FLOW (a+b+c) 22,920 10,190 (1,23,096) 1,10,762 1,51,909 1,53,699
Free Cash Flow 2,64,610 3,23,030 3,08,899 3,59,507 4,19,419 4,58,739
Key RatiosY/E March FY19 FY20 FY21E FY22E FY23E FY24E
Profitability (%)
EBITDA Margin 27.0 26.8 27.5 28.0 28.1 28.1
EBIT Margin 25.6 24.6 25.1 25.8 26.1 26.1
APAT Margin 21.5 20.6 19.8 20.9 21.5 21.8
RoE (%) 36 37 39 46 44 42
RoCE (%) 36 38 41 47 45 43
RoA (%) 25 25 25 25 25 25
Efficiency
Tax Rate (%) 24.1 23.2 24.9 24.0 24.0 24.0
Debtors (days) 81 84 87 86 87 87
FCF/NI (%) 84 100 95 91 91 88
Net Debt/EBITDA (x) (1.0) (0.6) (0.3) (0.5) (0.7) (0.9)
Net Debt/Equity (x) (0.4) (0.3) (0.2) (0.3) (0.4) (0.4)
Per Share Data (Rs)
EPS 83.0 86.2 86.6 105.7 122.3 139.4
DPS 29.9 73.0 58.0 65.0 70.0 80.0
BVPS 233.6 219.7 204.4 244.0 295.1 353.1
FCF 67.1 82.0 78.4 91.2 106.4 116.4
Valuation (x)
P/E 38.2 36.8 36.6 30.0 25.9 22.8
P/BV 13.4 13.7 15.1 12.6 10.5 8.7
EV/EBITDA 31.4 29.3 27.0 23.3 20.8 18.7
FCF/EV (%) 2.1 2.6 2.5 2.9 3.4 3.6
FCF/mkt cap (%) 2.2 2.7 2.6 3.0 3.5 3.9
Dividend Yield (%) 0.9 2.3 1.8 2.0 2.2 2.5

53
Company BackgroundTata Consultancy Services Ltd. (TCS) is a multinational information technology (IT) services and consulting company headquartered in Mumbai. It is a Tata Group company and has operations in 149 locations across 46 countries. TCS is the largest Indian IT company, which reported $22bn revenue in FY20 and has a workforce of 4,69,261 as on Dec’20.
Exhibit 30: Revenue break-up by verticals Exhibit 31: Revenue break-up by geography
Source: Company; RSec Research Source: Company; RSec Research
Management TeamName Designation Brief Profile
Mr. Rajesh Gopinathan CEO & MD Mr. Gopinathan was elevated to the role of CEO in Feb’17 after serving as CFO since 2013. He joined TCS in 2001. He has an engineering degree from the REC (now National Institute of Technology, Tiruchirappalli). He obtained a PG Diploma in Management from IIT, Ahmedabad.
Mr. V. Ramakrishnan CFO Prior to joining TCS in 1999, Mr. Ramakrishnan was the Head of Finance and Company Secretary of Tata Elxsi. He is a graduate in commerce from Loyola College, Chennai and a member of the Institute of Chartered Accountants of India, the Institute of Company Secretaries of India and the Institute of Cost Accountants of India.
Mr. N.G. Subramaniam COO Mr. Subramaniam is also an Additional Director and Chairman of Tata Elxsi since Nov’14. Prior to taking over the COO’s role he served as the Executive VP and Head of TCS Financial Solutions. He joined TCS in 1982 after completing his Masters in Mathematics from University of Madras.
Source: Company, RSec Research

54
72.1%
23.6%
4.2% 0.1%
Promoter Institutional Retail Corp Bodies
Shareholding Pattern
Source: Bloomberg
Key Institutional Shareholders
Holder's Name Share Holding (%)
Life Insurance Corp of India 4.0
JPMorgan Chase & Co 1.1
Vanguard Group Inc/The 0.9
BlackRock Inc 0.8
Invesco Ltd 0.8
SBI Funds Management Pvt Ltd 0.8
First State Investments ICVC 0.7
Axis Asset Management Co Ltd/India 0.5
Standard Life Aberdeen PLC 0.4
First Sentier Global Umbrella Fund 0.4Source: Bloomberg
55
InfosysIT | India
Institutional Equity Research
Initiating Coverage | 31 March 2021
BUY2 Year Target Price: Rs.1,920
CMP* (Rs) 1,387
Upside/ (Downside) (%) 38
Bloomberg Ticker INFO IN
Market Cap. (Rs bn) 5,913
Free Float (%) 87.0
Shares O/S (mn) 4,263
Share price (%) 1 mth 3 mth 12 mth
Absolute performance 9.5 11.3 116.4
Relative to Nifty 8.9 5.1 43.7
Shareholding Pattern (%) Sept'20 Dec'20
Promoter 13.0 13.0
Public 87.0 87.0
1 Year Stock Price Performance
Note: * CMP as on 30 March 2021
Multiple Tailwinds; Expect $110bn Mcap in Next 2 years
Key FinancialsY/E March (Rs mn) FY19 FY20 FY21E FY22E FY23E FY24ERevenue 8,26,760 9,07,910 10,10,910 11,80,257 13,42,789 15,03,340
EBIT 1,88,790 1,93,740 2,46,376 2,88,008 3,26,138 3,69,828
PAT 1,54,100 1,65,950 1,95,684 2,34,771 2,68,005 3,02,999
EPS (Rs) 35.4 38.9 46.1 55.3 63.2 71.4
EBIT Margin (%) 22.8 21.3 24.4 24.4 24.3 24.6
PE (x) 39.2 35.6 30.1 25.1 22.0 19.4
P/BV (x) 9.3 9.0 8.4 7.4 6.5 5.8
Source: Company, RSec Research
1. We expect Infosys (INFY) to report industry leading revenue CAGR of 13.3% over FY21-FY24E driven by surge in mega deal wins and higher technology spend. Additionally, a stable management at the helm (unlike of 2010-2017) is likely to aid consistent execution and bolder business decisions.
2. Consistent investment in talent, leveraging product portfolio, new cloud focused offerings and expanding ecosystem partnership are expected to accelerate client relevance.
3. Digital business has crossed 50% of top-line (3QFY21 growth of 31% YoY). We believe mainstreaming of digital business would continue to support Infosys in witnessing accelerated growth in the medium-term.
4. We expect the company’s margin at 24-25% level over FY22E-FY24E on the back of WFH model (~33% of workforce) and automation benefits compared to 21-23% over FY19-FY20.
5. Aggressive localization efforts in the US and remote working model would reduce visa dependency and delivery disruption.
ESG Analysis: While analyzing 20 key criteria (10 points each) under ESG Matrix, we have assigned an overall score of 83% to Infosys. Under “Environmental Head”, we have assigned 86% score, as the company has already achieved carbon neutral status. Under “Social Head”, we have assigned 81% score, as the company scores high on customer satisfaction, gender diversity and CSR spend. Under “Governance Head”, we have assigned 81% score in light of high score due to no political contribution and independent audit committee (please refer to page no.59 for detailed ESG analysis).
Outlook & ValuationLooking ahead, we expect Infosys to report superior growth vs. Top-4 Indian IT peers driven by surge in large deals and acceleration in digital revenue share. Additionally, stable management puts INFY in better place to make bolder decisions and pursue aggressive market share gain. At CMP, the stock trades at 13% discount to its larger peer i.e. TCS vs. historical average discount of 16%. We forecast INFY to witness revenue CAGR of 13.3% over FY21E-24E. The stock deserves multiple rerating considering the industry-leading EPS CAGR of 15.7% in FY21E-24E, higher EBIT margin and attractive dividend yield of 3% (FY24E). We initiate coverage on INFY with BUY and a 2-Year Target Price of Rs1,920 (valuing the stock at 27x PE on FY24E earnings), which implies 38% upside from the current level. We expect INFY to reach Mcap of US$110bn in next 2 years.
Key TriggersExecution focused management, surge in mega deals and digital acceleration to drive
superior growth Refreshed offerings and vast product portfolio to expand client relevanceRemote working and automation measures to drive EBIT marginBest-in-class show on ESG front with carbon neutrality, diversity and stronger
governance standard
Research Analyst:
Suyog Kulkarni, CFAContact : (022) 4303 4000 / 9890966735Email : [email protected]
Research Associate:
Chaitanya PanchmatiaContact : (022) 4303 4000 / 8080782900
Email : [email protected]
300
500
700
900
1,100
1,300
1,500
Mar
-20
Apr
-20
May
-20
Jun-
20
Jul-2
0
Aug
-20
Sep-
20
Oct
-20
Nov
-20
Dec
-20
Jan-
21
Feb-
21
Mar
-21
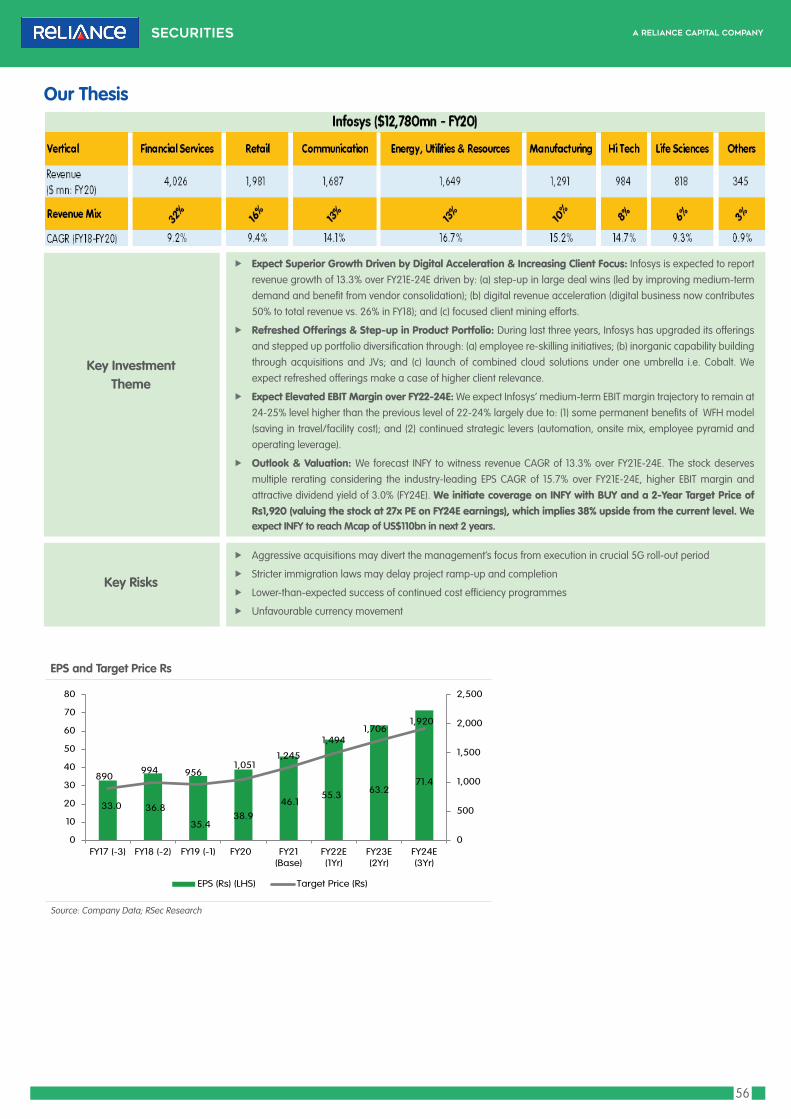
56
Our Thesis
Key InvestmentTheme
Key Risks
f Expect Superior Growth Driven by Digital Acceleration & Increasing Client Focus: Infosys is expected to report revenue growth of 13.3% over FY21E-24E driven by: (a) step-up in large deal wins (led by improving medium-term demand and benefit from vendor consolidation); (b) digital revenue acceleration (digital business now contributes 50% to total revenue vs. 26% in FY18); and (c) focused client mining efforts.
f Refreshed Offerings & Step-up in Product Portfolio: During last three years, Infosys has upgraded its offerings and stepped up portfolio diversification through: (a) employee re-skilling initiatives; (b) inorganic capability building through acquisitions and JVs; and (c) launch of combined cloud solutions under one umbrella i.e. Cobalt. We expect refreshed offerings make a case of higher client relevance.
f Expect Elevated EBIT Margin over FY22-24E: We expect Infosys’ medium-term EBIT margin trajectory to remain at 24-25% level higher than the previous level of 22-24% largely due to: (1) some permanent benefits of WFH model (saving in travel/facility cost); and (2) continued strategic levers (automation, onsite mix, employee pyramid and operating leverage).
f Outlook & Valuation: We forecast INFY to witness revenue CAGR of 13.3% over FY21E-24E. The stock deserves multiple rerating considering the industry-leading EPS CAGR of 15.7% over FY21E-24E, higher EBIT margin and attractive dividend yield of 3.0% (FY24E). We initiate coverage on INFY with BUY and a 2-Year Target Price of Rs1,920 (valuing the stock at 27x PE on FY24E earnings), which implies 38% upside from the current level. We expect INFY to reach Mcap of US$110bn in next 2 years.
f Aggressive acquisitions may divert the management’s focus from execution in crucial 5G roll-out period
f Stricter immigration laws may delay project ramp-up and completion
f Lower-than-expected success of continued cost efficiency programmes
f Unfavourable currency movement
EPS and Target Price Rs
Source: Company Data; RSec Research
33.0 36.8
35.438.9
46.155.3 63.2
71.4890994 956
1,0511,245
1,4941,706
1,920
0
500
1,000
1,500
2,000
2,500
0
10
20
30
40
50
60
70
80
FY17 (-3) FY18 (-2) FY19 (-1) FY20 FY21(Base)
FY22E(1Yr)
FY23E(2Yr)
FY24E(3Yr)
EPS (Rs) (LHS) Target Price (Rs)

57
Price Target ScenarioParticulars Bull Base BearRevenue CAGR (FY21E-FY24E) (%) 17.2 13.3 9.0
EPS CAGR (FY21E-FY24E) (%) 20.2 15.7 8.5
FY24E EPS (Rs) 80.3 71.4 58.9
Target P/E multiple (x) 30.0 27.0 23.0
2-yr Target Price (Rs) 2,404 1,920 1,355
Upside/Downside (%) 73.2 38.4 (2.4)Source: Company, RSec Research
Scenario Analysis
Base Case: In Base Case scenario, we expect the Indian IT services industry to witness high single to double-digit growth over FY21E-FY24E. We expect Infosys to clock 15.7% EPS CAGR on the back of 13.3% CAGR in USD revenue over the same period. Assuming target multiple of 27x on FY24E EPS, we arrive at a target price of Rs.1,920, which is 38% higher than the CMP.
Bull Case: In Bull Case scenario, we expect the Indian IT services industry to witness double-digit growth over FY21E-FY24E. We expect Infosys to clock 20.2% EPS CAGR on the back of 17.2% CAGR in USD revenue over the same period. Assuming target multiple of 30x on FY24E EPS, we arrive at a target price of Rs.2,404, which is 73% higher than the CMP.
Bear Case: In Bear Case scenario, we expect the Indian IT services industry to witness mid to high single digit growth over FY21E-FY24E. We expect Infosys to clock 8.5% EPS CAGR on the back of 9% CAGR in USD revenue over the same period. Assuming target multiple of 23x on FY24E EPS, we arrive at a target price of Rs1,355, which is 2% lower than the CMP.
Price Sensitivity AnalysisEPS (Rs) Growth (%) FWD PE (x) 24 26 27 29
FY17 33.0 22.1 791 857 890 956
FY18 36.8 11.8 18.8 884 958 994 1,068
FY19 35.4 (3.9) 34.3 850 920 956 1,027
FY20 38.9 10.0 35.6 934 1,012 1,051 1,129
FY21E 46.1 18.4 30.1 1,106 1,199 1,245 1,337
FY22E 55.3 20.0 25.1 1,328 1,439 1,494 1,605
FY23E 63.2 14.2 22.0 1,516 1,642 1,706 1,832
FY24E 71.4 13.1 19.4 1,714 1,857 1,920 2,071
Source: Company, RSec Research

58
Key Criteria Score Risk Comments
Management Quality 8 LowThe management is diversified and experienced in the field of IT, technology and finance; the company in one of the best managed IT services companies in the world; top leadership has been largely stable over last three years
Promoter's Holding Pledge 10 LowPromoter group holds mere 13% of total shares outstanding with zero pledged shares. Company is managed by professional management and going forward we expect further reduction in promoters ownership
Board of Directors Profile 8 LowIts board comprises of members from diverse background i.e. technology, engineering and finance; every sub-committee within the board has at least one independent director as member
Industry Growth 8 LowIndian IT industry is likely to witness high single to double-digit growth in the medium-term; Indian IT-BPM industry continues to clock 9.7% CAGR since FY08 (pre-GFC level); notably, the company’s share in global IT spends more than doubled from 8.4% in FY08 to 18.5% in FY20
Regulatory Environment / Risk 7 LowAs the IT companies are not regulated by the government/regulators, there is limited regulatory risk; however, key regulatory risks for the Indian IT companies are: worsening of global immigration policies, privacy and intellectual property rights and Indian SEZ acts etc.
Entry Barriers / Competition 8 Low IT services industry is fragmented with multiple players; large-cap companies enjoy scale benefits vs. their mid-cap peers
New Business/Client Potential 9 LowInfosys recorded new large deal wins of ~US$8bn in 9MFY21 (2x of FY20 levels); the company has the strongest new business potential driven by its refreshed offering, accelerated partnerships and inorganic capabilities
Business Diversification 8 LowInfosys' portfolio is well-diversified; it receives 33%,14.7%,12.5% and 7.1% revenue from BFSI, Retail & CPG, Energy & Utilities and Life Sciences, respectively
Market Share Potential 9 LowWe expect Infosys’ revenue to grow by 13.4% over FY21-FY24E, which is ahead of the industry’s growth rate; we expect the company to consistently gain market share compared to its US and European peers
Margin Expansion Potential 6 Low EBIT margin is expected to expand by 300bps YoY in FY21E; we expect stable EBIT margin thereafter
Earnings Growth 9 Low EPS is expected to clock 15.6% CAGR over FY21E-24E compared to 6% CAGR over FY17-FY20
Balance Sheet Strength 10 LowInfosys enjoys lean and debt free balance sheet; the amount of intangible assets – as a percentage of total assets – is also expected to remain in single digit
Debt Profile 10 LowAs of FY20, the company had cash and bank balance in the excess of US$3.3bn; with negligible debt on balance sheet, it is likely to sustain net cash position, going forward
FCF Generation/NWC 9 Low FCF conversation has been consistently in the excess of 80%; debtors days and unbilled days have improved in last 3 quarters
Dividend Policy 9 Low Infosys has decided to pay 85% of FCF as dividend under normal circumstances; it also returns cash to the shareholders through buy-back
Total Score Out of 150 128
Average Score (%) 85% Low
Investment Decision Matrix (IDM)
Score For < 5 Red High Risk For 5 Blue Medium Risk For > 5 Green Low Risk
Total Score (%) For < 50 Red High Risk For 50 Blue Medium Risk For > 50 Green Low Risk
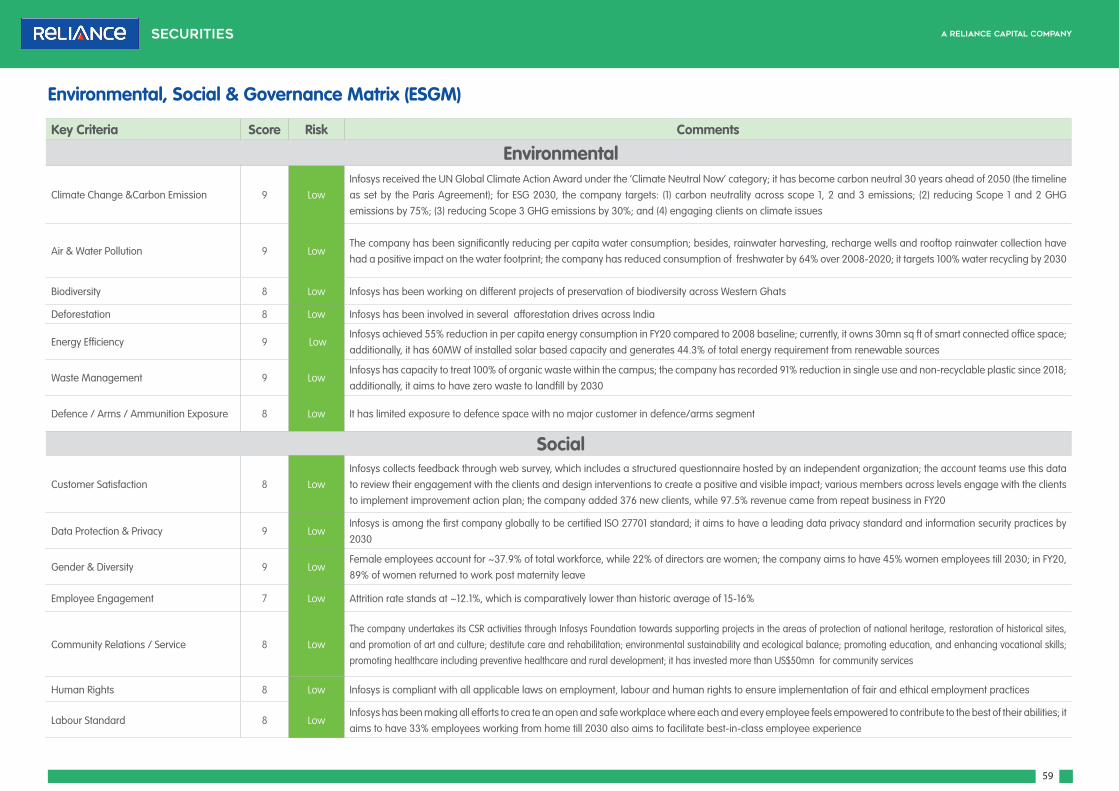
59
Key Criteria Score Risk Comments
Environmental
Climate Change &Carbon Emission 9 LowInfosys received the UN Global Climate Action Award under the ‘Climate Neutral Now’ category; it has become carbon neutral 30 years ahead of 2050 (the timeline as set by the Paris Agreement); for ESG 2030, the company targets: (1) carbon neutrality across scope 1, 2 and 3 emissions; (2) reducing Scope 1 and 2 GHG emissions by 75%; (3) reducing Scope 3 GHG emissions by 30%; and (4) engaging clients on climate issues
Air & Water Pollution 9 LowThe company has been significantly reducing per capita water consumption; besides, rainwater harvesting, recharge wells and rooftop rainwater collection have had a positive impact on the water footprint; the company has reduced consumption of freshwater by 64% over 2008-2020; it targets 100% water recycling by 2030
Biodiversity 8 Low Infosys has been working on different projects of preservation of biodiversity across Western Ghats
Deforestation 8 Low Infosys has been involved in several afforestation drives across India
Energy Efficiency 9 LowInfosys achieved 55% reduction in per capita energy consumption in FY20 compared to 2008 baseline; currently, it owns 30mn sq ft of smart connected office space; additionally, it has 60MW of installed solar based capacity and generates 44.3% of total energy requirement from renewable sources
Waste Management 9 LowInfosys has capacity to treat 100% of organic waste within the campus; the company has recorded 91% reduction in single use and non-recyclable plastic since 2018; additionally, it aims to have zero waste to landfill by 2030
Defence / Arms / Ammunition Exposure 8 Low It has limited exposure to defence space with no major customer in defence/arms segment
Social
Customer Satisfaction 8 LowInfosys collects feedback through web survey, which includes a structured questionnaire hosted by an independent organization; the account teams use this data to review their engagement with the clients and design interventions to create a positive and visible impact; various members across levels engage with the clients to implement improvement action plan; the company added 376 new clients, while 97.5% revenue came from repeat business in FY20
Data Protection & Privacy 9 LowInfosys is among the first company globally to be certified ISO 27701 standard; it aims to have a leading data privacy standard and information security practices by 2030
Gender & Diversity 9 LowFemale employees account for ~37.9% of total workforce, while 22% of directors are women; the company aims to have 45% women employees till 2030; in FY20, 89% of women returned to work post maternity leave
Employee Engagement 7 Low Attrition rate stands at ~12.1%, which is comparatively lower than historic average of 15-16%
Community Relations / Service 8 LowThe company undertakes its CSR activities through Infosys Foundation towards supporting projects in the areas of protection of national heritage, restoration of historical sites, and promotion of art and culture; destitute care and rehabilitation; environmental sustainability and ecological balance; promoting education, and enhancing vocational skills; promoting healthcare including preventive healthcare and rural development; it has invested more than US$50mn for community services
Human Rights 8 Low Infosys is compliant with all applicable laws on employment, labour and human rights to ensure implementation of fair and ethical employment practices
Labour Standard 8 LowInfosys has been making all efforts to crea te an open and safe workplace where each and every employee feels empowered to contribute to the best of their abilities; it aims to have 33% employees working from home till 2030 also aims to facilitate best-in-class employee experience
Environmental, Social & Governance Matrix (ESGM)

60
Governance
Audit Committee Structure 8 LowThe audit committee comprises of 4 members, all whom are independent directors; the committee met six times in FY20, which is more than the prescribed
norms in this regard
Bribery & Corruption 9 Low Infosys and its subsidiaries are committed to conduct its business in an ethical, legal and socially responsible manner
Executive Compensation 6 Low
The average annual increase in the salaries of employees was 7.3% in India, after accounting for promotions and other event-based compensation revisions,
while the employees outside India received a wage increase in line with the market trends of the respective countries; overall wages at leadership levels
remained constant or lower and there were no promotions in FY20 at leadership level; a majority of key managerial personnel went through increment cycle in
FY20 and received higher remuneration in FY20 compared to FY19 on account of increase in perquisite value of stock incentives, which were granted previously
but exercised during the year
Lobbying 8 Low The company is a member of multiple industry and technology bodies across different countries
Political Contribution 10 Low The company does not make any political contribution
Whistleblower Scheme 8 LowThe company has adopted a whistleblower mechanism for directors and employees to report concerns about unethical behaviour, actual or suspected fraud,
or violation of the company’s code of conduct and ethics
Total Score Out of 200 166 Low
Total Score (%) 83% Low

61
3QFY21 - Management Conference Call – Key Takeaways f The industry witnesses an increased focus on digital transformation agenda and
opening up new accounts across various sub-verticals of BFSI, which includes mortgages, regional banks, wealth and retirement services.
f During 4QFY21, company expects retail vertical to grow despite seasonal weakness. On the other side, during 3QFY21, In Communications vertical, the company witnessed improved performance although Media, OEM and Advertising remained under pressure. While Utilities vertical remained steady, Manufacturing vertical remained key highlight of the quarter, wherein the company expects superior growth in the coming quarters.
f During 3QFY21, Infosys won 22 large deals out of which 8 were in Financial Services, 4 deals each in Energy & Utility and other services vertical and Manufacturing vertical, 3 deals in Communication and 1 deal each in Retail, Hi-tech and Other segment. Geography-wise, 13 deal wins were from the US, 7 from Europe and 2 from the RoW. As per the management, the deal pipeline remains strong across verticals.
f With 33.1% YoY growth, revenue contribution from Digital services crossed 50% of total revenue. Notably, Digital is a part of all deal signings.
f It added 9,100 employees (net) in 3QFY21. Whilst voluntary attrition inched up to 10%, it is lower than the comfort band of 14-15%. The management indicated aggressive hiring in the coming quarters.
f Currently, 97% of total global workforce is working remotely. In India, ~98.3% of employees has been working remotely.
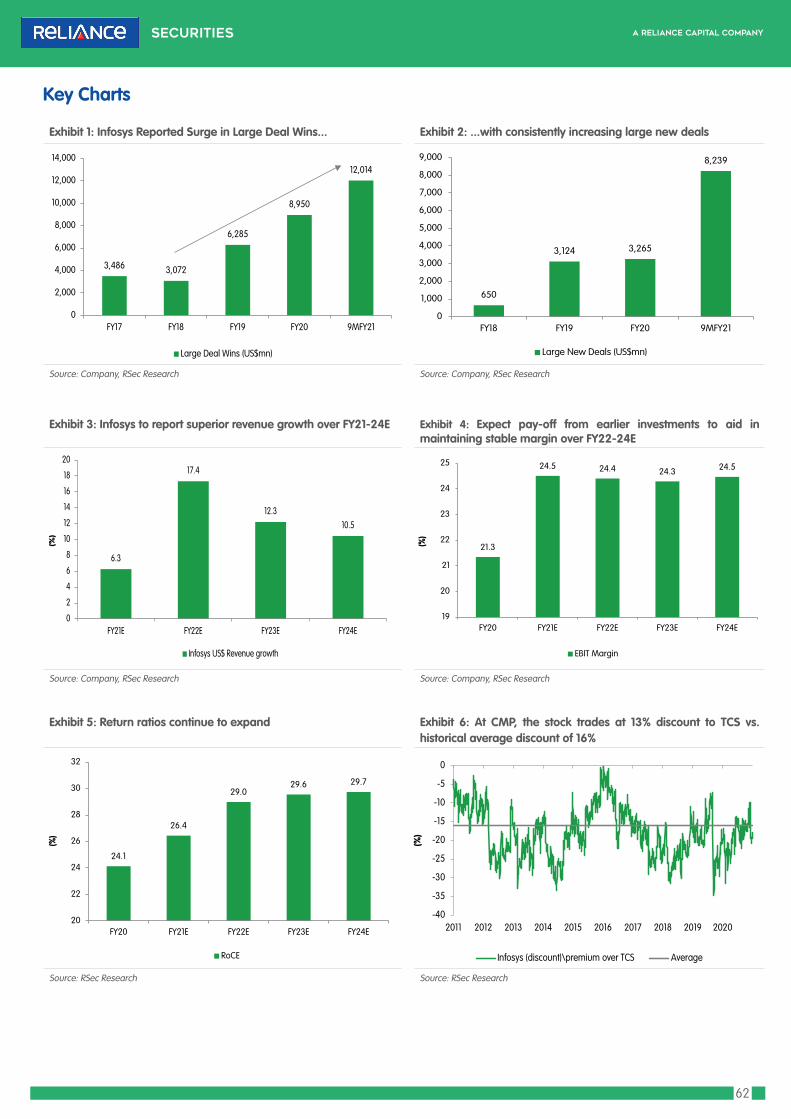
62
650
3,124 3,265
8,239
0
1,000
2,000
3,000
4,000
5,000
6,000
7,000
8,000
9,000
FY18 FY19 FY20 9MFY21
Large New Deals (US$mn)
3,486 3,072
6,285
8,950
12,014
0
2,000
4,000
6,000
8,000
10,000
12,000
14,000
FY17 FY18 FY19 FY20 9MFY21
Large Deal Wins (US$mn)
24.1
26.4
29.029.6 29.7
20
22
24
26
28
30
32
FY20 FY21E FY22E FY23E FY24E
(%)
RoCE
Exhibit 1: Infosys Reported Surge in Large Deal Wins... Exhibit 2: ...with consistently increasing large new deals
Source: Company, RSec Research Source: Company, RSec Research
Exhibit 3: Infosys to report superior revenue growth over FY21-24E Exhibit 4: Expect pay-off from earlier investments to aid in maintaining stable margin over FY22-24E
Source: Company, RSec Research Source: Company, RSec Research
Exhibit 5: Return ratios continue to expand Exhibit 6: At CMP, the stock trades at 13% discount to TCS vs. historical average discount of 16%
Source: RSec Research Source: RSec Research
Key Charts
6.3
17.4
12.310.5
0
2
4
6
8
10
12
14
16
18
20
FY21E FY22E FY23E FY24E
(%)
Infosys US$ Revenue growth
21.3
24.5 24.4 24.3 24.5
19
20
21
22
23
24
25
FY20 FY21E FY22E FY23E FY24E
(%)
EBIT Margin
-40
-35
-30
-25
-20
-15
-10
-5
0
2011 2012 2013 2014 2015 2016 2017 2018 2019 2020
(%)
Infosys (discount)\premium over TCS Average

63
Our investment thesis is based on the following premises: f Expect Superior Growth Driven by Digital Acceleration & Increasing Client Focus
f Refreshed Offerings & Step-up in Product Portfolio
f Margin is Expected to Remain Stable at 24-25% Level owing to WFH & Automation
f Aggressive Localization in the US & WFH to Change the Face of Delivery
f Solid Cash Return Policy with Improving Return Ratios
Investment Rationale
I. Expect Superior Growth Driven by Digital Acceleration & Increasing Client Focus Infosys underperformed TCS on revenue growth front in the lager part of last decade. Since 2017, new CEO has been successfully executing three year strategy with initial calibrated investments in capability, talent and localization. While Infosys’ revenue clocked 7.8% CAGR over last three years, we expect the company to report revenue growth of 13.3% over FY21E-FY24E driven by: (1) step-up in large deal wins led by improving medium-term demand; (2) acceleration in digital revenue, which contributes 50% to its total revenue now vs. 26% in FY18; and (3) focused client mining efforts.
Exhibit 7: Infosys underperformed TCS on revenue growth during FY10-FY20
Source: Company, RSec Research
Exhibit 8: Infosys to report superior revenue growth over FY21E-24E
Source: Company, RSec Research
19
21
23
25
27
29
31
0
5
10
15
20
25
30
FY10 FY11 FY12 FY13 FY14 FY15 FY16 FY17 FT18 FY19 FY20
(%)
(%)
Infosys Revenue CC growth TCS Revenue CC growth EBIT margin (RHS)
Mr. Vishal SikkaMr. S. D. Shibulal Mr. Salil Parekh
6.3
17.4
12.310.5
0
2
4
6
8
10
12
14
16
18
20
FY21E FY22E FY23E FY24E
(%)
Infosys US$ Revenue growth

64
A. Consistent Improvement in Large Deal Wins: Infosys has reported consistent improvement in large deal wins. During 9MFY21, it booked new deal wins to the tune of US$8bn, which is substantially higher (~2x ) than total deal wins in FY20. This also includes one of the largest IT deals ever closed by Indian IT industry (Daimler). Infosys, with its scale and presence in key offerings, is also likely to benefit from captive monetization efforts (ex. recent partnership with Rolls Royce) and large employee rebadging deals, which suggest higher off-shoring and vendor consolidation (flight to quality). The company has also highlighted strong deal pipeline comprising of both large and small deals. We expect the technology demand to remain strong in the medium-term, as the enterprises step up on Cloud adoption efforts. We expect better demand scenario in the next 12-18 months.
B. Exponential Rise in Revenue Share of Digital Services: Digital services now contribute >50% to the company’s total revenue compared to 25.5% in FY18. The management expects revenue share of digital services to witness further improvement led by consistent step-up in digital budgets driven by growth in newer areas such as data, cloud and security.
The company has also been consistently sharpening its digital portfolio with:
• Modernization suite and Live Enterprise Application Management Platform (parts of Cobalt and Applied AI),
• Inorganic capabilities, which include GuideVision (one of the largest ServiceNow Elite partners in Europe) and Blue Acorn (Adobe Platinum partner in the US), and
• Kaleidoscope- product firm for industrial, consumer and industrial verticals.
Notably, every large deal (that the company has closed) has some digital elements. We expect digital services budgets of global enterprises to grow by 15-20% annually over 2021-25E. Mainstreaming of digital revenue share provides a medium-term anchor for double-digit growth for Infosys, in our view.
Exhibit 9: Infosys Reported Surge in Large Deal Wins... Exhibit 10: ...with consistently increasing large new deals
Source: Company, RSec Research Source: Company, RSec Research
Exhibit 11: Digital has become new core... Exhibit 12: ...with strong double-digit growth (YoY)
Source: Company, RSec Research Source: Company, RSec Research
3,486 3,072
6,285
8,950
12,014
0
2,000
4,000
6,000
8,000
10,000
12,000
14,000
FY17 FY18 FY19 FY20 9MFY21
Large Deal Wins (US$mn)
650
3,124 3,265
8,239
0
1,000
2,000
3,000
4,000
5,000
6,000
7,000
8,000
9,000
FY18 FY19 FY20 9MFY21
Large New Deals (US$mn)
25.531.2
39.1
50.1
0
10
20
30
40
50
60
FY18 FY19 FY20 3QFY21
(%)
Digital Revenue as a % of Revenue
32.0
35.8
24.327.4
33.8
0
5
10
15
20
25
30
35
40
FY19 FY20 1QFY21 2QFY21 3QFY21
(%)
Digital Revenue Growth
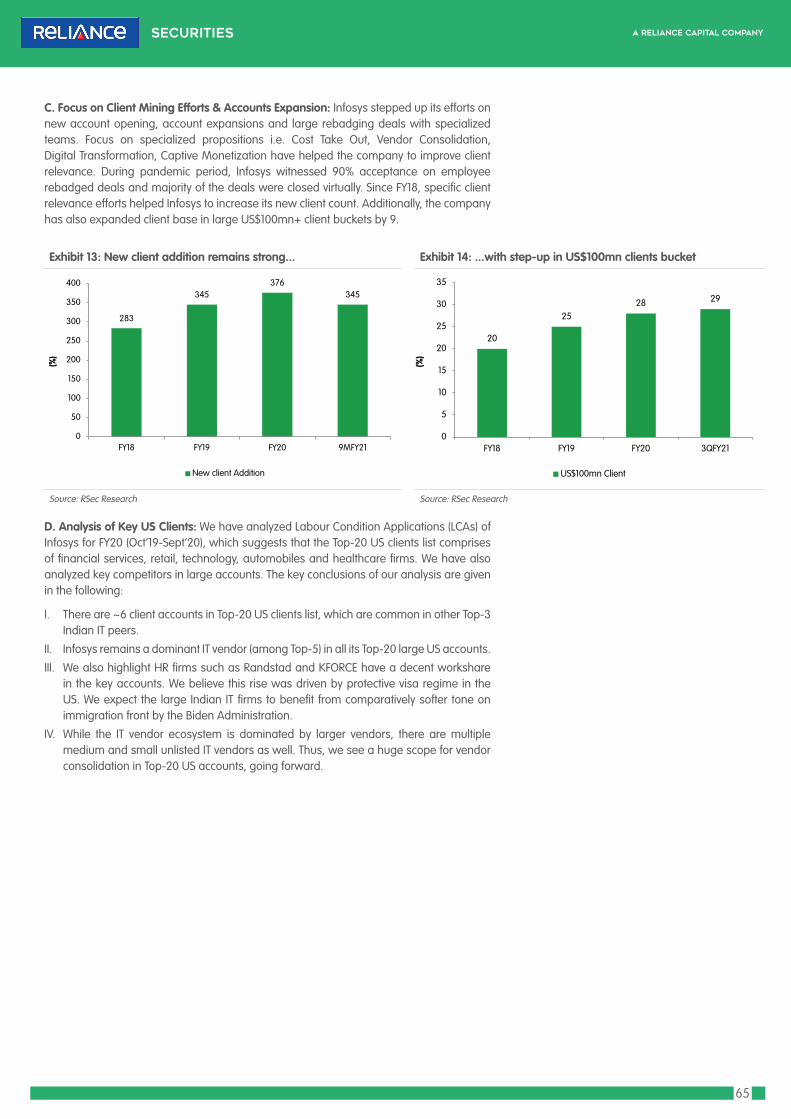
65
Exhibit 13: New client addition remains strong... Exhibit 14: ...with step-up in US$100mn clients bucket
Source: RSec Research Source: RSec Research
C. Focus on Client Mining Efforts & Accounts Expansion: Infosys stepped up its efforts on new account opening, account expansions and large rebadging deals with specialized teams. Focus on specialized propositions i.e. Cost Take Out, Vendor Consolidation, Digital Transformation, Captive Monetization have helped the company to improve client relevance. During pandemic period, Infosys witnessed 90% acceptance on employee rebadged deals and majority of the deals were closed virtually. Since FY18, specific client relevance efforts helped Infosys to increase its new client count. Additionally, the company has also expanded client base in large US$100mn+ client buckets by 9.
D. Analysis of Key US Clients: We have analyzed Labour Condition Applications (LCAs) of Infosys for FY20 (Oct’19-Sept’20), which suggests that the Top-20 US clients list comprises of financial services, retail, technology, automobiles and healthcare firms. We have also analyzed key competitors in large accounts. The key conclusions of our analysis are given in the following:
I. There are ~6 client accounts in Top-20 US clients list, which are common in other Top-3 Indian IT peers.
II. Infosys remains a dominant IT vendor (among Top-5) in all its Top-20 large US accounts.
III. We also highlight HR firms such as Randstad and KFORCE have a decent workshare in the key accounts. We believe this rise was driven by protective visa regime in the US. We expect the large Indian IT firms to benefit from comparatively softer tone on immigration front by the Biden Administration.
IV. While the IT vendor ecosystem is dominated by larger vendors, there are multiple medium and small unlisted IT vendors as well. Thus, we see a huge scope for vendor consolidation in Top-20 US accounts, going forward.
283
345376
345
0
50
100
150
200
250
300
350
400
FY18 FY19 FY20 9MFY21
(%)
New client Addition
20
2528 29
0
5
10
15
20
25
30
35
FY18 FY19 FY20 3QFY21
(%)
US$100mn Client

66
Exhibit 15: Infosys' Top 20 US Clients
Industry Peers
Technology f TCS, Wipro, Quest Global, Cognizant, Deloitte, Red Oak Technologies, DGN Technologies, Antra, Bridgenexus, Compunnel Software, Mastech, Mythri
Retail f Cognizant, TCS, Headstrong LLC, Randstad, Mastech, Genpact, Computer Software Group, deloitte, Genpact, Nemo IT, Xsell Resources, Comtek, Kforece, Zensar
Financial Services f Kforce, Luxoft, Globallogic, Prophesy, Accenture, Sierra Computer, V Soft Consulting
Utility f TCS, HCLT, E&Y, Bridgewater Consulting, Brillio, Anira Software, Cognizant
Financial Services f Atos, Cognizant, TCS, Intraedge, IBM, Mastech, Impetus, Deloitte, Humac, M3BI, Virtusa, Computer Software Group, Mindtree
Financial Services f TCS, LTI, Wipro, Iris Software, Virtusa, NTT data Services, Accenture, Mitchell/Martin, Capgemini, Maveric, Incandescent Tech, Synechron Inc, Oracle Financial Services, E&Y, Photon
Financial Services f IBM, Cognizant,Deloitte, Accenture, V3Tech Solutions, Computer Software Group
Technology f TCS, SRS Consulting, LTI, Wipro, Zensar, Tech Mahindra, Accenture, Persistent, HCLT, Cognizant, Randstad Technology, Urpan Technology, Capgemini, Enquero, Onstak
Financial Services f Wipro, Mphasis, Mastech, Compunnel Software Group, Randstad Tech, Comtek, Dots Technology, HCLT, Persistent, Eureka, M2 Source
Financial Services f Computer Software Group, Atos, Accenture, VASS, Vizplum, Clearlite, Digital Scripts, ERP Analysts, Federal Soft, Horizon Advanced Systems, IBM, Lorhan Corp, LynxTech Group, Morlogic, Quadratic Systems
Financial Services f NTT data, Randstad, Cognizant, Compunnel Software, Persistent, Diversant, Mastech, Mphasis, HCLT, Birlasoft, Deloitte, Synechron Inc
Telecom f Deloitte, Cognizant, Mastech, Kforce, Brillio, TCS, Agreeya,Techno-Comps, Marbles, GlobalLogic, Infinite Computer Solutions, HCL America, Randstad Tech, Virtusa
Energy f Wipro, HCLT, NITCO, Coglomerate IT Services, E&Y, Genuine IT
Financial Services f KFORCE, Compunnel Software, Mastech, Randstad, HCLT, Adroit, Digipulse, Anjus, Technosoft, TCS, Capgemini
Automobile f CSC Covansys, Congnizant, TCS, Deloitte, Hitachi Vantara, HCLT, Hexaware, Hinduja Tech, KFORCE, Mindtree, Photon, Cognizant, Mastech, Photon
Financial Services f CSC, Vertiv, LTI, Accenture, Deloitte, Mastech, EvonSys, Cognizant, Compunnel, EATEAM
Healthcare f Infinite Computer Solutions, Cognizant, TEKNEST, Altek, Cognizant, Concret, Dataquest, Devcare, grrenbyte, Oberon, Orgspire
Retail f KFORCE, Wipro, Cognizant, Populus, Centizen, Cloudwick, E&Y, Mastech, TCS, Centizen, Invincible Tech, Mavensoft
Services f TCS, KFORCE, Randstad, Mercury, Advanced technology Consulting, AMITI, C Vision, Dexperts, Emaestro, Nemo IT, Smart Scope Technologies, 3A Soft
Healthcare f Cognizant, Tech Mahindra, Specialty Resources, Deloitte, Virtusa, Computech
Source: RSec Research, Department of Labour (US), Note: Grey highlight denotes common Top-20 client accounts for Top-4 IT names
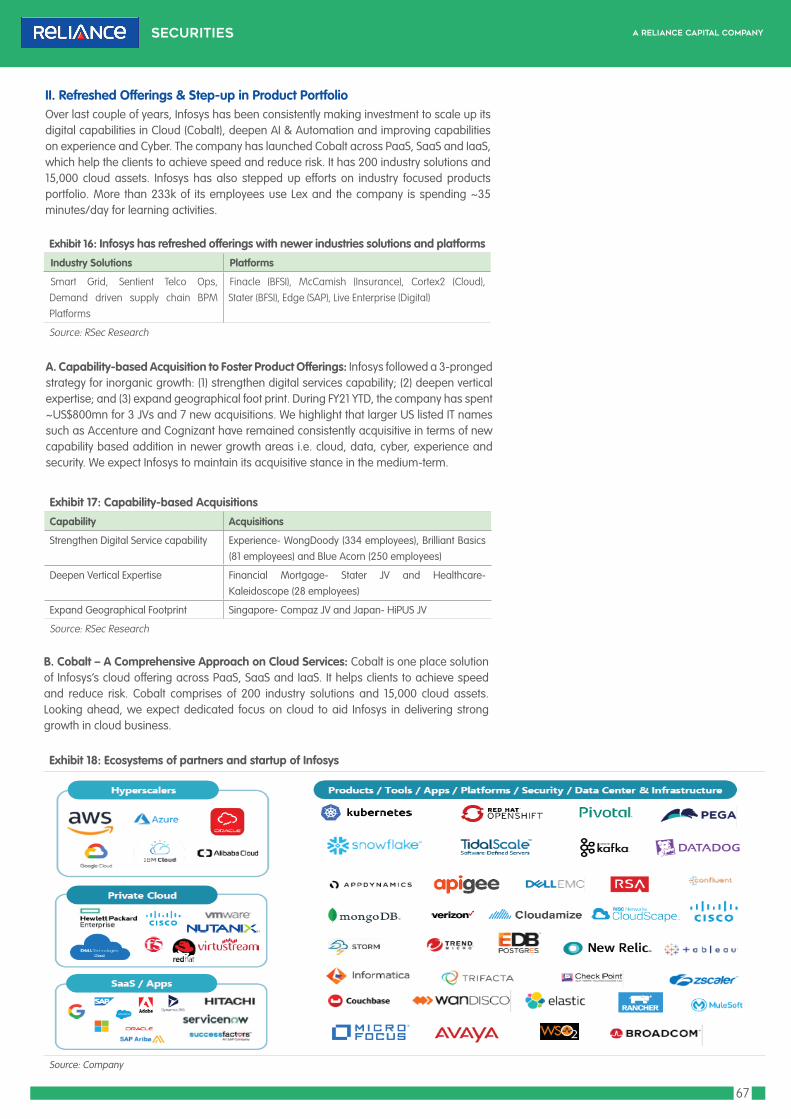
67
A. Capability-based Acquisition to Foster Product Offerings: Infosys followed a 3-pronged strategy for inorganic growth: (1) strengthen digital services capability; (2) deepen vertical expertise; and (3) expand geographical foot print. During FY21 YTD, the company has spent ~US$800mn for 3 JVs and 7 new acquisitions. We highlight that larger US listed IT names such as Accenture and Cognizant have remained consistently acquisitive in terms of new capability based addition in newer growth areas i.e. cloud, data, cyber, experience and security. We expect Infosys to maintain its acquisitive stance in the medium-term.
II. Refreshed Offerings & Step-up in Product Portfolio Over last couple of years, Infosys has been consistently making investment to scale up its digital capabilities in Cloud (Cobalt), deepen AI & Automation and improving capabilities on experience and Cyber. The company has launched Cobalt across PaaS, SaaS and IaaS, which help the clients to achieve speed and reduce risk. It has 200 industry solutions and 15,000 cloud assets. Infosys has also stepped up efforts on industry focused products portfolio. More than 233k of its employees use Lex and the company is spending ~35 minutes/day for learning activities.
Exhibit 16: Infosys has refreshed offerings with newer industries solutions and platforms
Industry Solutions Platforms
Smart Grid, Sentient Telco Ops, Demand driven supply chain BPM Platforms
Finacle (BFSI), McCamish (Insurance), Cortex2 (Cloud), Stater (BFSI), Edge (SAP), Live Enterprise (Digital)
Source: RSec Research
Exhibit 17: Capability-based Acquisitions
Capability Acquisitions
Strengthen Digital Service capability Experience- WongDoody (334 employees), Brilliant Basics (81 employees) and Blue Acorn (250 employees)
Deepen Vertical Expertise Financial Mortgage- Stater JV and Healthcare- Kaleidoscope (28 employees)
Expand Geographical Footprint Singapore- Compaz JV and Japan- HiPUS JV
Source: RSec Research
B. Cobalt – A Comprehensive Approach on Cloud Services: Cobalt is one place solution of Infosys’s cloud offering across PaaS, SaaS and IaaS. It helps clients to achieve speed and reduce risk. Cobalt comprises of 200 industry solutions and 15,000 cloud assets. Looking ahead, we expect dedicated focus on cloud to aid Infosys in delivering strong growth in cloud business.
Exhibit 18: Ecosystems of partners and startup of Infosys
Source: Company
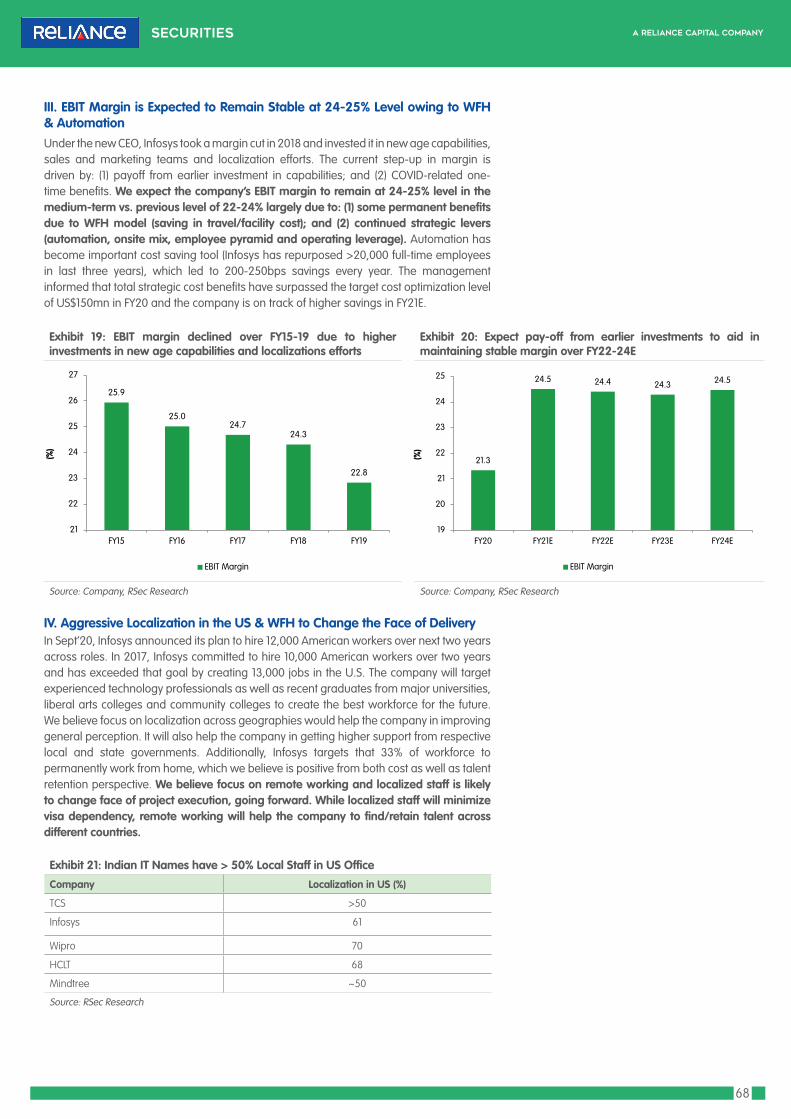
68
III. EBIT Margin is Expected to Remain Stable at 24-25% Level owing to WFH & Automation Under the new CEO, Infosys took a margin cut in 2018 and invested it in new age capabilities, sales and marketing teams and localization efforts. The current step-up in margin is driven by: (1) payoff from earlier investment in capabilities; and (2) COVID-related one-time benefits. We expect the company’s EBIT margin to remain at 24-25% level in the medium-term vs. previous level of 22-24% largely due to: (1) some permanent benefits due to WFH model (saving in travel/facility cost); and (2) continued strategic levers (automation, onsite mix, employee pyramid and operating leverage). Automation has become important cost saving tool (Infosys has repurposed >20,000 full-time employees in last three years), which led to 200-250bps savings every year. The management informed that total strategic cost benefits have surpassed the target cost optimization level of US$150mn in FY20 and the company is on track of higher savings in FY21E.
Exhibit 19: EBIT margin declined over FY15-19 due to higher investments in new age capabilities and localizations efforts
Exhibit 20: Expect pay-off from earlier investments to aid in maintaining stable margin over FY22-24E
Source: Company, RSec Research Source: Company, RSec Research
IV. Aggressive Localization in the US & WFH to Change the Face of DeliveryIn Sept’20, Infosys announced its plan to hire 12,000 American workers over next two years across roles. In 2017, Infosys committed to hire 10,000 American workers over two years and has exceeded that goal by creating 13,000 jobs in the U.S. The company will target experienced technology professionals as well as recent graduates from major universities, liberal arts colleges and community colleges to create the best workforce for the future. We believe focus on localization across geographies would help the company in improving general perception. It will also help the company in getting higher support from respective local and state governments. Additionally, Infosys targets that 33% of workforce to permanently work from home, which we believe is positive from both cost as well as talent retention perspective. We believe focus on remote working and localized staff is likely to change face of project execution, going forward. While localized staff will minimize visa dependency, remote working will help the company to find/retain talent across different countries.
Exhibit 21: Indian IT Names have > 50% Local Staff in US Office
Company Localization in US (%)
TCS >50
Infosys 61
Wipro 70
HCLT 68
Mindtree ~50
Source: RSec Research
25.9
25.024.7
24.3
22.8
21
22
23
24
25
26
27
FY15 FY16 FY17 FY18 FY19
(%)
EBIT Margin
21.3
24.5 24.4 24.3 24.5
19
20
21
22
23
24
25
FY20 FY21E FY22E FY23E FY24E
(%)
EBIT Margin
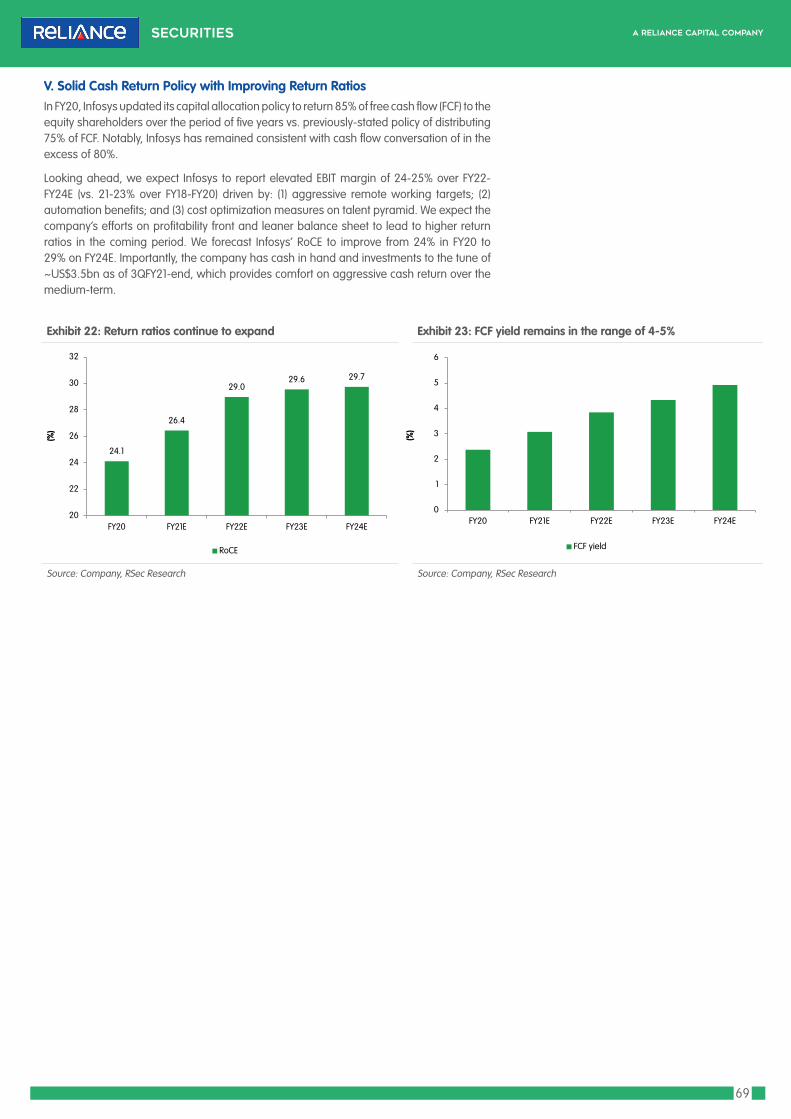
69
V. Solid Cash Return Policy with Improving Return RatiosIn FY20, Infosys updated its capital allocation policy to return 85% of free cash flow (FCF) to the equity shareholders over the period of five years vs. previously-stated policy of distributing 75% of FCF. Notably, Infosys has remained consistent with cash flow conversation of in the excess of 80%.
Looking ahead, we expect Infosys to report elevated EBIT margin of 24-25% over FY22-FY24E (vs. 21-23% over FY18-FY20) driven by: (1) aggressive remote working targets; (2) automation benefits; and (3) cost optimization measures on talent pyramid. We expect the company’s efforts on profitability front and leaner balance sheet to lead to higher return ratios in the coming period. We forecast Infosys’ RoCE to improve from 24% in FY20 to 29% on FY24E. Importantly, the company has cash in hand and investments to the tune of ~US$3.5bn as of 3QFY21-end, which provides comfort on aggressive cash return over the medium-term.
Exhibit 22: Return ratios continue to expand Exhibit 23: FCF yield remains in the range of 4-5%
Source: Company, RSec Research Source: Company, RSec Research
24.1
26.4
29.029.6 29.7
20
22
24
26
28
30
32
FY20 FY21E FY22E FY23E FY24E
(%)
RoCE
0
1
2
3
4
5
6
FY20 FY21E FY22E FY23E FY24E
(%)
FCF yield

70
Exhibit 24: Currently Infosys trades above 10-year average due to higher top line growth and margin resiliency
Exhibit 25: At CMP, the stock trades at 13% discount to TCS vs. historical average discount of 16%
Source: RSec Research, Bloomberg Source: RSec Research, Bloomberg
Outlook & ValuationLooking ahead, we expect Infosys to report superior growth vs. Top-4 Indian IT peers driven by surge in large deals and acceleration in digital revenue share. Additionally, stable management puts INFY in better place to make bolder decisions and pursue aggressive market share gain. At CMP, the stock trades at 13% discount to its larger peer i.e. TCS vs. historical average discount of 16%. We forecast INFY to witness revenue CAGR of 13.3% over FY21E-24E. The stock deserves multiple rerating considering the industry-leading EPS CAGR of 15.7% in FY21E-24E, higher EBIT margin and attractive dividend yield of 3.0% (FY24E). We initiate coverage on INFY with BUY and a 2-Year Target Price of Rs1,920 (valuing the stock at 27x PE i.e. 10% discount to TCS target multiple) on FY24E. We expect Infosys to reach market capitalization of $110bn in next 2 years.
-40
-35
-30
-25
-20
-15
-10
-5
0
2011 2012 2013 2014 2015 2016 2017 2018 2019 2020
(%)
Infosys (discount)\premium over TCS Average
5
10
15
20
25
30
2010 2011 2012 2013 2014 2015 2016 2017 2018 2019 2020 2021
BEST_PE_12M_BF AVG STDEV+1 STDEV-1

71
Key Financials
Profit & Loss StatementY/E March (Rs mn) FY19 FY20 FY21E FY22E FY23E FY24E
Net Revenues (US$ mn) 11,799 12,781 13,588 15,949 17,904 19,781
Growth (%) 7.9 8.3 6.3 17.4 12.3 10.5
Net Revenues 8,26,760 9,07,910 10,10,910 11,80,257 13,42,789 15,03,340
Growth (%) 17.2 9.8 11.3 16.8 13.8 12.0
Employee Costs & Other expenses 5,18,580 5,78,380 6,27,793 7,25,932 8,32,627 9,37,681
SG&A and Other Operating Expenses 44,750 47,120 46,388 63,062 70,807 76,274
EBITDA 2,08,890 2,22,680 2,79,137 3,22,685 3,61,833 4,05,593
EBITDA (%) 25.3 24.5 27.6 27.3 26.9 27.0
EBITDA Growth (%) 9.9 6.6 25.4 15.6 12.1 12.1
D&A 20,100 28,940 32,761 34,677 35,695 35,765
EBIT 1,88,790 1,93,740 2,46,376 2,88,008 3,26,138 3,69,828
EBIT (%) 22.8 21.3 24.4 24.4 24.3 24.6
EBIT Growth (%) 10.1 2.6 27.2 16.9 13.2 13.4
Other Income 28,830 26,340 20,972 25,340 31,522 34,490
PBT 2,17,620 2,20,080 2,67,349 3,13,348 3,57,660 4,04,319
Tax (incl deferred) 56,310 53,680 71,085 78,337 89,415 1,01,080
Exceptional 7,210 0 0 0 0 0
Minorities 0 450 580 240 240 240
PAT 1,54,100 1,65,950 1,95,684 2,34,771 2,68,005 3,02,999
PAT Growth (%) (3.9) 7.7 17.9 20.0 14.2 13.1
EPS (Rs) 35.4 38.9 46.1 55.3 63.2 71.4
EPS Growth (%) (3.9) 10.0 18.4 20.0 14.2 13.1
Balance SheetY/E March (Rs mn) FY19 FY20 FY21E FY22E FY23E FY24E
SOURCES OF FUNDS
Share Capital - Equity 21,700 21,220 21,230 21,230 21,230 21,230
Reserves & other 6,27,780 6,33,280 6,75,679 7,70,447 8,77,237 10,02,051
Total Shareholders' Funds 6,49,480 6,54,500 6,96,909 7,91,677 8,98,467 10,23,281
Total Current Liabilities 1,86,380 2,08,560 2,31,425 2,69,846 3,07,338 3,44,356
Total Debt 10,940 60,680 67,850 63,850 59,850 55,850
TOTAL SOURCES OF FUNDS 8,47,380 9,27,680 10,00,704 11,30,133 12,70,655 14,28,727
APPLICATION OF FUNDS
Fixed Assets 1,70,980 2,47,430 2,50,929 2,48,253 2,48,558 2,52,793
Other Long term assets 1,47,620 1,34,490 1,74,490 1,74,490 1,74,490 1,74,490
Total Non Current Assets 3,18,600 3,81,920 4,25,419 4,22,743 4,23,048 4,27,283
Accounts Receivable 1,48,270 1,84,870 1,91,104 2,23,117 2,53,842 2,84,193
Cash & Bank 2,61,950 2,33,040 2,19,655 2,96,136 3,79,392 4,79,191
Other Current Assets 1,18,560 1,27,850 1,64,526 1,88,138 2,14,374 2,38,061
Total Current Assets 5,28,780 5,45,760 5,75,284 7,07,391 8,47,608 10,01,444
TOTAL APPLICATION OF FUNDS 8,47,380 9,27,680 10,00,704 11,30,133 12,70,655 14,28,727

72
Cash Flow StatementY/E March (Rs mn) FY19 FY20 FY21E FY22E FY23E FY24E
PBT 2,10,410 2,20,070 2,67,349 3,13,348 3,57,660 4,04,319
Non-operating & EO items (9,260) (9,800) (580) (240) (240) (240)
Depreciation 20,110 28,930 32,761 34,677 35,695 35,765
Working Capital Change (4,530) (23,670) (15,525) (16,964) (19,229) (16,779)
Income Tax paid 68,320 45,500 71,085 78,337 89,415 1,01,080
Cash Flow from Operations (a) 1,48,410 1,70,030 2,12,920 2,52,484 2,84,471 3,21,984
Capex (24,450) (33,070) (36,260) (32,000) (36,000) (40,000)
Other 15,570 19,290 (40,000) 0 0 0
Change in Investments 3,130 11,390 0 0 0 0
Cash Flow from Investing (b) (5,750) (2,390) (76,260) (32,000) (36,000) (40,000)
Debt Issuance/(Repaid) 0 (5,710) 0 0 0 0
Share capital Issuance/(buyback)/Dividend/Others
(1,45,120) (1,70,200) (1,46,105) (1,44,003) (1,65,215) (1,82,185)
Cash Flow from Financing (c) (1,45,120) (1,75,910) (1,46,105) (1,44,003) (1,65,215) (1,82,185)
NET CASH FLOW (a+b+c) (2,460) (8,270) (9,445) 76,481 83,256 99,799
Free Cash Flow 1,23,960 1,36,960 1,76,660 2,20,484 2,48,471 2,81,984
Key RatiosY/E March FY19 FY20 FY21E FY22E FY23E FY24E
Profitability (%)
EBITDA Margin 25.3 24.5 27.6 27.3 26.9 27.0
EBIT Margin 22.8 21.3 24.4 24.4 24.3 24.6
APAT Margin 18.6 18.3 19.4 19.9 20.0 20.2
RoE 23.7 25.4 28.9 31.5 31.7 31.5
RoCE 23.4 24.1 26.4 29.0 29.6 29.7
RoA 18.7 18.7 20.3 22.0 22.3 22.4
Efficiency
Tax Rate (%) 25.9 24.4 26.6 25.0 25.0 25.0
Debtors (days) 65 74 69 69 69 69
Paybles (days) 12 18 18 18 18 18
FCF/NI (%) 80.4 82.5 90.3 93.9 92.7 93.1
Net Debt/EBITDA (x) (1.2) (0.8) (0.5) (0.7) (0.9) (1.0)
Net Debt/Equity (x) (0.4) (0.3) (0.2) (0.3) (0.4) (0.4)
Per Share Data (Rs)
EPS 35.4 38.9 46.1 55.3 63.2 71.4
DPS 24.6 17.5 30.0 33.0 38.0 42.0
BVPS 149.2 150.4 160.1 181.9 206.4 235.1
FCF 28.5 31.5 40.6 50.7 57.1 64.8
Valuation (x)
P/E 34.3 35.6 30.1 25.1 22.0 19.4
P/BV 9.3 9.0 8.4 7.4 6.5 5.8
EV/EBITDA 30.2 27.9 22.1 19.4 17.5 15.8
FCF/EV (%) 2.0 2.2 2.9 3.5 3.9 4.4
FCF/mkt cap (%) 2.1 2.3 3.0 3.7 4.2 4.8
Dividend Yield (%) 1.8 1.3 2.2 2.4 2.7 3.0

73
Company BackgroundInfosys is Bangalore based Indian multinational corporation that provides business consulting, information technology and outsourcing services. Its key services include: application development, product co-development and system implementation/system engineering. Infosys has specialized expertise in insurance, banking, telecommunication and manufacturing sectors. The company, which generated $12.8bn revenue in FY20, employs 2,42,371 people.
Management TeamName Designation Brief Profile
Mr. Salil Parekh CEO & MD Mr. Parekh has nearly three decades of experience in global IT services industry with a strong track record of driving digital transformation for enterprises, executing business turnarounds and managing successful acquisitions. He holds masters degree in Computer Science and Mechanical Engineering from Cornell University.
Mr. Pravin Rao COO & Whole-time Director
Mr. Rao has over 33 years of industry experience. Since joining Infosys in 1986, he held a number of senior leadership roles, including interim CEO & MD, Head of Infrastructure Management Services, Delivery Head for Europe and Head of Retail, Consumer Packaged Goods, Logistics and Life Sciences. Mr. Rao holds a degree in Electrical Engineering from Bangalore University.
Mr. Nilanjan Roy CFO Mr. Roy, who earlier served as the global CFO of Bharti Airtel, is responsible for finance function across India and Africa. Prior to Bharti Airtel, he worked with Unilever for 15 years. He has a Bachelor of Commerce (Hons.) from Delhi University and is a Chartered Accountant.
Source: RSec Research
Exhibit 26: Geography-wise Revenue Break-up Exhibit 27: Vertical-wise Revenue Break-up
Source: Company, RSec Research Source: Company, RSec Research
61.5%
24.0%
2.9% 11.6%
North America Europe India RoW
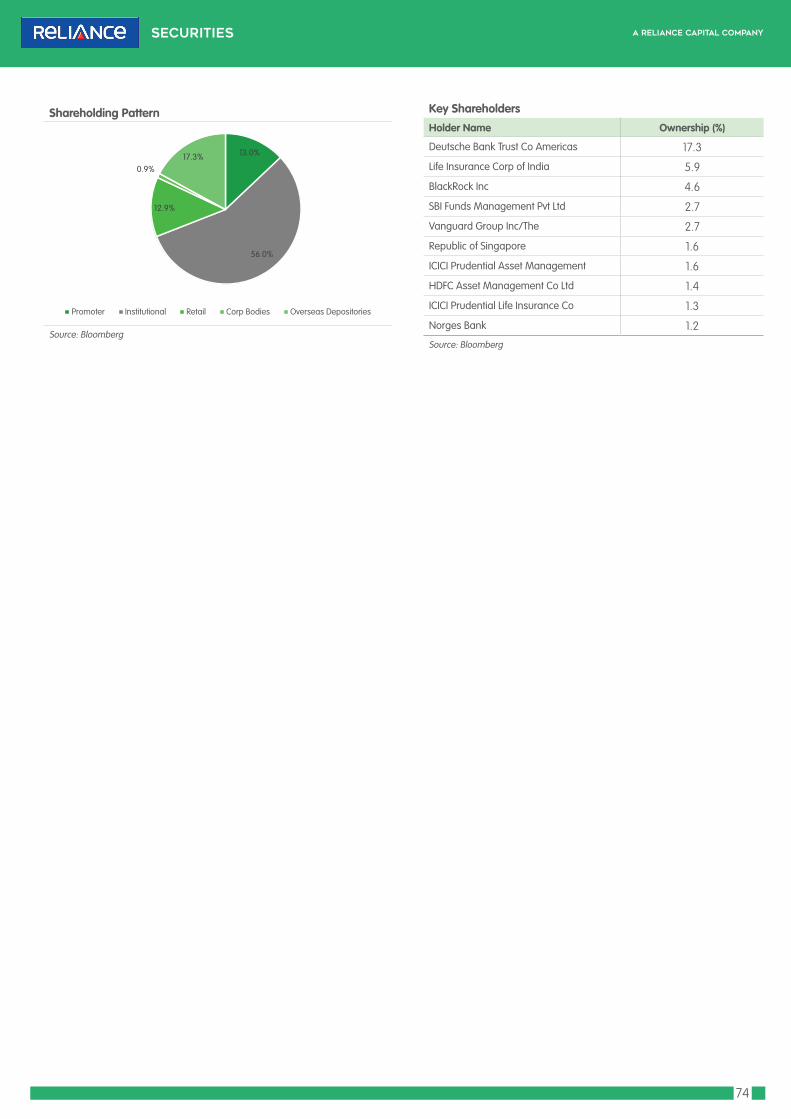
74
13.0%
56.0%
12.9%
0.9%17.3%
Promoter Institutional Retail Corp Bodies Overseas Depositories
Key Shareholders
Holder Name Ownership (%)
Deutsche Bank Trust Co Americas 17.3
Life Insurance Corp of India 5.9
BlackRock Inc 4.6
SBI Funds Management Pvt Ltd 2.7
Vanguard Group Inc/The 2.7
Republic of Singapore 1.6
ICICI Prudential Asset Management 1.6
HDFC Asset Management Co Ltd 1.4
ICICI Prudential Life Insurance Co 1.3
Norges Bank 1.2Source: Bloomberg
Shareholding Pattern
Source: Bloomberg

75
HCL Technologies IT | India
Institutional Equity Research
Initiating Coverage | 31 March 2021
BUY2 Year Target Price: Rs.1,320
CMP* (Rs) 995
Upside/ (Downside) (%) 33
Bloomberg Ticker HCLT IN
Market Cap. (Rs bn) 2,700
Free Float (%) 39.7
Shares O/S (mn) 2,714
Share price (%) 1 mth 3 mth 12 mth
Absolute performance 7.0 5.9 128.2
Relative to Nifty 6.4 (0.3) 55.5
Shareholding Pattern (%) Sept'20 Dec'20
Promoter 60.3 60.3
Public 39.7 39.7
1 Year Stock Price Performance
Note: * CMP as on 30 March 2021
Balanced Portfolio at Attractive Risk Reward Benefit
Key Financials
Y/E March (Rs mn) FY19 FY20 FY21E FY22E FY23E FY24E
Revenue 6,04,280 7,06,780 7,54,112 8,58,313 9,67,190 10,79,027
EBIT 1,18,210 1,38,530 1,59,546 1,75,096 1,95,372 2,17,964
PAT 99,640 1,11,080 1,32,066 1,41,520 1,59,182 1,79,645
EPS (Rs) 36.7 41.0 48.7 52.4 58.9 66.4
EBIT Margin (%) 19.6 19.6 21.2 20.4 20.2 20.2
PE (x) 27.1 24.3 20.4 19.0 16.9 15.0
P/BV (x) 6.4 5.5 4.6 4.0 3.6 3.1
Source: Company, RSec Research
1. HCL Technologies (HCLT) offers an integrated portfolio of products and services through three business units i.e. (1) IT and Business Services (ITBS); (2) Engineering and R&D Services (ERS); and (3) Products & Platforms (P&P).
2. We expect HCLT’s revenue to clock 11.7% CAGR over FY21E-FY24E driven by: (1) consistent transformational deal wins; (2) structured blueprint across Mode 1-2-3 strategy; (3) alliance network in Cloud ecosystem; and (4) broad-based IP and products base.
3. HCLT is key beneficiary of hybrid Cloud migration with its multi-decade experience in IMS offerings and strong ecosystem partnerships.
4. Additionally, the company follows acquisitive capital allocation policy and has spent US$2.1bn during the last 3 years on acquisitions, which we expect to accelerate inorganic capability building and market share gain.
5. We forecast its EBIT margin to remain at ~20% over FY22E-FY24E driven by increasing share of high-margin Mode 3 business, remote working/hybrid working model, automation and cost-efficiency benefits.
ESG Analysis: While analyzing 20 key criteria (10 points each) under ESG Matrix, we have assigned an overall score of 75% to HCLT. Under “Environmental Head”, we have assigned 77% score, as the company mulls reducing carbon emission and reducing water and air pollution. Under “Social Head”, we have assigned 70% score, as the company scores high on customer satisfaction and data protection and privacy. Under “Governance Head”, we have assigned 80% score in light of high score on political contribution and executive compensation front (please refer to page no. 79 for detailed ESG analysis).
Outlook & ValuationOver the 12 months, the stock outperformed the NIFTY by 56%. Going ahead, we expect HCLT to report solid revenue recovery over FY21E-FY24E driven by consistent transformation deal wins, multi-decade experience in IMS/Cloud services offerings and rising share of P&P business. At CMP, the stock trades at 15x of FY24E EPS, which is 37% discount to larger peers Infosys and TCS against historical 22% discount. We initiate coverage on HCLT with BUY and a 2-Year Target Price of Rs1,320 (valuing the stock at 20x PE of FY24E earnings), which implies 33% upside from the current level.
Key TriggersConsistent growth leader; revenue to witness strong growth over FY22-24E
Well-diversified offerings across verticals, geographies and service lines
Key beneficiary of hybrid Cloud migration with strong IMS/Cloud offerings
Acquisitive capital allocation to drive accelerated market share gain
Attractive valuation; 37% discount to large peers
Research Analyst: Suyog Kulkarni, CFA
Contact : (022) 4303 4000 / 9890966735Email : [email protected]
Research Associate: Chaitanya Panchmatia
Contact : (022) 4303 4000 / 8080782900Email : [email protected]
300
400
500
600
700
800
900
1,000
1,100
1,200
Mar
-20
Apr
-20
May
-20
Jun-
20
Jul-2
0
Aug
-20
Sep-
20
Oct
-20
Nov
-20
Dec
-20
Jan-
21
Feb-
21
Mar
-21
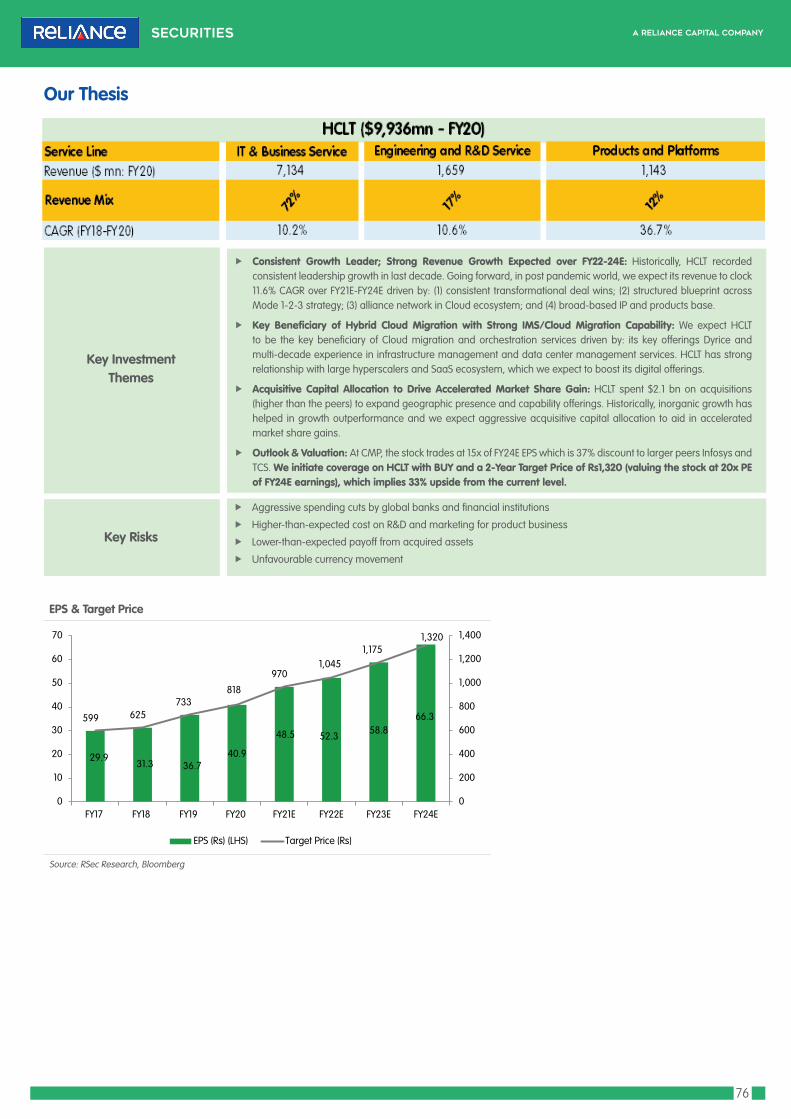
76
Our Thesis
f Consistent Growth Leader; Strong Revenue Growth Expected over FY22-24E: Historically, HCLT recorded consistent leadership growth in last decade. Going forward, in post pandemic world, we expect its revenue to clock 11.6% CAGR over FY21E-FY24E driven by: (1) consistent transformational deal wins; (2) structured blueprint across Mode 1-2-3 strategy; (3) alliance network in Cloud ecosystem; and (4) broad-based IP and products base.
f Key Beneficiary of Hybrid Cloud Migration with Strong IMS/Cloud Migration Capability: We expect HCLT to be the key beneficiary of Cloud migration and orchestration services driven by: its key offerings Dyrice and multi-decade experience in infrastructure management and data center management services. HCLT has strong relationship with large hyperscalers and SaaS ecosystem, which we expect to boost its digital offerings.
f Acquisitive Capital Allocation to Drive Accelerated Market Share Gain: HCLT spent $2.1 bn on acquisitions (higher than the peers) to expand geographic presence and capability offerings. Historically, inorganic growth has helped in growth outperformance and we expect aggressive acquisitive capital allocation to aid in accelerated market share gains.
f Outlook & Valuation: At CMP, the stock trades at 15x of FY24E EPS which is 37% discount to larger peers Infosys and TCS. We initiate coverage on HCLT with BUY and a 2-Year Target Price of Rs1,320 (valuing the stock at 20x PE of FY24E earnings), which implies 33% upside from the current level.
Key Investment Themes
Key Risks
f Aggressive spending cuts by global banks and financial institutions
f Higher-than-expected cost on R&D and marketing for product business
f Lower-than-expected payoff from acquired assets
f Unfavourable currency movement
EPS & Target Price
Source: RSec Research, Bloomberg
29.931.3 36.7
40.9
48.5 52.3 58.866.3599 625
733818
9701,045
1,1751,320
0
200
400
600
800
1,000
1,200
1,400
0
10
20
30
40
50
60
70
FY17 FY18 FY19 FY20 FY21E FY22E FY23E FY24E
EPS (Rs) (LHS) Target Price (Rs)

77
Price Sensitivity AnalysisEPS (Rs) Growth (%) FWD PE (x) 18 19 20 21
FY17 29.9 33.2 539 569 599 629
FY18 31.3 4 31.8 563 594 625 657
FY19 36.7 17 27.1 660 696 733 770
FY20 40.9 12 24.3 736 777 818 859
FY21E 48.5 19 20.5 873 921 970 1,018
FY22E 52.3 8 19.0 941 993 1,045 1,097
FY23E 58.8 12 16.9 1,058 1,117 1,175 1,234
FY24E 66.3 13 15.0 1,194 1,260 1,320 1,393
Source: Company, RSec Research
Price Target ScenarioParticulars Bull Base BearRevenue CAGR (FY21E-FY24E) (%) 14.0 11.8 7.5
EPS CAGR (FY21E-FY24E) (%) 16.2 10.9 7.0
FY24E EPS (Rs) 76.4 66.4 59.6
Target P/E multiple (x) 23.0 20.0 16.0
2-yr Target Price (Rs) 1,756 1,320 954
Upside/Downside (%) 76.5 32.7 (4.1)Source: Company, RSec Research
Scenario AnalysisBase Case: In Base Case scenario, we expect the Indian IT services industry to witness high single to double-digit growth over FY21E-FY24E. We expect HCLT to clock 10.9% EPS CAGR on the back of 11.8% CAGR in USD revenue over the same period. Assuming target multiple of 20x on FY24E EPS, we arrive at a target price of Rs.1320, which is 33% higher than the CMP.
Bull Case: In Bull Case scenario, we expect the Indian IT services industry to witness double-digit growth over FY21E-FY24E. We expect HCLT to clock 16.2% EPS CAGR on the back of 14% CAGR in USD revenue over the same period. Assuming target multiple of 23x on FY24E EPS, we arrive at a target price of Rs.1,756, which is 77% higher than the CMP.
Bear Case: In Bear Case scenario, we expect the Indian IT services industry to witness mid to high single digit growth over FY21E-FY24E. We expect HCLT to clock 7% EPS CAGR on the back of 7.5% CAGR in USD revenue over the same period. Assuming target multiple of 16x on FY24E EPS, we arrive at a target price of Rs954, which is 4% lower than the CMP.

78
Key Criteria Score Risk Comments
Management Quality 8 LowThe management is stable, diversified and experienced in the field of IT, technology and finance; HCLT is one of the best managed IT services companies in the world
Promoter's Holding Pledge 10 LowPromoter group includes founder Mr. Shiv Nadar and his family. Promoter group owns 60.3% of HCLT. There is no pledge of shares by promoter group. We don't expect promoter group to dilute their stake in the medium term
Board of Directors Profile 8 LowIts board comprises of members from diverse background i.e. technology, engineering and finance; every sub-committee within the board has at least one independent director as member
Industry Growth 7 LowIndian IT industry is likely to witness high single to double-digit growth in the medium-term; Indian IT-BPM industry continues to clock 9.7% CAGR since FY08 (pre-GFC level); notably, the share of Indian IT industry in global IT spends more than doubled from 8.4% in FY08 to 18.5% in FY20;
Regulatory Environment / Risk 8 LowAs the IT companies are not regulated by the government/regulators, there is limited regulatory risk; however, key regulatory risks for the Indian IT companies are: worsening of global immigration policies, privacy and intellectual property rights and Indian SEZ acts etc.
Entry Barriers / Competition 8 Low IT services industry is fragmented with multiple players; large-cap companies enjoy scale benefits vs. their mid-cap peers
New Business/Client Potential 8 LowHCLT has remained consistent growth outperformer; we expect strong organic growth potential due to solid Cloud/IMS capabilities; we also expect strong inorganic client addition due to acquisitive capital allocation
Business Diversification 9 LowHCLT’s portfolio is well-diversified; it receives 21.4% of revenue from BFSI vertical, 35.9% from Hi-tech-Manufacturing, 10.5% from Retail, 13.6% from Lifescience, 18.3% from Media, Publishing and Entertainment
Market Share Potential 7 Low We expect HCLT’s revenue to grow by 11.7% over FY21-FY24E, which is ahead of the industry’s growth rate
Margin Expansion Potential 7 Low EBIT is likely to improve by 60bps from the FY20 level in FY24E on the back of cost-efficiency measures and no one-off cost
Earnings Growth 7 Low EPS is expected to clock 10.9% CAGR over FY21-24E in line with 11% CAGR over FY17-FY20
Balance Sheet Strength 10 Low Strong balance sheet with almost no debt and net cash and investments of ~US$2.2bn
Debt Profile 7 LowHCLT company has cash and bank balance in the excess of US$2.6bn; with negligible debt on balance sheet of US$400mn, it is likely to sustain net cash position
FCF Generation/NWC 9 Low HCLT reported a consistent FCF conversation of 80% over past three years; we expect FCF conversation to remain strong, going forward as well
Dividend Policy 8 Low Dividend yield is pegged at ~3.4% in FY24E, which looks attractive
Total Score Out of 150 121
Average Score (%) 80% Low
Investment Decision Matrix (IDM)
Score For < 5 Red High Risk For 5 Blue Medium Risk For > 5 Green Low Risk
Total Score (%) For < 50 Red High Risk For 50 Blue Medium Risk For > 50 Green Low Risk

79
Key Criteria Score Risk Comments
Environmental
Climate Change &Carbon Emission 8 LowUnder the environment pillar of HCL Uday, HCLT strengthened efforts to protect, restore and enhance diminishing green cover, biodiversity, water bodies and responding to climate change in a holistic manner; HCLT has reduced carbon footprint by 27,575 tCO2 driven by renewable power purchase and efficient utilization of cooling system
Air & Water Pollution 10 LowUse of auto chemical dozing, treated sewage water for flushing, use of 3 LPM water aerators in hand wash taps as well as rainwater to conservation of ground water to the tune of 87,163 KL in FY20
Biodiversity 8 Low HCLT works on different biodiversity projects relating to environment, trees and water bodies
Deforestation 8 LowCumulatively, 103,284 trees were planted in schools, residential spaces and public spaces and at the urban forest sites known as Uday Upvan and 67 water bodies were also taken up for restoration and rejuvenation; the Environment vertical is now known as ‘Harit - the Green Spaces Initiative’
Energy Efficiency 7 LowHCLT has installed solar hot water of 250-LPD capacity in Feb’19 at one of facilities in Madurai region, which preserves 3.2MWH of electric energy required from conventional sources; energy saving was worked out in comparison to conventional method of electrical heating and was tracked till one year of completion of the activity; HCLT also buys some part of electricity from renewable sources
Waste Management 7 Low
New Initiative – Clean NOIDA is an HCL Foundation initiative started in 2019, which carries out works and services to implement effective solid waste management in partnership with Noida Development Authority; this initiative aims to transform the city into a litter and waste-free region, covering 90 Residential Welfare Associa-tions (RWAs) and 64 urban villages with major focus on capacity building of relevant stakeholders, intensive behaviour change campaigns, awareness drives and technological solutions
Defence / Arms / Ammunition Exposure 6 Low Limited exposure to defence. HCLT works with clients such as Boeing and Collins Aerospace
SocialCustomer Satisfaction 8 Low The company has 8 customer cases as on Mar’20; it regularly conducts customer satisfaction survey as well
Data Protection & Privacy 8 LowHCL has established a comprehensive Risk & Compliance organization that provides global analysis, assessment, policy and governance for risks related to information security, privacy, business continuity, third party engagements and operational activities; it has put in place a comprehensive global regulatory compliance framework to track regulatory compliances globally
Gender & Diversity 7 LowFemale employees account for ~26.8% of HCLT’s total workforce; the company has seen 30% YoY increase women in senior leadership in FY20; gender diversity ratio of senior leadership stood at 7.5% in FY20 from 5.4% in FY19
Employee Engagement 5 MediumAttrition rate stands at 10.2% in 3QFY21; in FY20, HCLT invested 4.1mn hours in training; it imparted generic skills training to 82,675 employees, out of whom 34,707 employees were trained on digital skills HCLT has highlighted that attrition is likely to go up in coming quarters. We will remain watchful on attrition and employee engagement levels of recently acquired IBM product business
Community Relations / Service 7 Low
HCL Foundation, the CSR arm of HCL Technologies, continues to work toward positive transformative shift in the lives of vulnerable communities in India and around the world; through its flagship initiatives i.e. HCL Samuday, HCL Grant and HCL Uday, the HCL Foundation impacted >1.5mn people, creating opportunities to break the cycle of poverty through Early Childhood Care and Development (ECCD), Education, Health, Livelihoods, Water Sanitation & Hygiene (WASH) and Disaster Risk Reduction and Response (DRR) verticals in rural and urban communities; as many as 3,375 volunteers and 13,776 participants have been engaged till now through various events
Environmental, Social & Governance Matrix (ESGM)
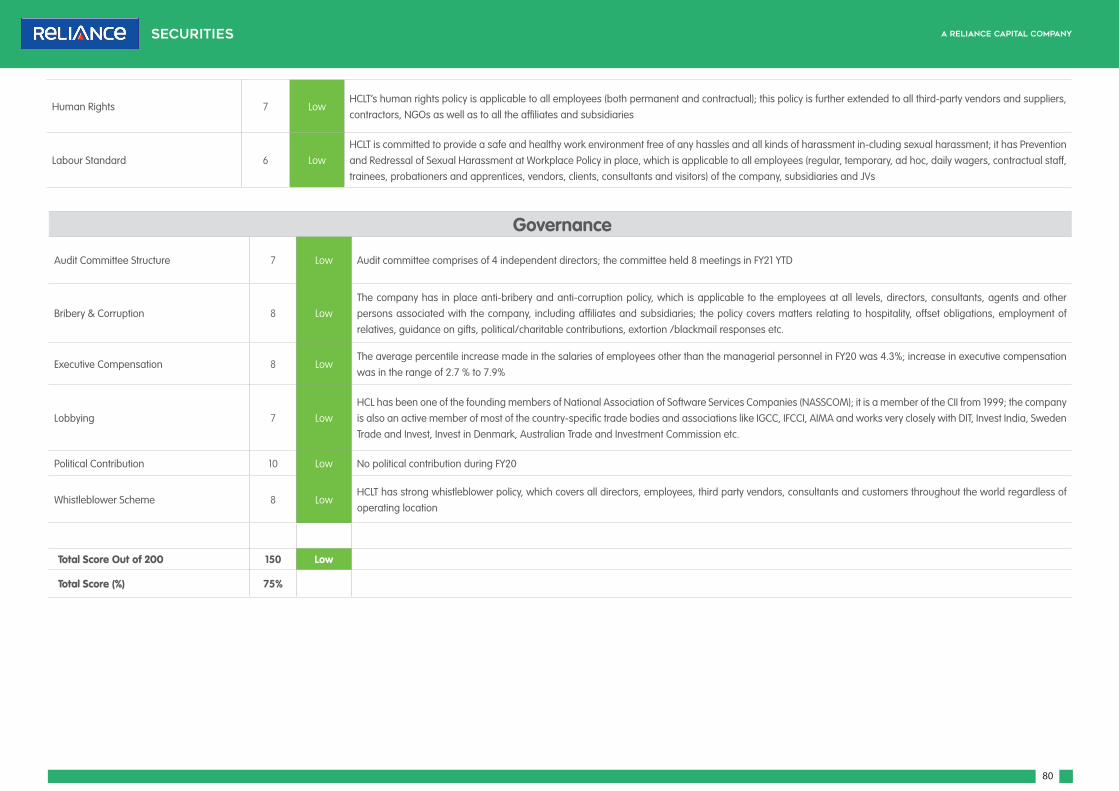
80
Governance
Audit Committee Structure 7 Low Audit committee comprises of 4 independent directors; the committee held 8 meetings in FY21 YTD
Bribery & Corruption 8 LowThe company has in place anti-bribery and anti-corruption policy, which is applicable to the employees at all levels, directors, consultants, agents and other persons associated with the company, including affiliates and subsidiaries; the policy covers matters relating to hospitality, offset obligations, employment of relatives, guidance on gifts, political/charitable contributions, extortion /blackmail responses etc.
Executive Compensation 8 LowThe average percentile increase made in the salaries of employees other than the managerial personnel in FY20 was 4.3%; increase in executive compensation was in the range of 2.7 % to 7.9%
Lobbying 7 LowHCL has been one of the founding members of National Association of Software Services Companies (NASSCOM); it is a member of the CII from 1999; the company is also an active member of most of the country-specific trade bodies and associations like IGCC, IFCCI, AIMA and works very closely with DIT, Invest India, Sweden Trade and Invest, Invest in Denmark, Australian Trade and Investment Commission etc.
Political Contribution 10 Low No political contribution during FY20
Whistleblower Scheme 8 LowHCLT has strong whistleblower policy, which covers all directors, employees, third party vendors, consultants and customers throughout the world regardless of operating location
Total Score Out of 200 150 Low
Total Score (%) 75% Low
Human Rights 7 LowHCLT’s human rights policy is applicable to all employees (both permanent and contractual); this policy is further extended to all third-party vendors and suppliers, contractors, NGOs as well as to all the affiliates and subsidiaries
Labour Standard 6 LowHCLT is committed to provide a safe and healthy work environment free of any hassles and all kinds of harassment in-cluding sexual harassment; it has Prevention and Redressal of Sexual Harassment at Workplace Policy in place, which is applicable to all employees (regular, temporary, ad hoc, daily wagers, contractual staff, trainees, probationers and apprentices, vendors, clients, consultants and visitors) of the company, subsidiaries and JVs
81
3QFY21 - Management Conference Call – Key Takeaways f Massive acceleration was seen in investments across industries for digital transformation
in value chain, omni-channel transformation, supply chain improvement and new products.
f The companies are rethinking about (1) the platforms in which they can deliver services; (2) modernizing the platforms using SAAS and cloud native capabilities; and (3) building Application Programming Interfaces (APIs) to integrate with the ecosystem with new products and services.
f The management expects growth acceleration in next 5 years vs. high single-digit growth during last few years.
f The management sees pent-up demand in most impacted sector i.e. Manufacturing and Retail. The businesses, which have done well during pandemic-led lockdown, are the bold bets. Media & Technology witnessed substantial positive impact due to one-time activity.
f The company added 4,022 freshers during 3QFY21 and plans to add >5,000 freshers in the coming quarter. It has highlighted that 90% of hiring happened on offshore side.
f HCLT has booked 13 transformation deals. TCV increased 13% YoY. As pipeline remains very strong, further acceleration will be seen, going ahead.
f The company expects lower margin in 4QFY21E owing to: (1) salary hike (80-90bps impact); and (2) one-time benefit during 3QFY21 (40bps impact)
f Attrition, which was at record low of 10.5% in 3QFY20, is expected to inch up in the coming quarter.

82
31.228.7
24.4 24.1
0
5
10
15
20
25
30
35
TCS HCL Infosys Wipro
(%)
Revenue Contribution Europe
Key Charts
Deal Pipeline
3QFY20Qualified pipeline is at an all-time high in the recent past and the company
expects higher conversion of pipeline to booking this quarter
4QFY20 Reduction in pipeline vs. previous quarter. It will improve next quarter
1QFY21Pipeline increased 40% QoQ driven by Life Sciences, Financial Services and
Tech, Energy & Auto segments
2QFY21 Pipeline grew by 20% QoQ to a record high.
3QFY21
TCV signed witnessed 13% YoY rise vs. 3QFY20. Deal pipeline remains very
strong. The company expects further acceleration of bookings in the coming
quarters.
Exhibit 1: HCLT reported one of the best revenue growth rates in last decade...
Exhibit 2: ...growth momentum expected to sustain over FY21-FY24E
Source: Company, Rsec Research Source: Company, Rsec Research
Exhibit 3: Deal commentary remains buoyant Exhibit 4: Both TCS and HCLT enjoy high revenue exposure to under-penetrated Europe region
Source: Company, Rsec Research Source: Company, Rsec Research
Exhibit 5: EBIT margin is likely to remain stable given increasing contribution of Mode-3 to top-line
Exhibit 6: Currently, HCLT trades at 37% discount to larger peers
Source: Rsec Research Source: RSec Research, Bloomberg
13.912.9
10.3
9.0
6.5
4
6
8
10
12
14
16
HCLT TCS Infosys IndustryRevenue
Wipro
(%)
HCLT TCS Infosys Industry Revenue Wipro
15.1
2.4
14.0
11.210.1
0
2
4
6
8
10
12
14
16
FY20 FY21E FY22E FY23E FY24E
(%)
USD Revenue Growth Rate
19.6
21.2
20.420.2 20.2
19
19
20
20
21
21
22
FY20 FY21E FY22E FY23E FY24E
(%)
EBIT Margin
-60
-50
-40
-30
-20
-10
02010 2011 2012 2013 2014 2015 2016 2017 2018 2019 2020 2021
(%)
(Discount)/Premium Over 1 YR Forward PE of TCS and Infosys
Average (Discount)/Premium
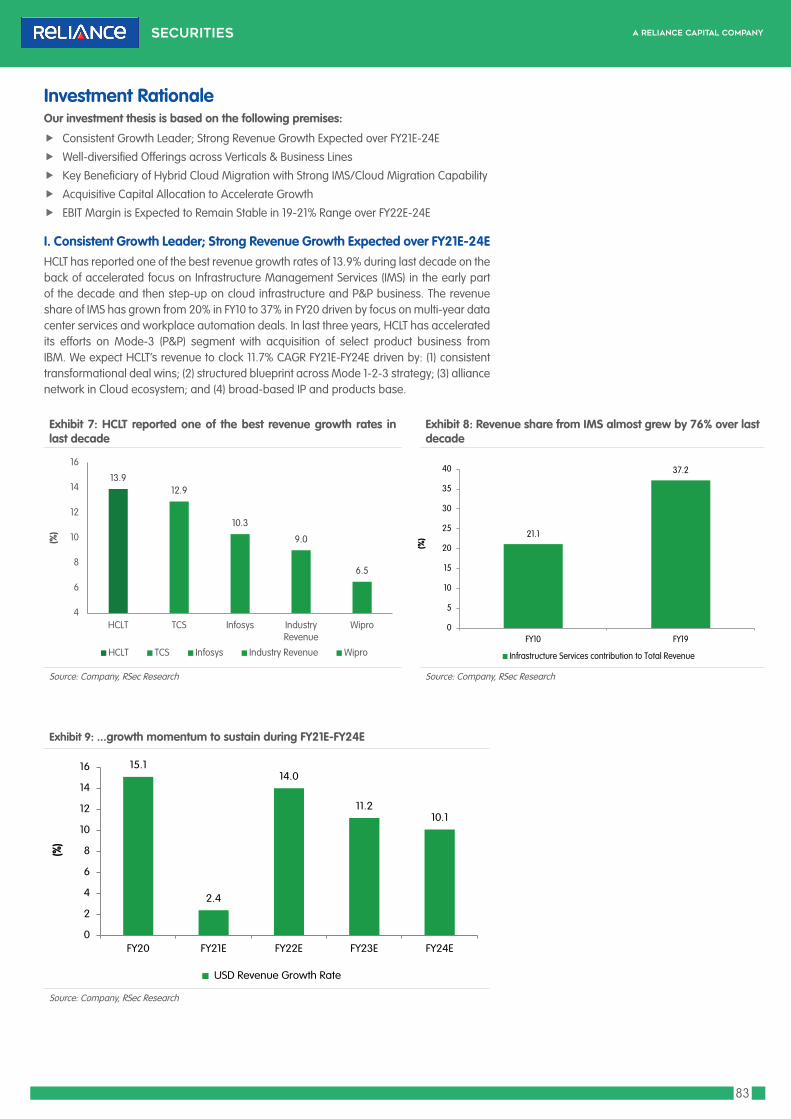
83
Investment Rationale
I. Consistent Growth Leader; Strong Revenue Growth Expected over FY21E-24EHCLT has reported one of the best revenue growth rates of 13.9% during last decade on the back of accelerated focus on Infrastructure Management Services (IMS) in the early part of the decade and then step-up on cloud infrastructure and P&P business. The revenue share of IMS has grown from 20% in FY10 to 37% in FY20 driven by focus on multi-year data center services and workplace automation deals. In last three years, HCLT has accelerated its efforts on Mode-3 (P&P) segment with acquisition of select product business from IBM. We expect HCLT’s revenue to clock 11.7% CAGR FY21E-FY24E driven by: (1) consistent transformational deal wins; (2) structured blueprint across Mode 1-2-3 strategy; (3) alliance network in Cloud ecosystem; and (4) broad-based IP and products base.
Exhibit 7: HCLT reported one of the best revenue growth rates in last decade
Exhibit 8: Revenue share from IMS almost grew by 76% over last decade
Source: Company, RSec Research Source: Company, RSec Research
Exhibit 9: ...growth momentum to sustain during FY21E-FY24E
Source: Company, RSec Research
Our investment thesis is based on the following premises:
f Consistent Growth Leader; Strong Revenue Growth Expected over FY21E-24E
f Well-diversified Offerings across Verticals & Business Lines
f Key Beneficiary of Hybrid Cloud Migration with Strong IMS/Cloud Migration Capability
f Acquisitive Capital Allocation to Accelerate Growth
f EBIT Margin is Expected to Remain Stable in 19-21% Range over FY22E-24E
13.912.9
10.3
9.0
6.5
4
6
8
10
12
14
16
HCLT TCS Infosys IndustryRevenue
Wipro
(%)
HCLT TCS Infosys Industry Revenue Wipro
21.1
37.2
0
5
10
15
20
25
30
35
40
FY10 FY19
(%)
Infrastructure Services contribution to Total Revenue
15.1
2.4
14.0
11.210.1
0
2
4
6
8
10
12
14
16
FY20 FY21E FY22E FY23E FY24E
(%)
USD Revenue Growth Rate

84
A. Consistent Transformational Deal Wins Provides Mid-term Growth Visibility: HCLT has recorded 90 transformational deal wins during last six quarters across different verticals and geographies. The management commentary suggests consistent improvement in deal pipeline. In case of software business, 3QFY21 TCV was almost doubled on YoY basis. In 3QFY21, HCLT signed 13 transformational deals with 13% YoY rise in TCV. As the deal pipeline remains very strong, the company expects accelerated deal conversation in the coming quarters. HCLT expects steady momentum in the market and highlighted that pent-up demand in some of the most impacted sectors, like manufacturing and retail is slowly returning, while the sectors that were least impacted or in fact benefiting from the pandemic is grocery and food distribution, life sciences and healthcare. The clients in these segments are making bolder bets and strengthening their business models.
Exhibit 10: Consistent large transformation deal wins to continue
Source: Company, RSec Research
Exhibit 11: Deal commentary remains buoyant
Deal Pipeline
3QFY20 Qualified pipeline is at an all-time high in the recent past and the company expects higher conversion of pipeline to booking this quarter
4QFY20 Reduction in pipeline vs. previous quarter. It will improve next quarter
1QFY21 Pipeline increased 40% QoQ driven by Life Sciences, Financial Services and Tech, Energy & Auto segments
2QFY21 Pipeline grew by 20% QoQ to a record high.
3QFY21 TCV signed witnessed 13% YoY rise vs. 3QFY20. Deal pipeline remains very strong. The company expects further acceleration of bookings in the coming quarters.
Source: Company, RSec Research
B. Structured Blueprint of Mode 1-2-3 Strategy: HCLT’s Mode 1-2-3 strategy provides a structured growth blueprint for the clients’ business operations. Mode 1 leverages the current business and IT landscape to enable an HCLT enterprise client to consolidate and enhance its existing core business with new technologies. Mode 2 provides scaled digital transformation frameworks that help clients to build robust new-age capabilities and pivot to new business models. In Mode 3, HCLT helps its clients to take advantage of specific next-generation opportunities to make them future-ready. We have seen solid double-digit growth in last 6 quarters in Mode 2 and Mode 3 business (largely due to inorganic contribution).
15
12
14
11
15
13
0
2
4
6
8
10
12
14
16
2QFY20 3QFY20 4QFY20 1QFY21 2QFY21 3QFY21
Transformation Deals

85
Exhibit 12: At the end of 3QFY21, Mode 1 contributed 61% to the topline
Source: Company, RSec Research
Exhibit 13: Mode 1-2-3 YoY growth chart
Source: Company, RSec Research
C. Step up in Alliances & Ecosystem Partnerships: Alliances and ecosystems play a key role in shaping digital offerings, modernization of people skills and an operational model driven by IP and products. HCL has excelled in creating partnerships and strategic alliances with global technology vendors and niche solution providers to create joint solutions and build new IP. HCLT has enhanced it’s capabilities by certifying employees in partner products. HCLT’s hybrid cloud services cover the entire breadth of consulting, migration, modernization, systems integration, operations, management and consolidation. These services are powered by extreme automation and designed for a Consume-Configure-Build approach with customized vertical-led solutions. The application of advanced autonomics and service orchestration that leverage machine learning (ML), artificial intelligence (AI) and cognitive solutions ensures zero-touch migration and operations in an environment that is adaptive, secure, scalable, self-learning and self-healing. Behind these offerings are HCLT’s co-innovation labs, dedicated Centers of Excellence, strong partner ecosystem and delivery centers, which give clients the means to maximize their businesses.
Exhibit 14: Mode 1-2-3 YoY growth chart
Source: Company
10.2
7.6 3.1
-10.1
-4.7
-4.9
35.5
22.5
13.4
7.9 15.2
28.6
46.2
52.9
65.1
48.1
8.5
6.2
-20
-10
0
10
20
30
40
50
60
70
2QFY20 3QFY20 4QFY20 1QFY21 2QFY21 3QFY21
(%) Y
oY
Mode 1 Mode 2 Mode 3
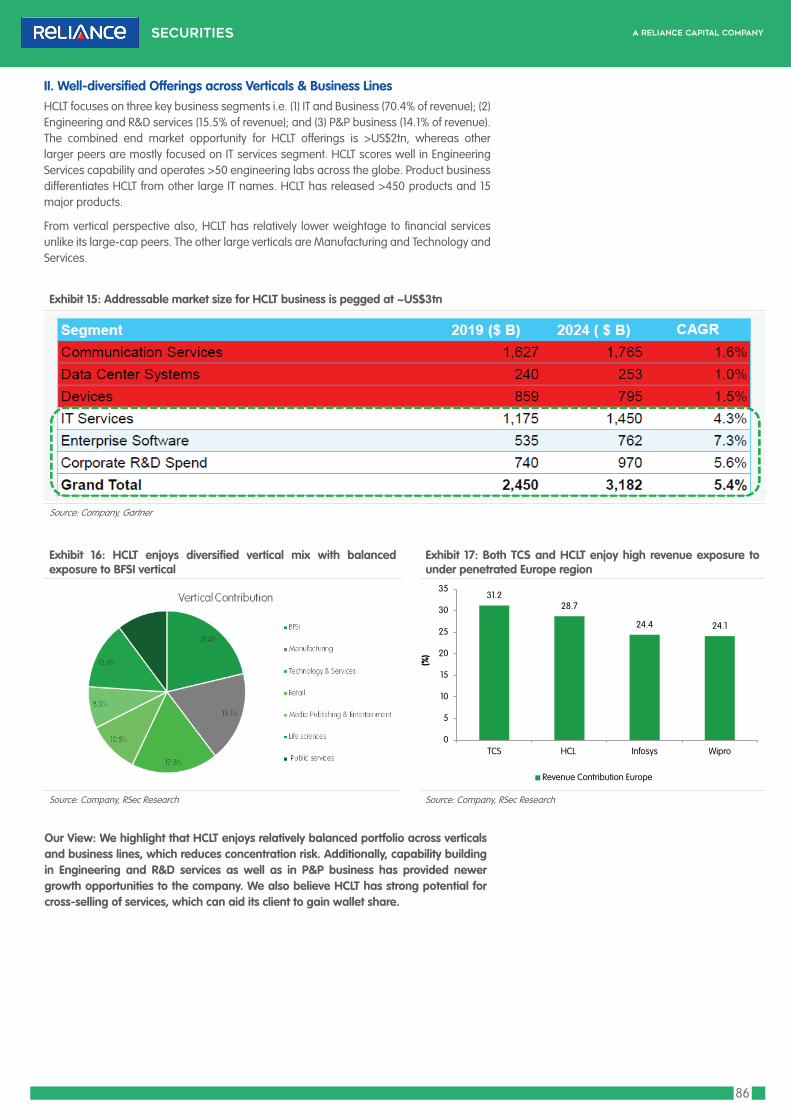
86
II. Well-diversified Offerings across Verticals & Business Lines HCLT focuses on three key business segments i.e. (1) IT and Business (70.4% of revenue); (2) Engineering and R&D services (15.5% of revenue); and (3) P&P business (14.1% of revenue). The combined end market opportunity for HCLT offerings is >US$2tn, whereas other larger peers are mostly focused on IT services segment. HCLT scores well in Engineering Services capability and operates >50 engineering labs across the globe. Product business differentiates HCLT from other large IT names. HCLT has released >450 products and 15 major products.
From vertical perspective also, HCLT has relatively lower weightage to financial services unlike its large-cap peers. The other large verticals are Manufacturing and Technology and Services.
Exhibit 15: Addressable market size for HCLT business is pegged at ~US$3tn
Source: Company, Gartner
Exhibit 16: HCLT enjoys diversified vertical mix with balanced exposure to BFSI vertical
Exhibit 17: Both TCS and HCLT enjoy high revenue exposure to under penetrated Europe region
Source: Company, RSec Research Source: Company, RSec Research
Our View: We highlight that HCLT enjoys relatively balanced portfolio across verticals and business lines, which reduces concentration risk. Additionally, capability building in Engineering and R&D services as well as in P&P business has provided newer growth opportunities to the company. We also believe HCLT has strong potential for cross-selling of services, which can aid its client to gain wallet share.
31.228.7
24.4 24.1
0
5
10
15
20
25
30
35
TCS HCL Infosys Wipro
(%)
Revenue Contribution Europe
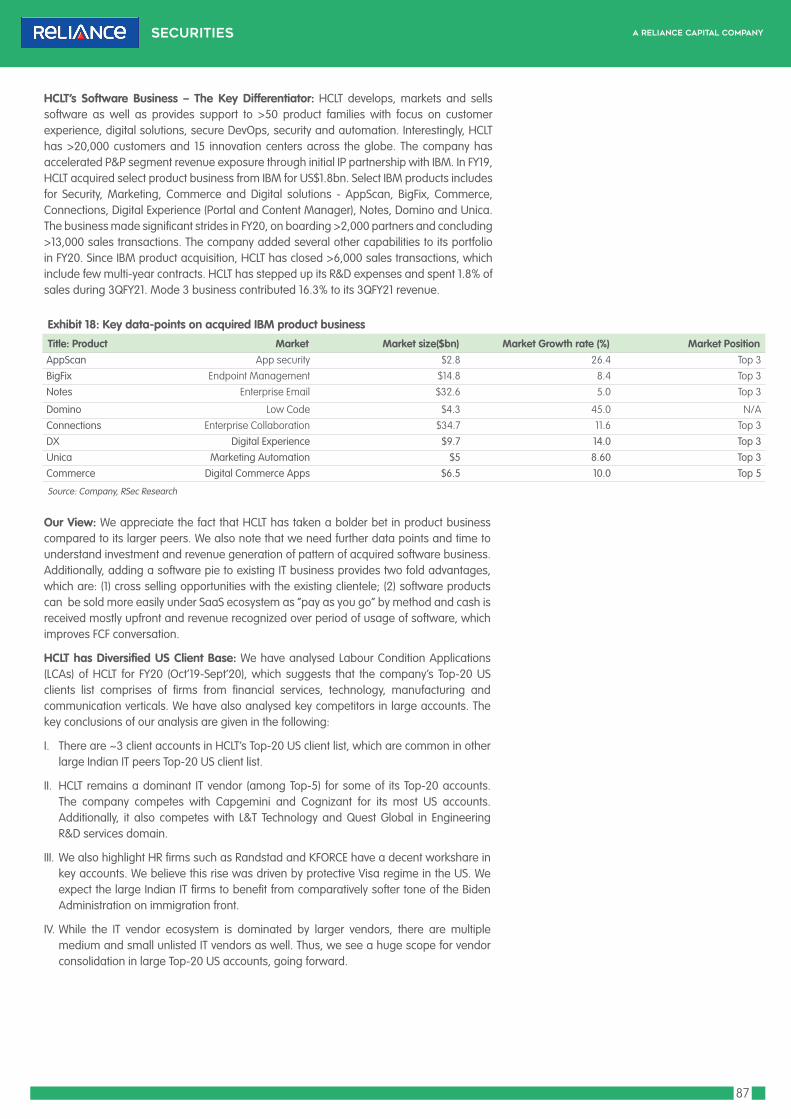
87
HCLT’s Software Business – The Key Differentiator: HCLT develops, markets and sells software as well as provides support to >50 product families with focus on customer experience, digital solutions, secure DevOps, security and automation. Interestingly, HCLT has >20,000 customers and 15 innovation centers across the globe. The company has accelerated P&P segment revenue exposure through initial IP partnership with IBM. In FY19, HCLT acquired select product business from IBM for US$1.8bn. Select IBM products includes for Security, Marketing, Commerce and Digital solutions - AppScan, BigFix, Commerce, Connections, Digital Experience (Portal and Content Manager), Notes, Domino and Unica. The business made significant strides in FY20, on boarding >2,000 partners and concluding >13,000 sales transactions. The company added several other capabilities to its portfolio in FY20. Since IBM product acquisition, HCLT has closed >6,000 sales transactions, which include few multi-year contracts. HCLT has stepped up its R&D expenses and spent 1.8% of sales during 3QFY21. Mode 3 business contributed 16.3% to its 3QFY21 revenue.
Exhibit 18: Key data-points on acquired IBM product business
Title: Product Market Market size($bn) Market Growth rate (%) Market PositionAppScan App security $2.8 26.4 Top 3BigFix Endpoint Management $14.8 8.4 Top 3Notes Enterprise Email $32.6 5.0 Top 3
Domino Low Code $4.3 45.0 N/AConnections Enterprise Collaboration $34.7 11.6 Top 3DX Digital Experience $9.7 14.0 Top 3Unica Marketing Automation $5 8.60 Top 3Commerce Digital Commerce Apps $6.5 10.0 Top 5
Source: Company, RSec Research
Our View: We appreciate the fact that HCLT has taken a bolder bet in product business compared to its larger peers. We also note that we need further data points and time to understand investment and revenue generation of pattern of acquired software business. Additionally, adding a software pie to existing IT business provides two fold advantages, which are: (1) cross selling opportunities with the existing clientele; (2) software products can be sold more easily under SaaS ecosystem as “pay as you go” by method and cash is received mostly upfront and revenue recognized over period of usage of software, which improves FCF conversation.
HCLT has Diversified US Client Base: We have analysed Labour Condition Applications (LCAs) of HCLT for FY20 (Oct’19-Sept’20), which suggests that the company’s Top-20 US clients list comprises of firms from financial services, technology, manufacturing and communication verticals. We have also analysed key competitors in large accounts. The key conclusions of our analysis are given in the following:
I. There are ~3 client accounts in HCLT’s Top-20 US client list, which are common in other large Indian IT peers Top-20 US client list.
II. HCLT remains a dominant IT vendor (among Top-5) for some of its Top-20 accounts. The company competes with Capgemini and Cognizant for its most US accounts. Additionally, it also competes with L&T Technology and Quest Global in Engineering R&D services domain.
III. We also highlight HR firms such as Randstad and KFORCE have a decent workshare in key accounts. We believe this rise was driven by protective Visa regime in the US. We expect the large Indian IT firms to benefit from comparatively softer tone of the Biden Administration on immigration front.
IV. While the IT vendor ecosystem is dominated by larger vendors, there are multiple medium and small unlisted IT vendors as well. Thus, we see a huge scope for vendor consolidation in large Top-20 US accounts, going forward.

88
Exhibit 19: HCLT's Top 20 US Clients
Clients Key Competition
Financial Services f KFORCE, TCS, Wipro, IBM, Mastech Digital, Compunnel Software Group, Daman, Populus Group, Inherent technologies
Pharmaceutical f Cognizant, Accenture, E&Y, deloitte, CGI Technologies, LS Solutions, Infosys, United Pharma Technology, White Collar Technologies,
Mastech Digital, Compunnel Software Group
Technology f ETOUCH Systems, Deloitte, Accenture, HCLT, Tech Mahindra, EPAM, Infosys, IBM, Global Logic, KFORCE, TCS
Communication f Capgemini, HCLT, Infosys, Telecom Technology, Pro Karma, UST Global, Tech Democracy, Wipro, Accenture, NTT data, TCS, Amdocs,
Compunnel Software Group
Industrial f Infosys, TCS, Accenture, Fujitsu America, Cyient, E&Y, Ruleware, Tech Mahindra, App Soft, TechMagix, Dotcom team
Logistics f Atos, Mphasis, Wipro, Deloitte, Sai Technology, KFORCE, Compunnel Software Group, Infogain, Vidorra
Beverage f E&Y, DEXTEROUSUSA, Altran, Anveta
Media & Entertainment f Accenture, Birlasoft, Cognizant, Capgemini, E&Y, Ciber, Info Services, Deloitte, Genpact, Globant, Affine, Everest
Industrial f L&T Technology Services, Quest Global, Einfochips, Compunnel Software Group, Cyient, Anventa, Blucapsoft, Caltek Solutions,
Computer Professionals
Financial Services f Infosys, DXC, Luxoft, Accenture, TCS, Cira Infotech, Ikcon Technologies, Oracle Financial Services, Alttech, Ariston, Inficare
Healthcare f Capgemini, E&Y, Deloitee, Wipro, Horkus Solutions, Katalyst Helthcares
Finance f Capgemini, Incandescent Technologies
Healthcare f Capgemini, Indus USA, Cognizant, Geometric, I3 Infotech, Ilink Systems, Systechcorp
Technology f Zen3 Infosolutions, Infosys, Couloir, TCS, Wipro, Cirquetech, Brillio, KFORCE, Accenture, Aricent Tech, Cognizant, Isite Technology,
Lasai Technologies
Healthcare f Cognizant, Capgemini, HCLT, IBM, I3 Infotek, The Fountain Group
Financial Services f TCS, Mphasis, Cognizant, Capgemini, E&Y, Accenture
Financial Services f Infosys, TCS, Hexaware, Cognizant, Photon, Procal Technologies
Technology f Infosys, Aricent, UST Global, Deloitte, L&T Technology, Cerium Systems, TCS, Wipro
Financial Services f Mastech Digital, TCS, Cognizant, I-Link Solutions, ASTA CRS, Astir IT Solutions, Compunnel Software Group, Iris Software
Financial Services f Infosys, Wipro, Deloitte, EPAM, Mastech, Cognizant, Softcom Systems, Cyberthink, Compunnel Software Group, Capgemini
Source for all : RSec Research, Department of Labour (US); Note: Grey highlight denotes common Top-20 client accounts for Top-4 IT names

89
III. Key Beneficiary of Hybrid Cloud Migration with Strong IMS/Cloud Migration Capability
HCLT generates >35% of its revenue from IMS vertical. The company is one of early leaders in IMS space in last decade with data center management, network and security monitoring, end-user service desk and desktop engineering. Recent commentary from IT company suggests that Digital and Cloud are growing very aggressively, as the companies are modernizing their core processes for differentiation, speed, efficiency and scalability.
HCLT was one of the first companies to create dedicated business units for the large hyperscalers. It was also one of early capability builders in terms of public and private cloud migration, hybrid cloud migration and cloud orchestration services. According to industry consultants, hybrid and multi-cloud model will be the preferred model for the large global enterprises. All public Cloud providers are now creating hybrid Cloud products to address the incremental demand. Mid-size enterprise customers are adopting more holistic public Cloud, while the consumer/start-ups continue to have large share in Cloud consumption. This has opened up new opportunity segment for HCLT.
Exhibit 20: Hybrid and Multi-Cloud will be the preferred model for the large global enterprises
Source: Company
Our View: We expect HCLT to the key beneficiary of Cloud migration and orchestration services driven by its key offerings Dyrice and multi-decade experience in infrastructure management and data center management services. HCLT has strong relationship with large hyperscalers and SaaS ecosystem, which we expect to boost its digital offerings. Additionally, we highlight that historically managed services contract in infrastructure management services are generally long tenure and annuity in nature, which provides higher growth visibility.

90
Exhibit 21: HCLT remains acquisitive
Source: Company, RSec Research
IV. Acquisitive Capital Allocation to Accelerate GrowthAcquisition for capability expansion and geography footprint is the core part of HCLT’s capital allocation policy. During last three years, HCLT acquired >10 companies and spent US$2bn on acquisitions vs. US$372mn and US$235mn by Infosys & Wipro, respectively. Wipro has recently announced acquisition of consulting firm - Capco, which we believe a positive step to accelerate growth inorganically. HCLT has done comparatively well in integration of acquired companies and its employees. The company has been able to diversify its offerings with expansion in capability in Engineering and R&D services and P&P segment largely due to stepped-up acquisitions. Our analysis of HCLT’s acquisition pattern suggests comparatively more focus on digital operations which includes customer experience and artificial intelligence. The company has accelerated focus on acquisitions on telecom and life sciences vertical as well.
Our View: We highlight that aggressive acquisition policy bodes well for HCLT, as it is rather difficult to build a scale and diversified offerings organically. HCLT has track record of successful conversations of acquisitions to support its revenue growth. The company’s revenue has clocked 14% CAGR over the last decade, which is substantially higher than its peers. We believe consistent M&A policy would continue to aid the company to grow at above average industry rate, going forward.

91
V. EBIT Margin is Expected to Remain Stable in 19-21% Range over FY22E-FY24EWe expect HCLT’s EBIT margin to remain at 19-21% over FY22E-FY24E compared to 18-19% over FY17-FY20E. We expect its EBIT margin to remain at an improved level largely due to: (1) rising revenue share of high-margin P&P business; (2) pay-out from the investment made in digital business (largely reflecting in mode 2 business); (3) Work from Home/hybrid model of delivery in the medium-term; (4) cost optimization opportunity at sub-contractor level; and (5) automation, which can provide some offset from return of travel/facility cost. HCLT reported EBIT margin of 22.9% in 3QFY21. However, the management’s plans to expand P&P sales team (to build its deal pipeline) may lead to lower EBIT margin in the coming quarters.
Strong RoCE & Solid Cash Flow Conversation: We expect HCLT’s RoCE to remain in the range of 21-22% over FY22E-24E driven by: (1) step-up in revenue growth led by higher technology spend in the mid-term; and (2) improved EBIT margin (19-21%). Additionally, HCLT is likely to report strong FCF conversation (>80%) over FY22E-FY24E. The company has also witnessed improved collection during FY20 with improved debtor’s collection days. We expect dividend yield of 3-4% over FY22E-FY24E.
Exhibit 22: EBIT margin declined over FY15-FY19 due to weakness in legacy IMS business...
Exhibit 23: ...but profitability revived due to high margin product business and payoff from digital investments
Source: Company, RSec Research Source: Company, RSec Research
Exhibit 24: RoCE to remain over 20% Exhibit 25: FCF Conversation to remain in the range of 80-100%
Source: Company, RSec Research Source: Company, RSec Research
22.2
20.4 20.3
19.719.5
18
19
20
21
22
23
FY15 FY16 FY17 FY18 FY19
(%)
EBIT Margin
19.6
21.2
20.7
20.3 20.3
19
19
20
20
21
21
22
FY20 FY21E FY22E FY23E FY24E
(%)
EBIT Margin
96.6
92.6
85.483.8
90.0
75
80
85
90
95
100
FY20 FY21E FY22E FY23E FY24E
(%)
FCF Conversation
22.0
22.4
20.9 20.9 20.9
20
21
21
22
22
23
FY20 FY21E FY22E FY23E FY24E
(%)
RoCE

92
Outlook & ValuationOver the 12 months, the stock outperformed the NIFTY by 56%. Going ahead, we expect HCLT to report solid revenue recovery over FY21E-FY24E driven by consistent transformation deal wins, multi-decade experience in IMS/Cloud services offerings and rising share of P&P business. At CMP, the stock trades at 15x of FY24E EPS, which is 37% discount to larger peers Infosys and TCS against historical 22% discount. We initiate coverage on HCLT with BUY and a 2-Year Target Price of Rs1,320 (valuing the stock at 20x PE of FY24E earnings), which implies 33% upside from the current level.
Exhibit 26: HCLT's 10 year valuation summary Exhibit 27: Currently, HCLT trades at 37% discount to larger peers
Source: RSec Research, Bloomberg Source: RSec Research, Bloomberg
0.0
5.0
10.0
15.0
20.0
25.0
2010 2011 2012 2013 2014 2015 2016 2017 2018 2019 2020 2021
BEST_PE_12M_BF 11.3 AVG 13.5 STDEV+1 15.1 STDEV-1 12.0
-60
-50
-40
-30
-20
-10
02010 2011 2012 2013 2014 2015 2016 2017 2018 2019 2020 2021
(%)
(Discount)/Premium Over 1 YR Forward PE of TCS and Infosys
Average (Discount)/Premium

93
Profit & Loss StatementY/E Mar (Rs mn) FY19 FY20 FY21E FY22E FY23E FY24E
Net Revenues (US$ mn) 8,632.4 9,936.0 10,173.8 11,598.8 12,895.9 14,197.7
Growth (%) 10.1 15.1 2.4 14.0 11.2 10.1
Net Revenues 6,04,280 7,06,780 7,54,112 8,58,313 9,67,190 10,79,027
Growth (%) 19.5 17.0 6.7 13.8 12.7 11.6
Employee Costs & Other expenses 3,92,680 4,52,950 4,63,538 5,32,154 5,99,658 6,68,997
SG&A and Other Operating Expenses 71,910 86,900 92,314 1,07,289 1,25,735 1,40,274
EBITDA 1,39,690 1,66,930 1,98,260 2,18,870 2,41,798 2,69,757
EBITDA (%) 23.1 23.6 26.3 25.5 25.0 25.0
EBITDA Growth (%) 22.1 19.5 18.8 10.4 10.5 11.6
D&A 21,480 28,400 38,714 43,774 46,425 51,793
EBIT 1,18,210 1,38,530 1,59,546 1,75,096 1,95,372 2,17,964
EBIT (%) 19.6 19.6 21.2 20.4 20.2 20.2
EBIT Growth (%) 18.4 17.2 15.2 9.7 11.6 11.6
Other Income 6,240 1,930 6,039 6,507 8,877 12,523
PBT 1,24,450 1,40,460 1,65,585 1,81,602 2,04,249 2,30,486
Tax (incl deferred) 24,810 29,380 33,519 40,083 45,067 50,841
PAT 99,640 1,11,080 1,32,066 1,41,520 1,59,182 1,79,645
PAT Growth (%) 20.9 11.5 18.9 7.2 12.5 12.9
EPS (Rs) 36.7 41.0 48.7 52.4 58.9 66.4
EPS Growth (%) 17.5 11.7 18.6 7.6 12.4 12.8
Balance SheetY/E Mar (Rs mn) FY19 FY20 FY21E FY22E FY23E FY24E
SOURCES OF FUNDS
Total Shareholders' Funds 4,27,605 4,90,630 5,91,877 6,67,670 7,60,494 8,64,052
Total Current Liabilities 1,12,884 1,96,286 2,11,227 2,48,911 2,80,485 3,12,918
Total Debt 40,365 47,842 49,895 49,795 50,468 51,140
TOTAL SOURCES OF FUNDS 5,96,426 7,81,931 9,03,391 10,23,709 11,56,054 12,92,853
APPLICATION OF FUNDS
Fixed Assets 237954 335111 434314 452361 482696 516156
Investment in Associates 350 355 371 370 375 380
Other Long term assets 57,198 85,402 91,200 1,03,765 1,16,927 1,40,274
Total Non Current Assets 2,95,501 4,20,869 5,25,885 5,56,495 5,99,999 6,56,810
Accounts Receivable 1,47,937 1,66,994 1,81,051 2,14,578 2,41,798 2,58,967
Inventory
Cash & Bank 60,040 45,502 47,989 98,143 1,51,840 2,06,557
Other Current Assets 92,950 1,48,565 1,48,464 1,54,492 1,62,416 1,70,518
Total Current Assets 3,00,927 3,61,062 3,77,504 4,67,213 5,56,054 6,36,042
TOTAL APPLICATION OF FUNDS 5,96,426 7,81,931 9,03,391 10,23,709 11,56,054 12,92,853

94
Cash Flow StatementY/E Mar (Rs mn) FY19 FY20 FY21E FY22E FY23E FY24E
PAT 1,01,062 1,10,784 1,32,174 1,42,112 1,59,782 1,80,253
Non-operating & EO items (7,972) 3,875 0 0 0 0
Depreciation 21,467 28,382 38,725 43,774 46,425 51,793
Working Capital Change (20,760) (19,111) 6,104 (2,109) (1,946) 8,811
Cash Flow from Operations (a) 93,797 1,23,930 1,77,003 1,83,777 2,04,262 2,40,858
Capex (19,164) (17,099) (55,103) (62,695) (70,648) (78,817)
Other 938 (70,180) (69,394) (5,705) (5,262) (22,513)
Change in Investments (17,232) (39,452) - - - -
Cash Flow from Investing (b) (35,458) (1,26,731) (1,24,497) (68,400) (75,910) (1,01,330)
Change in Debt 0 0 0 0 0 0
Share capital Issuance/(buyback) (11,787) (10,444) (54,271) (65,126) (75,981) (86,835)
Cash Flow from Financing (c) (11,787) (10,444) (54,271) (65,126) (75,981) (86,835)
NET CASH FLOW (a+b+c) 46,552 (13,245) (1,765) 50,251 52,371 52,693
Free Cash Flow 74,633 1,06,831 1,21,900 1,21,082 1,33,614 1,62,041
Key RatiosY/E Mar FY19 FY20 FY21E FY22E FY23E FY24E
Profitability (%)
EBITDA Margin 23.1 23.6 26.3 25.5 25.0 25.0
EBIT Margin 19.6 19.6 21.2 20.4 20.2 20.2
APAT Margin 16.5 15.7 17.5 16.5 16.5 16.6
RoE 25.6 24.1 24.3 22.5 22.3 22.2
RoCE 24.2 22.0 22.4 20.9 20.9 20.9
RoA 18.8 16.1 15.6 14.7 14.6 14.7
Efficiency
Tax Rate (%) 19.9 20.9 20.2 22.1 22.1 22.1
Debtors (days) 88.1 85.1 86.4 90.0 90.0 86.4
FCF/NI (%) 74.9 96.2 92.3 85.6 83.9 90.2
Net Debt/EBITDA (x) (0.1) 0.0 0.0 (0.2) (0.4) (0.6)
Net Debt/Equity (x) (0.0) 0.0 0.0 (0.1) (0.1) (0.2)
Per Share Data (Rs)
EPS 36.7 41.0 48.7 52.4 58.9 66.4
DPS 13.0 5.0 20.0 24.0 28.0 32.0
BVPS 155.4 180.8 218.1 246.0 280.3 318.4
FCF 27.1 39.4 44.9 44.6 49.2 59.7
Valuation (x)
P/E 27.1 24.3 20.5 19.0 16.9 15.0
P/BV 6.4 5.5 4.6 4.0 3.6 3.1
EV/EBITDA 20.3 16.7 14.1 13.0 12.0 11.0
FCF/EV (%) 2.6 3.8 4.4 4.3 4.6 5.5
FCF/mkt cap (%) 2.7 4.0 4.5 4.5 4.9 6.0
Dividend Yield (%) 1.3 0.5 2.0 2.4 2.8 3.2

95
Company BackgroundHCL Technologies (HCLT) is Noida based IT services and product company. Currently, it employs >159,000 employees across 50 countries. HCLT’s clientele includes leading global enterprises including 250 Fortune 500 and 650 of the Global 2000 enterprises. The company offers an integrated portfolio of products and services through three business units i.e. (1) IT and Business Services (ITBS); (2) Engineering and R&D Services (ERS); and (3) Products and Platforms (P&P). HCLT generated US$9.9bn revenue in FY20.
Exhibit 28: Revenue by geographies Exhibit 29: Revenue by verticals
Source: Company, Rsec Research Source: Company, Rsec Research

96
60.3%
35.2%
4.0% 0.5%
Promoter Institutional Retail Corp Bodies
Key Management TeamName Designation Brief Profile
Mr. C. Vijayakumar President and CEO
Mr. Vijaykumar has more than 25 years of experience in IT services. Over the year, he has held several technology, operations and business leadership positions. He is a graduate in Electrical & Electronics Engineering from P.S.G. College of Technology,
Mr. Prateek Aggarwal CFO Mr. Aggarwal has more than 27 years of experience in business finance and strategic initiatives. He is a graduate in commerce from SRCC, Delhi, and holds an MBA degree from IIM, Calcutta. He has also completed an M&A course from The University of Chicago Booth School of Business.
Mr. Apparao V. V. CHRO Mr. Apparao is an HCL veteran, having joined the company in 2002. Before taking over his current role, he served as Vice President in Financial Services business. Mr. Apparao holds a Masters Degree in Engineering from the Indian Institute of Technology, Roorkee.
Source: Company
Key Shareholders
Holder Name Ownership percentage
SBI Funds Management Pvt Ltd 2.1
BlackRock Inc 1.5
Artisan Partners Ltd 1.4
Vanguard Group Inc/The 1.3
Life Insurance Corp of India 1.2
ICICI Prudential Asset Management 1.2
Nomura Holdings Inc 0.8
Vontobel Holding AG 0.8
Norges Bank 0.6
Virtus Investment Partners Inc 0.6
Source: RSec Research
Shareholding Pattern
Source: Bloomberg

97
Share price (%) 1 mth 3 mth 12 mth
Absolute performance 1.4 9.4 113.2
Relative to Nifty 0.9 3.2 40.5
Shareholding Pattern (%) Mar'20 June'20
Promoter 74 74
Public 26 26
1 Year Stock Price Performance
Note: * CMP as on 30 March 2021
Growth Revival on the Cards
Key Financials
Y/E March (Rs mn) FY19 FY20 FY21E FY22E FY23E FY24ERevenue 5,85,845 6,10,232 6,12,005 7,22,507 8,10,897 8,89,804EBIT 1,02,456 1,05,031 1,14,753 1,28,303 1,49,929 1,69,018PAT 91,657 96,985 98,776 1,11,273 1,28,879 1,46,794
EPS (Rs) 15.2 16.5 18.3 19.5 22.6 25.7EBIT Margin (%) 17.5 17.2 18.8 17.8 18.5 19.0PE (x) 27.7 25.4 22.9 21.5 18.6 16.3P/BV (x) 4.5 4.4 3.7 3.2 2.9 2.6
Source: Company, RSec Research
WiproIT | India
Institutional Equity Research
Initiating Coverage | 31 March 2021
2 Year Target Price: Rs.565
CMP* (Rs) 420
Upside/ (Downside) (%) 35
Bloomberg Ticker WPRO IN
Market Cap. (Rs bn) 2,396
Free Float (%) 26
Shares O/S (mn) 5,706
1. Bengaluru-headquartered Wipro (WPRO) is one of the pioneering IT services firms in India, which offers IT, Engineering, Business Process Outsourcing (BPO) and Consulting services.
2. Restructuring efforts, which include simplified operating structuring, step-up in capability upgrade and talent management bode well for Wipro in the medium-term.
3. Multi-decade experience in IT maintenance and transformation projects, HR battery of >180K IT professionals, multi geography presence and existing longstanding customer relationship with large corporate make Wipro a strong case for potential strategic transformation partnership with global enterprises.
4. While Wipro lagged behind on revenue growth front vs. larger Indian peers historically, we expect its revenue to clock 13.2% (Including 2.8% from Capco acquisition) CAGR over FY21E-FY24E vs. 4% CAGR over FY17-FY20 driven by recent large deal wins and focused efforts on prioritized sectors/geographies.
5. We expect Wipro’s EBIT margin to remain at elevated level of 18-19% over FY22E-FY24E vs. 16-18% over FY18-FY20 driven by simplified operating structure and remote working etc.
ESG Analysis: While analyzing 20 key criteria (10 points each) under ESG Matrix, we have assigned an overall score of 80% to Wipro. Under “Environmental Head”, we have assigned 82.9% score, as the company mulls at carbon efficiency to net zero and actively working on biodiversity projects. Under “Social Head”, we have assigned 78.6% score, as the company scores high on customer satisfaction, data protection and privacy and gender equality. Under “Governance Head”, we have assigned 78% score due to high score in political contribution and independent audit committee (please refer to page no. 101 for detailed ESG analysis).
Outlook & ValuationWipro outperformed Nifty and Nifty IT by 40% and 2%, respectively in last 12 months. Going ahead, we expect its revenue to grow at the industry average driven by recent surge in deal wins, prioritized focused areas and step-up in investment in talent and partnerships. At CMP, the stock trades at 16.3x of FY24E EPS, which is 25% discount to average of larger peers i.e. Infosys and TCS. We initiate coverage on Wipro with BUY and a 2-Year Target Price of Rs565 (valuing the stock at 22x PE on FY24E earnings), which implies 35% upside from the current level.
Key Takeaways: Growth acceleration driven by recent large deal wins and focus on prioritized sector/
geographies
Organization restructuring and talent management efforts to infuse agility and capability
Longstanding relationship with large global corporations
Attractive valuation - 25% discount to larger peers
BUY
Research Analyst: Suyog Kulkarni, CFA
Contact : (022) 4303 4000 / 9890966735Email : [email protected]
Research Associate: Chaitanya Panchmatia
Contact : (022) 4303 4000 / 8080782900Email : [email protected]
100
150
200
250
300
350
400
450
500
Mar
-20
Apr
-20
May
-20
Jun-
20
Jul-2
0
Aug
-20
Sep-
20
Oct
-20
Nov
-20
Dec
-20
Jan-
21
Feb-
21
Mar
-21
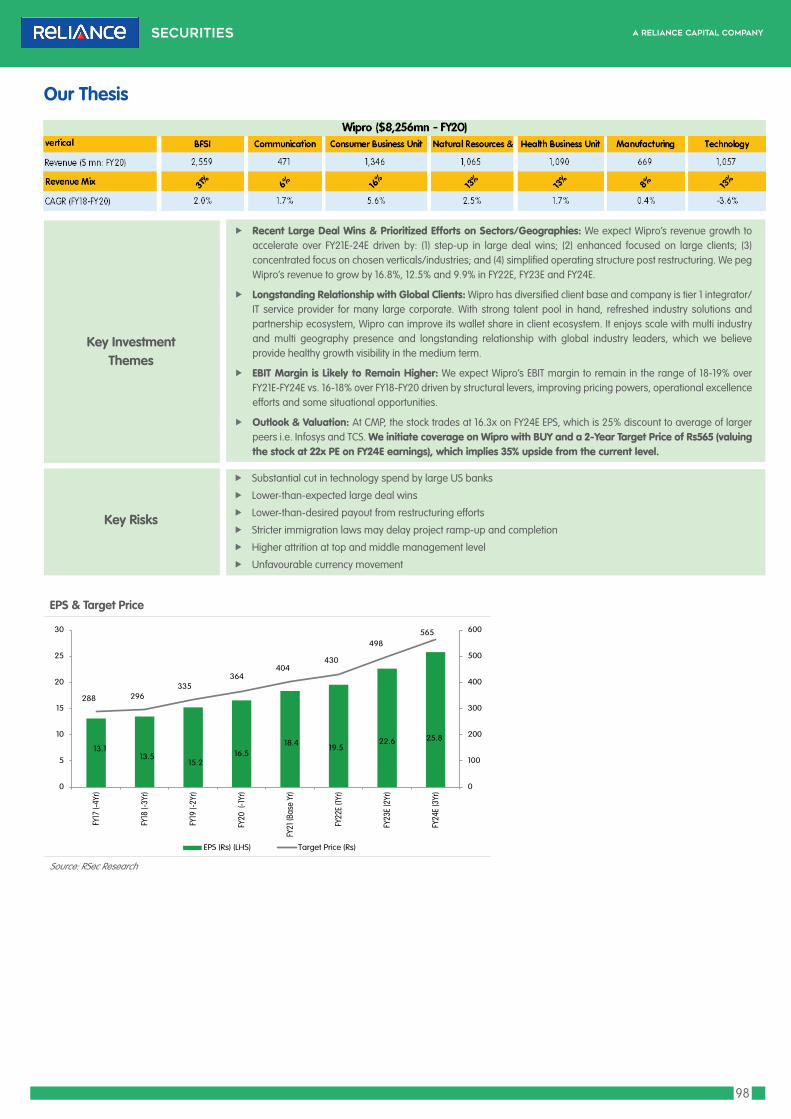
98
Our Thesis
f Recent Large Deal Wins & Prioritized Efforts on Sectors/Geographies: We expect Wipro’s revenue growth to accelerate over FY21E-24E driven by: (1) step-up in large deal wins; (2) enhanced focused on large clients; (3) concentrated focus on chosen verticals/industries; and (4) simplified operating structure post restructuring. We peg Wipro’s revenue to grow by 16.8%, 12.5% and 9.9% in FY22E, FY23E and FY24E.
f Longstanding Relationship with Global Clients: Wipro has diversified client base and company is tier 1 integrator/ IT service provider for many large corporate. With strong talent pool in hand, refreshed industry solutions and partnership ecosystem, Wipro can improve its wallet share in client ecosystem. It enjoys scale with multi industry and multi geography presence and longstanding relationship with global industry leaders, which we believe provide healthy growth visibility in the medium term.
f EBIT Margin is Likely to Remain Higher: We expect Wipro’s EBIT margin to remain in the range of 18-19% over FY21E-FY24E vs. 16-18% over FY18-FY20 driven by structural levers, improving pricing powers, operational excellence efforts and some situational opportunities.
f Outlook & Valuation: At CMP, the stock trades at 16.3x on FY24E EPS, which is 25% discount to average of larger peers i.e. Infosys and TCS. We initiate coverage on Wipro with BUY and a 2-Year Target Price of Rs565 (valuing the stock at 22x PE on FY24E earnings), which implies 35% upside from the current level.
Key Investment Themes
Key Risks
f Substantial cut in technology spend by large US banks
f Lower-than-expected large deal wins
f Lower-than-desired payout from restructuring efforts
f Stricter immigration laws may delay project ramp-up and completion
f Higher attrition at top and middle management level
f Unfavourable currency movement
EPS & Target Price
Source: RSec Research
13.113.5
15.216.5
18.4 19.522.6 25.8
288 296335
364404
430
498565
0
100
200
300
400
500
600
0
5
10
15
20
25
30
FY17
(-4Y
r)
FY18
(-3Y
r)
FY19
(-2Y
r)
FY20
(-1
Yr)
FY21
(Bas
e Yr
)
FY22
E (1Y
r)
FY23
E (2
Yr)
FY24
E (3
Yr)
EPS (Rs) (LHS) Target Price (Rs)

99
Price Sensitivity AnalysisEPS (Rs) Growth (%) FWD PE (x) 20 21 22 23
FY17 13.1 32.0 262 275 288 302
FY18 13.5 3 31.2 269 283 296 310
FY19 15.2 13 27.6 305 320 335 350
FY20 16.5 9 25.4 331 348 364 381
FY21E 18.4 11 22.9 367 386 404 423
FY22E 19.5 6 21.5 391 410 430 449
FY23E 22.6 16 18.6 453 475 498 524
FY24E 25.8 14 16.3 515 541 565 593
Source: Company, RSec Research
Price Target ScenarioParticulars Bull Base BearRevenue CAGR (FY21E-FY24E) (%) 16.5 13.2 8.0
EPS CAGR (FY21E-FY24E) (%) 16.5 11.9 7.0
FY24E EPS (Rs) 29.0 25.7 22.5
Target P/E multiple (x) 25.0 22.0 17.0
2-yr Target Price (Rs) 725 565 382
Upside/Downside (%) 72.5 34.5 (9.1)Source: Company, RSec Research
Scenario AnalysisBase Case: In Base Case scenario, we expect the Indian IT services industry to witness high single to double-digit growth over FY21E-FY24E. We expect Wipro to clock 11.9% EPS CAGR on the back of 13.2% CAGR in USD revenue over the same period. Assuming target multiple of 22x on FY24E EPS, we arrive at a target price of Rs.565, which is 35% higher than the CMP.
Bull Case: In Bull Case scenario, we expect the Indian IT services industry to witness double-digit growth over FY21E-FY24E. We expect Wipro to clock 16.5% EPS CAGR on the back of 16.5% CAGR in USD revenue over the same period. Assuming target multiple of 25x on FY24E EPS, we arrive at a target price of Rs.725, which is 73% higher than the CMP.
Bear Case: In Bear Case scenario, we expect the Indian IT services industry to witness mid to high single digit growth over FY21E-FY24E. We expect Wipro to clock 7% EPS CAGR on the back of 8% CAGR in USD revenue over the same period. Assuming target multiple of 17x on FY24E EPS, we arrive at a target price of Rs382, which is 9% lower than the CMP.
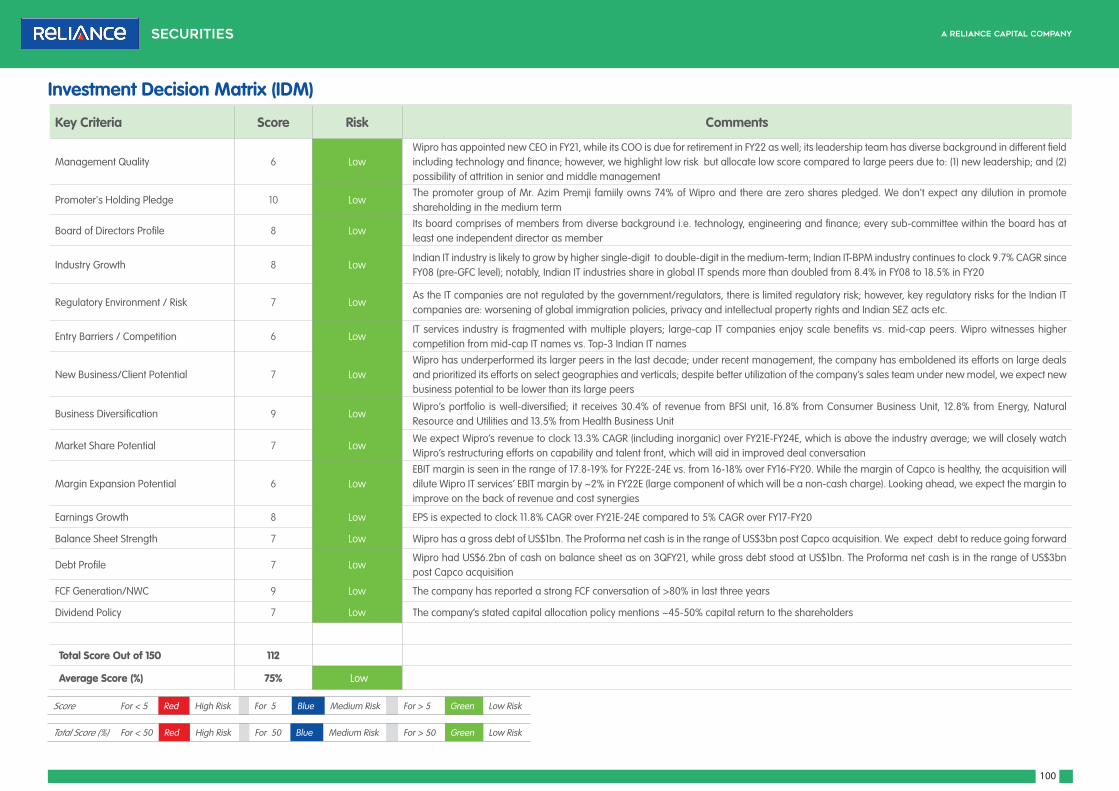
100
Key Criteria Score Risk Comments
Management Quality 6 LowWipro has appointed new CEO in FY21, while its COO is due for retirement in FY22 as well; its leadership team has diverse background in different field including technology and finance; however, we highlight low risk but allocate low score compared to large peers due to: (1) new leadership; and (2) possibility of attrition in senior and middle management
Promoter's Holding Pledge 10 LowThe promoter group of Mr. Azim Premji famiily owns 74% of Wipro and there are zero shares pledged. We don't expect any dilution in promote shareholding in the medium term
Board of Directors Profile 8 LowIts board comprises of members from diverse background i.e. technology, engineering and finance; every sub-committee within the board has at least one independent director as member
Industry Growth 8 LowIndian IT industry is likely to grow by higher single-digit to double-digit in the medium-term; Indian IT-BPM industry continues to clock 9.7% CAGR since FY08 (pre-GFC level); notably, Indian IT industries share in global IT spends more than doubled from 8.4% in FY08 to 18.5% in FY20
Regulatory Environment / Risk 7 LowAs the IT companies are not regulated by the government/regulators, there is limited regulatory risk; however, key regulatory risks for the Indian IT companies are: worsening of global immigration policies, privacy and intellectual property rights and Indian SEZ acts etc.
Entry Barriers / Competition 6 LowIT services industry is fragmented with multiple players; large-cap IT companies enjoy scale benefits vs. mid-cap peers. Wipro witnesses higher competition from mid-cap IT names vs. Top-3 Indian IT names
New Business/Client Potential 7 LowWipro has underperformed its larger peers in the last decade; under recent management, the company has emboldened its efforts on large deals and prioritized its efforts on select geographies and verticals; despite better utilization of the company’s sales team under new model, we expect new business potential to be lower than its large peers
Business Diversification 9 LowWipro’s portfolio is well-diversified; it receives 30.4% of revenue from BFSI unit, 16.8% from Consumer Business Unit, 12.8% from Energy, Natural Resource and Utilities and 13.5% from Health Business Unit
Market Share Potential 7 LowWe expect Wipro’s revenue to clock 13.3% CAGR (including inorganic) over FY21E-FY24E, which is above the industry average; we will closely watch Wipro’s restructuring efforts on capability and talent front, which will aid in improved deal conversation
Margin Expansion Potential 6 LowEBIT margin is seen in the range of 17.8-19% for FY22E-24E vs. from 16-18% over FY16-FY20. While the margin of Capco is healthy, the acquisition will dilute Wipro IT services’ EBIT margin by ~2% in FY22E (large component of which will be a non-cash charge). Looking ahead, we expect the margin to improve on the back of revenue and cost synergies
Earnings Growth 8 Low EPS is expected to clock 11.8% CAGR over FY21E-24E compared to 5% CAGR over FY17-FY20
Balance Sheet Strength 7 Low Wipro has a gross debt of US$1bn. The Proforma net cash is in the range of US$3bn post Capco acquisition. We expect debt to reduce going forward
Debt Profile 7 LowWipro had US$6.2bn of cash on balance sheet as on 3QFY21, while gross debt stood at US$1bn. The Proforma net cash is in the range of US$3bn post Capco acquisition
FCF Generation/NWC 9 Low The company has reported a strong FCF conversation of >80% in last three years
Dividend Policy 7 Low The company’s stated capital allocation policy mentions ~45-50% capital return to the shareholders
Total Score Out of 150 112
Average Score (%) 75% Low
Investment Decision Matrix (IDM)
Score For < 5 Red High Risk For 5 Blue Medium Risk For > 5 Green Low Risk
Total Score (%) For < 50 Red High Risk For 50 Blue Medium Risk For > 50 Green Low Risk

101
Key Criteria Score Risk Comments
Environmental
Climate Change &Carbon Emission 8 LowWipro is a founding member of “Transform to Net Zero” (a cross-sector initiative to accelerate the transition to a net zero emissions global economy); over the last 5 years, Wipro has prevented the equivalent of 425,000 tonne of CO2 emission through energy efficiency and renewable energy procurement
Air & Water Pollution 8 LowWipro's waste management strategy includes regular monitoring of air, water and noise pollution to operate well within regulatory norms; Wipro recycled 1,118mn liters of water at its 27 locations in FY20 (vs. 1,090mn litres in FY19) using Sewage Treatment Plants (STPs) and ultra-filtration units; recycled water meets 41% of of its total water demand
Biodiversity 9 Low Wipro is actively involved in biodiversity projects, which includes Butterfly park, Wetland zone and thematic garden in Bengaluru and Pune
Deforestation 8 LowWipro worked on agro-forestry project in rural Tamil Nadu, which helped 100 farmers in integrated farming by planting 40,000 trees; the project benefited 400 farmers through seed distribution and training programmes
Energy Efficiency 8 LowConsidering 2017 as base year, Wipro has set the following goals for FY17-FY22: (a) energy intensity in terms of EPI (Energy Performance Index): cumulative reduction of 7.8% in EPI over 5 years;(b) renewable energy: increase in renewable energy procurement by 55% to 120mn units
Waste Management 8 Low
Wipro’s current recycling rate is 81% (excluding construction and demolition debris); 84% of organic waste is recycled in-house and the balance sent as animal feed outside the campus; close to 100% of inorganic waste is recycled through approved partners; 70% of total mixed solid waste and scrap is currently recycled and the rest is sent for land-filling; Wipro targets to improve this to 80% by 2021; biomedical and hazardous waste is incinerated as per approved methods; waste management summary (excluding C&D): recycle - 81%, land-fill - 3%, other methods - 10% and incineration - 6%
Defence / Arms / Ammunition Exposure 9 Low It has no direct exposure to Defence/Arms/Ammunition space
Social
Customer Satisfaction 8 LowCustomers have multiple channels for raising grievances i.e. account managers, client engagement managers, customer advocacy group and through independently administered satisfaction surveys
Data Protection & Privacy 8 LowWipro’s IT infrastructure is certified under the ISO 27001 standard, which provides assurance in the areas of information security, physical security and business continuity; Wipro benchmarks the processes to meet the EU’s General Data Protection Regulation (GDPR) and SOX IT compliance requirements
Gender & Diversity 9 Low Female employees constitute ~35% of its total workforce
Employee Engagement 5 MediumAttrition level stood at ~11% in 3QFY21; Wipro conducts its annual Employee Engagement Survey (EES) survey in every March. We highlight medium risk due to possibility of higher attrition in newly acquired UK/US based consulting business (Capco)
Community Relations / Service 9 Low Wipro spent Rs1,818mn towards CSR activities in FY20
Human Rights 8 LowWipro claims to remain committed to protect human rights and effectively deals with such violations, when identified; its code of business conduct (COBC), supplier code of conduct and human rights policy are aligned with the globally accepted standards and frameworks like the UN Global Compact, UN Universal Declaration of Human Rights and International Labour Organization; the company is also one of the founding members of CII’s business for human rights initiative
Labour Standard 8 Low Wipro ensures necessary labour standards of different countries; it has arranged adequate workshops and awareness programmes against sexual harassment
Environmental, Social & Governance Matrix (ESGM)
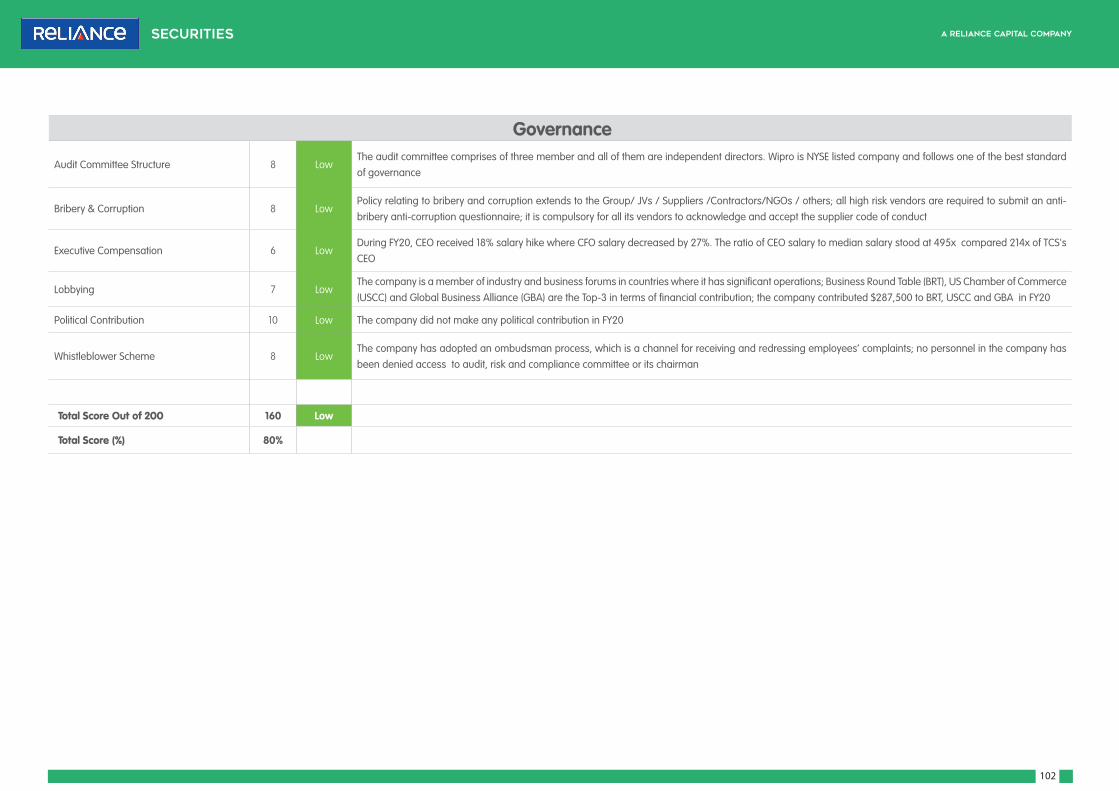
102
Governance
Audit Committee Structure 8 LowThe audit committee comprises of three member and all of them are independent directors. Wipro is NYSE listed company and follows one of the best standard of governance
Bribery & Corruption 8 LowPolicy relating to bribery and corruption extends to the Group/ JVs / Suppliers /Contractors/NGOs / others; all high risk vendors are required to submit an anti-bribery anti-corruption questionnaire; it is compulsory for all its vendors to acknowledge and accept the supplier code of conduct
Executive Compensation 6 LowDuring FY20, CEO received 18% salary hike where CFO salary decreased by 27%. The ratio of CEO salary to median salary stood at 495x compared 214x of TCS's CEO
Lobbying 7 LowThe company is a member of industry and business forums in countries where it has significant operations; Business Round Table (BRT), US Chamber of Commerce (USCC) and Global Business Alliance (GBA) are the Top-3 in terms of financial contribution; the company contributed $287,500 to BRT, USCC and GBA in FY20
Political Contribution 10 Low The company did not make any political contribution in FY20
Whistleblower Scheme 8 LowThe company has adopted an ombudsman process, which is a channel for receiving and redressing employees’ complaints; no personnel in the company has been denied access to audit, risk and compliance committee or its chairman
Total Score Out of 200 160 Low
Total Score (%) 80% Low

103
3QFY21 - Management Conference Call – Key Takeaways f The cloud environment is creating ample opportunities for the enterprises, which will
create new services, solutions and platforms, going forward.
f Demand environment witnessed a steady improvement during last 90 days led by digital transformation, operations and cloud infrastructure services.
f Deal pipeline includes good mix of both large and small deals. Deal wins included 12 large deals with TCV of US$1.2bn.
f During 3QFY21, 5 out of 7 sectors grew by 4% QoQ in CC terms. While the Consumers vertical recorded solid deal wins, growth in Financial Services vertical was led by digital operations. The management expects some pick-up in Energy vertical in the coming quarters. While Technology vertical bounced back despite furloughs, pick-up in Healthcare vertical was more of seasonal in nature.
f Strong expansion in operating margin was driven by quality of revenue and improved operating matrices (offshore mix, subcontractor and utilization). The company expects margin to be lower in 4QFY21E due to salary hike roll-over for about 80% of employees. While EBIT margin is likely to remain healthy in the medium-term, it would be lower than exceptional 3QFY21 level.
f The company expects IT Services business to be in the range of US$2,102-2,143mn in 4QFY21E, which would translate into a sequential growth of 1.5-3.5% vs. consensus expectation of 1-3%.

104
Key Charts
Exhibit 1: Wipro underperformed vs. larger peers during last decade Exhibit 2: Expect accelerated growth driven by improved deal bookings
Source: Company, RSec Research Source: Company, RSec Research
Exhibit 3: EBIT margin is expected to rebound in FY24E Exhibit 4: FCF conversation to remain healthy at >80% level
Source: Company, RSec Research Source: Company, RSec Research
Exhibit 5: At CMP, Wipro trades at 25% discount to average of larger peers i.e. Infosys and TCS
Exhibit 6: Improved earnings visibility led to elevated valuation against historical average
Source: RSec Research, Bloomberg Source: RSec Research, Bloomberg
6.7 6.5
9.010.3
12.9
15.5
0
2
4
6
8
10
12
14
16
18
Accenture Wipro IndustryRevenueGrowth
Infosys TCS Cognizant
(%)
US$ Revenue CAGR of FY10-FY20
17.1
19.6
17.8
18.5
19.0
16
16
17
17
18
18
19
19
20
20
FY20 FY21E FY22E FY23E FY24E
(%)
EBIT Margin
80 80
87
9293
70
75
80
85
90
95
FY20 FY21E FY22E FY23E FY24E
(%)
FCF Conversation
-50
-40
-30
-20
-10
0
10
20
2010 2011 2012 2013 2014 2015 2016 2017 2018 2019 2020 2021
(%)
Wipro (discount)/premium Over peers Average (Discount)/Premium
0
5
10
15
20
25
30
2010 2011 2012 2013 2014 2015 2016 2017 2018 2019 2020 2021
BEST_PE_12M_BF 17.9 AVG 14.9 STDEV+1 16.8 STDEV-1 12.9
3.6
1.6
16.8
12.5
9.9
0
2
4
6
8
10
12
14
16
18
FY20 FY21E FY22E FY23E FY24E
(%)
Revenue Growth (US$)
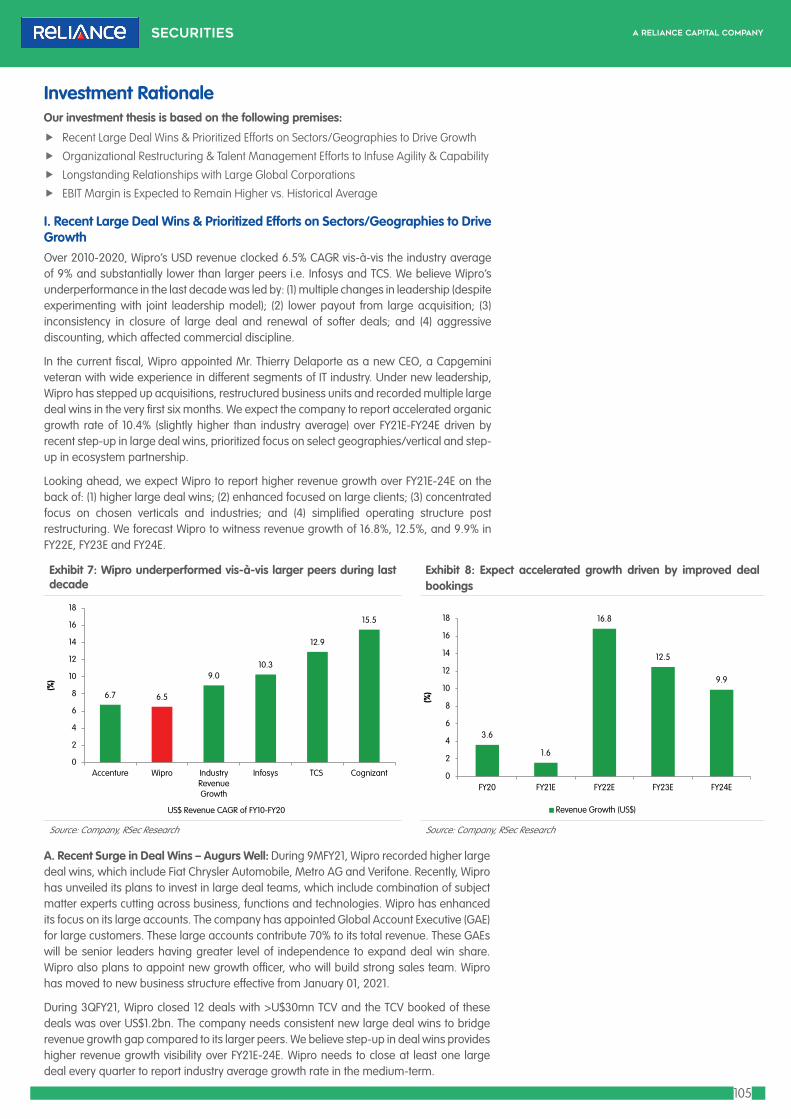
105
3.6
1.6
16.8
12.5
9.9
0
2
4
6
8
10
12
14
16
18
FY20 FY21E FY22E FY23E FY24E
(%)
Revenue Growth (US$)
Investment Rationale
I. Recent Large Deal Wins & Prioritized Efforts on Sectors/Geographies to Drive GrowthOver 2010-2020, Wipro’s USD revenue clocked 6.5% CAGR vis-à-vis the industry average of 9% and substantially lower than larger peers i.e. Infosys and TCS. We believe Wipro’s underperformance in the last decade was led by: (1) multiple changes in leadership (despite experimenting with joint leadership model); (2) lower payout from large acquisition; (3) inconsistency in closure of large deal and renewal of softer deals; and (4) aggressive discounting, which affected commercial discipline.
In the current fiscal, Wipro appointed Mr. Thierry Delaporte as a new CEO, a Capgemini veteran with wide experience in different segments of IT industry. Under new leadership, Wipro has stepped up acquisitions, restructured business units and recorded multiple large deal wins in the very first six months. We expect the company to report accelerated organic growth rate of 10.4% (slightly higher than industry average) over FY21E-FY24E driven by recent step-up in large deal wins, prioritized focus on select geographies/vertical and step-up in ecosystem partnership.
Looking ahead, we expect Wipro to report higher revenue growth over FY21E-24E on the back of: (1) higher large deal wins; (2) enhanced focused on large clients; (3) concentrated focus on chosen verticals and industries; and (4) simplified operating structure post restructuring. We forecast Wipro to witness revenue growth of 16.8%, 12.5%, and 9.9% in FY22E, FY23E and FY24E.
A. Recent Surge in Deal Wins – Augurs Well: During 9MFY21, Wipro recorded higher large deal wins, which include Fiat Chrysler Automobile, Metro AG and Verifone. Recently, Wipro has unveiled its plans to invest in large deal teams, which include combination of subject matter experts cutting across business, functions and technologies. Wipro has enhanced its focus on its large accounts. The company has appointed Global Account Executive (GAE) for large customers. These large accounts contribute 70% to its total revenue. These GAEs will be senior leaders having greater level of independence to expand deal win share. Wipro also plans to appoint new growth officer, who will build strong sales team. Wipro has moved to new business structure effective from January 01, 2021.
During 3QFY21, Wipro closed 12 deals with >U$30mn TCV and the TCV booked of these deals was over US$1.2bn. The company needs consistent new large deal wins to bridge revenue growth gap compared to its larger peers. We believe step-up in deal wins provides higher revenue growth visibility over FY21E-24E. Wipro needs to close at least one large deal every quarter to report industry average growth rate in the medium-term.
Exhibit 7: Wipro underperformed vis-à-vis larger peers during last decade
Exhibit 8: Expect accelerated growth driven by improved deal bookings
Source: Company, RSec Research Source: Company, RSec Research
Our investment thesis is based on the following premises:
f Recent Large Deal Wins & Prioritized Efforts on Sectors/Geographies to Drive Growth
f Organizational Restructuring & Talent Management Efforts to Infuse Agility & Capability
f Longstanding Relationships with Large Global Corporations
f EBIT Margin is Expected to Remain Higher vs. Historical Average
6.7 6.5
9.010.3
12.9
15.5
0
2
4
6
8
10
12
14
16
18
Accenture Wipro IndustryRevenueGrowth
Infosys TCS Cognizant
(%)
US$ Revenue CAGR of FY10-FY20
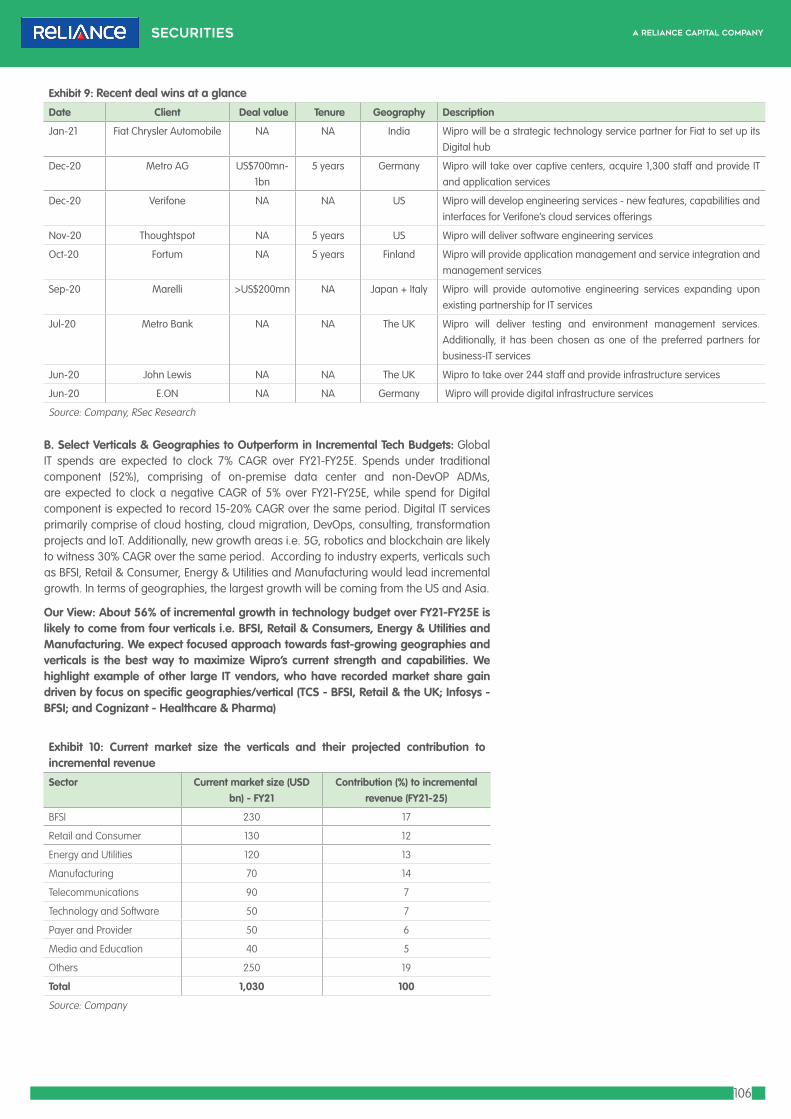
106
Exhibit 9: Recent deal wins at a glance
Date Client Deal value Tenure Geography Description
Jan-21 Fiat Chrysler Automobile NA NA India Wipro will be a strategic technology service partner for Fiat to set up its Digital hub
Dec-20 Metro AG US$700mn-1bn
5 years Germany Wipro will take over captive centers, acquire 1,300 staff and provide IT and application services
Dec-20 Verifone NA NA US Wipro will develop engineering services - new features, capabilities and interfaces for Verifone’s cloud services offerings
Nov-20 Thoughtspot NA 5 years US Wipro will deliver software engineering services
Oct-20 Fortum NA 5 years Finland Wipro will provide application management and service integration and management services
Sep-20 Marelli >US$200mn NA Japan + Italy Wipro will provide automotive engineering services expanding upon existing partnership for IT services
Jul-20 Metro Bank NA NA The UK Wipro will deliver testing and environment management services. Additionally, it has been chosen as one of the preferred partners for business-IT services
Jun-20 John Lewis NA NA The UK Wipro to take over 244 staff and provide infrastructure services
Jun-20 E.ON NA NA Germany Wipro will provide digital infrastructure services
Source: Company, RSec Research
Exhibit 10: Current market size the verticals and their projected contribution to incremental revenue
Sector Current market size (USD bn) - FY21
Contribution (%) to incremental revenue (FY21-25)
BFSI 230 17
Retail and Consumer 130 12
Energy and Utilities 120 13
Manufacturing 70 14
Telecommunications 90 7
Technology and Software 50 7
Payer and Provider 50 6
Media and Education 40 5
Others 250 19
Total 1,030 100
Source: Company
B. Select Verticals & Geographies to Outperform in Incremental Tech Budgets: Global IT spends are expected to clock 7% CAGR over FY21-FY25E. Spends under traditional component (52%), comprising of on-premise data center and non-DevOP ADMs, are expected to clock a negative CAGR of 5% over FY21-FY25E, while spend for Digital component is expected to record 15-20% CAGR over the same period. Digital IT services primarily comprise of cloud hosting, cloud migration, DevOps, consulting, transformation projects and IoT. Additionally, new growth areas i.e. 5G, robotics and blockchain are likely to witness 30% CAGR over the same period. According to industry experts, verticals such as BFSI, Retail & Consumer, Energy & Utilities and Manufacturing would lead incremental growth. In terms of geographies, the largest growth will be coming from the US and Asia.
Our View: About 56% of incremental growth in technology budget over FY21-FY25E is likely to come from four verticals i.e. BFSI, Retail & Consumers, Energy & Utilities and Manufacturing. We expect focused approach towards fast-growing geographies and verticals is the best way to maximize Wipro’s current strength and capabilities. We highlight example of other large IT vendors, who have recorded market share gain driven by focus on specific geographies/vertical (TCS - BFSI, Retail & the UK; Infosys - BFSI; and Cognizant - Healthcare & Pharma)
107
Exhibit 11: Current market size of the geographies and their projected contribution to incremental revenue
Geography Current market size (USD bn) - FY21
Contribution (%) to incremental revenue (FY21-FY25E)
Americas 470 42
Europe 290 26
APMEA 270 32
Total 1,030 100
Source: Company
C. Step-up in Partnership Ecosystem: Wipro has already developed alliances with AWS, Microsoft, Google, Salesforce, SAP and ServiceNow. It targets large opportunities in its strategic alliances and plans to scale up these businesses. Few of these relationships are longstanding partnerships and Wipro has added very senior leaders in partnership ecosystem. The company is also going to intensify its efforts to build the dedicated cloud studios and center of excellence. It targets to reach its large 100 customers with business solutions with strategic alliances.
Our View: We expect Wipro to benefit from strategic alliances with hyperscalers. Large IT companies have already stepped up their efforts for ecosystem partnership. We expect industry-focused cloud solutions, deep relationship with cloud providers and SaaS ecosystem as well as proactive sales efforts to drive Wipro’s market share gain.
II. Organizational Restructuring & Talent Management Efforts to Infuse Agility & Capability Wipro has restructured its business model from beginning of CY21 with simplified operating model by moving from >20 internal P&Ls earlier to 4 P&Ls. It has organized its capabilities under new Global Business Lines (GBLs), where it has consolidated synergetic capabilities and offerings under 2 business lines: (1) Integrated Digital Engineering & Application Services (IDEAS); and (2) Infra Cloud Ops Risk & Enterprise Cyber Security (ICOR). Delivery practice cells will be owned by these 2 GBLs, which will have technology, process and structured engineering practices to enable global scaling capabilities and solutions. Wipro has also identified geographies/verticals, where it will prioritize its offerings and capability.
Exhibit 12: Prioritizing geographies to accelerate growth
Source: Company

108
A. Prioritized Efforts on Geographies & Verticals: Under the new management, Wipro has prioritized specific markets and within which, it identified specific sectors to focus upon. Under new structure, the company will have sector-led approach towards the chosen markets and it will have global domain/industry expertise aligned to business facing units. Additionally, Wipro will reprioritize few geographies and verticals where the market attractiveness is either relatively lower or where it has weak presence. Additionally, the company targets to strengthen relationship with strategic clients by investing the relationships and focusing on proactively shaping and winning larger transformational deals.
• Wipro plans to have 4 Strategic Market Units (SMUs) i.e. (1) Americas-I; (2) Americas-II; (3) Europe; and (4) APMEA.
• SMUs will be primary access for go-to-market and will have full P&L ownership. Furthermore, the Americas-I and Americas-II SMUs will be structured by sectors.
• The Europe in APMEA SMU will be structured by prioritized countries with dedicated focus on certain identified sectors. The new operating model ensures increased focus on Europe and APMEA, in addition to the Americas.
Our View: We expect Wipro to benefit from the new organizational structure, as it focuses on chosen markets for efficient utilization of current strength and capabilities, which will increase the company’s focus on large clients. Additionally, lower number of internal P&Ls will reduce internal redundancies and duplication of processes, which will aid alignment of organizational goal and resultantly lead to cost saving.
B. Expanding Focus on Leveraging Employee Talent Pool: In term of workforce, Wipro has a strong talent pool of >180K employees. New leadership plans to build talent at scale by hiring deep domain and tech expertise over the next three years. The management also targets re-skilling workforce from legacy to next generation by focusing on Cloud, Analytics, Dev-ops and Digital technologies. We also highlight that Wipro is one of the earliest follower of localization model, which is currently having ~70% localized workforce in the Americas.
Recently, Wipro appointed Mr. Tomoaki Takeuchi as Country Head & Managing Director for Japan. Before joining Wipro, he was heading Cognizant’s Japan operations, prior to which he held leadership positions at EDS, Sun Microsystems and Apple in Japan. Wipro has recently appointed Mr. Michael Seiger as Country Head and Managing Director for Germany and Austria. Prior to joining Wipro, Seiger was the Global Head of Application Management at Atos SE, where he led modernization of the organization’s portfolio.
We believe these appointments are part of Wipro's three-year roadmap to strengthen global leadership team across the chosen markets.
Exhibit 13: An Overview of Strategic Market Units (SMUs) & Global Business Lines (GBLs)
Source: Company

109
III. Longstanding Relationships with Large Global CorporationsAs Wipro is one of early entrants into IT services industry, it enjoys long-term relationship with diversified set of large global corporations. Currently, Wipro has 1,074 active clients, which stood at 845 in FY10. Currently, the company has 15 and 25, US$100mn and US$50mn client accounts, respectively. In last four quarters, it has added 293 new clients. Notably, Wipro enjoys multi-decade relationship with some of the large global corporations. The client pool is well-diversified across different verticals and technology domains.
Exhibit 14: Number of active clients (US$100mn) over the years Exhibit 15: Number of total active clients over the years
Source: Company Source: Company
According to industry consultant, Wipro is star performer and leader in many IT services practices, which are summarized in the following. Additionally, Wipro is the industry leader as system integrator as well.
Our View: Wipro has diversified client base and it is Tier-I integrator/IT service provider for many large corporate. We believe Wipro can improve its wallet share in client ecosystem by leveraging its strong talent pool, refreshed industry solutions and partnership ecosystem. The company enjoys scale with multi-industry and multi-geography presence and longstanding relationships with global industry leaders, which we believe provide growth visibility in the medium-term.
A. Analysis of Key US Clients: We have analysed Labour Condition Applications (LCAs) of Wipro for FY20 (Oct’19-Sept’20), which suggests that the company’s Top-20 US clients list comprises of financial services, technology, retail, and energy firms. We have also analysed key competitors in large accounts. The key conclusions of our analysis are given in the following:
I. There are 9 client accounts in Wipro’s Top-20 US client list, which are common in other large Indian IT peers.
II. Wipro remains a dominant IT vendor (among Top-5) in most of its Top-20 accounts. The company competes with not only with Top-4 IT players, but also with the mid-cap IT names i.e. Mphasis and L&T Infotech.
III. We also highlight HR firms such as Randstad and KFORCE have a decent workshare in key accounts. We believe this rise was driven by protective visa regime in the US. We expect the large Indian IT firms to benefit from comparatively softer tone of the Biden Administration on immigration front.
Exhibit 16: Offerings cited as leader and star performer
Offerings Capability
Star Application & Digital Services in Life and Annuities, IoT Services and Digital Interactive Experience Services
Leader Next Generation Application Management Services, Application and Digital Service in Capital Markets, Cloud Native Application Development Service, System Integrator Capabilities on Google Cloud Platform, System Integrator Capabilities on Microsoft Azure, System Integrator Capabilities on Amazon WEB Services, Healthcare payer Operations, Healthcare payer Operations and Artificial Intelligence Services
Source: Everest

110
IV. While the IT vendor ecosystem is dominated by larger vendors, there are multiple medium and small unlisted IT vendors as well. Thus, we see a huge scope for vendor consolidation in Top-20 US accounts, going forward.
V. With recent acquisition of Capco’s consulting business, we expect Wipro can gain market share in its large financial services accounts, going forward.
Exhibit 17: Wipro's Top 20 US Clients
Clients Key Competition
Technology f TCS, Infosys, Quest Global, Cognizant, Deloitte, Red Oak Technologies, DGN Technologies, Antra, Bridgenexus,Compunnel Software, Mastech, Mythri
Financial Services f Infosys, Mphasis, Mastech, Compunnel Software Group, Randstad Tech, Comtek, Dots Technology, HCLT, Persistent, Eureka, M2 Source
Financial Services f Cognizant, Compunnel Software Group, Mastech Digital, Deloitte, Vak IT, Federal Soft Systems, Accenture
Financial Services f TCS, LTI, Infosys, Iris Software, Virtusa, NTT data Services, Accenture, Mitchell/Martin, Capgemini, Maveric, Incandescent Tech, Synechron Inc, Oracle Financial Services, E&Y, Photon
Logistics f Atos, Mphasis, HCLT, Deloitte, Sai Technology, KFORCE, Compunnel Software Group, Infogain, Vidorra
Financial Services f Atos, Maxima Consulting, Oracle Financial Services, Cognizant, TCS, Mastech Digital, IBM, Hexaware
Technology f TCS, SRS Consulting, LTI, Infosys, Zensar, Tech Mahindra, Accenture, Persistent, HCLT, Cognizant, Randstand Technology, Urpan Technology, Capgemini, Enquero, Onstak
Retail/Pharma f CGI Technologies, Cognizant, TCS, Accenture, Mastech, Randstad, Deloitte, Compunnel Software, EPAM, Mastech, Virtusa, Bradford
Technology f Deloitee, KFORCE, Mphasis, TCS, Infosys, Inspirisys, Accenture, Capgemini, Quest Global, Unique Key Resources, Adecco, System Soft Technologies, Softcom, ITC Infotech
Professional Services f Accenture, TCS, Randstad, Titan Data Group, Javen Technology, Mastech, Techvision, Javen Technology
Technology f HCLT, Zen3 Infosolutions, Infosys, Couloir, TCS, Cirquetech, Brillio, KFORCE, Accenture, Aricent Tech, Cognizant, Isite Technology, Lasai Technolgogies
Retail f KFORCE, Infosys, Cognizant, Populus, Centizen, Cloudwick, E&Y, Mastech, TCS, Centizen, Invincible Tech, Mavensoft
Financial Services f CSC, TechM, Compunnel Software Group, Mastech, Altimetrik, EPAM, High Quartile, KFORCE, EPAM, Cognizant
Automobile f L&T Infotech, L&T Technology, CSC Covansys, Delta Computer Consulting, Accenture, IBM, Mastech Digital, HCLT, Altair, Product design, Infosys, Cognizant
Financial Services f Capgemini, KFORCE, Cognizant, TCS, Xavient Digital, E&Y, CGI Technology, Conch Technology
Financial Services f Cognizant, Infosys, TCS, Hexaware, Mastech, Americcloud Solutions, Oracle Financial Services Software, Atos, Synopsis, E&Y, Compunnel Software Group, Virtusa, Innovative Consulting
Energy f Infosys, HCLT, NITCO, Conglomerate IT Services, E&Y, Genuine IT
Retail/Consumer Goods f TCS, Larsen & Toubro Infotech, Cognizant, IBM, deloitte, HCLT, Capgemini, Accenture, L&T Technology Services, I3 Infotech, Microexcel, BirlaSoft, Tech Mahindra
Financial Services f TCS, Cognizant, KFORCE, Mastech Digital, Federal Soft Systems, 8K Miles Health Cloud
Energy f L&T Infotech, Tech Mahindra, Accenture, L&T Technology Services, Compunnel Software Group, EPAM
Financial Services Cognizant, Accenture, Lucent Systems, TCS, IGate Solutions
Source: RSec Research, Department of Labour (US); Note: Grey highlight denotes common Top-20 client accounts for Top-4 IT names

111
41.0%
55.0%
4.0%
Europe North America Asia
48%
38%
14%
Consulting Digital Technology
Exhibit 18: Geographical break-up of Capco
Exhibit 19: Sector break-up of Capco Exhibit 20: Service line break-up of Capco
Source: Company, RSec Research Source: Company, RSec Research Source: Company, RSec Research
B. Acquisition of Capco to Embolden Financial Services Vertical Transformation Practise: Wipro has signed an agreement to acquire Capco, a global management and technology consultancy firm that offers digital, consulting and technology services to financial institutions in the Americas, Europe and the Asia Pacific.
I. Purchase Consideration: US$1,450mn, all in cash (~2x of CY20 sales). The deal is expected to close during 1QFY22E.
II. Brief about Capco: Headquartered in London, Capco was founded in 1998. It has 5,000 employees on 30 worldwide locations. Its consolidated revenue stood at US$734mn, US$693mn, US$720mn in CY18, CY19 and CY20, respectively (YE December).
III. Acquisition Rationale: (1) To build a global financial services business of US$3.2bn (36% of sales) from current level of US$2.5bn (30.5% of sales) with strong consulting and business transformation footprint; (2) addition of 30 new BFSI strategic clients; and (3) sector alignment and expanded BFSI leadership.
IV. EBIT Margin: While the margin of Capco is healthy, the acquisition will dilute Wipro IT services’ EBIT margin by ~2% in FY22E (large component of which will be a non-cash charge). Looking ahead, we expect the margin to improve on the back of revenue and cost synergies.
V. EPS: Despite being EPS is positive, the deal is expected to be EPS dilutive in the first year (FY22E). We expect EPS to turn accretive from the third year (FY24E) onwards.
VI. Cash in Hand: Wipro enjoys strong net cash to the tune of ~US$3bn post Capco deal.
Our View: Acquisition of Capco extends depth of Wipro's financial services practice. In our view, scale and depth of offering have become key factors of large deal wins. Post-acquisition, Wipro’s financial services vertical would contribute ~35% to its total revenue (US$3.2bn), which will help the company to compete with larger peers such as Infosys, which has ~US$4.2bn financial services practice. We believe that expect Capco margin could be improved with accelerated hiring in India geography (16% of total workforce) and higher revenue synergies.
51%
34%
10%5%
Banking & Payments Capital Markets Wealth Insurance

112
Exhibit 23: G&A expenses over the years (FY18-9MFY21)
Source: Company, RSec Research
• Pricing Power: The management expects the pricing power to improve on the back of: (1) increasing share of digital revenue, which has attractive pricing power; (2) increasing share of outcome-based deals; and (3) focus on stepping up the value chain of the clients’ ecosystem.
• Operational Excellence: The management targets to reduce variable workforce and expects increased productivity due to automation efforts (Infosys has highlighted ~100-150bps annual margin improvement due to automation).
• Situational Improvement: We expect near-term benefit of lower travel expenses to continue for the next 2-3 quarters.
IV. EBIT Margin is Expected to Remain Higher vs. Historical Average Wipro’s new leadership targets to accelerate profitable growth in the medium-term. We expect the company to step-up investments in talent, capabilities, large deals and partnership ecosystem and some of these higher expenses would be offset by the benefits of recent efforts on organizational restructuring front. With enhanced efforts on margin front since FY16, Wipro has been able to record ~300bps improvement in margin over last four years.
Looking ahead, we expect the company’s EBIT margin to remain in the range of 18-19% over FY22E-FY24E compared to 16-18% over FY18-FY20 driven by structural levers, improving pricing powers, operational excellence and some recent situational opportunities.
Exhibit 21: EBIT margin declined due to muted revenue growth Exhibit 22: Expect EBIT margin to rebound in FY24E on the back of revenue synergies from Capco acquisition
Source: Company, RSec Research Source: Company, RSec Research
A. Structural Measures: These measures include prioritization of geographies/verticals and reducing the number of P&Ls under newer operating model. The management expects G&A expenses to remain lower than the historical average driven by remote working operating model.
20.318.9
17.1 16.417.5
0
5
10
15
20
25
FY15 FY16 FY17 FY18 FY19
(%)
EBIT Margin
17.1
19.6
17.8
18.5
19.0
16
16
17
17
18
18
19
19
20
20
FY20 FY21E FY22E FY23E FY24E
(%)
EBIT Margin
5.3 5.3
4.9
5.8
4
5
6
FY18 FY19 FY20 9MFY21
(%)
G&A Expense as a % of revenue

113
B. Expect Further Progress on Return Ratios & Capital Allocation Policy: In recent years, Wipro has been witnessing improved margin and efficient working capital management. Despite this, the company stands lower on RoE parlance compared to larger peers, in our view. We believe the management needs to step up efforts to improve asset turnover ratios (high due to acquisitive nature in past, high cash on hand) and payout ratios. Its capital allocation policy states that 45-50% of net income should be returned to the shareholders. Additionally, the company targets to payback excess cash to the shareholders as well. As the company has reported FCF conversation in the excess of 80% during last three tears, we expect it should aim at expanding payout ratios.
Exhibit 24: FCF conversation to remain healthy at >80% level Exhibit 25: RoCE
Source: Company, RSec Research Source: Company, RSec Research
80 80
87
9293
70
75
80
85
90
95
FY20 FY21E FY22E FY23E FY24E
(%)
FCF Conversation
17.3
16.0
15.0
15.415.6
14
14
15
15
16
16
17
17
18
FY20 FY21E FY22E FY23E FY24E
(%)
RoCE

114
Outlook & ValuationWipro outperformed Nifty and Nifty IT by 40% and 2%, respectively in last 12 months. Going ahead, we expect its revenue to grow at the industry average driven by recent surge in deal wins, prioritized focused areas and step-up in investment in talent and partnerships. At CMP, the stock trades at 16.3x of FY24E EPS, which is 25% discount to average of larger peers i.e. Infosys and TCS. We initiate coverage on Wipro with BUY and a 2-Year Target Price of Rs565 (valuing the stock at 22x PE on FY24E earnings), which implies 35% upside from the current level.
Exhibit 26: At CMP, Wipro trades at 25% discount to average of larger peers i.e. Infosys and TCS
Exhibit 27: Wipro valuation history
Source: RSec Research, Bloomberg Source: RSec Research, Bloomberg
-50
-40
-30
-20
-10
0
10
20
2010 2011 2012 2013 2014 2015 2016 2017 2018 2019 2020 2021
(%)
Wipro (discount)/premium Over peers Average (Discount)/Premium
0
5
10
15
20
25
30
2010 2011 2012 2013 2014 2015 2016 2017 2018 2019 2020 2021
BEST_PE_12M_BF 17.9 AVG 14.9 STDEV+1 16.8 STDEV-1 12.9

115
Key Financials
Profit & Loss StatementY/E Mar (Rs mn) FY19 FY20 FY21E FY22E FY23E FY24E
Wipro IT Revenues (US$ mn) 8,190 8,286 8,097 9,527 10,573 11,467
Growth (%) 1.6 1.2 (2.3) 17.7 11.0 8.5
Net Revenues 5,85,845 6,10,232 6,12,005 7,22,507 8,10,897 8,89,804
Growth (%) 7.5 4.2 0.3 18.1 12.2 9.7
EBITDA 1,21,926 1,25,890 1,40,686 1,57,204 1,82,365 2,04,611
EBITDA (%) 20.8 20.6 23.0 21.8 22.5 23.0
EBITDA Growth (%) 10.2 3.3 11.8 11.7 16.0 12.2
D&A 19,470 20,859 25,933 28,900 32,436 35,592
EBIT 1,02,456 1,05,031 1,14,753 1,28,303 1,49,929 1,69,018
EBIT (%) 17.5 17.2 18.8 17.8 18.5 19.0
EBIT Growth (%) 14.4 2.5 9.3 11.8 16.9 12.7
Other Income 15,548 16,753 13,038 12,548 13,209 16,797
PBT 1,18,004 1,21,784 1,27,791 1,40,852 1,63,138 1,85,816
Tax (incl deferred) 26,347 24,799 29,015 29,579 34,259 39,021
PAT 91,657 96,985 98,776 1,11,273 1,28,879 1,46,794
PAT Growth (%) 7.4 5.8 1.8 12.7 15.8 13.9
EPS (Rs) 15.2 16.5 18.3 19.5 22.6 25.7
EPS Growth (%) 12.9 8.8 11.0 6.4 15.8 13.9
Balance SheetY/E Mar (Rs mn) FY19 FY20 FY21E FY22E FY23E FY24E
SOURCES OF FUNDS
Share Capital - Equity 12,068 11,427 11,427 11,427 11,427 11,427
Reserves & other 5,52,158 5,46,031 6,38,387 7,26,884 8,21,598 9,22,840
Total Shareholders' Funds 5,64,226 5,57,458 6,49,814 7,38,311 8,33,025 9,34,267
Total Current Liabilities 2,14,350 2,16,393 2,13,717 2,27,340 2,38,238 2,47,966
Total Debt 48,035 41,336 41,336 41,336 41,336 41,336
TOTAL SOURCES OF FUNDS 8,29,248 8,17,062 9,07,354 10,09,029 11,14,126 12,24,509
APPLICATION OF FUNDS
Fixed Assets 86926 97868 96680 169058 163851 156434
Other Long term assets 1,70,416 1,99,343 1,98,834 2,29,853 2,27,621 2,24,443
Total Non Current Assets 2,57,342 2,97,211 2,95,514 3,98,911 3,91,472 3,80,877
Accounts Receivable 1,00,489 1,04,474 1,10,664 1,30,645 1,46,628 1,60,896
Inventory 3,951 1,865 1,865 1,865 1,865 1,865
Cash & Bank 1,58,529 1,44,499 2,30,298 2,08,596 3,05,148 4,11,858
Other Current Assets 3,08,937 2,69,013 2,69,013 2,69,013 2,69,013 2,69,013
Total Current Assets 5,71,906 5,19,851 6,11,840 6,10,119 7,22,654 8,43,632
TOTAL APPLICATION OF FUNDS 8,29,248 8,17,062 9,07,354 10,09,030 11,14,126 12,24,509

116
Cash Flow StatementY/E Mar (Rs mn) FY19 FY20 FY21E FY22E FY23E FY24E
PBT 90,173 97,713 1,04,597 1,11,261 1,28,832 1,46,715
Non-operating & EO items 4,653 12,308 15,123 17,043 21,097 22,304
Depreciation 19,474 20,862 25,933 28,900 32,436 35,592
Working Capital Change 27,165 (23,856) (8,866) (6,358) (5,085) (4,540)
Income Tax paid (25,149) (6,384) (29,015) (29,579) (34,259) (39,021)
Cash Flow from Operations (a) 1,16,316 1,00,643 1,07,772 1,21,267 1,43,020 1,61,049
Capex (22,781) (23,497) (24,236) (24,997) (24,997) (24,997)
Acquisitions 26,103 (10,003) 0 (1,07,300) 0 0
Other 46,804 67,512 19,802 19,312 19,973 23,561
Cash Flow from Investing (b) 50,126 34,012 (4,434) (1,12,985) (5,024) (1,436)
Debt Issuance/(Repaid) (38,878) (26,038) 0 0 0 0
Share capital Issuance/(buyback)/Dividend/others
(10,491) (1,24,960) (18,151) (29,540) (40,928) (52,316)
Cash Flow from Financing (c) (49,369) (1,50,998) (18,151) (29,540) (40,928) (52,316)
NET CASH FLOW (a+b+c) 1,17,073 (16,343) 85,187 (21,258) 97,068 1,07,297
Free Cash Flow 93,535 77,146 83,537 96,270 1,18,023 1,36,052
Key RatiosY/E Mar FY19 FY20 FY21E FY22E FY23E FY24E
Profitability (%)
EBITDA Margin 20.8 20.6 23.0 21.8 22.5 23.0
EBIT Margin 17.5 17.2 18.8 17.8 18.5 19.0
APAT Margin 15.6 15.9 16.1 15.4 15.9 16.5
RoE 16.1 16.1 15.1 14.2 14.6 15.7
RoCE 16.0 17.3 16.0 15.0 15.4 15.6
RoA 10.9 11.3 10.9 10.5 11.0 12.0
Efficiency
Tax Rate (%) 22.3 20.4 22.7 21.0 21.0 21.0
Debtors (days) 63 62 66 66 66 66
Paybles (days) 39 47 45 45 45 45
FCF/NI (%) 102 80 85 87 92 93
Net Debt/EBITDA (x) (0.9) (0.8) (1.3) (1.1) (1.4) (1.8)
Net Debt/Equity (x) (0.2) (0.2) (0.3) (0.2) (0.3) (0.4)
Per Share Data (Rs)
EPS 15.2 16.5 18.3 19.5 22.6 25.7
DPS 1.0 1.0 2.0 4.0 6.0 8.0
BVPS 93.7 95.4 113.9 129.4 146.0 163.7
FCF 15.5 13.2 14.6 16.9 20.7 23.8
Valuation (x)
P/E 27.6 25.4 22.9 21.5 18.6 16.3
P/BV 4.5 4.4 3.7 3.2 2.9 2.6
EV/EBITDA 22.0 20.7 18.7 16.6 14.8 13.8
FCF/EV (%) 3.5 3.0 3.2 3.7 4.4 4.8
FCF/mkt cap (%) 3.7 3.1 3.5 4.0 4.9 5.7
Dividend Yield (%) 0.2 0.2 0.5 1.0 1.4 1.9

117
Company BackgroundWipro Limited is a leading global information technology, consulting and business process services company, headquartered in Bengaluru. It has a headcount of >180,000 serving clients in 110 countries across six continents. Wipro reported US$8.3bn revenue in FY20.
Exhibit 28: Geography wise revenue break-up Exhibit 29: Service Vertical wise revenue break-up
Source: Company, RSec Research Source: Company, RSec Research

118
74.0%
14.5%
10.6%
0.9%
Promoter Institutional Retail Corp Bodies
Management TeamName Designation Brief Profile
Mr. Thierry Delaporte CEO & MD Mr. Delaporte began his career in 1992 as a Senior Auditor with Arthur Andersen in Paris and London. He joined Capgemini in 1995, and over the years held several leadership positions, driving operational excellence and managing technological disruption. He has a Bachelor’s degree in Economics & Finance and a Masters in Law from Sorbonne University.
Mr. Sanjeev Singh COO Mr. Singh has over 25 years of senior leadership experience across the services and industrial sectors, during which he built new businesses, led large global businesses and managed strategic client relationships. Prior to becoming COO, he was the Head of Wipro’s India Business (State-Run Enterprises & Products), Chief Risk Officer & Chief Quality Officer. Mr. Singh is an alumnus of IIT, Madras and IIM, Kozhikode.
Mr. Jatin Dalal CFO Mr. Dalal joined Wipro in 2002 and over the years, he has worked in diverse roles in Finance. He served as CFO of Wipro’s Global IT Business from 2011 to 2015. He became group CFO in 2015. He is a qualified Chartered Accountant (CA), India, Cost and Management Account (CMA), Chartered Global Management Accountant (CGMA), UK and a Chartered Financial Analyst (CFA).
Mr. Saurabh Govil President and CHRO
Mr. Govil has a wide-ranging experience of over three decades in the industry. Prior to joining Wipro in 2009, he held leadership positions in organizations such as ITC and GE. Mr. Govil is an alumnus of XLRI, Jamshedpur where he completed his Masters in Human Resources.
Source: Company
Key Shareholders
Holder Name Ownership percentage
Life Insurance Corp of India 3.9
BlackRock Inc 1.0
ICICI Prudential Asset Management 0.7
Norges Bank 0.6
Vanguard Group Inc/The 0.6
SBI Funds Management Pvt Ltd 0.5
Dimensional Fund Advisors LP 0.4
Axis Asset Management Co Ltd/India 0.4
State of California 0.3
Government Pension Investment Fund 0.2
Source: RSec Research
Shareholding Pattern
Source: Bloomberg
119
Reliance Securities Limited (RSL), the broking arm of Reliance Capital is one of the India’s leading retail broking houses. Reliance Capital is amongst India’s leading and most valuable financial services companies in the private sector. Reliance Capital has interests in asset management and mutual funds, life and general insurance, commercial finance, equities and commodities broking, wealth management services, distribution of financial products, private equity, asset reconstruction, proprietary investments and other activities in financial services. The list of associates of RSL is available on the website www.reliancecapital.co.in. RSL is registered as a Research Analyst under SEBI (Research Analyst) Regulations, 2014
General Disclaimers: This Research Report (hereinafter called ‘Report’) is prepared and distributed by RSL for information purposes only. The recommendations, if any, made herein are expression of views and/or opinions and should not be deemed or construed to be neither advice for the purpose of purchase or sale of any security, derivatives or any other security through RSL nor any solicitation or offering of any investment /trading opportunity on behalf of the issuer(s) of the respective security(ies) referred to herein. These information / opinions / views are not meant to serve as a professional investment guide for the readers. No action is solicited based upon the information provided herein. Recipients of this Report should rely on information/data arising out of their own investigations. Readers are advised to seek independent professional advice and arrive at an informed trading/investment decision before executing any trades or making any investments. This Report has been prepared on the basis of publicly available information, internally developed data and other sources believed by RSL to be reliable. RSL or its directors, employees, affiliates or representatives do not assume any responsibility for, or warrant the accuracy, completeness, adequacy and reliability of such information / opinions / views. While due care has been taken to ensure that the disclosures and opinions given are fair and reasonable, none of the directors, employees, affiliates or representatives of RSL shall be liable for any direct, indirect, special, incidental, consequential, punitive or exemplary damages, including lost profits arising in any way whatsoever from the information / opinions / views contained in this Report.
Risks: Trading and investment in securities are subject to market risks. There are no assurances or guarantees that the objectives of any of trading / investment in securities will be achieved. The trades/ investments referred to herein may not be suitable to all categories of traders/investors. The names of securities mentioned herein do not in any manner indicate their prospects or returns. The value of securities referred to herein may be adversely affected by the performance or otherwise of the respective issuer companies, changes in the market conditions, micro and macro factors and forces affecting capital markets like interest rate risk, credit risk, liquidity risk and reinvestment risk. Derivative products may also be affected by various risks including but not limited to counter party risk, market risk, valuation risk, liquidity risk and other risks. Besides the price of the underlying asset, volatility, tenor and interest rates may affect the pricing of derivatives.
Disclaimers in respect of jurisdiction: The possession, circulation and/or distribution of this Report may be restricted or regulated in certain jurisdictions by appropriate laws. No action has been or will be taken by RSL in any jurisdiction (other than India), where any action for such purpose(s) is required. Accordingly, this Report shall not be possessed, circulated and/or distributed in any such country or jurisdiction unless such action is in compliance with all applicable laws and regulations of such country or jurisdiction. RSL requires such recipient to inform himself about and to observe any restrictions at his own expense, without any liability to RSL. Any dispute arising out of this Report shall be subject to the exclusive jurisdiction of the Courts in India.
Disclosure of Interest: The research analysts who have prepared this Report hereby certify that the views /opinions expressed in this Report are their personal independent views/opinions in respect of the securities and their respective issuers. None of RSL, research analysts, or their relatives had any known direct /indirect material conflict of interest including any long/short position(s) in any specific security on which views/opinions have been made in this Report, during its preparation. RSL’s Associates may have other potential/material conflict of interest with respect to any recommendation and related information and opinions at the time of publication of research report. RSL, its Associates, the research analysts, or their relatives might have financial interest in the issuer company(ies) of the said securities. RSL or its Associates may have received a compensation from the said issuer company(ies) in last 12 months for the brokerage or non brokerage services.RSL, its Associates, the research analysts or their relatives have not received any compensation or other benefits directly or indirectly from the said issuer company(ies) or any third party in last 12 months in any respect whatsoever for preparation of this report.
The research analysts has served as an officer, director or employee of the said issuer company(ies)?: No
RSL, its Associates, the research analysts or their relatives holds ownership of 1% or more, in respect of the said issuer company(ies).?: No
Copyright: The copyright in this Report belongs exclusively to RSL. This Report shall only be read by those persons to whom it has been delivered. No reprinting, reproduction, copying, distribution of this Report in any manner whatsoever, in whole or in part, is permitted without the prior express written consent of RSL.
RSL’s activities were neither suspended nor have defaulted with any stock exchange with whom RSL is registered. Further, there does not exist any material adverse order/judgments/strictures assessed by any regulatory, government or public authority or agency or any law enforcing agency in last three years. Further, there does not exist any material enquiry of whatsoever nature instituted or pending against RSL as on the date of this Report.
Important These disclaimers, risks and other disclosures must be read in conjunction with the information / opinions / views of which they form part of.
RSL CIN: U65990MH2005PLC154052. SEBI registration no. (Stock Broker: INZ000172433, Depository Participants: CDSL IN-DP-257-2016 IN-DP-NSDL-363-2013, Research Analyst: INH000002384); AMFI ARN No.29889.
Change in Ratings
f We have shifted to BUY & SELL ratings only and no longer continue with HOLD rating.
f We have also shifted to 2-year Target Price from 1-year Target Price earlier.
Rating Rationale
Market Cap BUY SELL
Large Cap >15% <15%
Mid/Small Cap >20% <20%
Score For < 5 Red High Risk For 5 Blue Medium Risk For > 5 Green Low Risk
Total Score (%) For < 50 Red High Risk For 50 Blue Medium Risk For > 50 Green Low Risk