India Convergence of Agricultural Interventions in ...
170
India Convergence of Agricultural Interventions in Maharashtra's Distressed Districts Programme Project Completion Report Document Date: 30/06/2019 Project No. 1100001470 Loan ID 1000003372 Asia and the Pacific Division Programme Management Department This document will be publicly disclosed unless there is written dissent on its disclosure by the Borrower at the time of this document submission to IFAD or no later than the project closing date.
Transcript of India Convergence of Agricultural Interventions in ...

India
Convergence of Agricultural Interventions in Maharashtra's Distressed DistrictsProgramme
Project Completion Report
Document Date: 30/06/2019
Project No. 1100001470
Loan ID 1000003372
Asia and the Pacific Division Programme Management Department
This document will be publicly disclosed unless there is written dissent on its disclosure by the Borrower at the time of this document submissionto IFAD or no later than the project closing date.


Map of the project area

Currency Equivalents
Currency EquivalentsCurrency Unit Indian RupeeUSD 1.0 =INR 70 Weights and measures1 kilogram = 1000 g
1 000 kg = 2.204 lb.
1 kilometre (km) = 0.62 mile
1 metre = 1.09 yards
1 square metre = 10.76 square feet
1 acre = 0.405 hectare
1 hectare = 2.47 acres

Weights and measures
1 Kilogram = 1000 g1 000 kg = 2.204 lb.1 kilometre (km) = 0.62 mile1 metre = 1.09 yards1 square metre = 10.76 square feet1 acre = 0.405 hectare1 hectare = 2.47 acres
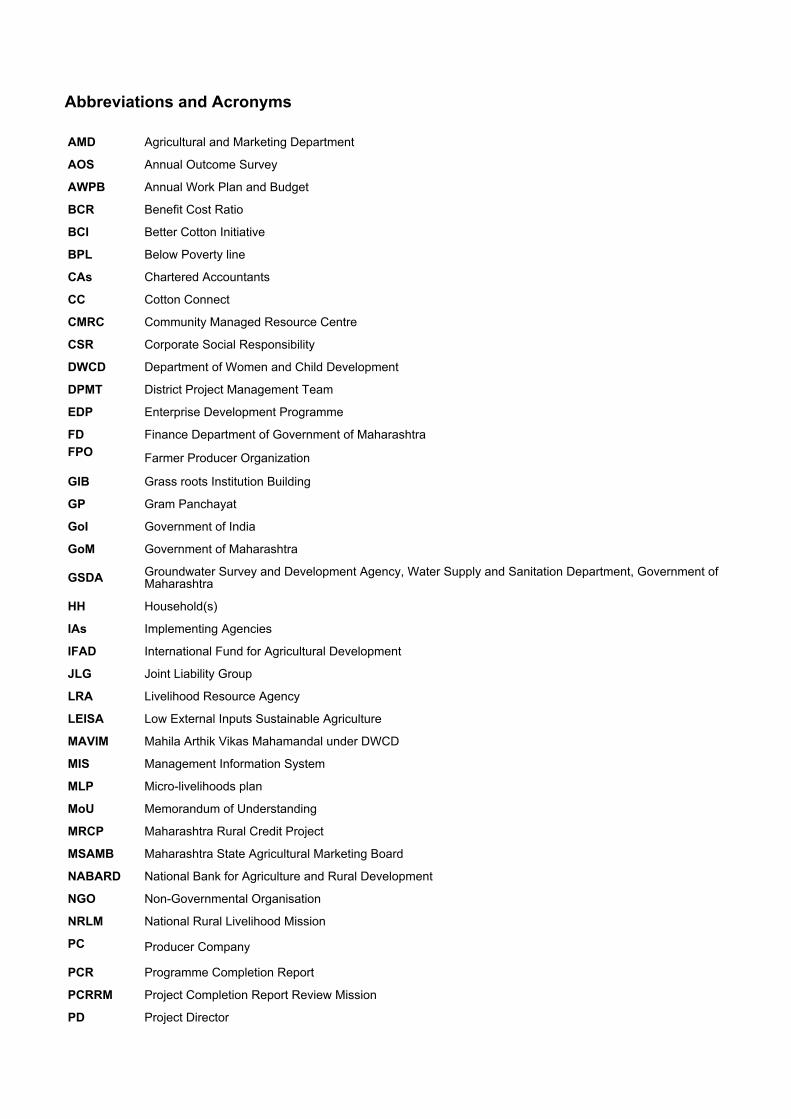
Abbreviations and Acronyms
AMD Agricultural and Marketing Department
AOS Annual Outcome Survey
AWPB Annual Work Plan and Budget
BCR Benefit Cost Ratio
BCI Better Cotton Initiative
BPL Below Poverty line
CAs Chartered Accountants
CC Cotton Connect
CMRC Community Managed Resource Centre
CSR Corporate Social Responsibility
DWCD Department of Women and Child Development
DPMT District Project Management Team
EDP Enterprise Development Programme
FD Finance Department of Government of MaharashtraFPO Farmer Producer Organization
GIB Grass roots Institution Building
GP Gram Panchayat
GoI Government of India
GoM Government of Maharashtra
GSDA Groundwater Survey and Development Agency, Water Supply and Sanitation Department, Government ofMaharashtra
HH Household(s)
IAs Implementing Agencies
IFAD International Fund for Agricultural Development
JLG Joint Liability Group
LRA Livelihood Resource Agency
LEISA Low External Inputs Sustainable Agriculture
MAVIM Mahila Arthik Vikas Mahamandal under DWCD
MIS Management Information System
MLP Micro-livelihoods plan
MoU Memorandum of Understanding
MRCP Maharashtra Rural Credit Project
MSAMB Maharashtra State Agricultural Marketing Board
NABARD National Bank for Agriculture and Rural Development
NGO Non-Governmental Organisation
NRLM National Rural Livelihood Mission
PC Producer Company
PCR Programme Completion Report
PCRRM Project Completion Report Review Mission
PD Project Director

PMU Project Management Unit
PRIs Panchayat Raj Institutions
RGB Representative Governing BodyRIMS Results and Impact Measurement System
RMOs Regional Monitoring Officer
SC Scheduled Caste
SDR Special Drawing Rights
SHG Self Help Groups
SPAC State Programme Advisory CommitteeSPARC Small Producers Agro-Resources Centre
SRTT Sri Ratan Tata Trust
ST Scheduled Tribe
SWC Soil and Water Conservation
TWD Tribal Welfare Department of GoM
UPI Unified Payment interferences
USD United States Dollar
VDC Village Development Committee
VLC Village Level Committees promoted by MAVIM
VO Village Level Organisations promoted under NRLM
WAs Withdrawal Applications

Project at a glance
Region Asia and the Pacific Division Project at Risk Status Potential problem
Country India Environmental and Social Category B
Project Name Convergence of Agricultural Interventionsin Maharashtra's Distressed Districts Programme
Climate Risk Classification not available yet
Project ID 1100001470
Project Sector Agricultural Development
CPM Rasha Omar
Project Area Akola, Amaravati, Buldhana, Wardha,Washim and Yavatmal districts of Maharashtra
Key Dates
IFAD Approval Signing Entry into Force Mid-Term Review OriginalCompletion
ActualCompletion
30/04/2009 30/09/2009 04/12/2009 13/01/2014 31/12/2017 31/12/2018
Original FinancialClosure
Actual FinancialClosure
30/06/2019 not available yet
Date of Last SISMission
Number of SISMissions
Number ofextensions
Effectiveness lag
09/03/2018 15 1 8 months
IFAD Financing
Loan USD Million 40.1 Million % disbursed 65.8
Grant USD Million 1.01 Million % disbursed 7.4
Actual Costs and Financing (USD ‘000)as at the time of PCR submission
Component IFAD Cofinancing Beneficiaries GOVT Total
Actual Actual Actual Actual Actual
Institutional Capacity Buildg & Partnership 0 0 0 0 0
Market Linkages & Sustainable Agriculture 0 0 0 0 0
Project management 0 0 0 0 0
Total 0 0 0 0 0
Remaks
The PCR review mission did not develop the table for components by financiers in USD. However, the data is availablein local currency in appendix 3 of the PCR report.
Outreach
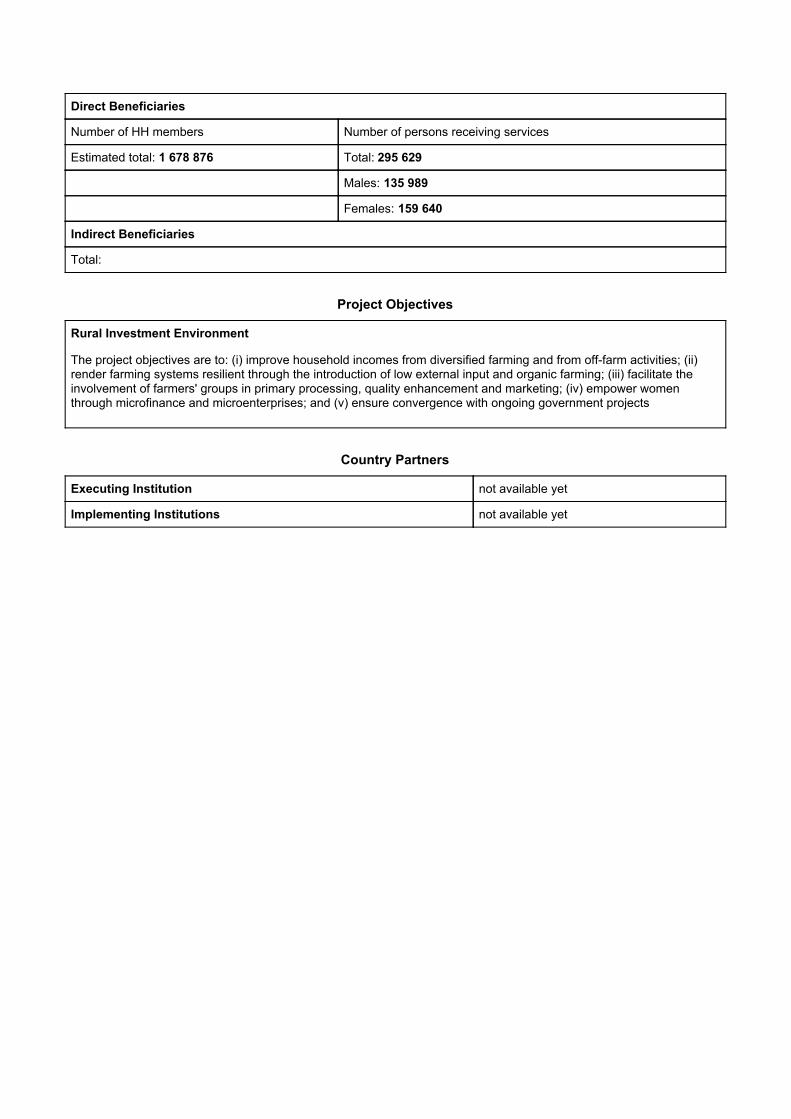
Direct Beneficiaries
Number of HH members Number of persons receiving services
Estimated total: 1 678 876 Total: 295 629
Males: 135 989
Females: 159 640
Indirect Beneficiaries
Total:
Project Objectives
Rural Investment Environment
The project objectives are to: (i) improve household incomes from diversified farming and from off-farm activities; (ii)render farming systems resilient through the introduction of low external input and organic farming; (iii) facilitate theinvolvement of farmers' groups in primary processing, quality enhancement and marketing; (iv) empower womenthrough microfinance and microenterprises; and (v) ensure convergence with ongoing government projects
Country Partners
Executing Institution not available yet
Implementing Institutions not available yet

Project Completion Ratings Matrix
COUNTRY: India
PROJECT NAME: Convergence of Agricultural Interventions in Maharashtra's Distressed Districts Programme
PROJECT ID: 1100001470
BOARD APPROVAL DATE: 30/04/2009
ENTRY INTO FORCE: 04/12/2009
PROJECT COMPLETION DATE: 31/12/2018
LOAN CLOSING DATE: 30/06/2019
IFAD LOAN AND GRANT (USD MILLION): $41,108,962
TOTAL PROJECT FINANCING: $118,645,691
IMPLEMENTING AGENCY: not available yet
Criterion PCR Rating
Project Performance
- Relevance 5
- Effectiveness 4
- Efficiency 3
- Sustainability 4
Rural poverty impact 4
- Households’ incomes and assets 4
- Human and social capital 5
- Food security 4
- Agricultural productivity 4
- Institutions and policies 4
Additional evaluation criteria
- Gender equality and women's empowerment 5
- Innovation 4
- Scaling up 4
- Environment and natural resource management 4
- Adaptation to climate change 4
- Targeting and outreach 4
- Access to markets 4
Partners Performance
- IFAD's performance 4
- Government performance 3
Overall project achievement 4

Executive Summary
1. Convergence of Agricultural Interventions in Maharashtra’s distressed districts programme (CAIM) entered intoeffectiveness on 4 December 2009 for a period of eight years, and completed on 31 December 2018 after one-yearextension. The Maharashtra State Agricultural Marketing Board (MSAMB) was the Lead Programme Agency. Theprogramme was implemented by Agricultural and Marketing Department of (AMD) of the Government of Maharashtra(GoM). The project was implemented in six distressed districts in the Vidharba region with a total project cost of INR 5,58billion (project design report, Feb 2010).
2. The overall goal of the project was to contribute to the development of resilient production, sustainable and diversifiedhouseholds, on-farm and off-farm livelihoods, allowing households to face production and market risks without falling backinto poverty and distress. The project objectives were to: i) improve household incomes from diversified farming and fromoff-farm activities; ii) render farming systems resilient with the introduction of organic and low-input contract farming; iii)facilitate the involvement of farmers groups in primary processing, quality enhancement and marketing; iv) empowerwomen through micro-finance and micro-enterprises; and, v) convergence of government programmes and resources.
3. The project had three components: Component One: SHG and CMRC Development; Component Two: MarketingLinkages & Sustainable Agriculture, which has four subcomponents including: i) Sustainable and Low External InputSustainable Agriculture (LEISA); ii) Livestock Development; iii) Soil and water conservation; and, iv) Market linkages andvalue chains. Component Three is Programme Management.
4. This project was financed by an IFAD Loan of SDR 26.82 million (USD 40.1 million) and an IFAD Grant of SDR670,000 (USD 1.10 million). The project was co-financed by the Sir Ratan Tata Trust (SRTT) with a grant of Rs 752.37million (USD 16.0 million), and the Government of Maharashtra (GoM) with a contribution of USD 37.6 million ascounterpart and parallel financing.
5. Target groups and outreach: CAIM benefitted an estimated 295,629 households. It reached 348,000 householdsexceeding the target at design of 286,800 households by 121%. Women represent 54% of the beneficiary households ofthe project due to their participation in component 1 activities. According to the endline survey, 35% of the beneficiary HHare below the poverty line (BPL), and 28.4% are SC/ST HH; approx. 34% of the HH are landless, 48% are small andmarginal farmers, and 19% are large farmers. At completion, and based on the findings of the end line survey, there is aslight positive bias in the representation of the SC/ST and landless/ marginal and smallholders among beneficiaries, andover-representation of the BPL HH, suggesting that the measures adopted by CAIM for poverty targeting were effective inreaching the intended target group.
6. Project Relevance: The program was relevant at the time of design and remained relevant during implementation. Thedesign aligned with relevant GoI policies, including the National Agriculture Development Programme (NADP) focusing onincreasing investments in the agriculture sector, emphasizing end-to-end projects and giving priority to farmers below thepoverty line. The GoM endorsed NADP in 2007, and focused on food security crops, watershed development, andrecognized the need to increase organic farming. Both the GoI and GoM sought to address farm household distressthrough ‘people-oriented’ livelihood development and by proactively providing support from numerous underutilizedgovernment programmes. CAIM’s objectives were well aligned with IFAD policies: the programme’s focus on LEISA,public private partnership (PPP), inclusive finance, and people-centric processes and organizations was well aligned withIFAD’s strategy for India in the approved 2005 and 2011 COSOP. The project remained aligned with the national objectiveof doubling farmers' incomes announced by GOI in 2016, and supported the main pillars of this objective: (i) watersecurity; (ii) optimization of inputs; (iii) shift to higher value agriculture production; (iv) improved price realization; (v) shift tonon-farm activities.
7. Project effectiveness. Under component 1, the project overachieved the outputs and nearly all the outcomes ofcomponent 1. In total, 63 CMRCs were established and equipped (98.4% of target); seed capital support was provided to63 CMRCs (196.9% of target); 13,235 SHGs were formed or strengthened (146.7% of the target); 15,903 ultra-poorhouseholds were supported, out of a target of 5,000 such households. Some 16,544 mutual crop insurance/ healthinsurance policies were introduced to programme beneficiaries. Outputs for this component were slowed by initial delaysfinalizing cluster selection and it took until mid-2017 for all clusters to have fully operating CMRCs. At completion, thecumulative savings during the project period reached INR 576.91 million with an average savings per SHG of INR 43,590,with internal credit repayment of 88-90%. A total of 12,112 SHG representing 91% (target 70%) were credit linked to thebank and mobilized approx. INR 1,864 million, primarily from ICICI bank. This was possible because of the very goodgrading of the SHGs with 75% of SHGs graded as A (creditworthy), and 16% B (near creditworthy). Repayment of bankloans reached 99% as of March 2019. The programme helped 43 CMRC’s cover 75% to 100% of their operating costsrepresenting 68% of the established CMRCs and thus achieving the project target of 70%. Moreover, CAIM wassuccessful in the implementation of the Laxmi Mukti Abhiyaan which became a major campaign for the CMRCs. In total,62,021 families registered their homes in joint names in 877 villages recording 100% success rate. With regards jointownership of farm land, 10,468 applications were made in 638 villages but only 47% of the applications were successful.
8. Under component 2, the project largely achieved its targeted outputs and outcomes except with regards to livestockdevelopment where the project exceeded its targets. The project undertook LEISA/organic farming in 64 clusters (100% of
1/40

target) covering 1,204 villages (103% of target) engaging 190,347 small and marginal farmers (95% of target) covering376,579 ha (93.40% of target). Cumulatively, 12,925 on-farm demonstrations on LEISA/organic practices were organizedand 264,476 farmers were trained on various farming techniques, exceeding the target of 200,000 farmers. For Livestockdevelopment, the project established 3,735 dairy units (149% of target) and supported 31 functioning milk collectioncentres (69% of target). The programme supported 3,048 household for goatery units (122% of target), and 16,529households were given backyard poultry (egg laying) or commercial poultry units. Joint Liability Groups (JLGs) wereformed as a mechanism to finance and manage the enterprises. A cluster approach was adopted to facilitate inputaggregation and sale of animal products. A cadre of para-veterinary workers was established composed of 42 locallybased para-vets and 273 Pashu Sakhis (local animal care givers). Fodder development was undertaken on 6,012 ha. Theproject met its SWC targets through works undertaken in 1,223 villages (103% of target) which covered 391,000 ha (97%of target). SWC works included well re-charge structures, gabion structures, loose bounder structures, stone bunds, farmponds, sunken dugout ponds and desiltation of streams/ rivers. An additional area of 6,629 ha was brought underirrigation, of which, micro irrigation accounts for 951 ha. Finally, under Market linkages and value chains, the projectprovided improved market access to 31,494 producers against a target of 50,000 (the BCI supporting 63% of thisachievement) and negotiated 95 partnerships with the private sector (81.3% of target) across 64 clusters for over 20agricultural commodities through annual buyback farming contracts and commodity marketing arrangements. Theprogramme supported 52 producer companies (PCs) against targets of 64; of these, 39 were formally registered, and 10received initial 2 lakh INR in form of seed capital. At project completion, 14 PCs remain active.
9. Project Impact: The programme helped 74% of CAIM beneficiaries to increase their income from 2012-13 to 2018-19achieving the MTR target of 75%. The main drivers were higher net income from farming and from non-farm enterprise(39%), from wage labour (33%), and other livelihoods (28%). This has positively impacted beneficiary householdperception of wealth. The percentage of beneficiary households classifying themselves as poor and very poor has halvedover the period, compared to 30% for the control group. Although sizable, this performance falls below the target set atdesign of 75% of the target group changing their wealth category. As per the financial analysis at completion, the increasein agricultural income is etimated at 20% over baseline, lower than the target 40%.
10. Gender equality and women's empowerment: Gender equity was a priority for CAIM. Women were more involvedin Component 1 and, to a lesser extent, in livestock development, with far fewer women in market linkage activities (e.g.,women participation in JLGs and PCs was lower than 20%). Their disciplined approach to financial services andenterprise development was reflected in the growth of women led micro-livelihood plans, common facility centres (CFCs),some JLGs. The project reached 34,959 female-headed households, many of whom benefitted from support to ultra-poorhouseholds. Interventions under component 1, addressed income diversification through on- and off-farm enterprisedevelopment, increasing agriculture productivity for food security, access to formal credit, livestock care, and capacitybuilding. Notably, 36% and 38% of internal and bank loans taken by women loans were invested in the household's farmactivities. The end line survey also found 56.2% of CAIM households (28.8% of control) reported women on and off-farmenterprises positively impacted household incomes. Some 55.7% of CAIM women reported increased assets compared to34.5% for the control. The programme had visible and positive impact on women's agency and decision-making role.Some 64% of women report greater household decision making power; 62% report increased mobility; and 60% reportimproved status outside the home (twice that of non-beneficiary women). This said, 56.7% of women saw workloadsincrease (due to enterprise obligations or increased manual labour associated with LEISA), but this was consideredgenerally positive as it allowed for increased incomes. It should also be noted that drudgery had been reduced through theintroduction of mechanized tools, and women were happy with the extra hours in enterprise activities as the workingconditions were much better (being based indoors) and/or produced positive outcomes (reduced cost of inputs andincreased incomes).
11. Human and social capital: The programme created substantial human and social capital through the support andmobilization of SHGs and CMRCs, various enterprises / human development trainings and capacity developmentactivities, as well as the creation of enterprise / economic activities. SHGs members, with the help of CMRCs, have builtsustainable institutions owned and managed by women members. More generally, project trainings on micro-enterprise,vocational skills, leadership, book-keeping etc. not only built producer/ entrepreneur technical skills, but soft social andenterprise skills as well (e.g., human resource management, teamwork, relationship trust, social issues, etc.)
12. Food security: CAIM interventions have helped beneficiary households diversify crop production and improve thesafety of food crops. Beneficiaries report that increased access to water enabled them to grow vegetables and wheatcontributing positively to their diets, as do many new livestock-based livelihoods. Data provided by the endline surveysuggests that nearly 41% of CAIM beneficiary HH experienced increase in food availability, as well as quality and type offood. At the same time, the end line survey reports that the incidence of food shortage was highest, at 40%, among themarginal farmers and HH falling below the income level of 30,000 INR/ year. It should be noted that the question wasopen with no reference to dates/ periods. The PCRVM made the recommendation to CAIM to review the data fromselected villages reporting highest food insecurity. In this instance, the questions were phrased precisely as food shortageover the last 12 months period, and the responses were nil, confirming the positive trend of this indicator in the AOS.Based on this, the PCR review concludes that food security has reduced from baseline, when 6% of HH in project andcontrol villages reported food shortage.
13. Climate change and natural resource management: LEISA/organic agriculture practices together with mixedfarming and crop diversification helped reduce vulnerability and built resilience to climate variability. Farmers confirmed
2/40
that fields under LEISA required less water and did better in the case of drought. Farmers also reported that livestock ismore tolerant to high temperatures and provide an alternative source of income in case of crop losses as well as provideorganic waste for agricultural purposes. SWC works have been found to increase water harvesting, improve infiltrationand re-charge of ground water aquifers. LEISA has been found to reduce the environmental footprint of agriculture,improving soil health, while decreasing use of synthetic and chemical products. Increased number of ruminants is withinthe carrying capacity of the region, and the many small, and in-principle environmentally neutral SWCs have beenundertaken together with tree plantation. Some “nalla training” works were not implemented in a technically adequatematter and these were flagged to the Division Commissioner and Secretary, Soil and Water Conservation, GoM, forcorrection.
14. Innovations and scaling up: The programme design was innovative for the GoM as it introduced to the state an ‘end-to-end’ approach, covering pre-production (e.g., inputs, finance, training), production (e.g., package of practices andtechnical support) and post-production (e.g., market linkages). This approach was critical for promoting remunerative andresilient production systems among small and marginal producers. The project also adopted numerous innovations forstakeholder participation, agricultural production, service provision, financial services, and women empowerment. On thetechnological production front, the project promoted innovations in LEISA (broad bed furrows, sowing against slope,biodynamic compost units, BCI, ready to install bio-gas units etc.). On the service front, the project promoted “PashuSakhi” community-based animal health workers and Sahayogini (SHG support workers as CMRC staff), both professionssustaining last mile service delivery. On the financial services front, the project introduced mandatory cattle and goatinsurance. MAVIM developed the CMRC grading and SHG alert monitoring systems which supported growing SHG banklinkages; the ultra-poor revolving fund and the debt redemption fund paving the way for ‘graduation system’ to protect,grow and diversify poor and ultra-poor household income and assets.
15. Many innovations and activities have the potential for or are already being scaled up. The suite of innovationsmanaged by the CMRCs is being scaled via MAVIM. The BCI network in Vidarbha region, already the group’s largest inthe world, is expanding; SRTT is scaling up the commercial poultry programme piloted with CAIM; the dairy activities arebeing scaled by the National Dairy Development Board and AMUL. There is scope to scale up : 1) dairy value addition; 2)MAVIM’s efforts to brand products made by CFCs; 3) farm equipment banks (e.g., SPARCs) ; and 4) non-traditional crops(e.g., baby corn, medicinal plants) provided market linkages are negotiated upfront.
16. Project Efficiency and link to EFA: Cost-benefit analysis yielded an overall IRR of 28% of the project with an NPV ata 7.5% discount rate of INR 3,568 million and a BCR of 1.63. A positive NPV under the Opportunity Cost of Capital of7.5% indicated that the project investments have been robust and sound. The switching value analysis indicated that theproject investments are worthy of sustaining either a 39% decline in overall benefits or 63% increases in costs. But theproject investments are highly sensitive to simultaneous increases in costs and decline in benefits.
17. Disbursement and financial management: As against the total allocation at appraisal of INR 5,578 million, theproject has utilised INR 6,857 million with achievement of 123%. IFAD loan and grant, and bank credit accounted for 62%of project expenditures; the GoM contributed 21%; beneficiaries 10%; the SRTT 5% and the private sector 2%. The bankand beneficiaries overachieved (282% and 409% respectively). Provisionally and pending settlement of all withdrawalapplications that IFAD received, the disbursement would reach 89% of the loan amount in USD, and 23% of the grantamount in USD. Utilization rate of GoM funds reached 60%. Utilisation of the SRTT grant and private sector contributionwas slightly above 30% of target.
18. The project experienced operational and administrative issues which were also identified during supervision missions.These impacted project financial and physical performance: close to 30% of project expenditures were incurred in lastyear of the project , as a result of expansion in SWC and enterprise support to utilze the exchange rate gains that wasreleased by GoM in November 2019. Non-adherence to procurement guidelines led to ineligible expenditures identified inFY 2016-17 and 2017-18 and certified by the auditors. The following activities are still on-going at the time of finalizing thePCR report : refund of ineligible expenditures to IFAD, review of audit FY 2018-19 by IFAD, and finalization of the auditreport for April-June 2019 by the auditor hired by CAIM for the purpose.
19. Partner Performance: The MSAMB was the lead programme agency, responsible for CAIM implementation,monitoring and evaluation. In effect, MSAMB did not play its intended role, all the more so since the Programme SupportUnit it was hosting, was dissolved soon after MTR, and all financial approvals were delegated to state and districtauthorities. The role of steering the project was assumed by the parent department, which was the Marketing Department.The innovative nature of the programme challenged some aspects of the GoM performance, and the PCR observes thatthe project’s institutional arrangements should have been modified to align with the agriculture administration at regionaland district level to ensure institutional continuity and better oversight. The GoM did not manage as was agreed, thecontinuity of any Project Director for three years, adequate remuneration for project staff to avoid turnover, timely releaseof funds as per AWPBs, and overall steering of the project. The GoM’s request for a one-year extension was appreciatedas it allowed the project to further strengthen the sustainability of CMRCs and the hand-over of the BCI activities to CottonConnect for further expansion.
20. IFAD provided intensive supervision and implementation support (15 missions in all). The project team appreciatedthe support provided by the IFAD supervision and implementation support missions. The design changes at MTR provedto be a seminal moment leading to the solid turnaround experienced in the final years of implementation. However, more
3/40

proactive measures were required to redress chronic weaknesses in the project systems covering areas of M&E, financialmanagement and procurement.
21. SRTT was to be a financier and provider of technical assistance. It shifted to direct implementation covering nineCAIM clusters and with a parallel financing arrangement and its own monitoring and reporting system. It provided modelsupport on dairy, poultry and PCs, but was unable to attend to watershed development plans.
22. MAVIM was instrumental in the success of Component 1, and supported SHG’s in 63 clusters. Results undercomponent 1 drove the impacts of the project as demonstrated in the end line survey.
23. Better Cotton Initiative (BCI) is a not-for-profit organisation spearheading better global standards for cotton fromfarmers to the retailers. CAIM partnership with BCI helped the project overachieve the target set at design of 54,000 Haunder more sustainable cotton production practices. This was made possible thanks to rigorous organization of extensionservices and monitoring of adoption of six production principles of BCI covering use of pesticides, irrigation water, soilhealth, natural habitats, quality of fibre and decent working conditions. CAIM started implementing BCI in the 2014-15season, obtaining its BCI licence in November 2014 and supporting 41,923 cotton growers. By project completion in FY2018-19, the outreach was 139,922 cotton growers cultivating 151,607 Ha thus making CAIM the largest implementingpartner of BCI in the world.
24. Sustainability: The majority of SHGs and CMRCs are at sustainable levels of operation, as are the CMRCs, for whichMAVIM will develop new services and revenue streams. The producers participating in the Better Cotton Initiative willcontinue to benefit from the services of Cotton Connect, a partner of BCI. Some PCs and most JLGs are operating atsustainable levels but still face challenges, including poor access to capital, inexperienced management and poorgovernance, and the sourcing of on-going support. The PCs and JLG would benefit from an apex institution or beinglinked to relevant government support schemes. SWC works can be handed over to the Gram Panchayat and/ or theAgriculture Department and registered accordingly to facilitate maintenance. One main concern relates to the projectenvironmental sustainability due to the quality of some of the “nalla training” works undertaken and is likely to havepotential adverse hydrological and biodiversity impacts and this situation should be redressed.
25. Lessons learned: As a result of the implementation of the project a number of relevant lessons emerged, includinginter alia: i) women in established SHGs generate trust leading to good long term business practice, access to credit,enterprise growth. This strengthens their social status, income as well as investment in farming (loans for agriculture andallied activities); ii) LEISA/ organic production can reduce production costs with limited impact on yield, increase resilienceto drought (more water retention and less dependency on external input). It enhances quality of produce, reduces healthrisks due to decreased exposure to pesticides, and it can complement other production activities (e.g., dairy and dungproduction for composting). The example set by BCI is very informative for the scaling up of LEISA in a more systematicmanner through combination of advisory services, farmer organization and effective training, continuous analysis andrecording of agronomic practices and related costs, third party assessment, and certification of buyers; iii) contract farmingand commodity marketing reduced the risk for smallholders and allowed them to experiment with higher value, non-traditional production; iv) larger seed capital contributions to PCs may preserve working capital needed to start businessoperations; v) convergence is about managing partnerships effectively and proactively and this requires very goodcommunication among Government and non-Government partners, clear delineation of and responsibilities, timelyallocation of resources, and continuous performance monitoring. Finally, the programme demonstrated the challengesand opportunities availed by end-to-end programming which works vertically up value chains while working horizontallyacross thematic issues (e.g., linking market linkages with SWC and LEISA for cotton).
25. Conclusions: Overall the CAIM programme has achieved all its outcomes, with significant over-achievement incomponent 1 and the sub-components of livestock development. Impacts are significant for gender equity and women'sempowerment including leadership roles, and are well aligned with the project target for income increase, yet miss theambitious target for economic mobility and increase in incomes over baseeline. It is equally clear that the BCI partnershipand LEISA interventions demonstrate great potential for more and better, economically sustainable, environmentallysound production leading to higher profits and better incomes to adopting households. The concept of convergence wassound and demonstrated the need for more proactive cross-department communication and coordination betweenprogramme stakeholders. Most targeted outputs and outcomes were met despite the innovative nature of programme andimplementation challenges: this is testament not just to the applicability of design, efforts of the PMU, DPMTs and othersin programme management, but of the farmers, men and women, taking advantage of CAIM resources and methods tobetter their own futures.
26. Recommendations: The main recommendations to GoM are proposed as follows:
Review “nallah training” works from a technical, hydrological and environmental perspective, and monitor impactsover 3-5 years through Groundwater Surveys and Development Agency (GSDA);
Inventory SWC structures to facilitate maintenance after a formal handing over structures to Gram Panchayats andline departments at the district level;Support BCI to help move farmers up the value chain through their formal collectivisation, enabling them to benefitfrom economies of scale, secure better terms of trade and improve incomes;
4/40

Explore the creation of a second-tier rural enterprise development apex for JLGs and FPOs to provide on-goingenterprise development support; as well as facilitate access to capital for these groups through a sustainableinvestment mechanism (possibly including value chain finance);Compile select success stories on the innovations tested in CAIM for replication by GoM and other developmentpartners.
A. Introduction
B. Project Description
The overall goal of Convergence of Agricultural Interventions in Maharashtra's distressed districts Programme(CAIM) was to develop resilient, sustainable and diversified households, on-farm and off-farm livelihoods, allowinghouseholds to face climatic and market risks without falling back into poverty and distress. The project was initiallyapproved for eight years from December 2009 and then extended for one year from December 2017 to December2018. The project geographic coverage was the six distressed districts in the Vidarbha region namely Akola,Amravati, Buldhana, Wardha, Washim and Yavatmal. The project’s target group was the rural households belongingto (i) the Scheduled Castes, (ii) the Scheduled Tribes, (iii) landless labourers, (iv) rural women, (v) the small andmarginal farmers and (vi) the farmers under agrarian distress. The project had three components: 1) SHG and CMRCDevelopment; 2) Marketing Linkages & Sustainable Agriculture ; 3) Programme Management. The project is financedby an IFAD loan of SDR 26.82 million (USD 40.1 million) and an IFAD Grant of SDR 670,000 (USD 1.0 million). Theproject is co-financed by the Sir Ratan Tata Trust (SRTT) with a grant of Rs 752.37 million (USD 16.0 million), andthe Government of Maharashtra (GoM) with a contribution of USD 37.6 million as counterpart and parallel financing.The Maharashtra State Agricultural Marketing Board (MSAMB) was the Lead Programme Agency.
1.
The project became effective on 4 December 2009. The original closing date was 31 December 2017 but wasextended by one year at the request of the GOM, to 31 December 2018, with loan closing on 30 June 2019. Overall,the project had 15 supervision and implementation support missions. The first review mission in April 2011 noted thenon-hiring of APD and Finance Officer impacting on the management of CAIM. It also recommended reducing thenumber of clusters from 124 to 64 (for increased aggregation purposes) while maintaing the coverage of 1,200villages under the “end to end projects” including in situ water conservation and sustainable agricultural development.Progress was slow in early years leading to a disbursement rate of the loan of 17% at MTR. In view of the situation,the MTR recommended a number of design changes that led to a simplified and accelerated implementation ofcomponent 1; leverage of BCI to achieve the LEISA and organic agriculture targets of the project; and simplification ofthe deliverables at output level. The design changes were effective and the project achieved its targets, evenexceeding them under component 1 for the institutional development of SHG and CMRCs, and for the sub-component on livestock development.
2.
CAIM hired a team of experienced consultants[1] to draft the project completion report (PCR) in April/ May 2019. Themain objective of the PCR is to assess and document the overall project implementation performance and the resultsachieved, for both accountability and learning purposes. The process involved an informed reflection on therelevance, effectiveness, efficiency and sustainability of project interventions. The PCR preparation relied on: 1)supervision reports, 2) MTR report, 3) project progress reports, 4) the RIMS and baseline surveys as well as theAnnual Outcome Surveys, 5) RIMS reports, 6) AWPB, 7) MIS data (including RIMS data); 8) the service providers’records and the records of the other organizations supported by the project. In addition to programme related sourcesof information, the PCR team collected relevant data from secondary sources, such as published national and localstatistics and research reports, used to bridge information gaps or to cross-examine data generated from othersources. The PCR team had structured and unstructured interview/ focus groups with a variety of programmestakeholders, beneficiaries and their organizations. (See Appendix 8 for schedules of meetings).
3.
The draft PCR was reviewed by an IFAD PCR review mission (PCRRM)[2] from 14 to 31 May 2019 in the State ofMaharashtra. The review of the PCR was undertaken on the basis of: (i) the endline survey carried out by theNational Council of Applied Economic Research (NCAER);[3] (ii) the numerous background documents provided bythe CAIM PMU; and, (iii) extensive consultations with implementing partners and beneficiaries. The PCRRM, in twoseparate teams, visited the six programme districts from 18 to 23 May and had meetings with 125 beneficiaryorganizations in 46 villages, and as well as district government and other stakeholder organisations. The CAIMorganized the project completion workshop on 27 May 2019, under the chairmanship of the Project Director andDivision Commissioner, Amravati. The proceedings of the completion workshop are in appendix 9.
4.
The PCRRM prepared a draft aide-mémoire which it discussed with the CAIM management on 29th May, with theState Government of Maharashtra on 30th May and the Department of Economic Affairs, Ministry of Finance on 3rdJune 2019. The present report incorporates the feedback received from the various stakeholders.
5.
5/40

B. Project Description
B.1. Project context
B.2. Project objectives
At the time of project design in 2009, six districts of Vidarbha region, Akola, Amravati, Buldhana, Wardha, Washimand Yavatmal in the state of Maharashtra, were declared as distressed districts given rising numbers of farmersuicides. Over the years, farming systems in the target areas had developed into a combination of food crop andmono-cropping of cash crops. The latter were produced with increasingly intensive use of chemical inputs. While thisraised yields, a host of interrelated factors led to farmers' distress, including: 1) indiscriminate use of fertilisers andpesticides and reliance on hybrid seeds which increased costs of production; 2) declining availability of fodder whichled to reduction in the livestock population; 3) inadequate irrigation infrastructure which maintained farmers'dependence on rainfall exposing the farmers' to crop failure in case of drought; and 4) adverse market conditions.This resulted in low productivity of crops and remaining livestock, and turned agriculture into a risky and unprofitablebusiness. Many smallholder households, as a result, saw their incomes decrease, their assets erode, and many,suffered under growing and unpayable debts, often to informal money lenders. Farmers' suicides reported inVidarbha region were a symptom of agrarian distress.
6.
The Government of Maharashtra (GoM) developed a multi-pronged approach to respond to these challenges, basedfirstly on the provision of emergency packages to poor and ultra-poor households, and secondly, on a shift indevelopment focus towards agricultural water security through soil and water conservation, crop diversification, aswell as off-farm activities (particularly livestock rearing), a transition towards low input organic farming, better pricerealization for farmers through organizing producers' collectives/ companies and facilitating farmer participation invalue chains. Numerous and adequately funded government programmes were implemented to support thisapproach; yet their resources were under-utilized and integration of these programmes at the level of household andgrassroots organizations were not necessarily happening, thus limiting these programmes' benefits to farmers.
7.
The overall goal of the project was to contribute to the development of resilient production, sustainable and diversifiedhouseholds, on-farm and off-farm livelihoods, allowing households to face production and market risks without fallingback into poverty and distress. The project objectives were to: i) improve household incomes from diversified farmingand from off-farm activities; ii) render farming systems resilient with the introduction of organic and low-input contractfarming; iii) facilitate the involvement of farmer groups in primary processing, quality enhancement and marketing; iv)empower women through micro-finance and micro-enterprises; and, v) convergence of government programmes andresources. At MTR, the formulation of the project targets were revised in line with project design guidelines as followsin order to make it more measurable: Incomes of 286,800 households improved; LEISA farming rendered on403,200ha; 9,000 women SHGs empowered ; and 158,400 distressed households counselled on social and financialmatters in six districts of Vidarbha, Maharashtra.
8.
The project had three components which address the 5 main thrusts of the project in terms of 1) financial inclusionwhile alleviating debt burden, 2) water security, 3) productivity enhancement for agriculture and allied sectors, 4)market linkages, and 5) facilitating convergence across thematic schemes of the Government. The 3 componentsand their outcomes are described below.
9.
Component 1 - SHG and CMRC Development: the main outcomes for this component are to have 90,000 poor andmarginalized household mobilized, through socially inclusive affinity groups, empowered to effectively articulate theirinterests, and the resilience of distressed households are enhanced. The main outputs for this component focussedon strengthening SHGs, CMRCs and their financial products, and the number of ultra-poor households participatingin the program.
10.
Component 2 - Marketing Linkages & Sustainable Agriculture has four subcomponents: i) Sustainable and LowExternal Input Sustainable Agriculture (LEISA); ii) Livestock development; iii) Soil and water conservation; and, iv)Market linkages and value chains. The main outcome for subcomponent 2.1 was to have 200,000 small and marginalfarmers increase productivity by using sustainable and environmentally friendly farming methods. The principaloutcome for subcomponent 2.2 Livestock development was to improve livelihood opportunities for 4,000 livestockproduction households. Subcomponent 2.3 Soil and water conservation’s main outcome was water security improvedand soil erosion reduced in 1,200 villages. The main outcome for Subcomponent 2.4 Market linkages and valuechains was 50,000 farmers have improved market access including contract farming, value addition, backward andforward linkages resulting in increased income. See Appendix 1 for the full Log Frame.
11.
Component 3 - Programme Management. The project management set up is detailed in section below.12.
The design of the project was revised on two occasions during implementation : at the first review mission in April2011 and at mid-term review in January 2014. The changes introduced are presented under the section onRelevance.
13.
6/40

B.3. Implementation modalities
MAVIM which supported the training and development of SHGs and CMRCs, as well as monitoring theirperformance in 63 clusters.5 Two other institutions, the Dhan Foundation and NIWCYD, were originally contractedto support CMRCs and SHGs in eight clusters each. MAVIM took these organizations’ responsibilities over in2016.Implementing Agencies were local NGOs registered with the government, selected on a competitive basis toimplement core CAIM programme activities for end-to-end subprojects in all village clusters.The SRTT is a charitable trust working inter alia in rural livelihoods, education, health, civil society, governance,arts and culture. Almost 70% of its grants go to community-based activities in rural areas. SRTT was to co-financeCAIM through grants, to support project activities, and provide ‘knowledge inputs’ by sharing its experience andbest practices. After 2016, SRTT began direct project implementation in nine clusters focused on integrated end-to-end production and market activities (e.g., poultry raising for low income households, dairy value chaindevelopment, etc.).Although not identified as a project partner in the CAIM design report, BCI became a key financing andimplementing partner helping CAIM exceed the target for LEISA application in cotton production. Thanks to BCImarket linkages, CAIM was able to improve the rate of achievement of the target for facilitating farmers' access toremunerative markets.Other partners included the Agricultural University (PDKV) in Akola and the Agriculture Department of GoM. Bothwere involved in training, extension support and, in the case of the latter, provided benefits from otherdevelopment programmes (convergence).All implementing partners strived to develop a cadre of local resource persons including master trainers, VillageLevel Workers (VLW, variously called Krishidoots/Watershed Volunteers), Pashu Sakhis, Sahayoginis forfollowing up and building the capacity of SHGs. All implementing partners organized producers into differentcollectives such as SHGs/VLCs/CMRCs in case of component 1 to promote financial inclusion; VDCs to managethe planning and implementation of SWC; and JLGs, FPOs and PCs for facilitating investments in enterprises andin input/output aggregation in case of component 2. The project also developed last mile service delivery in form ofthe agri-service centres and SPARCs.
B.4. Target groups
The CAIM budget at design was USD 118,645 million. It was financed by an IFAD loan of SDR 26.82 million (USD40.1 million) and an IFAD Grant of SDR 670,000 (USD 1.0 million). The project is co-financed by the Sir Ratan TataTrust (SRTT) with a grant of USD 16.0 million, and the Government of Maharashtra (GoM) with a contribution of USD37.6 million as counterpart and parallel financing.
14.
The Maharashtra State Agricultural Marketing Board (MSAMB) was the Lead Programme Agency which according tothe financing agreement was responsible for the implementation, monitoring and evaluation of CAIM. MSAMB is anautonomous state institution with headquarters in Pune with the mandate to develop agricultural produce marketsthrough grants, loans and capacity building. A project support unit was established in MSAMB in Pune to ensureliaison for the project. The programme management unit (PMU) was located in Amravati (560 km from Pune) tomanage/ implement / oversee all project activities. There were 6 District Programme Management Teams (DPMT),one in each district.
15.
A State Project Steering Committee (SPSC) was under the Principal Secretary, Agricultural Marketing andCooperation, Government of Maharashtra and included concerned Secretaries and Heads of Departments as itsmembers such as the Principal Secretaries of Planning Department, Finance Department, Revenue and ForestDepartment, Relief & Rehabilitation Department, Agriculture Department, Rural Development and WaterConservation Department etc.
16.
At the regional level, a Project Steering Committee (PSC) with the Divisional Commissioner, Amravati as chair, wasestablished, with the PMU Project Director (PD) as its Secretary. Other PSC members included District Collectorsfrom the six project districts, the State Liaison Officer (SLO) from MSAMB, participating NGOs, core PMU staff,representatives from participating banks, regional research organisations, technical heads of agriculture departmentsbased in Amravati, representatives of MAVIM, Sir Ratan Tata Trust (SRTT), private sector companies etc.[4] ThePSC approved and monitored annual work plans and budgets, oversaw all financial and physical performance andactivities. The PMU provided co-ordination, facilitation and administration services to the DPMTs and partner NGOs.District Project Coordination Committees (DPCCs) were established in each district, with the District Collector asChairman, the CEO, and Zila Parishads as Vice-chairs. District level officers of line departments were also members.Representatives of NGOs and select VDCs, JLGs/ SHGs/ CMRCs, the DCO, MAVIM, and Sir Ratan Tata Trust werealso members. The DPMT Manager was the Member-Secretary of the Committee. The DPCC coordinated projectactivities in the context of other on-going interventions in the project area. Interdepartmental matters were managed/coordinated by the DPCC.
17.
The main project partners included :18.
7/40

C. Assessment of project relevance
C.1. Relevance vis-à-vis the external context
At the time of design, poverty[6] was prevalent in the six project districts, with 45% of the population below thepoverty line. Poverty was higher among Scheduled Castes (SC) and Scheduled Tribes (ST), the landless, andmarginal and smallholder farmers. The SC and ST communities constituted two thirds of the rural poor with povertyrates of 62.6% and 56.8% respectively.[7] Some 27% of HHs in the project area faced food insecurity. It wasestimated that 79% of all poor households depended on casual wage labour for their livelihoods, with 18% engagedin some form of subsistence farming. Approximately 54% of the poor were indebted (47% to informal sources). In apredominantly agrarian economy, demand for labour and wages was dependent on the performance of agriculture,which had become increasingly less profitable and productive.
19.
The proposed targeting strategy as per project design. Incidence of poverty and household distress wasexpected to guide geographic and household beneficiary targeting within programme areas. Geographic targetingwould include selection of village clusters with poor resource endowments, adverse weather conditions, anduncertain crop prospects. Clusters would be identified by income volatility and crop yield fluctuation due to weatherpatterns. Cluster selection would include: i) villages with potential in situ water conservation; ii) large concentration ofpoor, SC , and ST households; iii) villages where soil conditions have deteriorated/are affected by salinity anddepend on rainfall; and iv) where the response to project facilities is positive. Community members would participatein a wealth ranking survey in selected villages, to identify the beneficiary households among the poorer groups.Results would be cross-checked with the lists of the HHs below the poverty line (BPL). Target groups would include:i) Schedule Castes; ii) Scheduled Tribes; iii) landless families; iv) women-headed households; and, v) distressedfamilies.[8] Targeting would further identify households willing to join groups like SHGs and JLGs. All projectinterventions would focus on the target group population, except for in situ water conservation which would bepoverty neutral given the need for using a watershed approach for effective results. Even there, care will be takenthat a majority of the beneficiaries are small farmers, women farmers, SC and ST, and distressed households.
20.
Gender Mainstreaming. Poor women would be a direct target group, and mainstreaming a gender perspective,would be a cross-cutting issue. The project would target women and build on their strengths to support positivechange in targeted households. As women’s effective participation in decision making bodies is restricted, women’sleadership and organisational skills will be built through working with SHGs and CMRCs. This would improve self-confidence, increase their voice in decisions affecting their lives and that of their families, reduce social seclusion,increase participation in community initiatives, including counselling distressed households. SHGs would also helpadvance SHG members to move beyond savings, credit and income generation; and increase their roles in valuechains. Development of gender policy and capacity building of the PMU and IAs was expected to be a key strategy topromote gender mainstreaming in the project.
21.
At completion, the Relevance of the project was rated satisfactory (5).22.
The program was relevant at the time of design and remained relevant during implementation. Its focus on integratingend-to-end and grassroots driven program interventions linked to SWC, LEISA, livestock development and marketlinkages provided strategies for raising incomes and assets of target beneficiaries while sustainably increasing theirresilience to climate and market shocks. CAIM’ s focus on leveraging the resources of allied/complementaryprograms (convergence) remained equally relevant.
23.
Design was aligned with the National Agriculture Development Programme (NADP) of the GoI which addressed slowgrowth and low investments by state governments in agriculture; and aimed to achieve an annual growth of 4%during the 11th Five Year Plan by providing incentives to states to increase investments in the agriculture sector. TheNADP emphasized end-to-end projects, as well as production, technology transfer, farmer training, forward andbackward linkages with the state and/or private sector focused on BPL farmers in "risk-prone, underdeveloped,agriculturally distressed, remote, hilly and tribal areas." The programme was designed to proactively providebeneficiaries support from numerous underutilized government programmes. The GoM endorsed the implementationof NADP in 2007. The Implementation of the programme pointed out the following challenges which limited impact onHH: many of the government programmes were designed, implemented and monitored by the respectivedepartments as per their own rules and regulations and it was not easy for the District level authorities to adapt forspecial projects; secondly, the District Collector is only a coordinator of all line departments and he/she exercises littleadministrative control over the budgets of the line departments and cannot re-direct their funds in the event of underspending for other programmes; thirdly, practically all government programmes have a sector focus as opposed tointegrated development.
24.
CAIM intended to build on lessons learned from NADP and other Government schemes to address agrarian distressin a holistic manner, at individual, community and cluster levels. The design and implementation of CAIM focused on
25.
8/40

C.2. Internal Logic
1) empowering individuals, especially women through training, SHG formation and joint asset ownership; 2)alleviating HH debt burden through a range of innovative financial products like the debt redemption fund and lowcost loans for the ultra-poor to reverse the erosion of assets; 3) facilitating access to loans from formal institutions,through the formation and strengthening of SHGs and facilitating bank linkages, with the aim of reducing HH relianceon moneylenders; 4) rendering agriculture more resilient to climate change by promoting water security mainlythrough in situ soil and water conservation works, and as applicable river/stream de-silting, widening, andafforestation of the river banks, as well as building HH capacity to adapt to climate and market shocks by diversifyingtheir productive activities into off-farm and non-farm activities; 5) promoting more remunerative agriculture byrationalizing use of inputs thus lowering costs of production, and improving price realization for farmers throughmarket linkages, collectivization of producers, and primary value addition; and 6) facilitating convergence acrossdepartments by building strong grassroots organizations who would be eligible to the various Governmentprogrammes and would be able to integrate the services for their members. CMRCs emerged as very effectiveorganizations for facilitating convergence. NGOs acting as Implementing Agencies in the project were also givenconvergence targets.
CAIM’s objectives are aligned with IFAD policies and strategies for poverty reduction, sustainable development,inclusive microfinance, and women's empowerment. Design responded to IFAD's Strategic Framework 2002-2006and was aligned with the Millennium Development Goals. CAIM’s focus on LEISA, technology transfer/ innovation,public private partnership (PPP), inclusive finance, and people-oriented processes was aligned with IFAD’s strategyfor India outlined in the COSOPs 2005 and 2011 which focused on capacity building, access to resources,diversification of livelihoods, rural development, and rural poverty reduction.
26.
The project design was based on a sound analysis of the problems facing poor households in Vidarbha region, thecauses of distress experienced by agriculture households, the achievements and limitations of the Governmentschemes. The project design proposed an integrated end to end approach across the four main verticals of financialinclusion, water security, sustainable production of agriculture and allied sectors, and access to markets and to valueadding enterprises. Cross cutting themes were poverty targeting, women's empowerment and formation/capacitybuilding of grassroots organizations to ensure activities are effectively implemented, well targeted and benefitsaccrued to the intended beneficiaries.
27.
The project followed 9 complementary pathways to achieve impact : (i) the integrated, ‘end to end’ package, frompre-production, to production to market linkages employing existing and new collective enterprises and facilitatingaccess to formal finance addressed the causes of farmers' distress; (ii) growing markets for organic and naturalproducts, as well as for dairy products, goats and poultry production, offered key opportunities for income increaseand livelihood diversification to mitigate the risks of mono cropping, dependence on chemical fertilizers and pesticidesand inadequate water supply; (iii) application of emerging LEISA techniques offered opportunities to increase cropyield while reducing production costs without adversely affecting productivity. These, associated with integratedwatershed development via relatively lower cost in situ water conservation and micro irrigation systems, would allowfarmers to take advantage of growing organic natural food commodities which are premium niche markets and lesssubject to price fluctuations compared to non organic markets; (iv) integrated farming (e.g., small ruminants anddairy) provided the opportunity to supplement incomes, diversify food sources, provide income and reduce productioncosts. For example in the project area, existence of dairy production was a necessary condition for taking up LEISA;(v) developing market linkages through tie ups, contract farming, etc. created market-led opportunities for thedevelopment of long-term relationships for sustainable outcomes and impacts; (vi) supporting existing grassrootsorganizations such as SHGs and forming new farmer organizations (JLGs, PCs etc.), with appropriate planning andtechnical inputs was an opportunity to efficiently and effectively deliver technical capacity building for on and off farmactivities, as well as provide a platform for empowering target beneficiaries, particularly women, involving them in onand off farm planning and economic decision making. Establishing and/or supporting PCs was an opportunity toidentify and support value chain development benefiting beneficiary farmer households on a sustainable basisprimarily through subsidies on asset purchase and organizing training; (vii) increasing access to loans and savingsproducts, supporting financial services through SHGs to reduce dependency on money lenders, bring down costs ofdebt, and potentially encourage the innovation or use of new financial services (e.g., insurance, credit products etc.);(viii) shifting the government’s role to that of facilitator while engaging NGOs and the private sector, offered theopportunity to enhance the scale and sustainability of farmer enterprise; and (ix) focusing programme interventions inclusters with the support of second-level institutions like the CMRCs and IAs, to build sustainable local institutionsable to deliver programme interventions.
28.
A key aspect of the internal logic was that component 1 was necessary as a base to enable/increase outcomes ofcomponent 2. The results and outcomes for women confirm this association as can be seen in the projecteffectiveness section. The skills, empowerment and social development aspects of SHGs and CMRCs provided thenecessary foundation for women to actively participate in their HHs, organisations, villages andlivelihoods/enterprises as well as financial management.
29.
The original Project Log Frame was revised, updated and simplified at midterm. Outcomes and outputs for30.
9/40

C.3. Adequacy of design changes
ComponentsProject Design-ProgrammeImplementationManual (2011)
Mid Term Review (2014)Assessment at completionof the appropriateness ofmain changes in designfeatures
Projectcomponentstructure andresult framework
The programmeobjectives sought to beachieved through threecomponents such asInstitutional capacitybuilding, Market linkageand sustainableagriculture andProgrammeManagement . Thelogframe wasdeveloped accordinglyand was very detailed.
MTR reorganised the contents ofcomponent 1 and 2; simplified the resultframework; and reduced the financing ofSRTT of component 1 and applied it tocomponent 2 instead.
The main changes include merger of budgetlines including elimination of some veryminor sub-components.
Component 1 was simplified to focus onSHG and CMRC development and all otheractivities related with market linkages andsustainable agriculture were shifted tocomponent 2. SRTT funding of component 1was allocated to component 2.
The log frame was revised and simplified,outputs reduced especially for SWC works(shift from coverage in ha to coverage ofvillages) and for agri-enterprises; reductionin number of PCs from 120 to 64.
Realignment of theprogramme componentsbased on the need wasappropriate and effective.
ProjectManagement
PSU located in MSAMBin Pune
At MTR, the GoM decided to dissolve thePSU and transfer the staff to the PMU inAmravati
Reduction from 124 to 64 clusters to group20-30 villages as a cluster. The targetnumber of 1200 villages, however, was notreduced.
Limited role for MSAMB inproject implementation.
At completion, projectcovered 63 clusters
Component 1 remained consistent with good practices of inclusive finance practice. They provided readilymeasurable, appropriate and relevant performance information for intervention management. While indicators forComponent 2 were appropriate and relevant, an additional indicator for each sub-component may have helped putgreater focus on distress at the household level. They include: for 2.1: number of agricultural employment daysgenerated; for 2.2 - number of employment days generated; for 2.3 - increase in period of water available for drinkingat the village level, and for 2.4 - number of profitable or near profitable farmer organized enterprises supported.
In conclusion, the developmental challenges for rural poverty alleviation in the defined geographic targets and fortarget beneficiaries were generally sound as was the intervention logic underlying project design.
31.
The CAIM First Review and Midterm Review recommended several changes to project design in order to improveproject implementation. These are summarized in the following table 1:
32.
Table 1. Summary of main changes to design33.
10/40

2.1. SustainableAgriculture.
Organic farming (54000ha of organic cotton and33600 ha of organiccereals)
Given the cost of organic certification (4,000Rs/ha/ year), the MTR recommended to onlycertify land needed to grow crops for whichthere is an assured market which requiresorganically certified crops and wherepremium prices will be paid (buyers willoften pay the cost of organic certification).
MTR recommended focusing on “naturallyproduced” produce. The target for organicfarming was shifted to a target for LEISA.
The project output targetwas fully achieved thanks inlarge part to CAIM and BCIcollaboration on improvedcotton production usingLEISA techniques.
2.2. Soil andWaterconservation
Provide the frameworkfor farmers to be able toincrease croppingintensity andproductivity under rainfed condition.
SWC (soil and water conservation) to beconsolidated in small integrated watershedbasins rather than on scattered works : 60micro water sheds of 200 ha each weretargeted.
Integrated watershedapproach was notimplemented. Focusremained on in-situ SWCand groundwater recharge.
ComponentsProject Design-ProgrammeImplementationManual (2011)
Mid Term Review (2014)Assessment at completionof the appropriateness ofmain changes in designfeatures
D. Assessment of project effectiveness
D.1. Physical targets and output delivery
The changes simplified project implementation and management. Expanding MAVIM’s activities was appropriate,anticipating its engagement in 2016 in all 64 clusters. The changes made to Component 2 helped link farmerorganizations and enterprises to soil and water conservation, LEISA, and livestock development interventions.Consolidating SWC into smaller watershed basins was appropriate as interventions up to midterm had beenscattered, limiting their aggregate effect. The elements of the revised updated Logical Framework were simplified toinclude fewer indicators. Outcomes and outputs remained relevant as noted above in section C2. Internal Logic.
34.
At completion the effectiveness of the project has been rated moderately satisfactory (4).35.
Component 1: SHG and CMRC Development:36.
Program output achievement against targets for Component 1 include: 63 CMRCs established and equipped (98.4%of target); seed capital support provided to 63 CMRCs (196.9% of target); and 13,235 SHGs were formed orstrengthened (146.7% of the target); and, 15,903 ultra-poor households were supported out of a target 5,000 HH.The project introduced some 16,544 mutual crop insurance/ health insurance policies to programme beneficiaries.
37.
At program completion, the number of women SHG members reached 155,784 women (173% of the target) in 1,606villages in 64 talukas distributed among the project districts.[9] Delays during project start-up in finalizing clusterselection slowed development and formation of SHGs and CMRCs. By 31 December 2012, 16 clusters did not haveCMRCs despite the appointment of IAs almost 2 years earlier. It would take until mid-2017 for all clusters to havefully formed and operating CMRCs. Despite a slow start, CAIM was able to meet output targets, although it took untilMarch 2018 for it to reach the targeted number of ultra-poor households.
38.
Both CMRCs and SHGs received substantial capacity development and training support aimed at ensuring theirviability and sustainability. A total of 14,385 trainings were conducted over the project period against an appraisaltarget of 13,000. There were 5,748 SHG exposure visits (60% of target). A further 3,919 trainings and 1,643 exposurevisits were conducted for VLCs (327% and 273% of target).[10] The quality of training and other capacity buildinginitiatives was periodically monitored.
39.
Table 2: Physical Progress of SHG and CMRC component40.
11/40

Activity UnitProjectTarget
Cumulative
Achievement
Total No of CMRCs CMRC 64 63
Total No of SHGs SHG 9000 13235
Formation VLC VLC no. 1200 1198
No of SHGs linked with bank (SHG) SHG 12112
No of ultra-poor HH supported Households 5000 15903
Number of CMRCs supported for Debt redemption through CMRCs CMRC 2 40
Social Enterprises Activities for CMRCs (Agro Service Center/ Common FacilityCentre) CMRC 27 63
Number of CMRCs supported Drudgery Reduction CMRC 52
Number of Micro Livelihood plan (MLP) MLP 454
Support for Common Facility Center CMRC 22 38
Component 2: Sustainable agriculture and market linkages41.
Subcomponent 2.1 Sustainable and LEISA farming systems: The project nearly met its target working in 64clusters (achieving 63 clusters being 98.4% of target) across 1,204 villages. The subcomponent engaged 190,347farmers (95% of target of 200,000 farmers), introducing several eco-friendly practices including: BBF, bio dynamiccomposting, bio-fertilisers and pesticides, vermi- composting, inter-cropping, refuge and trap crops.
42.
Quality seeds, fertilisers, pesticides (to 3,705 farmers) , sprayers (1,548 units) and training and technical support wasprovided to farmers. Due to salinity prevalent in some regions, subsidized gypsum was provided to 11,782 farmers.Soil testing was done by 10 minilabs for a total of 30,418 samples tested (with farmers contributing 30% of the cost).The Broad-Bed Furrow (BBF) system was implemented in 40,862 ha, assisted by 339 BBF planters provided by theproject. Better agronomic practices such as contour farming and sowing across the slope were promoted on 71,642ha to reduce soil erosion and improve soil moisture retention. Bio-dynamic compost (BDC), vermi-composting andother organic manures were promoted and farmers trained to prepare them, resulting in 11,110 BDC units and 315vermi compost/ organic compost units. Several farmers have started making S-9 culture (an input for BDC) from CowPat Pit (CPP) which they sell in the local market. As part of LEISA, 556 ready-to-install plastic biogas units were setup.
43.
LEISA/ organic initiatives with the Better Cotton Initiative (BCI) supported by the IDH reached 139,922 producerscultivating 151,607 ha in 1,204 villages, making CAIM the single largest BCI implementing partner in the world.[11]Additionally, on-farm demonstrations of organic/ BCI/ LEISA technologies and practices (12,924) were organized andfarmers were trained in preparation and application of organic and botanical formulations for plant protection andgrowth (e.g., amrut pani, dashparni arc etc.). Nature friendly agronomic practices such as rhizobium and PSB culturefor seed treatment and yellow/ blue sticky traps, pheromone traps for plant protection were also promoted and have
44.
12/40

been widely adopted. The program successfully promoted the intercropping of inter alia green/ black gram, moong,refuge crops cowpea, soya bean, pulses, groundnut and trap crops (okra, castor, marigold, pigeon pea, maize, etc. ).Although the project and IAs made efforts to promote uptake of organic-only farming, outputs were limited due to thehigh cost of certification and uncertain markets. The MTR suggested that land growing crops with assured marketsshould be certified and recommended focusing on “naturally grown” produce, leading to certification under the GoodAgricultural Practices (GAP) of 615 farmers.
Some 264,476 farmers were trained on various farming techniques/practices. In addition, BCI trained and providedon-site technical advisories to 139,922 farmers including safe use of pesticides. There were 650 exposure visits(target of 930), 219 Farmer Field Schools, and 285 households received kitchen gardens. The project also helped tointroduce the Agripole App developed by Jaya Laxmi Agro Tech (a start-up) which provides productionadvisories/basic extension for cotton, soybean, chilly, pigeon pea and dairy. About 100 units of the App were installed(CMRCs - 40, FPOs - 19, Agriculture Department offices – 40, and one in a cooperative milk society) reaching out intotal to 139,922 farmers. Farmer training on the App, however, has not been given and it remains underutilized.
45.
Some 1,256 Village Information Centres (VICs) were set up (209% of target) of which 770 are currently open and theirpost-project future is uncertain. There were 1,775 SPARC units established to provide farmers with farm implements,machinery, tractors and processing equipment on a for hire basis. Additionally,18 Farmer Service Centres (FSC) wereestablished. Both the SPARCs and FSCs are intended to help improve farm productivity, reduce input costs, andalleviate drudgery on a sustainable basis.
46.
Subcomponent 2.2: Livestock Development: Against a target of 2500 dairy units, the project established 3,735units (149% of target), supported the purchase of 7,470 cattle at the household level in 514 villages, and 31functioning milk collection centres (69% of target). The programme supported 3,048 household goatery units (122 %of target) consisting of 30,480 goats in 367 villages and 16,529 households in 1,443 villages were given backyardpoultry (egg laying) or commercial poultry units. Activity based JLGs were formed under the project as a mechanismfor sustainable financing and management of livestock activity. A cluster approach was adopted to facilitate inputaggregation and sale of animal products. In addition, CAIM supported bee keeping (533 households) and fisheries(809 households).
47.
Training was provided to 5,196 persons from 215 villages and 3,922 families availed veterinary services, whereby 42locally based para-vets and 273 Pashu Sakhis (local animal care givers) were trained and appointed. Fodderdevelopment was undertaken on 6,012.5 ha. In addition, farmers relied on veterinary services provided by the AnimalHusbandry Department, private practitioners, and market players with whom they have contract arrangements (e.g.,Amul, Mother Dairy, Eggman, Amrutha Hatcheries, etc.). Dairy trainings have proved useful for the farmers (providedby the Kolhapur Zilla Sahkari Dugdh Utpadan Sangh Ltd-GOKUL brand). The endline survey found 52% of peoplebenefited from these training programs.
48.
The PCR team identified four types of dairy models: i) producers market their milk (individually or as a group) directlyto buyers; ii) formation of dairy cooperative society associated with bulk purchasers such as AMUL, Mother Dairy,etc. whereby the purchaser introduced protocols and standards, provided measuring and quality testing materials,collected milk at fixed times daily, and made payments regularly according to a published rate schedule; iii) a CMRC/SHG managed milk collection centre which makes products like curd, ghee, paneer, butter milk and markets themdirectly; and, iv) JLG producer units where dairy animals were brought into town and milk is sold fresh directly tourban consumers.
49.
Subcomponent 2.3: Soil and water conservation50.
A total of 1,223 VDCs (102% of target) have been formed. Natural Resource Management (NRM) plans were madeby VDCs assisted by IAs and VLWs (altogether 2,780 plans). Following the MTR, NRM plans were replaced by need-based SWC proposals which were included in AWPBs. Altogether, only 284 persons (240 men and 44 women) from28 villages participated in SWC trainings. The endline survey revealed that only one third of participants in the CAIMvillages found the NRM trainings useful. VDCs which played an important role identifying beneficiaries and activities,supervising works, liaising and coordinating with the Gram Panchayats, the Agriculture and Soil ConservationDepartments, have become largely inactive post-project intervention.
51.
It is clear the project did not dedicate adequate resources towards mobilizing and building the capacities ofcommunities to undertake integrated SWC measures which could explain why not a single micro-watershed washolistically treated. The project exceeded or nearly met its SWC targets in terms of individual works as follows: workswere undertaken in 1,223 villages (103% of target) covering 391,000 ha (97% of target). A total of 854 well re-chargestructures; earthen (50), masonry (246), and gabion structures (153) were built bringing the total to 449 suchstructures; 514 Loose Bounder Structures (LBS) and 16 stone bunds erected; 3527 farm ponds dug (compared to thetarget of 1800 small farm ponds); 13 sunken dugout ponds have been constructed and 154 ground water rechargeshafts drilled. Desilting was conducted for 1,247 CNBs, 182 MNBs and 35 Village Ponds. Graded bunds have beenestablished on 48,882 ha. Nalla deepening, widening, and straightening has been undertaken on 301 streamscovering an approximate length of 75.25 Kms. Trees have been planted on 13,774 ha of land for soil conservationpurposes stream/ river soil stabilization and erosion reduction. There is no assessment available of the number of
52.
13/40

trees surviving but it doesn’t appear to be noteworthy. An additional area of 6,629 ha has been brought underirrigation, of which, micro irrigation accounts for 952 ha made possible through installation of 4,064 pump sets, 2,362sprinklers, and 1373 drips systems.
As SWC works were scattered across large geographical areas, the MTR recommended undertaking integratedSWC measures in 60 micro-watersheds of approximately 200 ha to improve outcomes through concentration ofefforts. This was not done and an opportunity to demonstrate the impacts that accrue to an integrated watersheddevelopment approach was lost. Despite 2017 and 2018 supervision missions recommending synchronization of theSRTT and CAIM management information systems (MIS), the PCR can only report 325 farm ponds were supportedby the SRTT.
53.
While the quality of works on private lands is largely acceptable, there is a need to review works done on the nallahsand streams, especially related to deepening, widening and straightening – “nullah training”. At the five CAIM-fundedsites visited by the PCRVM, excavated earth was piled on the edge of stream banks with no barriers to prevent itfrom draining back into the stream during the rains. In some cases, CNB flank walls were not compacted with thestream sides which could result in scouring, leading to damage to the structure as well as adjacent agricultural lands.In some instances, finishing of the dams was not done well with reinforcing rods left sticking out, posing a safetyhazard. In village Shirajgaon Mozari, Amravati (Tiwsa Cluster), work on the excavated and sequentially dammednullah was incomplete at the edge of the habitation, raising risks of flooding and diseases in the rainy season. InShendola Budruk, Amraati, a shallow aquifer was intersected and water which had drained out into the deepenedstream was evaporated.
54.
Straightening of streams, wherever undertaken, could lead to increased velocity of discharge resulting in damage tothe banks, water harvesting structures, water logging and possible flooding during heavy rainfall events or cloudbursts. Deep excavation into the river bed and uprooting of trees and vegetation can affect the hydrologicalcharacteristics of the stream which could result in reduction in basal flows, decline in re-charge potential, andenvironmental damage. Since integrated, adequate, and appropriate SWC measures to control water and soil erosionin the catchment areas have not been taken in all cases, siltation will in all likelihood and in a short span of 3- 4 years,reclaim the river, reduce ground water recharge and the life of the WHSs restoring the status quo ante. Finally thereappears to have been no consideration of up-stream or down-stream impacts on groups also using existing flowswith no reference to a type of compensation or alternative water sourcing for them.
55.
Subcomponent 2.4: Market linkages and value chains56.
Sixteen market information, surveys and studies (target 20) were undertaken profiling various commodities (e.g.,vegetables, spices, fruits, milk and poultry, etc..) provided information on farming practices and marketing channels.By 31 Dec 2018, 11,466 farmers continue to benefit from Market Linkages and Value Chain activities. In addition,20,028 farmers sold their cotton to BCI certified and registered ginners. This brings the total number of producersbenefitting from market linkages to 31,494 producers, representing 63% only of the CAIM target[12].
57.
The project negotiated 95 partnerships with the private sector (81.3% of target) across 63 clusters for over 20agricultural commodities through annual buyback farming contracts and commodity marketing arrangements. Majorcommodities included seed production for cereals (soybean, maize, cotton, green gram, black gram, maize,chickpea) and vegetables (tomato, lady finger, chili, and onion); medicinal plants (pashanbhed and ashwagandha),dairy (milk and paneer), wheat, turmeric and mustard, baby corn, and poultry (eggs and birds).
58.
The area of under contract farming reached 9,709 ha. The project staff supported the contract farming fromidentification to finalizing terms of agreement. Contract farming included production of specific seed/ product varietiesprovided by market players, technical handholding support and procurement from agreed points of purchase. Theproject facilitated five public private partnerships (e.g., local government providing building space and the privatesector technical support and buying of commodities). The number of market linkages peaked when IAs were involvedbut continued albeit more slowly after their withdrawal in 2017. Besides SMEs, market players also included well-known market companies such as ITC, Marico, Tata Chemicals, Tata Rallies, National Seed Corporation, Mahyco,Monsanto, and Amul.
59.
The project experimented with direct marketing of oranges in Pune city markets, selling 149 tons at higher than localprices. However, complex administration and higher cost of sale (underwritten by the project) did not encourage thecontinuation of direct sales activities. CAIM also experimented with supporting sales of several SHG products (e.g.,chilli powder, spices, papad, pickles, food products, candies, and red gram). The programme conducted cost-benefitanalyses of other products, markets, and alternate distribution channels (e.g., selling to a big retail brand).
60.
The project organized and supported 52 producer companies (PCs) against the target of 64. Of these, 39 wereformally registered, and 10 received initial 2 lakh INR seed capital. Only 14 PCs transacted business in 2017-18, ofwhich 8 achieved a turnover of greater than 20 lakhs (one had gross income in excess of INR 3 crore). PCbusinesses included cereals grading and processing, commodity and input trading, soil testing lab, oil mill, ruralgodown rental, commodity marketing, seed production, and buyback of medicinal plants. PCs were typically led by
61.
14/40
D.2. Rural Poverty impact
the largest investors (ranging from one to ten farmers) and had as many as several hundred farmer producermembers, each making a small shareholder capital contribution/membership fee. Producer benefits included, forexample, lower processing costs, lower input costs, and/ or premium produce prices, but did not typically includeshareholder/member voting/governance rights. Most directors (66%) and members (88%) were small and marginalfarmers. The remainder were larger farmers included to ensure some larger enterprise management experience wasavailable and to source investment capital.[12] Female participation was 10% and 20% at the director/ board andmember levels respectively.
PC formation and operation faced many challenges. From the programme side, inordinate delays in financing PCsaffected start up planning. PCs registered during 2014-15 received seed capital only in 2016-17, leaving little time forstrengthening and capacity building. Further, the mobilisation process for 26 PCs could not be finished when IAscontracts ended in March 2017, and PCs were unable to submit business plans on their own. From the PC side,most managers lacked the knowledge and experience of running a business. Many struggled to mobilise workingcapital, source bank loans (sometime due to poor credit history of directors), lacked collateral, and/or suffered poorcash flow and weak balance sheets. Many PC also struggled to pay Rs 20,000 to 25,000 fees for audits, accounting,digital signature of directors, inputs licenses and company registration.
62.
The project was able to form other collective enterprises more successfully through JLGs: 1,918 JLGs with 5-7members each and 3,921 producer groups with 8-10 members were formed to facilitate the benefits of collective inputprocurement and/or marketing. Groups that were part of buyback contract arrangements tended to produce and sellindividually, however, and fewer still offered services collectively and/or shared profits.
63.
The programme helped construct 213 value addition facilities (target of 100), mainly grading and processing units(e.g., cleaned graded soybean and red gram) and built/renovated 15 rural storage warehouses (target 10). Somewarehouses were used by other programme beneficiaries (e.g., a CMRC unit was used to store inputs for itsagricultural services center). The programme provided 50% subsidy for the units, which in some cases attracted JLGand or private sector investment. Several newly constructed warehouses remained idle due to lack of businessplanning and management capacity. The programme failed to establish a single on-farm storage facility for grainsand vegetables as producers with typically small quantities of produce preferred the convenience of commonly usedstorage facilities (e.g., tin sheds in fields, farmer’s home, neighbors, local low-cost warehouses etc.)
64.
The project supported the development of 2,172 non-farm enterprises (target 61), including 195 turmeric processingunits, 127 mushroom/grocery shops, 68 mini dal mills, 6 wool making units, and 1 integrated ginning mill unit. Some1,775 Small Producers Agribusiness Resource Centre (SPARC) were established against a target of 100.[13] CAIMprovided a 30% subsidy for asset purchase, often in combination with other programmes (i.e., convergence).
65.
Finally, 36,385 producers/farmers were trained for various agri-production and processing enterprise against a targetof 12,000 (e.g., seed production, vegetable, flowers, fruits, medicinal plants, spices production, fishery, dairy andbeekeeping etc.). Trainings included in/out of state exposure visits, business management/governance,bookkeeping, leadership, gender issues, and market linkages. Similarly, 6,942 persons had vocational trainings(target of 3,600 - 41% women). Topics included inter alia electrical appliances, tractor repair, dress design/ tailoring,soil testing, shade nets management, soybean by-products, dairy, lac cultivation etc. Trainings were given bygovernment agencies, KVKs, ITIs, and private sector players some of which provided jobs/ placement and self-employment opportunities.
66.
Most trainings lasted less than a week, some were up to 45 days in case of vocational training. The endline surveyfound only 38% of beneficiaries reported benefiting from training on market interventions; 35% from training ongrading, processing and packaging and SMEs. This calls for better selection of service providers and betteradaptation of training curricula.
67.
At completion the Rural poverty impact the project has been rated moderately satisfactory (4).68.
Outcome from Component 1 SHGs and CMRs Development: About 90,000 poor and marginalized householdsmobilized into socially inclusive affinity groups empowered to effectively articulate their interest, and the resilience ofthe distressed households enhanced. Specific outcomes included: i) 100% of SHG with savings and internal lending;ii) 70% of SHGs taking loans from banks; iii) 5,000 ultra-poor women cease to depend on daily wage labour; iv) 70%of CMRCs generated income to cover 80% of costs, and, v) Increase in ownership of assets by women.
69.
The total number of women reached through the SHG’s was 155,784 or 173% of target. By 30 December 2018,some 13,235 SHGs were operational each with mandatory savings programme and with aggregate savings duringthe project of IRN 576.91 million. This translates into an average savings per SHG of INR 43,590, and internal creditrepayment of 88-90%. A total of INR 1,864.13 million was lent to 12,112 SHGs by formal financial institutions (FFIs),primarily ICICI bank (which represents 91% of SHGs accessing bank loans in excess of the project target of 70%),and 75% of SHGs were graded as A (creditworthy), and 16% B (near creditworthy).
70.
15/40
The programme helped 43 CMRC’s cover 75% to100% of operating costs (representing 68% of formed CMRCsslightly lower than the project target of 70%). SHGs and CRMCs worked together in a mutually beneficial relationshipproviding women members appropriate support and income generating and asset building opportunities suited totheir needs. CAIM provided CMRCs INR 1 lakh of start-up capital per CMRC; while CMRCs sourced up to half theircore funding through SHG membership fees and fees for services such as the 2% commission charged on SHG bankloans. This encouraged CMRCs to ensure SHGs were creditworthy, which required constant attention to andnurturing of the lending and savings activities of groups and group members. To do this, MAVIM developed an SHGalert system, which employed variables related to SHG financials, group management and governance, and memberperformance as the basis of a monthly SHG performance assessment. At the same time, Sahayoginis, or womenwho would care and nurture SHG and their members, were deployed to cover 10 to 13 villages and 50 to 55 SHGs.The Sahayoginis provided proactive guidance/counselling services, watching over the economic, health, and otherpersonal/family needs of SHGs and their members, paying particularly close attention to vulnerable and very poorfamilies. Sahayoginis are employed by CMRCs.
71.
CMRCs also strived to diversify their businesses by creating enterprises and establishing micro-livelihood plans(MLPs) with partial support of the project. To illustrate, MLPs brought together groups implementing similar activitiessuch as goat, dairy, and vegetable patches. Some 454 MLPs were established, with 9,781 women at a cost of INR57.057 million, of which, CAIM supported INR 14 million (approx. 25% of total costs) and banks, SHGs, and othergovernment programs the remainder. CMRCs received INR1.981 million in MLP service charges and the programmeprovided participants a host of training and capacity development services on subjects from production through tomarketing and value addition. CAIM also supported CMRCs and SHGs with processing units, milk collection andprocessing units, turmeric polisher, etc. In 2016–17, MAVIM introduced the concept of Common Facility Centres(CFCs) to SHGs and CMRCs, which brought various production units under a common workspace for jointprocessing and value-added production, providing easy access to marketing. Some 38 CFCs were started by 6,283women, with a total investment of INR 59.2 million, of which, 70% was contributed by SHGs and the remainder byCAIM.
72.
An innovative debt redemption programme, livestock and health insurance scheme, along with loans to ultra-poor,asset subsidies (usually goat or cattle), training, and SHG loans/ savings helped 15,903 ultra-poor break dependenceon daily wage labour and raise their incomes (319.8% of target). CAIM provided financing to CMRCs to provide asmall grant to support income generating activities and reduce dependence on daily wage labour for ultra-poorhouseholds. Initially, the grant was INR 5,000/per woman, paid in cash. This was later raised to INR 7,000 and thenINR 10,000, as the original amount was found insufficient to purchase the income generating assets required toreduce dependence on wage labour. In 2016, MAVIM introduced the idea of revolving fund to the CMRCs so otherultra-poor families could benefit in the future. Women repay principal only and are not charged interest, beginningtheir payments one year after receiving funds, and have a negotiated/flexible payment system based on predictedfuture earnings. A total of 15,903 women were reached through this mechanism with 77.5% choosing to rear goats,10% to rear poultry, 3% to do dairy cattle, and 9.4% other activities. Many beneficiaries went on to borrow fromSHGs and banks. Total CAIM support given to this activity was INR 137,252,000, of which, INR 98,549,000 was lentand INR 12,711,910 repaid (approx. 13%).
73.
As a result of all the above mentioned results, women whose assets increased was 56% among CAIM beneficiariescompared to 34.5% for the control group, with an average difference between CAIM beneficiaries and controlrespondents across all districts of 24%. Moreover, with CAIM's support, MAVIM promoted Laxmi Mukti Abhiyaan,whereby a total of 62,021 families registered their homes in joint names in 877 villages recording 100% success rate.With regards joint ownership of farm land, 10,468 applications were made in 638 villages but only 47% of theapplications were successful. Joint ownership of farmland met with difficulty as it required consent of the family head.Furthermore, unlike the joint asset ownership for homes which paves the way for eligibility to access Governmentschemes for home improvement, joint ownership of farmland does not give access to services that meet HHaspirations.
74.
In conclusion, the debt redemption fund, MLPs, drudgery reduction scheme, and the ultra-poor revolving loan fundact in concert with the SHG and bank loans, as a system of graduation, which begins by building/stabilizing ultra-poorand poor household assets with grants and/or semi-subsidized cash payments. These, in turn, generate enoughincome to stabilize household economies. Once stable, households begin to lever assets through loans to furtherincrease incomes, reduce drudgery, and dependence on wage labour. As ultra-poor/ poor households graduatethrough this process, they can invest in both on and off farm, joint or individual micro and small enterprises whichserve to diversify income sources providing yet another hedge against external shocks and allowing them to invest ineducation, health, and other social and human capital assets. The systemic and contextually sensitive managementof SHGs and CMRCs reinforced the discipline women members required to advance their household economies andenterprise no matter which stage they began, ultra-poor or poor.
75.
Outcome from Subcomponent 2.1 Sustainable and LEISA Farming Systems: The endline impact assessmentindicates that 73% households reported an increase in household income since 2012-13, against 51.5% for thecontrol group. Of these, 39.1% of farmers report an increase in farm income as the key contributor to income
76.
16/40

enhancement. On average, project groups across all districts reported higher holdings of agriculture implements thancontrol groups, such as tractors (3.2%), sprayers (22.1%), irrigation equipment (13.8%), and micro irrigation (8.9%).
The CAIM Annual Outcome Survey (AOS) 2017-2018, found 96% and 92% of beneficiaries reported increased cropyield and land under cultivation, while control villages reported 10% and 84% respectively (the 2011 AOS reported13% and 58% for CAIM beneficiaries) This reflects the perceived improvement of agricultural productivity. Moreover,there has been an increase in other LEISA practices (i.e. seed treatment, sowing with BBF, integrated pestmanagement techniques etc.) from 34% (2016-17) to 54% in 2017-18. Further, 50% vegetable/horticulture farmers inproject villages report increased production as against no changes in control villages.
77.
The end-line survey confirms: i) there is a small but noticeable growth in area coming under conservation agricultureand a decline in conventional, chemical based agriculture; ii) 74% of farmers surveyed mentioned yields increased inBCI and this was 75% for organic farmers; and, iii) 74% of farmers reported an increase in net income for BCI and76% farmers for organic agriculture.
78.
The LEISA packages included different types of interventions implemented across villages and clusters. PCR fieldinterviews, cluster completion reports, and CAIM thematic studies show that decreased cost of production andreduced dependency on external input improved overall production, profitability and increased resilience. Farmersadopting BBF, for example, obtained an average 20% increase in yield, from 10% to 30% lower seed costs, and up to10% improved yields due to higher soil moisture content.[14] Gains were not without obstacles which include: i) BBFtakes more time than normal planting (up to 50% more), making it more difficult for larger farmers and farmerswithout access to mechanized BBF implements; ii) limited planting times of 10-15 days and short supply of BBFimplements (one BBF implement can serve 20-25 acres in 10-15 days); and, iii) sometimes limited access to bio-fertilizer and treatment for seeds.
79.
LEISA package initially promoted biodynamic composting (BDC) and then shifted to more open approach includingvermicomposting and jivamrut.[15] The method was found to have notable cost savings. Some 38% of farmers inJalgaon who tried BDC compost found it reduced cost of production by INR 1,500 per acre and increased yield by15%. Other advantages included softer soil, making weeding easier (often work undertaken by women), increasedwater retention improving yields and climate resilience, and decreased use of fertilizer. CPP was also used for seedtreatment and spraying for pest management.[16] Some obstacles found included: i) the time required (60 days); ii)need for manure, water and CPP inputs or S9 inoculum; and, iv) perception that compost will decrease yields. Thisapproach, as a result, is more readily adopted by farmers with enough livestock, means to transport compost, and asupply of water.
80.
Mixed and integrated approaches were also employed. A PDKV study found use of bio dynamic agriculturetechnology increased soybean and wheat yields by 31.8% and 14.5% respectively compared to conventionalpractices, with costs of production 64% and 48% less.[17] The Jalgaon cluster completion report shows LEISA wasimplemented in 82 ha. covering seed treatment, planting, bio-pesticides, and intercropping. Some 34% of householdsadopted such technology and reported 20% decrease of input costs and 13% increased productivity, with 33% ofhouseholds continuing use of method. Case studies in Seloo IA cluster found 33% additional income per acre forgroundnut under LEISA, associating BBF, seed treatment with Rhizobium, PSB and Trichoderma, and use of manureinstead of inorganic fertilizer (with some use chemical pesticides). Yields were 18% higher and cost of productionwas similar to those employing conventional fertilizer, but with savings in seeds (27%) and harvesting servicecharges as it is easier to handle BBF fields (14%).
81.
Outcome from Subcomponent 2.2: Livestock development: AOS data provides varying but generally positiveoutcomes for livestock development. AOS data (2013-14 to 2017-18) found 59% of households had livestock in 2013-14. This increased to 76% in 2014-15, dipped to 71% and 55% in 2015-16 and 2016-17 respectively, increasing againto 57% in 2017-18. Comparatively, livestock holdings are greater in project households as compared to controlvillages with about 13% farmers reporting increase in 2017-18.[18]
82.
Livestock rearing has proven to be attractive due to stable and remunerative returns. In the case of a well-run dairysociety such as the Sarvagya Shetkari Dugdh Utpadak Ghat of Takli village/Umerkhed Cluster, Yavatmal district, milkworth INR 5.9 million was marketed in 2016-2017 and the society gained a net profit of INR 57,000. On average,member households earned INR 10,000 per month not including sale of manure/compost. In the case of CMRC/SHGrun dairy at Urad Bhudruk (Akola), members received wage employment at the center of INR 100 per day. In the“dairy-to-customer” case, the JLG of Takli village (Buldana) members earns a gross income of INR 3,000 per day,netting INR 700-800 (including sale of manure). Average net income per member is INR 4,000-5,000 per month.
83.
Goat rearing has proved to be a profitable business for women, especially ultra-poor households. Several womenhave come out of extreme poverty by beginning with only 2 goats. A well- managed JLG (Rashtra Sant JLG which isa group of 5 menhaving 50 goats in Shendola Khurd village) reported net incomes averaging INR 108,000 perannum. Backyard poultry primarily reared for eggs (25-28 bird unit) has been successfully promoted especiallyamong poor women as the cost of raising the birds is not high. While returns are modest, the birds and eggs provide
84.
17/40
nutrition to undernourished families, especially children. On average, women earn a net profit of INR 40-50 per dayand, at the end of the cycle, a one-time amount of INR 3,000 - 4,000 through sale of the birds. Commercial (broiler)poultry units with market buy-back arrangements can yield significant returns: for example, in Dharni Taluka/AmravatiDistrict where the Tata Trust operates, the FPO has a buy-back arrangement with Amruta Hatcheries wherebyindividual members can earn a net income of INR 7,000 - 10,000 in a 40-day cycle, or INR 64,000-70,000 per annum.Market tie-ups in dairy and backyard/commercial poultry not only assure a steady income but reduce risks ascompanies guarantee buy back and provide feed and veterinary services across the production cycle. Despite theattractiveness and viability of livestock rearing, this sub-component could not be scaled up further due to reluctanceof banks to provide loans for purchase of animals.
Outcome from Subcomponent 2.3: Soil and Water Conservation: SWC works have contributed to raising thegroundwater table, increasing surface water capture, enhancing water availability for drinking and agriculturepurposes, improving the soil moisture regime and increasing the area under cultivation. The AOSs indicate that 29%of farmers perceived benefits from SWC in 2017-2018 compared to just 4% in 2011-2012. Similarly, 92% and 96% offarmers report increased crop areas and crop yield of in 2017–18 respectively, up from 58% and 13% in 2011-12.The AOS 2017-18 also indicates that 73% farmers noted water tables had increased, 60% said availability of irrigatedwater had increased, 56% report the area under irrigation has increased, and 5% that soil erosion has reduced. Theendline survey confirms SWC works have contributed to increasing area under irrigation in CAIM villages from 25.6%in 2012-13 to 31.2% in 2018-19, compared to 20.9% and 21.5% in control villages respectively. It should be noted,that farm ponds allow 1-2 protective irrigations and, in some cases, enable raising of fish.
85.
Outcome from Subcomponent 2.4: Market Linkages and Value Chain: The outcome for this subcomponent is50,000 farmers have improved market access including contract farming, value addition, backward and forwardlinkages resulting in increased income. By 31 Dec 2018, 11,466 farmers continue to benefit from Market Linkagesand Value Chain activities. In addition, 20,028 farmers sold their cotton to BCI certified and registered ginners. Thisbrings the total number of producers benefitting from market linkages to 31,494 producers, representing 63% only ofthe CAIM target.
86.
Market linkage benefits included improved market access through contract farming, value addition, and backwardand forward linkages resulting in increased income (e.g., input sales/ purchase, soil testing, processing, storage,etc.). The project supported 213 value added facilities, 2,172 non-farm JLG/PGs/SHG enterprises, 52 producercompanies, and 38 CFC.
87.
The project investigated 16 city markets for potential long-distance direct sales opportunities. Ultimately, the numberof farmers selling produce in distant markets achieved was 1,766.[19] As part of this effort, the project promoted a“Farmer to Consumer” pilot for selling oranges in markets requiring long distance transportation and overnightaccommodations for producers. Some 318 farmers sold 149 and 1208 tons of oranges in 12 cities in 2015–16 and2016–17 respectively. As per the date available from this pilot, the organization and costs of long-distance directtrading would be a challenge for farmers to manage on their own. This operation was discontinued thereafter.
88.
The endline survey found 19.5% of beneficiaries received a better market price for their produce. Beneficiaries inAmravati (16.7%), Washim (29.1%), and Yavatmal (36.5%) reported highest levels of improved prices. The PCRfound that contract farming led to increases in average incomes by INR 15-20,000 per ha. For example, seedproducers, under contract farming arrangement, witnessed increases in income and net profits of 1.3 and 2.5 timesrespectively, compared to traditional markets. While there is evidence of higher prices, improved incomes are morerelated to lower input and/or processing costs, improved pest control, reduced pesticide use, improved soil nutrientmanagement and improved irrigation. This is exemplified in the case of BCI where farmers enjoy a 17% to 51%higher profit compared to non-BCI farmers. A 1% premium on BCI cotton and free transport and weighing contributesto this margin, but the bulk of additional profit is earned through higher yields and lower production costs. BCI cottongrowers are encouraged to intercrop, where farmers can gain additional income of INR 25,000 – 26,000 over agrowing season.
89.
Figure 1 - Responses on Better Market Price (%)90.
18/40

i) Household income and assets
Source: Figure IV.19: A Study of Impact Evaluation of Convergence of Agricultural Interventions in Maharashtra(CAIM), May 2019, Preliminary Draft Report, May 2019, National Council of Applied Economic Research.
91.
While many individual dairy and egg producers continue to sell directly to consumers, commercial andindustrial aggregators like Amul, Mother Dairy, Amar Dairy, Shrusti Dairy in the milk sector as well as Eggman andAmrutha Hatcheries in the poultry sector, these practices are introducing transparency and accountability, as well asclear management protocols while providing veterinary care, high quality inputs, and assured buy-back arrangements– all of which incentivise producers to improve quality and efficiency. While there is no value chain for goats, localmarkets are large and returns attractive.
92.
Other benefits to farmers not necessarily immediately captured by improved prices include better market access (byproduct and geographically), increased market knowledge, quality production management for improved margin,greater price negotiation capacity, and greater crop diversification. Finally, the PCR mission found that not allproducers benefited equally from improved prices as some member-based enterprises were either unable or unwillingto divide retained earnings. In these cases, members often benefited from lower input and processing costs, or smallprice premiums.[20]
93.
As noted in section D.1, while many producer organizations enterprise, market linkages, and contract farmingarrangements were established by the programme, field results show that without continuous and consistent supportfrom IAs, many market linkages were not renewed and or collapsed. The endline survey found producer marketingbehaviour had not substantially changed and many still preferred/ relied on traditional channels. Some 24.9% ofCAIM beneficiaries preferred farm gate sales compared to 19% of the control group. There is a slight increasetowards market selling by CAIM beneficiaries from 49.3% in 2013 to 52.6% in 2018-19. Differences by district arenotable: in Yavatmal, use of marketing channels was 78.3% in 2018-19 while in Amravati it was 37.2%. The onlynotable change over time in the districts was in Washim, where preference for market channels increased 11.3%(compared to overall average change of 3.3%). Beneficiaries reporting benefits was relatively low at 37.9%. InBuldhana, where benefits from training was 60.1%, for example, change in preference for market channels was -0.2%
94.
In conclusion, the market linkage and value chain subcomponent activities formed numerous types of collectivefarmer organizations/ enterprise with uneven outcome achievements. The PCR finds little evidence of substantialacross-the-board price change for producers. More positively, producers were able to reduce input costs, processingcosts, and improve quality and yield through collective activity. This was particularly true through BCI, and otherLEISA and soil and water conservation activities. The extent to which CAIM durably changed producer marketingpreferences has been limited, underscoring both the challenge of establishing and growing enterprise whileintroducing new approaches to marketing. That price increases were evident is encouraging, as is the BCI modelwhich demonstrates the advantages of a well-organized value chain supported by an apex organization yieldinggains to producers at various points in the value chain.
95.
At completion of the project Household income, assets, and wealth ranking is rated moderately satisfactory (4).96.
According to the endline survey, 74% of CAIM beneficiaries reported their income improved from 2012-13 to date, or1% less than the MTR target of 75%. The main drivers for the improvements are higher net income from farming andfrom non-farm enterprise (39%), from wage labour (33%), and other livelihoods (28%). This has positively impactedbeneficiary household perception of wealth, as compared to the control group (See Table 2 below). While beneficiaryand control households had comparable perceptions of poverty in 2012-13, by 2018-19 CAIM beneficiary householdsseeing themselves as poor or very poor nearly halved whereas change for the control group was only 30%. Thisperformance is sizable, yet falls below the target set at design of 75% of the beneficiary group improving wealthranking. Finally and based on the financial analysis, increase in income reached on average about 10,000 INR whichrepresents 20% increase over the baseline income, below the target 40% income increase.
97.
19/40

Type
2012-13 2015-16 2018-19
CAIM Control CAIM Control CAIM Control
Rich 1.3 0.8 1.8 1.0 6.2 3.7
Medium 34.7 34.0 50.2 45.4 57.2 52.1
Poor 48.2 48.2 41.9 44.2 33.4 36.4
Very Poor 15.8 17.1 6.0 9.5 3.2 7.8
Tractor Sprayer Irrigation Equipment Micro-IrrigationEquipment
CAIM Control CAIM Control CAIM Control CAIM Control
Akola 3.3 3.3 11.4 10.0 10.1 9.2 5.9 7.5
Amravati 1.1 0.4 5.3 3.3 6.1 5.2 4.0 3.7
Buldhana 1.6 1.3 3.8 1.3 3.6 1.3 2.3 0.9
Wardha 3.7 1.6 7.7 0.0 12.0 6.3 8.3 4.0
Washim 5.8 3.7 15.5 7.3 14.5 13.8 14.5 6.5
Yavatmal 4.9 1.8 59.6 44.5 28.5 20.7 16.4 6.3
Findings from the endline survey showed that beneficiaries of soil and water conservation, particularly cement nalabunding (93.7%) and irrigation equipment (93.5%) interventions, reported increased income more frequently than thebeneficiary group as a whole (73.7%, control group 51.5%). Livestock development and market linkages and valuechain related beneficiaries reported slightly less than the average of beneficiary groups as a whole. Some 85% ofbeneficiaries reported increased income when benefiting from two programme activities, compared to 73.9%benefiting from just one activity.
98.
The increase of income from agri and allied activities is reflected in the ownership of consumption and productiveassets: while ownership of consumption assets is comparable among beneficiary and control groups, ownershipproductive assets is notably higher in beneficiary households. (See Table 3) Beneficiary household ownership of non-productive assets also grew compared to the control group in all categories, save mobile phones (i.e., colour TV,refrigerator, fan, and bicycle).
99.
Table 3 - Wealth Category Status as per the Respondents (%)100.
Source: Endline Survey, NCAER, 2019101.
Table 4 - Status of Asset Ownership (%): Productive Assets102.
20/40

Total 3.2 1.7 22.1 13.8 13.8 9.6 8.9 4.5
ii) Human and social capital
iii) Food security
Source: Endline Survey, NCAER, 2019103.
It is notable that these income gains were made in the context of substantial over indebtedness during the first part ofthe project and a three-year drought in the latter part. The analysis of outcomes shows that sustainable agriculture,livestock, market linkages, and SWC in particular, led to lower input and processing costs, higher yields and qualityproduction, and to a lesser extent improved agricultural product prices (to a lesser extent). These factors combinedled to net income gains for productive activities. This suggests that beneficiary households not only increased grossincomes, but profits on income generating activities as well.
104.
At completion of the project Human and social capital is rated moderately satisfactory (4).105.
The programme created substantial human and social capital through the support and mobilization of SHGs, variousenterprise/human development trainings and capacity development activities, as well as the creation of enterprise/economic activities. SHGs members, with the help of CMRCs, have built sustainable institutions owned and managedby women members. MAVIM’s training activities and SHG/CMRC have increased members self-confidence andeconomic potential, empowering their participation in public spheres (e.g., Panchayat Raj Institutions, VLCs, andCFCs). Selection of ultra-poor by SHG member consensus for extra support (e.g., funds for repaying overdue debt)indicates strong social capital development. Entrepreneurship training has increased women’s confidence andknowledge which is being recognized by their families, communities, and men. More generally, project trainings onmicro-enterprise, vocational skills, leadership, book-keeping etc. not only built producer/ entrepreneur technical skills,but soft social and enterprise skills as well (e.g., human resource management, teamwork, relationship trust, etc.).Market linkages provided opportunities for producers to manage commercial relationships and partnerships withsmaller and larger market players. This improved beneficiary understanding of marketing and business management,which in a collective enterprise context allowed for farmer to farmer/ training of trainer capacity building, resulting innotable social capital development. Various agri-enterprises and non-farm enterprises provided opportunities to movetarget groups up value chains, from producers to aggregators, to processers and marketers. This not only improvedenterprise management skills but social status within the family and the community as well. Similarly, farmer to farmerinteractions through product/livestock camps, demonstrations increased producer knowledge and empoweredproducers’ confidence to innovate and take calculated risks.
106.
The project also contributed to the creation of a cadre of community workers, composed of the management ream ofCMRCs including the Sahayoginis for monitoring SHGs and serving as first alert point in case of social and economicstress among the members; pashu sakhis (animal health workers) who provide first aid veterinary support to livestockrearers and many of the pashu sakhis, usually women, found their social status improve as a result of thheirprofession; village workers who played an important role in planning and monitoring the SWC.
107.
Other grassroots organizations like the Producer Companies (PCs) could have benefitted from timely support andmore experienced handholding. The achievement of financial sustainability by the CMRC and their strong socialcohesion point to the following : (i) the PCs should be built on a strong membership, and provide avenues for themembers to participate in the governance of the organization; (ii) the revenue model for the PCs should be clear andacceptale to the members; (iii) an experienced organization, which has as its mandate the development of PCs,should have been mobilized for the purpose of developing their capacity in a systematic way. As seen with CMRCs,their performance strengthened with MAVIM acting as the one agency backstopping all CMRCs, ensuringconsistency in the capacity building approach and strong system development within CMRCS.
108.
At completion of the project Food security has been rated moderately satisfactory (4).109.
CAIM interventions have helped beneficiary households diversify crop production and improve the safety of foodcrops. Beneficiaries report increased access to water through soil and water conservation which has enabled them togrow vegetables and wheat contributing positively to their diets. Moreover, LEISA methods enabled many to usefewer chemical inputs, leading some beneficiaries to mention that their food was "healthier". Field level discussionswith beneficiary household members found livestock-based livelihoods enhance family nutrition, especially amongchildren, as households consumed more dairy products. Similarly, households benefiting from poultry production eatmore eggs and some consume chicken meat. These observations are consistent with the endline survey which foundthat 40.5% of beneficiaries reported increase in food availability, compared to 22% for control respondents. A
110.
21/40

iv) Agricultural productivity
v) Insitutions and policies
considerable number of respondents (76.2%) from the control group reported unchanged food availability comparedto CAIM respondents (58.4%).[22]
In contrast to the positive results mentioned above, higher incidence of food shortages was reported in Buldhana,Akola and Amravati in the end line survey. Households earning income of less than INR 15,000 per annum facedfood shortages both in CAIM and control villages (61.4% and 62.6% respectively). Households earning INR 30,000-50,000 also reported notable food shortages (31.0% CAIM villages and 24% control villages). Higher incomehouseholds for both CAIM and control villages also reported food shortages, albeit less often. These findings contrastto the baseline survey which found 6% of project and control villages reporting food shortages. CAIM district teamscarried out random check of this information in the surveyed villages in the 3 districts and found that contrary to thedata of the endline survey, no household faced food insecurity over the past 12 months. The discrepancy betweenthe endline survey and the field verification can be explained by the following : (i) respondents mis-understood thequestion of the endline survey as the period of the food shortage was not specified; (ii) due to expansion ofcommercial agriculture, households are net food buyers and no longer produce all the food required for theirconsumption. One aspect that warrants attention however is the precarious situation of those households who earnless than INR 15,000/ year whose incidence is 10.6% and 16.5% in CAIM and control villages respectively, and thehigher incidence are in Amravati, Buldhana, Washim and Akola. Also noted is that the Government has several foodbased safety nets: the public distribution system (rations of staple food for poor and extremely poor households); mid-day schools meals; and the integrated child development services programmes where child and mother care centresprovide cooked meals for pre-school children as well as take home rations for pregnant and lactating mothers. Allthese programmes are now coming under the Poshan Abhiyaan (Nutrition Mission).
111.
At completion of the project Agricultural productivity is rated moderately satisfactory (4).112.
The area under LEISA/BCI/sustainable agriculture is gradually increasing, and most small/marginal farmers in theproject have increased production, reduced input costs, and improved market and resilience to weather-related risks.Simultaneously, producers are increasing incomes through crop pattern diversification, use of modern tools/equipment and water efficient technologies. Livestock rearing has augmented the income of 23,312 households,enabled many ultra-poor women get out of poverty. Water security has been enhanced in 1,200 villages, bringingmore area under cultivation, increasing availability of drinking water while increasing agricultural output. Focussedefforts have been made to aggregate farm and animal inputs/products to secure benefits of scale, as have sustainedefforts to secure favourable market access and better price realisation through contract farming, tie-ups and buy-backarrangements. The project attempted to address production (supply side) and market (demand side) improvementswith end-to-end value chain interventions, the success of which is demonstrated in several initiatives including dairy,BCI, and SHGs. For more detailed outcome analysis, see D2: subcomponents 2.1, 2.2 and 2.3.
113.
At completion of the project Institutions and policies is rated moderately satisfactory (4).114.
The programme has had a positive effect on institution building of various grassroots organizations including SHGs,CMRCs, VLCs, and VDCs. The institutional capacities of these organisations improved in terms of internalmanagement, service provision, and related beneficiary/ stakeholder social, economic and human capitaldevelopment. This is particularly important for CMRCs, which have important community development functionsfocused on local and rural poverty alleviation. Similarly, some local institutional/government agencies such as theGram Sabha and KSK are now reportedly more responsive to smallholder farmer and lower income stakeholderneeds. From a policy perspective, the success of MAVIM encouraging joint ownership of home and farm assets(Laxmi Mukti Yojana) through awareness street plays and gender workshops in 1,126 villages, demonstrates theeffectiveness of the GoM policy.
115.
BCI activities have been handed over to Cotton Connect (CC) which works through NGO partners, production units,field facilitators and CC absorbed groups organized by CAIM. The learning groups formed by BCI/CC will continue tofunction, as CC expands in the region. There is a need for BCI to go beyond the production cycle and certifiedginners, and to collectivise production units, moving them up the value chain. This would enable benefit of scale,secure better terms of trade, and improve incomes of cotton growers. Similarly, there is momentum towards use ofLEISA, nature friendly and water efficient agriculture as these are key areas for the RKVY Programme of theGovernment. The Jal Yukta Shivar Yojana (JSY), a SWC programme of the GoM, has provided substantial resourcesfor undertaking SWC works in collaboration with the Gram Panchayats. While VDCs, constituted as a formal sub-committee of the GP are not likely to continue effectively in the post-project period, their experience can prove usefulin the implementation of JSY. Government policy and convergence support promoting dairy development throughincentivizing private and public dairy industries has led to the growth of milk production in project villages. The GoM,with support from the National Dairy Development Board and Amul (owned by Gujarat Milk Producers Union) plan toscale up the dairy development approach taken by CAIM. The SRTT is expanding the poultry programme for poor
116.
22/40

vi) Access to markets
Districts
Friends Moneylender Trader Others
CAIM Control CAIM Control CAIM Control CAIM Control
Akola 66.7 57.7 29.5 38.5 1.3 0.0 5.1 3.8
Amravati 81.3 50.0 12.5 50.0 6.3 0.0 0.0 0.0
Buldhana 90.5 80.0 9.5 20.0 0.0 0.0 0.0 0.0
Wardha 71.1 82.4 14.5 11.8 9.2 0.0 7.9 5.9
Washim 69.4 80.0 20.0 17.1 3.5 2.9 7.1 0.0
Yavatmal 74.3 80.6 25.7 16.7 0.0 0.0 0.0 0.0
Total 72.0 75.4 21.1 21.4 3.5 0.8 4.6 1.6
D.3. Gender equality and women's empowerment
households, across Maharashtra and nationally.
CAIM beneficiaries and institutional stakeholders also benefitted financially and knowledge-wise from convergencewith 25 government/development agency programmes, and will continue to do so after the CAIM, as it partners withother external agencies such as the World Bank and Asian Development Bank, to support climate resilient agricultureand improved farmers' access to markets.
117.
At completion of the project Access to markets has been rated moderately satisfactory (4).118.
For details on market access, please refer to D1 and D2 output and outcome discussion for subcomponent 2.4:Market linkages and value chains.
119.
Reduced reliance on exploitative credit arrangements120.
At completion of the project, reduced reliance on exploitative credit arrangements is rated moderately satisfactory (4).121.
The programme targeted at least 90% of SHG members cease to use exploitative credit arrangements. A total of12,112 SHGs, or 91% of established SHGs had credit from banks (primarily ICICI Bank) mobilizing approximatelyINR 1,864 million. The endline survey found notable improvements in bank account holding since 2012 (99% ofbeneficiary households up from 78.5%). Some 63.4% of women had taken formal loans compared to 46.8% men.Some 21.1% of households still had loans from moneylenders (control group was 21.4%),[23] down from 2013, when40% of beneficiary households indicated a preference for informal sources.
122.
Table 5 - Major Sources (%) of the Informal Loan: CAIM & Control123.
Source: Endline Survey, NCAER, 2019, Note: Others include Shops and Landlords etc.124.
At completion of the project Gender equality and women's empowerment is rated satisfactory (5).125.
Gender equity was a priority for CAIM. Women represent 53.1% of the beneficiary households. Activities promotedthis level of participation are: i) staff and beneficiary gender sensitization workshops; ii) women’s rights awarenesscampaigns/advocacy at the government and grassroots level; iii) training women/ training women as trainers (e.g.,
126.
23/40

field facilitators); and, iv) participation in SHGs.[24]
Despite relatively high participation in the programme, women involvement in programme activities was uneven: theydominated in Component 1; they participated effectively in livestock development in subcomponent 2.2; yet therewere fewer women in market linkage activities. SHG members' disciplined approach to financial services wasreflected in the growth of women led MLPs, CFCs, some JLG, and fewer PCs. The project reached 34,959 female-headed households, many through support to ultra-poor households. Most had a single source of income, faced foodinsecurity, and had costly informal credit. Interventions addressed income diversification through on- and off-farmenterprise development, increasing agriculture productivity for food security, increasing access to formal credit,facilitating access to livestock care, and capacity building. Some 1,126 villages benefited from awareness raising onjoint ownership of home and farmland assets.[25]
127.
The mission observed that Components 1 and 2 could have been better synergized to increase benefits to women,particularly as women loans were often invested in household's farm activities (e.g., seed loans etc.). The endlinesurvey confirmed that SHG members used 36% and 38% of internal and bank loans respectively to fund agricultureactivities. Some women also engaged in value addition, or sold household farm produce (e.g., fodder, foodprocessing, retail sales, etc.).
128.
The endline survey also found 56.2% of CAIM households, compared to 28.8% of control respondents, reportedwomen on farm and off-farm enterprises had positively impacted household incomes. These findings varied bydistrict. In Amravati and Buldhana 80.5% and 78.1% reported positive changes (46% for control), and, while lowercompared to the average, women’s income generating work in Akola and Washim was 4 to 5 times higher thancontrol groups (38.4% and 52.6% respectively, compared to 8.3% and 10.1% for the control villages).[26] Some55.7% of CAIM women beneficiaries reported increased assets compared to 34.5% for the control. In Amravati andBuldhana, 84.7% and 83.4% reported increases, compared to 65.9% and 44.5% in the control group.[27] Akola(39.6% compared to 9.1% in control) and Wardha (31.8% against 11.1%) and Washim (46.6% against 23.3%) hadthe largest differences.[28]
129.
Enhancing economic security and improving access to land through joint ownership of homes and farmland alsocontributed to gender empowerment and equality (see discussion above on implementation of Laxmi Mukti Abhiyaanprogramme). In Shivnagar, Washim district, some 187 women obtained joint ownership; many interviewed by thePCR mission expressed feeling more “secured and confident” for their economic futures. Obstacles to joint ownershipincluded: i) adverse social norms; ii) unsupportive husbands; iii) cost and process of obtaining certificate (INR20,000); and, iv) challenge of dividing farm land among extended family members.
130.
CAIM had a noticeably positive impact on women's agency and decision-making role in household and communityaffairs, including increased representation in local institutions. The endline survey found CAIM respondents reportingwomen have greater household decision making power (64.4%), increased mobility (62%), and improved statusoutside the home (60%). This is approximately twice that reported by non-beneficiary women.[29] Notably, womenreport being more involved in farm input and investments decisions (which may be linked to the observation thatmany loans taken by women supported farm activities). Women also report many men, family, and villagers nowrecognize/accept their increased social status.[30] As one pashu sakhi said “now they call me madam and ask mequestions. Before they did not pay any attention to me.”[31] In Shivnagar, Washim district, women reported having astronger voice in the village council. This makes it easier for other women to communicate to the community theirviews/ needs (e.g., improved drinking water and housing, celebrate womens’ day etc).
131.
The endline survey found 56.7% of beneficiary women reported an increase in their overall workload compared to thecontrol at 28.3%. This is associated with a reported increase of paid work by 56.2% of women (control 20.9%). Fieldobservations found that women saw these changes as generally positive. Increased workloads were offset byincreased incomes, and often by a reduction in drudgery work in the household and on the farm. The programmesupported 358 SHG managed drudgery reduction units (e.g., grading machines, spiral separators, sprinkler pumps,motor engines, etc.) which women confirmed lessend workloads overall and made remunerative employmentpossible.[32]
132.
LEISA technologies and agricultural interventions had mixed but generally positive impacts on women’s work loadand well being. Access to mechanization via mechanization centres reduced women work load for land preparationand planting and helped to offset increased labour scarcity due to women’s other income generating activities.Reduced application of chemicals and mineral fertilizers reduced women’s work, as organic replacements are mostlyapplied by men. LEISA techniques also had health benefits for women and households, as did organic compostwhich makes weeding easier. This was partially offset by increased planting density in BBF and BCI, and timeintensive compost prepration which is often undertaken by women.
133.
Participation by women in JLGs and PCs was notably less than for men (e.g., 20% of PC members were women and10% directors). Going forward, and building on women active role in CMRCs, measures need to be designed formaintraeming gender considerations in PCs.
134.
24/40

D.4. Adaptation to climate change
D.5. Environment and natural resource management
D.6. Targeting and outreach
At completion of the project Adaptation to climate change is rated moderately satisfactory (4).135.
The adverse impacts of climate change are being increasingly felt across Maharashtra. In Vidarbha, the frequencyand intensity of extreme meteorological events are expected to increase in the coming years (e.g., erratic andunpredictable rainfall, cloud bursts, high intensity rainfall, long dry spells, hailstones, severe cold spells, extremelyhigh temperatures, warmer winter, reducing diurnal temperature range, increasing frequency of drought). The regionis currently in a three-year drought with moderate to high impacts depending on the district.
136.
Undertaking of LEISA/organic/conservation agricultural practices together with mixed farming and crop diversificationhelps reduce vulnerability and builds resilience to climate variability. Proper agronomic practices (such as INPM)together with improved soil health and assured access to water can help reduce the incidence of pest and diseaseattacks as well as ensure crops can be brought to term with minimum losses. Improved soil moisture holding capacity(due to increased organic content and specific ploughing methods such as BBF) as well as technologies thatenhance water use efficiency can help crops weather dry spells. Several farmers confirmed that fields under LEISArequired less water and do better in the case of drought. Large and small ruminants are better able to weather hightemperatures and provide a supplemental or alternate source of income in case of crop losses. They also providevaluable organic wastes for agricultural purposes.
137.
The SWC measures like graded bunds, farm ponds, CNBs, well recharge and ground water recharge structures,desilting of streams will help capture rainwater in-situ and impound runoff. However, these structures need periodicmaintenance in order to function effectively. Rivers and streams have been desilted and deepened, straightened,widened (“trained”) and intensively dammed substantially increasing water capture potential, increasing infiltrationand re-charge of ground water aquifers. However, as the upper catchments of these streams and water bodies havenot been adequately treated in general, and hydrological characteristics of streams have been significantly altered,the danger of flooding, damage to farmlands and properties remains, while siltation will reduce recharge potentialsprogressively reducing the life and effectiveness of the interventions. There is need, therefore, to intensify protectionand stabilisation of catchment areas of nalas/ streams and rivers where treatments have been undertaken, especiallywhere a deepening and straightening has been done.
138.
At completion of the project Environment and natural resource management is rated moderately satisfactory (4).139.
Promotion of sustainable agricultural practices and its adoption by large numbers of farmers reduces theenvironmental footprint of agriculture, improves biodiversity and soil health. This is further enhanced by the growingavailability of animal wastes being increasingly processed and used for agricultural operations and mirrored by asmall decrease in the use of synthetic and chemical products. Though the number of ruminants has increased, theyare well within the carrying capacity of the region. Many small, and in-principle environmentally neutral SWCs havebeen undertaken together with tree plantation. These have a generally beneficial effect on the environment. Ofconcern, however, is the way and quality of some of the “nalla training” works that have been undertaken which canhave potentially adverse hydrological and biodiversity outcomes. Tree plantation contributes to improving the micro-climate, increasing ground water infiltration, improving the soil moisture regime, adding to soil organic content andpromoting biodiversity.
140.
At completion of the project, targeting and outreach is rated moderately satisfactory (4).141.
The programme targeting strategy focused on reaching out to below the poverty line (BPL) households, scheduledcastes and scheduled tribes, the landless, women-headed and distressed households. It would do this first byassessing target clusters on a range of variables including inter alia socioeconomic status of the population, potentialfor soil and water conservation activities, and amenability to planned project activities. Specific beneficiaryhouseholds would be chosen through participatory measures. The mission measured the effectiveness of thetargeting strategy by reviewing the over-representation of the target groups among CAIM beneficiary households.This analysis is based on the findings of the endline survey.
142.
The programme successfully achieved its BPL targets. Compared to the population, CAIM BPL householdsrepresented 33.7% more than districts population as a whole.[31] There was overrepresentation in all districts exceptfor Buldhana and Washim where the representation of BPL in CAIM and overall population were approximatelyequivalent.
143.
In terms of social groupings, Scheduled Castes and Scheduled Tribes are underrepresented in the CAIM endlinesample compared to the control group, but overrepresented compared to the population as a whole (they representeda combined 28.4% of CAIM beneficiaries). Representation of women-headed households for CAIM and the control
144.
25/40

D.7. Innovation
D.8. Scaling up
sample are roughly equivalent across districts. With regards to land ownership, marginal landholders wereunderrepresented by 7.6% compared to the control overall. CAIM small landholders were overrepresented by 4.9%and large landholders were minimally overrepresented.
These findings are consistent with PCR mission field observations that CAIM households were poor but were notover-represented by the ultra-poor or landless poor; and there was evidence of some moderate under-representationof target groups in SHG’s, JLGs, and, more particularly, in PCs. This said, the program served over 34,959 women-headed households (12% of the programme beneficiaries) and directed resources to 15,903 ultra-poor households(5% of beneficiaries). Women comprised 155,784 beneficiaries, or 52% of all programme beneficiaries. As noted,women were not equally involved in all activities, particularly JLGs and the PCs. Their interests and needs, however,were well attended to by SHG’s and related CMRC activities (e.g., CFCs).
145.
There was minimal risk of elite capture in this programme despite a slight bias towards larger landholders. Theproject worked with a range of different socioeconomic groups to ensure access to a range of business skills requiredto facilitate enterprise development activities. More generally, average amounts of subsidies were not attractive tohigher income households. Directors and investors of larger PC enterprises, however, would disproportionatelybenefit in absolute terms even as producer members would benefit in relatively large numbers (typically small andmarginal landholders).
146.
At completion of the project, innovation is rated satisfactory (4).147.
The programme design was in and of itself innovative for the GoM as it implemented a new to the state ‘end-to-endapproach’ approach from pre-production (e.g., inputs, finance, training), production (e.g., package of practices andtechnical support) and post-production (e.g., market linkages) critical for small and marginal land holding producers.This was an ambitious approach which required programme stakeholders to work both horizontally acrosscomponents as well as vertically through the different activities (e.g., improving a product value chain link to SWC,and improved market linkages through a strengthened farmer owned enterprise). This approach required substantialstakeholder communication, including between various GoM line departments as they worked to support programmeactivities. (See Section F - Partners' performance details)
148.
The project also adopted numerous innovations for stakeholder participation, agricultural production, serviceprovision, financial services, and women empowerment. A key innovation consistent with the ‘end to end’ approach,was working to strengthen people-oriented institutions (e.g., VDC, SHGs, and CMRCs). On the technologicalproduction front, the project promoted innovations in LEISA such as BBF, sowing against the slope and biodynamiccompost units, expansion of good agricultural practices promoted by BCI, and introduction of ready to install bio-gasunits. On the service front, the project promoted “Pashu Sakhi” community-based animal workers and communityaccounting cadre as CMRC staff, to sustain last mile service delivery.
149.
On the financial services front, the project introduced mandatory cattle and goat insurance and joint borrowing forCFCs. MAVIM further developed the CMRC grading and SHG alert monitoring systems launched under the IFADsupported Tejaswini Programme. The ultra-poor revolving fund concept was introduced, as was a debt redemptionfund to help households willing but unable to re-pay loans due to extreme events (e.g., crop failure, illness etc.).Supportive counselling of the Sahayogini was also innovative, helping deal with crisis and to identify/ act onhousehold challenges before they happened. This package of services (also including the MLP, drudgery units etc.)helped address household distress by creating a sustainable/ institutionalized ‘graduation system’ to protect andgrow/ diversify poor and ultra-poor household income and assets.
150.
On the market access front, the project piloted market linkages with the private sector. Major commodities for marketlinkages included seed production for cereals(soybean, maize, cotton, green gram, black gram, maize, chickpea) andvegetables (tomato, lady finger, chilli and onion); medicinal plants (pashanbhed and ashwagandha), dairy (milk andpaneer cheese), wheat, turmeric, mustard, baby corn, and poultry (eggs and live birds). The buyback contract farmingincluded production of specific seed/product variety provided by market players, cost of which was recovered fromsales, technical handholding support and procurement from agreed points of purchase. Market linkages alsohappened after initial processing (cleaning and grading) on pre-agreed terms with the farmers and that fetched higherprices for the processed product. The private sector players included small enterprises as well as well-known marketplayers such as ITC, Marico, Tata Chemicals, Tata Rallies, National Seed Corporation, Mahyco, Monsanto and Amul.
151.
At completion of the project, scaling up is rated moderately satisfactory (4).152.
Several CAIM programme interventions are already being scaled up and others demonstrate the potential153.
for wider replication and adoption. The innovative suite of products for reducing household debt managed by theCMRCs were scaled up during the programme and have broad potential across the state through MAVIM’s network
154.
26/40

E. Assessment of project efficiency
E.1. Project costs and financing
Financiers Appraisal TargetAchievement
(to Dec 2018)% of Achievement
IFAD loan 1,886.277 2,334.597 123.77
IFAD grant 47.519 14.038 29.54
Government of Maharashtra 1,768.242 1,424.841 80.58
Sir Ratan Tata Trust Grant 751.387 342.652 45.60
Beneficiaries 169.980 694.821 408.77
Banks 683.333 1,930.051 282.45
(e.g., the debt redemption fund combined with livelihood development interventions and loans). Steps are in placethrough the BCI-CC network to expand the number of growers and ginners in Maharashtra (already BCI’s largestnetwork in the world). The SRTT is in the process of a national scale up of a commercial poultry programme linkinglocal producers to commercial buyback arrangements (developed during CAIM). Supporting small scale dairyproducers as per different CAIM models are being scaled by the GoM in collaboration with the National DairyDevelopment and AMUL (owned by Gujarat Milk Producers Union). There is also scope for scaling up home-baseddairy product value added activities observed in several PCR site visits. Similarly, MAVIM’s efforts to brand productsmade by CFCs (e.g., noodles, papad etc.) is being scaled up, and shows potential for further expansion across theCRMC network. The Agropole App which provides access to basic extension services, is being scaled up byCMRCs. Meanwhile, management of farm equipment banks (e.g., SPARCs) scales-up access to mechanization (e.g.,through PCs, JLGS, or agro service centre facilities).
Experiments in non-traditional crops such as baby corn, medicinal plants, lac cultivation, beekeeping and non-farmenterprises such as cattle feed making and postharvest value-added were introduced across the programme andseveral are being replicated (e.g., Madhavi Medifarm Pvt. Ltd. medicinal plants buyback partnership with CAIMproducers was replicated in nearby villages). Green shade nets were also reported to have been adopted by non-CAIM producers. SPARC units introduced by KJBF in Wardha district were also replicated in other project districts.
155.
At completion of the project, efficiency is rated moderately unsatisfactory (3).156.
At completion of the project, disbursement is rated moderately unsatisfactory (3). This rating is automaticallygenerated and takes into account project disbursement profile.
157.
As against the total allocation of INR 5,578.35 million, the project has utilised INR 6,857.50 million with achievementof 123 % of the design target. IFAD loan plus grant and bank credit accounted for 62% of the project expenditure(Table 9). While GoM contributed 21%, the beneficiaries share was 10% of the project cost. SRTT provided grantsupport of 5% and the contribution of private sector was 2%. The project submitted the remaining withdrawalapplications (WA) to IFAD for the period from completion date to the loan closing date (30 June 2019). In terms offinancial performance, the project has fully achieved its appraisal target for the project as a whole (123%). The bankcredit and beneficiaries’ sources overachieved (282% and 409% respectively). IFAD funding was 87% of the fundallocated in USD and 92% of SDR allocation. Funding from the GoM was utilised at 81%. Utilisation of the SRTTgrant and private sector contribution was about 45% of target.
158.
Table 6: Budget and Expenditure by Financier (INR million) 159.
27/40

Private Sector 271.613 116.499 42.89
Total 5,578.351 6,857.499 122.93
Financiers Appraisal TargetAchievement
(to Dec 2018)% of Achievement
Component Appraisal Target (INR)
Achievement ( up to Dec2018) % of Achievement
Institutional Capacity Building 523.921 2,372.830 452.90
Market Linkage & SustainableAgriculture- 4,723.276 4,051.919 85.79
Programme Management 331.154 432.750 130.68
Total 5,578.351 6,857.499 122.93
E.2. Quality of project management
Component wise, financial performance indicates institutional capacity building overachieved by four and seven timesdesign target, while the performance under market linkage and sustainable agriculture component underachievedtargets to 86% (See Table 10).
160.
Table 7 : Budget and Expenditure by component in INR161.
While it appears that there is under expenditure of the funds, the following table shows that due to exchange ratefluctuations the overall funds available were increased by approximately 39%. The overall disbursement rates of theIFAD loan and grant in USD, is provisionally estimated at 89% and 23% respectively.
162.
Figure 2: Exchange rate fluctuations163.
At completion of the project, quality of project management is rated as moderately satisfactory (4)164.
The project experienced several operational and administrative issues identified during supervision missions whichwere mostly resolved before the end of the programme, but not without impacts on financial and physicalperformance.
165.
There were frequent changes in Project Director with most having multiple charges (i.e., not full-time on CAIM). Highprogramme staff turnover, delays finalizing IA selection and contracts, and delayed fund flow/ disbursements had
166.
28/40

Name of Scheme ComponentExpenditure(million INR)
Rashtriya Krishi Vikas Yojana,Integrated Watershed ManagementProgramme, Jalyukt Shivar, Mahatma GandhiNational Rural Employment GuaranteeAct, Mahatma Fule Bhumi jalsandharn
Soil and Water conservation 7558
MSAMB Programme Pledge Loan Scheme 16.4
Rashtriy annsuraksha Abhiyan VIDP,Accelerated Pulse , Programme, NationalHorticulture Mission, Jowar Demonstration forTribal Farmers Agricultural , TechnologyManagement Agency, Reliance Foundation,Rashtriya Chemicals & Fertilizers Ltd,Mahabeej
Sustainable Agriculture 547
Animal Husbandry Department, FodderDevelopment Programme Livestock Development 38.1
Kamalnyan Jamnalal Bajaj Foundation Biogas Promotion 8.7
Dry land scheme, Rainfed Area DevelopmentProgramme Irrigation Department 111.1
District Industries Center, Pradhan MantriKaushal Vikas Yojana Training 4.4
Total 1481.5
Coherence with AWPB
substantial impact on implementation.
At the recommendation of the 2013 Joint Review Mission and the 2014 MTR, the programme filled several new postsin an effort to improve operations. To speed office work and to help the PMU Administration Officer, six data entryoperators for the PMU and six others, one for each district, were appointed. The programme appointed an agronomistto the PMU and three additional ABEs, one each in the three larger district offices. A fodder development/ animalhealth livestock specialist to help with the Livestock development subcomponent 2.2 and a SWC consultant wereappointed to address technical issues from the field. Similarly, two bank linkage consultants were contracted to helpwith SME activities and to overcome bank linkage challenges (both retired bank officers). A new post of PU Managerand District Coordinator for BCI were also created. Based on the recommendation of the Supervision Mission of2015, paravets were appointed at the cluster level and Pashusakhi at the village level. At the CMRC level, sixCommunity Resource Person were appointed per CMRC.
167.
Post-activity payment for IA programme and service costs created substantial barriers to project progress. Theservice cost disbursement guidelines, revised and implemented in October 2013, allowed for payment of advanceson programmatic and service cost payments on quarterly basis. This was to ensure smooth implementation of projectactivities by IAs but resulted in unsettled advances. The Implementation Support Mission 2015 developed a newservice cost method for IAs which had IAs submit expense claims/ compliances. Outstanding claims were to besettled by the first quarter of the year. Previously IAs would pay Village Volunteers (VVs) and Agriculture FieldOfficers (AFOs) services through management service costs. This created financial pressures on IAs and resulted inirregular VVs & AFOs salary payments. Based on the recommendation of the JRM of 2013, from September 2013forward the project provides VVs and AFOs salaries directly as part of programmatic costs.
168.
Convergence169.
The project accessed substantial funding for its beneficiaries from other government and development agenciesprogrammes/ schemes. Similarly, other schemes used CAIM as a platform for spreading information and serving newbeneficiaries. Approximately 100,343 households benefitted from convergence, of which 36% were women. Totalfunds received by CAIM from convergence was INR 1481.5 million. The Animal Husbandry Department of the GoMfunded poultry units, goats, bucks, cows, and buffalos, supported vaccination camps, provided medicines and dairyequipment, and helped in the construction of shade for livestock. The Agriculture Department provided seeds,fertilizer, water sprinklers, pipes, spray pump and agricultural equipment to CAIM beneficiaries through variousschemes. Nearly 50% of soil and water conservation works were carried out through convergence. The mainschemes the project converged with are listed below:
170.
Table 8 - Details of GoM schemes converged under the CAIN and its financial expenditure171.
29/40

YearAWPB AWPB Release by
GOMAmountUtilised
% AWPBreceived fromGovt
% of fund utilizedagainst AWPB(Original) (revised)
2009-10 28.23 28.23 10.91 2.8 39 11
2010-11 97 97 23.59 21.76 24 25
2011-12 135.27 52.78 95.26 31.23 180 65
2012-13 279.63 278.13 167.28 124.3 60 49
2013-14 253.24 423.44 250.21 257.94 59 67
2014-15 507.7 517.35 382.3 184.84 74 39
2015-16 554.06 560.3 171.3 302.73 31 59
2016-17 654.16 660.41 277.7 372.17 42 62
2017-18 1,673.08 619.47 158 185.8 26 33
2018-19 1,060.27 1,060.27 1,035.00 1,078.72 98 112
Total 5,242.64 4,297.39 2,571.55 2,562.29 60 66
i) Procurement
ii) M&E and KM
The average achievement of the project over the implementation period was 66%, the highest being 112% in 2018-19, and the lowest 11% in 2009-10 being the first year of implementation. The project achieved only 60% of budgetreleased cumulatively. Annual achievement against AWPB is found in Table 9 showing IFAD and Governmentfunding financial achievements against the budget released by the GOM but does not include beneficiariescontribution, bank financing, Ratan Tata Trust grant, & private sector.
172.
Table 9 - Yearly AWPB, Fund received and Utilised ( INR million)173.
The table below illustrates well the problems in the release of funds by the State Government. Over a 9 yearimplemetation period, funds were released against 70% or more of the approved budget in 3 years only. Despite this,the timing of the release of funds was not synchronized with the seasonality of project activities. Although theirrgularity of the release of funds did not affect the achievement of the project outputs, it certainly impacted on thequality of implementation and achievement of outcomes, namely the increase in households incomes and theireconomic mobility. As per the above table, 40% of project expenditure was incurred in the last year reflecting twoissues, backlog of payments; as well as capacity of the PMU and DPMTs to deliver, once implementationarrangements were streamlined with the line department taking the lead for the implementation of SWC, andexperienced agencies like SRTT for the implementation of enterprise development activities under component 2.4.
174.
At completion of the project, Procurement moderately unsatisfactory (3).175.
As per the Financing Agreement, the project has to undertake procurement in compliance with IFAD’s ProcurementGuidelines. Project procurement were delayed for many activities, particularly IA engagement, which took ninesubmissions. Goods and works procurement were considerably delayed due to non-availability of timely release offunds. Contract management was ineffective as procurement was undertaken by the Finance Unit and componentmanagers with moderate procurement skills and experience. The project did not develop a procurement manual andstandard documents were not always adopted. Inefficiencies in procurement and contract management wereidentified by IFAD in successive supervision/JRM missions, but no effective follow up was taken by the project tomitigate risks and problems. Procurement Specialists were not always included in supervision missions and financialmanagement specialists had to review procurement performance. Towards the end of the project, non-compliancewith internal controls and IFAD Procurement Guidelines led to ineligible expenditures. Given the complex IAprocurement and inefficient contract management, the project should have engaged a procurement professional tomanage procurement. The key lessons learned include: i) risk assessment and effective follow-up for resolving issuesshould be institutionalised from the start; ii) a procurement manual with processes and standard templates must bedeveloped; iii) unresolved procurement challenges to be taken to the government level; and, iv) programmeprocurement functions should be handled by dedicated staff with requisite skills and experience.
176.
At completion of the project Monitoring and evaluation and knowledge management is rated moderately satisfactory(4).
177.
The performance of the CAIM monitoring and evaluation system was uneven through the course of the178.
30/40

E.3. Quality of financial management
programme. It was not until the last two years of the programme that start-up challenges were fully overcome. TheM&E was initially hampered by use of an excel-based M&E system developed in house. It was to be replaced by aweb-based system to be developed by PWC which was contracted in 2012. A system was proposed by PWC in2013, but was deemed by the 2014 Supervision Mission overly complicated and needed to be simplified. Over thecourse of the next year, PWC did not attend to the contract and it was cancelled in 2016. By this time, the M&E teamhad further developed its Excel system which by then provided sufficient information for both performancemanagement and evaluation needs. Notably, the 2012 Supervision Mission expressed the need to measure theeffectiveness of training, which, given the relatively poor benefits to training reported by beneficiaries in the endlinesurvey, was an important oversight.[33] The programme was also unable to integrate information from SRTTprogramme activities, although not all data was made available on a request basis. Staff capacity and turnover issuesplagued M&E throughout the programme, and successive supervision missions made note of weaknesses.[34]
The M&E team contracted the programme baseline study without much delay and commissioned annual outcomestudies, which are of reasonable quality and provide useful information at the outcome level. The PCR mission notes,however, that AOS questions change over time, and that valuable trend line data was lost. Ultimately, only fourindicators were measured across all seven annual outcome surveys. Likewise, the baseline and endline studies, bothwell done, did not have a substantial number of overlapping questions limiting the programme’s ability to assessimpact over time.[35]
179.
Knowledge management: CAIM developed a comprehensive Knowledge Management Strategy in 2011 which wasunevenly executed particularly in the first years of the project. Workshops, leaflets, videos, and newsletters weremade available at 1,256 Village Information Centres (e.g., agricultural magazines such as Godwa, Baliraja,Krushokunnoti, LEISA related information such as Yuva, Agrovan, Agrotech, Panjabrao Deshmukh Krushi Viddyapithdiary etc.). A Google Group for information sharing was started, as were other social media efforts. Success storiesfor each district were prepared and disseminated among the stakeholders. Several thematic studies were completedincluding one on livestock development in 47 villages and a survey on organic vegetables demand was completed.Other topics included Okra seed production, From cotton to cloth, Milk collection centre, Jute, Agricultural prosperity,Pulses mill, The rural mall, Aquaculture (fish farming), and Agricultural prosperity. The project website wasdeveloped, and numerous brochures/ communication documents were produced. The project participated in districtand regional exhibitions. An English language project level documentary was approved and a district leveldocumentary in Marathi on activities in Buldhana was completed. The project initiated an awareness campaign in2013-14 to encourage joint husband/ wife home and farmlands registry.
180.
At completion of the project Quality of financial management was rated moderately unsatisfactory (3)181.
CAIM accounts were maintained manually during first three years of the project. Tally accounting software was usedto maintain accounts parallel to the manual system in FY 2012-13 and fully from FY 2013-14. Use of Tally softwareenabled uniform system of recording all transactions by components and categories and also simplified preparation ofconsolidated Project Financial Statements. The tracking of expenditure vis-a-vis the AWPB is done in an excel sheet; although Tally software has a feature of comparison of actual expenditure with the The project follows double entryaccounting system on ‘cash basis. The data back-up is sent by all the district offices to the PMU where the accountsare consolidated by using the synchronization feature of the software. The bank accounts are being operated by thejoint authorized signatories. The government deputed finance staff were replaced in 2011 by the fulltime finance staffhaving required qualification and hired following competitive selection processes. The government has deputedFinance Officer in 2018 after expiry of contract of the project Finance Officer. Training was conducted by IFAD for allthe finance staff in 2011 to make the concerned officers conversant with the record keeping, accounting proceduresand preparation of financial statements.
182.
There was adequate internal control system including authorizations for payments being made through all projectdistricts; and despite this, serious internal control weaknesses have been reported in the management letters issuedby the auditors. As a result, ineligible expenditures were observed in the audit of the FY 2016-17 & 2017-18. Theauditors certified a total amount of INR 38,743,157 as ineligible expenditures for IFAD financing in FY 2016-17 &2017-18 due to non-adherence to procurement guidelines. This situation reflects several weaknesses that wereidentified by the supervision missions and the audits: complex system for settlement of the payments of IAs andvendors; inadequate implementation of internal control functions in the PMU; poor record keeping; and high risk inprocurement due to non-adherence to IFAD procurement guidelines. The project has recovered - from theimplementing agencies - ineligible expenses to the tune of INR 32,379,873 and incurred through IAs, including anadvance of INR 1,630,725 accounted in FY 2018-19. The IAs have lodged claims of the deducted amounts but theproject has not yet accepted these claims. The audit report for FY 2018-19 is expected to shed more light on thesituation of ineligible expenditures and their recovery. While reviewing the expenditures incurred in FY 2018-19 aswell as expenses incurred during the closing period of January to June 2019, the PCR review mission notedadditional ineligible expenditures due to the following : (i) expenses incurred for investment activities that were notcompleted on 31 December 2018 and were still on-going after the completion date; (ii) payment of remuneration foradditional charge to government deputed staff, (iii) lack of supporting documentation ; (iv) non application of the IFAD
183.
31/40

E.4. Project internal rate of return
IndicatorsBase case
Cost Increases by Benefits down by15% 20% 15% 20%
NPV discounted (million INR) at 7.5% 3,568 2,720 2,437 2,184 1,723
BCR, ratio 1.63 1.42 1.36 1.39 1.3
IRR % 28% 21% 19% 20% 17%
procurement guidelines.
Funds were properly managed and made available to the districts for project implementation. A Fixed Assets Registerhas been maintained. Significant delays were noticed in the adjustment of advances causing unsettled advances withIAs up to project completion. Delays in paying salaries and other expenses were identified during projectimplementation, as a result of unpredictable release of funds by the State Government. There was also long delaysin processing IA claims due to the IAs delaying the submission of these claims to the DPMTs, and lack of timelyvalidation/ certification of physical targets and expenditures.
184.
While the project did not have a formal internal audit system, the PMU finance staff would visit district offices andreview books of accounts and relevant financial records on half yearly basis. The programme audit was conducted bya private audit firm empanelled with the Comptroller and Auditor General of India (C&AG) and selected based on theQCBS method in accordance with IFAD Guidelines. The audit performance during project implementation was ofvariable quality: the auditors did not sign the financial statements of FY 20101-11; the audit report of FY 2015-16does not specifically include the certification on eligibility of the expenditures for financing under the IFAD loanagreement; the Project Financial Statements FY 2015-16 were not fully in accordance with the IFAD Project AuditGuidelines.
185.
Approach and methodology for EFA: Cost-benefit analysis method was used for carrying out the economic andfinancial analysis of CAIM at Completion. All incremental investment costs were adjusted to April/May 2019 pricesapplying India’s GDP deflator. Incremental benefits were estimated based on actual physical outputs and likelychances of building up of incremental benefits during the reminder of the project life period and also consideringproduction foregone. Prices were collected for all inputs and output commodities from the district markets andadjusted them to farm-gate prices using standard conversion factor. Data collected and compiled by the CAIM projectoffice are used as basic sources of reference. Using all available data, both primary and secondary, type productionmodels for livelihoods interventions, in particular cattle and buffalo dairy, goat-rearing, backyard poultry, fishery,vegetable cultivation, non-farm activities, IGAs, and also social and community enterprises managed by the CMRCs,SHGs, JLG, PCs, were developed: from these production models to household models were built, subproject modelsthat are the aggregation of household models and finally the project models with the help of FARMOD.
186.
Assessment of financial benefits of household and area models: All area and household models are viableexcept the dairy and backyard poultry models due to higher feed costs. Milk collection centres, farm implementsbanks and CFCs, SPARC etc are not viable due to increased operating costs including wages etc. (Refer Table 10.2,Appendix-10). There is a need to watch closely the operations of these units so that the benefiting households do notlose much of their incomes. At present these beneficiaries may be feeling comfortable in their operations as thesignificant part of the investments was made by the project. But they would realise the financial burden oncereplacements considered necessary and they have to procure them.
187.
Project performance indicators: Cost-benefit analysis yielded an overall IRR of 28% of the project with an NPV at a7.5% discount rate of INR 3,568 million and a BCR of 1.63. A positive NPV under the Opportunity Cost of Capital of7.5%[36] indicated that the project investments have been robust and sound. The switching value analysis indicatedthat the project investments are worthy of sustaining either a 39% decline in overall benefits or 63% increases incosts. But the project investments are highly sensitive to simultaneous increases in costs and decline in benefits. Forexample, a 20% increases in costs and equal % of benefits decline will reduce the IRR to 10%. If benefits delayed bytwo years (in effect, if the project’s future production activities take longer to become fully developed or established)then the IRR declines to 19% with a NPV of INR 2,594 million. Details presented in Appendix-4 are summarised inTable 10 below.
188.
Table 10 : Project performance indicators & Sensitivity analysis189.
Above project performance indicators at ex-post EFA were compared with those of the indicators estimated atProject Design ex-ante in Table 11 below. Although the overall IRR are comparable, there is significant differencebetween the NPV of two scenarios and this could be generally explained due to (i) ambitious projections at the time ofthe design and (ii) assumptions did not materialize to the extent expected for reductions in costs of production and for
190.
32/40
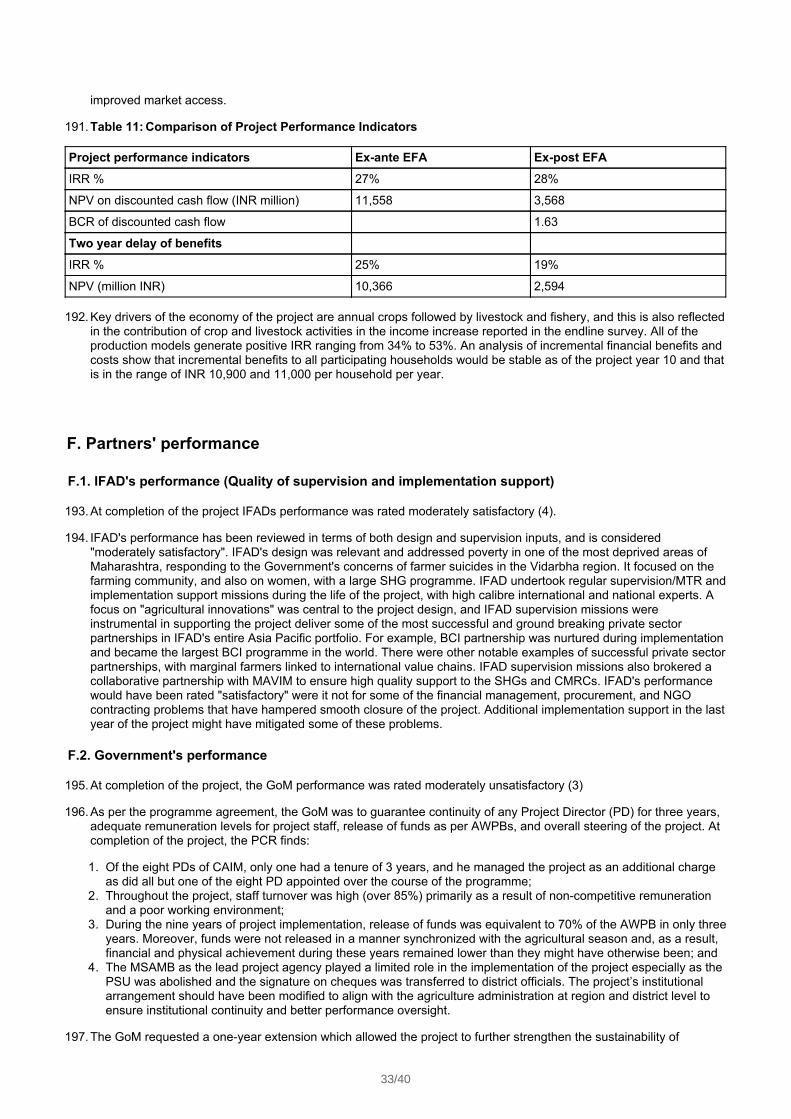
Project performance indicators Ex-ante EFA Ex-post EFA IRR % 27% 28%
NPV on discounted cash flow (INR million) 11,558 3,568
BCR of discounted cash flow 1.63
Two year delay of benefitsIRR % 25% 19%
NPV (million INR) 10,366 2,594
F. Partners' performance
F.1. IFAD's performance (Quality of supervision and implementation support)
F.2. Government's performance
1. Of the eight PDs of CAIM, only one had a tenure of 3 years, and he managed the project as an additional chargeas did all but one of the eight PD appointed over the course of the programme;
2. Throughout the project, staff turnover was high (over 85%) primarily as a result of non-competitive remunerationand a poor working environment;
3. During the nine years of project implementation, release of funds was equivalent to 70% of the AWPB in only threeyears. Moreover, funds were not released in a manner synchronized with the agricultural season and, as a result,financial and physical achievement during these years remained lower than they might have otherwise been; and
4. The MSAMB as the lead project agency played a limited role in the implementation of the project especially as thePSU was abolished and the signature on cheques was transferred to district officials. The project’s institutionalarrangement should have been modified to align with the agriculture administration at region and district level toensure institutional continuity and better performance oversight.
improved market access.
Table 11: Comparison of Project Performance Indicators191.
Key drivers of the economy of the project are annual crops followed by livestock and fishery, and this is also reflectedin the contribution of crop and livestock activities in the income increase reported in the endline survey. All of theproduction models generate positive IRR ranging from 34% to 53%. An analysis of incremental financial benefits andcosts show that incremental benefits to all participating households would be stable as of the project year 10 and thatis in the range of INR 10,900 and 11,000 per household per year.
192.
At completion of the project IFADs performance was rated moderately satisfactory (4).193.
IFAD's performance has been reviewed in terms of both design and supervision inputs, and is considered"moderately satisfactory". IFAD's design was relevant and addressed poverty in one of the most deprived areas ofMaharashtra, responding to the Government's concerns of farmer suicides in the Vidarbha region. It focused on thefarming community, and also on women, with a large SHG programme. IFAD undertook regular supervision/MTR andimplementation support missions during the life of the project, with high calibre international and national experts. Afocus on "agricultural innovations" was central to the project design, and IFAD supervision missions wereinstrumental in supporting the project deliver some of the most successful and ground breaking private sectorpartnerships in IFAD's entire Asia Pacific portfolio. For example, BCI partnership was nurtured during implementationand became the largest BCI programme in the world. There were other notable examples of successful private sectorpartnerships, with marginal farmers linked to international value chains. IFAD supervision missions also brokered acollaborative partnership with MAVIM to ensure high quality support to the SHGs and CMRCs. IFAD's performancewould have been rated "satisfactory" were it not for some of the financial management, procurement, and NGOcontracting problems that have hampered smooth closure of the project. Additional implementation support in the lastyear of the project might have mitigated some of these problems.
194.
At completion of the project, the GoM performance was rated moderately unsatisfactory (3)195.
As per the programme agreement, the GoM was to guarantee continuity of any Project Director (PD) for three years,adequate remuneration levels for project staff, release of funds as per AWPBs, and overall steering of the project. Atcompletion of the project, the PCR finds:
196.
The GoM requested a one-year extension which allowed the project to further strengthen the sustainability of197.
33/40

F.3. Other partners' performance (including co-financiers)
G. Assessment of sustainability
community and producer organizations as well facilitating project overlap with the GoM’s programme for climateresilient agriculture (POCRA funded by the World Bank). This went some way to ensuring the continuity and scalingup of CAIM's successful experiences. It is worth noting that CMRCs benefitted from this extension and 68% of themnow cover more than 75% of their costs and are considered financially sustainable. The additional year also allowedthe hand-over of the BCI from CAIM activities to Cotton Connect.
Sir Ratan Tata Trust: SRTT joined CAIM as financier and provider of high-quality technical assistance to the project.In 2015, SRTT began direct programme implementation and eventually covered 9 clusters of the CAIM project in 237villages and approximately 20,000 direct beneficiaries in Amravati, Akola and Yavatmal. SRTT operations evolved inparallel to those supported by IFAD, and in effect, CAIM and SRTT interventions became two sub-projects under theumbrella of CAIM. This negatively affected the implementation of 60 watershed development plans andestablishment of CDCs to render services to dairy farmers. Weaknesses in communication and reporting led to limitedexchange of SRTT good practices, in particular, support of seven successful PCs which may have provided models/insights to better supporting CAIM’s 52 PCs (of which only 14 are operational). SRTT also has effective convergencewith government schemes and the private sector, networks that could have been useful to the DPMTs.
198.
MAVIM provided support services to CMRCs and SHG’s. It provided training and capacity building, convergence linksto beneficiaries through SHGs and CMRC and focused on gender sensitization and social equity. MAVIM was activewith CAIM from 2012 to 2018, originally it was responsible for 35 clusters but was made responsible for CMRCs andSHG’s in all 63 CAIM clusters in 2016. The organization has an effective management and provides SHG and banklinkages services/ support, insurance and pension services and supports agricultural service centers. MAVIM alsomanages the Debt Redemption Fund, Drudgery Reduction activities, MLP activities, as well as supporting SMEs. Theorganization promotes the joint asset ownership programme, the ‘welcoming girl child’ street play, as well as healthand nutrition programmes. MAVIM innovated the SHG alert system and introduced the Sahayoginis and paravetservices. The organization supports CMRCs as they develop services and social enterprises and income generatingactivities. MAVIM has been instrumental in achieving output and outcome performance in Component One. (SeeSections D1 and D2).
199.
Better Cotton Initiative (BCI) is a not-for-profit organisation spearheading better global standards for cotton fromfarmers to the retailers. CAIM partnership with BCI helped the project overachieve the target set at design of 54,000Ha under more sustainable cotton production practices. This was made possible thanks to rigorous organization ofextension services and monitoring of adoption of six production principles of BCI covering use of pesticides, irrigationwater, soil health, natural habitats, quality of fibre and decent working conditions. CAIM started implementing BCI inthe 2014-15 season, obtaining its BCI licence in November 2014 and supporting 41,923 cotton growers. By projectcompletion in FY 2018-19, the outreach was 139,922 cotton growers cultivating 151,607 Ha thus making CAIM thelargest implementing partner of BCI in the world. This partnership was instrumental in improving the rate of projectachievement under sub-components 2.1 and 2.4.
200.
Implementing Agencies. The role of the Implementing Agencies was instrumental in the implementation of soil andwater conservation works, LEISA practices (excluding BCI) and facilitating market linkages. The performance of theIAs was mainly assessed based on achievement of financial targets in terms of project funds and convergence.Financial targets were not systematically linked to physical targets. At completion, outputs as per project resultframework were largely achieved for activities such as SWC, livestock development, enterprise development andvery partially achieved (contributing only 22%, in form of contract farming, to the total project target) for marketlinkages. This uneven performance and overall partial contribution to project results may be explained by fundingcrunch as payments were not timely (see financial management section above) disrupting implementation of the IAs'scope of work. Based on stakeholder feedback, given the variation in IAs expertise and performance, CAIM shouldhave invested more in building their capacity.
201.
At completion of the project, Sustainability is rated moderately satisfactory (4).202.
Political: A three-year drought and expected future climate events continue to pose substantial risk to the agriculturalsector and rural economic development in Maharashtra. The GoM and GoI recognize these risks, as well as the needto tackle chronic property and threats of food insecurity. Their commitment to addressing these challenges is notablystrong and demonstrated through 25 programmes CAIM availed through convergence. CAIM demonstrated theefficacy of an ‘end to end’ approach combined with LEISA production methods and SWC works. While the Marketlinkages and value chain subcomponent showed modest returns (save for the BCI), the GoM remains committed to
203.
34/40
developing rural economies and rural-based small on- and off-farm enterprise. Institutions like MAVIM and localgovernments, have seen first-hand the positive impacts of the approach taken by CAIM as well as the importance oflocal stakeholders' input into planning and implementation. (See institutional and policy sustainability for more details)
Social sustainability: Social cohesion created through the SHGs’ is notable particularly their successful promotionof equality and creating public spaces for women, the poor and vulnerable. SHGs will continue to impart theseoutcomes as they are largely self-sustaining institutions owned by women members serving the needs of women. Assuch, they provide leadership and personal growth opportunities for members working towards self-defined economicand social development goals. Together, SHGs and CMRCs provide a sustainable platform for personal, social,political, and financial growth. They also benefit communities through increasing the status of women, and providingleadership models for youth, communities, and men. They will accomplish these outcomes through increased workwith Gram Sabhas, where they will continue to encourage a range of issues (e.g., end violence against women,celebrating women, improved household electricity and sanitation, etc.). The Lakshmi Mukti Yojana programmesecuring jointly owned home and farmland for women will also continue to create greater social outcome.
204.
Similarly, CAIM sponsored trainings supporting household and personal beneficiary confidence improved inter- andintra-household relationships and resilience to adverse shocks will continue to grow, particularly in those householdsrealizing positive benefits of collective enterprise. Women, the poor, and other target beneficiaries will continue tobenefit from leadership positions in SHGs, JLGs, VDCs and other organizations. Working towards becoming PashuSakhis, Sahayoginis, or CMRC employee will, for example, build social and human capital through skills, knowledge,and management capacity development. This will grow self-confidence, support systems, and social standing for bothcommunities and individuals. CAIM support to various collective/ cooperative enterprises has increased socialnetworking ; and cohesiveness will also grow with enterprise and network development (e.g., BCI Learning Groupsand JLGs now have farmers undertaking activities together).
205.
Institutional sustainability: MAVIM will continue to provide technical, organizational and development support to theCMRCs as will CMRCs to SHGs and member enterprises. Continued institutional strength of MAVIM is key to CMRCand SHG sustainability. BCI activities have been handed over to CC which works through its NGO partners, PUs andField Facilitators (FFs). Cotton producer groups formed by CAIM early in the programme are also likely to beabsorbed by CC. BCI-CC formed learning groups will continue to function as CC expands in the region. However, asCC does not currently plan to provide farmers post-harvest support, there may be a need for it to go beyond theproduction cycle and certifying ginners, to formally collectivise and support producers. This would enable producers tomove up the value chain and to benefit from economies of scale, secure better terms of trade, and improve incomes.
206.
The mission endorses recommendations made at the completion workshop to find organizational homes for othernon SHG/ BCI organizations and assets currently without a formal sponsoring agency. These include the VIC, VDC,and SPARC units, and SWC works. The activities that align with the mandate of the CMRCs in terms of memberservice provision can be handed over to them for management (e.g., VICs and SPARCs). The PCs will need to belinked to on-going relevant government schemes. SWC works can be handed over to the Gram Panchayat and/ orthe Agriculture Department and registered accordingly to facilitate maintenance.
207.
Environmental sustainability: Promotion of conservation agricultural practices/ BCI and its adoption by largenumbers of farmers reduces the environmental footprint of cotton production, improves local biodiversity, as well assoil health. This is further enhanced by the growing availability of animal wastes which is increasingly beingprocessed and used in agricultural operations while use of synthetic and chemical products is declining. Though thenumber of ruminants has increased, they are well within the carrying capacity of the region. A large number of smalland in-principle environmentally neutral SWC works have been undertaken together with tree plantation. Thesewould generally have a beneficial effect on the environment. Of concern, however, is the way and quality of some ofthe “nalla training” works have been undertaken which can have potentially adverse hydrological and biodiversityimpacts.
208.
Technical sustainability: There is a clear economic incentive for farmers to continue with sustainable agriculturalpractices given the rising costs of conventional agriculture, growing demand for organic/ low chemical residue foods,access to low cost organic bio-fertilisers materials, and the relatively straightforward nature of LEISA. Whereintensive farmer training and provision of inputs, tools, and machinery for cultivation and post-harvest processingwere provided, together with market exposure and linkages, farmers were prepared for sustainable production andthe PCR mission could identify growing adoption of practices. In addition, farmers would require access to requiredinputs, knowledge, and services (organic pest management products, soil testing services, inoculum for seedtreatment, inputs for compost etc.).
209.
Farmers have an interest in maintaining SWC works to ensure water security, reduced soil erosion, and soil moistureretention. Common SWC assets like CNBs and ground water recharge shafts will require GP and governmentmaintenance. Regarding sustainability of SWC on one hand, local institutions were not sufficiently supported toprovide collective management of infrastructures and there was not sufficient attention to issues of maintenance,water sharing and inclusion of poorer households. On the other hand, drought management is a strong governmentpriority with specific focus on such water harvesting, conservation and recharge mechanisms as implemented inCAIM through canal deepening. Finally, livestock production units established on a joint basis (e.g., JLGs) and on a
210.
35/40
H. Lessons learned and knowledge generated
cluster basis for improved market access are likely to be sustainable given strong incentives for group cohesion,facilitating group training, buy-back arrangements, and due to demonstrable financial returns.
Economic and financial sustainability: The majority of SHGs and CMRCs are either at or near sustainable levels ofoperation. SHGs provide CMRCs membership and fee income (for facilitating external FFI loans). CMRCs provideSHGs a range of services from accounting and organizational capacity development, encouraging member disciplinerequired for self-sufficiency. MAVIM will develop new services for CMRCs to enhance revenues, including (potentially)the creation of a labour exchange service, an enterprise guarantee fund, and SME business development services.They are also actively seeking new development programme partnerships (e.g., POCRA, SMART etc.). Similarly,CFCs benefited as part of the SHG-CMRC network, as did women starting home enterprises (on and off farm) as aresult of CAIM interventions (e.g., ultra-poor subsidies, goat or cow/ buffalo subsidies) enhancing their sustainabilitypotential. Some PCs and most JLGs are operating at sustainable levels but still face challenges, including pooraccess to capital, inexperienced management and poor governance, and the sourcing ongoing support. CAIM hasalready shared a list of registered PCs with SFAC for further assistance.
211.
The CAIM endline survey showed that 75% of CAIM beneficiaries reported BCI and organic farming were profitable.Other studies confirm this, as they do the profitability of the various packages of LEISA approaches.[37] Two thematicassessment of LEISA packages found a 13% to 30% increase in yield with up to 50% input cost reductions.[38] BBFmethods show a 10% to 20% increase in yield and a 10% to 30% decrease in production costs. The PCR missionfound that use of organic pesticide management methods (notably pheromone traps) led to one or two fewer spraysper production cycle for a INR 900 to 2,000 savings per acre. Pheromone traps costing about INR 300 per acre peryear help farmers measure and typically reduce chemicals sprays.[39] Soil testing was also found profitable enablingfarmers to better manage the quantity and quantity of inorganic fertilizer required to meet specific soil needs. SomeCMRCs and PCs are providing soil services to members at fees ranging from INR 150 to INR 225 (normally costingINR 250). Producers in the Jalgaon Cluster reported soil testing decreased use of fertilizer by INR 1,000 per acre.Where such services exist, adoption and dissemination appear strong. Clearly, the profitability of any given LEISApractice varies according to farmer’s context. Most practices, however, require easy to access and inexpensivemanure and water inputs. Some technologies require specific organic inputs originally provided by the project but willnow need to be purchased by producers. The PCR mission notes most villages have or know where to purchasesuch inputs.
212.
Project exit strategy: The CAIM programme exit strategy was outlined at design and at the MTR was considered tobe moderately satisfactory. As noted at design the goal was to make CMRC institutions community funded andmanaged. As noted CMRCs most CMRCs are now funded by the members and likely to increase with additionalincome from services it provides to them. MAVIM will continue to support the SHGs and strengthen their relationshipswith ICICI and other formal financial institutions. It will develop a variety of commercial and government/ developmentprogramme funding sources for CMRCs (e.g., POCRA/ SMART). A federation/support organization for SMEs atdistrict level is being considered. Financing such an apex will require a mix of public and private funds (like CMRCs)to ensure a balanced focus on social and private development interests. Trained and experienced VLWs,Sahyogonis, Pashusakhis, and paravets could play central roles in such an apex as village economic/socialdevelopment outreach agents particularly for PCs and JLGs.
213.
LEISA could be made available through the local extension system and can build on the very successful modeldeveloped by BCI. BCI farmers will be supported by CC which will take over from CAIM the extension of advisoryservices to the cotton growers and promotion of the BCI 6 principles for sustainable cottn production. The operationand maintenance of completed SWC works will require local and district coordination and funding. The SWCstructure created under the project did not build on existing village level institutions and therefore was outside ofnormal practice. There is however an opportunity that they may be dovetailed with the Jalyukt Shivar Yojana (JSY)or reinvented to fit within the traditional structures, e.g. as an extension of water management. There is a clear rolefor the line departments for information sharing and convergence. Organizations such as farmer organizations/enterprises can avail funding from SFAC, SMART, POCRA and other government programmes, but this will requirefacilitation from the Division Commissioner and the district agriculture office.
214.
Project Strengths215.
Gender SHGs generate notable trust in business and social relations, leading to good long-term business practice,improved access to credit, and enterprise growth contributing to both incomes and farm investment (e.g., workingcapital and asset investment). As noted under the internal logic section, component 1 provided a solid base forwomen to actively participate and succeed in a wide range of activities. Given the performance of the larger
216.
36/40

Use of implementation support missions to ensure that key/critical issues identified during supervision missions areresolved quickly and efficiently be they fiduciary, contracting or technical in nature. This would have avoided thefinancial issues facing CAIM during their closing month;Due diligence on IAs needs to take place to ensure that they can actually deliver or at least using results basedcontracting to ensure payment for delivery. Prior to payment, the PMU should also seek feedback fromparticipants as to the quality of service delivered. CAIM found that the quality of service delivery varied significantlyduring implementation. Some contracts were cancelled, however many were recruited without sufficient evidencethat they had the required capacity to deliver (in order to speed up implementation).IAs need clear handover and exit strategies for the POs they have been supporting to ensure self-sufficiency afterclosure and where appropriate should "federate" such groups to increase efficiency and effectiveness of theirfuture as well as for productivity. This requires ensuring that local level institutions are well empowered to functionas legal entities knowing their rights and responsibilities. This should happen prior to engaging in any marketcontracts.Partnership Agreements whether with IAs or the Private Sector should follow clear process before engaging,including, due diligence on a clear set of principles of engagement (e.g. does not pose a reputation risk, theirmandate is compatible, they are respectful of their partners, and that the roles and responsibilities) along witheach parties expectations are clearly stated, etc. To avoid conflict over delivery and payment, legal advice shouldbe sought to ensure that such agreements spell out conflict resolution processes;As part of partnership agreements the example set by BCI is very informative for the scaling up in future as well asfor LEISA in a more systematic manner through a combination of advisory services, farmer organization / training,continuous analysis and recording of agronomic practices and related costs, third party assessment, and networks
enterprises run by men (who generally did not benefit from component 1 processes), these were lesssuccessful/sustainable than those of women. In future projects it should be considered to provide opportunities forwomen's groups with good business plans to encourage them to take on larger enterprises.
Moreover, the revenue model of the CMRCs demonstrates that poor rural women need effective services rather thanfreebies. The CMRCs started collecting livelihood service charges, implemented fee based services of para vets anddeveloped a partnership modality with SHGs for implementing micro-enterprises. CAIM only provided 30% of theinitial investment as grant which is the lowest amongst all government schemes. The members of these SHGsoperating in Vidarbha regiona which is considered as epicentre of farmer distress, have been accessing bank loansand repaying promptly with no clamour for loan write off or freebies.
217.
Design Considerations218.
Sequencing in any project is essential and even more so for market oriented projects. In CAIM POs/PCs and JLGsappear not to have received the strengthening required for sustainability. Key aspects include basic financial literacy,roles and responsibilities, business planning and so forth. Often issues of production/productivity are identified asessential to attract potential buyers by delivering large volumes at scale. In order not to over produce and have nomarket, it is essential that markets are sourced and contracts are entered into prior to any kind of scaling ofproduction to ensure agreement on quality, standards and volumes that are to be expected over a period of time. Assuch this may vary the type of activities to be implemented based around the localized production areas andrespective needs. The development of POs/PCs (to a formal level) should be done either prior to or at leastconcurrently with sourcing markets to increase their engagement during the contracting / negotiations preferably as afederated body to enhance their bargaining position during the process.
219.
Enterprise development should also be identified during design from micro in scale (e.g. repair services forirrigation, input supply, etc.) to larger type value adding (cleaning / value adding) that would support employmentopportunities. This would also provide some guidance for POs / CMRCs / federated groups to monitor progress forwhen such development would be financially viable thus providing greater benefits to the target groups. The missionfound that the profitability of larger producer organization/ enterprise is often hampered by low levels of capital andthat larger amounts of seed capital for asset purchase may have better preserved working capital volumes requiredfor start-up operations. Collectivising producer groups can help transfer technologies and learnings, provides socialand emotional support, and leverage better market access, leading to enhanced value capture and financial returns.
220.
CAIM was designed using a new approach working on both the ‘vertical’ end-to-end and the horizontal thematic axes(e.g., SWC, enterprise development, LEISA etc.). With the benefit of hindsight a more defined description forstakeholders and a capacity needs assessment to deliver such an approach would have been beneficial and couldhave been covered at start-up. While the Agriculture Technology Management Agency (ATMA) was designed tomanage these projects, aligning the project management with agriculture administration at divisional and districtlevels with detailed modalities in design could have assisted implementation – especially given the high staffturnover. A functioning cross-divisional advisory group involving the PMU could have further strengthenedintervention activities and sharing knowledge gained to address staff turnover.
221.
Implementation Considerations222.
As a result of the implementation of the project a number of lessons emerged that are relevant for future guidance.223.
37/40

of certified buyers. Given on farm technical support, access to knowledge, productivity enhancing technology andtraining, together with remunerative market access, encourages producers to adopt sustainable agricultural /LEISA practice.Complexity is not an issue in itself. CAIM despite challenges has shown that with a wide range of divergentpartnerships across a wide range of activities/tasks, it has been successful in implementation even with large staffturnover and significant delays in the flow of funds – focussing on convergence may well have assisted in thisarea.Soil and Water Conservation measures were undertaken in a piecemeal manner reducing potential gains andshould have been based on a watershed approach including WHS to ensure that the upper catchments werestabilised to reduce soil erosion and run-off velocity. Likewise linking to existing local institutions for O&M isessential for sustainability. Furthermore itConvergence between development programmes and / or private sector initiatives requires ongoing and proactivepartnership management to ensure stakeholders and institutional partners have and understand clear delineationof roles and responsibilities, leading to the timely allocation of resources. Continuous performance monitoring andinformation sharing is equally required.
I. Conclusions and recommendations
Ensure that GoM obligations for loan closing are completed by the closing date of 30 June 2019.Encourage and/ or provide CC support to help move farmers up the value chain through their formalcollectivisation, enabling them to benefit from economies of scale, secure better terms of trade and improveincomes;The GSDA reviews “nullah training” works undertaken by CAIM from a technical, hydrological and environmentalperspective, and monitor them for 3-5 years to assess costs and benefits, using insights to frame guidelines forSWC activities;Inventory SWC structures to facilitate maintenance after a formal handing over structures to GP and linedepartments at the district level;MAVIM/ CMRC (or like organization) expand agro services including LEISA practices and supporting farmer groupactivities including monitoring and evaluating their work for knowledge development and technology diffusion (e.g.,having BCI farmer field like books on different LEISA methods to better understand cost benefits, innovationadoption, and joint decision making at household);Explore the creation of a second-tier rural enterprise development apex for PG, JLGs and FPOs to provideongoing enterprise development support. Facilitate access to capital for PG, JLGs, and FPCs through asustainable investment or investment leveraging mechanism (possibly including value chain finance);Compile select success stories on the innovations tested in CAIM for replication by GoM and other developmentpartners.
Footnotes
1. The PCR team hired by CAIM is composed of Mr Puhazhendi, Team Leader and Rural Finance Specialist; MsUrmila Bendre, Empowerment and Gender specialist; Mr Sanjay Gupta, Agriculture Marketing Specialist; and MrNaveen Anand, Livelihoods and Enterprise Development Specialist.
2. Mission composition: Mr Marc De Sousa Shields, Team Leader, Ms Marie Aude Even, Agronomy ;Mr Crispino
Overall the CAIM programme has achieved most of its outcomes. Impacts are notable for gender equity and positivefor poverty alleviation, although below the project ambitious target of ensuring economic mobility for 75% of thehouseholds. The programme would have benefited from a stronger focus on the integration of women , the poor andultra-poor in production and marketing activities particularly as they relate to larger enterprise development. Althoughproject design was, and remains relevant, the effectiveness of CAIM was constrained by inconsistent implementationof subcomponent 2.4 Market linkages and value chains, and a host of programme management challenges,particularly issues surrounding the selection and remuneration process for IAs. It is equally clear that the BCIpartnership and LEISA interventions demonstrate notable potential for more and better, economically sustainable,environmentally sound production leading to higher profits and better incomes to adopting households. The conceptof convergence was sound and demonstrated the need for more proactive cross-department communications andcoordination between programme stakeholders. That most targeted outputs and outcomes were met despite theinnovative nature of programme design and implementation challenges is testament not just to the applicability ofdesign, efforts of the PMU, DPMTs and others in programme management, but of the farmers, men and women,taking advantage of CAIM resources and methods to better their own futures.
224.
Recommendations: The mission offers the following recommendations:225.
38/40

Lobo, Natural Resources Management; Ms Monica Paganini, Economist; Mr Alam, Economist; Mr.Sankarasubramanium Sriram, Procurement; Mr Pradeep Shrestha, Financial Management; Ms Louise McDonald,Country Director, Bhutan, Project management and partners' performance; and Ms Rasha Omar, CountryProgramme Manager, India
3. www.ncaer.org4. These would include the Department of Agriculture and Horticulture, Department of Animal Husbandry, Dairy
Development and Fisheries, the Department of Soil Conservation and EGS, and the Department of Cooperation,Marketing and Textiles.
5. MAVIM implemented the IFAD-supported Tejaswini-Rural Women Development programme (2017-2017)including the Vidharbha.
6. Figures relate to 1998-99. Maharashtra Human Development Report 2002.7. See WP 1, The Project Area for more details.8. Famers under distress were defined as households where famer suicides have occurred. No specific targets were
set in the Appraisal Report for this group. Design noted while economic distress has a physical base and can beidentified with objective analysis of information lending itself for predictions, psychological distress does not haveeasily verifiable information base that could predict likely distress. Convergence of Agricultural Interventions inMaharashtra’s Distressed District Programme, Design Completion Report, February 2010.
9. There is an minor overlap of SHG members, JLG members, and farm households programme M&E could notresolve.
10. VLCs were formed by SHGs to promote social and political empowerment of the poor.11. BCI withdrew from the project in June 2018, but the initiative is being continued by Cotton Connect in association
with IDH.12. The mission is refining the calculation of participating HH in this activity based on the farmers' direct sale to
certified ginners and engaging in primary value addition of baling and storing the cotton.13. SPARC units are agri tool/ equipment banks which are rented to member and non-members and can included
spiral separators, diesel engines, BBF planters, seed drill, sprinkler sets, spray pumps etc.14. IA cluster completion report for Jalgaon Ja cluster, 2012-2017.15. Several case studies found in IA completion report for Seloo Cluster, 2012-1616. Also mentioned in IA cluster completion report for Risod in Washim17. The PDKV reviewed biodynamic organic practices, organic practices and conventional ones in 2015-16 for 116
farmers in 6 districts.18. See CAIM Annual Outcome Surveys 2013-14 to 2017-1819. What constituted a distant market was not defined in program design or at midterm but is taken to mean a major
market center more than 100 km from producer village.20. Many producer enterprises created wage employment to farmers, and in this way, indirectly benefited from price
increases.21. Table IV. 10: Training on Social Rights, Empowerment and Health (%): A Study of Impact Evaluation of
Convergence of Agricultural Interventions in Maharashtra (CAIM), May 2019, Preliminary Draft Report, May 2019,National Council of Applied Economic Research.
22. Table IV. 36: How has the overall availability of food changed during the project period?: A Study of ImpactEvaluation of Convergence of Agricultural Interventions in Maharashtra (CAIM), May 2019, Preliminary DraftReport, May 2019, National Council of Applied Economic Research.
23. Table IV. 24: Major Sources (%) of the Informal Loan: CAIM & Control.24. IFAD gender indicators emphasize: i) expanding women’s access to and control over fundamental assets –
capital, land, knowledge and technologies; ii) strengthening women's agency and thus their decision-making rolein community affairs and representation in local institutions; and ii) improving women's well-being and easewomen’s workload.
25. Awareness campaigns on women’s rights both at government and grass root level to address patriarchal mindsetson joint ownership issues included street plays on health and nutrition and ;welcoming the girl child’ were held in249 villages benefited Some 2,512 SHG’s participated in this activity, with a total of 23,215 women participants.The Welcoming Girl Child programme was attended by 19,869 women from 2,370 SHGs in 373 villages.
26. Table IV. 29: Impact of income generating work of women (%).27. Table IV. 34: Overall Impact on Women Empowerment: Chane in Status of Ownership of Assets by Women since
201228. Impact Assessment, CAIM, May 2019; caution is needed when interpretating comparison between CAIM and
control as samples are not strictly comparable; control appeared poorer and more women responded in CAIMvillages (50% respondant were women against 38% in control).
29. Impact Assessment, CAIM, May 201930. Impact Assessment, CAIM, May 201931. PCR team visit, Yavatmal, April 201932. Sorting grain for home consumption, for example, was a very time consuming task for women that could take 2-3
days of intensive manual work per quintal or the equivalent of 2 to 3 weeks of work. Use of spiral separatorsdramatically reduced this time and allowed for other remunerative activities.
33. CAIM supervision Mission 2015.34. See CAIM Supervision Mission, 2017.35. The CAIM endline study relies on respondent recall.
39/40

36. Discount rate is based on India s long-term bond rate.37. A study of 8000 BCI farmers and 1,600 comparison farmers in CAIM districts shows that with higher yield and
prices for produce and lower production costs, their profit was 17% to 51% compared to rain-fed farmers andirrigated farmers respectively (SM, 2017).
38. Cluster Completion Report Jalgaon and the PDKV study of biodynamic agricultural technology, 2015-16.39. Producers must buy 5 traps per acre (at INR 135). Traps can last three years (INR 260 per year, per acre) and
require only INR 30 for lur to be replaced.
40/40

India
Convergence of Agricultural Interventions in Maharashtra's Distressed DistrictsProgramme
Project Completion Report
Appendix 1: Project logical framework
Document Date: 30/06/2019
Project No. 1100001470
Loan ID 1000003372
Asia and the Pacific Division Programme Management Department
This document will be publicly disclosed unless there is written dissent on its disclosure by the Borrower at the time of this document submissionto IFAD or no later than the project closing date.


Convergence of Agricultural Interventions in Maharashtra's Distressed Districts Programme
Logical Framework
Results hierarchy Indicators Means of verification Assumptions
Name Baseline Mid-Term
EndTarget
AnnualResult(2018)
CumulativeResult(2018)
CumulativeResult %
(2018)
Source Frequency Responsibility
Outreach 1.b Estimated corresponding total number of households members
Household members 1 430 000 155 541 1 678 876 117.4
1.a Corresponding number of households reached RIMS Annual
Non-women-headedhouseholds
Women-headedhouseholds
Households 286 800 16 046 348 612 121.6
1 Persons receiving services promoted or supported by the project RIMS Annual
Males 135 989
Females 159 640
Young
Not Young
Indigenous people
Non-Indigenous people
Total number of personsreceiving services
295 629
1/18

Project Goal Contribute to thedevelopment of resilient,sustainable and diversifiedhousehold on-farm and off-farm livelihoods, enablingrural households to faceclimatic and market riskswithout falling back intopoverty and distress
At least 75% of households improve household asset ownership index RIMS Impactsurvey
Political stability;Governmentcontinues povertyreductionprogramme
Households 75 74 98.7
Reduction in the prevalence of child malnutrition RIMS Impactsurvey
child 75
At least 75% of households improve food security and income RIMS Impactsurvey
Households 75 41 54.7
Development Objective Incomes of 286,800households improved,LEISA farming renderedon 403,200ha, some 9,000women SHGs empoweredand about 158,400distressed householdscounselled on social andfinancial matters in sixdistricts of Vidharbha,Maharashtra.
Changes in wealth ranking of at least 75% of target groups Impact Surveyat baselineandcompletion
Government policieson ruraldevelopment,agriculturalmarketing, womenempowerment etc.continue
Households 75 50 66.7
At least 75% HHs report increased incomes Impact Surveyat baselineandcompletion
Households 75 74 98.7
40 % increase in average HH incomes Impact Surveyat baselineandcompletion
Households 40 20 50
At least 90% SHG members cease to use exploitive credit arrangements Impact Surveyat baselineandcompletion
Households 90 91 101.1
Results hierarchy Indicators Means of verification Assumptions
Name Baseline Mid-Term
EndTarget
AnnualResult(2018)
CumulativeResult(2018)
CumulativeResult %
(2018)
Source Frequency Responsibility
2/18

Outcome About 90000 poor andmarginalised householdsmobilised into sociallyinclusive affinity groupsand empowered toeffectively articulate theirinterest, and the resilienceof the distressedhouseholds enhanced
100% of SHGs with savings & internal lending Data fromCMRCs andPRA survey ofultra-poorwomen
Women willing andhave enough time toparticipate to CAIMHouseholds 100 91 91
70% of SHGs taking loans from banks Data fromCMRCs andPRA survey ofultra-poorwomen
Households 70 91 130
Innovative financial products: debt redemption, insurance and health insurance piloted Data fromCMRCs andPRA survey ofultra-poorwomen
Households 10
5,000 ultra-poor women cease to depend on daily wage labour Data fromCMRCs andPRA survey ofultra-poorwomen
Females 5 000 4 092 15 903 318.1
70% of CMRCs generate income to cover 80% of costs Data fromCMRCs andPRA survey ofultra-poorwomen
Households 70 68 97.1
Increase in ownership of assets by women Data fromCMRCs andPRA survey ofultra-poorwomen
Females 67 000
Output 64 CMRCs establishedand equipped
Number of CMRCs established and equipped Reports fromCMRC
Women willing toparticipate in theprogramme andhave time to attendto group meetings
CMRCS 64 5 63 98.4
Results hierarchy Indicators Means of verification Assumptions
Name Baseline Mid-Term
EndTarget
AnnualResult(2018)
CumulativeResult(2018)
CumulativeResult %
(2018)
Source Frequency Responsibility
3/18

Output Seed capital supportprovided to 32 CMRCs
Number of CMRCs provided with seed capital Reports fromCMRC
Women willing toparticipate in theprogramme andhave time to attendto group meetings
CMRCs 63 32 63 63 196.9
Output 9,000 SHGs formed orstrengthened
No. of SHGs formed /strengthened Reports fromCMRC
Women willing toparticipate in theprogramme andhave time to attendto group meetings
SHGs 9 000 161 13 235 147.1
Output Pilots of mutual cropinsurance/ healthinsurance introduced
Persons covered by innovative financial products Reports fromCMRC
Women willing toparticipate in theprogramme andhave time to attendto group meetings
People 16 544
Output Pilot programme for 5,000ultra-poor women
Number of ultra-poor HHs participating Reports fromCMRC
Women willing toparticipate in theprogramme andhave time to attendto group meetings
Households 5 000 4 178 15 903 318.1
Outcome 200,000 small andmarginal farmers increaseproduction by usingsustainable andenvironmentally friendlyfarming methods
Number of farmers using LEISA & organic methods AOS /Thematicsurveys
Droughts and floodsdo not significantlydisrupt farming -Farmers find LEISAand organicmethods profitable
Number of farmers 33 767 190 347
Area of land certified for organic production AOS /Thematicsurveysarea of land 0 615
Value of gross loan portfolio (USD'000) RIMS Annual
Gross Loan Portfolio 30 093 000
Value of voluntary savings mobilized (USD'000) RIMS Annual
Value of voluntarysavings mobilized
10 000 000
Results hierarchy Indicators Means of verification Assumptions
Name Baseline Mid-Term
EndTarget
AnnualResult(2018)
CumulativeResult(2018)
CumulativeResult %
(2018)
Source Frequency Responsibility
4/18

Savings/credit groups with women in leadership positions RIMS Annual
Number of groups 161 13 235
People in savings and credit groups formed/strengthened (men/women) RIMS Annual
People in savings andcredit groups
90 000 12 464 155 784 173.1
1.2.4 Households reporting an increase in production AOS /Thematicsurveys /RIMS
Annual PMU
Total number ofhousehold members
1.1.4 Persons trained in production practices and/or technologies RIMS Annual PMU
Men trained in crop 26 880 242 871 903.5
Women trained in crop 11 520 21 605 187.5
Total persons trained incrop
264 476
1.2.2 Households reporting adoption of new/improved inputs, technologies or practices AOS /Thematicsurveys /RIMS
Annual PMU
Total number ofhousehold members
144 741 203 339
1.1.5 Persons in rural areas accessing financial services RIMS Annual PMU
Women in rural areasaccessing financialservices - savings
Men in rural areasaccessing financialservices - savings
Men in rural areasaccessing financialservices - credit
Results hierarchy Indicators Means of verification Assumptions
Name Baseline Mid-Term
EndTarget
AnnualResult(2018)
CumulativeResult(2018)
CumulativeResult %
(2018)
Source Frequency Responsibility
5/18

Women in rural areasaccessing financialservices - credit
Total persons accessingfinancial services -savings
Total persons accessingfinancial services - credit
Output 64 clusters establishedcovering about 1200villages
Output Community resourcepersons train and support200 000 farmers
People trained in community management topics IA & DPMTprogressreports / RIMS
Annual PMU IAs have thecapacity andresources toimplement theprogramme -Continuingextension supportand proventechnology packagefor LEISA farming -Availability of qualityseeds and otherinputs
Total persons trained inother
200 000 6 500 7 835 3.9
Results hierarchy Indicators Means of verification Assumptions
Name Baseline Mid-Term
EndTarget
AnnualResult(2018)
CumulativeResult(2018)
CumulativeResult %
(2018)
Source Frequency Responsibility
6/18

Output Sustainable farmingmethods demonstratedand disseminated
2.1.3 Rural producers’ organizations supported RIMS Annual PMU IAs have thecapacity andresources toimplement theprogramme -Continuingextension supportand proventechnology packagefor LEISA farming -Availability of qualityseeds and otherinputs
Total size of POs
Output Village information centresestablished and supported
Number of VIC established and operational IAs have thecapacity andresources toimplement theprogramme -Continuingextension supportand proventechnology packagefor LEISA farming -Availability of qualityseeds and otherinputs
Number of villageinformation centers
24 1 256
Results hierarchy Indicators Means of verification Assumptions
Name Baseline Mid-Term
EndTarget
AnnualResult(2018)
CumulativeResult(2018)
CumulativeResult %
(2018)
Source Frequency Responsibility
7/18

Output Machinery hire centresestablished andoperational
Number of machinery hire centres and clients IAs have thecapacity andresources toimplement theprogramme -Continuingextension supportand proventechnology packagefor LEISA farming -Availability of qualityseeds and otherinputs
Number of machineryhire centres
16 1 775
Output Crop demonstrations(technology, LEISA,organic)
Number of demonstrations by type, crop number of farmers and area IAs have thecapacity andresources toimplement theprogramme -Continuingextension supportand proventechnology packagefor LEISA farming -Availability of qualityseeds and otherinputs
Number ofdemonstrations
5 844 12 924
Results hierarchy Indicators Means of verification Assumptions
Name Baseline Mid-Term
EndTarget
AnnualResult(2018)
CumulativeResult(2018)
CumulativeResult %
(2018)
Source Frequency Responsibility
8/18

Output ha of orchardestablishment
Number, area and type of orchard establishment IAs have thecapacity andresources toimplement theprogramme -Continuingextension supportand proventechnology packagefor LEISA farming -Availability of qualityseeds and otherinputs
orchard establishment
Output compost and organicdemonstrations
Number of farmers* with compost, organic input demonstrations IAs have thecapacity andresources toimplement theprogramme -Continuingextension supportand proventechnology packagefor LEISA farming -Availability of qualityseeds and otherinputs
Number of farmers 0 11 080
Results hierarchy Indicators Means of verification Assumptions
Name Baseline Mid-Term
EndTarget
AnnualResult(2018)
CumulativeResult(2018)
CumulativeResult %
(2018)
Source Frequency Responsibility
9/18

Output Farmers trained
Community groups formed/strengthened - planning RIMS Annual PM IAs have thecapacity andresources toimplement theprogramme -Continuingextension supportand proventechnology packagefor LEISA farming -Availability of qualityseeds and otherinputs
Community Groupsformed
892
Community groups formed/strengthened - Self-Help RIMS Annual PMU
Community Groupsformed
16 683
People in community groups formed/strengthened - Planning RIMS Annual
Males 14 571 7 311 50.2
Females 14 571 2 100 8 145 55.9
People in community groups formed/strengthened - Self-Help RIMS Annual
Males 26 880
Females 11 520
People receiving vocational training (men/women) RIMS Annual
People receiving vocationtraining
3 600 500 5 048 140.2
Community workers trained (men/women) RIMS Annual
Community workerstrained
1 200 385 385 32.1
Village/community plans formulated RIMS Annual
Village community plans 1 661 26 565 34
2.1.2 Persons trained in income-generating activities or business management RIMS Annual PMU
Persons trained in IGAsor BM (total)
500 7 624
2.1.6 Market, processing or storage facilities constructed or rehabilitated RIMS Annual PMU
Results hierarchy Indicators Means of verification Assumptions
Name Baseline Mid-Term
EndTarget
AnnualResult(2018)
CumulativeResult(2018)
CumulativeResult %
(2018)
Source Frequency Responsibility
10/18

Processing facilitiesconstructed/rehabilitated
0 402
People trained in community management topics RIMS Annual PMU
Men trained in other 10 800 129 024 129 024 1 194.7
Women trained in other 10 800 9 873 9 873 91.4
Total persons trained inother
138 897 138 897
1.1.4 Persons trained in production practices and/or technologies IA & DPMTprogressreports / RIMS
Annual RIMS
Total persons trained incrop
Outcome Improved livelihoodopportunities for 4000livestock productionhouseholds
Numbers of households reporting improved increased numbers of animals owned, milkproduction, sales & prices, and use of facilitated livestock services
AOS /ThematicSurvey
Major diseaseoutbreak do notdisrupt livestocksectorHouseholds 4 000 990 3 736 93.4
Output 100 milk production groupsestablished with backwardand forward linkages
Number of dairy groups and members, services provided to group members IA & DPMTprogressreports
Dairy developmentis viable andsupported by inputand marketingagencies
Number of groups 100 1 210 1 239 1 239
Output Goat production developedin 50 villages
Number of villages and goat/poultry producers IA & DPMTprogressreports
Dairy developmentis viable andsupported by inputand marketingagencies
Number of villages 50 367 734
Output Poultry productiondeveloped in 100 village
Number of poultry production IA & DPMTprogressreports
Dairy developmentis viable andsupported by inputand marketingagencies
poultry production 100 1 443 1 443
Results hierarchy Indicators Means of verification Assumptions
Name Baseline Mid-Term
EndTarget
AnnualResult(2018)
CumulativeResult(2018)
CumulativeResult %
(2018)
Source Frequency Responsibility
11/18

Output Village livestock workers /paravets recruited andtrained
Number of trained and active village livestock workers and para vets IA & DPMTprogressreports
Dairy developmentis viable andsupported by inputand marketingagencies
Number of trained andactive village livestockworkers
283 315
Agricultural/livestock production groups formed/strengthened RIMS Annual
Number ofAgricultural/livestockproduction groups
4 800 4 012 24 757 515.8
People in agricultural/livestock production groups RIMS Annual
number of People inagricultural/livestockproduction groups
76 5 839
Outcome Water security improvedand soil erosion reduced in1,200 villages
Number of farmers benefitted AOS/ThematicSurveys
Farmers able toadapt to changingsolutionsNumber of farmers
At least 75% of farmers report increased availability of water and reduced soil erosion in areaswhere SWC implemented
AOS/ThematicSurveys
% of farmers reportincreased availability ofwater and reduced soilerosion
75
Output VDCs established andtrained in 1,200 villages
Number of operational VDC with SWC plans ProgressReports
VDCs remain active/ Timely supportfrom MGNREGAand otherconvergence
Number of operationalVDC with SWC plans
1 200 188 753 62.7
Output 1200 village NRM plansdrawn up by VDC
Number of villages & area covered by different types of SWC works Progressreports
VDCs remain active/ Timely supportfrom MGNREGAand otherconvergence
Number of village NRMplans drawn up by VDC
1 200 188 753 62.7
Results hierarchy Indicators Means of verification Assumptions
Name Baseline Mid-Term
EndTarget
AnnualResult(2018)
CumulativeResult(2018)
CumulativeResult %
(2018)
Source Frequency Responsibility
12/18

Output In situ soil and waterconservation carried out in1200 villages
Number of in situ soil and water conservation carried out ProgressReports
VDCs remain active/ Timely supportfrom MGNREGAand otherconvergence
Number of in situ soil andwater conservationcarried out
1 200 1 312 7 470 622.5
Output Number of small farmponds
Number of small farm ponds constructed ProgressReports
VDCs remain active/ Timely supportfrom MGNREGAand otherconvergence
Number of small farmponds constructed
1 800 7 3 538 196.6
Output Comprehensive SWC of200 ha in 60 microwatersheds(Rs180m)
Number of and area of micro watersheds treated ProgressReports
VDCs remain active/ Timely supportfrom MGNREGAand otherconvergence
Hectares of land 200
Environmental management plans RIMS Annual
Number of environmentalmanagement plans
1 606 381 23.7
Households receiving facilitated animals health services RIMS Annual
Households 5 000 2 226 7 564 151.3
Other productive infrastructure constructed/rehabilitated RIMS Annual
Other productiveinfrastructureconstructed/rehabilitated
3 600 44 44 1.2
Groups managing productive infrastructure formed/strengthened RIMS Annual
Number of groupsmanaging productiveinfrastructureformed/strengthened
1 200 8 4 190 349.2
Groups managing productive infrastructure formed/strengthened with women in leadershipposition
RIMS Annual
Results hierarchy Indicators Means of verification Assumptions
Name Baseline Mid-Term
EndTarget
AnnualResult(2018)
CumulativeResult(2018)
CumulativeResult %
(2018)
Source Frequency Responsibility
13/18

number of groups groupsmanaging productiveinfrastructureformed/strengthened withwomen in leadershipposition
80 1 900
People trained in infrastructure management RIMS Annual
Number of people trainedin infrastructuremanagement
14 400 80 40 548 281.6
Rainwater harvesting systems constructed/rehabilitated RIMS Annual
Number of rainwaterharvesting systemsconstructed/rehabilitated
3 600 1 385 4 977 138.3
People accessing facilitated advisory services RIMS Annual
Number of peopleaccessing facilitatedadvisory services
139 922 428 905
Land under improved management practices RIMS Annual PMU
Hectares of land 504 000 151 607 391 000 77.6
Outcome 50,000 farmers haveimproved market accessincluding contract farming,value addition, backwardand forward linkagesresulting in increasedincome
Number of farmers* using improved marketing systems AOS/ThematicSurveys
Market demandexists / Favourableresponse from theprivate sector,NGOs, farmers
Number of farmers* usingimproved marketingsystems
50 000 31 494 63
Number of farmers whose produce is sold in distant markets AOS/ThematicSurveys
Number of farmers
Number of farmers* reporting increased sales of farm produce and value of these sales AOS/ThematicSurveys
Number of farmers
Results hierarchy Indicators Means of verification Assumptions
Name Baseline Mid-Term
EndTarget
AnnualResult(2018)
CumulativeResult(2018)
CumulativeResult %
(2018)
Source Frequency Responsibility
14/18

Number of farmers reporting improved prices AOS/ThematicSurveys
Number of farmers
Output Market information,surveys and studies
Number & scope of market studies DPMTProgressReports
Private sectorremains interestedin linking with, andsupporting smallproducers in remoteareas / Local valueaddition iscompetitive withlarge scaleprocessors
Number of marketstudies
16
Output 200 Marketing links withprivate sector (PPP,contact marketing etc)
Number of market links, producers involved and volume of produce marketed via PPP, contractmarkets, producer companies and other collective marketing
DPMTProgressReports
Private sectorremains interestedin linking with, andsupporting smallproducers in remoteareas / Local valueaddition iscompetitive withlarge scaleprocessors
number of market links 200 2 95 47.5
Output 64 producer companies(PCs) organised &strengthened
Number of producer companies DPMTProgressReports
Private sectorremains interestedin linking with, andsupporting smallproducers in remoteareas / Local valueaddition iscompetitive withlarge scaleprocessors
number of producercompanies
2 52
Output 200 other groupscollectively market farmproduce
Number of groups collectively market farm produce DPMTProgressReports
Private sectorremains interestedin linking with, andsupporting smallproducers in remote
Results hierarchy Indicators Means of verification Assumptions
Name Baseline Mid-Term
EndTarget
AnnualResult(2018)
CumulativeResult(2018)
CumulativeResult %
(2018)
Source Frequency Responsibility
15/18

producers in remoteareas / Local valueaddition iscompetitive withlarge scaleprocessors
Number of groups 200 10 9 002 4 501
Output 100 value addition facilitiesestablished
Number of and type of value addition facilities DPMTProgressReports
Private sectorremains interestedin linking with, andsupporting smallproducers in remoteareas / Local valueaddition iscompetitive withlarge scaleprocessors
Number of value additionfacilities
100 30 154 154
Output 10 rural storagewarehouses
Number of on and off-farm storage facilities by type and capacity, number of farmers utilisingthese
DPMTProgressReports
Private sectorremains interestedin linking with, andsupporting smallproducers in remoteareas / Local valueaddition iscompetitive withlarge scaleprocessors
Number of storagefacilities
10 1 14 140
Results hierarchy Indicators Means of verification Assumptions
Name Baseline Mid-Term
EndTarget
AnnualResult(2018)
CumulativeResult(2018)
CumulativeResult %
(2018)
Source Frequency Responsibility
16/18

Output 100 on-farm storagefacilities for grains andvegetable
2.1.6 Market, processing or storage facilities constructed or rehabilitated DPMTProgressReports /RIMS
Annual PMU Private sectorremains interestedin linking with, andsupporting smallproducers in remoteareas / Local valueaddition iscompetitive withlarge scaleprocessors
Storage facilitiesconstructed/rehabilitated
100
Output 100 non-farm enterprisesestablished and supported
Number, type and scale of non-farm enterprises DPMTProgressReports
Private sectorremains interestedin linking with, andsupporting smallproducers in remoteareas / Local valueaddition iscompetitive withlarge scaleprocessors
number of non-farmenterprises
100 457 460 460
Output Capacity of 5,000producers developed inmarketing and business
Staff of service providers trained RIMS Annual Private sectorremains interestedin linking with, andsupporting smallproducers in remoteareas / Local valueaddition iscompetitive withlarge scaleprocessors
Staff of service providerstrained (men/women)
2 154 286 5 376 249.6
2.1.3 Rural producers’ organizations supported RIMS Annual PMU
Rural POs supported 64
2.1.4 Supported rural producers that are members of a rural producers' organization RIMS Annual PMU
Males
Females
2.1.2 Persons trained in income-generating activities or business management DPMTProgressReports /RIMS
Annual PMU
Persons trained in IGAsor BM (total)
5 000
Results hierarchy Indicators Means of verification Assumptions
Name Baseline Mid-Term
EndTarget
AnnualResult(2018)
CumulativeResult(2018)
CumulativeResult %
(2018)
Source Frequency Responsibility
17/18

18/18

India
Convergence of Agricultural Interventions in Maharashtra's Distressed DistrictsProgramme
Project Completion Report
Appendix 2: Summary of amendments to the financing agreement
Document Date: 30/06/2019
Project No. 1100001470
Loan ID 1000003372
Asia and the Pacific Division Programme Management Department
This document will be publicly disclosed unless there is written dissent on its disclosure by the Borrower at the time of this document submissionto IFAD or no later than the project closing date.


Appendix 2: Summary of amendments to the financing agreement
1. The project loan agreement between the Government of India ( Borrower) and IFAD and the project Agreement between GoM and IFAD were signed on 30 September 2009. The project was declared effective on 4 December 2009.
2. A corrigendum of typographical errors was issued by IFAD on 19 January 2010.
3. The project period was amended on 2 May, 2017 with the project completion date as 31 December 2018 and closing date as 31 June 2019.

India
Convergence of Agricultural Interventions in Maharashtra's Distressed DistrictsProgramme
Project Completion Report
Appendix 3: Actual project costs
Document Date: 30/06/2019
Project No. 1100001470
Loan ID 1000003372
Asia and the Pacific Division Programme Management Department
This document will be publicly disclosed unless there is written dissent on its disclosure by the Borrower at the time of this document submissionto IFAD or no later than the project closing date.


Appendix 3: Actual Project costs
Table 3.1: Financier wise Budget and Expenditure (INR in million), as at 31 May 2019
Financier Appraisal (USD ‘000)
Disbursements (USD ‘000)
Per cent disbursed
IFAD loan 40 101 35 721 89.08
IFAD grant 1 008 236 23.41
Government of Maharashtra 37 602 22 765 60.54
Sir Ratan Tata Trust Grant 16 007 5 460 34.11
Beneficiaries 3 609 10 664 295.47
Banks 14 539 30 093 206.98
Private Sector 5 779 1 873 32.41
Total 118 645 106 811 90.03
Table 3.2: Component wise Expenditure ( INR in '000) Sr No
Component IFAD loan IFAD grant Government of Maharashtra
Sir Ratan Tata Trust Grant
Beneficiaries Banks Private Sector Total
Appraisal
Actual
% Appraisal
Actual
% Appraisal
Actual
% Appraisal
Actual
% Appraisal
Actual
% Appraisal
Actual
% Appraisal
Actual
% Appraisal
Actual
%
1 INSTITUTIONAL CAPCITY BUILDING
149 819
462 702
30
9
5 994
14
038
23
4
100
2
588
2
588
368 008
2
502
1
-
-
1
891 000
-
-
523 921
2
372 830
45
3
2 MARKET LINKAGE & SUSTAINABLE AGRICULTURE-
1 460
671
1
556 939
10
7
29 000
-
-
1 735
500
1
389 159
80
373 179
255 450
68
169 980
694 821
40
9
683 333
39
051
6
271 613
116 499
43
4 723 276
4
051 919
86
3 PROGRAMME MANAGEMENT
275 787
314 956
11
4
12 525
-
-
32 642
33
094
10
1
10 200
84
700
83
0
-
-
-
-
-
331 154
432 750
13
1
TOTAL 1 + 2 + 3
1 886
277
2
334 597
12
4
47 519
14
038
30
1 768 242
1
424 841
81
751 387
342 652
46
169 980
694 821
40
9
683 333
1 930 051
28
2
271 613
116 499
43
5 578 351
6 857 499
12
3
India
Convergence of Agricultural Interventions in Maharashtra's Distressed DistrictsProgramme
Project Completion Report
Appendix 4: Project internal rate of return (detailed analysis)
Document Date: 30/06/2019
Project No. 1100001470
Loan ID 1000003372
Asia and the Pacific Division Programme Management Department
This document will be publicly disclosed unless there is written dissent on its disclosure by the Borrower at the time of this document submissionto IFAD or no later than the project closing date.


Appendix 4: Project internal rate of return (Ex-post)
A. Introduction
The CAIM Programme commenced implementation in December 2009 and completed in December 2018 covering 6 districts in Maharashtra state involving some 159,000 beneficiary households. With the implementation of CAIM interventions, there have been significant changes in land use, production patterns, households’ incomes and overall well-being of the participating households. These aspects are examined in this Appendix, the economic and financial analysis (EFA).
Approach and methodology for EFA: Cost-benefit analysis method was used for carrying out the economic and financial analysis of CAIM at Completion. All incremental investment costs were adjusted to April 2019 prices applying India’s GDP deflator. Incremental benefits were estimated based on actual physical outputs and likely chances of building up of incremental benefits during the remainder of the project life period and also considering production foregone. Prices were collected for all inputs and output commodities from the district markets and adjusted them to farm-gate prices using standard conversion factor. Data collected and compiled by the CAIM project office are used as basic sources of reference. Using all available data, both primary and secondary, type production models for livelihoods interventions, in particular cattle and buffalo dairy, goat-rearing, backyard poultry, fishery, vegetable cultivation, non-farm activities, IGAs, and also social and community enterprises managed by the CMRCs, SHGs, JLG, PCs, were developed: from these production models to household models were built, subproject models that are the aggregation of household models and finally the project models with the help of FARMOD.
Quality of data: The project-based MIS data aggregated at project levels were useful such as number of units installed, beneficiaries covered, site locations etc by year, as well as details with regard to type of models were quite adequate. However, models for dairy, goat, poultry and social enterprises were not representative. There were a number of limitations in collecting data for the core activities that significantly delayed analysis. The project has not compiled the data as per the checklist provided to them by the previous supervision mission.
This Appendix-4 provides a detailed analysis of ex-post EFA of CAIM and examines its key features briefly. Major interventions and number of participating beneficiaries are given in Annex-1.3.
B. Financial Analysis The data used for this analysis have been collected from various sources including a number of studies (both in house and other agencies) carried out during the project implementation, impact assessment studies, data base for PCR report and some generally accepted norms and estimates collected from progress reports and published sources. (i) Assumptions and observations The key assumptions used for the estimation of benefits from the project are presented below:
In general, the project was able to overcome the sluggish start by strategically placing resources to complete most of the activities during the later period of project implementation.
Overall assessment indicates a positive change in resource use/base and livelihoods scenario of the participating target groups.
Though the range of activities and interventions that were promoted and facilitated under the project were broadly similar to those estimated at design, there has been a range of additions and innovations added.
Access to market with remunerative prices was made available to farmers through POs and value chain arrangements. In addition to the diversity of farm produce, the volume of marketable farm produce has increased with addition of several social/ collective enterprises.

The physical coverage of the project interventions is related to dynamic interaction between service providers and the target groups, the wide coverage indicated their appropriateness, adoption preference and potential for scaling up.
The households were willing to organize themselves into viable community institutions for capacity building and participated in the project implementation: establishing the SHGs as people organization at the grassroots level along with federation structures through CMRCs, availability of required, adequate and timely credit facilities facilitated the women members for enhancing their economic and social empowerment.
By improving the market information, adoption of appropriate technologies and other related facilities, the participating households were able to realize increased margins in their adopted enterprises.
Cash inflow and benefits accrued in the year following when the activities were initiated. The without project situation of the parameters for the interventions was taken as per the impact assessment studies and the estimated generated through group discussions during the field study by the PCR team.
(ii) Activity Models of the Project In all 295,629 households benefited from the project interventions. These beneficiaries were grouped in the following sub project models: (i) crop models (ii) Fishery and Livestock and (iii) social and community Enterprises. The project interventions included several social development activities, which had significant impacts on the financial benefits of the farm households through adoption of timely and cost effective operations besides competitive marketing arrangements. Following production models were developed and used in the economic and financial analysis:
Table 10.1 List of production models developed and used in Economic analysis
Crops based models Livestock-based models Enterprises-based models -Cotton -Soybean -Black gram -Red gram -Pigeon pea -Soybean seed production -Fodder cultivation -Medicinal plants -better cotton initiative -better agronomic practices -irrigated crops
-Household dairy -Household goat unit -Back yard poultry Fishery models -pond fishery
-Milk collection centres Common processing centres -Agricultural service centres -Farm equipment banks -turmeric processing unit -mushroom production unit -dal processing units -SPARC unit (small producers agricultural resource centre)
Above interventions are managed by small and marginal farmers
Above interventions are managed by small and marginal farmers
These are managed by individual members and also by SHGs and the Federations
(iii) Household, Activity or Farm Models
Household, area and activity models: Using production budgets from a range of crops and activities, several “area and farm models and activity models” were prepared to broadly illustrate the CAIM “expected impacts” on the incomes, and the use of household labour adopting and/or adapting both on-farm and non-farm during the reminder period of the project. Results of financial analysis of each module shown in Annex-3.1 to 3.17 of this Appendix are summarised below.
Crop models and medicinal plants: Under crop farm models there are three variants: (i) crops cultivated taking advantages of the benefits of soil and water conservation practices with average size of landholding of 3.9 ha, (ii) crops grown under contract farming with an average landholding size of 3 ha (iii) other crops with the support from the convergence with average farm size of 2 ha, (iv) fodder crops at 2 ha per households, medicinal plants 2.2 ha per hh and irrigated crops, better cotton initiative and better agronomic practices at 1 ha each household.

Medicinal plants are profitably cultivated in the project area and average size of cultivation is 2 ha. Fodder cultivation has also been taken up by group and the average size of cultivation is 2 ha.
Micro livelihood models: There are five production models under this category and these are (i) household dairy with two cattle or buffalo, (ii) goat-keeping, (iii) backyard poultry, (iv) vegetable cultivation MLP, and (v) non-farm interventions. On and average each MLP is managed by a group of 21 women members. In all, there are 454 MLPs and all were supported by CAIM, of which 1,232 SHG with 9,781 women, covering 80% of goat production. Banks provided finances to a group and the participating members divided the amount and purchased additional dairy animal, goats or set up poultry units, or engaged in vegetable cultivation or started non-farm enterprises, etc.
Dairy model: Each household purchased 2 dairy animal and adopted improved management practices. Average milk production is xxx litre/animal. Milk is sold or marketed individually by the respective household in local markets. Cattle insurance is common among the dairy farmers
Goat model: Each household model consists of 10 does and one buck, purchased at 7,000 INR per goat and is treated with free vaccination from the government, insurance is at INR 120 /goat but most households go for goat insurance and feed and fodder at INR 400 per animal. Mortality rate is assumed at 15-20% with project and sale price at INR 230/kg but rarely beneficiaries sell animal by weight. Buck and does are replaced at every 5 Year period.
Backyard Poultry model. The backyard poultry is a 20-25 chicks unit with four cycles a year. Sale of birds at INR 120 each and eggs at INR 5 with private player such as “Eggsman organic ltd” at the local market. Majority of the poultry initiatives in the project were for the backyard poultry 20-25 birds each
for egg production. In this case the birds were reduced from 25to 15.
Vegetables cultivation model. Average annual production of tomato is assumed at 16 ton per year with an average sale price of INR 12.5/kg. As summer vegetables are expensive, a weighted average price has been assumed. Households use both bio-fertilisers and also chemical fertilisers. Farm products are sold in nearby markets. Households are unable to cultivate vegetables through out the year due to drought conditions.
Better cotton initiatives and other practices. The technology aspects include planting of cotton, soybean and pulses as intercrops and application of required fertilisers and avoiding excess application of pesticides and other chemicals and use of appropriate quantities of seeds. Under better agronomic practices, broad bed furrow method of cultivation is practiced. Under irrigated farming, a very limited area brought under micro-irrigation facilities is considered where traditional crops such as cotton, soy bean, pulses, etc are grown. In all cases, one ha model is used.
Social and community enterprises models: All activities listed in Table 10.1 above were considered for analysis. The milk collection centres collect milk from their members and sell it. SPARC units rent machineries to farmers and collect charges from villages to process food, grading of feed crops, like soybean, red gram, wheat, etc. The common processing centres provide processing facilities to their members on charge basis. The agricultural service centres sell all inputs such as seeds, fertilisers, small tools etc. Farm equipment banks supply farm implements, tools and other equipment on rental basis to their members. Turmeric processing units, mushroom production units and dal (pulses) processing units are used for the respective, processing and production of agricultural produce.
Results of the above production and activity models are summarised in Table-10.2 below and details in Annex-3.1 to 3.17
Table 10.2: Financial performance of household, area and activity models
Production Models Gross Income
(INR)
Input Cost
(INR)
Labour (INT)
FIRR (%)
NPV at 12%
(INR)
BCR (ratio)
SWC measures 36,540 17,455 16050 - 47,086 -
Contract farm 51,520 14,620 14000 - 83,460
Vegetable crops 120,800 25,350 17,310 - 235,070 -
Better cotton initiative 6,300 -2,700 -1500 - 79,360 Better agronomic practices 45,990 18,000 18,375
- 78,290
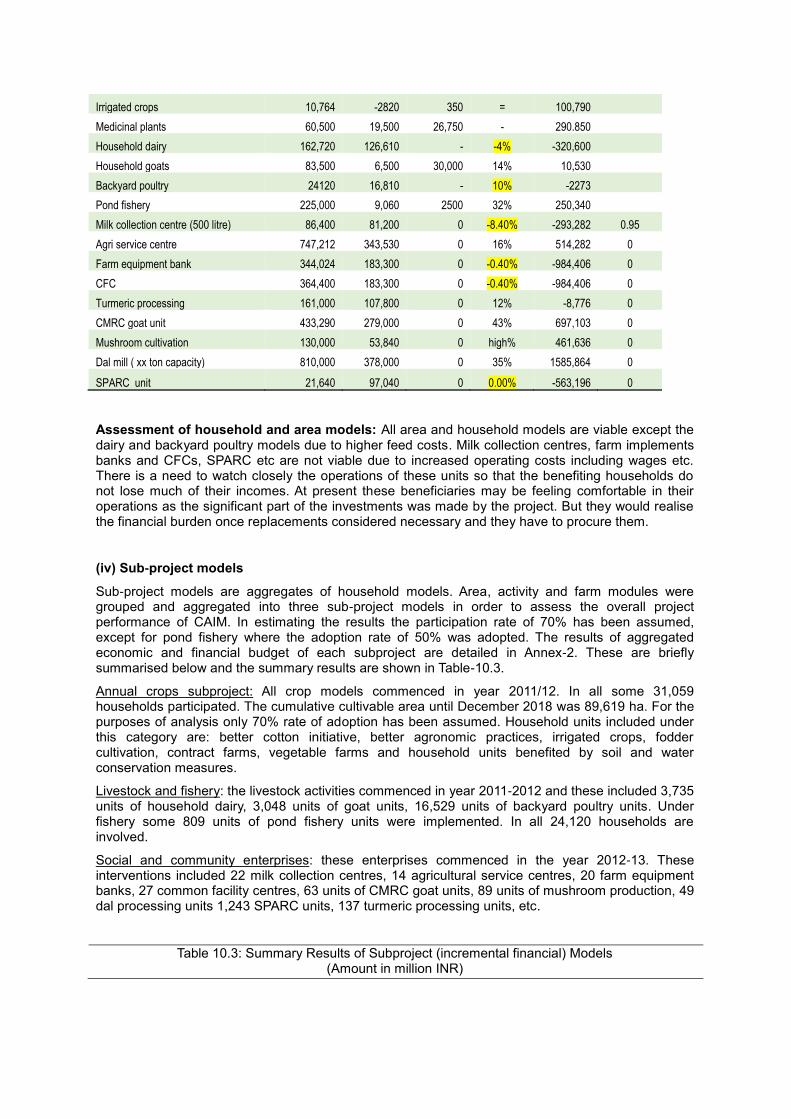
Irrigated crops 10,764 -2820 350 = 100,790
Medicinal plants 60,500 19,500 26,750 - 290.850
Household dairy 162,720 126,610 - -4% -320,600
Household goats 83,500 6,500 30,000 14% 10,530
Backyard poultry 24120 16,810 - 10% -2273
Pond fishery 225,000 9,060 2500 32% 250,340
Milk collection centre (500 litre) 86,400 81,200 0 -8.40% -293,282 0.95
Agri service centre 747,212 343,530 0 16% 514,282 0
Farm equipment bank 344,024 183,300 0 -0.40% -984,406 0
CFC 364,400 183,300 0 -0.40% -984,406 0
Turmeric processing 161,000 107,800 0 12% -8,776 0
CMRC goat unit 433,290 279,000 0 43% 697,103 0
Mushroom cultivation 130,000 53,840 0 high% 461,636 0
Dal mill ( xx ton capacity) 810,000 378,000 0 35% 1585,864 0
SPARC unit 21,640 97,040 0 0.00% -563,196 0
Assessment of household and area models: All area and household models are viable except the dairy and backyard poultry models due to higher feed costs. Milk collection centres, farm implements banks and CFCs, SPARC etc are not viable due to increased operating costs including wages etc. There is a need to watch closely the operations of these units so that the benefiting households do not lose much of their incomes. At present these beneficiaries may be feeling comfortable in their operations as the significant part of the investments was made by the project. But they would realise the financial burden once replacements considered necessary and they have to procure them.
(iv) Sub-project models
Sub-project models are aggregates of household models. Area, activity and farm modules were grouped and aggregated into three sub-project models in order to assess the overall project performance of CAIM. In estimating the results the participation rate of 70% has been assumed, except for pond fishery where the adoption rate of 50% was adopted. The results of aggregated economic and financial budget of each subproject are detailed in Annex-2. These are briefly summarised below and the summary results are shown in Table-10.3.
Annual crops subproject: All crop models commenced in year 2011/12. In all some 31,059 households participated. The cumulative cultivable area until December 2018 was 89,619 ha. For the purposes of analysis only 70% rate of adoption has been assumed. Household units included under this category are: better cotton initiative, better agronomic practices, irrigated crops, fodder cultivation, contract farms, vegetable farms and household units benefited by soil and water conservation measures.
Livestock and fishery: the livestock activities commenced in year 2011-2012 and these included 3,735 units of household dairy, 3,048 units of goat units, 16,529 units of backyard poultry units. Under fishery some 809 units of pond fishery units were implemented. In all 24,120 households are involved.
Social and community enterprises: these enterprises commenced in the year 2012-13. These interventions included 22 milk collection centres, 14 agricultural service centres, 20 farm equipment banks, 27 common facility centres, 63 units of CMRC goat units, 89 units of mushroom production, 49 dal processing units 1,243 SPARC units, 137 turmeric processing units, etc.
Table 10.3: Summary Results of Subproject (incremental financial) Models (Amount in million INR)

Sub-project model Participating or adoption rate%
Gross Income (INR)
Purchased inputs (INR)
Labour (INR)
Net income (INR)
NPV estimated at 12%
Annual crops 70% 2276.7 -148.9 -104.7 2530/4 8860.9 Livestock & Fishery a/ 70-50% 654.1 431.0 122.3 101.4 617.9 Enterprises a/ 70% 134.3 192.0 - (51.4) (453.9) a/ cost of labour included under purchased inputs
Assessment of subproject models: By and large, all crop-based activities and enterprises are viable and so are the livestock enterprises except household dairy due high feed costs. While some of the community and social enterprises are financially viable such as pulses mill, turmeric processing, CMRC goat units and also the CFC. While selecting such enterprises careful assessment of their financial viability and sustainability should be ensured.
C. Economic analysis
(i) Assumptions
A twenty year analysis period has been assumed, which included an 11 year project investment period.
All inputs and outputs that are traded are valued at prices as of April 2019.
Economic investment costs are net of taxes and price contingencies, credit for recurring expenditures, etc. All costs directly associated with the incremental production are included in full, including incremental farm inputs and family labour.
Investment costs were adjusted to May 2019 prices applying GDP inflator for India
A standard conversion factor (SCF) ranging between 0.66 and 0.90 is applied to items for adjusting financial prices
1.
The average financial rural wage rate is taken to be the best estimate of the economic value of labour in rural Maharashtra. The financial price of labour reflects seasonal variation in employment opportunities in the project area.
The analysis includes only on-farm and off-farm benefits and including attributable benefits
2, from MLPs, IGAs and social enterprises.
Some notional benefits emerging from other social interventions such as drudgery reduction, which are few have not been monetized or accounted for in the ex-post EFA;
The analysis employs an Opportunity Cost of Capital (OCC) at 7.5%, which is the April 2019 long-term bond rate in India.
(ii) Costs-Benefits Streams and Analysis
The project economic costs were direct expenditures after adjusting for inflation. Recurrent costs for continued operations have been included in full. Economic costs for inputs and output models were estimated by applying the conversion factors on the financial prices. Commodity prices
3were
collected and compiled by PMU, Amrawati and NCAER.
Production benefits: The farm productions are direct output from the respective farming practices resulted in productivity increases ranging between 10 and 20%.
Project performance indicators: Cost-benefit analysis yielded an overall IRR of 28% of the project with an NPV at a 7.5% discount rate of INR 3.568 million and a BCR of 1.63. A positive NPV under the the Opportunity Cost of Capital of 7.5%
4 indicated that the project investments have been robust
and sound. The switching value analysis indicated that the project investments are worthy of sustaining either a 39% decline in overall benefits or 63% increases in costs. But the project investments are highly sensitive to simultaneous increases in costs and decline in benefits. For example, a 20% increases in costs and equal % of benefits decline will reduce the IRR to 10%. If
1 These vary, for example value of milk was at 10% of the financial price of INR 42/litre as animals are purchased and
used and not reared, eggs were at 0.66, planting materials and seeds at 0.90, fertilisers at 100, tolls and plants for
enterprises at 75 to 80 2 % of attributable benefits of convergence have been estimated at 77.4% in case of cattle and buffalo, 83% in case of
goat and about 71.4% for poultry 3See Annex XX containing list of financial and economic prices used in EFA.
4Discount rate is based on India’s long-term bond rate and also Central Bank lending rate

benefits delayed by two years (in effect, if the project’s future production activities take longer to become fully developed or established) then the IRR declines to 19% with a NPV of INR 2,594 million
Details presented in Annex-1 are summarised in Table-10.4 below.
Table 10.4: Performance Indicators of CAIM at PCR
Indicators
Base case Cost Increases by Benefits down by
15% 20% 15% 20%
NPV discounted (million INR) at 7.5% 3,568 2,720 2,437 2,184 1,723
BCR, ratio 1.63 1.42 1.36 1.39 1.30
IRR % 28% 21% 19% 20% 17%
Above project performance indicators were compared with those of the indicators estimated at Project Design in Table-10.5 below. Although the overall IRR are comparable, there is significant difference between the NPV of two scenarios and this could be generally explained due to (i) ambitious projections at the time of the design and (ii) assumptions in reductions in costs of production owing to the adaptation of suggested technologies such as organic farming, significant area under LEISA technology and improved market access on the concept of “end-to-end” approaches. These by and large did not happen.
Table 10.5: Comparison of Project Performance Indicators
Project performance indicators Ex-ante EFA Ex-post EFA
IRR % 27% 28%
NPV on discounted cash flow (INR million) 11,558 3,568
BCR of discounted cash flow
1.63
Two year delay of benefits IRR % 25% 19%
NPV (million INR) 10,366 2,594
Key drivers of the economy of the project are (i) annual crops followed by livestock and fishery. All of them generate positive IRR ranging from 34% to 53%. An analysis of incremental financial benefits and costs show that incremental benefits to all participating households have been stable since the project year 10 and that is in the range of INR 10,900 and 11,000 per household per year. These increases are the resultant effect of increased productivity of crops, which is about 34%.
D. Benefits and Beneficiaries.
Beneficiaries: The project covered some 295,629 households in six districts of Maharashtra.
Benefits: Immediate benefits were increased productivity through the introduction of in situ water conservation and organic farming practices and low external input sustainable agriculture. This is as a result of the LEISA practices and marginal production increases due to in situ moisture conservation and other agronomic farming practices.
Table 10.6 Average Household incomes "excluding labour value" (Amount in INR/Participating household)
Details PY 9 PY 10 PY 11 PY 12 PY 15 PY 20
Household incomes (incremental)
10,900 10,910 11,420 11,086 11,320
a/ Source data: Annex table 1.7
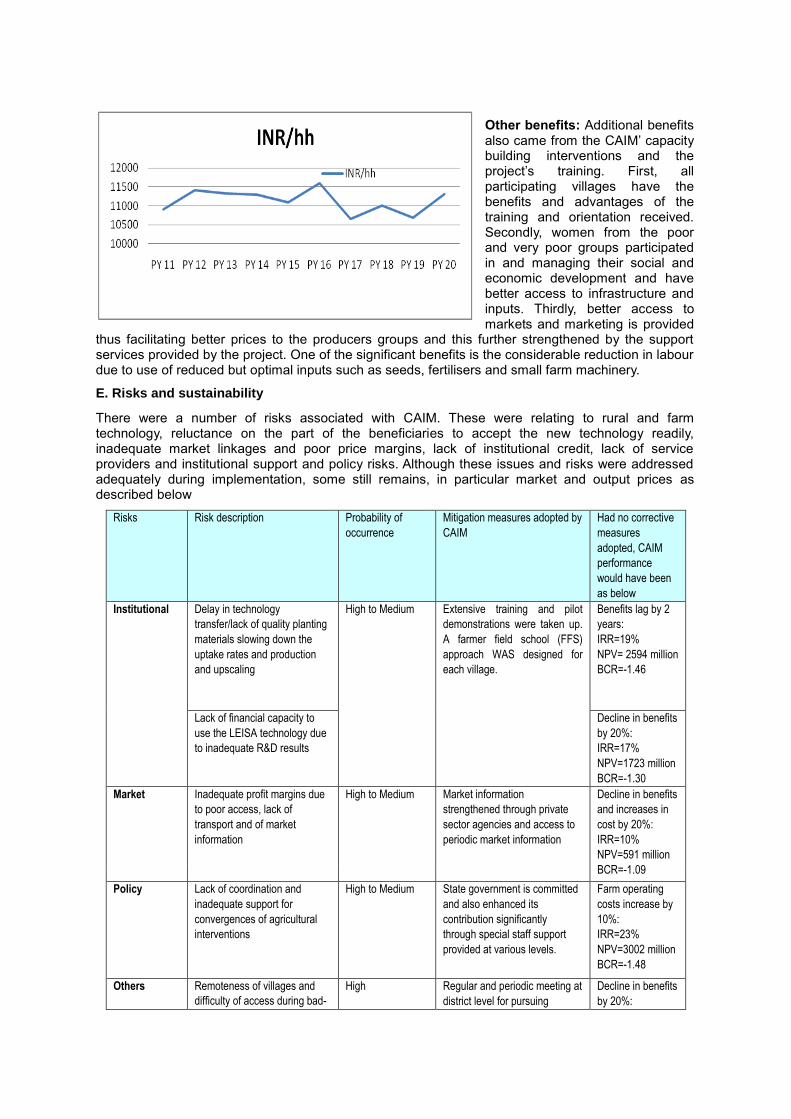
Other benefits: Additional benefits also came from the CAIM’ capacity building interventions and the project’s training. First, all participating villages have the benefits and advantages of the training and orientation received. Secondly, women from the poor and very poor groups participated in and managing their social and economic development and have better access to infrastructure and inputs. Thirdly, better access to markets and marketing is provided
thus facilitating better prices to the producers groups and this further strengthened by the support services provided by the project. One of the significant benefits is the considerable reduction in labour due to use of reduced but optimal inputs such as seeds, fertilisers and small farm machinery.
E. Risks and sustainability
There were a number of risks associated with CAIM. These were relating to rural and farm technology, reluctance on the part of the beneficiaries to accept the new technology readily, inadequate market linkages and poor price margins, lack of institutional credit, lack of service providers and institutional support and policy risks. Although these issues and risks were addressed adequately during implementation, some still remains, in particular market and output prices as described below
Risks Risk description Probability of
occurrence
Mitigation measures adopted by
CAIM
Had no corrective
measures
adopted, CAIM
performance
would have been
as below
Institutional Delay in technology
transfer/lack of quality planting
materials slowing down the
uptake rates and production
and upscaling
High to Medium Extensive training and pilot
demonstrations were taken up.
A farmer field school (FFS)
approach WAS designed for
each village.
Benefits lag by 2
years:
IRR=19%
NPV= 2594 million
BCR=-1.46
Lack of financial capacity to
use the LEISA technology due
to inadequate R&D results
Decline in benefits
by 20%:
IRR=17%
NPV=1723 million
BCR=-1.30
Market Inadequate profit margins due
to poor access, lack of
transport and of market
information
High to Medium Market information
strengthened through private
sector agencies and access to
periodic market information
Decline in benefits
and increases in
cost by 20%:
IRR=10%
NPV=591 million
BCR=-1.09
Policy Lack of coordination and
inadequate support for
convergences of agricultural
interventions
High to Medium State government is committed
and also enhanced its
contribution significantly
through special staff support
provided at various levels.
Farm operating
costs increase by
10%:
IRR=23%
NPV=3002 million
BCR=-1.48
Others Remoteness of villages and
difficulty of access during bad-
High Regular and periodic meeting at
district level for pursuing
Decline in benefits
by 20%:

Risks Risk description Probability of
occurrence
Mitigation measures adopted by
CAIM
Had no corrective
measures
adopted, CAIM
performance
would have been
as below
weather seasons
convergence. IRR= 17%
NPV=1723 million
BCR=-1.30
Climate change risks of
delayed and abnormal rainfall,
drought, floods, frosts, snowfall
etc
Use of SWC and LEISA
technology

9
PROJECT PERFORMANCE INDICATORS AND SENSITIVITY ANALYSIS
Annex-1.1: Project performance indicators (IRR, NPV & BCR) of CAIM at PCR
ECONOMIC ANALYSIS: ex-post
Country: 0.075 7.5%
Project:
(amount in million INR)
1 2 3 4 5 6 7 8 9 10 11 12 13 14 15 16 17 18 19 20
Incremental benefits
Incremental benefits 0.0 2.0 50.7 190.3 453.1 621.3 984.9 1298.3 1773.9 2177.6 1461.4 1518.4 1509.2 1529.5 1513.5 1511.1 1515.5 1505.6 1513.1 1508.0
Total Incremental benefits 0.0 2.0 50.7 190.3 453.1 621.3 984.9 1298.3 1773.9 2177.6 1461.4 1518.4 1509.2 1529.5 1513.5 1511.1 1515.5 1505.6 1513.1 1508.0
Incremental costs
Investment costs 6.2 41.8 105.0 643.9 429.2 516.8 597.8 603.3 674.3 1183.9
Operating costs, inputs & labour 0.0 4.4 26.2 159.3 281.2 442.4 511.4 450.7 610.2 366.4 313.5 305.7 307.7 332.9 343.3 332.0 375.5 345.2 393.3 307.5
Incremental costs 6.2 46.2 131.2 803.2 710.5 959.2 1109.2 1054.1 1284.5 1550.3 313.5 305.7 307.7 332.9 343.3 332.0 375.5 345.2 393.3 307.5
Incremental net benefits -6.2 -44.3 -80.5 -612.9 -257.4 -337.8 -124.3 244.3 489.4 627.3 1148.0 1212.7 1201.4 1196.6 1170.3 1179.1 1140.0 1160.4 1119.8 1200.4
Basecase results discounted: 7.5% Benefits lagged by 2 year DR at 7.5%
NPV of benefit streams discounted at 7.5% 9,226 NPV of benefit streams discounted at 7.5% 8,252
NPV of costs stream discounted at 7.5% 5,658 NPV of costs stream discounted at 7.5% 5,658
NPV of project discounted at 7.5% 3,568 NPV of project discounted at 7.5% 2,594
BCR- discounted benefits & costs at 7.5% 1.63 BCR- discounted benefits & costs at 7.5% 1.46
IRR IRR
Discount rate:DR
CAIM PCR
INDIA
28%
Project Year
19%

10
Annex-1.2: CAIM Project sensitivity analysis (Switching values etc…) at PCR
Project Performance indicators 10% 15% 20% 25% 10% 15% 20% 25% 10% 15% 20% 25%
NPV of at discount rate of 7.5% 3,002 2,720 2,437 2,154 2,646 2,184 1,723 1,262 2,080 1,336 591 -153
BCR at discount rate of 7.5% 1.48 1.42 1.36 1.30 1.47 1.39 1.30 1.22 1.33 1.21 1.09 0.98
IRR 23% 21% 19% 17% 23% 20% 17% 15% 18% 14% 10% 7%
Switching Value Analysis:
Switching Value: Appraisal
Total Benefits at 7.5% DR 9,226 5,658 -39
Total Costs at 7.5% DR 5,658 9,226 63
Switching value % change
Both cost increase & benefits down
Results of Sensitivity Analysis:
Costs increased by Benefits down by

11
Annex-1.3: CAIM INTERVENTIONS
Activities unit 2009/10 2010/11 2011/12 2012/13 2013/14 2014/15 2015/16 2016/17 2017/18 2018/19
Agricultural farms
Soil and water conservation ha 0 0 391 4344 16827 11574 4210 5027 5520 986 48879
# of hh 0 130 856 3545 3512 1145 1665 1505 249.0 12607
70% hh 91 599 2482 2458 802 1166 1054 174 8825
Contract farming ha 41 1,177 4,716 828 1,292 845 114 685 9698
# of hh 14 392 1,572 276 431 282 38 228 3233
70% hh 10 274 1100 193 302 197 27 160 2263
Other annual crops ha 1,030 2,394 5,692 5,138 5,362 4,296 22 23934
# of hh 515 1,197 2,846 2,569 2,681 2,148 11 11967
70% hh 361 838 1992 1798 1877 1504 8 0 8377
Fodder cultivation ha 200 302 1,055 230 550 634 2,374 668 6013
# of hh 100 151 528 115 275 317 1,187 334 3007
70% hh 70 106 370 81 193 222 831 234 2105
Medicinal plants ha 83 1012 1095
# of hh 247 247 494
70% hh 173 173
Better cotton initiative ha cumulative 68,569 98,057 90,098 1,55,672 1,51,607 1,51,607
# of hh incremental 41,923 15,684 12,330 69,985 1,39,922
70% hh incremental 29,346 10,979 8,631 48,990 0
Better agronomic practices ha 400 880 8,398 15,102 15,275 805 0 40,860
# of hh 400 880 8,398 15,102 15,275 805 40,860
70% hh 280 616 5,879 10,571 10,693 564 28,602
Micro-irrigation ha 57 242 234 145 228 46 952
# of hh 57 242 234 145 228 46 952
70% hh 40 169 164 102 160 32 666

12
Activities unit 2009/10 2010/11 2011/12 2012/13 2013/14 2014/15 2015/16 2016/17 2017/18 2018/19
Livestock
Household dairy # of unit 19 55 429 492 399 907 444 990
# of hh 19 55 429 492 399 907 444 990
70% hh 13.3 38.5 300.3 344.4 279.3 634.9 310.8 693.0
Goat unit # of unit 14 54 270 273 831 1,169 236 201
# of hh 14 54 270 273 831 1,169 236 201
70% hh 9.8 37.8 189.0 191.1 581.7 818.3 165.2 140.7
Backyard poultry unit 30 1,454 10,607 2,149 1,399 196 694
# of hh 30 1,454 10,607 2,149 1,399 196 694
70% hh 21 1018 7425 1504 979 137 486
Pond fishery # of unit 2 17 0 82 18 0 690
# of hh 2 17 0 82 18 0 690
50% hh 1 8.5 0 41 9 0 345
Participating households # of hh 0 0 33 141 2170 11372 3461 3493 876 2575
Adopting households # of hh 0 0 23.1 98.3 1515.6 7960.4 2406.3 2441.5 613.2 1664.5
CAIM Interventions

13
Activities unit 2009/10 2010/11 2011/12 2012/13 2013/14 2014/15 2015/16 2016/17 2017/18 2018/19
Enterprises
Milk collection centre # of unit 1 2 1 1 25 1
# of hh 100 200 100 100 2,500 100
70% 70 140 70 70 1750 70 0
Agricultural service centre farms # of unit 5 7 2
# of hh
70% 3.5 4.9 1.4
Farm implement banks # of unit 1 2 15 2
# of hh
70% 0.7 1.4 10.5 1.4
CFC # of unit 3 10 25
# of hh
70% 2.1 7 17.5
Turmeric processsing unit # of unit 0 0 0 3 76 10 100 4 2
# of hh
70% 0 0 0 2.1 53.2 7 70 2.8 1.4
CMRC goat unit # of unit
# of hh
70%
Mushroom production # of unit 0 0 0 71 220 1341 67 60 16
hh
70% 0 0 0 49.7 154 938.7 46.9 42 11.2
Dal processing mill # of unit 20 23 19 0 4
# of hh 200 230 190 0 40
70% 140 161 133 0 28
SPARC # of unit 71 220 1,341 67 60 16
# of hh 710 2,200 13,410 670 600 160
70% 497 1540 9387 469 420 112
CAIM Interventions

14
Annex-1.4: Project economic costs adjusted to nominal prices
Financier 2009/10 2010/11 2011/12 2012/13 2013/14 2014/15 2015/16 2016/17 2017/18 2018/19 Total
IFAD Loan & Grant 2.8 21.8 31.2 124.3 253.2 184.8 302.8 372.4 166.8 1,078.6 2,538.7
Govt of Maharashtra 0.2 1.6 3.0 3.8 3.2 3.1 2.4 4.0 3.4 24.7
Convergence 0.0 0.0 20.8 257.6 0.0 180.9 141.6 123.6 443.9 42.7 1,211.1
SRTT (TT) a/ 0.0 0.0 9.7 34.4 54.9 40.2 54.9 37.5 0.0 0.0 231.6
Credit from Banks 0.0 0.0 0.0 117.2 229.6 261.6 358.7 333.0 328.7 301.2 1,930.0
Private sector 0.0 0.0 1.7 7.5 0.0 65.6 12.5 17.0 6.7 5.5 116.5
Beneficiary 0.0 0.0 9.7 11.7 58.4 60.8 149.8 229.2 58.1 116.8 694.5
Total A 3.0 23.4 76.1 556.5 599.3 797.0 1,022.7 1,116.7 1,007.6 1,544.8 6,747.1
Calculation of Economic cost
Less credit from banks 0.0 0.0 0.0 117.2 229.6 261.6 358.7 333.0 328.7 301.2 1,930.0
Less private sector participation 0.0 0.0 1.7 7.5 0.0 65.6 12.5 17.0 6.7 5.5 116.5
Less beneficiary participation 0.0 0.0 9.7 11.7 58.4 60.8 149.8 229.2 58.1 116.8 694.5
Sub-total B 0.0 0.0 11.4 136.4 288.0 388.0 521.0 579.2 393.5 423.5 2,741.0
Economic costs (A-B) 3.0 23.4 64.7 420.1 311.3 409.0 501.7 537.5 614.1 1,121.3 4,006.1
Inflation factor a/ 2.05 1.79 1.63 1.53 1.38 1.26 1.19 1.12 1.10 1.06
Adjusted to Nominal Prices 6.163 41.811 105.603 643.929 429.220 516.772 597.776 603.344 674.343 1183.869 4,802.8
a/ source: www.inflation.com/indian_rupee
CAIM PCR: PROJECT EXPENDITURE BY YEAR IN NOMINAL PRICES (million INR)
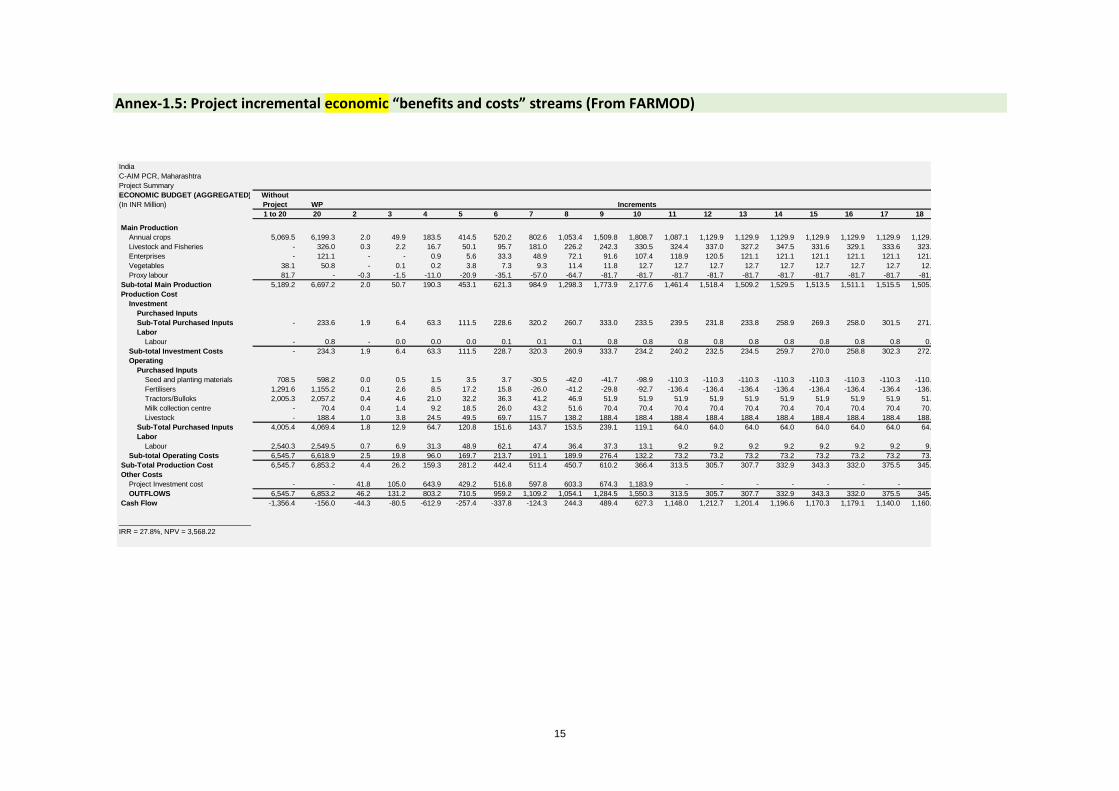
15
Annex-1.5: Project incremental economic “benefits and costs” streams (From FARMOD)
India
C-AIM PCR, Maharashtra
Project Summary
ECONOMIC BUDGET (AGGREGATED) Without
(In INR Million) Project WP Increments
1 to 20 20 2 3 4 5 6 7 8 9 10 11 12 13 14 15 16 17 18 19 20
Main Production
Annual crops 5,069.5 6,199.3 2.0 49.9 183.5 414.5 520.2 802.6 1,053.4 1,509.8 1,808.7 1,087.1 1,129.9 1,129.9 1,129.9 1,129.9 1,129.9 1,129.9 1,129.9 1,129.9 1,129.9
Livestock and Fisheries - 326.0 0.3 2.2 16.7 50.1 95.7 181.0 226.2 242.3 330.5 324.4 337.0 327.2 347.5 331.6 329.1 333.6 323.7 331.1 326.0
Enterprises - 121.1 - - 0.9 5.6 33.3 48.9 72.1 91.6 107.4 118.9 120.5 121.1 121.1 121.1 121.1 121.1 121.1 121.1 121.1
Vegetables 38.1 50.8 - 0.1 0.2 3.8 7.3 9.3 11.4 11.8 12.7 12.7 12.7 12.7 12.7 12.7 12.7 12.7 12.7 12.7 12.7
Proxy labour 81.7 - -0.3 -1.5 -11.0 -20.9 -35.1 -57.0 -64.7 -81.7 -81.7 -81.7 -81.7 -81.7 -81.7 -81.7 -81.7 -81.7 -81.7 -81.7 -81.7
Sub-total Main Production 5,189.2 6,697.2 2.0 50.7 190.3 453.1 621.3 984.9 1,298.3 1,773.9 2,177.6 1,461.4 1,518.4 1,509.2 1,529.5 1,513.5 1,511.1 1,515.5 1,505.6 1,513.1 1,508.0
Production Cost
Investment
Purchased Inputs
Sub-Total Purchased Inputs - 233.6 1.9 6.4 63.3 111.5 228.6 320.2 260.7 333.0 233.5 239.5 231.8 233.8 258.9 269.3 258.0 301.5 271.2 319.3 233.6
Labor
Labour - 0.8 - 0.0 0.0 0.0 0.1 0.1 0.1 0.8 0.8 0.8 0.8 0.8 0.8 0.8 0.8 0.8 0.8 0.8 0.8
Sub-total Investment Costs - 234.3 1.9 6.4 63.3 111.5 228.7 320.3 260.9 333.7 234.2 240.2 232.5 234.5 259.7 270.0 258.8 302.3 272.0 320.1 234.3
Operating
Purchased Inputs
Seed and planting materials 708.5 598.2 0.0 0.5 1.5 3.5 3.7 -30.5 -42.0 -41.7 -98.9 -110.3 -110.3 -110.3 -110.3 -110.3 -110.3 -110.3 -110.3 -110.3 -110.3
Fertilisers 1,291.6 1,155.2 0.1 2.6 8.5 17.2 15.8 -26.0 -41.2 -29.8 -92.7 -136.4 -136.4 -136.4 -136.4 -136.4 -136.4 -136.4 -136.4 -136.4 -136.4
Tractors/Bulloks 2,005.3 2,057.2 0.4 4.6 21.0 32.2 36.3 41.2 46.9 51.9 51.9 51.9 51.9 51.9 51.9 51.9 51.9 51.9 51.9 51.9 51.9
Milk collection centre - 70.4 0.4 1.4 9.2 18.5 26.0 43.2 51.6 70.4 70.4 70.4 70.4 70.4 70.4 70.4 70.4 70.4 70.4 70.4 70.4
Livestock - 188.4 1.0 3.8 24.5 49.5 69.7 115.7 138.2 188.4 188.4 188.4 188.4 188.4 188.4 188.4 188.4 188.4 188.4 188.4 188.4
Sub-Total Purchased Inputs 4,005.4 4,069.4 1.8 12.9 64.7 120.8 151.6 143.7 153.5 239.1 119.1 64.0 64.0 64.0 64.0 64.0 64.0 64.0 64.0 64.0 64.0
Labor
Labour 2,540.3 2,549.5 0.7 6.9 31.3 48.9 62.1 47.4 36.4 37.3 13.1 9.2 9.2 9.2 9.2 9.2 9.2 9.2 9.2 9.2 9.2
Sub-total Operating Costs 6,545.7 6,618.9 2.5 19.8 96.0 169.7 213.7 191.1 189.9 276.4 132.2 73.2 73.2 73.2 73.2 73.2 73.2 73.2 73.2 73.2 73.2
Sub-Total Production Cost 6,545.7 6,853.2 4.4 26.2 159.3 281.2 442.4 511.4 450.7 610.2 366.4 313.5 305.7 307.7 332.9 343.3 332.0 375.5 345.2 393.3 307.5
Other Costs
Project Investment cost - - 41.8 105.0 643.9 429.2 516.8 597.8 603.3 674.3 1,183.9 - - - - - - - - - -
OUTFLOWS 6,545.7 6,853.2 46.2 131.2 803.2 710.5 959.2 1,109.2 1,054.1 1,284.5 1,550.3 313.5 305.7 307.7 332.9 343.3 332.0 375.5 345.2 393.3 307.5
Cash Flow -1,356.4 -156.0 -44.3 -80.5 -612.9 -257.4 -337.8 -124.3 244.3 489.4 627.3 1,148.0 1,212.7 1,201.4 1,196.6 1,170.3 1,179.1 1,140.0 1,160.4 1,119.8 1,200.4
_________________________________
IRR = 27.8%, NPV = 3,568.22

16
Annex-1.6: Project incremental Labour
India
C-AIM PCR, Maharashtra
Project Summary
LABOR BUDGET Without
(In Units '000) Project WP Increments
Unit 1 to 20 11 to 20 2 3 4 5 6 7 8 9 10 11 to 20
Labor Requirements
Preparation day 2,130 2,197 1 6 29 45 51 58 65 67 67 67
Sowing/Planting day 1,142 1,181 0 4 17 27 30 34 39 39 39 39
Irrigation day 413 593 0 2 12 19 23 71 92 107 181 181
Fertiliser Application day 946 432 -1 -7 -39 -67 -105 -247 -339 -362 -493 -514
Pesticides application day 577 527 0 1 5 7 8 -9 -15 -20 -50 -50
Weeding day 1,793 1,644 0 3 14 20 23 -27 -44 -61 -149 -149
Harvesting day 2,510 2,816 1 10 47 76 85 116 132 134 307 307
Harvesting_Tomato unit 6 6 - - - - - - - - - -
Threshing day 598 639 0 4 18 28 31 36 40 41 41 41
Maintenance day - 213 1 5 24 43 101 183 199 213 213 213
Transport day 743 765 0 2 10 15 17 19 22 22 22 22
Other day 1,627 1,434 0 2 8 12 17 -52 -78 -66 -192 -192
Application Dung day - 2 - 0 0 0 0 0 0 2 2 2
Pumping_water day - 2 - 0 0 0 0 0 0 2 2 2
Family day 1,056 1,139 1 5 23 36 52 72 80 84 84 84
Sub-Total Labor Requirements 13,539 13,592 4 37 167 261 332 254 194 203 74 53

17
Annex-1.7: Project incremental “financial benefit stream” and household incomes
India
C-AIM PCR, Maharashtra
Project Summary
FINANCIAL BUDGET (AGGREGATED)
(In INR Million) WOP WP Increments
20 20 2 3 4 5 6 7 8 9 10 11 12 13 14 15 16 17 18 19 20
Main Production
Annual crops 6,336.8 7,749.1 2.5 62.4 229.4 518.1 650.3 1,003.3 1,316.7 1,887.3 2,260.8 1,358.8 1,412.3 1,412.3 1,412.3 1,412.3 1,412.3 1,412.3 1,412.3 1,412.3 1,412.3
Livestock and Fisheries - 757.3 0.4 4.6 27.8 108.1 211.5 355.7 497.6 559.5 763.0 755.3 771.1 758.8 784.2 764.3 761.3 766.8 754.4 763.8 757.3
Enterprises - 151.4 - - 1.2 7.1 41.7 61.2 90.1 114.5 134.3 148.7 150.7 151.4 151.4 151.4 151.4 151.4 151.4 151.4 151.4
Vegetables 47.6 63.5 - 0.1 0.2 4.7 9.1 11.6 14.2 14.8 15.9 15.9 15.9 15.9 15.9 15.9 15.9 15.9 15.9 15.9 15.9
Proxy labour 108.9 - -0.5 -2.0 -14.6 -27.8 -46.9 -76.0 -86.2 -108.9 -108.9 -108.9 -108.9 -108.9 -108.9 -108.9 -108.9 -108.9 -108.9 -108.9 -108.9
Sub-total Main Production 6,493.4 8,721.3 2.4 65.0 244.0 610.2 865.6 1,355.8 1,832.4 2,467.2 3,065.1 2,169.8 2,241.1 2,229.5 2,254.9 2,235.0 2,231.9 2,237.4 2,225.1 2,234.4 2,228.0
Production Cost
Investment
Purchased Inputs
Sub-Total Purchased Inputs - 292.3 2.4 8.0 79.1 139.4 285.8 400.3 326.3 416.5 292.1 299.7 290.0 292.5 324.0 337.0 322.9 377.3 339.6 399.5 292.3
Labor
Labour - 1.0 - 0.0 0.0 0.0 0.1 0.2 0.2 1.0 1.0 1.0 1.0 1.0 1.0 1.0 1.0 1.0 1.0 1.0 1.0
Sub-total Investment Costs - 293.3 2.4 8.0 79.2 139.4 285.9 400.5 326.4 417.5 293.2 300.7 291.0 293.5 325.0 338.0 323.9 378.3 340.6 400.5 293.3
Operating
Purchased Inputs
Seed and planting materials 787.2 664.7 0.0 0.6 1.7 3.9 4.1 -33.9 -46.7 -46.4 -109.9 -122.5 -122.5 -122.5 -122.5 -122.5 -122.5 -122.5 -122.5 -122.5 -122.5
Fertilisers 1,291.6 1,155.2 0.1 2.6 8.5 17.2 15.8 -26.0 -41.2 -29.8 -92.7 -136.4 -136.4 -136.4 -136.4 -136.4 -136.4 -136.4 -136.4 -136.4 -136.4
Tractors/Bulloks 2,113.8 2,167.5 0.4 4.8 21.7 33.4 37.6 42.7 48.6 53.6 53.6 53.6 53.6 53.6 53.6 53.6 53.6 53.6 53.6 53.6 53.6
Milk collection centre - 93.9 0.5 1.9 12.2 24.6 34.7 57.6 68.9 93.9 93.9 93.9 93.9 93.9 93.9 93.9 93.9 93.9 93.9 93.9 93.9
Livestock - 235.4 1.2 4.7 30.7 61.8 87.1 144.6 172.7 235.4 235.4 235.4 235.4 235.4 235.4 235.4 235.4 235.4 235.4 235.4 235.4
Sub-Total Purchased Inputs 4,192.6 4,316.7 2.2 14.5 74.8 140.9 179.4 185.1 202.3 306.7 180.4 124.0 124.0 124.0 124.0 124.0 124.0 124.0 124.0 124.0 124.0
Labor
Labour 3,387.1 3,399.3 0.9 9.2 41.7 65.2 82.8 63.2 48.5 49.8 17.5 12.2 12.2 12.2 12.2 12.2 12.2 12.2 12.2 12.2 12.2
Sub-total Operating Costs 7,579.7 7,716.0 3.1 23.7 116.5 206.1 262.2 248.3 250.7 356.5 197.9 136.3 136.3 136.3 136.3 136.3 136.3 136.3 136.3 136.3 136.3
Sub-Total Production Cost 7,579.7 8,009.3 5.5 31.8 195.7 345.5 548.1 648.8 577.1 774.0 491.0 437.0 427.3 429.8 461.3 474.3 460.2 514.6 476.9 536.8 429.6
Other Costs
Project Investment cost - - 41.8 105.0 643.9 429.2 516.8 597.8 603.3 674.3 1,183.9 - - - - - - - - - -
OUTFLOWS 7,579.7 8,009.3 47.3 136.8 839.6 774.7 1,064.9 1,246.6 1,180.5 1,448.4 1,674.9 437.0 427.3 429.8 461.3 474.3 460.2 514.6 476.9 536.8 429.6
Cash Flow Before Financing -1,086.3 712.0 -44.9 -71.7 -595.7 -164.6 -199.3 109.2 651.9 1,018.8 1,390.2 1,732.8 1,813.7 1,799.6 1,793.6 1,760.7 1,771.7 1,722.9 1,748.2 1,697.6 1,798.4
_________________________________ 10911 11420 11331 11293 11086 11156 10848 11008 10689 11323
IRR = 66.0%, NPV = 6,157.79

18
Annex-1.8: Project implementation phasing of activities
India
C-AIM PCR, Maharashtra
Project Summary
CROPPING PATTERNS/ACTIVITY LEVELS
(In Units '000) Increments
Unit 2 3 4 5 6 7 8 9 10 11 to 20
Cropping Pattern
New Technology
Redgram CM ha 0.055 0.678 3.529 7.007 9.671 16.946 22.333 23.646 28.791 28.791
Gram ha 0.055 0.663 3.130 4.997 7.938 12.870 17.920 18.283 18.283 18.283
Soybean ha 0.082 1.009 5.066 9.416 12.963 27.516 36.554 39.919 54.862 54.862
Cotton ha 0.055 0.663 3.020 4.686 5.319 19.254 24.993 29.470 51.527 51.527
Sorghum ha 0.027 0.331 1.565 2.498 3.969 6.435 8.960 9.142 9.142 9.142
Tomato production ha - 0.002 0.004 0.095 0.182 0.233 0.284 0.296 0.318 0.318
Fodder cultivation ha - 0.140 0.350 1.088 1.249 1.634 2.077 3.738 4.205 -
Medicinal Plants ha - - - - - - 0.083 1.095 1.095 1.095
Cotton ha - - 0.024 0.125 0.224 4.687 6.430 7.894 15.242 15.242
Soybean ha - - 0.012 0.063 0.112 0.143 0.191 0.200 0.200 0.200
Gram ha - - 0.008 0.042 0.075 0.095 0.127 0.133 0.133 0.133
Redgram CM ha - - 0.004 0.021 0.037 0.048 0.064 0.067 0.067 0.067
Sub-total New Technology 0.273 3.486 16.713 30.037 41.737 89.859 120.013 133.883 183.864 179.659
Total Cropped Area 0.055 0.663 3.018 4.638 5.228 5.932 6.704 6.842 6.842 6.842
Activity Pattern
New Technology
Household dairy 0.013 0.052 0.339 0.683 0.962 1.597 1.908 2.601 2.601 2.601
Goat Farming 0.010 0.048 0.237 0.428 1.009 1.828 1.993 2.134 2.134 2.134
Backyard poultry - 0.021 1.039 1.786 3.291 4.270 4.407 4.893 4.893 4.893
Pond Fishery - 0.001 0.010 0.010 0.051 0.060 0.060 0.405 0.405 0.405
Milk Collection Centre - - 0.001 0.002 0.003 0.004 0.021 0.022 0.022 0.022
Agri service centres - - - - 0.004 0.008 0.010 0.010 0.010 0.010
FEB - - - - 0.001 0.002 0.013 0.014 0.014 0.014
Common facility centre - - - - - 0.002 0.009 0.027 0.027 0.027
Turmeric processing - - 0.002 0.055 0.062 0.132 0.135 0.137 0.137 0.137
CMRC goat unit - - - - - - - 0.020 0.040 0.063
Mushroom unit - - 0.002 0.034 0.071 0.089 0.089 0.089 0.089 0.089
Dal mill - - 0.003 0.017 0.033 0.046 0.046 0.049 0.049 0.049
SPARC units - - - - 1.142 1.189 1.231 1.243 1.243 1.243

19
Annex-1.9: Prices used in the EFA, (as prevailed in May 2019) a/
India
C-AIM PCR, Maharashtra
ECONOMIC AND FINANCIAL PRICES
(In INR) July -- June
Unit ECONOMIC FINANCIAL
Outputs
Annual crops
Sorghum ton 15,600 19,500
Millet ton 17,600 22,000
Soybean ton 28,640 35,800
Soybean seeds kg 34,000 42,500
Blackgram ton 37,800 47,250
Redgram ton 39,600 49,500
Greengram ton 44,800 56,000
PigeonPea ton 45,600 57,000
Gram ton 15,240 19,050
Fodder ton 2,400 3,000
Safflower ton 36,080 45,100
Cotton Bunni ton 50,400 63,000
Cotton desi ton 46,400 58,000
Cotton kg 38.4 48
Medicinal Plants kg 8 10
Byproducts kg 8 10
Seed_Soybean ton 30,837.6 38,547
Livestock and Fisheries
Household dairy Milk litre 4.2 42
Sale of manure ton 800 1,000
Goat each 4,400 5,500
Buck /a No 5,200 6,500
Does /b each 4,400 5,500
Kids /c each 2,560 3,200
Fish_AM kg 200 250
Sale of culled birds INR 96 120
Sale of culled birds_AM kg 160 200
Sale of eggs INR 4 5
Enterprises
Common facility centers /d INR 291,520 364,400
Milk Collection centre /e INR 69,120 86,400
Turmeric Processing unit /f INR 128,800 161,000
Dal mills INR 648,000 810,000
Bee honey /g unit 22,400 28,000
Mushroom, dry /h INR 104,000 130,000
CMRC goat unit /i unit 346,632 433,290
SHG fodder cultivation ton 2,400 3,000
Agriculture service centrs year 597,769.6 747,212
Farm equipment bank year 275,219.2 344,024
SPARC_Thresure unit 40,000 50,000
SPARC_Rotavator unit 24,000 30,000
SPARC_Harrowing unit 5,600 7,000
SPARC_BBF Planter unit 12,000 15,000
SPARC_Plough unit 16,000 20,000
SPARC_Land Levellar unit 4,800 6,000
Vegetables
Tomato kg 10 12.5
Proxy labour
Proxy labour under WOP pers_days 187.5 250

20
India
C-AIM PCR, Maharashtra
ECONOMIC AND FINANCIAL PRICES
(In INR) July -- June
Unit ECONOMIC FINANCIAL
Inputs
Seed and planting materials
Planting material_MP kg 36 40
Sorghum kg 22.5 25
Tomato kg 11,250 12,500
Treatment unit 63 70
Wire for support kg 54 60
Bamboo /j unit 18 20
Cotton kg 1,800 2,000
Soybean kg 54 60
Soybean kg 38.25 42.5
Redgram kg 44.55 49.5
Blackgram kg 108 120
Green Gram kg 126 140
Seed_Soybean kg 54 60
Pigeon Pea kg 63 70
Gram kg 63 70
Millet kg 54 60
Cotton kg 1,215 1,350
Cotton Desi kg 108 120
Fodder planting materials kg 540 600
Fertilisers
Nitrogen Fert kg 6 6
N Fert_SOY kg 30 30
N Fert_Redgram kg 35.04 35.04
N Fert_MP kg 240 240
N Fert_SoybeanSeed kg 60 60
Fert_Tomato kg 21.22 21.22
P Fert kg 5 5
P Fert_SOY kg 75 75
P Fert_Redgram kg 41.09 41.09
P FERT_MP kg 120 120
P Fert_Soybean Seed kg 42.67 42.67
P Fert_Tomato kg 44.66 44.66
Potash kg 19 19
K Fert_SOY kg 30 30
K Fert_ Redgram kg 19.85 19.85
K Fert_MP kg 120 120
K Fert_Soybean Seed kg 19.97 19.97
K Fert_Tomato kg 2.6 2.6
FYM kg 1 1
Mixed Fertilisers kg 22 22
Menure kg 4 4
PP chemical litre 250 250
Micronutrient ha 6,120 6,120
Bio Fertilizer kg 30 30
Bio Fertilizer_MP lit 2,000 2,000
Bio Fertilizer_TOMATO kg 350 350
Bio Pesticides lit 2,000 2,000
BIO_Pesticides_Tomato kg 300 300
Spray n. 1,000 1,000
FYM_COTTON ton 1,000 1,000
FYM_SOY ton 1,000 1,000
FYM_TOMATO ton 1,000 1,000
Pesticides lit 1,000 1,000
Urea ha 9,730 9,730

21
Inputs
Tractors/Bulloks
Tractor services hr 1,500 2,000
Tractor ploughing hr 800 800
Bullock pair 300 400
Bullock_Soybean Seed pair 416.37 555.16
Water_Pumping hr 200 200
Live hedges ha 2,000 2,000
SPARC UNIT
Thresure_BC unit 144,000 180,000
Rotavator_BC unit 50,400 63,000
Harrowing_BC unit 12,000 15,000
BBF Planter_BC unit 24,960 31,200
Plough_BC unit 31,200 39,000
Land Levellar_BC unit 12,960 16,200
Thresure_PC unit 96,000 120,000
Rotavator_PC unit 33,600 42,000
Harrowing_PC unit 8,000 10,000
BBF Planter_PC unit 16,640 20,800
Plough_PC unit 20,800 26,000
Land Levellar_PC unit 8,640 10,800
Milk collection centre
MCC Shed No 7,500 10,000
MCC Equipment /k set 131,250 175,000
Annual rent INR 4,500 6,000
Electricity charges INR 2,700 3,600
Transport charges INR 2,700 3,600
Milk purchase litre 27 36
Salary and wages INR/year 9,000 12,000
Miscellaneous costs INR/year 4,500 6,000
MCC Working Capital MCC 37,500 50,000
Vet Care cattle 375 500
Labour day 187.5 250
Family day 0.75 1
Agriculture service centres
Investment unit 1,214,580 1,518,225
Rent year 68,939.2 86,174
Electricity year 47,421.6 59,277
Labour charges year 106,617.6 133,272
Other expences year 51,845.6 64,807
Dal (pulses) processing
Machinery /l INR 240,000 300,000
Construction unit 100,000 125,000
Electrical installation unit 20,000 25,000
Electricity charges INR/year 129,600 162,000
Labour charges INR/year 129,600 162,000
Other costs INR/year 21,600 27,000
Common facility centre
Investment INR 408,000 510,000
Rent inr/year 28,320 35,400
Electricity inr/year 16,720 20,900
Labour charges inr/year 90,080 112,600
Other expences INR/year 11,520 14,400
Turmeric processing
Investment inr 108,000 135,000
Labour INR/year 72,800 91,000
Electricity charges INR/year 2,880 3,600
Rent INR/year 4,800 6,000
Transport INR/year 2,880 3,600
Other charges INR/year 2,880 3,600
farm equipment unit
Investment unit 520,640 650,800
Rent year 0.8 1
Electricity year 0.8 1
Labour charges year 8,980 11,225
Other expences year 86,268.8 107,836
CMRC goat unit
Investment cost /m INR 408,000 510,000
Rent inr/year 14,400 18,000
labour charges inr/year 172,800 216,000
Other costs inr/year 36,000 45,000

22
a/ Source: PMU, Amrawati
India
C-AIM PCR, Maharashtra
ECONOMIC AND FINANCIAL PRICES
(In INR) July -- June
Unit ECONOMIC FINANCIAL
Inputs
Mushroom production
Investment cost INR 7,280 9,100
crop waste INR/year 4,800 6,000
Spawn INR/year 16,000 20,000
Plastic bags INR/year 3,600 4,500
Fungicides unit 1,920 2,400
Labour charges INR/year 11,952 14,940
Other costs INR/year 4,800 6,000
SHG fodder cultivation
Pre-harvest charges /o inr/ha/year 15,800 19,750
seed /p unit 11,856 14,820
Urea INR/ha 7,784 9,730
seed treatment inr/ha 2,000 2,500
Harvest charges inr 7,904 9,880
transport to market inr/year 32,000 40,000
Livestock
Dairy Cattle each 48,000 60,000
Cattle shed INR/shed 10,400 13,000
Concentrate kg 16 20
DryFodder kg 4.8 6
Green Fodder kg 2.4 3
Feed and fodder INR/year 3,200 4,000
Purchase of Goat goat 3,840 4,800
Purchase of Buck buck 5,200 6,500
Manure_goat ton 800 1,000
Manure, cattle ton 800 1,000
Goat shed unit 6,400 8,000
Insurance cattle 528 660
Insurance, goat goat 96 120
Goat Unit /q INR 40,000 50,000
Goat medicine /r goat 80 100
Poultry Shed unit 1,920 2,400
Poultry_Birds unit 20 25
Poultry_Feed kg 9.6 12
Vaccination unit 8 10
Backyard poultry
Purchase of birds /s INR 96 120
Cockeral bird 240 300
Poultry shed INR 1,600 2,000
Poultry feed /t INR 5,100 6,375
vet services INR 8 10
Insurance INR/unit/yera 464 580
Labour charges /u INR 10,000 12,500
Other costs INR 2,000 2,500
Chick mortality /v INR 240 300
Fisheries
Harvesting fish per day 187.5 250
Watch and ward pers_day 187.5 250
Fishery_AM
Fingerlings # 3.75 5
Liming kg 11.25 15
Cake kg 30 40
Fish Feed kg 30 40
Applying Bleaching powder kg 18.75 25
Cattle Dung kg 7.5 10
Labor
Preparation day 187.5 250
Pitting day 187.5 250
Staking day 187.5 250
Pruning /w day 187.5 250
Sowing/Planting day 187.5 250
Irrigation day 187.5 250
Fertiliser Application day 187.5 250
Pesticides application day 187.5 250
Weeding day 187.5 250
Harvesting day 187.5 250
Harvesting_Tomato /x unit 450 600
Threshing day 187.5 250
Maintenance day 187.5 250
Transport day 187.5 250
Other day 187.5 250
Application Dung day 187.5 250
Pumping_water day 187.5 250
Family /y day 187.5 250

23
SUBPROJECT MODELS
Annex-2.1 Agricultural crops sub-projects (economic)
India
C-AIM PCR, Maharashtra
Annual Crops Subproject Model
ECONOMIC BUDGET (DETAILED)
(In INR '000) WOP WP Increments
1 to 20 12 to 20 2 3 4 5 6 7 8 9 10 11 12 to 20
Main Production
Sorghum 228,174.3 278,087.5 68.1 907.8 4,888.5 10,875.0 17,311.6 27,825.1 41,436.4 49,374.3 49,913.1 49,913.1 49,913.1
Soybean 1,419,269.7 1,814,084.4 211.1 2,744.0 15,152.0 36,600.2 65,388.2 121,715.2 180,634.2 246,570.6 316,737.5 352,035.1 394,814.7
Redgram 1,074,760.0 1,428,454.9 1,081.1 13,271.7 64,874.7 115,577.4 148,016.8 227,149.8 288,348.4 302,764.3 353,694.9 353,694.9 353,694.9
Gram 91,412.0 123,921.3 199.7 2,423.5 11,138.1 17,343.2 21,057.4 26,286.8 31,842.7 32,509.3 32,509.3 32,509.3 32,509.3
Fodder 756,900.0 756,900.0 - 25,200.0 63,000.0 195,840.0 224,820.0 294,120.0 373,860.0 672,840.0 756,900.0 - -
Cotton 1,498,944.4 1,744,869.0 440.3 5,344.9 24,481.6 38,235.2 43,655.2 105,522.7 133,235.8 152,779.0 245,924.6 245,924.6 245,924.6
Medicinal Plants - 52,560.0 - - - - - - 3,984.0 52,560.0 52,560.0 52,560.0 52,560.0
Byproducts - 438.0 - - - - - - 33.2 438.0 438.0 438.0 438.0
Tomato 38,100.0 50,800.0 - 60.0 160.0 3,780.0 7,260.0 9,300.0 11,360.0 11,820.0 12,700.0 12,700.0 12,700.0
Sub-total Main Production 5,107,560.5 6,250,115.1 2,000.3 49,952.0 183,694.9 418,250.9 527,509.2 811,919.6 1,064,734.6 1,521,655.6 1,821,377.4 1,099,775.0 1,142,554.6
Production Cost
Purchased Inputs
Sub-Total Purchased Inputs 4,005,368 3,810,643 488 7,739 30,996 52,900 55,829 -15,242 -36,319 -19,648 -139,658 -194,725 -194,725
Labor
Sub-Total Hired Labor 2,540,308 2,457,817 471 5,830 25,704 38,184 37,577 627 -14,964 -23,623 -78,550 -82,492 -82,492
Sub-Total Production Cost 6,545,676 6,268,459 959 13,569 56,700 91,084 93,406 -14,615 -51,282 -43,271 -218,208 -277,217 -277,217
OUTFLOWS 6,545,676 6,268,459 959 13,569 56,700 91,084 93,406 -14,615 -51,282 -43,271 -218,208 -277,217 -277,217
Cash Flow -1,438,116 -18,344 1,041 36,383 126,995 327,167 434,104 826,534 1,116,017 1,564,926 2,039,585 1,376,992 1,419,772
_________________________________
IRR = None, NPV = 8,273,354.61

24
Annex-2.2 Agricultural crops sub-project, financial
India
C-AIM PCR, Maharashtra
Annual Crops Subproject Model
FINANCIAL BUDGET (DETAILED) July -- June
(In INR '000) WOP WP Increments
12 to 19 20 2 3 4 5 6 7 8 9 10 11 12 to 19 20
Main Production
Sorghum 347,609.3 347,609.3 85.2 1,134.8 6,110.6 13,593.7 21,639.5 34,781.4 51,795.5 61,717.9 62,391.4 62,391.4 62,391.4 62,391.4
Soybean 2,267,605.5 2,267,605.5 263.9 3,430.0 18,940.0 45,750.2 81,735.2 152,144.0 225,792.7 308,213.3 395,921.8 440,043.9 493,518.3 493,518.3
Redgram 1,785,568.6 1,785,568.6 1,351.4 16,589.6 81,093.4 144,471.8 185,021.0 283,937.3 360,435.5 378,455.4 442,118.6 442,118.6 442,118.6 442,118.6
Gram 154,901.6 154,901.6 249.6 3,029.4 13,922.7 21,678.9 26,321.8 32,858.5 39,803.3 40,636.7 40,636.7 40,636.7 40,636.7 40,636.7
Fodder 946,125.0 946,125.0 - 31,500.0 78,750.0 244,800.0 281,025.0 367,650.0 467,325.0 841,050.0 946,125.0 - - -
Cotton 2,181,086.2 2,181,086.2 550.4 6,681.2 30,602.0 47,794.0 54,568.9 131,903.4 166,544.7 190,973.8 307,405.7 307,405.7 307,405.7 307,405.7
Medicinal Plants 65,700.0 65,700.0 - - - - - - 4,980.0 65,700.0 65,700.0 65,700.0 65,700.0 65,700.0
Byproducts 547.5 547.5 - - - - - - 41.5 547.5 547.5 547.5 547.5 547.5
Tomato 63,500.0 63,500.0 - 75.0 200.0 4,725.0 9,075.0 11,625.0 14,200.0 14,775.0 15,875.0 15,875.0 15,875.0 15,875.0
Sub-total Main Production 7,812,643.8 7,812,643.8 2,500.4 62,439.9 229,618.6 522,813.7 659,386.5 1,014,899.5 1,330,918.3 1,902,069.5 2,276,721.7 1,374,718.8 1,428,193.3 1,428,193.3
Production Cost
Purchased Inputs
Sub-Total Purchased Inputs 3,987,362.2 3,987,362.2 502.9 7,962.0 31,918.7 54,445.7 57,543.0 -17,144.6 -39,310.1 -22,576.1 -148,940.6 -205,269.5 -205,269.5 -205,269.5
Labor
Sub-Total Hired Labor 3,277,088.8 3,277,088.8 627.9 7,773.8 34,272.1 50,912.1 50,102.3 835.5 -19,951.5 -31,497.2 -104,732.8 -109,989.0 -109,989.0 -109,989.0
Sub-Total Production Cost 7,264,451.0 7,264,451.0 1,130.8 15,735.8 66,190.7 105,357.8 107,645.2 -16,309.2 -59,261.6 -54,073.3 -253,673.4 -315,258.5 -315,258.5 -315,258.5
OUTFLOWS 7,264,451.0 7,264,451.0 1,130.8 15,735.8 66,190.7 105,357.8 107,645.2 -16,309.2 -59,261.6 -54,073.3 -253,673.4 -315,258.5 -315,258.5 -315,258.5
Cash Flow Before Financing 548,192.8 548,192.8 1,369.6 46,704.1 163,427.9 417,455.8 551,741.3 1,031,208.6 1,390,179.8 1,956,142.8 2,530,395.1 1,689,977.3 1,743,451.8 1,743,451.8
_________________________________
IRR = None, NPV = 8,860,944.54

25
Annex-2.3 Livestock households subproject, economic
India
C-AIM PCR, Maharashtra
Livestock & fishery Subproject Model
ECONOMIC BUDGET (DETAILED) Without
(In INR '000) Project WP Increments
1 to 20 20 2 3 4 5 6 7 8 9 10 11 12 13 14 15 16 17 18 19 20
Main Production
Household dairy Milk - 39,982.6 - 204.4 796.3 5,205.0 10,499.1 14,792.5 24,552.2 29,329.8 39,982.6 39,982.6 39,982.6 39,982.6 39,982.6 39,982.6 39,982.6 39,982.6 39,982.6 39,982.6 39,982.6
Sale of manure - 22,141.6 15.7 171.9 751.5 3,122.2 6,532.6 9,853.5 14,689.1 17,152.0 22,141.6 22,141.6 22,141.6 22,141.6 22,141.6 22,141.6 22,141.6 22,141.6 22,141.6 22,141.6 22,141.6
Buck - 3,024.8 - - 51.0 196.6 982.8 993.7 3,075.8 4,453.8 1,841.8 1,725.4 3,075.8 4,453.8 1,841.8 1,725.4 3,075.8 4,453.8 1,841.8 1,725.4 3,024.8
Does - 13,717.0 43.1 252.6 1,207.4 2,756.6 5,448.5 11,477.8 13,380.0 13,550.7 14,661.2 13,673.9 15,326.5 13,683.1 17,045.2 14,725.9 14,169.8 14,618.1 13,550.7 14,661.2 13,717.0
Kids - 79,808.0 250.9 1,469.4 7,024.6 16,038.4 31,700.5 66,780.2 77,847.0 78,840.3 85,301.8 79,557.1 89,172.5 79,610.9 99,171.8 85,678.1 82,442.2 85,050.9 78,840.3 85,301.8 79,808.0
Fish_AM - 72,900.0 - - 180.0 1,800.0 1,800.0 9,180.0 10,800.0 10,800.0 72,900.0 72,900.0 72,900.0 72,900.0 72,900.0 72,900.0 72,900.0 72,900.0 72,900.0 72,900.0 72,900.0
Sale of culled birds - 15,501.0 - 50.4 2,507.2 4,986.5 9,197.6 12,630.8 13,762.6 15,114.8 15,454.4 15,501.0 15,501.0 15,501.0 15,501.0 15,501.0 15,501.0 15,501.0 15,501.0 15,501.0 15,501.0
Sale of eggs - 78,914.3 - 66.5 4,134.2 15,969.8 29,506.1 55,292.4 68,093.1 73,040.3 78,228.7 78,914.3 78,914.3 78,914.3 78,914.3 78,914.3 78,914.3 78,914.3 78,914.3 78,914.3 78,914.3
Proxy labour under WOP 81,682.7 - -341.3 -1,469.4 -10,951.1 -20,881.3 -35,149.4 -56,974.7 -64,659.6 -81,682.7 -81,682.7 -81,682.7 -81,682.7 -81,682.7 -81,682.7 -81,682.7 -81,682.7 -81,682.7 -81,682.7 -81,682.7 -81,682.7
Sub-total Main Production 81,682.7 325,989.3 -31.6 745.9 5,701.1 29,193.7 60,517.8 124,026.2 161,540.1 160,599.0 248,829.5 242,713.2 255,331.6 245,504.6 265,815.7 249,886.2 247,444.6 251,879.6 241,989.7 249,445.2 244,306.7
Production Cost
Investment
Purchased Inputs
Sub-Total Purchased Inputs - 79,639.7 1,911.4 6,403.7 56,960.5 73,509.4 109,628.3 174,365.1 111,193.3 160,444.8 79,941.5 79,500.6 81,286.5 83,422.0 108,253.2 112,792.5 106,570.1 140,880.4 109,794.7 146,244.0 79,639.7
Labor
Application Dung - 379.7 - 0.9 9.4 9.4 47.8 56.3 56.3 379.7 379.7 379.7 379.7 379.7 379.7 379.7 379.7 379.7 379.7 379.7 379.7
Pumping_water - 379.7 - 0.9 9.4 9.4 47.8 56.3 56.3 379.7 379.7 379.7 379.7 379.7 379.7 379.7 379.7 379.7 379.7 379.7 379.7
Sub-Total Hired Labor - 759.4 - 1.9 18.8 18.8 95.6 112.5 112.5 759.4 759.4 759.4 759.4 759.4 759.4 759.4 759.4 759.4 759.4 759.4 759.4
Sub-total Investment Costs - 80,399.1 1,911.4 6,405.6 56,979.3 73,528.2 109,723.9 174,477.6 111,305.8 161,204.2 80,700.9 80,260.0 82,045.8 84,181.4 109,012.5 113,551.9 107,329.5 141,639.8 110,554.1 147,003.4 80,399.1
Operating
Purchased Inputs
Vet Care - 1,950.8 10.0 38.9 254.0 512.3 721.7 1,197.9 1,431.0 1,950.8 1,950.8 1,950.8 1,950.8 1,950.8 1,950.8 1,950.8 1,950.8 1,950.8 1,950.8 1,950.8 1,950.8
Labour - 68,276.3 349.1 1,359.8 8,888.3 17,928.8 25,260.4 41,926.5 50,085.0 68,276.3 68,276.3 68,276.3 68,276.3 68,276.3 68,276.3 68,276.3 68,276.3 68,276.3 68,276.3 68,276.3 68,276.3
Family - 175.6 0.9 3.5 22.9 46.1 65.0 107.8 128.8 175.6 175.6 175.6 175.6 175.6 175.6 175.6 175.6 175.6 175.6 175.6 175.6
Concentrate - 83,232.0 425.6 1,657.6 10,835.2 21,856.0 30,793.6 51,110.4 61,056.0 83,232.0 83,232.0 83,232.0 83,232.0 83,232.0 83,232.0 83,232.0 83,232.0 83,232.0 83,232.0 83,232.0 83,232.0
DryFodder - 46,193.8 236.2 920.0 6,013.5 12,130.1 17,090.4 28,366.3 33,886.1 46,193.8 46,193.8 46,193.8 46,193.8 46,193.8 46,193.8 46,193.8 46,193.8 46,193.8 46,193.8 46,193.8 46,193.8
Green Fodder - 56,181.6 287.3 1,118.9 7,313.8 14,752.8 20,785.7 34,499.5 41,212.8 56,181.6 56,181.6 56,181.6 56,181.6 56,181.6 56,181.6 56,181.6 56,181.6 56,181.6 56,181.6 56,181.6 56,181.6
Insurance - 2,746.7 14.0 54.7 357.6 721.2 1,016.2 1,686.6 2,014.8 2,746.7 2,746.7 2,746.7 2,746.7 2,746.7 2,746.7 2,746.7 2,746.7 2,746.7 2,746.7 2,746.7 2,746.7
Sub-Total Purchased Inputs - 258,756.6 1,323.1 5,153.2 33,685.1 67,947.2 95,733.0 158,895.0 189,814.5 258,756.6 258,756.6 258,756.6 258,756.6 258,756.6 258,756.6 258,756.6 258,756.6 258,756.6 258,756.6 258,756.6 258,756.6
Labor
Sub-Total Hired Labor - 91,679.1 220.5 1,089.8 5,600.1 10,701.4 24,558.4 46,799.4 51,318.0 60,952.5 91,679.1 91,679.1 91,679.1 91,679.1 91,679.1 91,679.1 91,679.1 91,679.1 91,679.1 91,679.1 91,679.1
Sub-total Operating Costs - 350,435.6 1,543.6 6,243.0 39,285.2 78,648.6 120,291.3 205,694.5 241,132.5 319,709.1 350,435.6 350,435.6 350,435.6 350,435.6 350,435.6 350,435.6 350,435.6 350,435.6 350,435.6 350,435.6 350,435.6
Sub-Total Production Cost - 430,834.7 3,455.0 12,648.6 96,264.4 152,176.8 230,015.3 380,172.1 352,438.3 480,913.3 431,136.5 430,695.6 432,481.5 434,617.0 459,448.2 463,987.5 457,765.1 492,075.4 460,989.8 497,439.0 430,834.7
OUTFLOWS - 430,834.7 3,455.0 12,648.6 96,264.4 152,176.8 230,015.3 380,172.1 352,438.3 480,913.3 431,136.5 430,695.6 432,481.5 434,617.0 459,448.2 463,987.5 457,765.1 492,075.4 460,989.8 497,439.0 430,834.7
Cash Flow 81,682.7 -104,845.4 -3,486.6 -11,902.7 -90,563.3 -122,983.1 -169,497.4 -256,145.9 -190,898.2 -320,314.3 -182,307.0 -187,982.4 -177,149.9 -189,112.4 -193,632.5 -214,101.4 -210,320.5 -240,195.8 -219,000.1 -247,993.9 -186,528.1
_________________________________
IRR = None, NPV = -1,471,267.69

26
Annex-2.4 Livestock households subproject financial model
India
C-AIM PCR, Maharashtra
Livestock & fishery Subproject Model
FINANCIAL BUDGET (DETAILED) Without
(In INR '000) Project WP Increments
1 to 20 20 2 3 4 5 6 7 8 9 10 11 12 13 14 15 16 17 18 19 20
Main Production
Household dairy Milk - 399,825.7 - 2,044.5 7,962.7 52,049.6 104,990.8 147,924.8 245,521.6 293,297.8 399,825.7 399,825.7 399,825.7 399,825.7 399,825.7 399,825.7 399,825.7 399,825.7 399,825.7 399,825.7 399,825.7
Sale of manure - 27,677.0 19.6 214.9 939.4 3,902.8 8,165.8 12,316.9 18,361.4 21,440.0 27,677.0 27,677.0 27,677.0 27,677.0 27,677.0 27,677.0 27,677.0 27,677.0 27,677.0 27,677.0 27,677.0
Buck - 3,781.1 - - 63.7 245.7 1,228.5 1,242.2 3,844.8 5,567.3 2,302.3 2,156.7 3,844.8 5,567.3 2,302.3 2,156.7 3,844.8 5,567.3 2,302.3 2,156.7 3,781.1
Does - 17,146.3 53.9 315.7 1,509.2 3,445.8 6,810.7 14,347.3 16,725.0 16,938.4 18,326.6 17,092.4 19,158.2 17,103.9 21,306.5 18,407.4 17,712.2 18,272.7 16,938.4 18,326.6 17,146.3
Kids - 99,760.0 313.6 1,836.8 8,780.8 20,048.0 39,625.6 83,475.2 97,308.8 98,550.4 106,627.2 99,446.4 111,465.6 99,513.6 123,964.8 107,097.6 103,052.8 106,313.6 98,550.4 106,627.2 99,760.0
Fish_AM - 91,125.0 - - 225.0 2,250.0 2,250.0 11,475.0 13,500.0 13,500.0 91,125.0 91,125.0 91,125.0 91,125.0 91,125.0 91,125.0 91,125.0 91,125.0 91,125.0 91,125.0 91,125.0
Sale of culled birds - 19,376.3 - 63.0 3,134.0 6,233.1 11,497.0 15,788.5 17,203.3 18,893.4 19,318.0 19,376.3 19,376.3 19,376.3 19,376.3 19,376.3 19,376.3 19,376.3 19,376.3 19,376.3 19,376.3
Sale of eggs - 98,642.9 - 83.2 5,167.7 19,962.2 36,882.6 69,115.5 85,116.4 91,300.4 97,785.9 98,642.9 98,642.9 98,642.9 98,642.9 98,642.9 98,642.9 98,642.9 98,642.9 98,642.9 98,642.9
Proxy labour under WOP 108,910.3 - -455.0 -1,959.3 -14,601.4 -27,841.8 -46,865.9 -75,966.3 -86,212.9 -108,910.3 -108,910.3 -108,910.3 -108,910.3 -108,910.3 -108,910.3 -108,910.3 -108,910.3 -108,910.3 -108,910.3 -108,910.3 -108,910.3
Sub-total Main Production 108,910.3 757,334.2 -67.9 2,598.8 13,181.1 80,295.4 164,585.1 279,719.0 411,368.3 450,577.4 654,077.4 646,432.1 662,205.1 649,921.4 675,310.2 655,398.3 652,346.4 657,890.1 645,527.7 654,847.1 648,423.9
Production Cost
Investment
Purchased Inputs
Sub-Total Purchased Inputs - 99,778.9 2,389.2 8,005.1 71,205.6 91,891.9 137,061.3 217,987.1 139,025.0 200,760.9 100,134.6 99,605.0 101,837.4 104,506.8 135,545.7 141,219.9 133,441.9 176,329.8 137,472.7 183,034.3 99,778.9
Labor
Application Dung - 506.3 - 1.3 12.5 12.5 63.8 75.0 75.0 506.3 506.3 506.3 506.3 506.3 506.3 506.3 506.3 506.3 506.3 506.3 506.3
Pumping_water - 506.3 - 1.3 12.5 12.5 63.8 75.0 75.0 506.3 506.3 506.3 506.3 506.3 506.3 506.3 506.3 506.3 506.3 506.3 506.3
Sub-Total Hired Labor - 1,012.5 - 2.5 25.0 25.0 127.5 150.0 150.0 1,012.5 1,012.5 1,012.5 1,012.5 1,012.5 1,012.5 1,012.5 1,012.5 1,012.5 1,012.5 1,012.5 1,012.5
Sub-total Investment Costs - 100,791.4 2,389.2 8,007.6 71,230.6 91,916.9 137,188.8 218,137.1 139,175.0 201,773.4 101,147.1 100,617.5 102,849.9 105,519.3 136,558.2 142,232.4 134,454.4 177,342.3 138,485.2 184,046.8 100,791.4
Operating
Purchased Inputs
Vet Care - 2,601.0 13.3 51.8 338.6 683.0 962.3 1,597.2 1,908.0 2,601.0 2,601.0 2,601.0 2,601.0 2,601.0 2,601.0 2,601.0 2,601.0 2,601.0 2,601.0 2,601.0 2,601.0
Labour - 91,035.0 465.5 1,813.0 11,851.0 23,905.0 33,680.5 55,902.0 66,780.0 91,035.0 91,035.0 91,035.0 91,035.0 91,035.0 91,035.0 91,035.0 91,035.0 91,035.0 91,035.0 91,035.0 91,035.0
Family - 234.1 1.2 4.7 30.5 61.5 86.6 143.7 171.7 234.1 234.1 234.1 234.1 234.1 234.1 234.1 234.1 234.1 234.1 234.1 234.1
Concentrate - 104,040.0 532.0 2,072.0 13,544.0 27,320.0 38,492.0 63,888.0 76,320.0 104,040.0 104,040.0 104,040.0 104,040.0 104,040.0 104,040.0 104,040.0 104,040.0 104,040.0 104,040.0 104,040.0 104,040.0
DryFodder - 57,742.2 295.3 1,150.0 7,516.9 15,162.6 21,363.1 35,457.8 42,357.6 57,742.2 57,742.2 57,742.2 57,742.2 57,742.2 57,742.2 57,742.2 57,742.2 57,742.2 57,742.2 57,742.2 57,742.2
Green Fodder - 70,227.0 359.1 1,398.6 9,142.2 18,441.0 25,982.1 43,124.4 51,516.0 70,227.0 70,227.0 70,227.0 70,227.0 70,227.0 70,227.0 70,227.0 70,227.0 70,227.0 70,227.0 70,227.0 70,227.0
Insurance - 3,433.3 17.6 68.4 447.0 901.6 1,270.2 2,108.3 2,518.6 3,433.3 3,433.3 3,433.3 3,433.3 3,433.3 3,433.3 3,433.3 3,433.3 3,433.3 3,433.3 3,433.3 3,433.3
Sub-Total Purchased Inputs - 329,312.6 1,683.9 6,558.4 42,870.1 86,474.6 121,836.8 202,221.5 241,571.9 329,312.6 329,312.6 329,312.6 329,312.6 329,312.6 329,312.6 329,312.6 329,312.6 329,312.6 329,312.6 329,312.6 329,312.6
Labor
Harvesting - 50,625.0 - - 125.0 1,250.0 1,250.0 6,375.0 7,500.0 7,500.0 50,625.0 50,625.0 50,625.0 50,625.0 50,625.0 50,625.0 50,625.0 50,625.0 50,625.0 50,625.0 50,625.0
Maintenance - 53,350.0 245.0 1,190.0 5,915.0 10,692.5 25,235.0 45,702.5 49,832.5 53,350.0 53,350.0 53,350.0 53,350.0 53,350.0 53,350.0 53,350.0 53,350.0 53,350.0 53,350.0 53,350.0 53,350.0
Other - 7,593.8 - 25.0 243.8 187.5 1,212.5 1,181.3 1,125.0 9,750.0 7,593.8 7,593.8 7,593.8 7,593.8 7,593.8 7,593.8 7,593.8 7,593.8 7,593.8 7,593.8 7,593.8
Family - 10,670.0 49.0 238.0 1,183.0 2,138.5 5,047.0 9,140.5 9,966.5 10,670.0 10,670.0 10,670.0 10,670.0 10,670.0 10,670.0 10,670.0 10,670.0 10,670.0 10,670.0 10,670.0 10,670.0
Sub-Total Hired Labor - 122,238.8 294.0 1,453.0 7,466.8 14,268.5 32,744.5 62,399.3 68,424.0 81,270.0 122,238.8 122,238.8 122,238.8 122,238.8 122,238.8 122,238.8 122,238.8 122,238.8 122,238.8 122,238.8 122,238.8
Sub-total Operating Costs - 451,551.4 1,977.9 8,011.4 50,336.9 100,743.1 154,581.3 264,620.7 309,995.9 410,582.6 451,551.4 451,551.4 451,551.4 451,551.4 451,551.4 451,551.4 451,551.4 451,551.4 451,551.4 451,551.4 451,551.4
Sub-Total Production Cost - 552,342.8 4,367.2 16,019.0 121,567.5 192,660.0 291,770.1 482,757.9 449,170.9 612,356.0 552,698.4 552,168.9 554,401.2 557,070.6 588,109.6 593,783.8 586,005.8 628,893.6 590,036.6 635,598.2 552,342.8
OUTFLOWS - 552,342.8 4,367.2 16,019.0 121,567.5 192,660.0 291,770.1 482,757.9 449,170.9 612,356.0 552,698.4 552,168.9 554,401.2 557,070.6 588,109.6 593,783.8 586,005.8 628,893.6 590,036.6 635,598.2 552,342.8
Cash Flow Before Financing 108,910.3 204,991.4 -4,435.1 -13,420.2 -108,386.4 -112,364.6 -127,185.0 -203,038.8 -37,802.7 -161,778.6 101,379.0 94,263.2 107,803.9 92,850.7 87,200.6 61,614.5 66,340.6 28,996.5 55,491.1 19,248.9 96,081.2
_________________________________
IRR = None, NPV = 617,881.97

27
Annex-2.5 Enterprises subproject, economic model
India
C-AIM PCR, Maharashtra
Enterprises Subproject Model July -- June
ECONOMIC BUDGET (DETAILED)
(In INR '000) With Project
4 5 6 7 8 9 10 11 12 13 14 15 16 17 18 19 20
Main Production
Common facility centers - - - - 306.1 1,479.5 4,690.6 6,362.4 7,349.2 7,871.0 7,871.0 7,871.0 7,871.0 7,871.0 7,871.0 7,871.0 7,871.0
Milk Collection centre 12.1 72.6 157.2 205.6 544.3 1,463.6 1,499.9 1,499.9 1,499.9 1,499.9 1,499.9 1,499.9 1,499.9 1,499.9 1,499.9 1,499.9 1,499.9
Turmeric Processing unit - 135.2 3,622.5 5,823.7 11,610.0 14,863.5 16,525.0 17,545.1 17,619.8 17,645.6 17,645.6 17,645.6 17,645.6 17,645.6 17,645.6 17,645.6 17,645.6
Dal mills - 907.2 5,896.8 13,802.4 23,004.0 27,766.8 30,844.8 31,298.4 31,752.0 31,752.0 31,752.0 31,752.0 31,752.0 31,752.0 31,752.0 31,752.0 31,752.0
Mushroom, dry 54.6 1,001.0 3,676.4 6,882.2 8,780.2 9,256.0 9,256.0 9,256.0 9,256.0 9,256.0 9,256.0 9,256.0 9,256.0 9,256.0 9,256.0 9,256.0 9,256.0
CMRC goat unit - - - - - 6,932.6 13,865.3 21,837.8 21,837.8 21,837.8 21,837.8 21,837.8 21,837.8 21,837.8 21,837.8 21,837.8 21,837.8
Agriculture service centrs - - - 1,046.1 3,033.7 4,498.2 5,356.0 5,774.5 5,858.1 5,858.1 5,858.1 5,858.1 5,858.1 5,858.1 5,858.1 5,858.1 5,858.1
Farm equipment bank - - 192.7 578.0 3,467.8 3,853.1 3,853.1 3,853.1 3,853.1 3,853.1 3,853.1 3,853.1 3,853.1 3,853.1 3,853.1 3,853.1 3,853.1
SPARC_Thresure 338.0 1,385.2 7,768.3 8,085.2 8,370.8 8,452.4 8,452.4 8,452.4 8,452.4 8,452.4 8,452.4 8,452.4 8,452.4 8,452.4 8,452.4 8,452.4 8,452.4
SPARC_Rotavator 202.8 831.1 4,661.0 4,851.1 5,022.5 5,071.4 5,071.4 5,071.4 5,071.4 5,071.4 5,071.4 5,071.4 5,071.4 5,071.4 5,071.4 5,071.4 5,071.4
SPARC_Harrowing 47.3 193.9 1,087.6 1,131.9 1,171.9 1,183.3 1,183.3 1,183.3 1,183.3 1,183.3 1,183.3 1,183.3 1,183.3 1,183.3 1,183.3 1,183.3 1,183.3
SPARC_BBF Planter 101.4 415.5 2,330.5 2,425.6 2,511.2 2,535.7 2,535.7 2,535.7 2,535.7 2,535.7 2,535.7 2,535.7 2,535.7 2,535.7 2,535.7 2,535.7 2,535.7
SPARC_Plough 135.2 554.1 3,107.3 3,234.1 3,348.3 3,381.0 3,381.0 3,381.0 3,381.0 3,381.0 3,381.0 3,381.0 3,381.0 3,381.0 3,381.0 3,381.0 3,381.0
SPARC_Land Levellar 35.8 146.7 822.5 856.1 886.3 895.0 895.0 895.0 895.0 895.0 895.0 895.0 895.0 895.0 895.0 895.0 895.0
Sub-total Main Production 927.1 5,642.5 33,322.8 48,921.9 72,057.2 91,632.1 107,409.5 118,946.0 120,544.8 121,092.4 121,092.4 121,092.4 121,092.4 121,092.4 121,092.4 121,092.4 121,092.4
Production Cost
Sub-Total Production Cost 6,330.4 37,985.1 118,967.1 145,850.3 149,556.3 172,514.8 153,517.6 159,980.6 150,464.9 150,331.7 150,665.6 156,484.6 151,444.5 160,667.4 161,433.0 173,067.8 153,926.1
OUTFLOWS 6,330.4 37,985.1 118,967.1 145,850.3 149,556.3 172,514.8 153,517.6 159,980.6 150,464.9 150,331.7 150,665.6 156,484.6 151,444.5 160,667.4 161,433.0 173,067.8 153,926.1
Cash Flow -5,403.3 -32,342.6 -85,644.3 -96,928.3 -77,499.1 -80,882.6 -46,108.2 -41,034.6 -29,920.1 -29,239.3 -29,573.2 -35,392.2 -30,352.1 -39,575.0 -40,340.6 -51,975.4 -32,833.7
_________________________________
IRR = None, NPV = -366,686.99

28
Annex-2.6 Enterprises sub-project financial model (xxx households)
India
C-AIM PCR, Maharashtra
Enterprises Subproject Model July -- June
FINANCIAL BUDGET (DETAILED)
(In INR '000) With Project
4 5 6 7 8 9 10 11 12 13 14 15 16 17 18 19 20
Main Production
Common facility centers - - - - 382.6 1,849.3 5,863.2 7,953.0 9,186.5 9,838.8 9,838.8 9,838.8 9,838.8 9,838.8 9,838.8 9,838.8 9,838.8
Milk Collection centre 15.1 90.7 196.6 257.0 680.4 1,829.5 1,874.9 1,874.9 1,874.9 1,874.9 1,874.9 1,874.9 1,874.9 1,874.9 1,874.9 1,874.9 1,874.9
Turmeric Processing unit - 169.1 4,528.1 7,279.6 14,512.5 18,579.4 20,656.3 21,931.4 22,024.8 22,057.0 22,057.0 22,057.0 22,057.0 22,057.0 22,057.0 22,057.0 22,057.0
Dal mills - 1,134.0 7,371.0 17,253.0 28,755.0 34,708.5 38,556.0 39,123.0 39,690.0 39,690.0 39,690.0 39,690.0 39,690.0 39,690.0 39,690.0 39,690.0 39,690.0
Mushroom, dry 68.3 1,251.3 4,595.5 8,602.8 10,975.3 11,570.0 11,570.0 11,570.0 11,570.0 11,570.0 11,570.0 11,570.0 11,570.0 11,570.0 11,570.0 11,570.0 11,570.0
CMRC goat unit - - - - - 8,665.8 17,331.6 27,297.3 27,297.3 27,297.3 27,297.3 27,297.3 27,297.3 27,297.3 27,297.3 27,297.3 27,297.3
Agriculture service centrs - - - 1,307.6 3,792.1 5,622.8 6,695.0 7,218.1 7,322.7 7,322.7 7,322.7 7,322.7 7,322.7 7,322.7 7,322.7 7,322.7 7,322.7
Farm equipment bank - - 240.8 722.5 4,334.7 4,816.3 4,816.3 4,816.3 4,816.3 4,816.3 4,816.3 4,816.3 4,816.3 4,816.3 4,816.3 4,816.3 4,816.3
SPARC_Thresure 422.5 1,731.5 9,710.4 10,106.5 10,463.5 10,565.5 10,565.5 10,565.5 10,565.5 10,565.5 10,565.5 10,565.5 10,565.5 10,565.5 10,565.5 10,565.5 10,565.5
SPARC_Rotavator 253.5 1,038.9 5,826.2 6,063.9 6,278.1 6,339.3 6,339.3 6,339.3 6,339.3 6,339.3 6,339.3 6,339.3 6,339.3 6,339.3 6,339.3 6,339.3 6,339.3
SPARC_Harrowing 59.1 242.4 1,359.5 1,414.9 1,464.9 1,479.2 1,479.2 1,479.2 1,479.2 1,479.2 1,479.2 1,479.2 1,479.2 1,479.2 1,479.2 1,479.2 1,479.2
SPARC_BBF Planter 126.7 519.4 2,913.1 3,032.0 3,139.1 3,169.7 3,169.7 3,169.7 3,169.7 3,169.7 3,169.7 3,169.7 3,169.7 3,169.7 3,169.7 3,169.7 3,169.7
SPARC_Plough 169.0 692.6 3,884.2 4,042.6 4,185.4 4,226.2 4,226.2 4,226.2 4,226.2 4,226.2 4,226.2 4,226.2 4,226.2 4,226.2 4,226.2 4,226.2 4,226.2
SPARC_Land Levellar 44.7 183.3 1,028.2 1,070.1 1,107.9 1,118.7 1,118.7 1,118.7 1,118.7 1,118.7 1,118.7 1,118.7 1,118.7 1,118.7 1,118.7 1,118.7 1,118.7
Sub-total Main Production 1,158.9 7,053.1 41,653.5 61,152.4 90,071.5 114,540.2 134,261.9 148,682.5 150,681.0 151,365.5 151,365.5 151,365.5 151,365.5 151,365.5 151,365.5 151,365.5 151,365.5
Production Cost
Sub-Total Production Cost 7,924.1 47,507.1 148,730.6 182,338.1 187,240.4 215,761.1 192,007.2 200,085.9 188,191.2 188,024.7 188,449.8 195,731.2 189,423.4 200,952.0 202,092.8 216,452.5 192,517.7
OUTFLOWS 7,924.1 47,507.1 148,730.6 182,338.1 187,240.4 215,761.1 192,007.2 200,085.9 188,191.2 188,024.7 188,449.8 195,731.2 189,423.4 200,952.0 202,092.8 216,452.5 192,517.7
Cash Flow Before Financing -6,765.2 -40,454.0 -107,077.1 -121,185.7 -97,168.9 -101,221.0 -57,745.3 -51,403.4 -37,510.2 -36,659.2 -37,084.3 -44,365.7 -38,058.0 -49,586.5 -50,727.3 -65,087.0 -41,152.2
_________________________________
IRR = None, NPV = -453,863.11

29
AREA MODELS:
Annex-3.1: Soil and water conservation model one ha
India
C-AIM PCR, Maharashtra
Soil and water conservation crop
FINANCIAL BUDGET (AGGREGATED) July -- June
(In INR) /a Without Project With Project Increments
1 to 19 20 1 2 3 to 19 20 1 2 3 to 19 20
Main Production
Annual crops 25,293 25,293 34,452 35,467 36,541 36,541 9,159 10,174 11,248 11,248
Production Cost
Purchased Inputs
Seed and planting materials 2,671 2,671 2,718 2,718 2,718 2,718 47 47 47 47
Fertilisers 3,602 3,602 3,957 3,957 3,957 3,957 355 355 355 355
Tractors/Bulloks 9,840 9,840 11,280 11,280 11,280 11,280 1,440 1,440 1,440 1,440
Sub-Total Purchased Inputs 16,113 16,113 17,955 17,955 17,955 17,955 1,842 1,842 1,842 1,842
Labor
Labour 13,750 13,750 16,050 16,050 16,050 16,050 2,300 2,300 2,300 2,300
Sub-Total Production Cost 29,863 29,863 34,005 34,005 34,005 34,005 4,142 4,142 4,142 4,142
OUTFLOWS 29,863 29,863 34,005 34,005 34,005 34,005 4,142 4,142 4,142 4,142
Cash Flow Before Financing -4,570 -4,570 447 1,462 2,536 2,536 5,017 6,032 7,106 7,106
_________________________________
IRR = None, NPV = 47,086.92
\a one ha model; average landholding 3.9 ha/hh

30
Annex-3.2: Contract farming one ha model
India
C-AIM PCR, Maharashtra
Contract farming crop
FINANCIAL BUDGET (AGGREGATED) July -- June
(In INR) /a Without Project With Project Increments
1 to 19 20 1 2 3 to 19 20 1 2 3 to 19 20
Main Production
Annual crops 40,860 40,860 48,659 49,733 51,523 51,523 7,799 8,873 10,663 10,663
Production Cost
Purchased Inputs
Seed and planting materials 2,623 2,623 2,598 2,598 2,598 2,598 -25 -25 -25 -25
Fertilisers 2,313 2,313 2,018 2,018 2,018 2,018 -295 -295 -295 -295
Tractors/Bulloks 10,000 10,000 10,000 10,000 10,000 10,000 - - - -
Sub-Total Purchased Inputs 14,936 14,936 14,616 14,616 14,616 14,616 -320 -320 -320 -320
Labor
Labour 14,625 14,625 14,000 14,000 14,000 14,000 -625 -625 -625 -625
Sub-Total Production Cost 29,561 29,561 28,616 28,616 28,616 28,616 -945 -945 -945 -945
OUTFLOWS 29,561 29,561 28,616 28,616 28,616 28,616 -945 -945 -945 -945
Cash Flow Before Financing 11,299 11,299 20,042 21,116 22,906 22,906 8,743 9,817 11,607 11,607
_________________________________
IRR = None, NPV = 83,462.41
\a one ha model; average holding 3 ha/hh

31
Annex-3.3: Other annual crops under vegetables one ha model
India
C-AIM PCR, Maharashtra
Other annual crops crop
FINANCIAL BUDGET (AGGREGATED) July -- June
(In INR) /a Without Project With Project Increments
1 to 19 20 1 2 3 to 19 20 1 2 3 to 19
Main Production
Annual crops 17,415 17,415 20,085 20,353 20,801 20,801 2,670 2,938 3,386
Vegetables 75,000 75,000 100,000 100,000 100,000 100,000 25,000 25,000 25,000
Sub-total Main Production 92,415 92,415 120,085 120,353 120,801 120,801 27,670 27,938 28,386
Production Cost
Purchased Inputs
Seed and planting materials 5,124 5,124 4,568 4,568 4,568 4,568 -556 -556 -556
Fertilisers 15,459 15,459 13,885 13,885 13,885 13,885 -1,574 -1,574 -1,574
Tractors/Bulloks 6,900 6,900 6,900 6,900 6,900 6,900 - - -
Sub-Total Purchased Inputs 27,483 27,483 25,353 25,353 25,353 25,353 -2,130 -2,130 -2,130
Labor
Labour 18,094 18,094 17,313 17,313 17,313 17,313 -781 -781 -781
Sub-Total Production Cost 45,577 45,577 42,666 42,666 42,666 42,666 -2,911 -2,911 -2,911
OUTFLOWS 45,577 45,577 42,666 42,666 42,666 42,666 -2,911 -2,911 -2,911
Cash Flow Before Financing 46,838 46,838 77,419 77,687 78,135 78,135 30,581 30,849 31,297
_________________________________
IRR = None, NPV = 235,071.54
\a including vegetables; one ha model and average holding 2 ha/hh

32
Annex-3.4: Medicinal plants
India
C-AIM PCR, Maharashtra
Medicinal plants CROP
FINANCIAL BUDGET (AGGREGATED) July -- June
(In INR) /a Without Project With Project Increments
1 to 19 20 1 2 to 19 20 1 2 to 19 20
Main Production
Annual crops - - 60,500 60,500 60,500 60,500 60,500 60,500
Production Cost
Purchased Inputs
Seed and planting materials - - 8,000 8,000 8,000 8,000 8,000 8,000
Fertilisers 3 3 7,503 7,503 7,503 7,500 7,500 7,500
Tractors/Bulloks - - 4,000 4,000 4,000 4,000 4,000 4,000
Sub-Total Purchased Inputs 3 3 19,503 19,503 19,503 19,500 19,500 19,500
Labor
Labour 26,750 26,750 26,750 26,750 26,750 - - -
Sub-Total Production Cost 26,753 26,753 46,253 46,253 46,253 19,500 19,500 19,500
OUTFLOWS 26,753 26,753 46,253 46,253 46,253 19,500 19,500 19,500
Cash Flow Before Financing -26,753 -26,753 14,247 14,247 14,247 41,000 41,000 41,000
_________________________________
IRR = None, NPV = 290,857.98
\a one ha model; average holding 2.2 ha/hh

33
Annex-3.5: Fodder cultivation
India
C-AIM PCR, Maharashtra
Fodder cultivation crop
FINANCIAL BUDGET (AGGREGATED) July -- June
(In INR) /a Without Project With Project Increments
1 to 19 20 1 2 to 19 20 1 2 to 19 20
Main Production
Annual crops 225,000 225,000 450,000 450,000 450,000 225,000 225,000 225,000
Production Cost
Purchased Inputs
Seed and planting materials 12,000 12,000 15,000 15,000 15,000 3,000 3,000 3,000
Fertilisers 984 984 11,380 11,380 11,380 10,396 10,396 10,396
Tractors/Bulloks 6,000 6,000 6,000 6,000 6,000 - - -
Sub-Total Purchased Inputs 18,984 18,984 32,380 32,380 32,380 13,396 13,396 13,396
Labor
Labour 10,500 10,500 11,750 11,750 11,750 1,250 1,250 1,250
Sub-Total Production Cost 29,484 29,484 44,130 44,130 44,130 14,646 14,646 14,646
OUTFLOWS 29,484 29,484 44,130 44,130 44,130 14,646 14,646 14,646
Cash Flow Before Financing 195,516 195,516 405,870 405,870 405,870 210,354 210,354 210,354
_________________________________
IRR = None, NPV = 1,559,671.34
\a one ha model; average holding 2 ha/hh

34
Annex-3.6: Irrigated crops model one ha
India
C-AIM PCR, Maharashtra
Irrigated crops crop
FINANCIAL BUDGET (AGGREGATED) July -- June
(In INR) Without Project With Project Increments
1 to 19 20 1 2 to 19 20 1 2 to 19 20
Main Production
Annual crops 32,925 32,925 43,689 43,689 43,689 10,764 10,764 10,764
Production Cost
Purchased Inputs
Seed and planting materials 5,785 5,785 4,460 4,460 4,460 -1,325 -1,325 -1,325
Fertilisers 11,031 11,031 9,537 9,537 9,537 -1,494 -1,494 -1,494
Tractors/Bulloks 14,080 14,080 14,080 14,080 14,080 - - -
Sub-Total Purchased Inputs 30,895 30,895 28,076 28,076 28,076 -2,819 -2,819 -2,819
Labor
Labour 24,875 24,875 25,225 25,225 25,225 350 350 350
Sub-Total Production Cost 55,770 55,770 53,301 53,301 53,301 -2,469 -2,469 -2,469
OUTFLOWS 55,770 55,770 53,301 53,301 53,301 -2,469 -2,469 -2,469
Cash Flow Before Financing -22,845 -22,845 -9,612 -9,612 -9,612 13,233 13,233 13,233
IRR = None, NPV = 100,790.83

35
Annex-3.7: Better cotton initiative one ha model
India
C-AIM PCR, Maharashtra
Better cotton initiative crop
FINANCIAL BUDGET (AGGREGATED) July -- June
(In INR) Without Project With Project Increments
1 to 19 20 1 2 3 to 19 20 1 2 3 to 19 20
Main Production
Annual crops 31,896 31,896 36,476 37,121 38,195 38,195 4,580 5,225 6,299 6,299
Production Cost
Purchased Inputs
Seed and planting materials 5,505 5,505 4,180 4,180 4,180 4,180 -1,325 -1,325 -1,325 -1,325
Fertilisers 10,834 10,834 9,457 9,457 9,457 9,457 -1,377 -1,377 -1,377 -1,377
Tractors/Bulloks 12,880 12,880 12,880 12,880 12,880 12,880 - - - -
Sub-Total Purchased Inputs 29,218 29,218 26,516 26,516 26,516 26,516 -2,702 -2,702 -2,702 -2,702
Labor
Labour 21,775 21,775 20,275 20,275 20,275 20,275 -1,500 -1,500 -1,500 -1,500
Sub-Total Production Cost 50,993 50,993 46,791 46,791 46,791 46,791 -4,202 -4,202 -4,202 -4,202
OUTFLOWS 50,993 50,993 46,791 46,791 46,791 46,791 -4,202 -4,202 -4,202 -4,202
Cash Flow Before Financing -19,097 -19,097 -10,315 -9,671 -8,597 -8,597 8,782 9,427 10,501 10,501
_________________________________
IRR = None, NPV = 79,358.93

36
Annex-3.8: Better agronomic practices one ha model
India
C-AIM PCR, Maharashtra
Better agronomic practices crop
FINANCIAL BUDGET (DETAILED) July -- June
(In INR) Without Project With Project Increments
1 to 19 20 1 2 3 to 19 20 1 2 3 to 19 20
Main Production
Sorghum 6,240 6,240 6,864 7,605 7,605 7,605 624 1,365 1,365 1,365
Soybean 12,888 12,888 14,177 15,036 16,468 16,468 1,289 2,148 3,580 3,580
Redgram 14,850 14,850 18,563 18,563 18,563 18,563 3,713 3,713 3,713 3,713
Gram 3,048 3,048 3,353 3,353 3,353 3,353 305 305 305 305
Sub-total Main Production 37,026 37,026 42,956 44,556 45,988 45,988 5,930 7,530 8,962 8,962
Production Cost
Purchased Inputs
Sub-Total Purchased Inputs 18,567 18,567 17,977 17,977 17,977 17,977 -590 -590 -590 -590
Labor
Preparation 3,200 3,200 3,200 3,200 3,200 3,200 - - - -
Sowing/Planting 1,375 1,375 1,375 1,375 1,375 1,375 - - - -
Irrigation 1,125 1,125 1,125 1,125 1,125 1,125 - - - -
Fertiliser Application 1,325 1,325 75 75 75 75 -1,250 -1,250 -1,250 -1,250
Pesticides application 150 150 150 150 150 150 - - - -
Weeding 2,125 2,125 2,125 2,125 2,125 2,125 - - - -
Harvesting 4,650 4,650 4,650 4,650 4,650 4,650 - - - -
Threshing 2,000 2,000 2,000 2,000 2,000 2,000 - - - -
Transport 225 225 225 225 225 225 - - - -
Other 150 150 150 150 150 150 - - - -
Family 3,300 3,300 3,300 3,300 3,300 3,300 - - - -
Sub-Total Hired Labor 19,625 19,625 18,375 18,375 18,375 18,375 -1,250 -1,250 -1,250 -1,250
Sub-Total Production Cost 38,192 38,192 36,352 36,352 36,352 36,352 -1,840 -1,840 -1,840 -1,840
OUTFLOWS 38,192 38,192 36,352 36,352 36,352 36,352 -1,840 -1,840 -1,840 -1,840
Cash Flow Before Financing -1,166 -1,166 6,604 8,204 9,636 9,636 7,770 9,370 10,802 10,802
_________________________________
IRR = None, NPV = 78,291.95
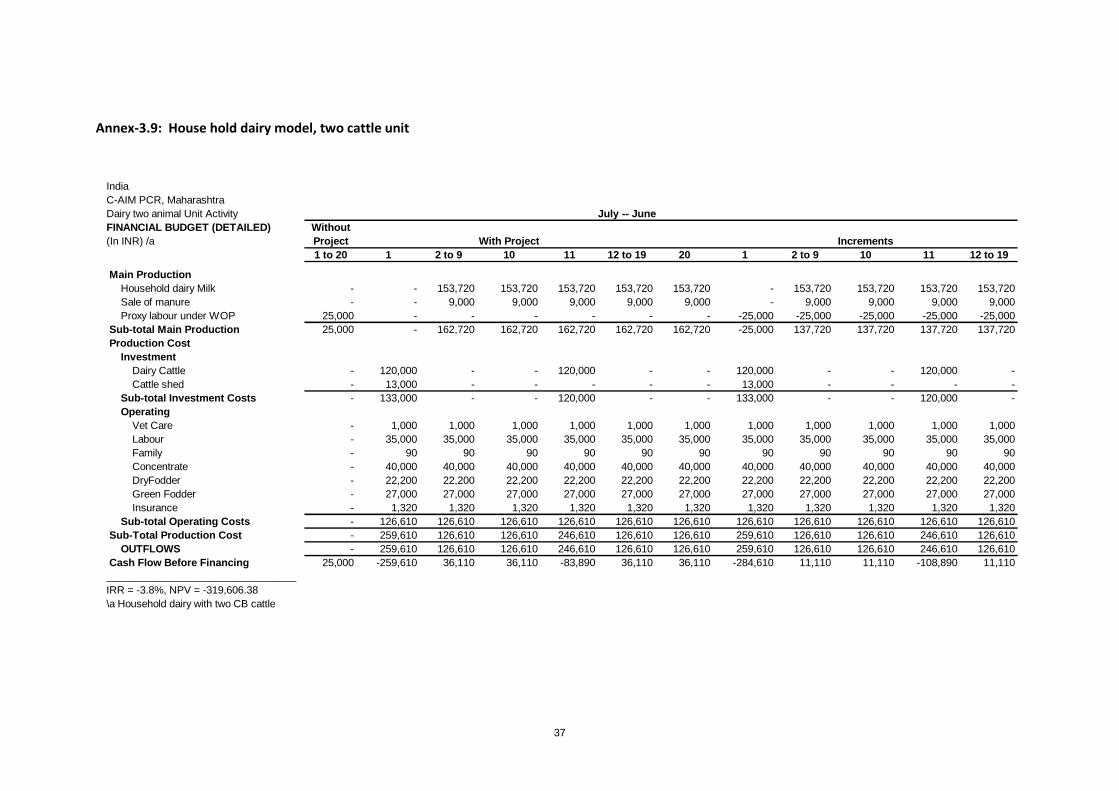
37
Annex-3.9: House hold dairy model, two cattle unit
India
C-AIM PCR, Maharashtra
Dairy two animal Unit Activity July -- June
FINANCIAL BUDGET (DETAILED) Without
(In INR) /a Project With Project Increments
1 to 20 1 2 to 9 10 11 12 to 19 20 1 2 to 9 10 11 12 to 19
Main Production
Household dairy Milk - - 153,720 153,720 153,720 153,720 153,720 - 153,720 153,720 153,720 153,720
Sale of manure - - 9,000 9,000 9,000 9,000 9,000 - 9,000 9,000 9,000 9,000
Proxy labour under WOP 25,000 - - - - - - -25,000 -25,000 -25,000 -25,000 -25,000
Sub-total Main Production 25,000 - 162,720 162,720 162,720 162,720 162,720 -25,000 137,720 137,720 137,720 137,720
Production Cost
Investment
Dairy Cattle - 120,000 - - 120,000 - - 120,000 - - 120,000 -
Cattle shed - 13,000 - - - - - 13,000 - - - -
Sub-total Investment Costs - 133,000 - - 120,000 - - 133,000 - - 120,000 -
Operating
Vet Care - 1,000 1,000 1,000 1,000 1,000 1,000 1,000 1,000 1,000 1,000 1,000
Labour - 35,000 35,000 35,000 35,000 35,000 35,000 35,000 35,000 35,000 35,000 35,000
Family - 90 90 90 90 90 90 90 90 90 90 90
Concentrate - 40,000 40,000 40,000 40,000 40,000 40,000 40,000 40,000 40,000 40,000 40,000
DryFodder - 22,200 22,200 22,200 22,200 22,200 22,200 22,200 22,200 22,200 22,200 22,200
Green Fodder - 27,000 27,000 27,000 27,000 27,000 27,000 27,000 27,000 27,000 27,000 27,000
Insurance - 1,320 1,320 1,320 1,320 1,320 1,320 1,320 1,320 1,320 1,320 1,320
Sub-total Operating Costs - 126,610 126,610 126,610 126,610 126,610 126,610 126,610 126,610 126,610 126,610 126,610
Sub-Total Production Cost - 259,610 126,610 126,610 246,610 126,610 126,610 259,610 126,610 126,610 246,610 126,610
OUTFLOWS - 259,610 126,610 126,610 246,610 126,610 126,610 259,610 126,610 126,610 246,610 126,610
Cash Flow Before Financing 25,000 -259,610 36,110 36,110 -83,890 36,110 36,110 -284,610 11,110 11,110 -108,890 11,110
_________________________________
IRR = -3.8%, NPV = -319,606.38
\a Household dairy with two CB cattle

38
Annex-3.10: Household goat unit
India
C-AIM PCR, Maharashtra
Goat farming Activity July -- June
FINANCIAL BUDGET (DETAILED) Without
(In INR) Project With Project
1 to 20 1 2 3 4 5 6 7 8 9 10 11 12 13 14 15 16 17 18 19 20
Main Production
Sale of manure - 2,000 2,000 2,000 2,000 2,000 2,000 2,000 2,000 2,000 2,000 2,000 2,000 2,000 2,000 2,000 2,000 2,000 2,000 2,000 2,000
Buck - - - 6,500 - - - 6,500 - - - 6,500 - - - 6,500 - - - - -
Does - 5,500 11,000 5,500 11,000 5,500 11,000 5,500 11,000 11,000 5,500 11,000 5,500 11,000 5,500 11,000 5,500 11,000 11,000 11,000 11,000
Kids - 32,000 64,000 32,000 64,000 32,000 64,000 32,000 64,000 64,000 32,000 64,000 32,000 64,000 32,000 64,000 32,000 64,000 64,000 64,000 64,000
Proxy labour under WOP 12,500 - - - - - - - - - - - - - - - - - - - -
Sub-total Main Production 12,500 39,500 77,000 46,000 77,000 39,500 77,000 46,000 77,000 77,000 39,500 83,500 39,500 77,000 39,500 83,500 39,500 77,000 77,000 77,000 77,000
Production Cost
Investment
Feed and fodder - 4,000 4,000 4,000 4,000 4,000 4,000 4,000 4,000 4,000 4,000 4,000 4,000 4,000 4,000 4,000 4,000 4,000 4,000 4,000 4,000
Goat shed - 8,000 - - - - - - - - - - - - - - - - - - -
Insurance, goat - 1,200 2,400 1,200 2,400 1,200 2,400 1,200 2,400 2,400 1,200 2,400 1,200 2,400 1,200 2,400 1,200 2,400 2,400 - -
Goat Unit - 50,000 - - - - - - - - - - - - - - - - - - -
Goat medicine - 100 100 100 100 100 100 100 100 100 100 100 100 100 100 100 100 100 100 100 100
Sub-total Investment Costs - 63,300 6,500 5,300 6,500 5,300 6,500 5,300 6,500 6,500 5,300 6,500 5,300 6,500 5,300 6,500 5,300 6,500 6,500 4,100 4,100
Operating
Maintenance - 25,000 25,000 25,000 25,000 25,000 25,000 25,000 25,000 25,000 25,000 25,000 25,000 25,000 25,000 25,000 25,000 25,000 25,000 25,000 25,000
Family - 5,000 5,000 5,000 5,000 5,000 5,000 5,000 5,000 5,000 5,000 5,000 5,000 5,000 5,000 5,000 5,000 5,000 5,000 5,000 5,000
Sub-total Operating Costs - 30,000 30,000 30,000 30,000 30,000 30,000 30,000 30,000 30,000 30,000 30,000 30,000 30,000 30,000 30,000 30,000 30,000 30,000 30,000 30,000
Sub-Total Production Cost - 93,300 36,500 35,300 36,500 35,300 36,500 35,300 36,500 36,500 35,300 36,500 35,300 36,500 35,300 36,500 35,300 36,500 36,500 34,100 34,100
OUTFLOWS - 93,300 36,500 35,300 36,500 35,300 36,500 35,300 36,500 36,500 35,300 36,500 35,300 36,500 35,300 36,500 35,300 36,500 36,500 34,100 34,100
Cash Flow Before Financing 12,500 -53,800 40,500 10,700 40,500 4,200 40,500 10,700 40,500 40,500 4,200 47,000 4,200 40,500 4,200 47,000 4,200 40,500 40,500 42,900 42,900
_________________________________
IRR = 13.7%, NPV = 10,532.44
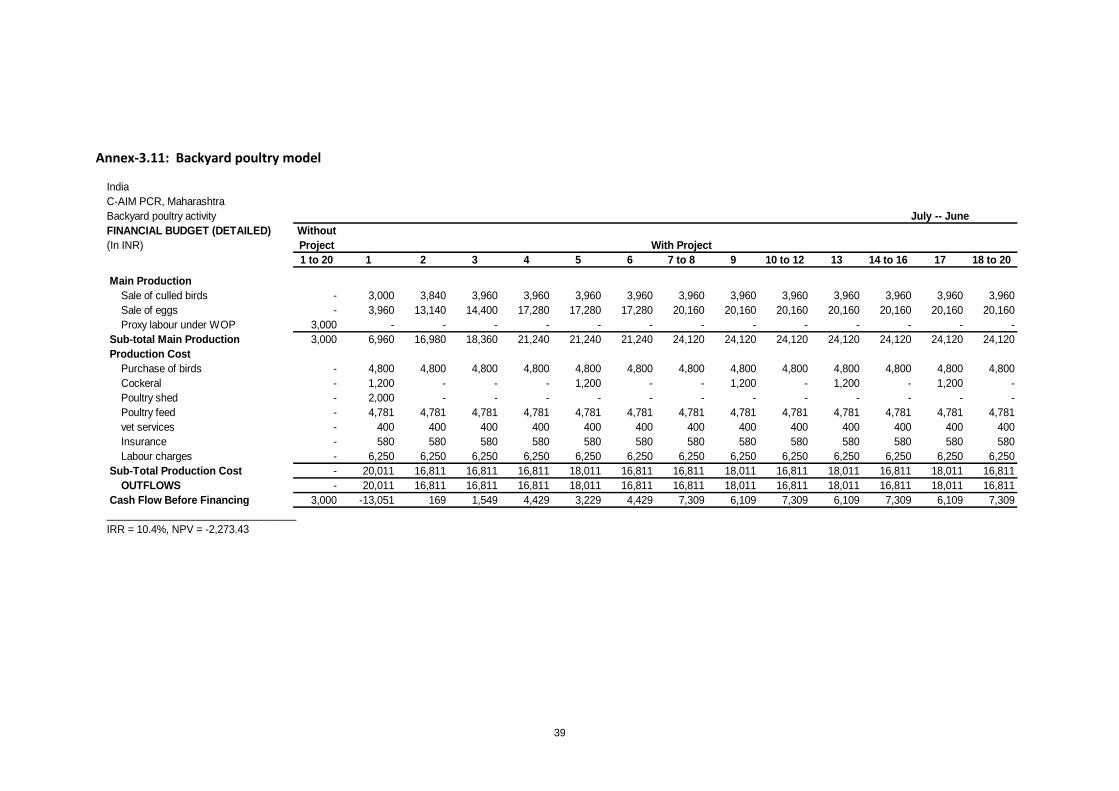
39
Annex-3.11: Backyard poultry model
India
C-AIM PCR, Maharashtra
Backyard poultry activity July -- June
FINANCIAL BUDGET (DETAILED) Without
(In INR) Project With Project
1 to 20 1 2 3 4 5 6 7 to 8 9 10 to 12 13 14 to 16 17 18 to 20
Main Production
Sale of culled birds - 3,000 3,840 3,960 3,960 3,960 3,960 3,960 3,960 3,960 3,960 3,960 3,960 3,960
Sale of eggs - 3,960 13,140 14,400 17,280 17,280 17,280 20,160 20,160 20,160 20,160 20,160 20,160 20,160
Proxy labour under WOP 3,000 - - - - - - - - - - - - -
Sub-total Main Production 3,000 6,960 16,980 18,360 21,240 21,240 21,240 24,120 24,120 24,120 24,120 24,120 24,120 24,120
Production Cost
Purchase of birds - 4,800 4,800 4,800 4,800 4,800 4,800 4,800 4,800 4,800 4,800 4,800 4,800 4,800
Cockeral - 1,200 - - - 1,200 - - 1,200 - 1,200 - 1,200 -
Poultry shed - 2,000 - - - - - - - - - - - -
Poultry feed - 4,781 4,781 4,781 4,781 4,781 4,781 4,781 4,781 4,781 4,781 4,781 4,781 4,781
vet services - 400 400 400 400 400 400 400 400 400 400 400 400 400
Insurance - 580 580 580 580 580 580 580 580 580 580 580 580 580
Labour charges - 6,250 6,250 6,250 6,250 6,250 6,250 6,250 6,250 6,250 6,250 6,250 6,250 6,250
Sub-Total Production Cost - 20,011 16,811 16,811 16,811 18,011 16,811 16,811 18,011 16,811 18,011 16,811 18,011 16,811
OUTFLOWS - 20,011 16,811 16,811 16,811 18,011 16,811 16,811 18,011 16,811 18,011 16,811 18,011 16,811
Cash Flow Before Financing 3,000 -13,051 169 1,549 4,429 3,229 4,429 7,309 6,109 7,309 6,109 7,309 6,109 7,309
_________________________________
IRR = 10.4%, NPV = -2,273.43
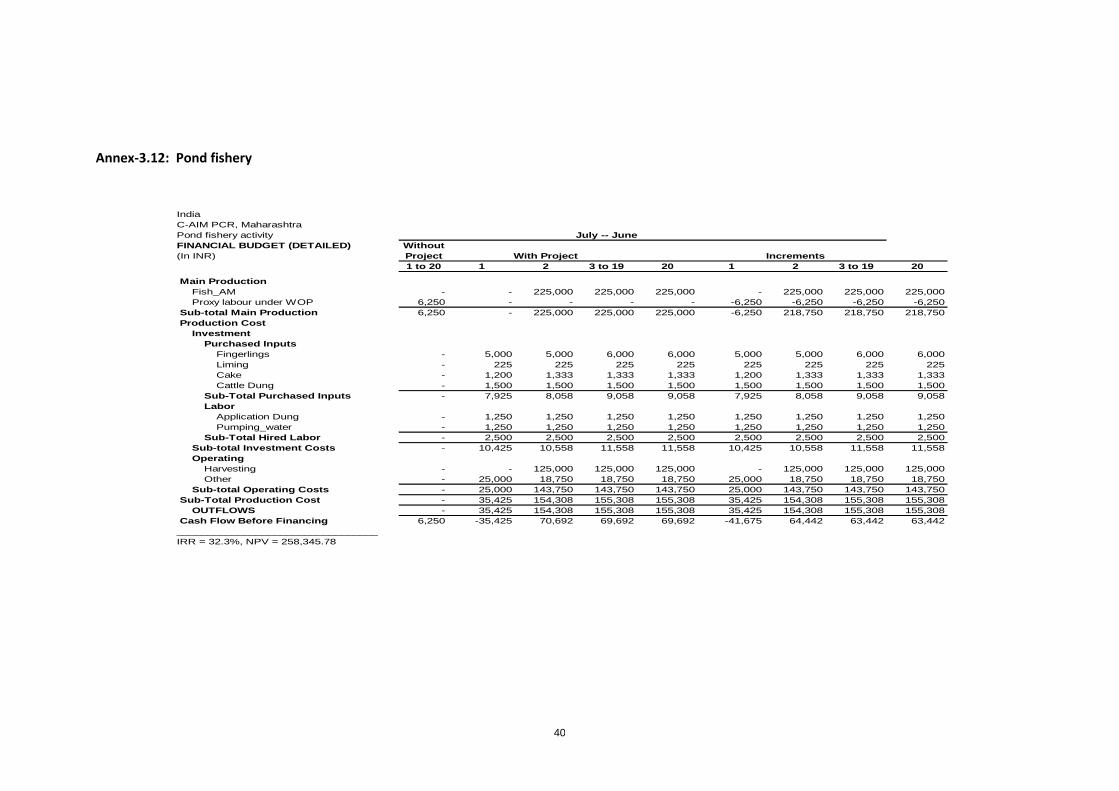
40
Annex-3.12: Pond fishery
India
C-AIM PCR, Maharashtra
Pond fishery activity July -- June
FINANCIAL BUDGET (DETAILED) Without
(In INR) Project With Project Increments
1 to 20 1 2 3 to 19 20 1 2 3 to 19 20
Main Production
Fish_AM - - 225,000 225,000 225,000 - 225,000 225,000 225,000
Proxy labour under WOP 6,250 - - - - -6,250 -6,250 -6,250 -6,250
Sub-total Main Production 6,250 - 225,000 225,000 225,000 -6,250 218,750 218,750 218,750
Production Cost
Investment
Purchased Inputs
Fingerlings - 5,000 5,000 6,000 6,000 5,000 5,000 6,000 6,000
Liming - 225 225 225 225 225 225 225 225
Cake - 1,200 1,333 1,333 1,333 1,200 1,333 1,333 1,333
Cattle Dung - 1,500 1,500 1,500 1,500 1,500 1,500 1,500 1,500
Sub-Total Purchased Inputs - 7,925 8,058 9,058 9,058 7,925 8,058 9,058 9,058
Labor
Application Dung - 1,250 1,250 1,250 1,250 1,250 1,250 1,250 1,250
Pumping_water - 1,250 1,250 1,250 1,250 1,250 1,250 1,250 1,250
Sub-Total Hired Labor - 2,500 2,500 2,500 2,500 2,500 2,500 2,500 2,500
Sub-total Investment Costs - 10,425 10,558 11,558 11,558 10,425 10,558 11,558 11,558
Operating
Harvesting - - 125,000 125,000 125,000 - 125,000 125,000 125,000
Other - 25,000 18,750 18,750 18,750 25,000 18,750 18,750 18,750
Sub-total Operating Costs - 25,000 143,750 143,750 143,750 25,000 143,750 143,750 143,750
Sub-Total Production Cost - 35,425 154,308 155,308 155,308 35,425 154,308 155,308 155,308
OUTFLOWS - 35,425 154,308 155,308 155,308 35,425 154,308 155,308 155,308
Cash Flow Before Financing 6,250 -35,425 70,692 69,692 69,692 -41,675 64,442 63,442 63,442
_________________________________
IRR = 32.3%, NPV = 258,345.78
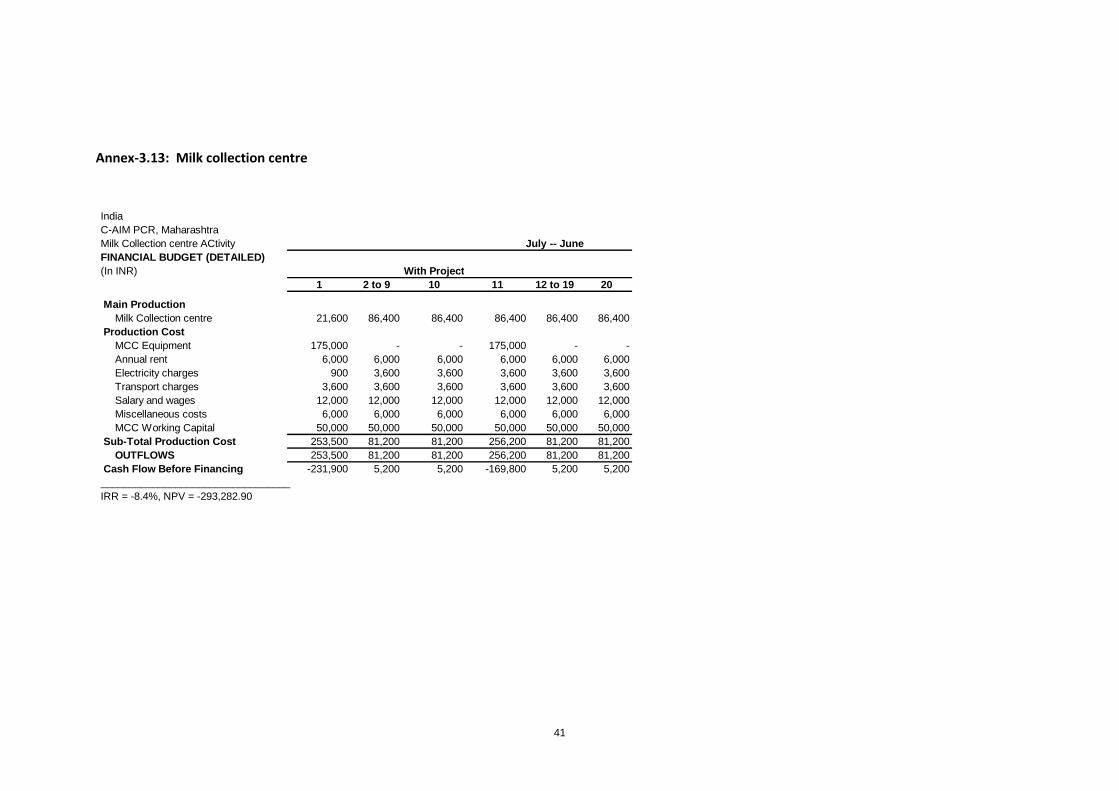
41
Annex-3.13: Milk collection centre
India
C-AIM PCR, Maharashtra
Milk Collection centre ACtivity July -- June
FINANCIAL BUDGET (DETAILED)
(In INR) With Project
1 2 to 9 10 11 12 to 19 20
Main Production
Milk Collection centre 21,600 86,400 86,400 86,400 86,400 86,400
Production Cost
MCC Equipment 175,000 - - 175,000 - -
Annual rent 6,000 6,000 6,000 6,000 6,000 6,000
Electricity charges 900 3,600 3,600 3,600 3,600 3,600
Transport charges 3,600 3,600 3,600 3,600 3,600 3,600
Salary and wages 12,000 12,000 12,000 12,000 12,000 12,000
Miscellaneous costs 6,000 6,000 6,000 6,000 6,000 6,000
MCC Working Capital 50,000 50,000 50,000 50,000 50,000 50,000
Sub-Total Production Cost 253,500 81,200 81,200 256,200 81,200 81,200
OUTFLOWS 253,500 81,200 81,200 256,200 81,200 81,200
Cash Flow Before Financing -231,900 5,200 5,200 -169,800 5,200 5,200
_________________________________
IRR = -8.4%, NPV = -293,282.90

42
Annex- 3.14: Agricultural service centre
India
C-AIM PCR, Maharashtra
ASC activity July -- June
FINANCIAL BUDGET (DETAILED)
(In INR) With Project
1 2 3 4 5 to 20
Main Production
Agriculture service centrs - 373,606 560,409 672,491 747,212
Production Cost
Investment 1,518,225 - - - -
Rent 86,174 86,174 86,174 86,174 86,174
Electricity 59,277 59,277 59,277 59,277 59,277
Labour charges 133,272 133,272 133,272 133,272 133,272
Other expences 64,807 64,807 64,807 64,807 64,807
Sub-Total Production Cost 1,861,755 343,530 343,530 343,530 343,530
OUTFLOWS 1,861,755 343,530 343,530 343,530 343,530
Cash Flow Before Financing -1,861,755 30,076 216,879 328,961 403,682
Cash Flow After Financing -1,861,755 30,076 216,879 328,961 403,682
Farm Family Benefits After Financing -1,861,755 30,076 216,879 328,961 403,682
_________________________________
IRR = 16.0%, NPV = 514,282.56

43
Annex-3.15 Farm implements banks
India
C-AIM PCR, Maharashtra
FEB activity July -- June
FINANCIAL BUDGET (DETAILED) Without
(In INR) Project With Project Increments
1 to 20 1 2 to 20 1 2 to 20
Main Production
Farm equipment bank - 344,024 344,024 344,024 344,024
Production Cost
Investment - 650,800 - 650,800 -
Rent - 1 1 1 1
Electricity - 1 1 1 1
Labour charges - 11,225 11,225 11,225 11,225
Other expences - 107,836 107,836 107,836 107,836
Sub-Total Production Cost - 769,863 119,063 769,863 119,063
OUTFLOWS - 769,863 119,063 769,863 119,063
Cash Flow Before Financing - -425,839 224,961 -425,839 224,961
Cash Flow After Financing - -425,839 224,961 -425,839 224,961
Farm Family Benefits After Financing - -425,839 224,961 -425,839 224,961
_________________________________
IRR = 52.8%, NPV = 1,099,262.08

44
Annex-3.16: Common facility centre
India
C-AIM PCR, Maharashtra
Common facility centre activity July -- June
FINANCIAL BUDGET (DETAILED)
(In INR) With Project
1 2 3 4 5 to 10 11 12 to 20
Main Production
Common facility centers - 182,200 273,300 327,960 364,400 364,400 364,400
Production Cost
Investment 1,518,225 - - - - 1,518,225 -
Rent 35,400 35,400 35,400 35,400 35,400 35,400 35,400
Electricity 10,450 15,675 20,900 20,900 20,900 20,900 20,900
Labour charges 112,600 112,600 112,600 112,600 112,600 112,600 112,600
Other expences 14,400 14,400 14,400 14,400 14,400 14,400 14,400
Sub-Total Production Cost 1,691,075 178,075 183,300 183,300 183,300 1,701,525 183,300
OUTFLOWS 1,691,075 178,075 183,300 183,300 183,300 1,701,525 183,300
Cash Flow Before Financing -1,691,075 4,125 90,000 144,660 181,100 -1,337,125 181,100
_________________________________
IRR = -0.4%, NPV = -984,406.84
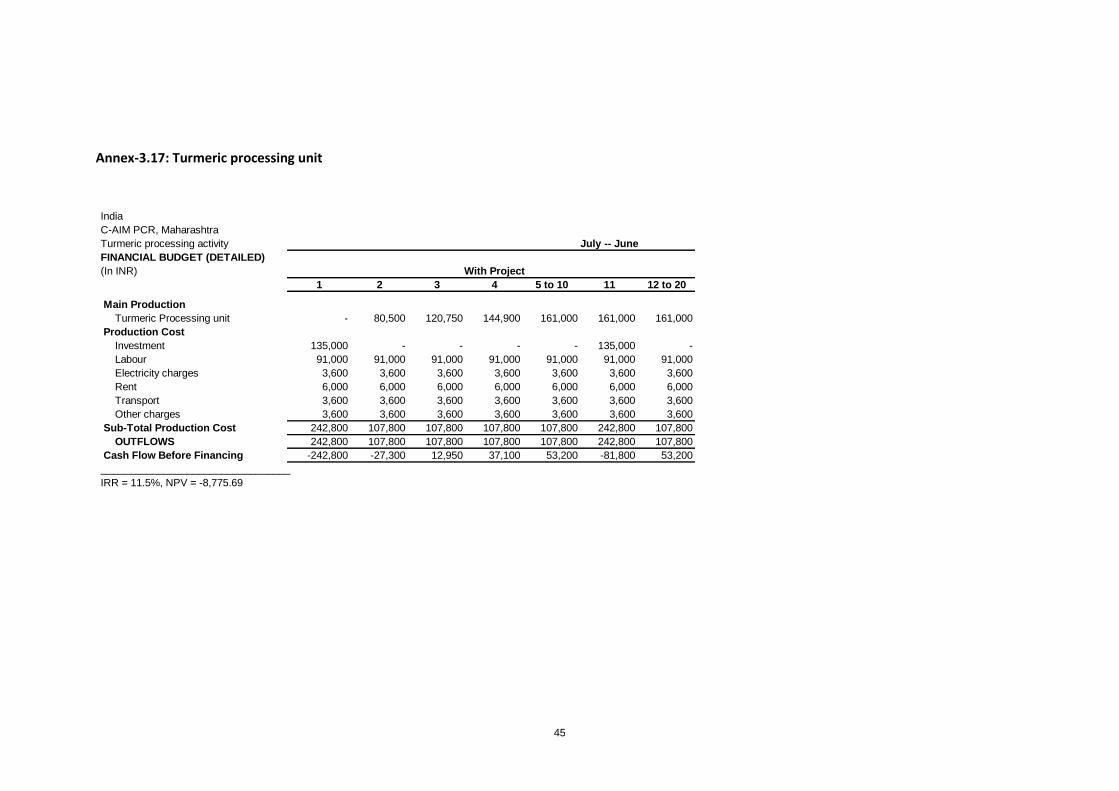
45
Annex-3.17: Turmeric processing unit
India
C-AIM PCR, Maharashtra
Turmeric processing activity July -- June
FINANCIAL BUDGET (DETAILED)
(In INR) With Project
1 2 3 4 5 to 10 11 12 to 20
Main Production
Turmeric Processing unit - 80,500 120,750 144,900 161,000 161,000 161,000
Production Cost
Investment 135,000 - - - - 135,000 -
Labour 91,000 91,000 91,000 91,000 91,000 91,000 91,000
Electricity charges 3,600 3,600 3,600 3,600 3,600 3,600 3,600
Rent 6,000 6,000 6,000 6,000 6,000 6,000 6,000
Transport 3,600 3,600 3,600 3,600 3,600 3,600 3,600
Other charges 3,600 3,600 3,600 3,600 3,600 3,600 3,600
Sub-Total Production Cost 242,800 107,800 107,800 107,800 107,800 242,800 107,800
OUTFLOWS 242,800 107,800 107,800 107,800 107,800 242,800 107,800
Cash Flow Before Financing -242,800 -27,300 12,950 37,100 53,200 -81,800 53,200
_________________________________
IRR = 11.5%, NPV = -8,775.69

46
Annex-3.18: CMRC Goat unit
C-AIM PCR, Maharashtra
CMRC Goat unit activity July -- June
FINANCIAL BUDGET (DETAILED) Without
(In INR) Project With Project Increments
1 to 20 1 2 to 20 1 2 to 20
Main Production
CMRC goat unit - 433,290 433,290 433,290 433,290
Production Cost
Investment cost - 510,000 - 510,000 -
Rent - 18,000 18,000 18,000 18,000
labour charges - 216,000 216,000 216,000 216,000
Other costs - 45,000 45,000 45,000 45,000
Sub-Total Production Cost - 789,000 279,000 789,000 279,000
OUTFLOWS - 789,000 279,000 789,000 279,000
Cash Flow Before Financing - -355,710 154,290 -355,710 154,290
Cash Flow After Financing - -355,710 154,290 -355,710 154,290
Farm Family Benefits After Financing - -355,710 154,290 -355,710 154,290
_________________________________
IRR = 43.3%, NPV = 697,103.31

47
Annex-3.19: Mushroom production unit
Mushroom production activity July -- June
FINANCIAL BUDGET (DETAILED)
(In INR) With Project
1 2 3 to 5 6 7 to 10 11 12 to 15 16 17 to 20
Main Production
Mushroom, dry 32,500 97,500 130,000 130,000 130,000 130,000 130,000 130,000 130,000
Production Cost
Investment cost 9,100 - - 9,100 - 9,100 - 9,100 -
crop waste 6,000 6,000 6,000 6,000 6,000 6,000 6,000 6,000 6,000
Spawn 10,000 15,000 20,000 20,000 20,000 20,000 20,000 20,000 20,000
Plastic bags 4,500 4,500 4,500 4,500 4,500 4,500 4,500 4,500 4,500
Fungicides 2,400 2,400 2,400 2,400 2,400 2,400 2,400 2,400 2,400
Labour charges 7,470 11,205 14,940 14,940 14,940 14,940 14,940 14,940 14,940
Other costs 6,000 6,000 6,000 6,000 6,000 6,000 6,000 6,000 6,000
Sub-Total Production Cost 45,470 45,105 53,840 62,940 53,840 62,940 53,840 62,940 53,840
OUTFLOWS 45,470 45,105 53,840 62,940 53,840 62,940 53,840 62,940 53,840
Cash Flow Before Financing -12,970 52,395 76,160 67,060 76,160 67,060 76,160 67,060 76,160
Cash Flow After Financing -12,970 52,395 76,160 67,060 76,160 67,060 76,160 67,060 76,160
Farm Family Benefits After Financing -12,970 52,395 76,160 67,060 76,160 67,060 76,160 67,060 76,160
_________________________________
IRR = 438.0%, NPV = 461,636.37

48
Annex-3.20 Dal Processing
C-AIM PCR, Maharashtra
Dal processing mill activity July -- June
FINANCIAL BUDGET (DETAILED)
(In INR) With Project
1 2 3 4 to 15 16 17 to 20
Main Production
Dal mills - 405,000 607,500 810,000 810,000 810,000
Production Cost
Machinery 300,000 - - - 300,000 -
Construction 125,000 - - - - -
Electrical installation 25,000 - - - - -
Electricity charges 162,000 162,000 162,000 162,000 162,000 162,000
Labour charges 162,000 162,000 162,000 162,000 162,000 162,000
Other costs 54,000 54,000 54,000 54,000 54,000 54,000
Sub-Total Production Cost 828,000 378,000 378,000 378,000 678,000 378,000
OUTFLOWS 828,000 378,000 378,000 378,000 678,000 378,000
Cash Flow Before Financing -828,000 27,000 229,500 432,000 132,000 432,000
_________________________________
IRR = 34.6%, NPV = 1,585,864.13

49
Annex-3.21: SPARC (Small producers Agricultural Resource Centre)
SPARC unit activity
FINANCIAL BUDGET (DETAILED) With
(In INR) Project Increments
1 to 20 1 to 20
Main Production
SPARC_Thresher 8,500 8,500
SPARC_Rotavator 5,100 5,100
SPARC_Harrowing 1,190 1,190
SPARC_BBF Planter 2,550 2,550
SPARC_Plough 3,400 3,400
SPARC_Land Levellar 900 900
Sub-total Main Production 21,640 21,640
Production Cost
Thresure_BC 30,600 30,600
Rotavator_BC 10,710 10,710
Harrowing_BC 2,550 2,550
BBF Planter_BC 5,304 5,304
Plough_BC 6,630 6,630
Land Levellar_BC 2,430 2,430
Thresure_PC 20,400 20,400
Rotavator_PC 7,140 7,140
Harrowing_PC 1,700 1,700
BBF Planter_PC 3,536 3,536
Plough_PC 4,420 4,420
Land Levellar_PC 1,620 1,620
Sub-Total Production Cost 97,040 97,040
OUTFLOWS 97,040 97,040
Cash Flow Before Financing -75,400 -75,400
_________________________________
IRR = None, NPV = -563,196.05

India
Convergence of Agricultural Interventions in Maharashtra's Distressed DistrictsProgramme
Project Completion Report
Appendix 5: Environmental social and climate impact assessment (detailedanalysis)
Document Date: 30/06/2019
Project No. 1100001470
Loan ID 1000003372
Asia and the Pacific Division Programme Management Department
This document will be publicly disclosed unless there is written dissent on its disclosure by the Borrower at the time of this document submissionto IFAD or no later than the project closing date.


Appendix 5: Environmental social and climate impact assessment (detailed
analysis)
1. The overall goal of the Project is to contribute to the development of resilient production, sustainable and diversified households, on-farm and off-farm livelihoods, allowing households to face production and market risks without falling back into poverty and distress.
2. The project objectives are to: i) improve household incomes from diversified farming and from off-
farm activities; ii) render farming systems resilient with the introduction of organic and low-input contract farming; iii) facilitate the involvement of farmers groups in primary processing, quality enhancement and marketing; iv) empower women through micro-finance and micro-enterprises; an, v) convergence of government programmes and resources.
3. The project’s three components are as follows: Component 1: SHG and CMRC Development;
Component Two: Marketing Linkages & Sustainable Agriculture which has four subcomponents
including: (i) Sustainable and Low External Input Sustainable Agriculture (LEISA); (ii) Livestock
development; (iii) Soil and water conservation; and (iv) Market linkages and value chains; and
Component Three which concerns Programme Management.
4. The Appraisal Report identified the following risks to the project from the social, environmental
and climate perspective - increasing drought like situations and decreasing rainfall; declining soil
fertility and soil organic carbon; extensive mono-cropping particularly of Bt cotton and soybean
heightening risk of crop failure; hardly any crop rotation practiced leading to nutrient losses and
decline in soil quality and health; non-compliance with recommended planting and safety
standards (bio-safety requiring intercropping of refuge/ trap crops in each field as well as health
safety in use of chemical plant protection measures); large herds of cattle leading to soil
degradation and reduction of carbon stock; limited use of animal dung and farm yard manure;
poor farming practices; loss of crops due to wild animal depredation); water harvesting potential
and use underdeveloped; unregulated groundwater abstraction for irrigation and industrial uses
with many places experiencing acute shortages of water in the summer months; problems of
drinking water, poor hygiene and sanitation practices; and in general, low levels of awareness on
environment and environmental education; large tracts of land suffering from salinity; heavy/
excessive rainfall often leading to water logging and flooding in fields; low to no cultivation of
vegetables leading to poor levels of nutrition particularly among many of the women and children.
5. In order to address these problems, as well as achieve the overall goal of the project, the project
proposed a number of interventions across Components 1 and 2 which we shall now assess, at
the end of project period, in terms of their social, environmental and climate impacts (mitigated
and adaptive).
Poverty Targeting:
6. The project successfully targeted and included vulnerable sections of rural households, namely,
Scheduled Castes, Scheduled Tribes, landless labourers, women, small and marginal farmers
and farmers experiencing agrarian distress, as confirmed by the end line survey.
7. These beneficiaries have been supported to undertake a variety of activities and interventions and
provided with the means to do so. The impact on household incomes has been considerable with
74% of the CAIM beneficiaries stating that their income has improved and that most of this
increase in income has come from farming and non-farming enterprises and less so from labour
and other sources. CAIM households perceiving themselves as poor and very poor have reduced
by 43% as compared to only 29% in the control group and ownership of productive assets
(tractors, sprayers, irrigation and micro-irrigation equipment,) was higher than in the control
group1.
8. It is a given that as incomes rise, the social status and mobility of people also increases. Moreover, ability to cope with climate stresses and shocks as well as adapt to climate variability is greater with those with access to financial and economic assets than those without. The poor and very poor are much more vulnerable to climate-induced losses than the better off who are relatively more resilient to these drivers.
SHGs and CMRCs (Component 1)
9. The project formed/ supported 13,235 SHGs with a total membership of 155,784 women. The endline survey reports enhanced women’s participation in HH decision-making (productive and domestic matters) as well as improved social status with over 60 per cent of the CAIM respondents reporting improvement in status of women members as compared to 39 per cent from the control households.
10. Due to credit discipline introduced through SHGs/ CMRCs, regular group savings, and access to loans from the SHGs/CMRC and banks, the social and economic status of women has notably improved as also their credit-worthiness – they are being seen as reliable customers by banks given their loan repayment rate of 99%. Many of the 15,989 most vulnerable women-the ultra-poor have been provided with financial assistance to enable them to purchase productive assets (mostly goats and poultry) which has led many of them to get out of poverty and reduce their dependence on daily wage labour. Women in need now have access to financial and other resources (counselling, emotional and solidarity support, technical assistance, networks) to help them better cope with crises and basic needs.
11. The innovative debt redemption programme, livestock and health insurance schemes, along with asset subsidies (for livestock and capital goods), training and technical support and the successful implementation of the Laxmi Mukti Abhiyaan which saw 62,021 and 4,919 families register their homes and farms ,respectively, in joint names, has increased agency of women, contributed to their empowerment and helped improve household incomes as confirmed by the endline survey.
12. Moreover, MAVIM, which was a major IA under CAIM, strongly promoted the Swach Bharat Abhiyan (Clean India Campaign with a focus on sanitation) and well as the Prime Minister’s Ujjwala Scheme (PMUY which provides LPG connections to BPL households aimed at replacing traditional and unhealthy cooking fuels) and also lent financial assistance to women to benefit from these schemes. During the field visits, the CMRCs confirmed that most of its members had access to and used the toilets and many eligible women had also availed of the Ujjwala scheme. These two initiatives have improved sanitation and health conditions in the villages as well as reduced pressure on biomass for fuels, thus improving social and environmental conditions.
Sustainable and LEISA farming systems (Component 2)
13. As stated in the AR, agriculture was largely cash crop based (cotton/ soybean), heavily chemical dependent, oblivious to bio-hazards and safety risks, unorganised and dominated by intermediaries who benefitted the most. Agro-Biodiversity had declined alarmingly as also soil nutrient status and health.
14. CAIM introduced and promoted LEISA/ organic and conservation agricultural practices especially in cotton which is a major cash crop in the region (BCI, for example); demonstrated modern and appropriate methods of cultivation (ploughing/ sowing across the slope/along the contour line, BBF, inter-cropping) and safe methods of handling plant protection chemicals and disposal of containers; encouraged crop diversification and setting up of kitchen gardens to enhance nutrition; provided good
1 Endline Impact Assessment, pgs. 36-37

quality seeds and agricultural tools and machinery; provided intensive training to farmers and on-site technical support through FFSs; and set up Farmer Service Centres to provide to farmers’ needs and installed plastic bio-gas units that help recycle animal wastes into organic fertilisers.
15. These measures have resulted in increased agricultural productivity, reduced cost of cultivation, increased bio-diversity due to a reduced environmental footprint, reduced health problems, improved soil health and greater crop diversification. Agriculture, which was perceived as a low return/ zero-sum game before the project is now showing promise of generating surpluses and remunerative returns - 74% of CAIM beneficiaries interviewed in the endline survey indicated that agriculture contributed majorly in increasing their overall income; 75% of farmers mentioned that yields had increased and 74% reported an increase in net income.
16. And the increasing soil carbon content, together with inter-cropping and adoption of more nature friendly agronomic practices will have improved the water holding capacity of the soil, increased microbial activity and enhanced the ability to better withstand drought, dry spells, pest and disease attacks while overall, building resilience and capacity to adapt to weather variability.
17. While conservation farming has still not become mainstream, it is encouraging to note that awareness of its benefits has increased, and the end line survey found that there is a small growth in area under sustainable agriculture and a decline in the area under conventional, chemical-based agriculture.
18. However, the endline survey on food security had mixed results - all CAIM respondents across landholdings and incomes reported food shortages [40.1% of small/marginal land owners reporting food shortages (control groups is 42.2%)] while, at the same time, 41% of CAIM respondents (as compared to 22% of control villages) reported increased food availability. This is an anomalous situation which warrants further investigation as the finding does not align with the various supervision reports, with pre-project’s assessment which noted that 27% of families faced food insecurity
2 and
with over 90 per cent of the households in both CAIM and control villages having access to the PDS and over 60 per cent of them reporting that they are satisfied with the quality of food they received
3.
19. This adverse finding notwithstanding, overall, the impact -social, environmental and climate related - of this sub-component is positive.
Livestock Development
20. Livestock rearing has been taken up by 23,312 households who have been provided training and technical support through para vets/ pashu sakhis and market facilitation. Rearing goats has enabled many ultra-poor women to get out of poverty and reduce their dependence on wage income. Members of dairy cooperative societies have reported average incomes of Rs. 10,000/ month besides sale of animal excreta/ compost. Farmers selling milk directly to customers in towns earn on average net income of Rs. 4000-5000 per month. Apart from this, milk has become an important part of the diet thus improving nutrition. While backyard poultry raising provides modest returns in comparison to raising larger livestock, it nevertheless is within the purview and control of women to whom it becomes a source of “own” income and also an important addition to the household diet and nutrition (generally from each batch of birds, between 2-5 are kept aside for home consumption).Chicken waste is an important source of manure.
21. Since livestock units have generally been established through JLG/ SHGs and on a cluster basis, breeders benefit through mutual support, sharing of experiences and advisories, reduced input costs and better product price realisation due to aggregation, (as in the case of milk, eggs and meat). This
2 Appraisal Report 2010, pg. 9
3 Endline Impact Assessment, pg. 59

has enabled households mitigate market risks and create an alternate source of income in case of crop failure or poor agricultural returns.
22. Market tie-ups for dairy and backyard/ commercial poultry are not only assuring a steady income, but also reduce risks as these companies guarantee buy back and provide feed and veterinary services across the production cycle. Moreover, with rainfall patterns becoming irregular and unpredictable with drought afflicting the region more often than previously, long dry spells becoming more frequent, high temperatures and prolonged heat waves increasing in frequency and access to water becoming less assured (despite Vidarbha being in the “assured” rainfall zone), livestock, especially the larger ruminants, are better able to tolerate these adverse conditions and provide a reliable source of income and food in times of adversity.
23. As the number of ruminants increases, there is a risk of over stocking (exceeding the carrying capacity of the local environment) leading to overgrazing, land degradation and loss of biodiversity. While the project has promoted fodder plots, their adoption has not been to the desired extent due to poor rainfall and water shortage. Large ruminants are major contributors to GHGs and the project has not undertaken any specific actions in terms of improving the feed preparations that reduce enteric fermentation.
24. On balance, livestock provides an important and stable source of income; has helped improve overall nutrition levels; is providing the animal wastes that sustain LEISA/ conservation agriculture and makes mixed farming possible thus enhancing resilience and building adaptive capacities (farm and household) to climate change; has helped many ultra-poor households mitigate poverty and even escape it; and provides a buffer/ “insurance on legs” assets, as it were, to both market and climatic vagaries.
Soil and Water Conservation
25. SWC measures have been undertaken on both private and common lands: well re-charge structures; Water Harvesting Structures (WHSs) like gabions, earthen and masonry weirs, Loose Bounder Structures (LBS), stone bunds, farm ponds dug; sunken dugout ponds, ground water recharge shafts, graded bunds, desilting of CNBs, MNBs and Village Ponds has been undertaken, thus increasing in-situ rainwater capture, storage, recharge of soil moisture and ground water aquifers. Rivers and streams (301 in all) have been desilted and deepened, straightened, widened (“trained”) and intensively dammed covering an approximate length of 75.25 Kms. This has substantially increased water capture potential, infiltration and re-charge of ground water aquifers. Trees have been planted on 13,774 ha of land for soil conservation purposes.
26. These measures have helped stabilise soil, reduce erosion, retain in-situ soil nutrients, improve the soil moisture regime, raise the groundwater table, increase surface water capture, enhance water availability for drinking and agriculture over a longer period and increased the area under cultivation. As ground water levels have risen in the vicinity of these measures, the quality of water can be expected to have improved, especially in areas where well recharge shafts have been drilled.
27. Functioning and desilted CNBs and Nalla Bunds have yielded significant benefits to farmers in the adjacent areas such as increase in well water levels and reduced damage of crops and farmland due to water logging and inundation. Farmers, who previously had hardly any access to water, now have diversified their cropping pattern including growing of vegetables which, on average, give reasonably good returns. An additional area of 6,629 ha has been brought under irrigation as a result of these SWC measures and use of irrigation equipment – water pumps, distribution systems, sprinklers and drips systems.
28. The end line survey confirms that SWC works have contributed to increasing area under irrigation in CAIM respondent villages from 25.6% in 2012-13 to 31.2% in 2018-2019; whereas in control villages it

was 20.9% and 21.5% respectively.4 AOS 2017-18 also indicates that 73% farmers noted that the
water table had increased; 60% that availability of irrigated water has increased; 56% that area under irrigation has increased; and 5% feel soil erosion has reduced. Farm ponds allow 1-2 protective irrigations and, in some cases, enable raising of fish.
29. A large number of small, and in-principle, environmentally neutral SWC works have been undertaken together with tree plantation. Tree plantation contributes to the improving the micro-climate, increasing ground water infiltration, improving the soil moisture regime, adding to soil organic content and promoting biodiversity. These measures would generally have a beneficial effect on the environment.
30. Nevertheless, if these benefits are to continue, these SWC structures, especially those on common property (dugout ponds, WHSs, nallah deepening, etc.) would need periodic maintenance; a situation which is not assured in the case of the latter. As the upper catchments of treated streams and water bodies have not been adequately treated in general, and hydrological characteristics of streams have been significantly altered, as compared to the pre-treatment situation, the danger of flooding, damage to farmlands and properties remains in some places. Siltation will effectively reduce the recharge potential, thus progressively limiting the useful life and effectiveness of the measures. There is need, therefore, to intensify protection and stabilisation of catchment areas of nallas/ streams and rivers where treatments have been undertaken, especially where deepening and straightening has been done.
31. These two cautionary advisories notwithstanding, the net impact of SWC works has been to increase the water available for drinking and productive purposes, improve the soil moisture regime, recharge ground water aquifers, contribute significantly to raising farm incomes, improve health and sanitation conditions, contribute to biodiversity, reduce drudgery for women, help crops tide over dry spells and mitigate the impacts of drought (which is now becoming more frequent) and enhance the resilience and adaptive capacity of communities to climate-induced stressors.
32. The overall impact of this sub-component - social, environmental and climate related - read with the advisory that, (i) periodic maintenance of SWC structures is periodically undertaken and (ii) stabilisation of the catchment area of treated streams and WHSs is undertaken immediately - is positive.
Market linkages and Value Chain
33. Agriculture and allied activities provide the bulk of sustenance and income in the project area. In order to facilitate remunerative and sustainable returns from agriculture, CAIM adopted a dual strategy of improving farm production efficiencies and bettering market access and price realisation.
34. In order to make farming more efficient, cost effective and nature friendly, CAIM, (i) organised farmers/ producers into SHGs/ Farmer Groups (FGs)/ Producer Groups (PGs)/ Producer Units (PUs)/JLGs/ FPOs; (ii) aggressively promoted LEISA/ conservation farming, crop diversification including promotion of non-traditional crops (medicinal plants) and animal husbandry; (iii) supplied agricultural equipment (including soil testing laboratories) and provided training and on-farm technical support;(iv) supported the establishment of Farmer Service Centres, SPARC units and processing and sale of farm produce; (iv) provided credit through SHG, CMRC resources and bank linkages as well as a “debt redemption program”; and (v) and linked farmers/ producers to markets (through contract farming, buy-back arrangements and approved market players).
35. The BCI was the single largest initiative of the project in this regard where farmers were systematically facilitated and trained to adopt agronomic practices and methods that promoted soil health and bio-diversity and were either environmentally friendly or minimally adverse; and maintained health safety
4 Endline Impact Assessment, pg.63

and hazard standards as well as output quality requirements which were rigorously third party certified. BCI further linked them to approved ginners. This integrated approach not only helped farmers practice sustainable conservation agriculture, but also helped them realise better farm incomes due to reduced costs of cultivation and better price realisation. Other than the BCI, farmers practicing LEISA/ conservation agriculture also reported similar results. Reduced and proper use of pesticides/ herbicides has improved health conditions. Livestock breeders reported having benefited not only from increased incomes form sale of animal products but also improved farming due to availability of manure/ composts from animal wastes.
36. The end line assessment noted that CAIM respondent reported higher ownership of both consumption and productive assets as compared to the control group
5. Of women engaged in farm and non-farm
enterprises, a substantial number (56.2%) reported that these contributed to increasing household incomes as against only 28.8 % in the control groups
6.
37. The overall impact- social, environmental, climatic – is positive
Taken together, all the above interventions (Components 1 and 2) have helped improve incomes and acquisition of consumption and productive assets, reduced adverse environmental impacts and generally improved the quality of life.
38. Together, they reveal a situation of progressive development, communities with a more diversified livelihood portfolio and income generating sources, possessing greater resilience and better able to cope with and adapt to market and climate-induced shocks
A component/ activity-wise summary overview is as follows:
S.N ACTIVITY
ASSESSED IMPACTS
SOCIAL ENVIRONMENTAL CLIMATE(Adaptation/ Mitigation)
1 Poverty Targeting
Positive Neutral Positive
2 SHGS/ CMRCS Positive Positive Positive
3 Sustainable and LEISA farming systems
Positive Positive Positive
4 Livestock Rearing
Positive Positive / Negative Positive in regard to adaptation/ Negative in regard to GHGs contribution
5 Soil and Water Conservation
Positive Positive with the advisory that periodic maintenance is undertaken and stabilisation of the catchment area of treated streams and WHSs is undertaken immediately.
Positive with the advisory that periodic maintenance is undertaken and stabilisation of the catchment area of treated streams and WHSs is undertaken immediately.
6 Market Linkages and Value Chain
Positive Positive Positive
5 Endline Impact Assessment, pg. 47
6 Endline Impact Assessment, pg. 51

India
Convergence of Agricultural Interventions in Maharashtra's Distressed DistrictsProgramme
Project Completion Report
Appendix 6: Dates of supervision mission and follow-up missions
Document Date: 30/06/2019
Project No. 1100001470
Loan ID 1000003372
Asia and the Pacific Division Programme Management Department
This document will be publicly disclosed unless there is written dissent on its disclosure by the Borrower at the time of this document submissionto IFAD or no later than the project closing date.


Mission Date Completed
Supervision Mission 1 28 November 2010 - 11 December 2010
Supervision Mission 2 14 April 2011 - 30 April 2011
Supervision Mission 3 22 April 2012 - 05 May 2012
Impl. Sup/Follow Up Mission 1 01 December 2012 - 31 December 2012
Supervision Mission 4 18 February 2013 - 01 March 2013
Mid-Term Review 1 13 January 2014 - 02 February 2014
Impl. Sup/Follow Up Mission 2 26 May 2014 - 28 May 2014
Supervision Mission 5 02 February 2015 - 16 February 2015
Impl. Sup/Follow Up Mission 3 27 April 2015 - 01 May 2015
Impl. Sup/Follow Up Mission 4 19 August 2015 - 22 August 2015
Impl. Sup/Follow Up Mission 5 07 September 2015 - 10 September 2015
Supervision Mission 6 04 March 2016 - 16 March 2016
Impl. Sup/Follow Up Mission 6 08 September 2016 - 10 September 2016
Supervision Mission 7 27 February 2017 - 23 March 2017
Supervision Mission 8 15 January 2018 - 09 March 2018
1/1

India
Convergence of Agricultural Interventions in Maharashtra's Distressed DistrictsProgramme
Project Completion Report
Appendix 7: Terms of Reference of the completions review mission
Document Date: 30/06/2019
Project No. 1100001470
Loan ID 1000003372
Asia and the Pacific Division Programme Management Department
This document will be publicly disclosed unless there is written dissent on its disclosure by the Borrower at the time of this document submissionto IFAD or no later than the project closing date.


Appendix 7: Terms of Reference for engaging a Team of Consultants
A. Background
CAIM was designed with a goal of developing resilient, sustainable and diversified on-farm and off-farm livelihood systems, allowing households to face climatic and market risks without falling back into poverty and distress, covering the six distressed districts in the Vidarbha region, namely Akola, Amravati, Buldhana, Wardha, Washim and Yavatmal. This project is financed by an IFAD Loan of SDR 26.82 million (USD 40.1 million) and an IFAD Grant of SDR 670,000 (USD 1.0 million). The project is co-financed by the Sir Ratan Tata Trust (SRTT) with a grant of Rs 752.37 million (USD 16.0 million), and the Government of Maharashtra (GoM) with a contribution of USD 37.6 million as counterpart and parallel financing. The Maharashtra State Agricultural Marketing Board (MSAMB) is the Lead Programme Agency. The original project completion was 31 December 2017 and based on GoM’s request this was extended to 31 December 2018. The loan closing is scheduled for 30 June 2019. MSAMB established a Project Management Unit for the management and day to day implementation of the project, located in Amravati. Six District Project Management Units operate in Akola, Amravati, Buldhana, Wardha, Washim and Yavatmal.
As a part of the project closing activities, CAIM is seeking a team of individual consultants in order to assess and document the overall performance of this programme and its impact and prepare a Project Completion Report (PCR). The assessment is to be done by a team of senior consultants with expertise and credentials in the field of NRM, financial inclusion, livelihood diversification, and market led sustainable agricultural development. The overall framework of PCR preparation, terms of references of individual consultants are given in the following sections.
B. Objectives of PCR
The overall objective of the project completion review is to assess and document overall project implementation performance and the results achieved, for both accountability and learning purposes. The process calls for an informed reflection on the relevance, effectiveness, efficiency and sustainability of project interventions. The detailed objectives of the project completion review are to: (i) assess the relevance of project interventions at the time of project design and at completion; (ii) assess the effectiveness of project implementation, or the extent to which project objectives were met, and to document the immediate results and impacts of project interventions; (iii) review the project costs and benefits; and the efficiency of the overall project implementation process, including IFAD’s and partners’ performance; (iv) assess the prospects of sustainability of project benefits beyond project completion; (v) generate useful lessons from implementation that will help improve IFAD’s or Department of Agriculture and Department of Marketing future programming and designs; (vi) identify potential for the replication or scaling up of project best practices; and (vii) encourage cross regional learning.
C. Methodology
IFAD Guidelines for Project Completion Review October 2015 will be the guiding document in the preparation of PCR. The methodology will involve the use of a mix of both quantitative and qualitative tools in order to draw informed inferences on overall project performance and results. For transparency and accuracy purposes, it is important that the sample selected for consultation with project stakeholders should be as large and inclusive as possible and the list of persons to be met by the consultants will require careful consideration.
Sources of information: Primary sources of information include project reports and documents (project design documents, supervision reports, MTR report, progress reports, Annual outcome surveys, RIMS reports, AWPB, etc.), MIS data (including RIMS data), any
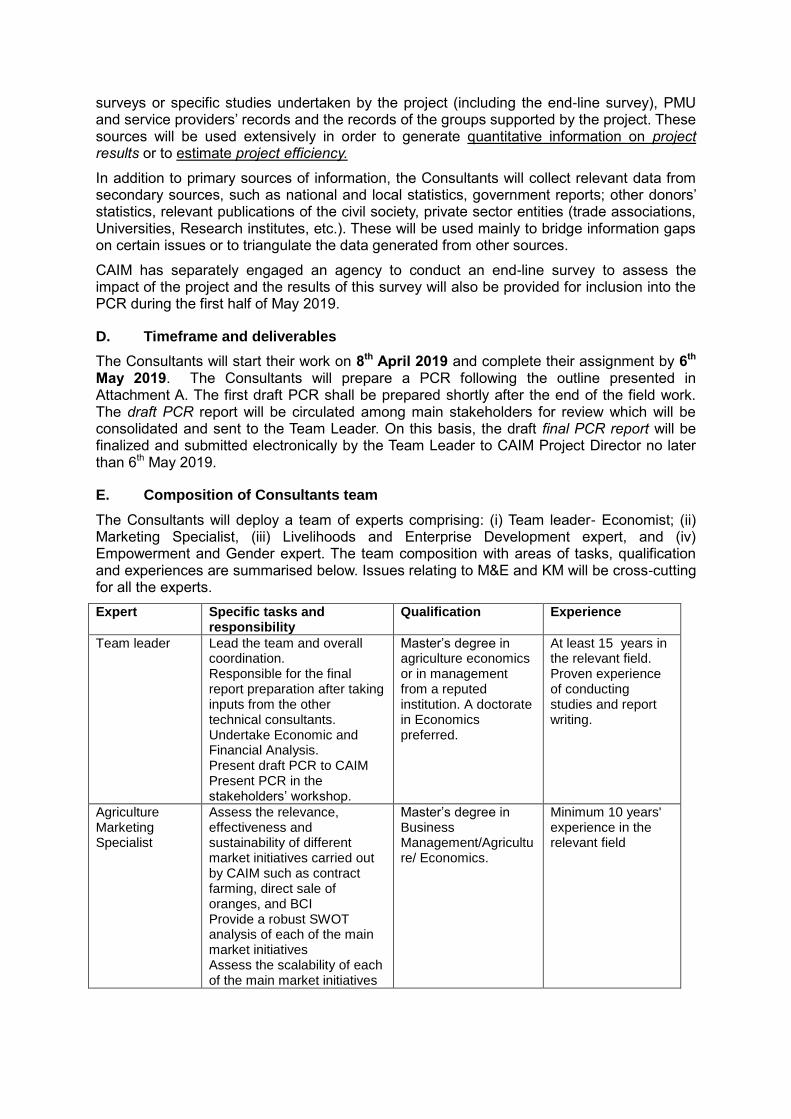
surveys or specific studies undertaken by the project (including the end-line survey), PMU and service providers’ records and the records of the groups supported by the project. These sources will be used extensively in order to generate quantitative information on project results or to estimate project efficiency.
In addition to primary sources of information, the Consultants will collect relevant data from secondary sources, such as national and local statistics, government reports; other donors’ statistics, relevant publications of the civil society, private sector entities (trade associations, Universities, Research institutes, etc.). These will be used mainly to bridge information gaps on certain issues or to triangulate the data generated from other sources.
CAIM has separately engaged an agency to conduct an end-line survey to assess the impact of the project and the results of this survey will also be provided for inclusion into the PCR during the first half of May 2019.
D. Timeframe and deliverables
The Consultants will start their work on 8th April 2019 and complete their assignment by 6th May 2019. The Consultants will prepare a PCR following the outline presented in Attachment A. The first draft PCR shall be prepared shortly after the end of the field work. The draft PCR report will be circulated among main stakeholders for review which will be consolidated and sent to the Team Leader. On this basis, the draft final PCR report will be finalized and submitted electronically by the Team Leader to CAIM Project Director no later than 6th May 2019.
E. Composition of Consultants team
The Consultants will deploy a team of experts comprising: (i) Team leader- Economist; (ii) Marketing Specialist, (iii) Livelihoods and Enterprise Development expert, and (iv) Empowerment and Gender expert. The team composition with areas of tasks, qualification and experiences are summarised below. Issues relating to M&E and KM will be cross-cutting for all the experts.
Expert Specific tasks and responsibility
Qualification Experience
Team leader Lead the team and overall coordination. Responsible for the final report preparation after taking inputs from the other technical consultants. Undertake Economic and Financial Analysis. Present draft PCR to CAIM Present PCR in the stakeholders’ workshop.
Master’s degree in agriculture economics or in management from a reputed institution. A doctorate in Economics preferred.
At least 15 years in the relevant field. Proven experience of conducting studies and report writing.
Agriculture Marketing Specialist
Assess the relevance, effectiveness and sustainability of different market initiatives carried out by CAIM such as contract farming, direct sale of oranges, and BCI Provide a robust SWOT analysis of each of the main market initiatives Assess the scalability of each of the main market initiatives
Master’s degree in Business Management/Agriculture/ Economics.
Minimum 10 years' experience in the relevant field

Livelihoods and micro-enterprise development expert
Assess the livelihoods and enterprise development component of the project. Document case studies and testimonials that show greater resilience to shocks, reduced indebtedness, increased incomes
Master’s degree in Management/Agriculture/ Commerce/ Engineering.
Minimum 10 years' experience in the relevant field
Empowerment and Gender expert
Assess the empowerment and social equity component of the project including the state of empowerment and gender parity.
Master’s degree in Social Welfare / Sociology/ Anthropology/ Development studies.
Minimum 10 years' experience in the relevant field
F. Overall scope of work of Consultants
The Consultants will have the following tasks in the preparation of PCR for CAIM. The following important tasks have been extracted from IFAD PCR Guidelines and the main performance assessment questions are provided in Attachment B:
a) Assess the extent to which project objectives were consistent with the priorities of the rural poor and their identified needs and potential; with the priorities and poverty alleviation policies and strategies of the country; and with IFAD’s mandate and policies (for detailed questions to be posed refer to Q 1 of Attachment B).
b) Assess the extent to which the project’s specific objectives were achieved in both quantitative and qualitative terms. This will involve the careful description of the main activities undertaken by the project since its start, as well as a thorough analysis of the results achieved at the output, outcome and impact levels. Variations between initial and actual targets will be highlighted and the external factors that had a bearing on project effectiveness will be explained (for detailed questions to be posed refer to Q 2 of Attachment B).
c) Assess how economically project inputs and resources (funds, expertise, time, etc.) were converted into results (for detailed questions to be posed refer to Q 3 of Attachment B).
d) Assess how well did the [PROJECT MANAGEMENT UNITS at the state and district levels] coordinate and manage project activities (for detailed questions to be posed refer to Q 4 of Attachment B).
e) Assess the Quality of IFAD supervision and implementation (for detailed questions to be posed refer to Q 5 of Attachment B).
f) Undertake cost benefit analysis (for detailed questions to be posed refer to Q 6 of Attachment B).
g) Assess the likelihood that the benefits from project intervention will continue after project completion. It will also assess the likelihood that actual and anticipated results will be resilient to risks, including climate-related risks, beyond project life. The adequacy of the post-project strategy, as designed and/or implemented, will also be examined. The assessment will cover: (i) Social sustainability (Empowerment); (ii) Economic and financial sustainability; (iii) Technical sustainability; (iv) Institutional sustainability; (v) Environmental sustainability; and (vi) Climate change (for detailed questions to be posed refer to Q 7 of Attachment B).
h) Present the rural impact of project interventions in quantitative and qualitative terms, using the standard IFAD impact domain classification: (i) Households’ incomes and assets; (ii) Human and social capital and empowerment; (iii) Food security; (iv)

Agricultural productivity or productivity of the enterprises; and Institutions and policies (for detailed questions to be posed refer to Q 8 of Attachment B).
i) Assess the impact of the project from the gender equity and women empowerment perspective (for detailed questions to be posed refer to Q 9 of Attachment B).
j) Assess the impact of the project from the perspective of access to markets (for detailed questions to be posed refer to Q 10 of Attachment B).
k) Assess the extent to which project interventions have introduced and tested innovative approaches to rural poverty reduction. These are any processes, tools or practices that add value or solve a problem in new ways (for detailed questions to be posed refer to Q 11 of Attachment B).
l) Assess the extent to which some approaches, technologies or innovative features pilot-tested or successfully implemented by the project have been or are likely to be up-scaled. It will also assess the likelihood that some project approaches have been or may be replicated in other geographical areas (for detailed questions to be posed refer to Q 12 of Attachment B).
m) Assess the appropriateness of approaches to environment preservation and natural resources management (for detailed questions to be posed refer to Q 13 of Attachment B).
n) Assess the appropriateness of approaches for climate change adaptation promoted by the project to local circumstances (for detailed questions to be posed refer to Q 14 of Attachment B).
o) Assess the extent to which project interventions have reached the intended target groups, that is the specific individuals or organizations for whose benefit specific interventions were initially designed and implemented and also assess the effectiveness of the project targeting strategy (for detailed questions to be posed refer to Q 15 of Attachment B).
p) Assess the performance of IFAD and the government. In addition to determining if all implementation partners have adequately fulfilled their respective roles and responsibilities. The mission will examine: (i) compliance to the covenants of the loan agreement; (ii) proactiveness in supporting project implementation and identifying solutions to problems; and (iii) fulfilment Project Steering Committee’s role.
q) Present the main lessons learned from project implementation, based on the analysis of what learning from experience may be replicable (for detailed questions to be posed refer to Q 17 of Attachment B).
r) Make an assessment of specific aspects of project implementation that will be worthwhile replicating in future interventions in Madhya Pradesh, or elsewhere, because they were particularly interesting or successful?
s) Prepare and present the PCR in consistence with the annotated outline given in Attachment A together with Appendices.
G. Specific terms of reference of Consultants
1) Team leader (Economist–Project Management and Economic Analysis) i) Tenure: 28 days ii) Place of work: Amravati with travel to CAIM districts iii) Expected Starting date: 8 April 2019 to 6th May 2019 iv) Skills required:

(a) High levels of analytical skills with a minimum qualification of a Master’s degree in agriculture economics/management from a reputed institution. A Doctorate degree in Economics is preferred.
(b) At least 15 years of experience in implementing and evaluating development projects at the senior management level.
(c) Experience in evaluation/impact assessment of projects with the component of SHGs and federations building.
(d) At least 5 research papers published in national and international journals of repute or having contributed to at least 5 reports/proposals of international funding agencies and/or Niti Ayog.
(e) Experience of having written at least one Project Completion Report in respect of a multilateral International Financial Institution funded project. Previous experience of having worked on an IFAD PCR will be an added advantage.
v) Job description:
(a) Prepare an outline for PCR along with appendices (Refer to Attachment B) and make allocation of writing tasks to the team members.
(b) Collect all data from CAIM as per PCR data templates including all the project documents.
(c) Review the data along with the team members and identify data gaps and prepare a plan for further data collection.
(d) Identify clearly the targets and achievements in respect of project outputs, outcomes and impact taking into account the project’s logframe indicators and RIMS indicators in respect of each of the components in consultation with the team members.
(e) Develop a framework for quantitative and also qualitative information to undertake (i) assessment of project’s relevance, effectiveness and efficiency; (ii) assessment of project management; and (iii) economic and financial analysis.
(f) Review the framework for quantitative and also qualitative information prepared by other team members and finalize the same.
(g) Make a plan for the field visit by the team to collect data and also to conduct focus groups discussions with the beneficiaries to make the assessments and undertake field visits not exceeding 10 days.
(h) Conduct discussions with other stakeholders of the project including project officials and senior management of CAIM.
(i) Present the finding of the PCR for review by the CAIM management.
(j) Based on the discussions and comments received, revise the draft PCR and submit to CAIM.
(k) Present the findings of the PCR in the stakeholder’s workshop to be organized by CAIM (this workshop would be scheduled for one day around 3rd week of May 2019).
2) Team member – Agriculture Marketing Specialist i) Tenure: 28 days ii) Place of work: Amravati with travel to CAIM districts iii) Expected Starting date: 8 April 2019 to 6th May 2019 iv) Qualification and Skills required:

(a) A minimum Bachelor’s degree in Business Management/Agriculture/ Economics. Master’s degree in the above specializations preferred.
(b) At least 10 years of experience in implementing and evaluating development projects at the senior management level particularly in agricultural marketing.
(c) Proven ability to write in English. Experience of having participated in rural development project design, supervision and implementation funded by national and international organisations, large NGOs and international financial institutions.
(d) Evidence of having written papers or assessments related to grassroots institution building and micro-finance.
v) Job description:
(a) Desk review all project documents in general and those specific to agricultural marketing.
(b) Collect all data from CAIM as per PCR data templates including all the project documents, monthly progress reports, and PCR template.
(c) Review the data along with the Team Leader and identify data gaps for further data collection.
(d) Identify clearly the targets and achievements in respect of project outputs, outcomes and impact taking into account the project’s logframe indicators and RIMS indicators in respect of market led agriculture in consultation with the Team Leader.
(e) Develop a framework for quantitative and also qualitative information to undertake assessment of: (i) project’s relevance, effectiveness and efficiency; (ii) market led activities; (iii) sustainability; and (iv) lessons learned. Finalize the same in consultation with the Team Leader.
(f) Make a plan for the field visit by the team to collect data and also to conduct focus groups discussions with the beneficiaries to make the assessments in consultation with the Team Leader.
(g) Present the finding and prepare PCR inputs as per the template provided by the Team Leader within 21 days from the start of the assignment.
(h) Any other task assigned by the Team Leader.
3) Team member – Livelihoods and Enterprise Development Expert i) Tenure: 28 days ii) Place of work: Amravati with travel to CAIM districts iii) Expected Starting date: 8 April to 6 May 2019 iv) Skills required:
(a) A minimum Bachelor’s degree in Management/Agriculture/ Commerce/ Engineering. Master’s degree in the above specializations preferred.
(b) At least 10 years of experience in implementing and evaluating development projects at the senior management level particularly in livelihoods promotion and enterprise development.
(c) Ability to write in English Experience and experience of having participated in rural development project design, supervision and implementation funded by national and international charities, large NGOs and international financial institutions.
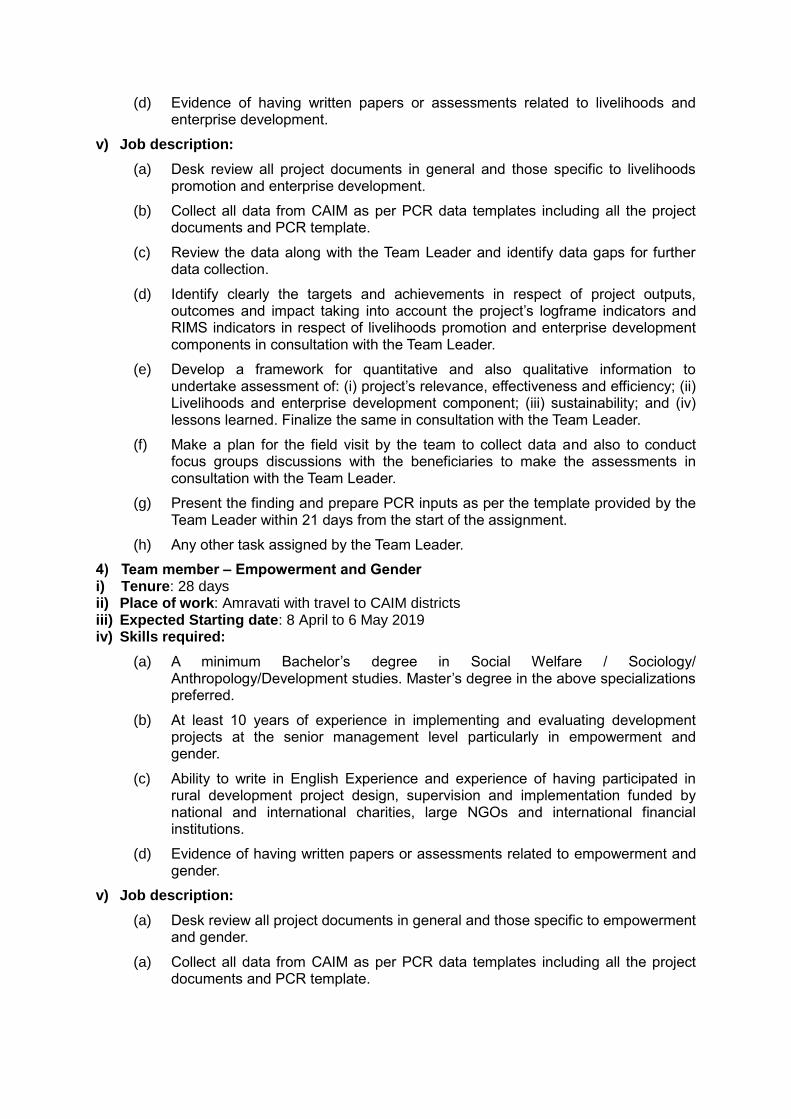
(d) Evidence of having written papers or assessments related to livelihoods and enterprise development.
v) Job description:
(a) Desk review all project documents in general and those specific to livelihoods promotion and enterprise development.
(b) Collect all data from CAIM as per PCR data templates including all the project documents and PCR template.
(c) Review the data along with the Team Leader and identify data gaps for further data collection.
(d) Identify clearly the targets and achievements in respect of project outputs, outcomes and impact taking into account the project’s logframe indicators and RIMS indicators in respect of livelihoods promotion and enterprise development components in consultation with the Team Leader.
(e) Develop a framework for quantitative and also qualitative information to undertake assessment of: (i) project’s relevance, effectiveness and efficiency; (ii) Livelihoods and enterprise development component; (iii) sustainability; and (iv) lessons learned. Finalize the same in consultation with the Team Leader.
(f) Make a plan for the field visit by the team to collect data and also to conduct focus groups discussions with the beneficiaries to make the assessments in consultation with the Team Leader.
(g) Present the finding and prepare PCR inputs as per the template provided by the Team Leader within 21 days from the start of the assignment.
(h) Any other task assigned by the Team Leader.
4) Team member – Empowerment and Gender i) Tenure: 28 days ii) Place of work: Amravati with travel to CAIM districts iii) Expected Starting date: 8 April to 6 May 2019 iv) Skills required:
(a) A minimum Bachelor’s degree in Social Welfare / Sociology/ Anthropology/Development studies. Master’s degree in the above specializations preferred.
(b) At least 10 years of experience in implementing and evaluating development projects at the senior management level particularly in empowerment and gender.
(c) Ability to write in English Experience and experience of having participated in rural development project design, supervision and implementation funded by national and international charities, large NGOs and international financial institutions.
(d) Evidence of having written papers or assessments related to empowerment and gender.
v) Job description:
(a) Desk review all project documents in general and those specific to empowerment and gender.
(a) Collect all data from CAIM as per PCR data templates including all the project documents and PCR template.

(b) Review the data along with the Team Leader and identify data gaps for further data collection.
(b) Identify clearly the targets and achievements in respect of project outputs, outcomes and impact taking into account the project’s logframe indicators and RIMS indicators in respect of empowerment and gender components in consultation with the Team Leader.
(c) Develop a framework for quantitative and also qualitative information to undertake assessment of: (i) project’s relevance, effectiveness and efficiency; (ii) Empowerment and Social equity component; (iii) the state of empowerment and gender parity; (iv) sustainability; and (v) lessons learned. Finalize the same in consultation with the Team Leader.
(d) Make a plan for the field visit by the team to collect data and also to conduct focus groups discussions with the beneficiaries to make the assessments in consultation with the Team Leader.
(e) Present the finding and prepare PCR inputs as per the template provided by the Team Leader within 21 days from the start of the assignment.
(f) Any other task assigned by the Team Leader.

India
Convergence of Agricultural Interventions in Maharashtra's Distressed DistrictsProgramme
Project Completion Report
Appendix 8: List of person met and mission's programme
Document Date: 30/06/2019
Project No. 1100001470
Loan ID 1000003372
Asia and the Pacific Division Programme Management Department
This document will be publicly disclosed unless there is written dissent on its disclosure by the Borrower at the time of this document submissionto IFAD or no later than the project closing date.


Appendix 8: List Of Persons Met And PCR Team Programme
Date Program / Activity/
Area Persons Met / Remarks
9 April 2019 Meeting At PMU Office Mr. Digamber Nemade Accounts Officer-PMU
Mr. Anand Towari-District M&E Officer Buldana District
Ms. Sweta Khade-M&E Officer PMU
Mr. Shailesh Patil –Market Linkage Specialist –PMU
Mr. Raju Ingle-CAIM MAVIM Regional Coordinator
Mr. Manoj Ingle-Agronomist, PMU, CAIM
10 April 2019
Mr. V.Puhazhendhi
Meeting At PMU Office Ms. Sweta Khade-M&E Officer PMU
Miss Urmila Bendre
SHG Amravati
Raju Ingle(Project Coordinator), Khushal Rathod(DCO), Ram Sahu(ADCO), Rushikesh Ghyar(Adco),Minakshi Shende(Amo)Ajay Sultane(CAIM Consultant).
Bharari, Dhamangaon
Swati Chauhan(CMRC Manager) SHG Name -Jivandhara, Sangharsh, Nalanda,Rani Durgavati, Ahilyabai Holkar, Ekta, Abhinandan. Ultra Poor Member-Sajeda Pathan, Aktari Pathan,Nalu Nari, Rupali Ghasale, Manager -Swati Chauhan, Accountant - Suresh Chavare Debt SHG Beneficiary- Surekha Dhanke, Kanchan Dhanke, Swati Dahad. Crp- Swati Dahad, Pranita Hinjawe.
Mr. Naveen Anand Mr. Sanjay Gupta
1. Visited Bori village of Akot cluster
Discussion with CAIM Team - Neelesh Jadhav Wankhade – Agri. Business Expert, Akola; Nilesh Tayde – MAVIM; Sudhir Suresh Govai , Agri. Field Officer , Akot, Akola; Nikhilesh Yadav, M&E Officer, Akola DPMT; Yogesh Asalkar – MIS Consultant, MAVIM; Ms. Varsha – MAVIM Coordinator, Akola Farmers Bori Village on Baby Corn : Ramesh Chandra Khadke; Sushila Raja Shanware – Kranti SHG; Rekha Ganesh Shanware Sarpanch ( Baby Corn grower) ;Ganesh Shankerrao Shanware – VDC – Secretary
2. Visited Rustamabad village of Barshitakli cluster
Discussion with CAIM beneficiaries of Dal Mill, Livestock & FPC activity in presence of Rekha Shriram Tupwade (VLW) Ramesh Rathod , Chairman, Chnda Tai Bhawani – Katipurna , Farmers Producer Company ;Rekha Madukar Katekar ( Ultra Poor) – Jai Jageshwari SHG, Rustamabad; Pratibha Dinesh Raut, Pashu Sakhi ( Goat rearing), Saira Bi ( Goat Rearing - farmer);Sangita Tulsiram ( Farmer - Poultry) Dairy Unit – Dhanraj Bhawane JLG Member; Pramila Vijay Bhad ( Ultra Poor) – Goat Rearing ; Rekha Madhukar Karkare – Chairperson – Sahyog SHG II. CMRC Barshitakli ;Nahel Sheik – CMRC Manager ; Sanghadeep
Duryodhan Livelihood Coordinator, Mohan Tajre – Accountant , Ms. Veena Mohod , Sahyogini
3. Visited Ural Budrug village of Balapur cluster
Milk Collection Centre – Vijay K Pande CMRC Manager , Mahesh bender - SRTT Also had a discussion with CAIM beneficiaries of Milk Collection Centre activity
11 April 2019
Mr. V. Puhazhendhi
Meeting At PMU Office Miss Sweta Khade-M&E Officer PMU
Miss Urmila Bendre
Unnati, Achalpur
Manjusha Raut(CMRC Manager) SHG Visit-Vishakha SHG, Prachita SHG, Sarvjanik SHG. Ultra Poor Member-Prabha Gathe, Sangita Gathe, Aruna Gathe. RGB Member- Nalini Wankhade, Vidyatai Arvikar, Varsha Gote, Savita Gathe. VLC Member- Sulochana More, Prabhas More, Sushma More, Shobha Sukhner, Chanda More, Bunda Bhalari, Mangla More, Wanmala More, Nalini Wankhade, Sindhu More.

Ultra Poor Member- Mangla Sardar, Manda Javanjal, Shila Burange. Manager -Manjusha Raut, Pashusevak -Ranjit Dhande.
Mr. Naveen Anand Mr. Sanjay Gupta-
Buldana Jawala Palaskhed, Tq Shegaon Dalmil Takali Viro, Tq Shegaon Group Dairy Activity
Sheela Bai Gajanan Khod – Chairperson , Yogita Vijay Hegale –Secretary; Praveeen Ashok Ingle – CMRC Manager
Shegaon Paratha Centre
Mr. Pravin Ingle (CMRC Manager) & SHG Member; Vishal Pawar, CAIM – Consultant – Initiated Paratha centre
Kherda, Tq Shegaon SWC Work, Gaion Structure, Recharge Shaft, SME & CFC
Mr. Vaibhav Deshmukh (CMRDF) & SHG Member & JLG Member Takli Village – Dairy JLG – Praveen Deshmukh – JLG Member Khreda Village – recharge Shaft Members - SriKrishna Mahila Bachat Ghat
Chinchpur, Tq Motala Maize Pulvliser
Mr. Amar Mapari & JLG Member
Didola, Tq Motala SWC Work Dairy Activity BCI Activities (BD Compost)
Village - Dindola Khurd – desilting work – Haider Shah Bannu Shah, Sukhdev Sopan Shimbre, Ramroa Kukde, Ganesh Sakharam Sumbre, Sukhdev; Srikrishna Ungle – Farmer - Cotton Grower Mr. Sharad Ugale and JLG Member Mr. Raghunath Bangar, LG Farmer
Deulgaon Mahi Tq Deulgaon Raja Seed Production Contract Farming
Mr. Raghunath Wayal Mr. Badri Doke, PG Farmer
Buldana Dr. Sukesh Brijmohan ji Zamwar – CMD , Buldana Urban Credit Society Ltd. Buldana ( Implementing Agency CAIM Yogesh Ghogle Agri. Business Expert Buldan
12 April 2019
Mr.V. Puhazhendhi
Meeting At PMU Office Miss Sweta Khade-M&E Officer PMU
Miss Urmila Bendre
Lok Sanchalit Sadhan Kendr Ner
1)CMRC Manager- Nilima Raut, 2)CMRC Secretary- Sunita Godpayle, 3)CMRC Voice President-Manjula Alone, 4)CMRC Member- Savita Khobragade, 5)Sanyogini- Meena Wankhede Rama Sanjay Talware / Member ujwala Bhimarao Ingole / Member mamta Bhaskar Basavnath / Member chandrakala Sudhakar Rathod / Member jija Yojiram Talware / Member vandana Panjab Talware / Memberpunam Arvind Aadole / Memberranjana Vikas Kubde / Membervarsha Rajendra Lohakare / Secretarynirmala Panjab Adole/ Memberdwarka Ramdhan Rathod/ Memberkamala Shivling Khadase/Varsha Rajendra Lohakare / Secretary Papita Rajesh Patil (SHG Member)Annapurna Sunil Uddyam ( SHG President)Rekha Milind Sahare (Secretary)Sunita Ajab Talware ( Secretary)Pimpala Maniram Aade ( SHG Member)
Darwha Anita Dipak Dudhe 9764357050kavita Anil Wankhade 9309994373manisha Dinesh Kadam 7558277272manjusha Sanjay Tetar 8766946105jyostna Pramod Dhote 7218665394SHG-12, Member 25(Present In Meeting)Nirmala Raut - CMRC Manager Kanta Dhule - Sanyogini CMRC Jaya Gavande - Gib Coordinater CMRC
Mr. Naveen Anand Mr. Sanjay Gupta
Activity - Nala Revival and Revival At. Kondoli, Cluster- Manora Dist- Washim
Mr. Ajay Kawale (Junior Engineer ) Minor Irrigation Dept., Washim & Kondoli Village Beneficiary Farmer. Ajit Kowle, PA to chief Minister, Maharashtra - Discussion over phone Kondoli village farmers - Bhawrao Sukharam Bhawar –Farmer and beneficiary of the river desilting work Manish Sureshrao Pawar- Farmer – Manora Cluster , Kondoli - (Desilting of river benefits; Kundalik vithal chandankar
Mahuli Common Facility Center (CFC), At. Risod Ta. Risod Dist- Washim
Mauli – Gramodyog Kendra – Krishi SHG Kiran Ashok Billari President -SHG – running CFC Multi facility center – (Spices, Papad , Dal mill, Sewai etc.)

Turmeric Processing Unit At. Morgaon Ta. Risod Dist- Washim
Met- Mr. Bhanudas Kokate, President of Jay Hanuman Join Liability Group (JLG), Morgaon and Turmeric Cultivation farmer Nand Kishore Thorat – Ex. AFO in CAIM , now in KVK Karda Indu Nainwa Jadhav – Farmer
12/04/2019 Cluster - Tiosa
Village-Shirojgaon
Mozri Visiting
person- Mr. V. Puhazhendhi
SME :- Dal Mill ( Pulses Unit)
Meeting with Kamdhenu Women SHG –MAVIM CMRC Members and suggested to sustain the business and keeping book records
Agri Enterprises :- Turmeric cultivation
Meeting with Turmeric Grower and advice to identify market player and to indulge in processing.
Livestock :- Dairy, Poultry & Goat Rearing
Meeting with Karmayogi JLG & Trimurti JLG. Suggested to increase production with proper management and process on milk.
13 April 2019
Mr. . Puhazhendhi
Meeting At PMU Office Miss Sweta Khade-M&E Officer PMU, Mr. Shailesh Patil –Market Linkage Specialist –PMU
Miss Urmila Bendre
Yashswini Yavatmal Bharati Ganesh Dhumane (MLP Member)Suvrna Kalpesh Dhumane (MLP President)Kiran Rajendra Bais (MLP Member)Joshna Ganesh Sapat (Mlp Member)Aashika Chandrakant Pimplakar (MLP Member)Sangita Santosh Dhande (Pashu Sakhi)Vandana Arun Aade (Ultra Poor Member)Jyoti Gopal Dethe (Ultra Poor Member)Maina Tulashiram Fupare (CRP Member )
Tejasvini Lok Sanchalit Sadhan Kendr Arni
Seema Bamratkar (CMRC Manager)Varsha Meshram (GIB Coordinator)Manda Bhujade(Sahyogini)Archana Jachak (Rgb Member)Usha Tekam (Secretory)Manda Shelmake (SHG Member)Archana Kumare (SHG Member)Sarubai Mangam (SHG Member)Shantabai Kambale (SHG Member)Nanda Bansod (SHG Member)Shantabai Kesale SHG President)Indubai Kunkar (SHG Secretary)Megha Garud (SHG Member)Lata Dhakulkar (SHG Member)Aasha Bande (SHG Member)
Mr. Naveen Anand Mr. Sanjay Gupta
Visit –Umarkhed cluster in Takali and Vidul village Takali Village (Umerkhed)
DPMT Yavatmal: Raju Tantre, Cluster Coordinator Shyamal Navghere, Agri. Business Expert, CAIM Vishal Rathod , CAIM Consultant ( MAVIM) Raj Rathod, Agri. Business Expert Dr. Ranjan Wankhede – Senior District Coordinating Officer, MAVIM, Yavatmal PCR Team– Takali village visited Milk collection center , activity discussed with members of Shri Sarvagya Dairy Cooperative Society. Anil Jhadav – Secretary Member Tukaram suroshe , anil sheshrav jadhav for process ,method and Implementation Fodder activity -discussed with madhav parshuram jadhav ,kailash bhimrav jadhav and other project beneficiaries Also visited plot to know which kind of Seeds used For Convergence Activity, Visited Sericulture Plot. Discussed about Marketing Strategy, Transportation, Benefits of the members,Crops taken up etc. Medicinal Crop- Pashan Bedh Plot visited. Discussed with Beneficiaries like Mr.Madhav Parasram Jadhav,Kailash Bhimrao Nirantar Shantabai Bupurao Shinde - Beneficiary Contract Farming of Coleus ( Pashan Bhed) Also Discussed about Rates given By Company, also Package Of Practices how many Benefited Crop Other Than Regular Crop Discussed with Anil Shinde Takli Village ( Mulberry Plantation and Sericulture Experiment) Kailash Nirantar (Mulberry Field- 2 Acre)
Vidul Village (Umerkhed)
Turmeric Processing Unit-Discussed with members about procurement of Turmeric from Farmer Process ,Quality Control, Market Avalability, Packaging Cost. discuss Discussion with SHG Members Tara Tukaram Ghamevad,Godavari Radheshyam Markade

Krushi Seva Kendr- Pesticide & Fertilizer procurement process, License,Profit Margin Farmer & KSK Shop , Recharge Shaft- Visited Recharge Shaft Plot. Discussion on Area Irrigated ,also Increase in the water level of Well Fisheries Activity-Discussion with Farmer Mr Mahesh Bicchevar about the benefits from fisheries activity
14 April 2019 Meeting At PMU Office Mr. Digamber Nemade Accounts Officer-PMU
Miss Sweta Khade-M&E Officer PMU III. Shailesh Patil, Market Linkage Specialist PMU, CAIM
Raju Ingle, Project Coordinator – MAVIM Manoj P. Ingle, Agronomist, PMU, CAIM
15 April 2019
PMU Meeting At PMU Office Bci-Cotton Connect
Mr. Kiran More-BCI-Cotton Connect - Programme Manager Mr. Vivek Deshmukh BCI-Cotton Connect Programme Manager
Meeting At PMU Office Icici District Coordinator
Mr. Khushal Rathod - District Coordinator Mr. Raju Ingle-CAIM MAVIM Regional Coordinator Mr. Amit Shinde ICICI District Coordinator
Meeting With Ngo Representative
Mr. Nivrutti Patil-KVK Washim Mr. Praveen Sarnaik-KVK Washim Mr.Balasaheb Chimurkar-Vaishnavi Samajik Shaishnik Sanstha- Yavatmal Mr. Ashok Ingole Vaishnavi Samajik Shaishnik Sanstha Kalamb-Yavatmal
Mr. Dinesh Thakre-MPSSM-Jalgaon Jamod Buldana Nilesh Jaware-MPSSM -Malkapur-Buldana
Mr. Praveen Chivane KJBF Seloo-Wardha Sachin Sonune-KJBF-Samudrapur-Wardha
Mr. Suresh Lule – Yuva Barishitakli
16 April 2019
Mr. Naveen Anand
16/04/2019 Cluster- Dharni
Village- Tingrya & Baru Visiting person- Mr. Navin Anand Honey /Bee keeping
Meeting with Individual beneficiaries IV. Gaurav Watane – Agri. Business Expert – Amravati Amol Landge
- AFO; Amol Patil - Cluster Coordinator Sonu Ganesh Sitole – President and Anita Subhash, Secretary , SHG Tingrya Village Uday Singh Chauhan , Gram Panchayat Member – Tingrya , Dharni
Tarabai Deepak Shivsagar – Goat Rearing Om Prakash Sukhdeve , Cluster Coordinator , Chikhaldhara Kishore Khatkar, Agri. Field Officer, Chikhaldhar
Mushroom cultivation Meeting with Individual beneficiaries and suggestion to keep business sustainability
Backyard Poultry Meeting with Individual beneficiaries
Dairy Meeting with Members of Melghat JLG - Milk collection centre and keeping the books of records.
Commercial Poultry – Baru Village , Dharni
Discussion with beneficiary Visit to village Baru at unit of Sau. Rakhi Pramod Kasdekar ;Chandra Kant Hinge, Community Mobilizer, SRTT Gaurav Watane – Agri. Business Expert – Amravati Amol Landge - AFO Amol Patil - Cluster Coordinator
Mr. Sanjay Gupta
16 April 2019 Wardha Dist.
Seloo- Seloo- Dall mill, Higani- FPC, Shivangaon- Sparck Unit & Zero Budget Natural Farming. Wardha- The Rural Mall, Satoda – Cotton to Cloth. Ashti- CMRC Rural Godown.

India
Convergence of Agricultural Interventions in Maharashtra's Distressed DistrictsProgramme
Project Completion Report
Appendix 9: Final wrap-up/stakeholder workshop findings
Document Date: 30/06/2019
Project No. 1100001470
Loan ID 1000003372
Asia and the Pacific Division Programme Management Department
This document will be publicly disclosed unless there is written dissent on its disclosure by the Borrower at the time of this document submissionto IFAD or no later than the project closing date.


Appendix 9: Stakeholder’s workshop finding ( to be added later)
Convergence of Agricultural Interventions in Maharashtra (CAIM) Minutes of meeting
Time: 10:00 am Date: 27/05/2019
The said meeting was conducted in regard to discuss key Project Completion Report (PCR) findings as the CAIM consultants and also to discuss the major findings of End Line Survey conducted by NCAER team, New Delhi. Half day Workshop was organised by CAIM-PMU, which mainly includes NCAER team, CAIM consultants, IFAD representatives, MAVIM/ CMRC representatives & DPMT staff. The meeting was chaired by Hon. Divisional Commissioner sir & Ms. Rasha Omar, IFAD Country Head. At the beginning of meeting, Hon. Commissioner Sir briefed about projects goals & objectives work done during the project period and also discussed various activities like Contract Farming, BCI, LEISA, etc. conducted during project implementation. At the same time income generating activities conducted by MAVIM/ CMRC SHG’s were also appreciated which also includes ultra poor support activities. About NCAER Presentation (Topic: End line Survey, Total 63 Pages): The power point presentation was prepared and presented by Ms. Laxmi Joshi & others based on the details collected from village level by the surveyor team appointed by NCAER. The data for said survey was collected by two different methods: (i) Close Ended Questionnaire & (ii) Focused Discussion Group (FGD). The total sample size per village was of 17 HH for CAIM having 3 to 4 villages per cluster & one control village from each cluster. About PCR Presentation (Topic: Key PCR Findings, Total 37 Pages): The power point presentation was prepared and presented based on the details collected from visits conducted at village level by the consultant team and by discussion conducted with CAIM households. In all 4 to 5 villages were selected on random basis per district were visited. Various aspects were taken into consideration at the time of discussion conducted with CAIM households subject to sustainability of activities. The bulleted points noted during the meeting were as below:
CAIM project was lagging in presenting Success Story & documentation with respect to the various
innovative activities conducted at various levels.
CAIM project had target of contributing/ assisting people at design time, which was 73% male & 37%
female from the total CAIM beneficiary, which is already achieved.
Conversion to Organic / LEISA is very high among CAIM beneficiaries due to low cost agricultural
cost and its long term benefits.
Village Information Systems (VIC’s) implanted under VDC can perform remarkable work if organised
well by taking Gram panchayat into confidence.
Due to various types of SWC work performed in CAIM villages on regular basis, water level
increased sufficiently which helped in improving irrigation and increasing the farm yield and resulted
in increase in income of CAIM household by 25,000/- to 30,000/-. At the same time Crop
diversification with risk taking ability increased up to some extent.
At the same time under Livestock activity like commercial poultry, total household income was
increased by Rs. 7,000/- to 10,000/- within the span of 40 to 45 days.
Convergence of activities from various government activities and schemes is very high due to
various government programs were contributed in IFAD program.
During the discussion with CAIM people, it was found that total 39 Farmer Producer Companies
(FPC’s) were started in project villages, but during the visit conduced and discussion held with FPC
people it was found that only 9 of them are working successfully and performing good business; it
was suggested by PCR team to link them with government funding agency like NABARD or
NABKISAN to normalise their functioning.

Questions raised by participants during the meeting, and discussion held on it were as below:
Sr. No. Question Discussion
1 What is the way of sustainability to project?
Post project sustainability is better assured for the CMRCs which are able to charge for the services, recover their operational costs, and have corpus funds. At the level of SHGs, more than 70% of the SHG’s already crossed the minimum criteria decided for their sustainability after CAIM. For other grassroots entities like the Producer Units supported by BCI, the producers will continue to benefit from BCI support thanks to Cotton Connect sustaining and expanding the activities in Vidarbha region. The sustainability of other entities like PCs, VDCs, JLGs, would require sponsor organizations that can provide handholding and facilitate access to financial assistance. For PCs, the project already provided the list to SFAC and some of the better performing PCs will participate in the forthcoming WB funded SMART project. PCR team proposed a dedicated apex entity for VDCs and JLGs to sustain their operation.
2 How dose VIC model helping in implementing sustainable agriculture based activities?
PCR team members said that, during their visit they found that VIC had provided customised model in CAIM village as a Knowledge sharing hub and will have a good future. The IFAD mission clarified that models of VICs managed by producer organizations exist in Andhra Pradesh & Uttarakhand. In Andhra Pradesh, there is an effort to digitize the knowledge in farmers one stop shops.
3
How BCI demonstration model effects on Control villages? Also, what is the hindrance in percolating their best practices?
As per PCR team, the speed of adoption of BCI activities increased by 14% during the project implementation period due to its benefits and good results. There is no any activity named BCI in control villages; and this despite the fact that Govt of Maharashtra is implementing the package of practice promoted by BCI given its long term benefits.
4
Food security issue was raised by
Ms. Louise McDonald, Country Director, Bhutan, IFAD. She asked specific question like how and whom is affected by food insecurity (either Ultra-poor, Women headed family or other families) and how long is the food insecurity period?
As per NCAER team, the food insecurity question was general and the question did not go into details. NCAER thereafter analysed the data and provided a list of the villages where food insecurity was reported as high in CAIM and control villages. This list is now informing a verification exercise to triangulate the data provided in the survey.
5 What are the indicators for women empowerment in CAIM households?
As per PCR team, 64.4% improvement is found in women's status in CAIM households during the project implementation period. Women’s opinion is considered in many of the household situations like purchasing of assets, participating in village level meetings & discussions, having joint bank accounts, etc.
6
Mr. Marc, Team leader, IFAD asked that CFC’s belong to women entrepreneurs and FPC’s belong to men. But, women SHG’s with CFC are getting less amount of loan for investments than men.
Mr. Ingle, MAVIM representative said that they will include one agricultural/ management graduate member in SHG/ CMRC, so that it will help to increase the likelihood of getting loan from any of the financial institutions.
7
Mr. Mark, Team leader, IFAD asked that as per PCR & NCAER team PPT, training component is good in few cases but below 30% in some of the cases. What are those trainings?
Ms Shweta, MEO PMU, said that all details of the training were already submitted to Mr. Lobo. The NCAER report also includes beneficiary assessment for some of the technical and marketing trainings received.
As instructed by Hon. Project Director sir & Ms. Rasha of IFAD, four groups were formed with four different topics and about 30 minutes were given for discussion. All the CAIM participants including MAVIM representatives contributed to the group work and the details are as below:

Team 1: Topic: Main impacts of CAIM Presented by: Mrs. Shweta Khade
Points discussed during presentation were as below:
- Women Empowerment - Soil and Water Conservation - Sustainable Agriculture and Market Linkage - SME and Livestock
Team 2: Topic: Innovative Techniques Presented by: Mrs.Rupali Dabhane
Points discussed during presentation were as below:
- Fishery & Pashanbedh (coleus) Cultivation activity conducted in Yavatmal district at a large
- Contract farming of Baby corn in Akola district - Small holder Commercial Poultry for tribal women in Amravati
and Yavatmal district
- Model of Pashusakhi/Paravets through CAIM Project - Initiative to Joint Asset to Ownership in CAIM villages
Team 3: Topic: Lessons learned from CAIM implementation Presented by: Mr. Vivek Adkine
Points discussed during presentation were as below:
- Regular capacity building efforts over time have developed a common understanding
- Leadership development among the beneficiaries is key for implementation of project activity smoothly
- Flexibility to implement the project and diversified activities gave opportunity to implement various activities
- Better coordination between DPMT-IA & MAVIM
Team 4: Topic: CAIM Sustainability & Exit Strategy Presented by: Mr. Bhalchandra Gawande
Points discussed during presentation were as below:
- Strength and diversity of CAIM activities - Withdrawal & Handover of activities to respective government
departments
- Role of Village level Institutions ( SHG, VDC,JLG, PGs, VIC, etc)
- Role of Community M74anaged Resource Centre (CMRC) - Role of Farmer Producer Organisation (FPO’s) - Role of Line Department for identification of Market Player to
sustain various activities
At the end of program Hon. Commissioner said for the programs monitored from Mumbai like POCRA & VSTF, it is very easy to handle and monitor the activities taking place in the field under the supervision of government departments and also to address sustainability issues. Regarding the contractual staff turnover, he said that, it is a common scenario in every project and also in government department. Regarding the Project Completion Report (PCR) draft and report submission at Mantralaya to Hon. Principal Secretary sir, tentative date will be 30
th May 2019. At the same time, Hon. Commissioner Sir had already
talked regarding handing over these activities at higher level. Also Project Completion Report (PCR) draft and report submission at Ministry of Agriculture GOI tentative date will be 5
th June 2019.
Mrs. Rupali Dabhane, ABE-CAIM PMU, had concluded the session by giving vote of thanks to all present in the meeting and requested to have food organised by CAIM-PMU before leaving to their destination.


India
Convergence of Agricultural Interventions in Maharashtra's Distressed DistrictsProgramme
Project Completion Report
Annex: ANNEX - Case study on broad based furrow (BBF)
Document Date: 30/06/2019
Project No. 1100001470
Loan ID 1000003372
Asia and the Pacific Division Programme Management Department
This document will be publicly disclosed unless there is written dissent on its disclosure by the Borrower at the time of this document submissionto IFAD or no later than the project closing date.


ANNEX: Case study on broad based furrow (BBF)
Overview of practices, objectives and relevance to context
CAIM Broad based furrows involved making furrows about 120 cm apart and sowing crops. BBF is an in situ soil and moisture conservation and drainage technology suitable notably for clay soils, which are frequently waterlogged during the rainy season. Up to four rows of crops can be sown with precision seeders on sloping beds, which conserve water and channel excess runoff to small tanks for later use
1
Objectives of such schemes include: i) encourage moisture in deep soils that may have sufficient soil moisture storage and allow double cropping; ii) dispose safely of surplus surface run-off without causing erosion; iii) provide a better drained and more easily cultivated soil in the beds for early and timely planting
2;
Modalities for implementation and dissemination
In 2014, BBF had only been tested in 480 ha. MTR 2014 considered initial trials to be successful and recommended to scale it up alongside with increased access to machinery services and implement
3.
Dissemination method included notably on farm demonstrations and farmers training. After recommendations from 2014 and 2015 missions, the project promoted the purchase of BBF planters by SHGs and VDC with 30% subsid (339 planted distributed by 2016 but distribution stopped after). It also carried out BBF awareness along with the training on cotton production under BCI. Thanks to such approach, dissemination grew rapidly notably for soybean but also groundnut, gram, wheat and tur: In 2014-15 12,563 farmers from 338 villages got training. 27,865 acres of soyabean were planted using BBF. There was then a slight decrease from 2015 to 2017 (from 22,059ha till 19,806 ha mostly covering soybean and groundnut). Then, it doubled in 2018 (40,863 ha) Results at farmers’level and selected field examples
All in all, review of BBF results were always positive but figures vary across study, crops and years, without consistent economic analysis. All mention that BBF enabled them to i) save seeds that can be very costly, (10 to 30% less seeds required); ii) retain better soil moisture, therefore requiring less irrigation water; iii) have better drained fields and less water runoff. In addition, along PCRVM, women mentioned that the technology was reducing their labor as they used to be involved in manual planting (against mechanized BBF planting) and because weeding is easier in BBF. Such enabled them to reduce their production cost while improving their yields from 10 to 50%. Such results are consistent with other sample of research carried out in India that show increased yield from 5 to 30%, seed saving of around 20-25%, water saving between 25 to 50% and reduced run off
4. As a result, BBF farmers interviewed
during PCRVM mentioned that each year more farmers were adopting BBF. More specifically, the following examples and data could be retrieved but they sometimes mix BBF with other interventions:
In 2013-14, in Balapur cluster, 100 HH practiced BBF for the main kharif crop which is soya. They got an extra 2 q/ac. In Lodi, 10 farmers tried and obtained between 5 to 10 more quintals per acre for soya. Therefore, 100 farmers were planning to adopt practices. DoA was therefore willing to demonstrate inoculum and provide a BBF planter
5.
1 FAO< 2016, Save and Grow in practice: maize, rice, wheat A guide to sustainable cereal production.
2 http://www.fao.org/3/T0321E/t0321e-11.htm
3 CAIM, January 2014, Mid-term review. Paragraph 22; CAIM, March 2015, Supervision report 2015. Paragraph 21 4 three references could be found in India, notably on soybean: 1) http://vikaspedia.in/agriculture ; 2) Verma, P.D.,
Parmanand and Tamrakar,S.K. (2017). Effect of broad bed furrow method for rainfed soybean cultivation at Balodabazar district of Chhattisgarh. Internat. J. Agric. Engg., 10(2) ;3) Singh, Devvrat & Vyas, A.K. & Gupta, Girish & Ramteke, Rajkumar & Khan, I.R.. (2011). Tractor-drawn broad bed furrow seed drill machine to overcome moisture stress for soybean (Glycine max) in Vertisols. Indian Journal of Agricultural Sciences. 81. 941-944 5 CAIM, January 2014, Mid-term review. Annex D, field report

In 2014-15, “data from 359 villages showed that use of BBF in soybean resulted in 49% yield increase (195 kg/ac) and reduction in seed use which allows for an additional cost for machine hire. It calculated that farmers benefited by Rs8,300 per acre
6.
In 2015-16, among a sample of 540 HH surveyed in CAIM village, 432 cultivated land, 203 benefited from soybean training and 84ha was reported under soybean BBF instead of 8ha in control. Farmers mentioned increase in yield by 1 to 3 q/ha for Soybean, Tur and Red Gram
7
SM 2016 reported successful implementation of BBF to support soybean. It mentioned that it” improves water infiltration as well as drainage, which contribute to higher yields. Farmers adopting BBF obtained on average an increase in yield of 0.25 to 0.75 mt/ha”
8.
Farmers adopting BBF obtained on an average 20% increase in yield and required up to 30% lower seed rate which enabled them to raise their income by 18%
9
During the PCRVM, two farmers mentioned that they use 10% less seeds and obtain 10% higher
yields. Similarly results were reported in Jalgaon Ja cluster for 806 acres under soybean BBF10.
.
Constrains
Some report also mention that BBF was not adapted to soils of specific villages. More generally, BBF profitability and scaling up potential may vary according to local agro-ecological conditions:
Indeed, the technique usually works best on deep vertisols (heavy black clay soils sometimes called cotton soils) in areas with dependable rainfall averaging 750 mm or more. Such soils can store larger quantity of water but can easily be waterlogged and difficult to plant on time
11.Additional access to
irrigation and other water storage may be needed for areas with less rainfall or less favorable soils12
.
At the time of design, rainfall patterns met such requirements in average but with some districts falling largely under 750 mm per year. Situation has worsened since then, with increasing variability between flooding and dry spell events.
The area contains a majority of deep black cotton soils which are theoretically the best to implement BBF. However, shallow soils with low water retention capacity make up 35% of the cultivated area (up to 50% in Yavmatmal for instance). Many areas have very low organic carbon levels < .5%
13
IA reports, SM report 2014-2015 and interviews with BBF farmers alongside the PCRVM mission enabled to identify key constrains related to time and availability of adapted mechanization services14: Manual BBF is extremely time consuming meanwhile farmers mentioned increased labor shortage and labor costs as analyzed in other reports
15.. Women increased employment outside the farm thanks to
CAIM also decrease their availability on the farm. Farmers need to have access to BBF implement and mechanized services. Yet, not all villages have sufficient access to BBF implements. Indeed, CAIM only
distributed 339 implements while farmers evaluated that 1 BBF implement can only serve 20-25 acres
during a very short planting time of 10-15 days. One BBF implement costs between 40,000 to 50,000r
and needs to be pulled by bullock or tractor. It is therefore not accessible for poorer farmers. Finally, even mechanized BBF planting still takes more time than normal planting (up to 50% more time).
6 CAIM, March 2015, Supervision report 2015. Agreed action 14. Paragraph 18
7 CAIM, 2016, Annual outcome survey 2015. P 9-10
8 CAIM, 2016, supervision mission report 2016. Paragraph 23
9 CAIM, 2017, supervision mission report 2017
10 CAIM, 2017, cluster completion report for Jalgaon Ja cluster, 2012-2017.
11 http://www.fao.org/3/T0321E/t0321e-11.htm
12 http://www.fao.org/3/T0321E/t0321e-11.htm
13 CAIM, 2009, Project design report. Annex WP 1
14 Also mentioned in IA cluster completion report for Risod, Washim
15 Technoserve, 2019, Towards doubling cotton incomes in Maharashrata. Idh sustainable trade initiative 2019. P21
show that labor shortage is among farmers key constrains. P39 analyze that increased labor shortage and increased cost come both from sharp decline in agricultural workforce since 2000 and increased cost due to government program for rural employment

Modalities for scaling up
To facilitate further scaling up, the following modalities have been identified:
Closely dissemination of BBF technologies with schemes to develop mechanization services targeted to poorer farmers (for instance, as done by CAIM, supporting SHG/CMRC and producer groups to purchase it at subsidized rate, development of specific credit scheme etc.).
BBF need to be integrated in specific package that meet farmers conditions. BBF alone may not be sufficient to address water constrains in drier and less fertile lands. Some villages may have strong access to mechanization or labor while others may be severely constrained
16. It is key to first provide
an initial diagnosis of prevailing agro-ecological conditions, access to services, farming practices and constrains of poorer farmers (i.e. access to credit, drought power, labor, land etc.)
17.
Farmers shall be supported to record their farm practices and analyze their incomes in their groups so as to progressively adapt and adopt the proposed innovations. As done by BCI, such data shall be centralized and analyzed to facilitate monitoring and dissemination of best practices.
Finally, interviews with farmers showed that farmers best adopted innovations that have been successfully adopted by other farmers. Further exchange visits with successful CAIM villages could be facilitated along the cropping season
16
During field interviews, farmers noted that availability of mechanization services seem to have increased sharply during the
period, in conjunction with rising labor constrains. For instance, in Talegaon, farmers of the spark unit mentioned that there were 40 tractors and 20 BBF in the village. However, availability of BBF was still insufficient and vary across villages 17
CAIM first main review mission report 2011 highlighted that DPRs did not contain such diagnostics and recommended that it
shall be undertaken. Paragraph 100

India
Convergence of Agricultural Interventions in Maharashtra's Distressed DistrictsProgramme
Project Completion Report
Annex: Annex - Biodynamic Compost (BDC)
Document Date: 30/06/2019
Project No. 1100001470
Loan ID 1000003372
Asia and the Pacific Division Programme Management Department
This document will be publicly disclosed unless there is written dissent on its disclosure by the Borrower at the time of this document submissionto IFAD or no later than the project closing date.


ANNEX : Biodynamic Compost (BDC)
Overview of BDC
Bio-dynamic compost (BDC) is a type of organic matter compost that was analyzed in detailed in MTR:1:
One heap of BDC (around 1 ton) is made from two tons of organic matter including around 30%
animal manure. Material is built up a layers, and can include some woody matter such as cotton
stalks. An inoculum, S9, is diluted added to each layer. It could be replaced by home made cow pat
pit (CPP) which can also be used for seed treatment, plant tonic or pesticide spray.2.
The heap is plastered with a slurry made from animal manure and matures between 40 and 60 days
Application of 3 tons per acre is recommended for most crops. Chemical analysis shows one tonne of
BDC contains 12 kg N, 12 kg P and 10 kg K. Taking account of the cost of S9 inoculum and labour to
make the heap, BDC may be a cheaper source of plant nutrients than purchased mineral fertilisers
Table 1 Cost of nutrients in biodynamic composts
Table 2 Analysis of BDC and other composts
Source: CAIM,2014, mid term supervision report. Table 8 and 9 MPKV, Rahru, 2008
Modalities for implementation and dissemination in the project
Dissemination of BDC was notably done through supply of subsidized BDC kit and establishment of BDC
units. Position of project on BDC and its dissemination evolved across project time:
In project design, farmers groups were to receive on-the-job training and demonstrations on organic
agriculture including compost pits (target of 1200), biodynamic fertilisers and Vermicompost.
In 2014, BDC had been tried in all clusters. MTR 2014 provided positive feedback on BDC against
vermicompost and recommended further study and potential scaling up.
In 2015, study had been done and 11,269 heaps of BDC were made across districts. However, the
study was not sufficient. SM2015 pointed out influence of specific NGO on the dissemination of BDC
in specific clusters and recommended further study3.
In 2016, the supervision mission reviewed that 1870 additional BDC unit had been made. It
recommended to avoid dependency to BDC kit from one company and recommended to support CPP
1 CAIM, January 2014, Mid-term review. Annex A. pg 65 going
2 To make 35 to 40 kg of S9 requires 60 kg of fresh dung from a lactating cow, 250 gm of gur, 250 gm of eggshells
and 250 gm of basalt powder plus 2 gm 502, 2 gm 506 and 20 ml 507 (these cost Rs500). This cow pat pit (CPP) mixture is fermented i na small brick-lined pit for 45 to 60 days. 3 61% are in one district and 24% in one cluster (Telhara) supported by SARG. a leading proponent of bio-dynamics
in India. CAIM, 2015, supervision mission 2015. Annex B p 53 going

production, diversify organic fertilization methods and review their outcomes objectively. The project
should limit subsidy for demonstration for a product to only one year 4.
In 2016-17, further 1,148 units of biodynamic compost (BDC) were established against a target of
3,000 units. 3,445 units were planned before the end of March 20175.
Results at farmers’ level and selected field examples
Positive results were reported across supervision mission, BDC study, IA cluster reports and PCR report
in terms of increased fertility, improved soil structure and increased yield. However, economic analysis
were not consistent, were not collected across different organic methods and diversely accounted for
labor, collection of animal and green manure and water:
PDKV trials 10% increased organic content, nitrogen, phosphorus in soil and similar or higher yields
than obtained with conventional fertiliser for both soyabean and wheat. Input costs were much lower
but it did not take into account labor and did not compare with other composting methods6
BD composting is relatively easy and quick to make, results in reduction of input cost and improve soil
structure. However further comparison with other methods are needed 5.
In Jalgaon, 38% of farmers who tried BDC compost continued it and that it reduced cost of production
by INR 1500 per acre and increased yield by 15%7.
Along PCRVM field visits, farmers who had adopted BDC confirmed positive results:
They mentioned that it makes “softer soil that facilitates weeding, increased water retention and
therefore improved yields and increased resilience on rainfed, decreased use of fertilizer”.
Women notably highlighted that it reduces their specific work load: softer soils makes it easier to
manually weed meanwhile use of compost decrease the application of inorganic fertilizer.
Farmers said that adoption was usually increasing. For instance, in Rustamabaa, farmers
mentioned that 30 were trained but 40 to 45 were now using such method. In Kherda, 20% use now
BDC. In Didola, 27 farmers are registered BCI but 40 farmers use it among 100 village farmers. On
the other hand, in Asalgaon, farmers said that only 4 to 5% use it.
Supervision mission, PCR and PCRVM field observations also noticed examples of production of CPP and
its use to both prepare BDC but also to treat seeds and manage pests:
MTR 2014 noted CAIM was also promoting the manufacture of S9 in villages. An SHG in Karla village of Telhara cluster has established a 23 pit CPP unit to make CPP for sale. Linked to BDC, some IAs were producing liquid organic preparations for use as foliar feeds, pesticides and seed treatment
1.
PCR team reported that several farmers had started making S-9 culture from Cow Pat Pit (CPP) which they sold in the local market at INR 150 per kg. (Discussion with farmers in Dindoli khurd and also Agriculture Business Expert of Buldana).
PCRVM mission also interviewed farmers in Rustamabaa who were producing CPP. They also used It as seed treatment and pest management and y were less affected by pests than their neighbors.
4 CAIM, 2016, supervision mission 2016. Paragraph 24 to 27
5 CAIM, 2017, supervision mission. Paragraph 29
6 PDKV study reviewed biodynamic organic practices, organic practices and conventional ones in 2015-16
for 116 farmers in 6 districts and CAIM, 2015, supervision mission 2015 7 CAIM, 2017, Jalgaon cluster completion report.

Constrains and barriers for upscaling
The following constrains were identified during the PCRVM as well as MTR2014 and some IA report8:
Labor constrains: during PCRVM field visits, farmers explained that slower dissemination came from
the fact that it was time consuming and difficult (60 days, 26 holes to be made, regular mixing).
Lack of manure and/or transportation. BDC can be made without animal manure, although in this
case more green leafy material shall be gathered and transported and composting also takes longer.
Lack of water: Farmers mentioned that BDC requires also around 1000 L of water and therefore can
only be done during rainy season for farmers without irrigation9.
Access to inoculum (S9 or CPP) differs across villages and may be costly. In Kherda, farmers
purchased S9 and said it costs 250 r per L / acre.
Lack of knowledge and potential wrong application: SM2011 MTR 2014 reported that, In Achalpur
cluster of Amravati district, farmers seemed to think that very low amounts of BDC (200 kg/acre) can
replace 50 kg of mineral fertilizer. In fact, they need between 500 kg and 1000 kg to provide as much
NPK. The team met a PC which was carrying out soil testing following CAIM support. The soil health
card mentioned required quantity of N, P, K and associated mineral fertilizer (Urea, DAP, MOP) but
not organic fertilizer quantity that may defer according to composting methods.
All in all, adopting BDC is likely to be diversely feasible and profitable according to farmers
conditions (both poverty levels, access to livestock, transportation, water, organic inputs and
extension):
Smaller and poorer farmers are less likely to adopt without livestock, transportation and limited
water. Indeed, transporting manure costs from 600 to 900 INR per trolley meanwhile trolley with
manure cost between 1500 to 3000 INR. Economic analysis provided in MTR 2014 was assuming
30% manual manure which is much more expansive but proportions are likely to vary.
Adoption and dissemination appeared often connected to specific schemes providing advise
and inputs such as BCI intervention and organic certification schemes. In Akola, one farmer was
doing vermicompost with ATMA support. On the other hand, 2011 report mentioned that in several
places, farmers seem to rely more on their input suppliers10
who may not promote home-made
composts
To upscale BDC in an inclusive way, integrated approach is needed to address such constrains and
pay specific attention to issues faced by poorer farmers.:
Associate BDC development with livestock development and SHG new income activities. SHG
and Ultra poor schemes contributed to increase access to manure. For landless women, selling
manure became sometimes the main source of income from animals. For women who belonged to
poor farm households, livestock ownership directly contributing to raise farm productivity. As identified
in some reports and seen in some CMRC, SHG, service centres and livestock groups could be
supported to go one step further to produce and sell CPP and even compost instead of raw manure.
Upgrade extension services: i) farmers shall be encouraged to test their compost and soil testing
cards shall incorporate recommendations for application of manure and compost; ii) extension
programs and app to integrate organic composting
Conduct more systematic assessment of various organic and inorganic methods and support
farmers to actually keep records and carry out cost benefit analysis. As done by BCI such data shall
be centralized and analysed
8 CAIM, 2017, Clompletion report for Risod cluster in Washim;
9 Worst for vermicompost. Field interview showed that farmers were watering it 2 to 3 times a day during dry season and therefore
their vermicompost was very close to their well. 10
CAIM, 2011, First main review mission report. Paragraph 100