
India Business Forum
22
India Destination of Choice for Global Business
-
Upload
naveen-narayanan -
Category
Business
-
view
110 -
download
1
Transcript of India Business Forum
India Destination of Choice for Global Business
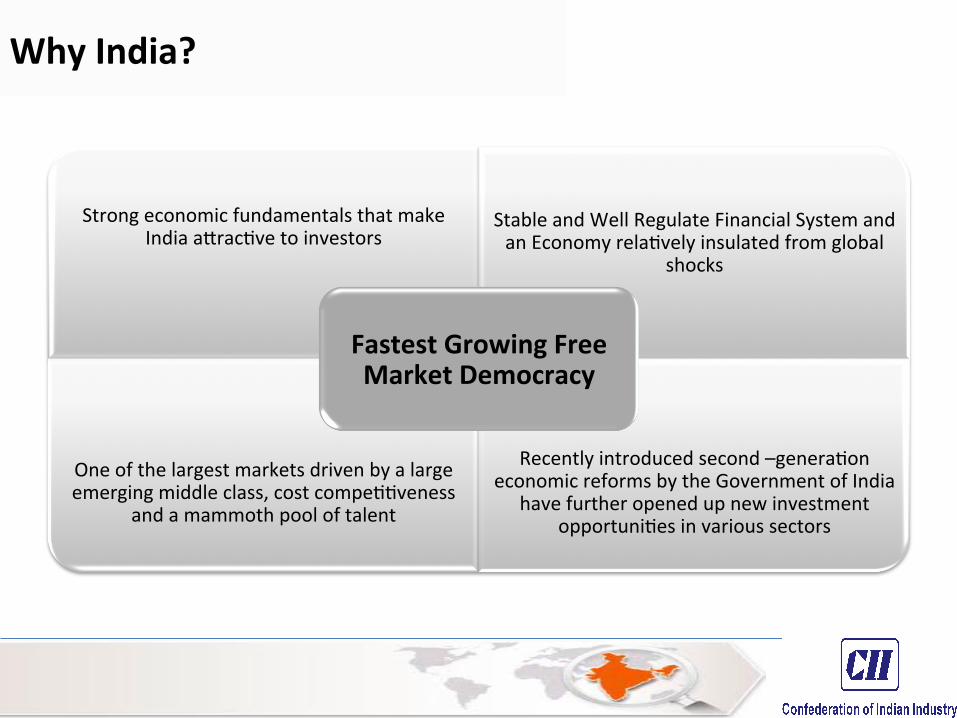
Why India?
Strong economic fundamentals that make India a5rac6ve to investors
Stable and Well Regulate Financial System and an Economy rela6vely insulated from global
shocks
One of the largest markets driven by a large emerging middle class, cost compe66veness
and a mammoth pool of talent
Recently introduced second –genera6on economic reforms by the Government of India
have further opened up new investment opportuni6es in various sectors
Fastest Growing Free Market Democracy
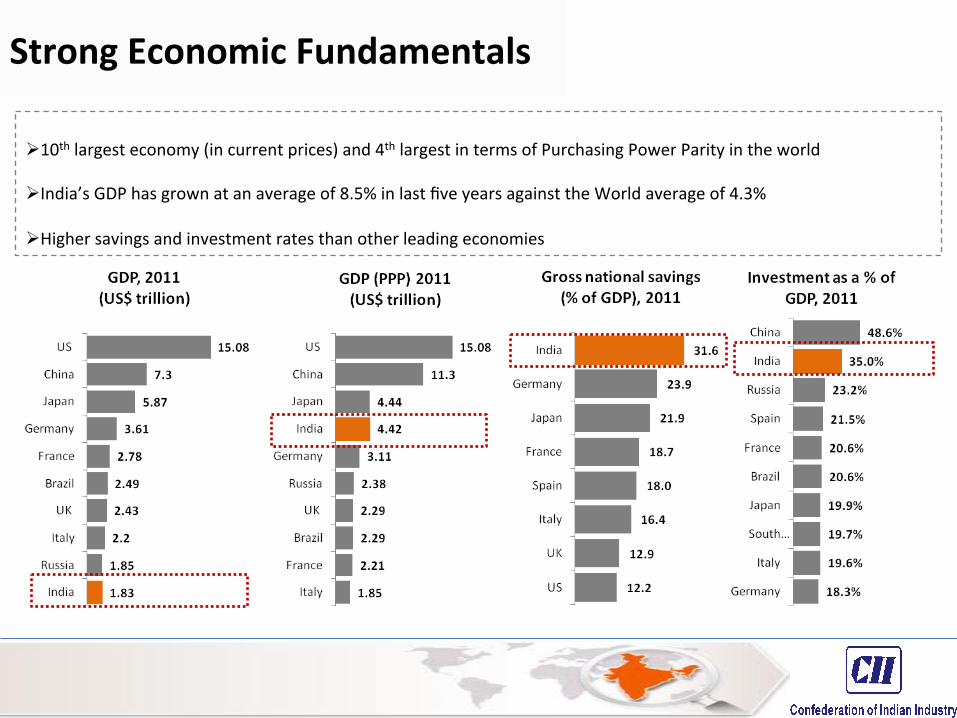
Ø 10th largest economy (in current prices) and 4th largest in terms of Purchasing Power Parity in the world
Ø India’s GDP has grown at an average of 8.5% in last five years against the World average of 4.3%
Ø Higher savings and investment rates than other leading economies
Strong Economic Fundamentals
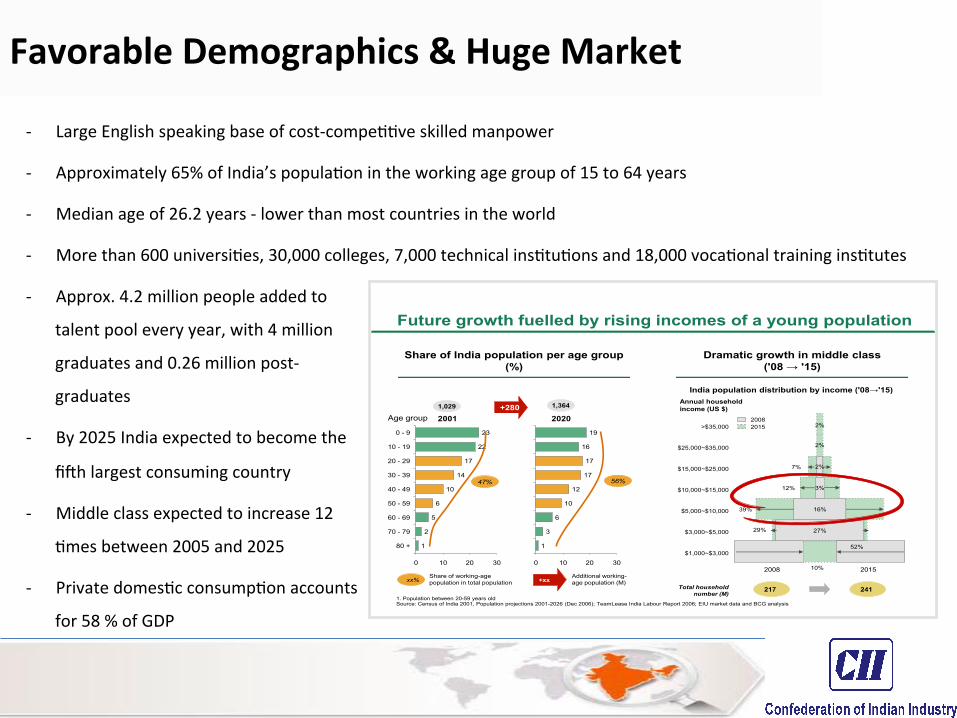
-‐ Large English speaking base of cost-‐compe66ve skilled manpower
-‐ Approximately 65% of India’s popula6on in the working age group of 15 to 64 years
-‐ Median age of 26.2 years -‐ lower than most countries in the world
-‐ More than 600 universi6es, 30,000 colleges, 7,000 technical ins6tu6ons and 18,000 voca6onal training ins6tutes
Future growth fuelled by rising incomes of a young population
Share of India population per age group (%)
Dramatic growth in middle class ('08 → '15)
0
2001
80 + 1
70 - 79 2
60 - 69 5
50 - 59 6
40 - 49 10
10
30 - 39 14
20 - 29 17
10 - 19 22
0 - 9 23
20 30
Age group
47%
1,029
xx%Share of working-age population in total population +xx
Additional working-age population (M)
30
17
17
12
10
6
3
1
2020
0 10 20
16
19
56%
1,364+280
1. Population between 20-59 years oldSource: Census of India 2001, Population projections 2001-2026 (Dec 2006); TeamLease India Labour Report 2006; EIU market data and BCG analysis
India population distribution by income ('08→'15)
>$35,000
$25,000~$35,000
$15,000~$25,000
$10,000~$15,000
$5,000~$10,000
$3,000~$5,000
$1,000~$3,000
Total householdnumber (M)
217
2008 2015
241
2%
2%
2%
16%
3%
27%
10%
20082015
52%
7%
39%
12%
29%
Annual household income (US $)
-‐ Approx. 4.2 million people added to
talent pool every year, with 4 million
graduates and 0.26 million post-‐
graduates
-‐ By 2025 India expected to become the
fi\h largest consuming country
-‐ Middle class expected to increase 12
6mes between 2005 and 2025
-‐ Private domes6c consump6on accounts
for 58 % of GDP
Favorable Demographics & Huge Market
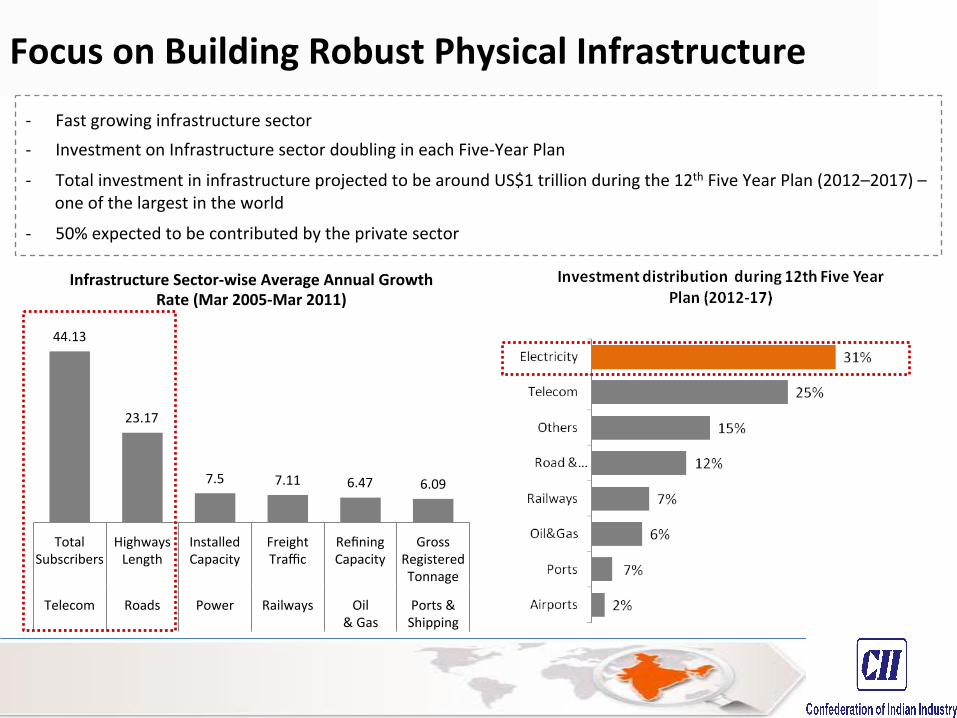
-‐ Fast growing infrastructure sector -‐ Investment on Infrastructure sector doubling in each Five-‐Year Plan
-‐ Total investment in infrastructure projected to be around US$1 trillion during the 12th Five Year Plan (2012–2017) – one of the largest in the world
-‐ 50% expected to be contributed by the private sector
44.13
23.17
7.5 7.11 6.47 6.09
Total Subscribers
Highways Length
Installed Capacity
Freight Traffic
Refining Capacity
Gross Registered Tonnage
Telecom Roads Power Railways Oil & Gas
Ports & Shipping
Infrastructure Sector-‐wise Average Annual Growth Rate (Mar 2005-‐Mar 2011)
Focus on Building Robust Physical Infrastructure
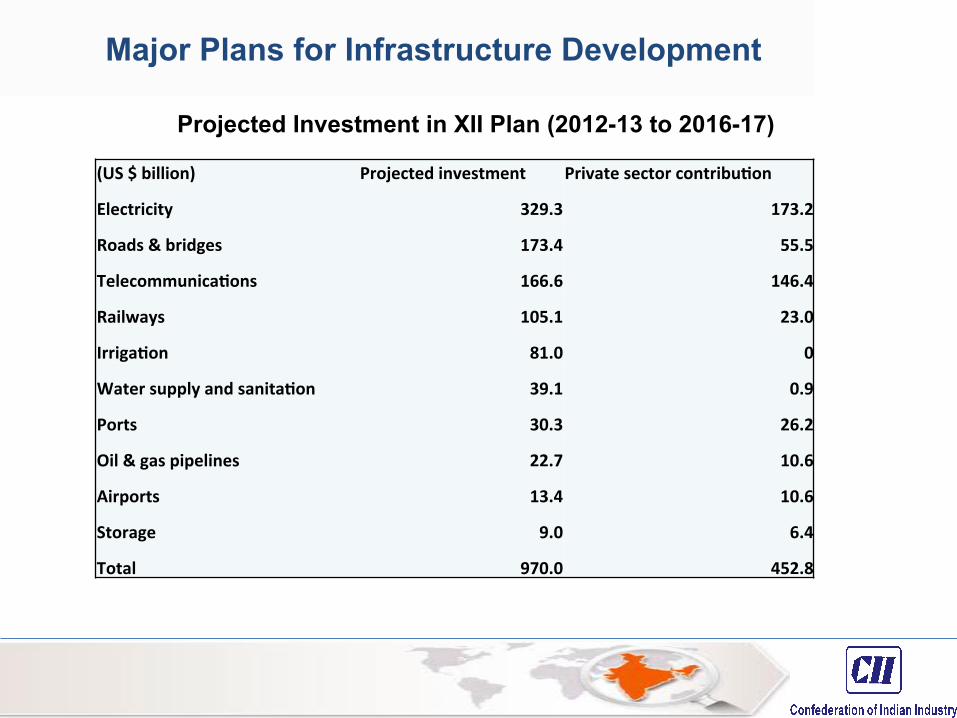
Major Plans for Infrastructure Development
(US $ billion) Projected investment Private sector contribuQon
Electricity 329.3 173.2
Roads & bridges 173.4 55.5
TelecommunicaQons 166.6 146.4
Railways 105.1 23.0
IrrigaQon 81.0 0
Water supply and sanitaQon 39.1 0.9
Ports 30.3 26.2
Oil & gas pipelines 22.7 10.6
Airports 13.4 10.6
Storage 9.0 6.4
Total 970.0 452.8
Projected Investment in XII Plan (2012-13 to 2016-17)
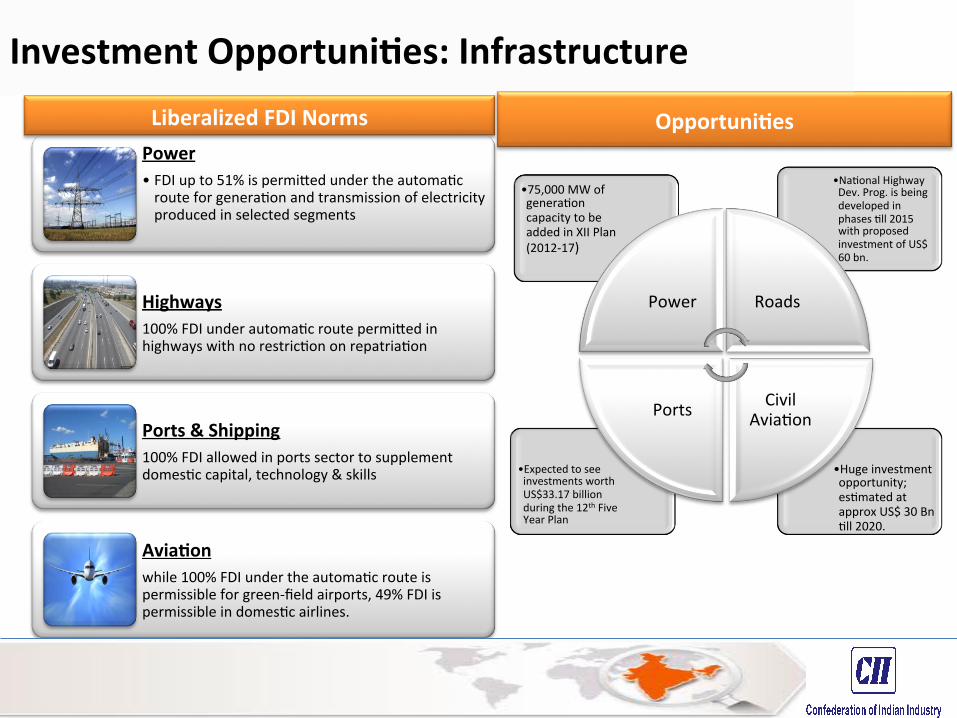
• Huge investment opportunity; es6mated at approx US$ 30 Bn 6ll 2020.
• Expected to see investments worth US$33.17 billion during the 12th Five Year Plan
• Na6onal Highway Dev. Prog. is being developed in phases 6ll 2015 with proposed investment of US$ 60 bn.
• 75,000 MW of genera6on capacity to be added in XII Plan (2012-‐17)
Power Roads
Civil Avia6on Ports
Power • FDI up to 51% is permi5ed under the automa6c route for genera6on and transmission of electricity produced in selected segments
Highways 100% FDI under automa6c route permi5ed in highways with no restric6on on repatria6on
Ports & Shipping 100% FDI allowed in ports sector to supplement domes6c capital, technology & skills
AviaQon while 100% FDI under the automa6c route is permissible for green-‐field airports, 49% FDI is permissible in domes6c airlines.
OpportuniQes
Investment OpportuniQes: Infrastructure Liberalized FDI Norms
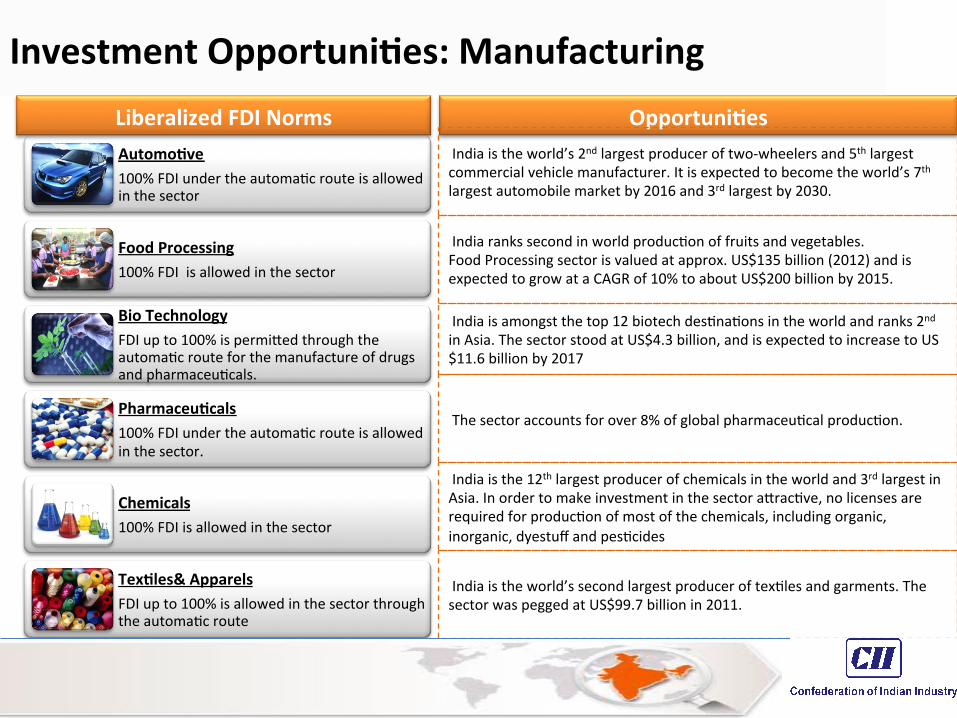
AutomoQve 100% FDI under the automa6c route is allowed in the sector
Food Processing 100% FDI is allowed in the sector
Bio Technology FDI up to 100% is permi5ed through the automa6c route for the manufacture of drugs and pharmaceu6cals.
PharmaceuQcals 100% FDI under the automa6c route is allowed in the sector.
Chemicals 100% FDI is allowed in the sector
TexQles& Apparels FDI up to 100% is allowed in the sector through the automa6c route
Liberalized FDI Norms
India ranks second in world produc6on of fruits and vegetables. Food Processing sector is valued at approx. US$135 billion (2012) and is expected to grow at a CAGR of 10% to about US$200 billion by 2015.
India is amongst the top 12 biotech des6na6ons in the world and ranks 2nd in Asia. The sector stood at US$4.3 billion, and is expected to increase to US$11.6 billion by 2017
OpportuniQes
India is the world’s second largest producer of tex6les and garments. The sector was pegged at US$99.7 billion in 2011.
India is the 12th largest producer of chemicals in the world and 3rd largest in Asia. In order to make investment in the sector a5rac6ve, no licenses are required for produc6on of most of the chemicals, including organic, inorganic, dyestuff and pes6cides
The sector accounts for over 8% of global pharmaceu6cal produc6on.
India is the world’s 2nd largest producer of two-‐wheelers and 5th largest commercial vehicle manufacturer. It is expected to become the world’s 7th largest automobile market by 2016 and 3rd largest by 2030.
Investment OpportuniQes: Manufacturing
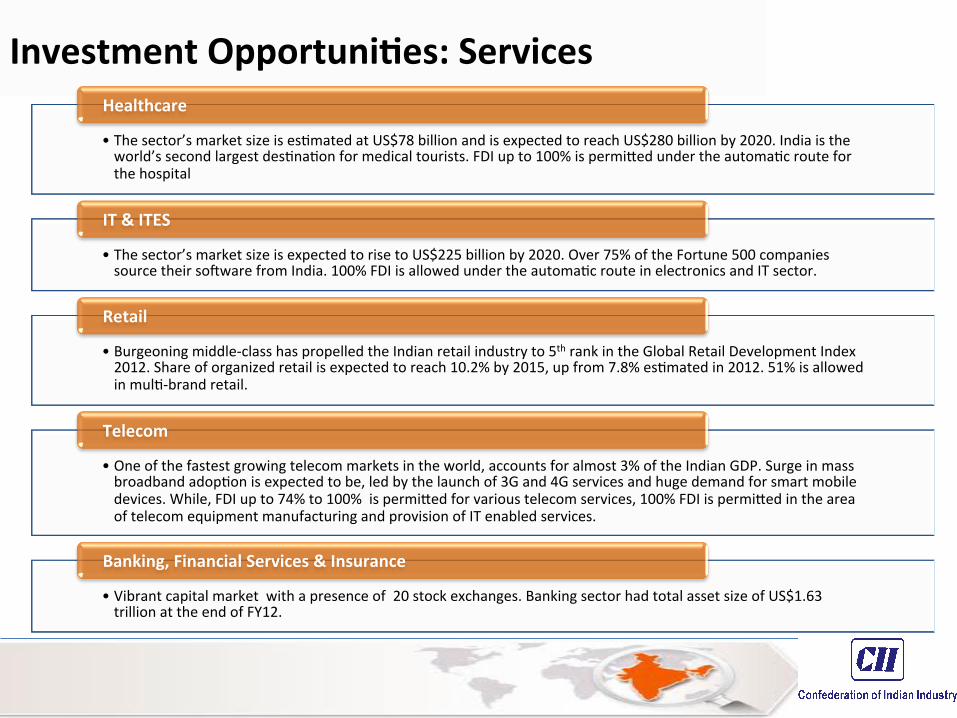
Investment OpportuniQes: Services
• The sector’s market size is es6mated at US$78 billion and is expected to reach US$280 billion by 2020. India is the world’s second largest des6na6on for medical tourists. FDI up to 100% is permi5ed under the automa6c route for the hospital
Healthcare
• The sector’s market size is expected to rise to US$225 billion by 2020. Over 75% of the Fortune 500 companies source their so\ware from India. 100% FDI is allowed under the automa6c route in electronics and IT sector.
IT & ITES
• Burgeoning middle-‐class has propelled the Indian retail industry to 5th rank in the Global Retail Development Index 2012. Share of organized retail is expected to reach 10.2% by 2015, up from 7.8% es6mated in 2012. 51% is allowed in mul6-‐brand retail.
Retail
• One of the fastest growing telecom markets in the world, accounts for almost 3% of the Indian GDP. Surge in mass broadband adop6on is expected to be, led by the launch of 3G and 4G services and huge demand for smart mobile devices. While, FDI up to 74% to 100% is permi5ed for various telecom services, 100% FDI is permi5ed in the area of telecom equipment manufacturing and provision of IT enabled services.
Telecom
• Vibrant capital market with a presence of 20 stock exchanges. Banking sector had total asset size of US$1.63 trillion at the end of FY12.
Banking, Financial Services & Insurance
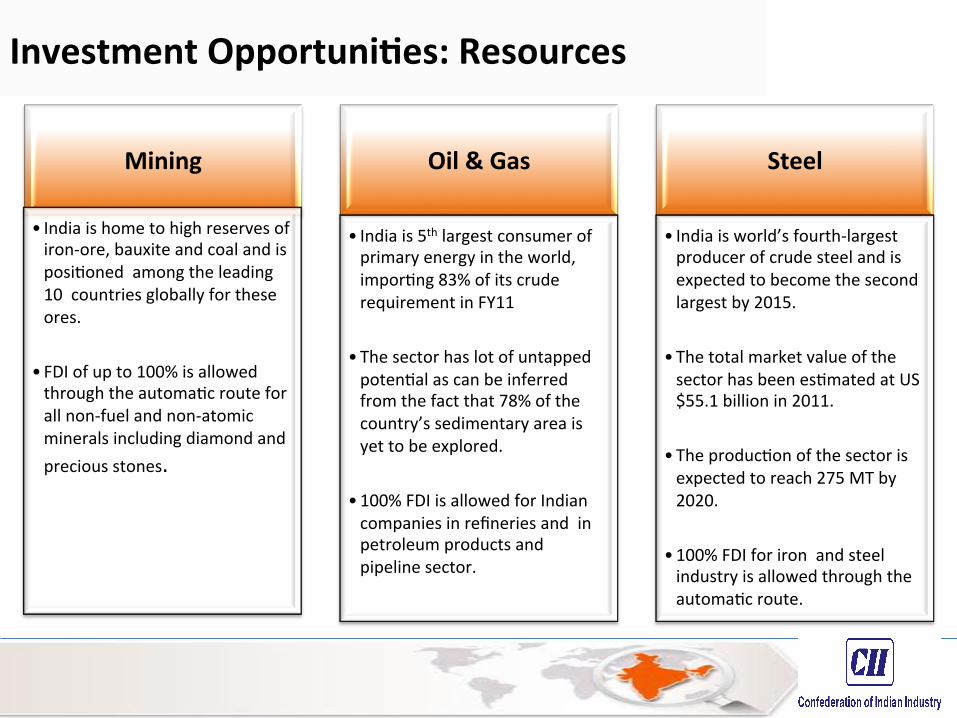
Mining
• India is home to high reserves of iron-‐ore, bauxite and coal and is posi6oned among the leading 10 countries globally for these ores.
• FDI of up to 100% is allowed through the automa6c route for all non-‐fuel and non-‐atomic minerals including diamond and precious stones.
Oil & Gas
• India is 5th largest consumer of primary energy in the world, impor6ng 83% of its crude requirement in FY11
• The sector has lot of untapped poten6al as can be inferred from the fact that 78% of the country’s sedimentary area is yet to be explored.
• 100% FDI is allowed for Indian companies in refineries and in petroleum products and pipeline sector.
Steel
• India is world’s fourth-‐largest producer of crude steel and is expected to become the second largest by 2015.
• The total market value of the sector has been es6mated at US$55.1 billion in 2011.
• The produc6on of the sector is expected to reach 275 MT by 2020.
• 100% FDI for iron and steel industry is allowed through the automa6c route.
Investment OpportuniQes: Resources
The Current State of the Economy
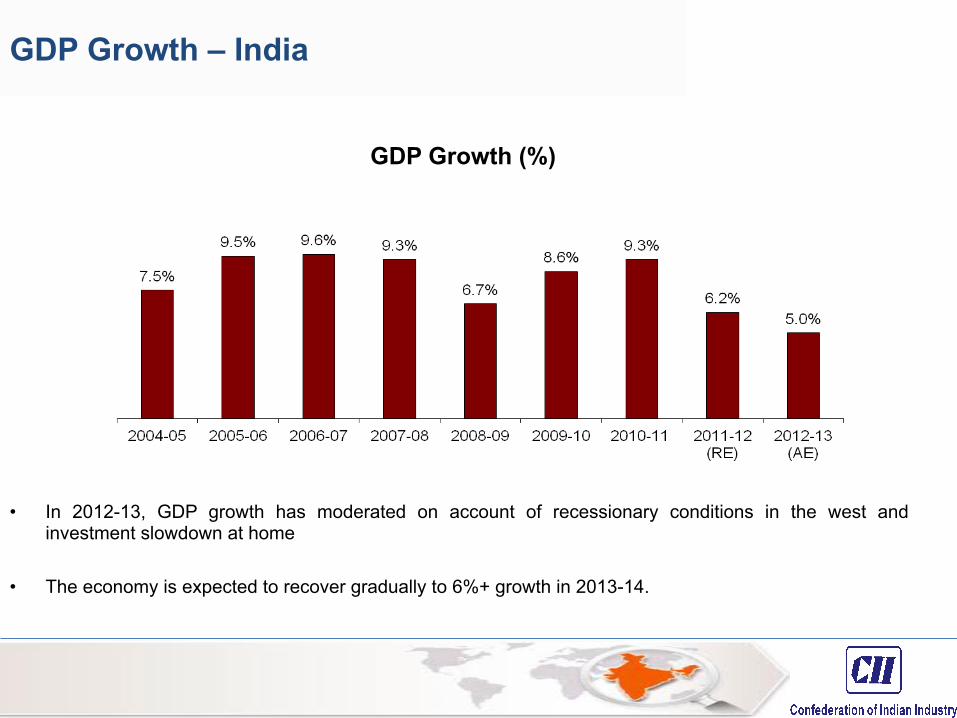
GDP Growth – India
GDP Growth (%)
• In 2012-13, GDP growth has moderated on account of recessionary conditions in the west and investment slowdown at home
• The economy is expected to recover gradually to 6%+ growth in 2013-14.
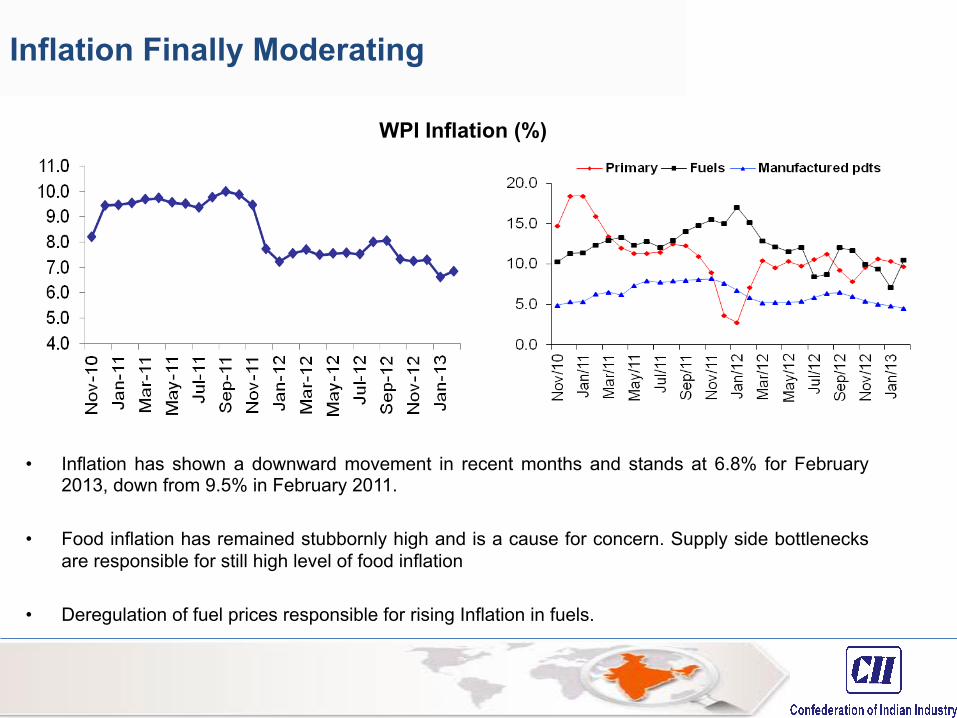
Inflation Finally Moderating
• Inflation has shown a downward movement in recent months and stands at 6.8% for February 2013, down from 9.5% in February 2011.
• Food inflation has remained stubbornly high and is a cause for concern. Supply side bottlenecks are responsible for still high level of food inflation
• Deregulation of fuel prices responsible for rising Inflation in fuels.
WPI Inflation (%)
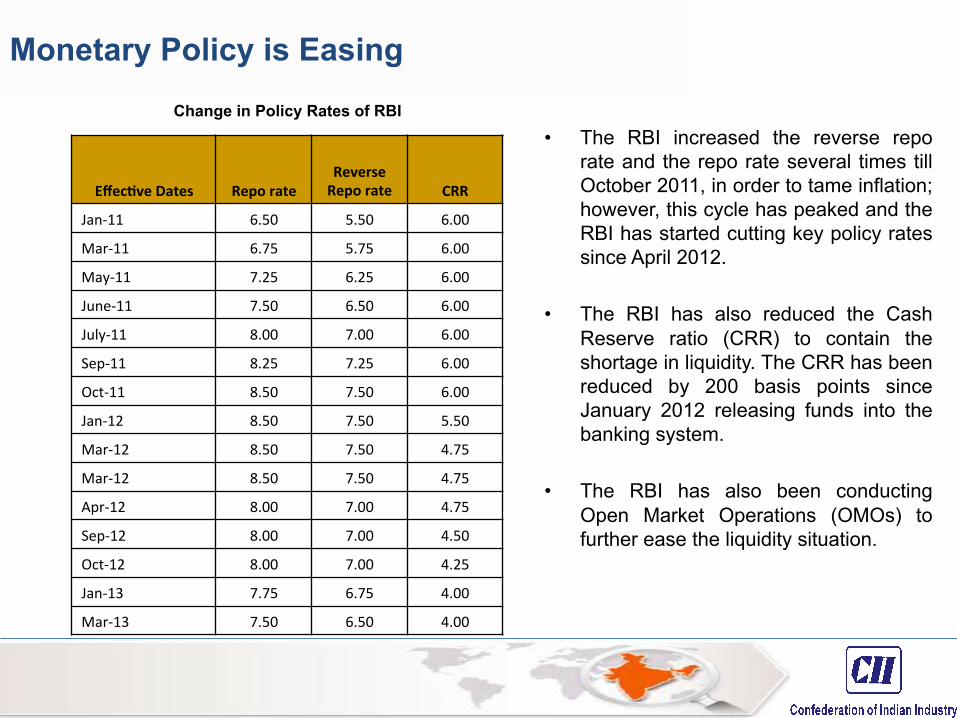
Monetary Policy is Easing
EffecQve Dates Repo rate Reverse Repo rate CRR
Jan-‐11 6.50 5.50 6.00 Mar-‐11 6.75 5.75 6.00 May-‐11 7.25 6.25 6.00 June-‐11 7.50 6.50 6.00 July-‐11 8.00 7.00 6.00
Sep-‐11 8.25 7.25 6.00
Oct-‐11 8.50 7.50 6.00
Jan-‐12 8.50 7.50 5.50
Mar-‐12 8.50 7.50 4.75
Mar-‐12 8.50 7.50 4.75
Apr-‐12 8.00 7.00 4.75
Sep-‐12 8.00 7.00 4.50
Oct-‐12 8.00 7.00 4.25
Jan-‐13 7.75 6.75 4.00
Mar-‐13 7.50 6.50 4.00
• The RBI increased the reverse repo rate and the repo rate several times till October 2011, in order to tame inflation; however, this cycle has peaked and the RBI has started cutting key policy rates since April 2012.
• The RBI has also reduced the Cash Reserve ratio (CRR) to contain the shortage in liquidity. The CRR has been reduced by 200 basis points since January 2012 releasing funds into the banking system.
• The RBI has also been conducting Open Market Operations (OMOs) to further ease the liquidity situation.
Change in Policy Rates of RBI
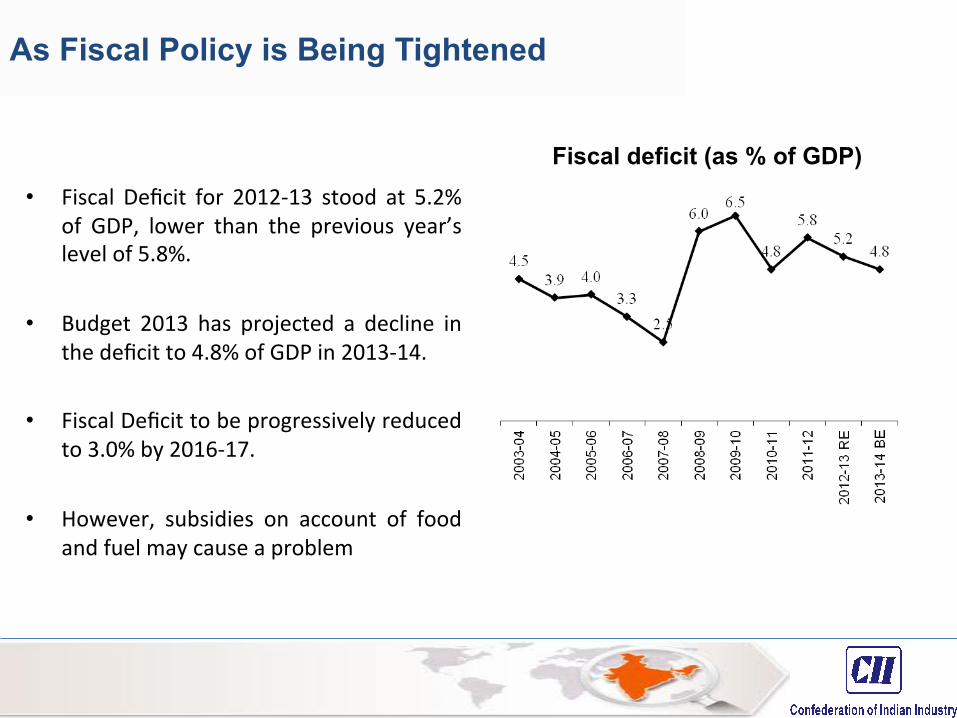
As Fiscal Policy is Being Tightened
• Fiscal Deficit for 2012-‐13 stood at 5.2%
of GDP, lower than the previous year’s level of 5.8%.
• Budget 2013 has projected a decline in the deficit to 4.8% of GDP in 2013-‐14.
• Fiscal Deficit to be progressively reduced to 3.0% by 2016-‐17.
• However, subsidies on account of food and fuel may cause a problem
Fiscal deficit (as % of GDP)
The Early Burst of Reforms
• The reforms in the early to mid nineties made sweeping changes such as
• Reduction in tariff barriers • Removal of barriers to entry in industry • Removal of controls in the financial sector • Encouragement to foreign investment and technology • Rationalization of tax structure
• These have ensured macroeconomic stability and driven the economy towards greater competitiveness
• These measures have also helped India in emerging as a resurgent, vibrant and
dynamic nation, leading global growth
• India is the second fastest growing major economy in the world after China • India was able to withstand the repercussion of the global economic crisis • India’s participation is required in all global negotiations ranging from global trade to
climate related deals
Recent Policy Reforms
Fiscal consolidation
– De-regulation of diesel prices – Cap on availability of subsidised LPG cylinders – Direct transfer of subsidies to poor people by opening of a bank account – Approval for disinvestment in several Public Sector Units (PSUs)
Power sector reforms
– The central government recently also approved the scheme for Financial Restructuring of State Distribution Companies (Discoms). The scheme contains various measures required to be taken by State Discoms and State Governments for achieving the financial turnaround of the Discoms by restructuring their debt with support through a transitional finance mechanism by the Central Government.
– These reforms were the need of the hour as the accumulated losses of the state power
distribution companies (Discoms) are estimated to be about Rs 1.9 trillion as on 31st March, 2011.
Recent Policy Reforms
• FDI Reforms: Increase in FDI cap in several sectors – FDI cap in multi brand retail upto 51% subject to state permission and 100% in single-
brand retail – Upto 49% foreign investment each in the aviation sector and power trading exchanges – Upto 74% in broadcasting sector
• Monetary Policy: Gradual move away from tight monetary stance – Reduction in SLR form 24% to 23% – Cut in CRR from 4.75% to 4.00% – Easing of repo rate by 100 bps in 2012-13
• Financial Reforms – Cabinet has approved 49% FDI limit (as opposed to 26% currently) in insurance sector;
bill needs to be passed in Parliament – FDI limit in Pension funds to be hiked in line with the insurance sector once the PFRDA
Bill is passed in Parliament
.
Union Budget 2013-14 Unleashed Pro-Growth Measures • Boosting Infrastructure
– Encourage Infrastructure Debt Fund (IDF) – Allow some institutions to raise tax-free bonds up to 50,000 crore (100 per cent more than the
current year) – India Infrastructure Finance Corporation (IIFC), in partnership with ADB, to help infrastructure
companies to access the bond market to tap long-term funds
• Boosting Investments & Savings – 15% investment deduction allowance apart from depreciation for companies investing Rs 100
crore of more in plant & machinery in April 1, 2013 to March 31, 2015 – Proposal to launch inflation indexed bonds to protect savings from inflation
• Financial Sector Reforms – Rs 14,000 crore will be provided to public sector banks for capital infusion in 2013-14 – Foreign institutional investors will be allowed to participate in exchange-traded currency
derivatives – FIIs, will be permitted to use their investments in corporate bonds and G-secs as collateral to
meet their margin requirements .
………Contd
• Tax Proposals - Slabs and rate for personal income tax unchanged
– Tax credit of Rs 2,000 to every person with total income up to Rs 5 lakh – Increase in surcharge from 5 to 10 per cent on domestic companies whose taxable
income exceeds Rs 10 crores – 10 per cent surcharge on persons (other than companies) with taxable income
exceeding Rs 1 crore – India Infrastructure Finance Corporation (IIFC), in partnership with ADB, to help
infrastructure companies to access the bond market to tap long-term funds
• Subsides – Rs 10,000 crore of additional allocation to the Food Security Bill – Petroleum subsidies, at Rs 65000 crore, have been adequately provisioned for
.
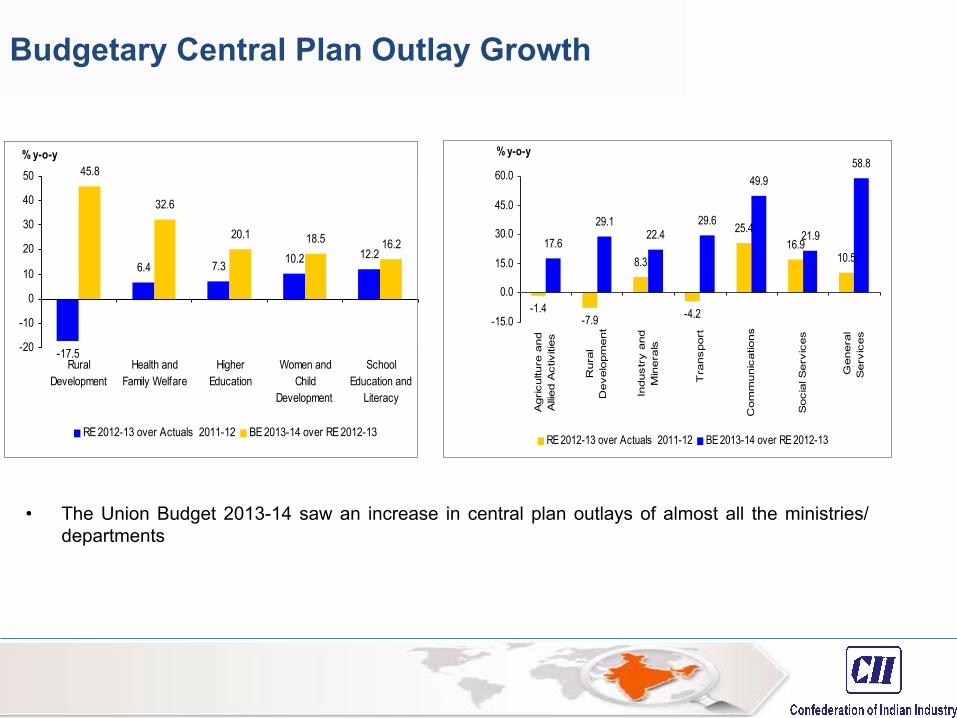
Budgetary Central Plan Outlay Growth
-17.5
6.4 7.3 10.2 12.2
45.8
32.6
20.1 18.5 16.2
-20
-10
0
10
20
30
40
50
RuralDevelopment
Health andFamily Welfare
HigherEducation
Women andChild
Development
SchoolEducation and
Literacy
% y-o-y
RE 2012-13 over Actuals 2011-12 BE 2013-14 over RE 2012-13
-1.4-7.9
8.3
-4.2
25.416.9
10.517.6
29.122.4
29.6
49.9
21.9
58.8
-15.0
0.0
15.0
30.0
45.0
60.0
Agricultu
re a
nd
Allied A
ctiv
ities
Rura
lD
evelo
pm
ent
Industr
y a
nd
Min
era
ls
Tra
nsport
Com
munic
atio
ns
Socia
l Serv
ices
Genera
lS
erv
ices
% y-o-y
RE 2012-13 over Actuals 2011-12 BE 2013-14 over RE 2012-13
• The Union Budget 2013-14 saw an increase in central plan outlays of almost all the ministries/
departments

Thank-You