India 100 2017 - Brand Financebrandfinance.com/images/upload/india_100_locked.pdf · study revealed...
11
India 100 2017 The annual report on the most valuable Indian brands May 2017
Transcript of India 100 2017 - Brand Financebrandfinance.com/images/upload/india_100_locked.pdf · study revealed...

India 1002017The annual report on the most valuable Indian brandsMay 2017

Brand Finance India 100 May 2017 3.Brand Finance Australia 100 March 2016 2. 3.Brand Finance Global 500 February 2016 2. Brand Finance Airlines 30 30 February 2015 2.
Brand Finance India 100 May 2017 2.
Foreword.
Foreword 2
Definitions 4
Methodology 6
Excecutive Summary 8
Full Table (USDm) 12
Full Table (INRm) 14
Understand Your Brand’s Value 16
How We Can Help 18
Contact Details 19
Contents
David Haigh, CEO, Brand Finance
What is the purpose of a strong brand; to attract customers, to build loyalty, to motivate staff? All true, but for a commercial brand at least, the first answer must always be ‘to make money’.
Huge investments are made in the design, launch and ongoing promotion of brands. Given their potential financial value, this makes sense. Unfortunately, most organisations fail to go beyond that, missing huge opportunities to effectively make use of what are often their most important assets. Monitoring of brand performance should be the next step, but is often sporadic. Where it does take place it frequently lacks financial rigour and is heavily reliant on qualitative measures poorly understood by non-marketers.
As a result, marketing teams struggle to communicate the value of their work and boards then underestimate the significance of their brands to the business. Skeptical finance teams, unconvinced by what they perceive as marketing mumbo jumbo may fail to agree necessary investments. What marketing spend there is can end up poorly directed as marketers are left to operate with insufficient financial guidance or accountability. The end result can be a slow but
steady downward spiral of poor communication, wasted resources and a negative impact on the bottom line.
Brand Finance bridges the gap between the marketing and financial worlds. Our teams have experience across a wide range of disciplines from market research and visual identity to tax and accounting. We understand the importance of design, advertising and marketing, but we also believe that the ultimate and overriding purpose of brands is to make money. That is why we connect brands to the bottom line.
By valuing brands, we provide a mutually intelligible language for marketers and finance teams. Marketers then have the ability to communicate the significance of what they do and boards can use the information to chart a course that maximises profits. Without knowing the precise, financial value of an asset, how can you know if you are maximising your returns? If you are intending to license a brand, how can you know you are getting a fair price? If you are intending to sell, how do you know what the right time is? How do you decide which brands to discontinue, whether to rebrand and how to arrange your brand architecture? Brand Finance has conducted thousands of brand and branded business valuations to help answer these questions.
Brand Finance’s recently conducted share price study revealed the compelling link between strong brands and stock market performance. It was found that investing in the most highly branded companies would lead to a return almost double that of the average for the S&P 500 as a whole. Acknowledging and managing a company’s intangible assets taps into the hidden value that lies within it. The following report is a first step to understanding more about brands, how to value them and how to use that information to benefit the business. The team and I look forward to continuing the conversation with you.

Brand Finance India 100 May 2017 5.Brand Finance India 100 May 2017 4.
Definitions
Definitions+ Enterprise Value – the value of the
entire enterprise, made up of multiple branded businesses
+ Branded Business Value – the value of a single branded business operating under the subject brand
+ Brand Contribution– The total economic benefit derived by a business from its brand
+ Brand Value – the value of the trade marks (and relating marketing IP and ‘goodwill’ attached to it) within the branded business
‘Branded Business’
‘Branded Enterprise’
E.g.Titan
Company ltd
E.g.Tanishq
E.g.Tanishq
‘Brand Value’
‘Branded Business’
‘Branded Enterprise’
‘Brand’ Contribution’
E.g.Tanishq
Branded Business Value
A brand should be viewed in the context of the business in which it operates. For this reason Brand Finance always conducts a Branded Business Valuation as part of any brand valuation. Where a company has a purely mono-branded architecture, the business value is the same as the overall company value or ‘enterprise value’.
In the more usual situation where a company owns multiple brands, business value refers to the value of the assets and revenue stream of the business line attached to that brand specifically. We evaluate the full brand value chain in order to understand the links between marketing investment, brand tracking data, stakeholder behaviour and business value to maximise the returns business owners can obtain from their brands.
Brand Contribution
The brand values contained in our league tables are those of the potentially transferable brand asset only, but for marketers and managers alike. An assessment of overall brand contribution to a business provides powerful insights to help optimise performance.
Brand Contribution represents the overall uplift in shareholder value that the business derives from owning the brand rather than operating a generic brand.
Brands affect a variety of stakeholders, not just customers but also staff, strategic partners, regulators, investors and more, having a significant impact on financial value beyond what can be bought or sold in a transaction.
Brand Value
In the very broadest sense, a brand is the focus for all the expectations and opinions held by customers, staff and other stakeholders about an organisation and its products and services. However, when looking at brands as business assets that can be bought, sold and licensed, a more technical definition is required.
Brand Finance helped to craft the internationally recognised standard on Brand Valuation, ISO 10668. That defines a brand as “a marketing-related intangible asset including, but not limited to, names, terms, signs, symbols, logos and designs, or a combination of these, intended to identify goods, services or entities, or a combination of these, creating distinctive images and associations in the minds of stakeholders, thereby generating economic benefits/value”.
Brand Strength
Brand Strength is the part of our analysis most directly and easily influenced by those responsible for marketing and brand management. In order to determine the strength of a brand we have developed the Brand Strength Index (BSI). We analyse marketing investment, brand equity (the goodwill accumulated with customers, staff and other stakeholders) and finally the impact of those on business performance.
Following this analysis, each brand is assigned a BSI score out of 100, which is fed into the brand value calculation. Based on the score, each brand in the league table is assigned a rating between AAA+ and D in a format similar to a credit rating. AAA+ brands are exceptionally strong and well managed while a failing brand would be assigned a D grade.
Effect of a Brand on Stakeholders
PotentialCustomers
ExistingCustomers
Influencerse.g. Media
TradeChannels
StrategicAllies &
Suppliers Investors
Debt providers
Sales
Production
All OtherEmployees
MiddleManagers
Directors
Brand

Brand Finance India 100 May 2017 7.Brand Finance India 100 May 2017 6.
Methodology
Inputs StakeholderBehaviour PerformanceBrand Equity
Value DriversBrand
Contribution
Audit the impact of brand management and investment on brand equity
Run analytics to understand how perceptions link to behaviour
Link stakeholder behaviour with key financial value drivers
Model the impact of behaviour on core financial performance and isolating the value of the brand contribution
Brand Audit Trial & Preference Acquisition & Retention
Valuation Modelling
1 2 3 4
Brand Finance Typical Project ApproachBrand Finance calculates the values of the brands in its league tables using the ‘Royalty Relief approach’. This approach involves estimating the likely future sales that are attributable to a brand and calculating a royalty rate that would be charged for the use of the brand, i.e. what the owner would have to pay for the use of the brand—assuming it were not already owned.
Brand strength expressed as a BSI score out of 100.
BSI score applied to an appropriate sector royalty rate range.
Royalty rate applied to forecast revenues to derive brand values.
Post-tax brand revenues are discounted to a net present value (NPV) which equals the brand value.
The steps in this process are as follows:
1 Calculate brand strength on a scale of 0 to 100 based on a number of attributes such as emotional connection, financial performance and sustainability, among others. This score is known as the Brand Strength Index, and is calculated using brand data from the BrandAsset® Valuator database, the world’s largest database of brands, which measures brand equity, consideration and emotional imagery attributes to assess brand personality in a category agnostic manner.
Strong brand
Weak brand
Brand strength index(BSI)
Brand‘Royalty rate’
Brand revenues Brand value
Forecast revenues
Brand investment
Brand equity
Brand performance
2 Determine the royalty rate range for the respective brand sectors. This is done by reviewing comparable licensing agreements sourced from Brand Finance’s extensive database of license agreements and other online databases.
3 Calculate royalty rate. The brand strength score is applied to the royalty rate range to arrive at a royalty rate. For example, if the royalty rate range in a brand’s sector is 1-5% and a brand has a brand strength score of 80 out of 100, then an appropriate royalty rate for the use of this brand in the given sector will be 4.2%.
4 Determine brand specific revenues estimating a proportion of parent company revenues attributable to a specific brand.
5 Determine forecast brand specific revenues using a function of historic revenues, equity analyst forecasts and economic growth rates.
6 Apply the royalty rate to the forecast revenues to derive brand revenues.
7 Brand revenues are discounted post tax to a net present value which equals the brand value.
League Table Valuation Methodology
How We Help to Maximise Value
6. Build scale through licensing/franchising/partnerships
5. Build core business through market expansion
4. Build core business through product development
3. Portfolio management/rebranding Group companies
2. Optimise brand positioning and strength
1. Base-case brand and business valuation(using internal data), growth strategyformulation, target-setting, scorecard andtracker set-up
Evaluate ongoing performance
Current brand and business value
Target brand and business value
Max
imis
ing
a st
rong
bra
nd

Brand Finance India 100 May 2017 9.Brand Finance India 100 May 2017 8.
India 100
Excecutive Summary
Rank 2017: 1 2016: 1 BV 2017: $ 13,117m BV 2016: $ 13,713mBrand Rating: AA+
Rank 2017: 2 2016: 2 BV 2017: $ 7,722m BV 2016: $ 5,768mBrand Rating: AA+
Rank 2017: 5 2016: 3 BV 2017: $ 5,509m BV 2016: $ 5,760mBrand Rating: AA+
1
2
5
-4%
+34%
Rank 2017: 6 2016: 6 BV 2017: $ 4,848m BV 2016: $ 3,554mBrand Rating: AA+
Rank 2017: 7 2016: 8 BV 2017: $ 4,623m BV 2016: $ 3,360mBrand Rating: AAA-
Rank 2017: 8 2016: 9 BV 2017: $ 4,595m BV 2016: $ 3,261mBrand Rating: AA
Rank 2017: 9 2016: 10 BV 2017: $ 4,463m BV 2016: $ 3,236mBrand Rating: AA+
6
7
8
9
+36%
+38%
+38%
-4%
Rank 2017: 3 2016: 4 BV 2017: $ 6,814m BV 2016: $ 4,988mBrand Rating: AA
3
Rank 2017: 4 2016: 5 BV 2017: $ 6,224m BV 2016: $ 4,794mBrand Rating: AA+
4 +30%
Rank 2017: 10 2016: 11 BV 2017: $ 3,575m BV 2016: $ 2,949mBrand Rating: AA
10 +21%
+37% +41%
Strong brand value growth characterises the 2017 Brand Finance India 100. 68 of India’s 100 most valuable brands have grown in value this year, with 54 of those enjoying double-digit growth. There are however some notable exceptions, most obviously, India’s most valuable brand, Tata.
There has already been intense speculation as to whether Brand Value has fallen due to Tata’s board room drama. In Brand Finance’s view this is emphatically not the case. Tata’s Brand Strength Index score in fact improved significantly this year and its brand rating was upgraded from A+ to AA+. Corrective action has been taken quickly and the stakeholders at large have not been significantly affected. The brand value drop of 4% is clearly not positive, however it is a lesser decline than between 2015 and 2016, when brand value fell 11%. Tata is present in a number
of industries in which operating conditions are very challenging for all participants. In this context the slight decline can be seen as a stabilisation in challenging times. As Tata’s new chairman, Natarajan Chandrasekaran, settles in and attempts to streamline the conglomerate’s activities, we expect Tata to return to brand value growth soon.
IT services brands continue to be one of India’s great success stories, dominating not just the national rankings but the international rankings of their sector too. Even as other Indian brands perform strongly, IT services brands are managing to improve their national ranks. Infosys is up from 5th to 4th, HCL from 10th to 9th and Wipro from 12th to 11th.
The biggest improvement in rankings however comes from Indigo Airlines which is up from 95th
last year to 62nd now. India’s biggest airline recently announced the addition of 35 new routes and increasing frequency on existing ones. At the opposite end of the scale, the iconic Taj Hotels brand has fallen 14 places to 93rd with brand value dropping below US$300 million. Like so many other hotel brands it has been hit by the impact of technology, with aggregator sites creating pricing pressure and Airbnb introducing competition.
This year’s fastest falling brand is Micromax. The tech firm has lost 39% of its brand value and nearly fallen out of the top 100, placing 95th. Micromax is struggling to compete following the influx of strong Chinese mobile brands such as Oppo and Vivo into the Indian market in the last couple of years.
ITC is India’s most powerful brand. It is India’s only AAA rated brand, with a Brand Strength Index score of 86. ITC has been expanding its strategic
presence, beyond tobacco, for over a decade. In the last four to five years it has become a formidable competitor in the food and beverage, personal care, apparel and stationery sectors, challenging incumbents that have dominated those industries for over a century. This broad spectrum of excellence is making ITC a household name across India and contributing to the brand’s strength.
Mahindra, a stalwart of Indian enterprise has re-entered the top ten this year, after posting healthy growth in its flagship automotive division and strengthening its presence in SAARC countries. Mahindra’s agricultural division and its tractors business are well-established strengths while more recent initiatives such as crop-care solutions, seed distribution and power solutions through Mahindra Powerol are poised to accelerate growth. This year brand value is up 21% to US$3.6 billion.
Brand Finance India 100 May 2017 11.Brand Finance India 100 May 2017 10.
Excecutive Summary
01
2
3
4
56
7
8
9
1011
12
13
14
1516
17
18
19
20
State Bank of India
Infosys
LIC
airtel
Tata Group
2017201620152014201320122011
Bra
nd
val
ue
(US
Dm
)
Brand Value Over Time
-750.000000-342.85714364.285714471.428571878.5714291285.7142861692.857143
Tata Group
Idea Cellular
Bank of Baroda
State Bank of India
Micromax
Punjab National Bank
BHEL
Bank of India
SAIL
Tanishq
Hindustan Petroleum
Wipro
HDFC Bank
HCL
Larsen & Toubro
Reliance
Indian Oil
Infosys
LIC
Airtel $1953
$1826
$1430
$1334
$1293
$1263
$1226
$820
$766
$705
-60 -39 -18 3 24 45 66 87 108 129 150
Micromax
Bank of Baroda
BHEL
Punjab National Bank
Bank of India
Idea Cellular
SAIL
Union Bank of India
Canara Bank
Oil India Limited
Hindustan Petroleum
NTPC
Adani Enterprises
Apollo Tyres
Yes Bank
Royal Enfield
Power Finance Corporation
Indigo
Flipkart
Coal India
$-88
$-92
$-134
$-165
$-180
$-183
$-251
$-304
$-564
$-596
110%
103%
96%
95%
77%
75%
75%
67%
64%
61%
-12%
-16%
-18%
-19%
-22%
-23%
-24%
-27%
-34%
-39%
Brand Value Change 2016-2017 (USDm) Brand Value Change 2016-2017 (%)
Colour Industry Total Brand Value (USDbn)
% of Total Brand Value
Conglomerate 31.74 23.0%
Banks 21.44 15.6%
Technology 16.83 12.2%
Oil&Gas 12.92 9.4%
Telecoms 11.04 8.0%
Engineering 7.72 5.6%
Insurance 6.81 4.9%
Automobiles 5.93 4.3%
Food 5.63 4.1%
Retail 4.44 3.2%
Others 13.37 9.7%
Total Brand Value by Sector 2017
Conglomerate23%
Technology12.2%
KEY
Banks15.6%
Oil & Gas9.4%
Telecoms8%
-750.000000-342.85714364.285714471.428571878.5714291285.7142861692.857143
Tata Group
Idea Cellular
Bank of Baroda
State Bank of India
Micromax
Punjab National Bank
BHEL
Bank of India
SAIL
Tanishq
Hindustan Petroleum
Wipro
HDFC Bank
HCL
Larsen & Toubro
Reliance
Indian Oil
Infosys
LIC
Airtel $1953
$1826
$1430
$1334
$1293
$1263
$1226
$820
$766
$705
-60 -39 -18 3 24 45 66 87 108 129 150
Micromax
Bank of Baroda
BHEL
Punjab National Bank
Bank of India
Idea Cellular
SAIL
Union Bank of India
Canara Bank
Oil India Limited
HDFC
Hindustan Petroleum
NTPC
Adani Enterprises
Apollo Tyres
Yes Bank
Royal Enfield
Power Finance Corporation
Indigo
Filpkart
$-88
$-92
$-134
$-165
$-180
$-183
$-251
$-304
$-564
$-596
103%
96%
95%
77%
75%
75%
67%
64%
61%
61%
-12%
-16%
-18%
-19%
-22%
-23%
-24%
-27%
-34%
-39%

Brand Finance India 100 May 2017 13.Brand Finance India 100 May 2017 12.
Brand Finance India 100 (USDm)Top 100 most valuable Indian brands 1 - 50.
Rank2017
Rank2016
Brand name Sector Brandvalue (USDm)
2017
%change
Brandvalue
(USDm) 2016
Brandrating2017
Brandrating2016
1 1 Tata Group Conglomerate 13,117 -4% 13,713 AA+ A+2 2 Airtel Telecoms 7,722 34% 5,768 AA+ AA+3 4 LIC Insurance 6,814 37% 4,988 AA AA4 5 Infosys Technology 6,224 30% 4,794 AA+ AA+5 3 State Bank of India Banks 5,509 -4% 5,760 AA+ AA+6 6 Reliance Conglomerate 4,848 36% 3,554 AA+ AA+7 8 Larsen & Toubro Engineering & Construction 4,623 38% 3,360 AAA- AA+8 9 Indian Oil Oil & Gas 4,595 41% 3,261 AA AA9 10 HCL Technology 4,463 38% 3,236 AA+ AA+10 11 Mahindra11 12 Wipro12 7 ONGC13 14 HDFC Bank14 16 Amul15 13 ICICI Bank16 18 Maruti Suzuki17 24 Bharat Petroleum19 15 Idea Cellular18 23 Godrej20 27 Hindustan Petroleum21 New Bajaj Group22 22 Reliance (ADAG)23 19 Asian Paints24 21 Axis Bank25 20 Aditya Birla26 31 HDFC27 25 ITC LTD28 26 Hero29 30 United Spirits30 28 Kotak Mahindra Bank31 35 Britannia32 33 Ultratech Cement33 49 Royal Enfield34 32 Tanishq35 New Officer's Choice36 68 Coal India37 38 Marico38 36 Kingfisher39 53 JSW40 60 Adani Enterprises41 51 ZEE42 41 GAIL43 45 Jaypee Group44 55 BSNL45 66 NTPC46 44 Parle47 73 Yes Bank48 48 Future Retail49 47 Ashok Leyland50 34 Bank of Baroda
Top 100 most valuable Indian brands 51 - 100.
Rank2017
Rank2016
Brand name Sector Brandvalue (USDm)
2017
%change
Brandvalue (USDm)
2016
Brandrating2017
Brandrating2016
51 39 Vedanta Resources52 37 Punjab National Bank53 56 Nandini54 43 Dabur55 59 Mother Dairy56 85 Flipkart57 70 Power Grid Corporation of India58 69 Aircel59 52 Videocon60 50 MRF61 84 Apollo Tyres62 95 Indigo63 94 Power Finance Corporation64 74 Gitanjali65 40 BHEL66 46 Canara Bank67 77 TVS68 42 Bank of India69 61 Ambuja Cements70 65 ACC71 New MRPL72 New Shriram Group73 64 Indusind Bank74 67 Motherson Sumi75 63 Jet Airways76 54 SAIL77 80 Sun Pharma78 76 Cairn India79 62 Berger Paints80 58 Union Bank of India81 75 Nerolac82 81 IDBI Bank83 New Indiabulls Housing Finance84 New Mphasis85 91 Pidilite86 71 Bharti Infratel87 100 Voltas88 86 Air India89 72 Oil India Limited90 New Biocon91 82 DLF92 87 Syndicate Bank93 79 Taj94 New JK Tyre95 57 Micromax96 89 GMR Infrastructure97 83 Emami98 New DishTV99 New Welspun Group100 88 Central Bank of India
Brand Finance India 100 May 2017 15.Brand Finance India 100 May 2017 14.
Brand Finance India 100 (INR cr)Top 100 most valuable Indian brands 1 - 50.
Rank2017
Rank2016
Brand name Sector Brandvalue (INR cr)
2017
%change
Brandvalue (INR cr)
2016
Brandrating2017
Brandrating2016
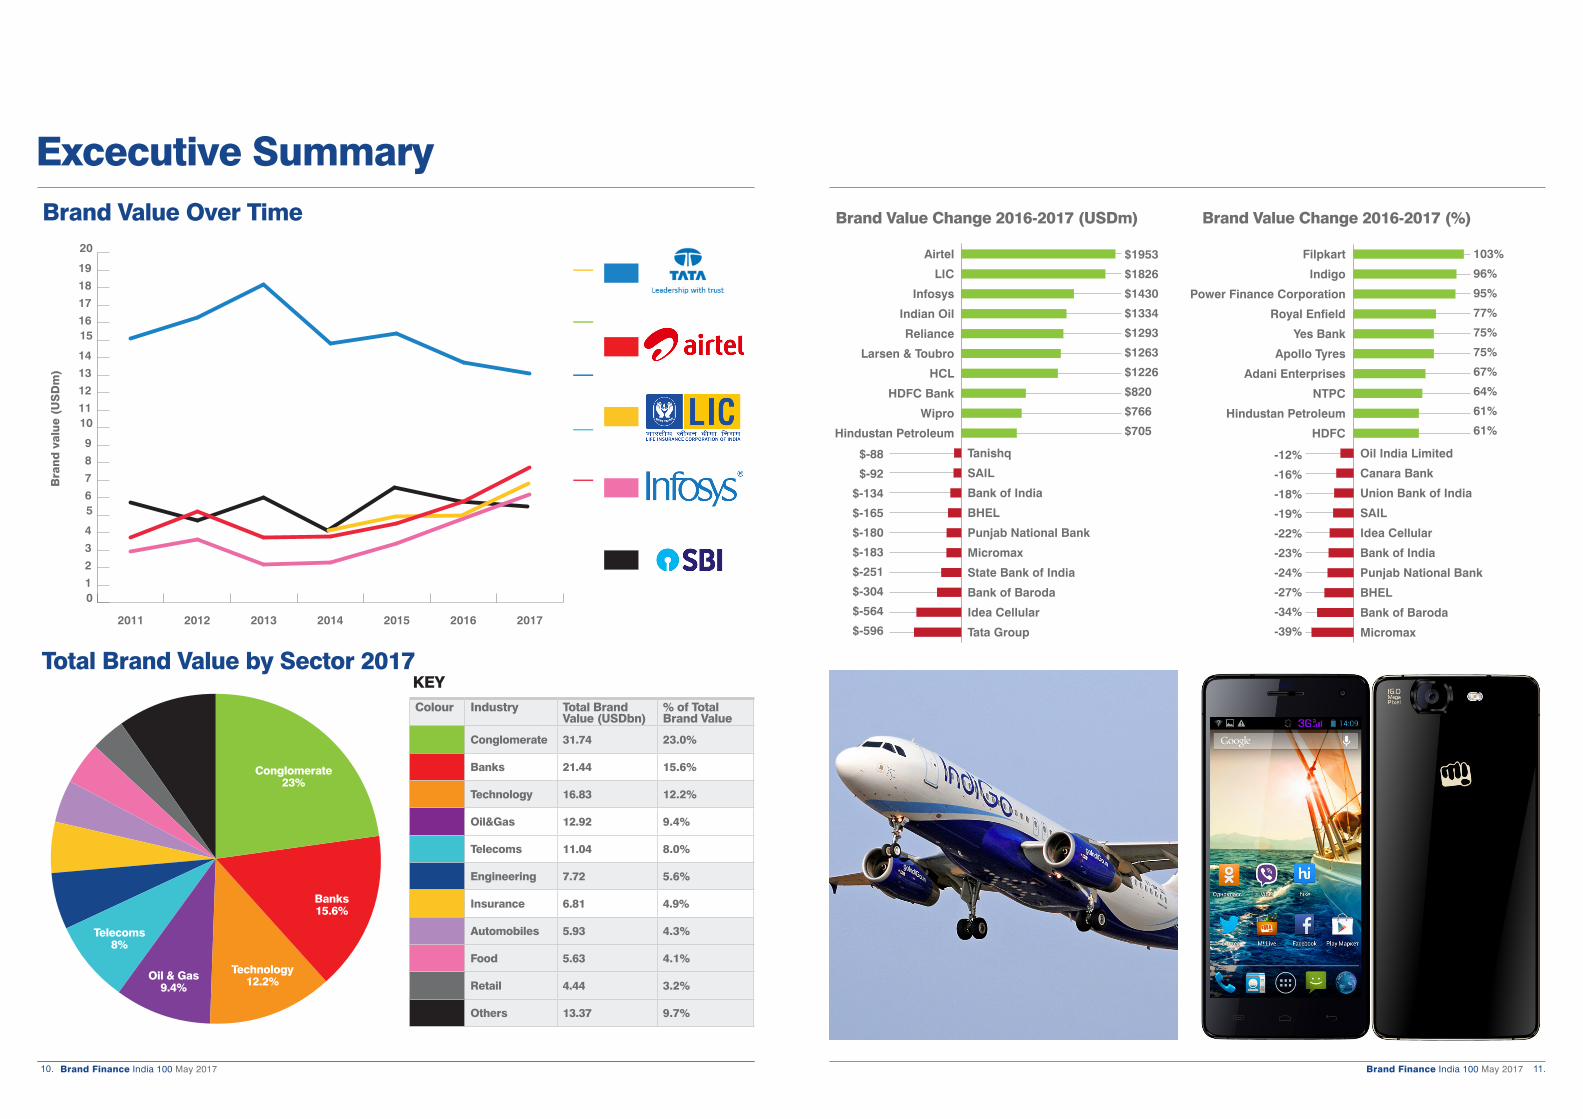
1 1 Tata Group Conglomerate 87,353 -5% 91,493 AA+ A+2 2 Airtel Telecoms 51,426 34% 38,487 AA+ AA+3 4 LIC Insurance 45,382 36% 33,281 AA AA4 5 Infosys Technology 41,452 30% 31,987 AA+ AA+5 3 State Bank of India Banks 36,688 -5% 38,428 AA+ AA+6 6 Reliance Conglomerate 32,285 36% 23,715 AA+ AA+7 8 Larsen & Toubro Engineering & Construction 30,788 37% 22,415 AAA- AA+8 9 Indian Oil Oil & Gas 30,601 41% 21,756 AA AA9 10 HCL Technology 29,720 38% 21,591 AA+ AA+10 11 Mahindra Conglomerate 23,811 21% 19,674 AA AA+11 12 Wipro12 7 ONGC13 14 HDFC Bank14 16 Amul15 13 ICICI Bank16 18 Maruti Suzuki17 24 Bharat Petroleum19 15 Idea Cellular18 23 Godrej20 27 Hindustan Petroleum21 New Bajaj Group22 22 Reliance (ADAG)23 19 Asian Paints24 21 Axis Bank25 20 Aditya Birla26 31 HDFC27 25 ITC LTD28 26 Hero29 30 United Spirits30 28 Kotak Mahindra Bank31 35 Britannia32 33 Ultratech Cement33 49 Royal Enfield34 32 Tanishq35 New Officer's Choice36 68 Coal India37 38 Marico38 36 Kingfisher39 53 JSW40 60 Adani Enterprises41 51 ZEE42 41 GAIL43 45 Jaypee Group44 55 BSNL45 66 NTPC46 44 Parle47 73 Yes Bank48 48 Future Retail49 47 Ashok Leyland50 34 Bank of Baroda
Top 100 most valuable Indian brands 51 - 100.
Rank2017
Rank2016
Brand name Sector Brandvalue (INR cr)
2017
%change
Brandvalue (INR cr)
2016
Brandrating2017
Brandrating2016
51 39 Vedanta Resources52 37 Punjab National Bank53 56 Nandini54 43 Dabur55 59 Mother Dairy56 85 Flipkart57 70 Power Grid Corporation of India58 69 Aircel59 52 Videocon60 50 MRF61 84 Apollo Tyres62 95 Indigo63 94 Power Finance Corporation64 74 Gitanjali65 40 BHEL66 46 Canara Bank67 77 TVS68 42 Bank of India69 61 Ambuja Cements70 65 ACC71 New MRPL72 New Shriram Group73 64 Indusind Bank74 67 Motherson Sumi75 63 Jet Airways76 54 SAIL77 80 Sun Pharma78 76 Cairn India79 62 Berger Paints80 58 Union Bank of India81 75 Nerolac82 81 IDBI Bank83 New Indiabulls Housing Finance84 New Mphasis85 91 Pidilite86 71 Bharti Infratel87 100 Voltas88 86 Air India89 72 Oil India Limited90 New Biocon91 82 DLF92 87 Syndicate Bank93 79 Taj94 New JK Tyre95 57 Micromax96 89 GMR Infrastructure97 83 Emami98 New DishTV99 New Welspun Group100 88 Central Bank of India

Brand Finance India 100 May 2017 17.Brand Finance India 100 May 2017 16.
Understand Your Brand’s Value
$707
$6,265
$3,031 $2,328 $1,913
213 275
320
607
729
650
0
100
200
300
400
500
600
700
800
2011 2012 2013 2014 2015 2016
58%
37%
4%
Nutrition
Performance Materials
Other Activities
Brand Value Dashboard
$707m AA+78/100
$10,216m
Peer Group Comparison (USDm)Historic brand value performance
Brand Value by Product Segment
7%
Brand Value
€650mEnterprise Value
€9,399m(EUR) (EUR)
(EURm)
$882mBrand Value
€729m(EUR)[XXX]
[XXX]
A Brand Value Report provides a complete breakdown of the assumptions, data sources and calculations used to arrive at your brand’s value. Each report includes expert recommendations for growing brand value to drive business performance and offers a cost-effective way to gaining a better understanding of your position against competitors.
A full report includes the following sections which can also be purchased individually.
Brand Valuation Summary Overview of the brand valuation including executive summary, explanation of changes in brand value and historic and peer group comparisons.
+ Internal understanding of brand+ Brand value tracking+ Competitor benchmarking+ Historical brand value
Brand Strength Index
A breakdown of how the brand performed on various metrics of brand strength, benchmarked against competitor brands in a balanced scorecard framework.
+ Brand strength tracking+ Brand strength analysis+ Management KPI’s+ Competitor benchmarking
Brand PerformanceAn ideal balanced scorecard of fundamental brand related measures
Brand Performance
Brand Strength Index
The brand’s ability to drive a volume premium. Implied by current and future revenue.
The brand’s ability to drive a price premium. Implied by current and future margins.
The brand’s ability to improve business prospects across
various KPIs
Revenue Margin % Forecast Revenue Growth % Forecast Margin %
6.25% 6.25% 6.25%
Dow Akzo Nobel Du Pont
Effective Weighting
Best in Class
6.25%
Akzo Nobel
8.98.1
5.0
8.9
0.0
2.0
4.0
6.0
8.0
10.0
DSM Best in Class Competitor Average[XXX]
Drivers of ChangeThree key areas impact Brand Value (EURm)
Brand Strength
[XXX]’s brand strength has increased compared to last year.
As the brand continues its sustainability drive, [XXX] hasbeen improving across all CSR scores. It now has thehighest CSR scores it has had in the last four years acrossEnvironment, Employees and Governance.
The premium approach is also leading to significant marginadvantages – positively affecting “performance”.
Business Outlook
Brands drive higher revenues. An investor would thereforepay more for a brand that makes more money.
[XXX]’s revenue base and the 5 year forecast growth havefallen this year, resulting in a loss of $177m USD to totalbrand value.
However, it is important to note that this has arisen as aresult of the company divesting a number of divisions.
Economic Outlook
All future returns are subject to risk. If the risk of notreceiving the forecast returns is higher (increasing thediscount rate), the brand’s market is not growing as quicklyas expected (lower long term growth rate) or the tax rate inthe brand’s regions of operation is higher, then the brand’svalue is reduced and vice versa.
2016 2015
Discount Rate 9.1% 8.6%
Long Term Growth 3.2% 2.6%
Tax 28.9% 30.2%
2016 2015
5 Year Forecast Growth 2.6% 3.4%
Base Year Revenue (EURm) 8,205 9,570
2016 2015
BrandStrength 78 76
729 729 616 616 650
18 13134
2015 Brand Strength Business Performance External Changes 2016
Brand InvestmentProven inputs that drive the Brand Equity and financial results
Relative quality of the brand’s investment in its products. The measure can include R&D spend and capital expenditure.
Relative quality of a brand’s distribution network. It can include the quality of logistical infrastructure available to the brand, the quality of its online presence, or the number and quality of its retail outlets.
Relative quality of the human network supporting the brand. This may include the size of the support network, its likely future growth or the investment in workforce training and human resources.
Relative quality of the brand’s promotions. Marketing investment, the quality of visual identity and the effectiveness of the brand’s social media is covered by this measure.
Product Place People Promotion
Brand Investment
Brand Strength Index
6.25% 6.25% 6.25%
Du Pont Multiple Akzo Nobel
Effective Weighting
Best in Class
6.25%
[XXX]
7.7
9.3
5.36.4
0.0
2.0
4.0
6.0
8.0
10.0
DSM Best in Class Competitor Average[XXX]
Royalty Rates
Analysis of competitor royalty rates, industry royalty rate ranges and margin analysis used to determine brand specific royalty rate.
+ Transfer pricing+ Licensing/ franchising negotiation+ International licensing+ Competitor benchmarking
Cost of Capital
A breakdown of the cost of capital calculation, including risk free rates, brand debt risk premiums and the cost of equity through CAPM.
+ Independent view of cost of capital for internal valuations and project appraisal exercises
Trademark Audit
Analysis of the current level of protection for the brands word marks and trademark iconography highlighting areas where the marks are in need of protection.
+ Highlight unprotected marks + Spot potential infringement+ Trademark registration strategy
For more information regarding our Brand Value Reports, please contact:
Alex HaighDirector of League Tables, Brand Finance
+44 (0)20 7389 9400
Brand Strength Index 2016An ideal balanced scorecard of fundamental brand related measures
Widely recognised factors deployed by Marketers to create brand loyalty and market share. We therefore benchmark brands against relevant input measures by sector against each of these factors.
How do stakeholders feel about the brand vs. competitors?
• Brand equity accounts for 50% to reflect the importance of stakeholder perceptions to behaviour
• Brand Equity is important to all stakeholder groups with customers being the most important
Quantitative market, market share and financial measures resulting from the strength of the brand.
BSI Attributes
Product: R&D expenditure,Capital expenditure
Place: Website Ranking
People: Number of Employees,Employee Growth
Promotion: Marketing expenditure
FamiliarityConsiderationPreferenceSatisfactionRecommendation/NPS
Employee Score
Credit RatingAnalyst Recommendation
Environment ScoreCommunity ScoreGovernance Score
Revenue% Margin% Forecast Margin% Forecast Revenue Growth
Bra
nd S
tren
gth
Inde
x
35%
25%
5%
5%
5%
Effective Weighting
25%Brand
Investment
25%
BrandEquity
50%
BrandPerformance
25%
Customer
Outputs
Inputs
Staff
Financial
External
6.25%
6.25%6.25%
6.25%
5.00%7.50%7.50%7.50%7.50%
5.00%
2.50%2.50%
1.67%1.67%1.67%
6.25% 6.25% 6.25% 6.25%
Determining the Royalty RateIn order to apply the Brand Strength Index, a hypothetical royalty rate range needs to be set
Following the OECD guidelines, Brand Finance sets the hypothetical brand royalty rate ranges by reference to three tests:
• Comparable Agreements: A search of comparable licensing agreements for brands in each industry is conducted every year. The margin analysesare then compared against the royalty rates found in these agreements to analyse the importance of brand in the industry and set an appropriateaverage industry royalty rate.
• Industry Margins: An analysis of 25% to 40% of margins, generally accepted as rules of thumb for licensing rates for all intangible assets in acompany. These rates are adjusted to take into account the importance of brand in a given industry.
• Affordability: Thirdly, an analysis of the brand’s specific royalties is conducted. If the brand has been able to sustain extraordinary profits over anextended time it is likely that hypothetical brand owners would be willing to pay closer to the company’s margins than the industry average. In thecase of Brand Finance’s League Table models, affordability will be based on the forecast EBIT.
• Average industry royalty rate ranges can be seen below
High
Mid
Low
Brand Valuation AssumptionsUnderlying economic assumptions used in valuation
Brand value (EURm)
$650
Discount Rate
Earnings in the future are worth lessthan consumption now. This rate istherefore used to reduce futureearnings to their value today.
Long Term Growth Rate
After the explicit forecasts, the brandwill continue to grow. However, it isunlikely that the company will sustainextraordinary returns into the futureso forecast industry growth rates areapplied.
Revenue
Licensing payments for the use of abrand are derived from revenue.Increases or decreases in forecastedrevenue increase or decrease thefinal valuation.
Tax Rate
Forecasted royalties are reduced bythe tax rate to reflect the actualamount that would be received bythe brand owner after tax.
5 year Compound Annual Growth Rate (CAGR)
2015 2014
2.6% 3.4% -0.8%
Discount Rate
2015 2014
9.1% 8.6% +0.5%
Long Term Growth Rate
2015 2014
3.2% 2.6% +0.6%
Tax Rate
2015 2014
29% 30% -1.3%
Brand Investment
Brand Equity
Brand Performance
X = $Forecast revenues
%Strong brand
Weak brand
0.00% 0.00% 0.00% 0.00% 0.00% 0.00%
0.8% 0.8%
0.6%
0.8% 0.8%
1.2%
0.6% 0.6%
0.5%
0.6%0.7%
1.0%
DSM BASF Dow Du Pont Akzo Nobel Akzo Nobel
Competitor Royalty RatesCompetitor royalty rates will be different based on different strengths of the brand, having different operating segments and company-specific long term affordability
[XXX] BASF Dow Du Pont Akzo Nobel - Corporate Akzo Nobel – Paints and Coatings
78 78 80 80 82 82
[XXX]

Brand Finance India 100 May 2017 19.Brand Finance India 100 May 2017 18.
How we can help
MARKETING FINANCE TAX LEGAL
Contact usFor brand value report enquiries, please contact:Alex HaighDirector of League Tables Brand Finance [email protected]
For media enquiries, please contact:Robert HaighMarketing & Communications Director Brand Finance [email protected]
For all other enquiries, please contact:[email protected]+44 (0)207 389 9400
linkedin.com/company/brand-finance
facebook.com/brandfinance
twitter.com/brandfinance
For further information on Brand Finance®’s services and valuation experience, please contact your local representative:
Country Contact Email addressAustralia Mark Crowe [email protected] Pedro Tavares [email protected] Bill Ratcliffe [email protected] Minnie Fu [email protected] Nigel Cooper [email protected] Africa Jawad Jaffer [email protected] Victoire Ruault [email protected] Dr. Holger Mühlbauer h.mü[email protected] Ioannis Lionis [email protected] Marc Cloosterman [email protected] Ajimon Francis [email protected] Jimmy Halim [email protected] Massimo Pizzo [email protected] Samir Dixit [email protected] Laurence Newell [email protected] (exc. Brazil) Laurence Newell [email protected] East Andrew Campbell [email protected] Babatunde Odumeru [email protected] Pedro Tavares [email protected] Alexander Eremenko [email protected] Alexander Todoran [email protected] Samir Dixit [email protected] Africa Jeremy Sampson [email protected] Lorena Jorge ramirez [email protected] Lanka Ruchi Gunewardene [email protected] Victoire Ruault [email protected] Muhterem Ilgüner [email protected] Alex Haigh [email protected] Ken Runkel [email protected] Lai Tien Manh [email protected]
Contact detailsOur offices
Disclaimer
Brand Finance has produced this study with an independent and unbiased analysis. The values derived and opinions produced in this study are based only on publicly available information and certain assumptions that Brand Finance used where such data was deficient or unclear . Brand Finance accepts no responsibility and will not be liable in the event that the publicly available information relied upon is subsequently found to be inaccurate.
The opinions and financial analysis expressed in the report are not to be construed as providing investment or business advice. Brand Finance does not intend the report to be relied upon for any reason and excludes all liability to any body, government or organisation.
We help marketers to connect their brands to business performance by evaluating the return on investment (ROI) of brand based decisions and strategies.
+ Branded Business Valuation+ Brand Contribution+ Trademark Valuation+ Intangible Asset Valuation+ Brand Audit+ Market Research Analytics+ Brand Scorecard Tracking+ Return on Marketing Investment+ Brand Transition+ Brand Governance+ Brand Architecture & Portfolio Management+ Brand Positioning & Extension+ Franchising & Licensing
We provide financiers and auditors with an independent assessment on all forms of brand and intangible asset valuations.
+ Branded Business Valuation+ Brand Contribution+ Trademark Valuation+ Intangible Asset Valuation+ Brand Audit+ Market Research Analytics+ Brand Scorecard Tracking+ Return on Marketing Investment+ Brand Transition+ Brand Governance+ Brand Architecture & Portfolio Management+ Brand Positioning & Extension+ Mergers, Acquisitions and Finance Raising Due Diligence+ Franchising & Licensing+ Tax & Transfer Pricing+ Expert Witness
We help brand owners and fiscal authorities to understand the implications of different tax, transfer pricing and brand ownership arrangements.
+ Branded Business Valuation+ Brand Contribution+ Trademark Valuation+ Intangible Asset Valuation+ Brand Audit+ Market Research Analytics+ Franchising & Licensing+ Tax & Transfer Pricing+ Expert Witness
We help clients to enforce and exploit their intellectual property rights by providing independent expert advice in- and outside of the courtroom.
+ Branded Business Valuation+ Brand Contribution+ Trademark Valuation+ Intangible Asset Valuation+ Brand Audit+ Tax & Transfer Pricing+ Expert Witness
2. Analytics: How can I improve marketing effectiveness?
Analytical services help to uncover drivers of demand and insights. Identifying the factors which drive
consumer behaviour allow an understanding of how brands create bottom-line impact.
• Market Research Analytics • Brand Audits
• Brand Scorecard Tracking • Return on Marketing Investment
3. Strategy: How can I increase the value of my branded business?
Strategic marketing services enable brands to be leveraged to grow businesses. Scenario
modelling will identify the best opportunities, ensuring resources are allocated to those activities
which have the most impact on brand and business value.
• Brand Governance • Brand Architecture & Portfolio Management
• Brand Transition • Brand Positioning & Extension
4. Transactions: Is it a good deal? Can I leverage my intangible assets?
Transaction services help buyers, sellers and owners of branded businesses get a better deal by leveraging the value of their intangibles.
• M&A Due Diligence • Franchising & Licensing
• Tax & Transfer Pricing • Expert Witness
1. Valuation: What are my intangible assets worth?
Valuations may be conducted for technical purposes and to set a baseline against which potential strategic brand scenarios can be evaluated.
• Branded Business Valuation • Trademark Valuation
• Intangible Asset Valuation • Brand Contribution
2. ANALYTICS
3. STRATEGY 4.TRANSACTI
ON
1. V
ALUATION
Brand & Business Value

Contact us.
The World’s Leading Independent Branded Business Valuation and Strategy ConsultancyT: +91 98 92 08 59 51 E: [email protected] www.brandfinance.com
Bridging the gap between marketing and finance


![Tanishq Ppt Repaired]](https://static.fdocuments.us/doc/165x107/546c3035b4af9f40358b4653/tanishq-ppt-repaired.jpg)