Index of State WeakneSS In the Developing WorlD r e i g n Po l i c y a t Br o o k i n g s 5 Br o o k...
47
Susan E. Rice and Stewart Patrick Foreign Policy at BROOKINGS INDEX OF STATE WEAKNESS IN THE DEVELOPING WORLD
Transcript of Index of State WeakneSS In the Developing WorlD r e i g n Po l i c y a t Br o o k i n g s 5 Br o o k...
Susan E. Rice and Stewart Patrick1775 Massachusetts Avenue, NWWashington, D.C. 20036brookings.edu
Foreign Policyat BROOKINGS
Index of State WeakneSS In the Developing WorlD

Susan E. Rice and Stewart Patrick
Index of State WeakneSS In the Developing WorlD
Susan E. Rice is Senior Fellow at the Brookings Institution and Stewart Patrick is Research Fellow at the Center for Global Development (CGD). They express their sincere gratitude to Papia Debroy, Corinne Graff, Brandon Hunt, Larry Malm, and Liana Wyler of Brookings and to Kaysie Brown and Kevin Ummel of CGD for their extensive intellectual contributions, research support, and technical assistance in producing the Index, this document, and the associated technical annex.
Foreign Policyat BROOKINGS
Main Report ..........................................................3
Endnotes ............................................................23
Technical Annex...................................................29

ISBN-13: 978-0-8157-7435-8
The views expressed in this report do not necessarily reflect the official position of Brookings, its board or the advisory council members.
Copyright © 2008, The Brookings Institution
The Brookings Institution1775 Massachusetts Avenue, NWWashington, DC 20036brookings.edu
3Fo r e i g n Po l i c y at Br o o k i n g s Br o o k i n g s gl o B a l ec o n o m y a n d de v e l o P m e n t
assisting their officials in setting policy and budgetary priorities.
This paper presents the Index of State Weakness in the Developing World (hereafter, the Index), which ranks all 141 developing countries according to their relative performance in four critical spheres: economic, political, security, and social welfare.6 We define weak states as countries that lack the essential capacity and/or will to fulfill four sets of critical government responsibilities: fostering an environment conducive to sustainable and equitable economic growth; establishing and maintaining legitimate, transparent, and accountable political institutions; securing their populations from violent conflict and controlling their territory; and meeting the basic human needs of their population.
We measure state weakness according to each state’s effectiveness in delivering on these four critical dimensions. Contrary to some conventional usage, we do not equate “strong” states with authoritarian or semiauthoritarian regimes that impose their will within or beyond their borders, a criterion that would make North Korea, for example, a strong state (rather than a weak one, as we regard it). Instead, a state’s strength or weakness is a function of its effectiveness, responsiveness, and legitimacy across a range of government activities.
In this report, we examine state weakness among all developing countries, focusing in particular on the weakest two quintiles. The results provide a current assessment of each developing country’s individual and relative performance in each of the four core areas (and 20 subindicators) of state competence. Ours is thus a descriptive model, providing a snapshot in time of relative state effectiveness. Subsequent, updated
Since September 11, 2001, the United States and other governments have frequently asserted that
threats to international peace and security often come from the world’s weakest states. Such countries can fall prey to and spawn a host of transnational security threats, including terrorism, weapons proliferation, organized crime, infectious disease, environmental degradation, and civil conflicts that spill over borders.1 Accordingly, the 2002 National Security Strategy of the United States maintains that weak and failing states “pose as great a danger to our national interest as strong states.”2 Across the Atlantic, the European Union’s 2003 European Security Strategy labels state failure “an alarming phenomenon.”3 Former United Nations secretary-general Kofi Annan encapsulated this new collective concern in his 2005 report In Larger Freedom, which declares: “If states are fragile, the peoples of the world will not enjoy the security, development, and justice that are their right.”4
Despite general agreement on the dangers of state weakness for U.S. and international security, existing assessments of state weakness across developing countries remain inadequate. What has been largely lacking is a comprehensive, measurable definition of state weakness, with accompanying objective indicators and metrics.5 Any large-scale, cross-country comparison can only be an approximation to be supplemented by more detailed analysis of each state’s circumstances and trajectory. Yet it can provide useful guidance to U.S. and international policymakers on the relative institutional strengths and weaknesses of individual countries, help to inform the allocation of scarce resources, and foster greater policy convergence among donors and multilateral institutions. Equally important, such a tool will give developing countries insight into their own unique performance profile, enabling them to make comparative judgments and
INDEX OF STATE WEAKNESS IN THE DEVELOPING WORLD

4 in d e x o F Stat e We a k n e S S i n t h e De v e l o p i n g Wo r l D
versions could enable policymakers to identify trends in a country’s relative performance. The Index is not intended to predict which states will collapse into conflict, or conversely, emerge from weakness.
By carefully assessing and ranking all 141 developing countries on the basis of their relative weakness, we provide policymakers with a new tool to examine and better understand the unique dynamics and drivers of performance in each of these states and, in principle, to tailor and target their policy interventions more
effectively (see Box 1). We also provide insight into which countries should command the attention of U.S. and international policymakers, given the nature and extent of their weakness. In some cases, weak states may not be receiving adequate focus or resources.7
In the following pages, we present the findings from the “Index of State Weakness in the Developing World” and briefly summarize key implications for U.S. policymakers.
Key Policy imPlications
• Poverty alleviation should be given higher priority in U.S. policy, because poorer countries tend to be weaker ones, and the consequences of state weakness can be significant for U.S. national security.
• U.S. assistance to the world’s weakest states should be increased and targeted to address unique performance gaps in these countries.
• Among failed and critically weak states, U.S. and international efforts should focus on improving security and, in parallel, to the extent possible, on the other drivers of weakness.
• Sub-Saharan Africa is the region with the world’s highest concentration of weak and failed states and requires increased U.S. attention and resources.
• The United States should pay due attention to severe performance gaps even in better-performing states.
• U.S. efforts to strengthen weak states cannot succeed in isolation but must be augmented by and coordinated with the actions of other partners, institutions, and, most importantly, the policies of the concerned countries.
Box 1: key policy implicationS

5Fo r e i g n Po l i c y at Br o o k i n g s Br o o k i n g s gl o B a l ec o n o m y a n d de v e l o P m e n t
MAPPING THE FIELD
Although no universally accepted definition of weak states exists, there is general agreement that such countries lack the capacity and/or will to perform core functions of statehood effectively. In other words, weak states are unable or unwilling to provide essential public services, which include fostering equitable and sustainable economic growth, governing legitimately, ensuring physical security, and delivering basic services. Yet, lacking concrete metrics to evaluate state capacity in each core area of state responsibility, policymakers and scholars resort to a host of adjectives—“weak,” “fragile,” “failing,” failed,” and even “collapsed”—to distinguish among countries suffering from a wide variety of capacity gaps.
Though academic research on state capacity and analytical efforts to identify weak states remain works in progress, interest in state weakness has grown in recent years.8 Existing contributions to the field can usefully be divided into two groups: conceptual analyses that improve our understanding of criteria by which to define weakness and identify cohorts of weak or failed states; and quantitative efforts that rank countries according to weakness criteria and indicators. Among the efforts to quantify state weakness are some designed to predict the outbreak of conflict or state failure. All are described here.
To date, the leading “conceptualizers” of state weakness include:
• The Center for Global Development’s 2004 “Commission on Weak States and U.S. National Security” identified some 50 to 60 weak states, based on three sets of gaps: “capacity,” “legitimacy,” and “security.”9 Yet the commission proposed only one indicator to measure each gap: respectively, childhood immunization (capacity); voice and accountability (legitimacy); and battle deaths (security). Using these indicators, the commission generated three separate lists of weak states but made no attempt to offer a unified or ranked list of countries.
• The Political Instability Task Force (formerly State Failure Task Force), commissioned and
funded by the Central Intelligence Agency’s Directorate of Intelligence, uses extensive open-source data to isolate independent variables generally associated with the onset of “severe internal political crisis,” including revolutionary and ethnic wars, “politicides,” and genocides.10 Based on rigorous statistical analysis, the task force identified three factors that correlate highly with internal crises: high infant mortality, low trade openness, and low levels of democracy. The model focuses only on severe state collapse, not on the full spectrum of failed and weak states.
• Robert Rotberg, director of the Belfer Center’s Program on Intrastate Conflict, Conflict Prevention, and Conflict Resolution at Harvard University, published the results of his five-year research in a 2004 book titled When States Fail.11 Rotberg uses a broad set of economic, political, and security indicators and distinguishes among three categories of weak states: “collapsed,” “failed,” and “weak.” His study defines state weakness as principally a function of conflict and human insecurity but does not rank states according to their level of weakness.
• Among major donor countries, only the United Kingdom’s Department for International Development (DFID) has taken the bold step of producing a proxy list of fragile states, including 46 countries.12 DFID defines “fragility” in terms of the state’s will and capacity to use its domestic and international resources to deliver security, social welfare, economic growth, and legitimate political institutions. DFID has also taken the lead in commissioning papers on the challenges faced by development agencies in fragile states, including how to assess the adequacy of metrics to measure governmental will and capacity in such environments.13 However, DFID does not rank fragile states according to their relative level of weakness.
• The World Bank’s Fragile and Conflict-Affected Countries Group (formerly the Low Income Countries Under Stress Initiative, or LICUS) identifies roughly 30 extremely impoverished countries “experiencing difficulties arising either from conflict or weak institutions and capacity.”14

6 in d e x o F Stat e We a k n e S S i n t h e De v e l o p i n g Wo r l D
The initiative relies on the World Bank’s annual Country Policy and Institutional Assessment (CPIA) scores to determine which states are “fragile.”15 This approach yields three categories of fragility: “severe” countries, with CPIA scores less than or equal to 2.5; “core” countries scoring between 2.6 and 3.0; and an additional set of “marginal” states with scores between 3.1 and 3.2, which are identified for monitoring purposes.16 Although the initiative’s strong emphasis on poverty is compelling, the list includes only countries eligible for assistance under the Bank’s International Development Association (IDA), omitting states like North Korea.17 The 16 indicators used by the Bank to calculate CPIA scores are heavily focused on economic and financial management as well as bureaucratic efficiency.18
In addition, other organizations have made recent attempts to rank countries according to their level of performance. The leading “quantifiers” of weak states include the following:
• Ashraf Ghani of the Brookings Institution and the Institute for State Effectiveness, Clare Lockhart of the Institute for State Effectiveness, and Michael Carnahan of Australian National University have proposed a “sovereignty index” based on 10 “core functions” that states should perform, and they outline a quantitative framework to assess these core functions in individual countries.19 Their sovereignty index, which is forthcoming, will use over 100 indicators to determine how far short a given state falls in performing its basic functions.20 The indicators focus especially on the economic components of state function, including market regulation and the management of public finances.
• In August 2006, the Country Indicators for Foreign Policy Project, led by David Carment on behalf of the Canadian International Development Agency, produced an index of state fragility. Defining weakness as a country’s capacity to fulfill the basic functions of governance along three dimensions—“authority,” “capacity,” and “legitimacy”—the index assesses country performance in 10 areas of state responsibility using 74 indicators.21
Though comprehensive, the use of so many indicators may make it difficult for policymakers to identify priority sectors on which to focus attention and resources. We also find that the distinctions among authority, capacity, and legitimacy often break down in practice.
• In 2006, the U.S. Agency for International Development (USAID) produced an analysis called “Measuring State Fragility,” which proposes ranking weak states according to 33 indicators of state effectiveness and legitimacy in four governance areas: economic, political, security, and social spheres.22 In practice, however, USAID officials concede that the distinction between government “effectiveness” and “legitimacy” in different areas of state function often breaks down. Moreover, the selection of indicators was perhaps skewed because it was based in part on “how well they related to the programs USAID typically support in weak and low-performing states.”23 This promising initiative was suspended in 2006 along with the entire USAID Fragile States agenda/strategy. Because USAID is sensitive to the political implications of the U.S. government officially ranking other countries, it never released a comparative list of fragile states.
• Monty G. Marshall and Jack A. Goldstone of
George Mason University recently published a “State Fragility Index.”24 Much like USAID’s approach, the Fragility Index ranks country performance both in terms of “effectiveness” and “legitimacy” across four dimensions of state function, including economic development, governance, security, and social development. Employing about 16 underlying data sources, they generate effectiveness and legitimacy scores in each of these 4 dimensions. The 8 resulting scores range from 0 (no fragility) to 3 (high fragility) and are summed to produce an overall fragility score for over 160 developed and developing countries. The authors assign scores for each indicator on the basis of a narrow range of integers (0, 1, 2, or 3). Also, like USAID’s approach, the State Fragility Index seeks to distinguish state “effectiveness” from “legitimacy” in each dimension of state function, a distinction that is potentially blurry in practice.

7Fo r e i g n Po l i c y at Br o o k i n g s Br o o k i n g s gl o B a l ec o n o m y a n d de v e l o P m e n t
• The 2007 Mo Ibrahim Foundation’s Index of African Governance, produced by Harvard’s Robert I. Rotberg and Rachel Gisselquist, assesses the performance of 48 sub-Saharan African countries in five key governance areas: “safety and security”; “rule of law, transparency, and corruption”; “participation and human rights”; “sustainable economic development”; and “human development.”25 Their index is based on an array of 58 indicators. Because it covers only Africa, it does not enable comparisons across the developing world.
Two additional quantitative assessments of weakness rely on variables that seek to predict conflict, instability, and state failure:
• The “Failed States Index” produced by the Fund for Peace and published annually in Foreign Policy magazine is perhaps the best-known ranking of countries according to their relative weakness.26 It is compiled using 12 economic, political, and social indicators that seek to measure factors (e.g., “mounting demographic pressures”) that may be conducive to conflict. It also relies on proprietary software that scans news articles, U.S. State Department reports, and independent studies for key terms related to these indicators and to the strength of five “core state institutions.”27 The Fund’s 2006 Index covers 148 countries, including most large developing and developed countries, and is valuable for its emphasis on conflict and insecurity as crucial aspects of state weakness. Since the Failed States Index focuses almost exclusively on “early warning and assessment” of internal conflicts,28 it underplays other aspects of state weakness—like inadequate health care and education. Additionally, the method of arriving at indicator scores relies extensively on selected press reports and lacks full transparency.
• Scholars at the University of Maryland’s Center
for International Development and Conflict Management have recently released a “Peace and Conflict Instability Ledger,” which ranks countries according to their risk of “future instability.” The ledger builds on the work of the Political
Instability Task Force. It provides an overall “risk ratio” for 160 countries using data on 5 political, economic, security, and social variables that are statistically correlated with “instability events.”29 Both rigorous and transparent, the ledger (like the Political Instability Task Force) focuses primarily on early warnings for violent events like war or genocide.
A NEw TooL FoR PoLIcyMAkERS: THE INDEx oF STATE wEAkNESS IN THE
DEvELoPING woRLD
Collectively, these earlier efforts to identify and, in some cases, to rank weak states have considerably increased the visibility and policy relevance of research on state weakness. However, from the perspective of measuring state weakness across the developing world, each approach has shortcomings. In general, these efforts tend to:
• characterize weakness using more extreme cases of failed or collapsed states, while underemphasizing the many states that exhibit various forms of weakness short of outright failure;
• concentrate on one or two of the core functions of statehood—security and political legitimacy, for instance—without fully capturing other areas of state responsibility;
• use metrics that lack full transparency to rank weak states, hindering replicability; and
• focus primarily on the present, failing to capture recent historical trends.
The aim of the Index of State Weakness in the Developing World is to address those shortcomings and provide U.S. and international policymakers with a new, comprehensive, user-friendly tool. The Index ranks countries in a straightforward and transparent fashion that will enable policymakers to assess with greater ease and accuracy the relative weakness of developing countries. It also provides insights into how officials around the world might allocate their scarce attention and resources among developing countries in order to address more efficiently and effectively the challenges posed by state weakness.

8 in d e x o F Stat e We a k n e S S i n t h e De v e l o p i n g Wo r l D
The Index is not limited to a particular geographical region or functional area of state responsibility. Rather, it encompasses all developing countries and tracks their performance in each core area of state function. By capturing state performance across all four areas of state responsibility, the Index allows policymakers to identify potential patterns of state weakness, either within geographical regions or across functional areas (e.g., between political governance and security within countries).30 In addition, the Index assembles, derives from, and clearly displays information on the performance of individual countries across a manageable selection of 20 important indicators. (See Table 1 for a list of the 20 indicators). The indicators will allow policymakers to zero in on the challenges faced by individual developing countries. Scores are also scaled for convenient comparability across states.
METHoDoLoGy
As stated above, we define weak states as countries lacking the capacity and/or will to foster an environment conducive to sustainable and equitable economic growth; to establish and maintain legitimate, transparent, and accountable political institutions; to secure their populations from violent conflict and to control their territory; and to meet the basic human needs of their population. With this definition, we aim to capture government responsibilities commonly considered core functions of statehood.31
This definition also informs our selection of a set of indicators that measure state weakness in the developing world. The selected indicators allow for a fine-grained assessment of relative state weakness and enable us to rank the 141 developing countries, which the World Bank classifies as low-income, lower middle-income, and upper middle-income.32 Specifically, the Index relies on four “baskets,” each of which contains five indicators (see Table 1). Each of the four baskets consists of indicators that are proxies for one core aspect of state function:
1. Indicators in the economic basket assess a state’s ability to provide its citizens with a stable economic environment that facilitates sustainable and equitable growth. They take into account recent economic growth, the quality of existing economic policies, whether
the environment is conducive to private sector development, and the degree to which income is equitably distributed.
2. Political indicators assess the quality of a state’s political institutions and the extent to which its citizens accept as legitimate their system of governance. They seek to measure government accountability to citizens, the rule of law, the extent of corruption, the extent of democratization, freedom of expression and association, and the ability of the state bureaucracy and institutions to function effectively, independently, and responsively.
3. Security indicators evaluate whether a state is able to provide physical security for its citizens. They measure the occurrence and intensity of violent conflict or its residual effects (e.g., population displacement), illegal seizure of political power, widespread perceptions of political instability, territory affected by conflict, and state-sponsored political violence and gross human rights abuses.
4. Indicators in the social welfare basket measure how well a state meets the basic human needs of its citizens, including nutrition, health, education, and access to clean water and sanitation.
As is often the case when examining the world’s poorest countries, complete data sets are often unavailable. Several indicators that would have been ideally suited to measuring state weakness had to be omitted due to missing data. For example, unemployment and crime rates would have been excellent additional measures of security and state effectiveness, but they are largely unavailable for many low-income countries that lack sufficient resources to collect data. Proxies for ungoverned spaces, the quality of primary and secondary school education, and tax-collection capacity would also have been ideal indicators of state weakness, but existing data sets remain too incomplete for the purposes of the index. Significant improvements in the quality of data on developing countries are needed to allow a more accurate understanding of state performance.
The Index is based on 5 indicators in each basket. Taken together, the 20 indicators yield a balanced picture of how developing countries perform or fail to perform along multiple dimensions. Within each basket, the indicator scores are standardized and

9Fo r e i g n Po l i c y at Br o o k i n g s Br o o k i n g s gl o B a l ec o n o m y a n d de v e l o P m e n t
Note: For each indicator, the researchers sought to use the latest data available. Most of the data sources used were published in 2007, and most of the data were for the years indicated above. For more detailed information on data sources and the aggregation process see the “Technical Annex” (page 29).
taBle 1: DeScription of the 20 inDicatorS
economic Political secURity social WelFaRe1. Gni per capita, 2006
(World Bank, World Development Indicators)
2. GDP growth, 2002-2006 (World Bank, World Development Indicators)
3. income inequality, 2006 (World Bank, World Development Indicators)
4. inflation, 2002-2006 (International Monetary Fund, International Financial Statistics)
5. Regulatory Quality, 2006 (World Bank, Governance Matters VI)
6. Government effectiveness, 2006 (World Bank, Governance Matters VI)
7. Rule of law, 2006 (World Bank, Governance Matters VI)
8. Voice and accountability, 2006 (World Bank, Governance Matters VI)
9. control of corruption, 2006 (World Bank, Governance Matters VI)
10. Freedom Ratings, 2006 (Freedom House)
11. conflict intensity, 1992-2006 (Center for Systemic Peace, Major Episodes of Political Violence)
12. Political stability and absence of Violence, 2006 (World Bank, Governance Matters VI)
13. incidence of coups, 1992-2006 (Archigos 2.8 and Economist Intelligence Unit)
14. Gross Human Rights abuses, 1992-2006 (Political Terror Scale)
15. territory affected by conflict, 1991-2005 (Political Instability Task Force)
16. child mortality, 2005 (UNICEF, State of the World’s Children)
17. Primary school completion, 2005 (World Bank, World Development Indicators)
18. Undernourishment, 2004 (Food and Agriculture Organization)
19. Percent Population with access to improved Water sources, and with access to improved sanitation Facilities, 2004 (World Bank, World Development Indicators)
20. life expectancy, 2005 (World Bank, World Development Indicators)
aggregated, creating individual indicator and basket scores ranging from 0.0 (worst) to 10.0 (best). The 4 basket scores are then averaged to obtain an overall score for state weakness, ranging from just above 0 to just short of a perfect 10, to produce a ranking of states on the basis of their relative weakness.33 Though the most widely available and accurate data are used to establish the precise rank of countries, absent accurate indicators, the Index must necessarily be viewed as an approximation of each country’s weakness relative to other developing countries.34 The 20 indicators and 4 basket scores provide multifaceted yet user-friendly measures of each state’s performance profile. The 20 individual indicator scores also allow useful comparisons between states on each dimension of state performance.
MAIN FINDINGS The Index of State Weakness in the Developing World (see pull-out 1) assesses the broad spectrum of 141 developing countries, ranging from Somalia (#1), a failed state at the very bottom of the performance or weakness spectrum, and Haiti (#12), a critically weak state, to high performers such as Poland (#135) and Chile (#139) at the upper end of the spectrum. The countries analyzed are a geographically, economically, and politically diverse set. They span six continents, have a per capita gross national income (GNI) ranging from $100 to more than $10,000, and include both repressive autocracies like Burma (#17) and North Korea (#15) and successful democracies like the Slovak Republic (#141).

10 in d e x o F Stat e We a k n e S S i n t h e De v e l o p i n g Wo r l D
We term countries in the bottom quintile “critically weak states” and deem the 3 weakest states in the world “failed states.” Failed states perform markedly worse than all others—even those in their critically weak cohort (see Figure 1). Failed and critically weak states are those least capable of fulfilling most, if not all, of the four critical functions of government. We term the second quintile “weak states.” These 28 countries suffer fewer severe capacity gaps than the bottom quintile but tend to perform poorly in some areas and score variably across the four dimensions of state function. In addition, we note that a number of countries that perform better overall than those in the bottom two quintiles are nonetheless “states to watch,” because they score notably poorly in at least one of the four core areas of state function.
PATTERNS oF STATE wEAkNESS
Several clear patterns emerge from the ranking of 141 developing countries. In particular, our findings
reveal a strong positive relationship between countries’ scores on many individual indicators and their overall performance on the Index.35 However, this strong positive relationship does not hold with respect to 4 of our 20 indicators—coups, inflation, GDP growth, and inequality. Among the stronger relationships is that between poverty and overall weakness. Thus, a substantial majority of the world’s failed and critically weak states are also the world’s poorest, with GNI per capita in the bottom quintile of developing nations. Conversely, none of the countries in the top-performing quintile of developing countries have incomes that place them in the bottom two quintiles of GNI per capita. In addition, the weakest countries on the Index tend to be the least democratic. None of the states in the bottom two quintiles of the Index, except Mali (#52) and Lesotho (#53), are classified by Freedom House as “free,” whereas only six of the top-performing quintile of countries fall short of “free.” We also identified trends in country performance across some of the core areas of state responsibility. Most notably, developing countries that are more
Rank countryoverall score economic Political security
social Welfare
Gni Per capita
1 somalia 0.52 0.00 0.00 1.37 0.70 2262 afghanistan 1.65 4.51 2.08 0.00 0.00 2713 congo, Dem. Rep. 1.67 4.06 1.80 0.28 0.52 1304 iraq 3.11 2.87 1.67 1.63 6.27 11345 Burundi 3.21 5.01 3.46 2.95 1.43 1006 sudan 3.29 5.05 2.06 1.46 4.59 8107 central african Rep. 3.33 4.11 2.90 5.06 1.25 3608 Zimbabwe 3.44 1.56 1.56 6.81 3.84 3509 liberia 3.64 3.39 3.91 6.01 1.25 14010 cote D’ivoire 3.66 5.23 2.12 3.71 3.56 87011 angola 3.72 5.42 2.67 5.32 1.45 198012 Haiti 3.76 3.90 2.62 5.21 3.31 480
inDeX oF state WeaKness in tHe DeVeloPinG WoRlD(Bottom Two Quintiles Only)
The 141 weakest states and their index basket scores are presented below. A basket score of 0.00 represents the worst score in the 141-country sample, a score of 10.00 signifies the best.
color coding Key Color coding and quintiles are based on full sample of 141 countries
BOTTOM QUINTIlE2ND QUINTIlE3rd QUINTIlE4TH QUINTIlETOP QUINTIlE
taBle 2: inDex of State WeakneSS in the Developing WorlD

11Fo r e i g n Po l i c y at Br o o k i n g s Br o o k i n g s gl o B a l ec o n o m y a n d de v e l o P m e n t
Rank countryoverall score economic Political security
social Welfare
Gni Per capita
13 sierra leone 3.77 5.04 3.87 5.43 0.76 24014 eritrea 3.84 3.09 2.78 7.01 2.48 20015 north Korea 3.87 0.52 0.95 7.28 6.73 n/a16 chad 3.90 5.80 2.42 6.18 1.21 48017 Burma 4.16 4.72 0.89 3.96 7.07 n/a18 Guinea-Bissau 4.16 5.22 3.83 5.96 1.69 19019 ethiopia 4.46 6.14 4.03 5.91 1.75 18020 congo, Rep. 4.56 5.08 2.77 6.45 3.95 110021 niger 4.60 5.45 4.69 7.33 0.94 26022 nepal 4.61 5.17 3.84 2.94 6.50 29023 Guinea 4.67 5.00 2.64 7.43 3.61 41024 Rwanda 4.68 5.33 4.26 6.62 2.51 25025 equatorial Guinea 4.77 7.51 1.73 7.95 1.91 825026 togo 4.80 4.78 2.68 7.38 4.38 35027 Uganda 4.86 5.78 4.55 4.89 4.23 30028 nigeria 4.88 5.39 3.51 5.37 5.24 64029 cameroon 5.12 5.78 3.09 7.54 4.07 108030 yemen 5.18 5.80 3.64 6.43 4.85 76031 comoros 5.20 4.24 4.20 8.18 4.20 66032 Zambia 5.23 5.08 4.59 8.15 3.11 63033 Pakistan 5.23 6.58 3.52 4.69 6.13 77034 cambodia 5.27 6.33 3.00 7.18 4.57 48035 turkmenistan 5.27 5.05 1.40 7.88 6.75 170036 Uzbekistan 5.30 5.20 1.78 6.66 7.54 61037 mauritania 5.30 6.23 4.34 6.38 4.24 74038 Djibouti 5.31 5.05 3.69 8.21 4.29 106039 mozambique 5.32 5.60 5.33 8.35 1.98 34040 Papua new Guinea 5.32 5.13 4.62 7.45 4.08 77041 swaziland 5.33 5.57 3.65 8.28 3.80 243042 tajikistan 5.35 6.18 3.03 6.39 5.82 39043 east timor 5.51 3.93 4.41 7.74 5.98 84044 Burkina Faso 5.51 6.30 4.87 8.30 2.59 46045 laos 5.53 5.88 2.56 7.98 5.71 50046 malawi 5.60 5.68 4.83 8.11 3.77 17047 colombia 5.63 5.84 5.79 1.78 9.11 274048 Bangladesh 5.64 6.08 3.97 6.55 5.98 48049 madagascar 5.65 5.24 5.95 7.65 3.76 28050 Kenya 5.65 5.77 4.72 6.95 5.15 58051 Gambia 5.79 5.26 4.54 8.29 5.06 31052 mali 5.85 6.33 6.16 8.49 2.43 44053 lesotho 5.88 4.59 6.40 8.35 4.18 103054 solomon islands 5.92 4.59 5.05 7.66 6.39 68055 tanzania 5.94 6.38 5.41 8.08 3.89 35056 sri lanka 5.94 6.32 5.47 3.38 8.59 1300

12 in d e x o F Stat e We a k n e S S i n t h e De v e l o p i n g Wo r l D
successful at political governance also tend to be better providers of social welfare. There is a similar, moderately strong relationship between political governance and the ability to ensure the security of citizens. Not surprisingly, the countries that perform better economically also tend to be better providers of social welfare. Though country performance in the economic and political baskets is not as strongly related, countries with high government effectiveness are generally also strong economic performers. None of these relationships are water-tight; there are cases of countries with abysmal democratic governance records, for example, that are relatively good providers of social welfare (e.g., Syria, #59, and Cuba, #62). Conversely, some well-governed countries, such as Namibia (#82) and Botswana (#102), still perform poorly on social welfare indicators. Yet, across the developing world as a whole, poor performance in maintaining security or providing social welfare tends to be associated with a lack of democratic governance, whereas stronger economic performance often goes hand in hand with more adequate social welfare provision.
The existence of relationships among the four baskets is significant, despite the fact that the data do not reveal the direction of causality. The data confirm that state weakness is better conceived as a function of all four core areas of state responsibility, not just one or two spheres. By widening our analytical lens to focus not just on conflict (as does the Failed States Index), governance (like the World Bank’s Governance Matters indicators), or development (like the United Nations Development Program’s Human Development Index) but on all areas of state function, the Index enables policymakers to gain a more comprehensive understanding of the patterns and drivers of state weakness in the developing world, and it can ultimately serve as a clearer road map and better guide to strengthening each state’s capacity. In addition, as Figure 1 illustrates, the three failed countries register strikingly low overall weakness scores compared with the other states. Beyond the threshold for failed states, however, no clear-cut categories emerge. Instead, the Index shows that state
figure 1: Spectrum of State WeakneSS
ove
rall
scor
e
Faile
d st
ates
6
4
2
00 5 10 15 20 25 30 35 40 45 50 55
overall Rank
Weak States (#29-#56)Critically Weak States (#4-#28)

13Fo r e i g n Po l i c y at Br o o k i n g s Br o o k i n g s gl o B a l ec o n o m y a n d de v e l o P m e n t
Failed States
Critically Weak States
Weak States
States to Watch*
* Fall in both 3rd (yellow) and 4th (green) quintiles
figure 2: map of the WeakeSt StateS
weakness varies along a rather smooth continuum. This continuous distribution suggests that state weakness is best characterized as a relative phenomenon that evades rigid categorization.
Failed and critically weak states are geographically concentrated in sub-Saharan Africa and, to a lesser extent, in South Asia and Central Asia (see Figure 2). Though only about one-third of the 141 developing countries are in sub-Saharan Africa, 23 of the 28 critically weak states are in sub-Saharan African. There are, of course, high performers in sub-Saharan Africa—including Botswana (#102), Mauritius (#133), the Seychelles (#126), and South Africa (#109). Nonetheless, most countries in sub-Saharan Africa, even the top performers, score poorly on social welfare indicators, compared with countries in other regions, due in part to the devastating impact of the HIV/AIDS pandemic.
In South Asia, countries tend to score lower on security than other core areas due primarily to ongoing or recent conflict. Afghanistan (#2), India (#67), Nepal (#22), Pakistan (#33) and Sri Lanka (#56) all rank in the bottom quintile in the security sphere. India
and Sri Lanka receive higher overall scores than their counterparts in the region, due mainly to their stronger performance in the political and economic spheres. Conversely, Bhutan (#94) has comparatively higher economic and political scores and ranks among the top quintile on security. Countries in Central Asia typically score lower on political indicators than in the other baskets. By far the worst performers are Turkmenistan (#35), Uzbekistan (#36), and Tajikistan (#42). Uzbekistan’s overall rank is reduced by its abysmal political scores; it falls in the bottom quintile among developing countries on each of the five indicators in the political basket, and it receives the lowest possible score on the freedom indicator. Turkmenistan also ranks among the worst in the world on governance. Yet even relatively stronger performers in the region, including Kyrgyzstan (#73), are weak in the areas of government effectiveness and legitimacy. Countries in Europe tend to either fall outside the scope of the index or score near the very top. Moldova (#88), Ukraine (#107), and Serbia (#108) are the weakest countries in Europe.

14 in d e x o F Stat e We a k n e S S i n t h e De v e l o p i n g Wo r l D
east asia & PaciFic
eURasia & soUtH asia
miDDle east & noRtH aFRica
sUB-saHaRan aFRica
WesteRn HemisPHeRe
north Korea (#15)
Burma (#17)
cambodia (#34)
Papua new Guinea (#40)
east timor (#43)
afghanistan (#2)
nepal (#22)
Pakistan (#33)
turkmenistan (#35)
Uzbekistan (#36)
iraq (#4)
yemen (#30)
algeria (#57)
syria (#59)
iran (#66)
somalia (#1)
Democratic Republic of the congo (#3)
Burundi (#5)
sudan (#6)
central african Republic (#7)
Haiti (#12)
colombia (#47)
Guatemala (#60)
cuba (#62)
Bolivia (#64)
Although the majority of the critically weak and weak states falter in the political sphere, democratic governance is not always associated with strong state capacity. States that are well governed yet weak include Colombia (#47) and Mali (#52). By the same token, some autocracies, as exemplified by Belarus (#81) and Libya (#86), score relatively well.
Overall, the Index suggests that there are multiple typologies of weakness (see Table 4). Many of the critically weak states—including the Central African Republic (#7), Guinea (#23), Haiti (#12), and Nigeria (#28)—exhibit across-the-board weakness in all four core spheres of state performance. Yet a minority of developing countries exhibit extremely low scores in just one or two areas. For instance, insecurity and conflict negatively affect the overall scores of Algeria (#57), Colombia (#47), Russia (#65), Indonesia (#77), and Sri Lanka (#56). East Timor (#43) performs relatively better than one might expect, because the available data do not reflect the recent turmoil that began in 2006. Equatorial Guinea (#25), one of the few upper-middle-income countries on the list of critically weak states, scores extremely low in the political and social welfare baskets, but above average in the other two areas. Mozambique (#39) scores in the bottom 10 percent on social welfare, despite above-average scores in the other three core areas. North Korea (#15) and Zimbabwe (#8) are among the most autocratic states and are experiencing sharp, potentially destabilizing economic decline.
taBle 3: WeakeSt StateS By region
FAILED AND cRITIcALLy wEAk STATES
The bottom three countries in the Index are failed states and also the world’s most insecure countries. They lack the ability to effectively control substantial portions of their territory, and they are all currently in conflict. Their governments are unable and/or unwilling to provide for the essential human needs of their people—in terms of security as well as adequate food, clean water, health care, and education. Their abysmal overall scores reflect the vicious cycle of collapsed security environments that result in (and may sometimes be fueled by) poverty, decaying political institutions, bankrupt economies, and miserable social conditions. Somalia (#1), perhaps the world’s most emblematic failed state, has been without a functional central government since 1991, and its capacity to provide key public goods to its citizens has collapsed. Somalia’s civil war destroyed the state judiciary, leaving an institutional vacuum that was subsequently filled by the Islamic Courts Union. Somalia’s Ethiopian-backed interim government, installed in 2007, lacks legitimacy and is failing to fulfill any critical functions of state. Somalia’s health care and education systems remain in shambles, as reflected in the country’s rock bottom social welfare score.
Afghanistan (#2), the world’s second-weakest state, is also the most insecure. It has suffered from a long history of violent conflict as well as a lack of government control over significant portions of its territory and

15Fo r e i g n Po l i c y at Br o o k i n g s Br o o k i n g s gl o B a l ec o n o m y a n d de v e l o P m e n t
taBle 4: WorSt performerS By BaSket anD By inDiviDual inDicator
econ
omic
economic BasKet
Gni PeR caPita GDP GRoWtHincome
ineQUalityinFlation
ReGUlatoRy QUality
1. Somalia (#1)2. North Korea
(#15)3. Zimbabwe (#8)4. Iraq (#4)5. Eritrea (#14)
1. Burundi (#5)2. Dem. Rep. of
Congo (#3)3. liberia (#9)4. Malawi (#46)5. Ethiopia (#19)
1. Zimbabwe (#8)2. East Timor (#43)3. liberia (#9)4. Micronesia
(#103)5. Seychelles
(#126)
1. Namibia (#82)2. lesotho (#53)3. Central African
Republic (#7)4. Botswana
(#102)5. Bolivia (#64)
1. Zimbabwe (#8)2. Angola (#11)3. Burma (#17)4. Guinea (#23)5. Eritrea (#14)
1. Somalia (#1)2. North Korea
(#15)3. Burma (#17)4. Zimbabwe (#8)5. Turkmenistan
(#35)
Poli
tica
l
Political BasKet
GoVeRnment eFFectiVeness
RUle oF laWVoice &
accoUntaBilitycontRol oF coRRUPtion
FReeDom
1. Somalia (#1)2. Burma (#17)3. North Korea
(#15)4. Turkmenistan
(#35)5. Zimbabwe (#8)
1. Somalia (#1)2. North Korea
(#15)3. Comoros (#31)4. Iraq (#4)5. Dem. Rep. of
the Congo (#3)
1. Somalia (#1)2. Afghanistan (#2)3. Iraq (#4)4. Zimbabwe (#8)5. Dem. Rep. of
the Congo (#3)
1. Burma (#17)2. North Korea
(#15)3. Somalia (#1)4. Turkmenistan
(#35)5. libya (#86)
1. Somalia (#1)2. North Korea
(#15)3. Burma (#17)4. Equatorial
Guinea (#25)5. Afghanistan (#2)
Somalia (#1)*North Korea (#15)*Burma (#17)*Turkmenistan
(#35)*Uzbekistan (#36)*libya (#86)*Syria (#59)*Cuba (#62)*
secU
Rity
secURity BasKet
conFlict intensity
GRoss HUman RiGHts aBUses
teRRitoRy aFFecteD By
conFlict
inciDence oF coUPs
Political staBility & aBsence oF
Violence
1. Afghanistan (#2)2. Dem. Rep. of
Congo (#3)3. Somalia (#1)4. Sudan (#6)5. Iraq (#4)
1. Sudan (#6)2. Somalia (#1)3. Sri lanka (#56)4. Dem. Rep. of
Congo (#3)5. Afghanistan (#2)
1. Sudan (#6) †
1. Iraq (#4) †2. Dem. Rep. of
the Congo (#3) †
2. Colombia (#47) †3. Afghanistan (#2)
1. Colombia (#47)2. Afghanistan (#2)3. Somalia (#1)4. Nepal (#22)5. Dem. Rep. of
Congo (#3)
1. Fiji (#76)2. Thailand (#79)3. Guinea-Bissau
(#18)4. Mauritania (#37)5. Sao Tome &
Principe (#61)
1. Iraq (#4)2. Somalia (#1)3. Dem. Rep. of
Congo (#3)4. Afghanistan (#2)5. Nepal (#22)
soci
al W
elFa
Re
social WelFaRe BasKet
cHilD moRtality
access to clean WateR
anD imPRoVeD sanitation
UnDeR-noURisHment
PRimaRy scHool
comPletion
liFe eXPectancy
1. Afghanistan (#2)2. Dem. Rep. of
Congo (#3)3. Somalia (#1)4. Sierra leone
(#13)5. Niger (#21)
1. Sierra leone (#13)
2. Angola (#11)3. Afghanistan (#2)4. Niger (#21)5. liberia (#9)
1. Ethiopia (#19)2. Chad (#16)3. Somalia (#1)4. Niger (#21)5. Guinea (#23)
1. Eritrea (#14)2. Dem. Rep. of
Congo (#3)3. Burundi (#5)4. Comoros (#31)5. Tajikistan (#42)
1. Central African Republic (#7)
2. Guinea-Bissau (#18)
3. Niger (#21)4. Burkina Faso
(#44)5. Chad (#16)
1. Botswana (#102)
2. lesotho (#53)3. Zimbabwe (#8)4. Zambia (#32)5. Central African
Republic (#7)
Note: Number in parenthesis indicates each country’s overall rank.*The countries marked with an asterisk all received the lowest possible score on the Freedom House indicator.†For Gross Human Rights Abuses, Sudan and Iraq both received the worst score; Dem. Rep. of Congo and Columbia both receivedthe second lowest score.
16 in d e x o F Stat e We a k n e S S i n t h e De v e l o p i n g Wo r l D
an inability to curtail grave human rights abuses. In the area of social welfare, Afghanistan also receives the world’s lowest score due to high child mortality, inadequate access to improved water and sanitation, and low primary school completion rates.
Beyond the three failed states, other countries in the bottom quintile of the Index warrant policymakers’ sustained attention. Failed and critically weak states cover most of sub-Saharan Africa, stretching over 2,000 miles from southwestern Africa, across the Great Lakes Region, parts of West Africa, and into East Africa. This sea of state failure and critical weakness condemns more than 480 million people to sustained violence, deprivation, and hopelessness. Nigeria (#28), the most populous country in sub-Saharan Africa, garners an especially low security score and does not perform above the two bottom quintiles in any area of state function. Nigeria’s performance matters enormously to the West African region, and its further faltering or even potential failure would have far-reaching regional and international ramifications.
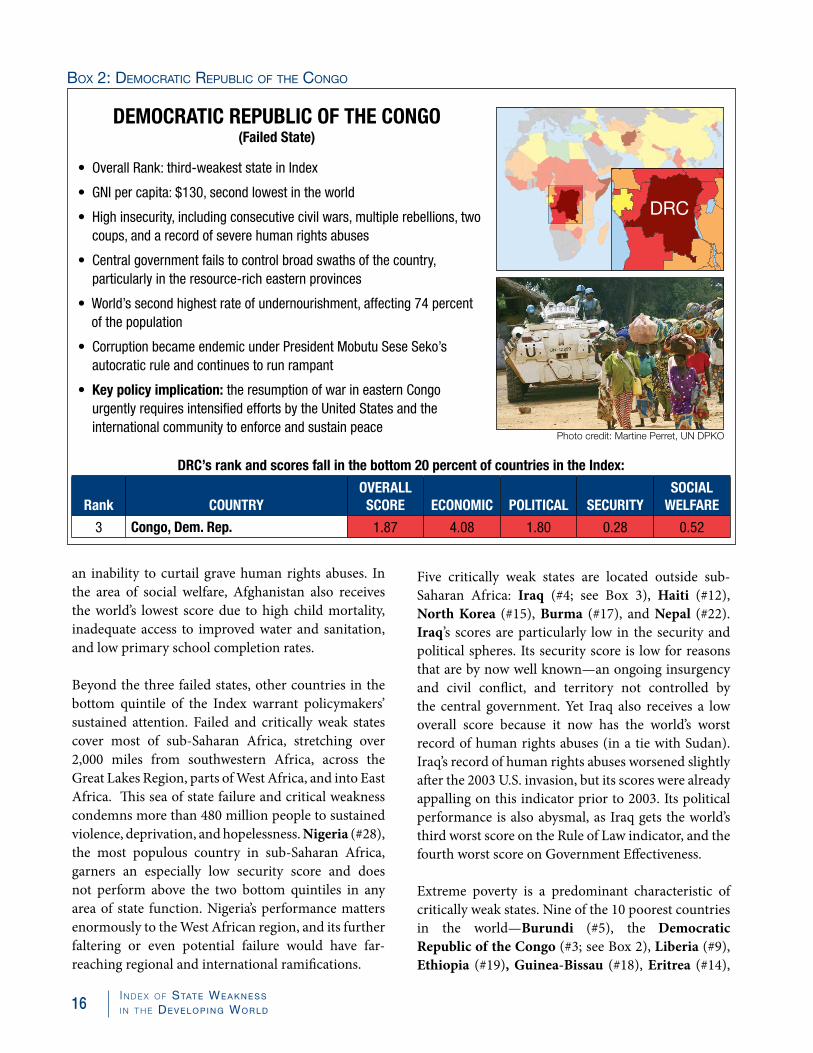
DRC
DemocRatic RePUBlic oF tHe conGo(Failed state)
• Overall Rank: third-weakest state in Index
• GNI per capita: $130, second lowest in the world
• High insecurity, including consecutive civil wars, multiple rebellions, two coups, and a record of severe human rights abuses
• Central government fails to control broad swaths of the country, particularly in the resource-rich eastern provinces
• World’s second highest rate of undernourishment, affecting 74 percent of the population
• Corruption became endemic under President Mobutu Sese Seko’s autocratic rule and continues to run rampant
• Key policy implication: the resumption of war in eastern Congo urgently requires intensified efforts by the United States and the international community to enforce and sustain peace
DRc’s rank and scores fall in the bottom 20 percent of countries in the index:
Rank coUntRyoVeRall scoRe economic Political secURity
social WelFaRe
3 congo, Dem. Rep. 1.87 4.08 1.80 0.28 0.52
Box 2: Democratic repuBlic of the congo
Five critically weak states are located outside sub-Saharan Africa: Iraq (#4; see Box 3), Haiti (#12), North Korea (#15), Burma (#17), and Nepal (#22). Iraq’s scores are particularly low in the security and political spheres. Its security score is low for reasons that are by now well known—an ongoing insurgency and civil conflict, and territory not controlled by the central government. Yet Iraq also receives a low overall score because it now has the world’s worst record of human rights abuses (in a tie with Sudan). Iraq’s record of human rights abuses worsened slightly after the 2003 U.S. invasion, but its scores were already appalling on this indicator prior to 2003. Its political performance is also abysmal, as Iraq gets the world’s third worst score on the Rule of Law indicator, and the fourth worst score on Government Effectiveness.
Extreme poverty is a predominant characteristic of critically weak states. Nine of the 10 poorest countries in the world—Burundi (#5), the Democratic Republic of the Congo (#3; see Box 2), Liberia (#9), Ethiopia (#19), Guinea-Bissau (#18), Eritrea (#14),
Photo credit: Martine Perret, UN DPko

17Fo r e i g n Po l i c y at Br o o k i n g s Br o o k i n g s gl o B a l ec o n o m y a n d de v e l o P m e n t
Iraq
iRaQ(critically Weak state)
• Overall Rank: world’s fourth-weakest state
• GNI per capita: has declined and now stands at only $1,134, lower than all neighboring states
• Security score reflects ongoing counterinsurgency and sectarian conflicts
• Iraq has world’s lowest score on “Gross Human Rights Abuses” and “Political Stability and Absence of Violence”
• Iraq has world’s third-lowest score on “Rule of law” and fourth-lowest score on “Government Effectiveness”
• Social Welfare is buoyed by a relatively high rate (80 percent) of access to clean water and improved sanitation facilities
• Key policy implication: U.S. assistance in Iraq should target all the critical needs of the Iraqi people, not just security and representative governance, but also corruption, rule of law, job creation and economic growth
iraq’s rank and most of its scores fall in the bottom 20 percent of countries in the index:
Rank coUntRyoVeRall scoRe economic Political secURity
social WelFaRe
4 iraq 3.11 2.87 1.67 1.63 6.27
Box 3: iraq
Somalia (#1), Sierra Leone (#13), and Rwanda (#24)—are critically weak states. Malawi (#46) is the one exception. All but 4 of the 28 critically weak states are low-income countries; the 4 exceptions—Iraq (#4), the Republic of the Congo (#20), Angola (#11), and Equatorial Guinea (#25)—are oil producers with uneven distribution of wealth.
More than 85 percent of the critically weak states have experienced conflict in the past 15 years. Among the countries that have not yet failed but are wracked by longstanding violent conflict are Burma (#17) and Nepal (#22). In Nigeria (#28), communal violence and a history of political instability place it at risk of wider conflict. Poor, conflict-ridden countries may be condemned to arrested development for years, if not decades.36
The international community has intervened militarily in many failed and critically weak states. In the past 15 years, the UN (and in some cases also the African Union) has deployed peacekeepers or observers to
half of the failed or critically weak states, while the United States has deployed forces to five: Afghanistan (#2), Haiti (#12), Iraq (#4), Liberia (#9), and Somalia (#1).37 France and the EU have also deployed forces to Côte d’Ivoire (#10) and Democratic Republic of the Congo (DRC, #3), respectively, and the UK sent troops to Sierra Leone (#13). We should note that postconflict countries with an international peacekeeping presence are likely to score better than their internal performance or capacities warrant. These countries’ scores reflect the support they receive from international institutions or foreign governments in fulfilling one or more government functions. Examples include Bosnia and Herzegovina (#113), East Timor (#43), and Lebanon (#93).
wEAk STATES
Like the critically weak states, most of the world’s weak states, with overall scores in the second quintile of the Index, are also impoverished. Twenty-one out of 28 in this second quintile are designated low-income

18 in d e x o F Stat e We a k n e S S i n t h e De v e l o p i n g Wo r l D
countries (with a per capita GNI below $905). This is not surprising given that poorer states with smaller tax bases generally lack the resources to effectively meet their population’s needs. Yet even among this group we find notable underperformers that enjoy higher income but fail to use their resources to deliver essential public goods. Some of these countries are energy producers such as Uzbekistan (#36) and Turkmenistan (#35).38 Other states that perform less
Political Security Economic Social Welfare5th Quintile(81-100%)
4th Quintile(61-80%)
3rd Quintile(41-60%)
2nd Quintile(21-40%)
1st Quintile(0-20%)
OverallRank
33/141
Gov’t
effec
tiven
ess
Rule o
f law
contro
l of c
orru
ption
voice
& ac
coun
tabilit
y
Free
dom
conflic
t inten
sity
Gross
hum
an rig
hts a
buse
s
Territ
ory a
ffecte
d by
confl
ict
Incide
nce o
f cou
ps
Pol. st
ab. &
abse
nce o
f viol
ence
GNI per
capit
a
Inflati
on
GDP gro
with
Regula
tory
quali
ty
Incom
e ine
qualt
iy
child
mor
tality
Impr
oved
wate
r and
sanit
ation
Under
nour
ishm
ent
Primar
y sch
ool c
omple
tion
Life e
xpec
tancy
Note: Available data predates the 2007 state of emergency and the assassination of Benazir Bhutto.
PaKistan(Weak state)
• Overall Rank: 33rd-weakest state of the 141 states in the Index
• Security is weakest area of performance, due to several military coups, human rights abuses, and three ongoing low-intensity conflicts
• In the sphere of political governance, Pakistan receives its lowest scores on Freedom and Voice & Accountability
• Only 63 percent of primary school age children completed school (compared to 82 percent on average among South Asian countries)
• Higher scores in the economic realm reflect recent economic growth and low-income inequality, compared to other weak states
• Key policy implication: U.S. policy in Pakistan should increasingly target the underlying drivers of conflict and instability, especially poor governance, political repression, and poor quality education
Pakistan’s individual indicator scores relative to all countries in the index:
Box 4: pakiStan
well than their level of income per capita would predict are Swaziland (#41) and Colombia (#47). On the flip side, a handful of states perform better overall than their low incomes would predict. These include the Gambia (#51), Malawi (#46), and Tanzania (#55).
Weak states tend to exhibit more variable scores across all four areas of state function than do countries in the first quintile. Some score poorly in one or more area,

19Fo r e i g n Po l i c y at Br o o k i n g s Br o o k i n g s gl o B a l ec o n o m y a n d de v e l o P m e n t
Political Security Economic Social Welfare5th Quintile(81-100%)
4th Quintile(61-80%)
3rd Quintile(41-60%)
2nd Quintile(21-40%)
1st Quintile(0-20%)
OverallRank
32/141
Gov’t
effec
tiven
ess
Rule o
f law
contro
l of c
orru
ption
voice
& ac
coun
tabilit
y
Free
dom
conflic
t inten
sity
Gross
hum
an rig
hts a
buse
s
Territ
ory a
ffecte
d by
confl
ict
Incide
nce o
f cou
ps
Pol. st
ab. &
abse
nce o
f viol
ence
GNI per
capit
a
Inflati
on
GDP gro
with
Regula
tory
quali
ty
Incom
e ine
qualt
iy
child
mor
tality
Impr
oved
wate
r and
sanit
ation
Under
nour
ishm
ent
Primar
y sch
ool c
omple
tion
Life e
xpec
tancy
ZamBia(Weak state)
• Overall rank: 32nd-weakest state with highly variable performance across indicators
• GNI per capita: $630
• Zambia’s high inflation and income inequality, and low income per capita, are weakest points in the economic sphere
• Receives the world’s fourth-lowest score on life Expectancy and ninth-lowest score on Undernourishment, with recent outbreaks of cholera and bubonic plague
• Earns high scores in security due to absence of civil conflict, but Gross Human Rights Abuses remain a challenge
• Key policy implication: international partners should seek to help Zambia reduce poverty and inequality, limit inflation, and improve social welfare, including through increased HIV/AIDS relief
Zambia’s individual indicator scores relative to all countries in the index:
Box 5: ZamBia
while others demonstrate mediocre performance across the board. A number of weak states are plagued by insecurity—especially recent or ongoing conflict—which lowers their overall scores despite their above average performance in other baskets. Examples include Pakistan (#33; see Box 4)39 and Sri Lanka (#56). Colombia (#47) is particularly striking in this regard, ranked the fifth most insecure country in the world but a far stronger performer on political and social welfare indicators. Among the more stable and secure countries in this cohort, in contrast, are
Zambia (#32; see Box 5), Malawi (#46), Mali (#52), Mozambique (#39), Tanzania (#55), and Zambia (#32). Two of these—Mali and Mozambique—are noteworthy as countries recovering from past conflicts. Poor political performers among weak states include Cameroon (#29), Laos (#45), and Turkmenistan (#35), which ranks between North Korea (#15) and Zimbabwe (#8) on political indicators. Its neighbor, Uzbekistan (#36), also places within the bottom ten.
20 in d e x o F Stat e We a k n e S S i n t h e De v e l o p i n g Wo r l D
On economic performance, Comoros (#31), Djibouti (#38), East Timor (#43), Lesotho (#53), and the Solomon Islands (#54) each scores in the bottom quintile due to a variety of factors ranging from sluggish growth and high income inequality to a weak regulatory environment. In the social welfare basket, Mozambique (#39) and Mali (#52) score poorly across the board.
STATES To wATcH
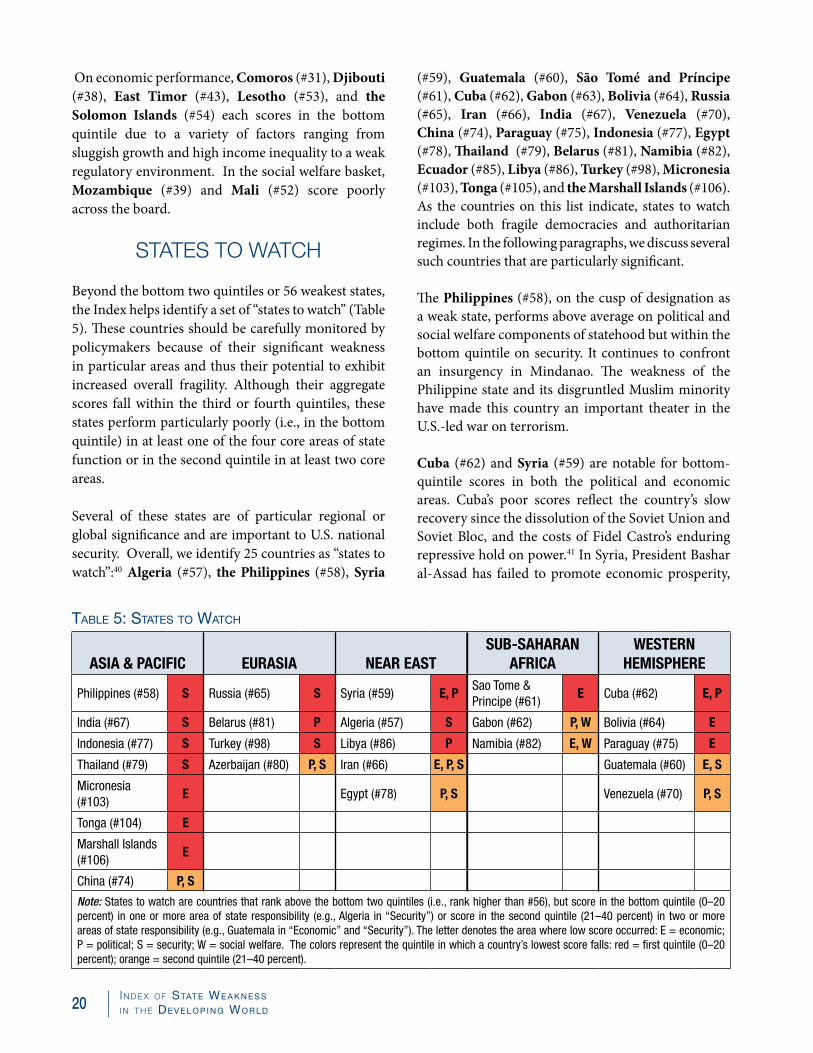
Beyond the bottom two quintiles or 56 weakest states, the Index helps identify a set of “states to watch” (Table 5). These countries should be carefully monitored by policymakers because of their significant weakness in particular areas and thus their potential to exhibit increased overall fragility. Although their aggregate scores fall within the third or fourth quintiles, these states perform particularly poorly (i.e., in the bottom quintile) in at least one of the four core areas of state function or in the second quintile in at least two core areas.
Several of these states are of particular regional or global significance and are important to U.S. national security. Overall, we identify 25 countries as “states to watch”:40 Algeria (#57), the Philippines (#58), Syria
(#59), Guatemala (#60), São Tomé and Príncipe (#61), Cuba (#62), Gabon (#63), Bolivia (#64), Russia (#65), Iran (#66), India (#67), Venezuela (#70), China (#74), Paraguay (#75), Indonesia (#77), Egypt (#78), Thailand (#79), Belarus (#81), Namibia (#82), Ecuador (#85), Libya (#86), Turkey (#98), Micronesia (#103), Tonga (#105), and the Marshall Islands (#106). As the countries on this list indicate, states to watch include both fragile democracies and authoritarian regimes. In the following paragraphs, we discuss several such countries that are particularly significant.
The Philippines (#58), on the cusp of designation as a weak state, performs above average on political and social welfare components of statehood but within the bottom quintile on security. It continues to confront an insurgency in Mindanao. The weakness of the Philippine state and its disgruntled Muslim minority have made this country an important theater in the U.S.-led war on terrorism.
Cuba (#62) and Syria (#59) are notable for bottom-quintile scores in both the political and economic areas. Cuba’s poor scores reflect the country’s slow recovery since the dissolution of the Soviet Union and Soviet Bloc, and the costs of Fidel Castro’s enduring repressive hold on power.41 In Syria, President Bashar al-Assad has failed to promote economic prosperity,
asia & PaciFic eURasia neaR eastsUB-saHaRan
aFRicaWesteRn
HemisPHeRe
Philippines (#58) s Russia (#65) s Syria (#59) e, PSao Tome & Principe (#61)
e Cuba (#62) e, P
India (#67) s Belarus (#81) P Algeria (#57) s Gabon (#62) P, W Bolivia (#64) e
Indonesia (#77) s Turkey (#98) s libya (#86) P Namibia (#82) e, W Paraguay (#75) e
Thailand (#79) s Azerbaijan (#80) P, s Iran (#66) e, P, s Guatemala (#60) e, s
Micronesia (#103)
e Egypt (#78) P, s Venezuela (#70) P, s
Tonga (#104) e
Marshall Islands (#106)
e
China (#74) P, s
Note: States to watch are countries that rank above the bottom two quintiles (i.e., rank higher than #56), but score in the bottom quintile (0–20 percent) in one or more area of state responsibility (e.g., Algeria in “Security”) or score in the second quintile (21–40 percent) in two or more areas of state responsibility (e.g., Guatemala in “Economic” and “Security”). The letter denotes the area where low score occurred: E = economic; P = political; S = security; W = social welfare. The colors represent the quintile in which a country’s lowest score falls: red = first quintile (0–20 percent); orange = second quintile (21–40 percent).
taBle 5: StateS to Watch

21Fo r e i g n Po l i c y at Br o o k i n g s Br o o k i n g s gl o B a l ec o n o m y a n d de v e l o P m e n t
despite having promised reform of the country’s state-run economy. Syria’s low score in the economic sphere derives primarily from slow growth and inadequate regulatory quality. In the political arena, repression and government control of the media continue to stifle political opposition and dissent. The Group of Eight member state Russia (#65) garners low scores in the areas of security and political governance, mainly due to ongoing civil conflict in Chechnya, human rights abuses, and lacks of political accountability and freedom of expression. The only upper-middle-income country to score worse than Russia is Equatorial Guinea (#25), a comparison that underscores the severity of Russia’s challenges, especially in the political and security spheres.
Iran ranks #66 on the Index and receives its highest score in the area of social welfare. The country fares well on basic needs indicators like access to clean water and sanitation, and the prevalence of undernourishment. Yet on balance, its performance across the 20 indicators in the Index is highly variable. Its economic score reflects relatively high income per capita and low inequality, yet this is tempered by high inflation and slow economic growth. It has not experienced a coup in recent years, and the central government controls the country’s territory. Unsurprisingly, its lowest score comes in the area of political governance, reflecting the absence of political freedom, and rampant corruption.
The ranking of democratic India at #67 overall and in a relatively low position in the third quintile of states may surprise some. Its scores are noteworthy for their extreme variability. Though it enjoys a fast-growing and vibrant economy and has a long-established parliamentary democracy, it remains a low-income country (per capita GNI, $820) and suffers from significant insecurity in various parts of the country. Sectarian violence, terrorism, and human rights abuses reflect continued social and economic tensions and remain the country’s major challenges.
China ranks #74 on the Index and performs variably across the 20 indicators. Though its rank places it outside the category of a weak state, its political and security scores remain low primarily because of
particularly poor performance on three indicators: Voice and Accountability, Freedom, and Gross Human Rights Abuses. The country also underperforms in other areas, including income inequality and access to clean water and sanitation. Its low score in the area of conflict intensity reflects ethnic violence and state repression in Xinjiang Province during the 1990s. By contrast, the country performs well above average in the areas of economic growth and low inflation.
Indonesia (#77) scores relatively well in the economic sphere, because low inflation and market-friendly reforms buoy its performance. Yet in the area of security, its poor scores are due mainly to recent episodes of violence, including an insurgency in Aceh, popular unrest surrounding President Suharto’s forced resignation in 1998, and ethnic and religious violence in several regions. The country’s notoriously poor human rights record is also reflected in its extremely low score in the category of Gross Human Rights Abuses.
IMPLIcATIoNS FoR U.S. PoLIcy
The Index of State Weakness in the Developing World highlights the bottom two quintiles of developing countries, which demonstrate some significant weaknesses and face important performance gaps. The Index also identifies additional countries that merit close monitoring. Although U.S. officials now understand that weak states deserve particular attention because they can incubate transnational security threats, to date they have not crafted effective strategies to strengthen such states. Building effective states in the developing world, focusing both on their will and capacity to deliver essential public services to their citizens, must become a significant component of U.S. national security policy.42
Five insights emerging from an analysis of the Index of State Weakness could help U.S. officials frame more effective policies towards the world’s weakest states:
First, poverty alleviation should be given higher priority in U.S. foreign policy. The Index reveals a strong relationship between low income and state weakness: On balance, poorer countries tend to be
22 in d e x o F Stat e We a k n e S S i n t h e De v e l o p i n g Wo r l D
weaker ones. Poverty fuels and perpetuates civil conflict, which swiftly and dramatically reduces state capacity.43 Yet, still lacking from the George W. Bush administration are any comprehensive strategies to address poverty in the world’s most challenging institutional environments, including not only development aid but also other critical instruments like democracy promotion, support for peacekeeping, trade concessions, and investment promotion.
In early 2007, the Bush administration belatedly added poverty alleviation as an explicit, central goal of U.S. foreign assistance policy.44 As Randall Tobias, the former U.S. director of foreign assistance, explained, “The time is ripe for a New Deal on poverty reduction.”45 Translating this rhetoric into effective action, however, will require a strategy to tailor U.S. assistance, as well as other policy tools, to the unique needs of poorly performing states. Though the Bush administration has instituted significant and laudable increases in overall U.S. foreign aid, neither of its two signature initiatives—the Millennium Challenge Account (MCA) and the President’s Emergency Plan for AIDS Relief (PEPFAR)—is designed to build critical sovereign capacities or to advance development in the world’s weakest states.
The MCA, for instance, directs aid disproportionately to “good performers” that have made demonstrable progress in “ruling justly, investing in people, and promoting economic freedom,” on the grounds that countries with good policy and institutional environments are best positioned to make effective use of external assistance.46 Directing assistance in this fashion may yield improved development outcomes in better-performing states, but it excludes by definition most of the difficult countries in the world, including all three “failed” states and approximately three-quarters of the countries in the bottom two quintiles in the Index. PEPFAR, meanwhile, annually commits billions of dollars to combat AIDS through investment in prevention, treatment, and care, and it primarily targets 15 focus countries. Though these expenditures are vitally important and represent a vastly improved response to a devastating pandemic, PEPFAR cannot substitute for long-term and comprehensive investments across a wide spectrum of weak states to build public health infrastructure and strengthen other critical aspects of state capacity.
How best to utilize development assistance and other economic and governance instruments in weak institutional environments remains a particularly daunting and largely unresolved policy challenge. However, recent evidence suggests that strategically targeted foreign aid can help encourage policy reform and institutional development, even in weak states.47
Second, U.S. foreign assistance programs should target the specific weaknesses of individual developing countries:
• In failed and critically weak states, U.S. policy should place heavy emphasis on improving security, while paying due attention to the other three core areas of state performance. The vast majority of states in this cohort have experienced conflict within the past decade and a half. Their security deficits are typically accompanied by weaknesses across the three other core areas of state performance. This is logical, because conflict destroys both formal economies and political institutions. It can also exacerbate poor health conditions, including by facilitating the spread of infectious diseases. Given a nearly 50 percent risk that postconflict countries will return to war within 5 years, unsuccessful postconflict, peace-building and peacekeeping/stabilization efforts risk condemning countries to renewed conflict or nearly perpetual insecurity and poverty.48 In Iraq and Afghanistan, U.S. troop levels have been inadequate to the task of stabilizing these countries. Coalition efforts to improve economic recovery and governance have also been found wanting in both countries. The United States and its partners did not target enough aid to job creation and improved social services, and they invested too little in promoting political reconciliation and the rule of law. Taken together, these shortcomings have undermined state-building efforts in both countries. By contrast, peace-building efforts that effectively end war and jump-start political, economic, and social capacity building, as in El Salvador and Mozambique, can help extricate conflict-ridden states from the vicious cycle of violence and weakness.
23Fo r e i g n Po l i c y at Br o o k i n g s Br o o k i n g s gl o B a l ec o n o m y a n d de v e l o P m e n t
• In weak states, assistance should take account of each state’s unique performance gaps. The Index suggests that there are numerous “profiles” of weakness among developing countries. Some states, like Mozambique and Colombia, are weak primarily in one area (social welfare and security, respectively). Others, like Bangladesh and Guatemala, suffer from multiple deficiencies. Yet current aid allocations by sector often fail to respond to specific country needs. For example, states like Nigeria and Pakistan—with severe weaknesses in the political sphere—are not slated to receive sufficient U.S. assistance in the area of “Governing Justly and Democratically” in the administration’s fiscal year (FY) 2008 budget request. Similarly, weak states like Kenya and Ethiopia have performance gaps in all four areas. Yet in these countries, the administration’s FY 2008 budget request proposes to invest the bulk of U.S. bilateral assistance in HIV/AIDS spending through the PEPFAR program.49 The objective should not be to cut PEPFAR or MCA funding but rather to augment these funds with additional resources and target new assistance to address the specific performance gaps manifest in individual weak states.
• The United States should not ignore severe performance gaps even in better-performing states. We have identified “states to watch.” These are comparatively better performers that fall outside the world’s weakest two quintiles in the Index but suffer critical performance gaps in one or two areas. Both China and Russia score poorly on the political and security indicators, and Syria suffers from major weaknesses in the political and economic spheres. Thus countries such as China, Russia, Cuba, and Syria are unique cases that should continue to be of concern to policymakers interested in the consequences of state weakness.
Third, overall U.S. assistance to the world’s weakest states—which is currently insufficient and unevenly distributed—should be increased and targeted. In early 2006, Secretary of State Condoleezza Rice announced a foreign assistance reform effort as part of a new “transformational diplomacy” effort,
designed to “build and sustain democratic, well-governed states” in the developing world.50 Despite this initiative, however, the United States has not yet invested the resources that are required to realize this ambitious goal. Its assistance policy toward the world’s weakest states remains inadequate and haphazard, reflecting neither specific country characteristics nor the strategic importance of state weakness to U.S. and international security.51 This is reflected in the Bush administration’s FY 2008 budget request to Congress. Of the $16.7 billion requested for total international assistance, only about half ($7.9 billion) is targeted at the bottom two quintiles of countries in the Index. Moreover, nearly 80 percent of this amount is focused on just nine countries, including three critical countries in the global war on terror (Afghanistan, Iraq, and Pakistan), one key partner in the war on drugs (Colombia), and five beneficiaries of HIV/AIDS spending (Ethiopia, Nigeria, Uganda, Tanzania, and Zambia). Further, per capita disparities in U.S. aid in the budget request are vast. Whereas Iraq and Afghanistan would receive between $45 and $50 per capita in bilateral U.S. aid per year, respectively, Nigeria is set to receive only $4.06 and Côte d’Ivoire would receive only $0.01 per capita. Recent empirical research on foreign assistance confirms that low-income countries that perform equally poorly on the Index receive substantially different levels of foreign assistance.52
Ultimately, the fates of the world’s weakest states will be determined less by the actions of outsiders than by the commitments and capacities of their own leaders and citizens. Nevertheless, increased aid and other forms of external assistance can play a critical role in building the capacity and will of weak states to bring security, good governance, economic growth, and social welfare to their inhabitants. The United States and other donors have a vital interest in using foreign aid and other tools—such as trade, enhanced market access, debt relief, foreign investment, military cooperation, and democracy promotion—to encourage wise policy choices, nurture effective institutions, and bolster state performance in the developing world.
Fourth, U.S. policymakers should acknowledge the strategic importance of sub-Saharan Africa. The Index shows that state weakness is pervasive in sub-
24 in d e x o F Stat e We a k n e S S i n t h e De v e l o p i n g Wo r l D
Saharan Africa: more than three-quarters of the failed and critically weak states and more than half the world’s weak states are African. Only 11 countries in the region (4 of which are small island states) do not fall in the bottom two quintiles. Given the role that weak states can play as incubators and breeding grounds for transnational security threats, building state capacity in Africa should be a higher priority for U.S. policy.
Fifth, building state capacity is too complex, expensive, and long-term a challenge for the United States to undertake effectively alone: It requires a multilateral approach. The United States must collaborate with its international partners as well as with governments and civil society in failed and weak
states. U.S. and international aid delivery mechanisms should also be streamlined to maximize their impact and minimize the burdens they impose on developing countries with limited institutional capacity.
The Index of State Weakness in the Developing World thus provides important insights to U.S. and international policymakers as they seek to develop more effective strategies and policies to strengthen weak states. Sustained attention to the world’s weakest countries is critical both to realizing the broad strategic imperatives laid out in the 2002 U.S. National Security Strategy and to enhancing the security, prosperity, freedom, and welfare of the world’s most vulnerable inhabitants.

25Fo r e i g n Po l i c y at Br o o k i n g s Br o o k i n g s gl o B a l ec o n o m y a n d de v e l o P m e n t
ENDNoTES 1 The authors have examined the relationship between state
weakness and transnational threats in prior writings: Susan E. Rice, “The Threat of Global Poverty,” The National Interest, Spring 2006; Susan E. Rice, “Poverty Breeds Insecurity,” in Too Poor for Peace? Poverty, Conflict and Security in the 21st Century, ed. Lael Brainard and Derek Chollet (Brookings, 2007); Susan E. Rice, The New National Security Strategy: Focus on Failed States, Brookings Policy Brief 116, February 2003; Stewart Patrick, Weak States and Global Threats: Assessing Evidence of Spillovers, Center for Global Development Working Paper 73, January 2006; and Stewart Patrick, “Weak States and Global Threats: Fact or Fiction,” Washington Quarterly, Spring 2006, pp. 23-57.
2 National Security Strategy of the United States, 2002. The 2006 National Security Strategy of the United States also emphasizes the threats posed by weak and failing states in relation to U.S. national security interests.
3 European Security Strategy: A Secure Europe in a Better World, 2003. Similar statements have been issued among Australian, British, Canadian, and other governments.
4 United Nations, Report of the Secretary-General, In Larger Freedom: Towards Development, Security, and Human Rights for All, April 2005.
5We treat state “weakness” as synonymous with “fragility.” 6 The Index includes developing countries with sufficient data
coverage and a population above 100,000. In defining developing countries, we use the World Bank’s 2007 income classification, in which economies are divided according to 2006 GNI per capita, calculated using the World Bank Atlas method. These include: low-income countries with a 2006 GNI per capita of $905 or less; lower-middle-income countries with a 2006 GNI per capita between $9,066 and $3,595; and upper-middle-income countries with a 2006 GNI per capita between $3,596 and $11,115. Although the World Bank includes the West Bank and Gaza as a low-income economy, we do not include it in our Index because it is not a sovereign state. See: World Bank Country Groups, http://go.worldbank.org/K2CKM78CC0.
7 In a subsequent project, we will assess the relative significance of the weakest states to U.S. national security.
8 In the academic community, James D. Fearon and David D. Laitin have used per capita income, newly independent countries, countries with large populations, countries with noncontiguous territory, and oil exporters. See James D. Fearon and David D. Laitin, “Ethnicity, Insurgency, and Civil War,” American Political Science Review 97 (2003): 75–90.
9 See Commission on Weak States and U.S. National Security, On the Brink: Weak States and U.S. National Security, Center for Global Development (2004).
10See http://globalpolicy.gmu.edu/pitf/.11 Robert I. Rotberg, editor, When States Fail: Causes and Consequences
(Princeton: Princeton University Press, 2004).
12 DFID, Why We Need to Work More Effectively in Fragile States (London: U.K. Department for International Development, 2005).
13 See Michael Anderson, Andrew Branchflower, Magui Moreno Torres, and Marie Besancon, Measuring Capacity and Willingness for Poverty Reduction Strategies in Fragile States, Poverty Reduction in Difficult Environments (PRDE) Working Paper 6, January 2005.
14 World Bank, Fragile and Post-Conflict Countries: Background, http://go.worldbank.org/JHPKRCXS40.
15 CPIA ratings are on a scale from 0 to 5. The 2006 ratings can be accessed at http://go.worldbank.org/S2THWI1X60.
16 The FY 2007 “severe” fragile states are Afghanistan, Central African Republic, Comoros, Côte d’Ivoire, Liberia, Myanmar, Somalia, Togo, West Bank and Gaza, and Zimbabwe. The FY 2007 “core” fragile states are Angola, Burundi, Chad, Democratic Republic of the Congo, Republic of the Congo, Eritrea, Guinea, Guinea-Bissau, Haiti, Kosovo, Lao People’s Democratic Republic Solomon Islands, Sudan, Timor-Leste, Tonga, and Uzbekistan. The FY 2007 “marginal” states are Cambodia, Djibouti, Gambia, Mauritania, Nigeria, Papua New Guinea, São Tomé and Príncipe, Sierra Leone, and Vanuatu. The list can also be accessed at http://siteresources.worldbank.org/INTLICUS/Resources/FY07LICUSListSept.doc.
17 For a list of developing economies eligible and ineligible for IDA assistance in FY 2006, see http://devdata.worldbank.org/GMIS/ida14qa/ida_eligibility.htm.
18 Using an approach to state weakness similar to the World Bank’s, the Development Assistance Committee of the Organization for Economic Cooperation and Development (OECD) commissioned a “Fragile States Group” to study a host of issues related to “fragile environments.” To access the OECD’s working papers on the topic and other news related to the Fragile States Group, see http://www.oecd.org/department/0,2688,en_2649_33693550_1_1_1_1_1,00.html.
19 The 10 core functions of state sovereignty laid out by Ghani et al. are (1) legitimate monopoly on the means of violence; (2) administrative control; (3) management of public finances; (4) investment in human capital; (5) delineation of citizenship rights and duties; (6) provision of infrastructure services; (7) formation of the market; (8) management of the state’s assets (including the environment, natural resources, and cultural assets); (9) international relations (including entering into international contracts and public borrowing); and (10) the rule of law.
20 Ashraf Ghani et al., Closing the Sovereignty Gap: An Approach to State-Building (London: Overseas Development Institute, 2005).
21 “The 2006 Country Indicators for Foreign Policy” Canadian Foreign Policy Journal 13, no. 1 (2006): 1-35.
22 See http://www.usaid.gov/policy/2005_fragile_states_strategy.pdf.

26 in d e x o F Stat e We a k n e S S i n t h e De v e l o p i n g Wo r l D
23Ibid., 3.24 Monty G. Marshall and Jack Goldstone, “Global Report on
Conflict, Governance and State Fragility 2007,” Foreign Policy Bulletin (Cambridge) 17, no. 1 (March 2007): 3–22.
25 Ibrahim Index of African Governance, http://www.moibrahimfoundation.org/index/index.asp.
26 The 2006 Failed States Index can be accessed at http://www.fundforpeace.org/web/index.php?option=com_content&task=view&id=104&Itemid=324.
27 The Fund for Peace considers five institutions key to a state’s ability to maintain domestic peace and security, including a competent police force and corrections system, an efficient bureaucracy, an independent juridical system, a professional military, and strong executive/legislative leadership. A description of this methodology can be found at http://www.fundforpeace.org/web/index.php?option=com_content&task=view&id=107&Itemid=145#3.
28 See http://www.fundforpeace.org/web/index.php?option=com_content&task=view&id=107&Itemid=145.
29 J. Joseph Hewitt, Jonathon Wilkenfeld, and Ted Robert Gurr, Peace and Conflict 2008: Executive Summary (College Park: Center for International Development and Conflict Management, University of Maryland, 2008).
30 There is a vast body of empirical research on the relationships between political governance, economic performance, social welfare provision, and security. Prominent examples include research on democratic governance and economic performance, democratic governance and conflict, democratic governance and social welfare provision, economic performance and political violence (including terrorism, civil war, and coups), and social welfare and political violence.
31 For a discussion of government responsibilities that are commonly considered core functions of statehood, see Jennifer Milliken and Keith Krause, “Introduction,” in State Failure, Collapse, and Reconstruction: Issues and Responses, ed. Jennifer Milliken (Boston: Blackwell Publishers, 2003). See also Robert I. Rotberg, When States Fail: Causes and Consequences (Princeton University Press, 2003).
32 We chose to eliminate the world’s wealthiest countries from consideration because the metrics for measuring state strength are substantially different in the developed world. In this respect, we follow the example of agencies like the United Nations Development Program (UNDP). For instance, UNDP uses two different metrics to measure deprivation in developing and in industrialized countries: the human poverty index-1 (HPI-1) is designed to measure deprivations in the achievement of a long and healthy life, knowledge, and a decent standard of living in non-OECD countries. By contrast, the human poverty index-2 (HPI-2) is tailored to measuring deprivations in OECD countries and also includes indicators on social exclusion. See UNDP, Human Development Report, 2006.
33 This aggregation methodology implicitly assumes that each of the four core areas of state function contribute to state
weakness equally. Because there is no widely accepted formula to definitively assess the relative contribution of each of the four areas to state weakness, any unequal weighting system would be open to criticism on the grounds that it could not be accurate for all countries and it reflected the arbitrary biases of the researchers. Though this assumption is currently valid, the state weakness literature would benefit from further exploration of how the four core areas of state function should be weighted and how they interact with each other.
34 The Index is based on the most recent, publicly available data. In some instances, such as for the “Conflict Intensity” indicator, we used data as current as 2006. In other cases, however, data may be several years older. For example, although some of the social welfare and economic indicators were published in 2006, they are based on household surveys from several years ago.
35 We found a strong positive relationship between countries’ overall index score and their scores on 16 of our 20 indicators: Government Effectiveness; Rule of Law; Control of Corruption; Voice and Accountability; Freedom; Violence; Political Terror; Rebel-Held Territory; Political Stability and Absence of Violence; GNI per capita; Regulatory Quality; Child Mortality; Access to Improved Water and Sanitation; Extent of Undernourishment; Primary School Completion Rate; and Life Expectancy. We should note, however, that several individual indicators in the index are closely related to each other (e.g., Freedom and Voice and Accountability, or GNI per capita and Child Mortality), which in part explains the relationship between a handful of individual indicators and a country’s overall weakness score. In addition, our findings do not reveal the direction of causality.
36 The causal relationship between poverty, conflict, and state failure is undoubtedly complex, as poverty both fuels conflict and deepens as a result of conflict. See Paul Collier et al., Breaking the Conflict Trap: Civil War and Development Policy (Washington: World Bank, 2003).
37 On UN peacekeeping missions, see http://www.un.org/Depts/dpko/dpko/. The UN has deployed to Angola, Burundi, Central African Republic, Chad, Democratic Republic of the Congo, Côte D’Ivoire, Republic of the Congo, Ethiopia, Eritrea, Liberia, Rwanda, Sierra Leone, Somalia, and Sudan.
38 Not all energy-producing weak states have an annual per capita income above $905. Among the poorest oil producing states are Nigeria, Sudan, and Uzbekistan.
39 Pakistan’s score is based on the most recently available public data and does not reflect the state of emergency declared in November 2007 and increased political repression.
40 Lebanon (#93) scores relatively well on the index. However, common sense suggests that as new data become available that reflect more recent events in the country, its score should decline.
41 The Index only includes data on 3 out of 5 economic indicators for Cuba; data on Cuba’s inflation rate and income inequality are missing.
42 See Susan E. Rice. Strengthening Weak States: A 21st Century Policy Imperative, paper published by the Security and Peace Initiative, a joint project of the Center for American Progress

27Fo r e i g n Po l i c y at Br o o k i n g s Br o o k i n g s gl o B a l ec o n o m y a n d de v e l o P m e n t
and the Century Foundation, http://www.securitypeace.org/pdf/rice.pdf.
43 See Susan E. Rice, Corinne Graff, and Janet Lewis, “Poverty and Civil Conflict: What Policy-makers Need to Know,” Global Economy and Development Working Paper #02, Brookings Institution, December 2006.
44 According to the 2007 Strategic Framework for Foreign Assistance, a central goal of U.S. policy is “to help build and sustain democratic, well-governed states that respond to the needs of their people, reduce widespread poverty and conduct themselves responsibly in the international system.” http://www.state.gov/documents/organization/79748.pdf.
45 Speech given by Randal Tobias at the Center for Strategic and International Studies, February 5, 2007, available at http://www.usaid.gov/press/speeches/2007/sp070205.html
46 Millennium Challenge Corporation, http://www.mcc.gov/about/index.php.
47 Lisa Chauvet and Paul Collier, “Helping Hand? Aid to Failing States,” June 2006, available at http://users.ox.ac.uk/~econpco/research/pdfs/HelpingHand-AidtoFailingStates.pdf. Levin and Dollar, “The Forgotten States: “Low Income Countries Under Stress: Update,” World Bank Operations Policy and Country
Services, December 1, 2005, available at http://www-wds.worldbank.org/servlet/WDSContentServer/WDSP/IB/2005/12/22/000090341_20051222092710/Rendered/PDF/34789.pdf. Development Assistance Committee, OECD, “Principles for Good International Engagement in Fragile States,” April 7, 2005, available at http://www.oecd.org/dataoecd/59/55/34700989.pdf. World Bank, “Making Aid Work in Fragile States: Case Studies of Effective Aid-Financed Programs,” World Bank Background Document, 2004, available at http://www.oecd.org/dataoecd/31/63/34252765.pdf.
48Collier et al., Breaking the Conflict Trap.49 Specifically, it proposes to direct 89 percent of U.S. bilateral
assistance toward HIV/AIDS in Kenya, and 81 percent toward HIV/AIDS in Ethiopia.
50 Condoleezza Rice, “Remarks on Foreign Assistance,” January 19, 2006, http://www.state.gov/secretary/rm/2006/59408.htm.
51 For a discussion on the FY 2007 budget request to fragile states, see Stewart Patrick and Kaysie Brown, Fragile States and U.S. Foreign Assistance: Show Me the Money, Center for Global Development Working Paper 96, August 2006.
52 Development Assistance Committee, OECD, “Monitoring Resource Flows to Fragile States,” DAC News, July 26, 2006,

29Fo r e i g n Po l i c y at Br o o k i n g s Br o o k i n g s gl o B a l ec o n o m y a n d de v e l o P m e n t
TEcHNIcAL ANNEX
The Index of State Weakness in the Developing World uses a wide range of country-level indicators to measure state performance among developing countries. It provides an assessment of the relative strength of 141 countries in four core areas of state function: economic, political, security, and social welfare.
Here we provide the rationale for selecting particular data sets and a description of the 20 indicators underlying the Index. We also describe how we created the Index by weighting and aggregating the indicator data to obtain an overall score for each country.
INDIcAToRS
The Index is based on 20 indicators, 5 in each of 4 areas of state function, that are widely used in the development community. In selecting each indicator, we were guided by the following general criteria:
• the accuracy, currency, and transparency of the data set;
• the extent of data coverage for the 141 countries included in the Index; and
• the relevance of the data set to state weakness in developing countries.
We used five political indicators in the Index (see table A1 below for further detail): Government Effectiveness, Rule of Law, Control of Corruption, Voice and Accountability, and a measure of Political and Civil Liberties, which we shorthand as “freedom.” As a set, these indicators allow us to capture the quality and effectiveness of state institutions, as well as the government’s legitimacy and accountability to its citizens.
We chose five security indicators: Conflict Intensity, Political Stability and the Absence of Conflict,
Incidence of Coups, Gross Human Rights Abuses, and Territory Affected by Conflict. These five indicators measure the presence of different types of political violence in a country, from civil war to gross human rights violations (such as mass atrocities). The Territory Affected by Conflict indicator provides a measure of a state’s ability to maintain peace and security across the entirety of its territory. We considered alternative data sets, such as the Armed Conflict Dataset on battle-related deaths, which is produced jointly by the Centre for the Study of Civil War at the International Peace Research Institute, Oslo (PRIO) and the Uppsala Conflict Data Program (UCDP). We chose to use the Major Episodes of Political Violence data set from the Center for Systemic Peace (University of Maryland), because it provides more information about the scope and societal impact of conflict than battle deaths alone.
To assess a country’s economic performance, we selected five economic indicators: Gross National Income (GNI) per Capita, Growth of Gross Domestic Product (GDP), Inflation, Income Inequality, and Regulatory Quality. These widely used indicators allow us to capture key aspects of national economic performance. We opted to include the Gini coefficient (Income Inequality), despite missing data for some of our 141 countries, in order to capture the government’s ability to distribute economic gains equitably.
Finally, we used five social welfare indicators to assess a country’s ability to meet the basic welfare needs of its citizens: Child Mortality, Primary School Completion, Undernourishment, Access to Clean Water & Sanitation, and Life Expectancy. This set of widely accepted indicators captures various dimensions of social welfare in a country, from education to health and nutrition.
A detailed description of each of these 20 indicators is provided in Table A1.

30 in d e x o F Stat e We a k n e S S i n t h e De v e l o p i n g Wo r l D
taBle a1: DeScription of the 20 inDicatorS
FIVE POLITICAL INDICATORS1. GoVeRnment
eFFectiVenessRationale: This indicator is among the most direct measures available of the strength and quality of state institutions, which are essential for the provision of public goods and the formulation and implementation of sound policies.source: World Bank, Governance Matters VI, 2007. Available at http://papers.ssrn.com/sol3/papers.cfm?abstract_id=999979.indicator Description: Government effectiveness measures the “quality of public services, the quality of the civil service and the degree of its independence from political pressures, the quality of policy formulation and implementation, and the credibility of the government’s commitment to such policies.” This indicator draws on data from 18 different sources.Data coverage:
- Year(s) included in the Index: 2006.- Data available for all 141 countries in the Index.
2. RUle oF laW Rationale: The state’s ability to govern on the basis of legitimate public norms and institutions is a strong indicator of the likelihood of long-term political stability.source: World Bank, Governance Matters VI, 2007. Available at http://papers.ssrn.com/sol3/papers.cfm?abstract_id=999979.indicator Description: Rule of law measures the “extent to which agents have confidence in and abide by the rules of society, in particular the quality of contract enforcement, the police, and the courts, as well as the likelihood of crime and violence.” This indicator draws on data from 24 different sources.Data coverage:
- Year(s) included in the Index: 2006.- Data available for all 141 countries in the Index.
3. contRol oF coRRUPtion
Rationale: Responsibly governed states are able to prevent the diversion of public resources from core state functions. Extensive corruption erodes state institutions and curtails investments in public goods. source: World Bank, Governance Matters VI, 2007. Available at http://papers.ssrn.com/sol3/papers.cfm?abstract_id=999979.indicator Description: Control of corruption measures the “extent to which public power is exercised for private gain, including petty and grand forms of corruption, as well as ‘capture’ of the state by elites and private interests.” This indicator draws on data from 23 different sources.Data coverage:
- Year(s) included in the Index: 2006.- Data available for all 141 countries in the Index.
4. Voice & accoUntaBility
Rationale: States that have mechanisms in place for peaceful dissent, transfer of power and policy reform, and are less prone to political instability in the long term.source: World Bank, Governance Matters VI, 2007. Available at http://papers.ssrn.com/sol3/papers.cfm?abstract_id=999979.indicator Description: Voice and accountability (as named in Governance Matters) measures the “extent to which a country’s citizens are able to participate in selecting their government, as well as freedom of expression, freedom of association, and a free media.” Drawing on data from 19 different sources, this indicator seeks to measure democracy, including “democratic accountability,” “representation,” “civil liberties,” and “political rights.”Data coverage:
- Year(s) included in the Index: 2006.- Data available for all 141 countries in the Index.
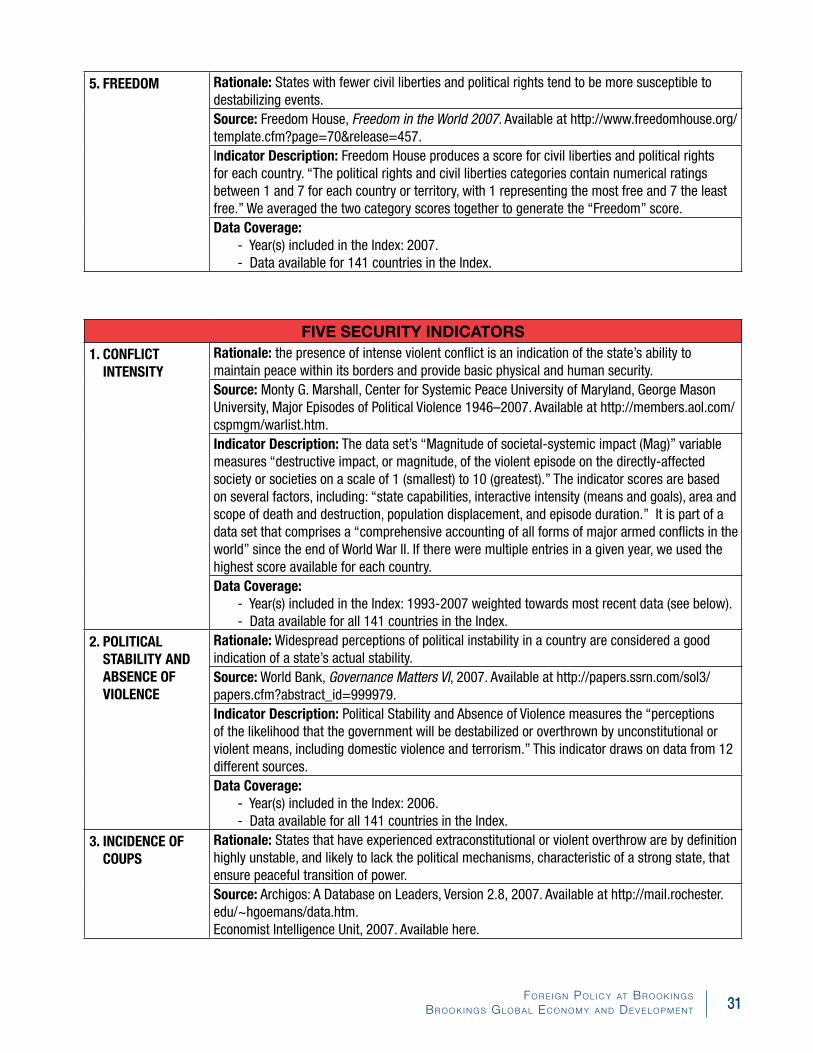
31Fo r e i g n Po l i c y at Br o o k i n g s Br o o k i n g s gl o B a l ec o n o m y a n d de v e l o P m e n t
5. FReeDom Rationale: States with fewer civil liberties and political rights tend to be more susceptible to destabilizing events.source: Freedom House, Freedom in the World 2007. Available at http://www.freedomhouse.org/template.cfm?page=70&release=457.Indicator Description: Freedom House produces a score for civil liberties and political rights for each country. “The political rights and civil liberties categories contain numerical ratings between 1 and 7 for each country or territory, with 1 representing the most free and 7 the least free.” We averaged the two category scores together to generate the “Freedom” score.Data coverage:
- Year(s) included in the Index: 2007.- Data available for 141 countries in the Index.
FIVE SECURITY INDICATORS1. conFlict
intensityRationale: the presence of intense violent conflict is an indication of the state’s ability to maintain peace within its borders and provide basic physical and human security.source: Monty G. Marshall, Center for Systemic Peace University of Maryland, George Mason University, Major Episodes of Political Violence 1946–2007. Available at http://members.aol.com/cspmgm/warlist.htm.indicator Description: The data set’s “Magnitude of societal-systemic impact (Mag)” variable measures “destructive impact, or magnitude, of the violent episode on the directly-affected society or societies on a scale of 1 (smallest) to 10 (greatest).” The indicator scores are based on several factors, including: “state capabilities, interactive intensity (means and goals), area and scope of death and destruction, population displacement, and episode duration.” It is part of a data set that comprises a “comprehensive accounting of all forms of major armed conflicts in the world” since the end of World War II. If there were multiple entries in a given year, we used the highest score available for each country.Data coverage:
- Year(s) included in the Index: 1993-2007 weighted towards most recent data (see below).- Data available for all 141 countries in the Index.
2. Political staBility anD aBsence oF Violence
Rationale: Widespread perceptions of political instability in a country are considered a good indication of a state’s actual stability.source: World Bank, Governance Matters VI, 2007. Available at http://papers.ssrn.com/sol3/papers.cfm?abstract_id=999979.indicator Description: Political Stability and Absence of Violence measures the “perceptions of the likelihood that the government will be destabilized or overthrown by unconstitutional or violent means, including domestic violence and terrorism.” This indicator draws on data from 12 different sources.Data coverage:
- Year(s) included in the Index: 2006.- Data available for all 141 countries in the Index.
3. inciDence oF coUPs
Rationale: States that have experienced extraconstitutional or violent overthrow are by definition highly unstable, and likely to lack the political mechanisms, characteristic of a strong state, that ensure peaceful transition of power.source: Archigos: A Database on leaders, Version 2.8, 2007. Available at http://mail.rochester.edu/~hgoemans/data.htm.Economist Intelligence Unit, 2007. Available here.

32 in d e x o F Stat e We a k n e S S i n t h e De v e l o p i n g Wo r l D
3. inciDence oF coUPs
indicator Description: The Archigos data set tracks political leaders. In order to code the incidence of coups, we examined the “entry” and “exitcode” variables for the political leaders of the countries in the index. The “entry” variable describes if the leader assumed power through “regular means,” “irregular means,” or “was imposed by another state.” The “exitcode” variable describes how the leader lost power and is broken down into various categories. We coded incidents as a “coup” if it was coded as one of the following in the “exitcode” variable regardless of whether it had foreign support:- leader removed by domestic rebel forces (i.e., Republic of Congo, 1997)- leader removed by domestic military actors (i.e., Pakistan, 1999)- leader removed by other domestic government actors (i.e., lesotho, 1994)If the “exitcode” variable was listed as “leader removed in an irregular manner through other means or processes” we examined the subsequent “entry” variable and if the next leader assumed power through “irregular” means, the transition was coded as a coup, (i.e., Rwanda, 1994). We did not use cases where the leader was “removed through the threat or use of foreign force” (i.e., Iraq, 2003) or where the leader was “removed through assassination by unsupported individual” (i.e., Nepal, 2001).The Archigos data set covers the years 1875-2004. In order to include coverage of recent years, we scoured Economist Intelligence Unit country profiles and country reports for the word “coup” and compared the description of events to the Archigos data set variables. We then included incidents that were compatible with Archigos coding but were not included in the data set because of the date (i.e., Thailand, 2006) or because the country was not included in Archigos (i.e. São Tomé & Príncipe, 1995 and 2003).Data coverage:
- Year(s) included in the Index: 1992–2004 (Archigos), 2005-2006 (EIU), weighted toward the most recent (see below).
- Data available for all 141 countries in the Index.4. GRoss HUman
RiGHts aBUsesRationale: Regimes that rely on widespread oppression and terror to maintain power may, among other things, be susceptible to internal discontent and instability.source: Mark Gibney, University of North Carolina at Asheville, Political Terror Scale, 2007. Available at http://www.politicalterrorscale.org/.indicator Description: We define “gross human rights abuses” to include the definitions of “level 4” and “level 5” on the Political Terror Scale. “level 4” is defined as practices of “imprisonment for political activity”, “politically-motivated executions”, “political murders, disappearances, and torture” that affect a “large portion of the population” and are a “common part of life”; unlimited detention, with or without trial, for political views is also commonplace. “level 5” is defined as including all the terror characteristics of level-4 countries and “encompass the entire population”; in addition, “the leaders of these countries place no limits on the means or thoroughness with which they pursue personal or ideological goals.” The Political Terror Scale publishes a score based on State Department reports and a second score based on Amnesty International country reports, both score countries from 1 (rare) to 5 (widespread political terror). We average of the two scores to assign a score for this indicator.Data coverage:
- Year(s) included in the Index: 2002-2006 weighted towards the most recent (see below).- Data available for 135 countries in the Index.
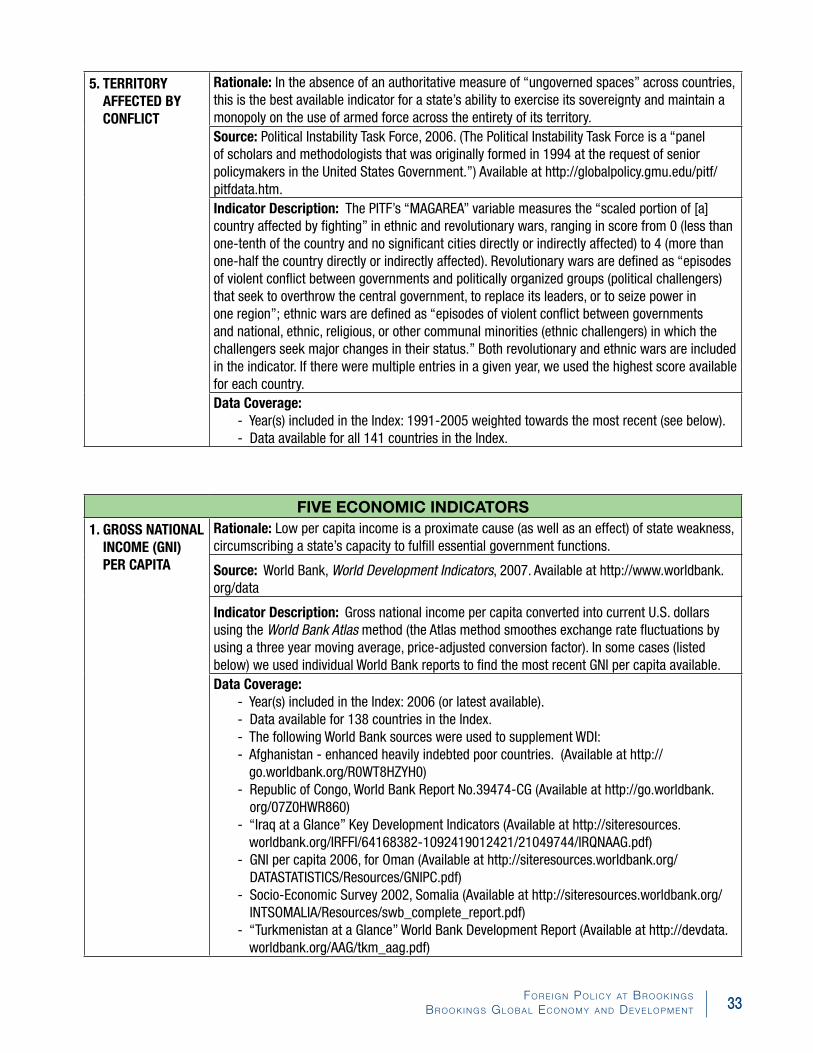
33Fo r e i g n Po l i c y at Br o o k i n g s Br o o k i n g s gl o B a l ec o n o m y a n d de v e l o P m e n t
5. teRRitoRy aFFecteD By conFlict
Rationale: In the absence of an authoritative measure of “ungoverned spaces” across countries, this is the best available indicator for a state’s ability to exercise its sovereignty and maintain a monopoly on the use of armed force across the entirety of its territory.source: Political Instability Task Force, 2006. (The Political Instability Task Force is a “panel of scholars and methodologists that was originally formed in 1994 at the request of senior policymakers in the United States Government.”) Available at http://globalpolicy.gmu.edu/pitf/pitfdata.htm.indicator Description: The PITF’s “MAGAREA” variable measures the “scaled portion of [a] country affected by fighting” in ethnic and revolutionary wars, ranging in score from 0 (less than one-tenth of the country and no significant cities directly or indirectly affected) to 4 (more than one-half the country directly or indirectly affected). Revolutionary wars are defined as “episodes of violent conflict between governments and politically organized groups (political challengers) that seek to overthrow the central government, to replace its leaders, or to seize power in one region”; ethnic wars are defined as “episodes of violent conflict between governments and national, ethnic, religious, or other communal minorities (ethnic challengers) in which the challengers seek major changes in their status.” Both revolutionary and ethnic wars are included in the indicator. If there were multiple entries in a given year, we used the highest score available for each country.Data coverage:
- Year(s) included in the Index: 1991-2005 weighted towards the most recent (see below).- Data available for all 141 countries in the Index.
FIVE ECONOMIC INDICATORS1. GRoss national
income (Gni) PeR caPita
Rationale: low per capita income is a proximate cause (as well as an effect) of state weakness, circumscribing a state’s capacity to fulfill essential government functions.
source: World Bank, World Development Indicators, 2007. Available at http://www.worldbank.org/data
indicator Description: Gross national income per capita converted into current U.S. dollars using the World Bank Atlas method (the Atlas method smoothes exchange rate fluctuations by using a three year moving average, price-adjusted conversion factor). In some cases (listed below) we used individual World Bank reports to find the most recent GNI per capita available.Data coverage:
- Year(s) included in the Index: 2006 (or latest available).- Data available for 138 countries in the Index.- The following World Bank sources were used to supplement WDI:- Afghanistan - enhanced heavily indebted poor countries. (Available at http://
go.worldbank.org/R0WT8HZYH0)- Republic of Congo, World Bank Report No.39474-CG (Available at http://go.worldbank.
org/07Z0HWR860)- “Iraq at a Glance” Key Development Indicators (Available at http://siteresources.
worldbank.org/IRFFI/64168382-1092419012421/21049744/IRQNAAG.pdf)- GNI per capita 2006, for Oman (Available at http://siteresources.worldbank.org/
DATASTATISTICS/Resources/GNIPC.pdf)- Socio-Economic Survey 2002, Somalia (Available at http://siteresources.worldbank.org/
INTSOMAlIA/Resources/swb_complete_report.pdf)- “Turkmenistan at a Glance” World Bank Development Report (Available at http://devdata.
worldbank.org/AAG/tkm_aag.pdf)
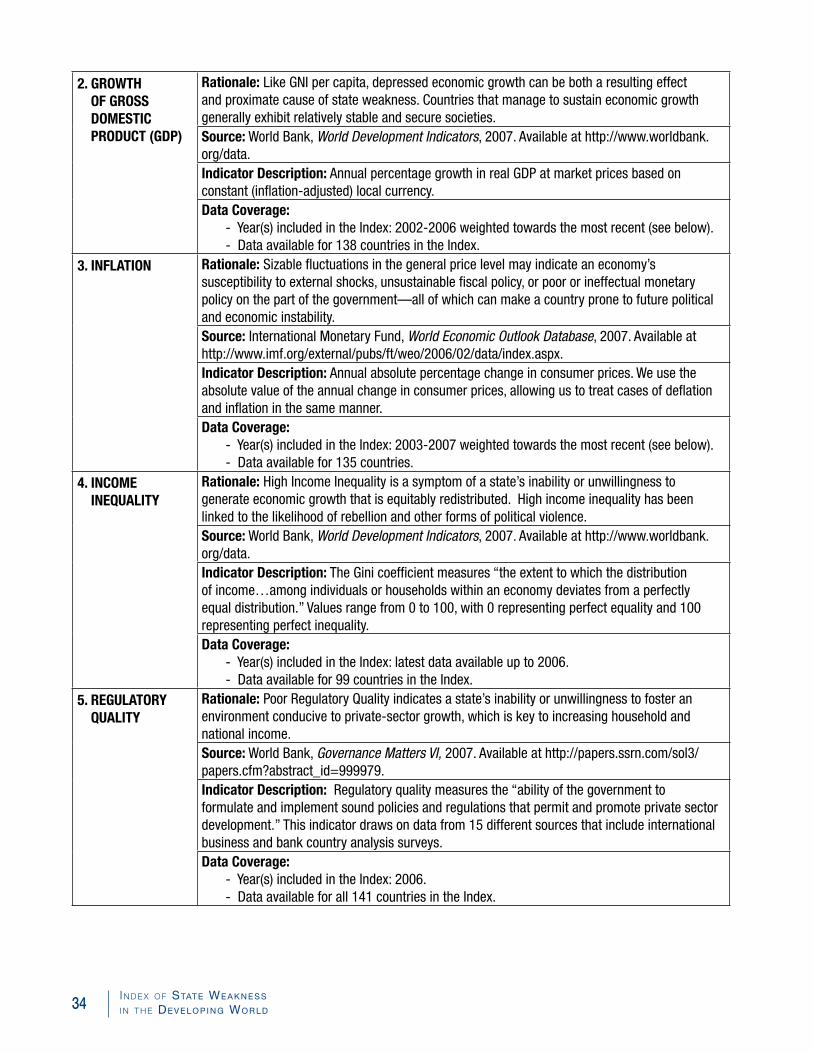
34 in d e x o F Stat e We a k n e S S i n t h e De v e l o p i n g Wo r l D
2. GRoWtH oF GRoss Domestic PRoDUct (GDP)
Rationale: like GNI per capita, depressed economic growth can be both a resulting effect and proximate cause of state weakness. Countries that manage to sustain economic growth generally exhibit relatively stable and secure societies.source: World Bank, World Development Indicators, 2007. Available at http://www.worldbank.org/data.indicator Description: Annual percentage growth in real GDP at market prices based on constant (inflation-adjusted) local currency.Data coverage:
- Year(s) included in the Index: 2002-2006 weighted towards the most recent (see below).- Data available for 138 countries in the Index.
3. inFlation Rationale: Sizable fluctuations in the general price level may indicate an economy’s susceptibility to external shocks, unsustainable fiscal policy, or poor or ineffectual monetary policy on the part of the government—all of which can make a country prone to future political and economic instability.source: International Monetary Fund, World Economic Outlook Database, 2007. Available at http://www.imf.org/external/pubs/ft/weo/2006/02/data/index.aspx.indicator Description: Annual absolute percentage change in consumer prices. We use the absolute value of the annual change in consumer prices, allowing us to treat cases of deflation and inflation in the same manner.Data coverage:
- Year(s) included in the Index: 2003-2007 weighted towards the most recent (see below).- Data available for 135 countries.
4. income ineQUality
Rationale: High Income Inequality is a symptom of a state’s inability or unwillingness to generate economic growth that is equitably redistributed. High income inequality has been linked to the likelihood of rebellion and other forms of political violence.source: World Bank, World Development Indicators, 2007. Available at http://www.worldbank.org/data.indicator Description: The Gini coefficient measures “the extent to which the distribution of income…among individuals or households within an economy deviates from a perfectly equal distribution.” Values range from 0 to 100, with 0 representing perfect equality and 100 representing perfect inequality.Data coverage:
- Year(s) included in the Index: latest data available up to 2006.- Data available for 99 countries in the Index.
5. ReGUlatoRy QUality
Rationale: Poor Regulatory Quality indicates a state’s inability or unwillingness to foster an environment conducive to private-sector growth, which is key to increasing household and national income.source: World Bank, Governance Matters VI, 2007. Available at http://papers.ssrn.com/sol3/papers.cfm?abstract_id=999979.indicator Description: Regulatory quality measures the “ability of the government to formulate and implement sound policies and regulations that permit and promote private sector development.” This indicator draws on data from 15 different sources that include international business and bank country analysis surveys.Data coverage:
- Year(s) included in the Index: 2006.- Data available for all 141 countries in the Index.

35Fo r e i g n Po l i c y at Br o o k i n g s Br o o k i n g s gl o B a l ec o n o m y a n d de v e l o P m e n t
FIVE SOCIAL WELFARE INDICATORS1. cHilD
moRtalitysource: UNICEF, State of the World’s Children 2007. Available at http://www.unicef.org/publications/files/The_State_of_the_Worlds__Children__2007_e.pdfRationale: Child mortality is widely recognized as an accurate proxy for a state’s ability to provide a wide range of public services, including health care, environmental quality, and maternal education.indicator Description: The annual probability (per 1,000 live births) of a child dying before reaching five years of age. We have used the 2005 estimate published in UNICEF’s State of the World’s Children 2007. The data are “based on the work of the Interagency Group for Mortality Estimation, which includes UNICEF, the World Health Organization, the World Bank and the UN Population Division.”Data coverage:
- Year(s) included in the Index: 2005.- Data available for all 141 countries in the Index.
2. PRimaRy scHool comPletion
source: World Bank, World Development Indicators, 2007. Available at http://www.worldbank.org/data.Rationale: Indicator provides a direct measure of a state’s ability and/or will to fulfill its responsibility to provide education for its citizens, an essential public service.indicator Description: This indicator reports the proportion of pupils starting grade 1 who reach grade 5. To increase data coverage, we use the most recent figures available in each country since 2000. Some countries report greater than 100 percent completion depending on the calculation method used; we cap all figures at a maximum of 100 percent.Data coverage:
- Year(s) included in the Index: most recent between 2000 and 2005.- Data available for 126 countries in the Index.
3. PReValence oF UnDeRnoURisH-ment
Rationale: High Undernourishment is a direct measure of a state’s ability and/or will to meet the basic food requirements of its people.source: Food and Agriculture Organization, 2006. Available at http://www.fao.org/faostat/foodsecurity/index_en.htm.indicator Description: The “percentage of the population whose food intake is insufficient to meet dietary energy requirements continuously.”Data coverage:
- Year(s) included in the Index: 2004.- Data available for 130 countries in the Index.
4. access to imPRoVeD WateR soURces & imPRoVeD sanitation Facilities
Rationale: Indicator provides a good measure of the state’s capacity and will to provide social welfare services across the entire population of that country.source: World Bank, World Development Indicators, 2007. Available at http://www.worldbank.org/data.indicator Description: We use the simple average of a country’s available data on the percent of the population with access to improved sanitation facilities and access to improved water sources. Access to improved sanitation facilities is defined as the “percentage of the population using improved sanitation facilities (including flush to piped sewer system, flush to septic tank, flush/pour flush to pit, flush/pour flush to elsewhere).” Access to improved water sources is the “percentage of the population using improved drinking water sources (including household water connection, public standpipe, borehole, protected dug well, protected spring, rainwater collection and bottled water—if a secondary available source is also improved).”Data coverage:
- Year(s) included in the Index: 2004.- Data available for 130 countries in the Index.
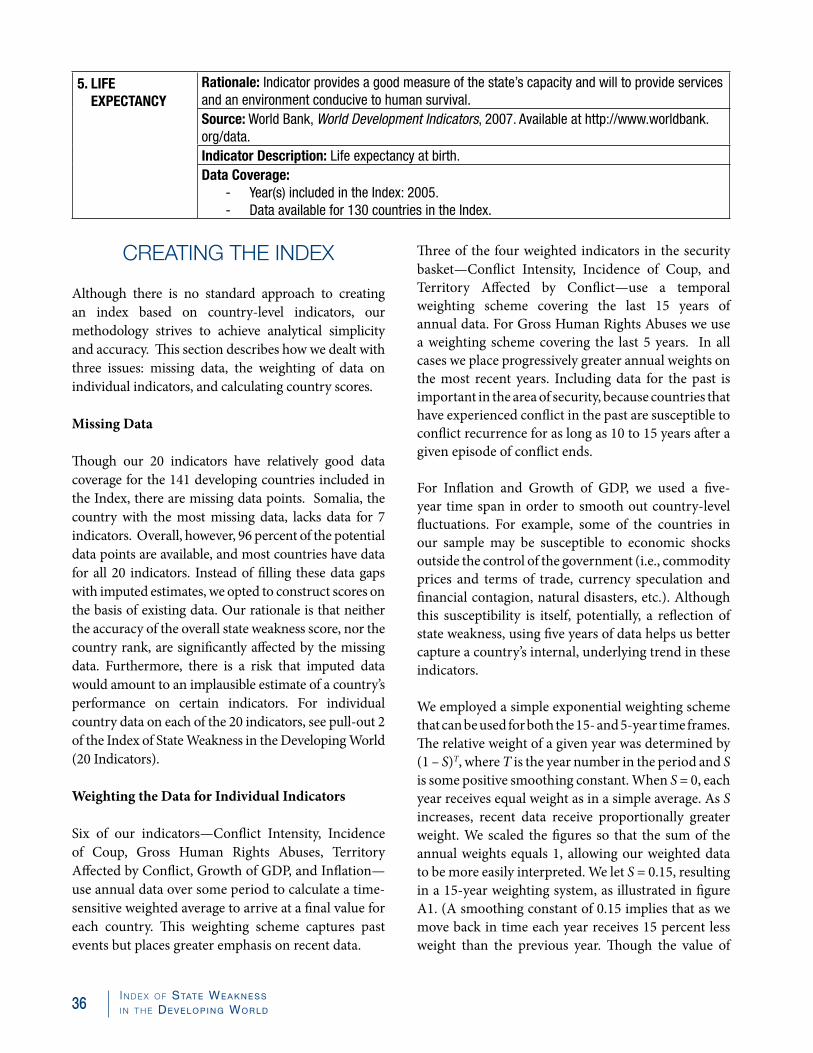
36 In d e x o f Stat e We a k n e S S I n t h e De v e l o p i n g Wo r l D
5. Life expectancy
Rationale: Indicator provides a good measure of the state’s capacity and will to provide services and an environment conducive to human survival.Source: World Bank, World Development Indicators, 2007. Available at http://www.worldbank.org/data.indicator Description: Life expectancy at birth.Data coverage:
- Year(s) included in the Index: 2005.- Data available for 130 countries in the Index.
CREATING THE INDEX
Although there is no standard approach to creating an index based on country-level indicators, our methodology strives to achieve analytical simplicity and accuracy. This section describes how we dealt with three issues: missing data, the weighting of data on individual indicators, and calculating country scores.
Missing Data
Though our 20 indicators have relatively good data coverage for the 141 developing countries included in the Index, there are missing data points. Somalia, the country with the most missing data, lacks data for 7 indicators. Overall, however, 96 percent of the potential data points are available, and most countries have data for all 20 indicators. Instead of filling these data gaps with imputed estimates, we opted to construct scores on the basis of existing data. Our rationale is that neither the accuracy of the overall state weakness score, nor the country rank, are significantly affected by the missing data. Furthermore, there is a risk that imputed data would amount to an implausible estimate of a country’s performance on certain indicators. For individual country data on each of the 20 indicators, see pull-out 2 of the Index of State Weakness in the Developing World (20 Indicators).
Weighting the Data for Individual Indicators
Six of our indicators—Conflict Intensity, Incidence of Coup, Gross Human Rights Abuses, Territory Affected by Conflict, Growth of GDP, and Inflation—use annual data over some period to calculate a time-sensitive weighted average to arrive at a final value for each country. This weighting scheme captures past events but places greater emphasis on recent data.
Three of the four weighted indicators in the security basket—Conflict Intensity, Incidence of Coup, and Territory Affected by Conflict—use a temporal weighting scheme covering the last 15 years of annual data. For Gross Human Rights Abuses we use a weighting scheme covering the last 5 years. In all cases we place progressively greater annual weights on the most recent years. Including data for the past is important in the area of security, because countries that have experienced conflict in the past are susceptible to conflict recurrence for as long as 10 to 15 years after a given episode of conflict ends.
For Inflation and Growth of GDP, we used a five-year time span in order to smooth out country-level fluctuations. For example, some of the countries in our sample may be susceptible to economic shocks outside the control of the government (i.e., commodity prices and terms of trade, currency speculation and financial contagion, natural disasters, etc.). Although this susceptibility is itself, potentially, a reflection of state weakness, using five years of data helps us better capture a country’s internal, underlying trend in these indicators.
We employed a simple exponential weighting scheme that can be used for both the 15- and 5-year time frames. The relative weight of a given year was determined by (1 – S)T, where T is the year number in the period and S is some positive smoothing constant. When S = 0, each year receives equal weight as in a simple average. As S increases, recent data receive proportionally greater weight. We scaled the figures so that the sum of the annual weights equals 1, allowing our weighted data to be more easily interpreted. We let S = 0.15, resulting in a 15-year weighting system, as illustrated in figure A1. (A smoothing constant of 0.15 implies that as we move back in time each year receives 15 percent less weight than the previous year. Though the value of
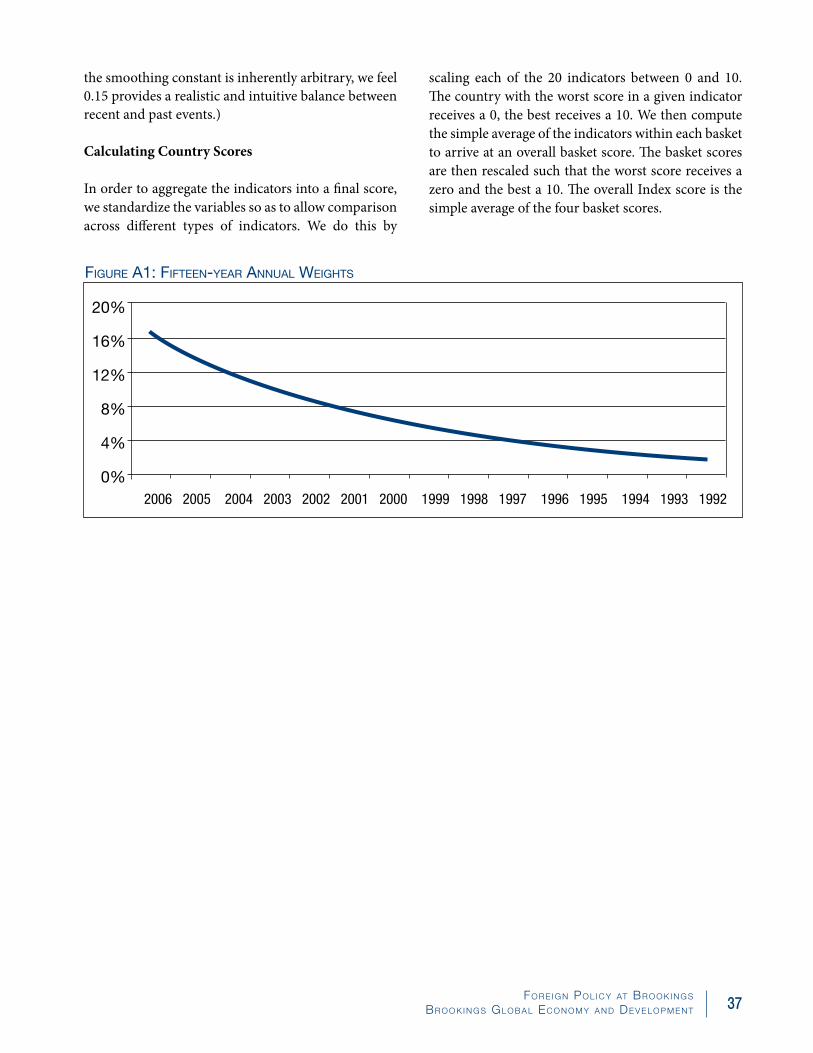
37fo r e I g n Po l I c y at Br o o k I n g s Br o o k I n g s gl o B a l ec o n o m y a n d de v e l o P m e n t
the smoothing constant is inherently arbitrary, we feel 0.15 provides a realistic and intuitive balance between recent and past events.)
Calculating Country Scores
In order to aggregate the indicators into a final score, we standardize the variables so as to allow comparison across different types of indicators. We do this by
scaling each of the 20 indicators between 0 and 10. The country with the worst score in a given indicator receives a 0, the best receives a 10. We then compute the simple average of the indicators within each basket to arrive at an overall basket score. The basket scores are then rescaled such that the worst score receives a zero and the best a 10. The overall Index score is the simple average of the four basket scores.
20%
16%
12%
8%
4%
0%2006 2005 2004 2003 2002 2001 2000 1999 1998 1997 1996 1995 1994 1993 1992
Figure a1: FiFteen-year annual WeightS
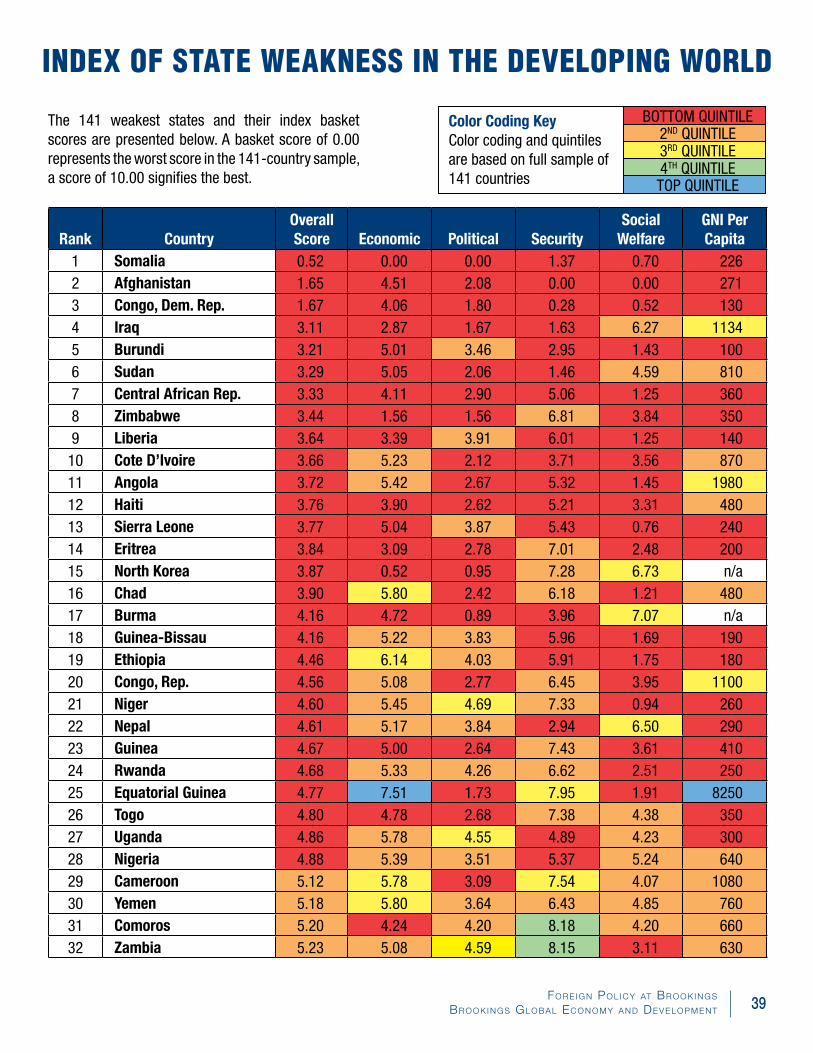
Rank CountryOverall Score Economic Political Security
Social Welfare
GNI Per Capita
1 Somalia 0.52 0.00 0.00 1.37 0.70 2262 Afghanistan 1.65 4.51 2.08 0.00 0.00 2713 Congo, Dem. Rep. 1.67 4.06 1.80 0.28 0.52 1304 Iraq 3.11 2.87 1.67 1.63 6.27 11345 Burundi 3.21 5.01 3.46 2.95 1.43 1006 Sudan 3.29 5.05 2.06 1.46 4.59 8107 Central African Rep. 3.33 4.11 2.90 5.06 1.25 3608 Zimbabwe 3.44 1.56 1.56 6.81 3.84 3509 Liberia 3.64 3.39 3.91 6.01 1.25 140
10 Cote D’Ivoire 3.66 5.23 2.12 3.71 3.56 87011 Angola 3.72 5.42 2.67 5.32 1.45 198012 Haiti 3.76 3.90 2.62 5.21 3.31 48013 Sierra Leone 3.77 5.04 3.87 5.43 0.76 24014 Eritrea 3.84 3.09 2.78 7.01 2.48 20015 North Korea 3.87 0.52 0.95 7.28 6.73 n/a16 Chad 3.90 5.80 2.42 6.18 1.21 48017 Burma 4.16 4.72 0.89 3.96 7.07 n/a18 Guinea-Bissau 4.16 5.22 3.83 5.96 1.69 19019 Ethiopia 4.46 6.14 4.03 5.91 1.75 18020 Congo, Rep. 4.56 5.08 2.77 6.45 3.95 110021 Niger 4.60 5.45 4.69 7.33 0.94 26022 Nepal 4.61 5.17 3.84 2.94 6.50 29023 Guinea 4.67 5.00 2.64 7.43 3.61 41024 Rwanda 4.68 5.33 4.26 6.62 2.51 25025 Equatorial Guinea 4.77 7.51 1.73 7.95 1.91 825026 Togo 4.80 4.78 2.68 7.38 4.38 35027 Uganda 4.86 5.78 4.55 4.89 4.23 30028 Nigeria 4.88 5.39 3.51 5.37 5.24 64029 Cameroon 5.12 5.78 3.09 7.54 4.07 108030 Yemen 5.18 5.80 3.64 6.43 4.85 76031 Comoros 5.20 4.24 4.20 8.18 4.20 66032 Zambia 5.23 5.08 4.59 8.15 3.11 630
INDEX OF STATE WEAKNESS IN THE DEVELOPING WORLD
The 141 weakest states and their index basket scores are presented below. A basket score of 0.00 represents the worst score in the 141-country sample, a score of 10.00 signifies the best.
Color Coding Key Color coding and quintiles are based on full sample of 141 countries
BoTTom quinTile2nd quinTile3rd quinTile4Th quinTileTop quinTile
39Fo r e i g n Po l i c y at Br o o k i n g s Br o o k i n g s gl o B a l ec o n o m y a n d de v e l o P m e n t

Rank CountryOverall Score Economic Political Security
Social Welfare
GNI Per Capita
33 Pakistan 5.23 6.58 3.52 4.69 6.13 77034 Cambodia 5.27 6.33 3.00 7.18 4.57 48035 Turkmenistan 5.27 5.05 1.40 7.88 6.75 170036 Uzbekistan 5.30 5.20 1.78 6.66 7.54 61037 Mauritania 5.30 6.23 4.34 6.38 4.24 74038 Djibouti 5.31 5.05 3.69 8.21 4.29 106039 Mozambique 5.32 5.60 5.33 8.35 1.98 34040 Papua New Guinea 5.32 5.13 4.62 7.45 4.08 77041 Swaziland 5.33 5.57 3.65 8.28 3.80 243042 Tajikistan 5.35 6.18 3.03 6.39 5.82 39043 East Timor 5.51 3.93 4.41 7.74 5.98 84044 Burkina Faso 5.51 6.30 4.87 8.30 2.59 46045 Laos 5.53 5.88 2.56 7.98 5.71 50046 Malawi 5.60 5.68 4.83 8.11 3.77 17047 Colombia 5.63 5.84 5.79 1.78 9.11 274048 Bangladesh 5.64 6.08 3.97 6.55 5.98 48049 Madagascar 5.65 5.24 5.95 7.65 3.76 28050 Kenya 5.65 5.77 4.72 6.95 5.15 58051 Gambia 5.79 5.26 4.54 8.29 5.06 31052 Mali 5.85 6.33 6.16 8.49 2.43 44053 Lesotho 5.88 4.59 6.40 8.35 4.18 103054 Solomon Islands 5.92 4.59 5.05 7.66 6.39 68055 Tanzania 5.94 6.38 5.41 8.08 3.89 35056 Sri Lanka 5.94 6.32 5.47 3.38 8.59 130057 Algeria 6.07 6.83 4.27 4.04 9.13 303058 Philippines 6.08 6.18 5.59 4.16 8.40 142059 Syria 6.14 4.62 2.76 7.49 9.67 157060 Guatemala 6.15 5.63 4.66 6.65 7.65 264061 Sao Tome & Principe 6.17 4.86 5.77 7.95 6.12 78062 Cuba 6.17 3.60 2.94 8.28 9.88 n/a63 Gabon 6.18 6.51 3.93 8.36 5.94 500064 Bolivia 6.19 4.64 5.01 7.77 7.34 110065 Russia 6.20 7.14 3.81 4.83 9.04 578066 Iran 6.25 5.51 3.32 6.91 9.28 300067 India 6.28 6.72 6.72 4.87 6.79 82068 Senegal 6.28 6.38 5.97 7.96 4.82 75069 Honduras 6.33 5.30 4.86 7.68 7.47 120070 Venezuela 6.33 6.01 3.76 7.12 8.44 607071 Benin 6.36 6.25 5.82 8.51 4.86 540
40 in d e x o F Stat e We a k n e S S i n t h e De v e l o p i n g Wo r l D

Rank CountryOverall Score Economic Political Security
Social Welfare
GNI Per Capita
72 Nicaragua 6.37 5.61 4.79 8.14 6.94 100073 Kyrgyzstan 6.39 6.27 3.62 7.53 8.14 49074 China 6.41 6.89 3.69 6.85 8.21 201075 Paraguay 6.44 4.78 4.50 8.00 8.50 140076 Fiji 6.47 5.99 5.19 6.32 8.37 330077 Indonesia 6.49 6.46 5.25 5.92 8.34 142078 Egypt 6.50 6.34 4.09 6.55 9.03 135079 Thailand 6.50 7.14 5.30 5.07 8.51 299080 Azerbaijan 6.54 7.85 3.36 7.06 7.89 185081 Belarus 6.63 6.57 2.31 8.24 9.41 338082 Namibia 6.66 5.21 7.26 8.93 5.23 323083 Vietnam 6.66 6.33 3.67 8.35 8.31 69084 Ghana 6.72 5.92 7.02 8.44 5.48 52085 Ecuador 6.78 5.55 4.53 7.47 9.56 284086 Libya 6.80 6.84 2.45 8.12 9.77 738087 Guyana 6.83 5.56 5.71 7.89 8.15 113088 Moldova 6.89 6.41 4.69 7.93 8.54 110089 Kazakhstan 6.92 7.43 3.59 8.33 8.31 379090 Georgia 6.99 6.58 5.66 7.15 8.58 156091 Dominican Republic 7.01 5.83 5.89 8.18 8.14 285092 Peru 7.01 6.58 5.69 7.25 8.54 292093 Lebanon 7.02 7.05 4.86 6.77 9.40 549094 Bhutan 7.08 6.04 6.16 9.78 6.33 141095 El Salvador 7.10 6.03 6.00 8.13 8.23 254096 Morocco 7.11 6.77 5.50 8.01 8.15 190097 Mongolia 6.16 6.68 6.01 8.78 7.17 88098 Turkey 7.18 7.32 6.53 5.83 9.06 540099 Brazil 7.22 6.12 6.42 7.32 9.01 4730
100 Maldives 7.25 7.00 4.77 8.96 8.29 2680101 Jamaica 7.26 6.28 6.39 7.78 8.60 3480102 Botswana 7.27 6.59 8.41 9.29 4.78 5900103 Micronesia 7.28 4.65 7.77 9.81 6.90 2380104 Tonga 7.32 4.90 5.25 9.52 9.63 2170105 Armenia 7.34 7.97 4.73 8.23 8.44 1930106 Marshall Islands 7.37 4.20 6.66 9.82 8.82 3000107 Ukraine 7.38 6.92 5.34 7.90 9.34 1950108 Serbia 7.43 7.14 5.89 7.39 9.29 3910109 Suriname 7.49 5.86 6.63 8.72 8.74 3200110 South Africa 7.50 6.89 8.07 7.72 7.33 5390
41Fo r e i g n Po l i c y at Br o o k i n g s Br o o k i n g s gl o B a l ec o n o m y a n d de v e l o P m e n t

Rank CountryOverall Score Economic Political Security
Social Welfare
GNI Per Capita
111 Albania 7.59 7.42 5.33 7.95 9.65 2960112 Tunisia 7.61 7.12 5.57 8.22 9.53 2970113 Bosnia-Herzegovina 7.63 7.52 5.63 7.87 9.51 2980114 Macedonia 7.66 7.04 5.84 8.09 9.66 3060115 Argentina 7.67 6.18 6.17 8.54 9.77 5150116 Vanuatu 7.70 6.06 7.21 10.00 7.52 1710117 Belize 7.71 6.49 6.92 8.54 8.88 3650118 Jordan 7.74 7.26 6.16 8.03 9.50 2660119 Kiribati 7.75 5.65 7.61 10.00 7.75 1230120 Mexico 7.83 7.82 6.38 7.63 9.51 7870121 Romania 7.91 7.91 6.77 8.42 8.54 4850122 Panama 7.94 7.06 7.02 9.05 8.64 4890123 Cape Verde 7.96 6.60 8.46 9.49 7.30 2130124 Malaysia 8.20 7.64 7.06 8.49 9.61 5490125 Samoa 8.21 5.87 7.77 9.86 9.33 2270126 Seychelles 8.23 7.33 6.54 9.52 9.55 8650127 Bulgaria 8.38 8.05 7.21 8.61 9.64 3990128 Oman 8.46 8.67 6.26 9.42 9.48 9070129 Grenada 8.48 7.03 7.87 9.49 9.52 4420130 Costa Rica 8.65 6.89 8.31 9.62 9.79 4980131 Croatia 8.67 9.26 7.27 8.46 9.70 9330132 Uruguay 8.76 7.14 8.67 9.43 9.79 5310133 Mauritius 8.79 7.34 8.49 9.67 9.68 5450134 Dominica 8.90 7.47 8.92 9.57 9.66 3960135 Poland 9.01 8.95 8.17 8.98 9.95 8190136 Latvia 9.08 9.18 8.54 9.45 9.16 8100137 Saint Lucia 9.11 8.01 9.60 9.25 9.59 5110138 Lithuania 9.27 9.33 8.44 9.63 9.69 7870139 Chile 9.35 7.99 10.00 9.43 10.00 6980140 Hungary 9.41 10.00 8.92 9.01 9.69 10950141 Slovak Republic 9.41 9.95 8.68 9.32 9.68 9870
42 in d e x o F Stat e We a k n e S S i n t h e De v e l o p i n g Wo r l D

ECON
OMIC
BAS
KET
POLI
TICA
L BA
SKET
SECU
RITY
BAS
KET
SOCI
AL W
ELFA
RE B
ASKE
T
Coun
try
Overall Ranking
GNI per capita
GDP Growth
Income Inequality
Inflation
Regulatory Quality
Government Effectiveness
Rule of Law
Voice and Accountability
Control of Corruption
Freedom
Conflict Intensity
Gross Human Rights Abuses
Territory Affected by Conflcit
Incidence of Coups
Political Stability and Absence of Violence
Child Mortality
Access to Improved Water and Sanitation
Undernourishment
Primary School Completion
Life Expectancy
Som
alia
10.
12--
----
0.00
0.00
0.00
0.61
0.00
0.00
0.72
2.37
0.92
10.0
00.
372.
071.
21--
--2.
90
Afgh
anis
tan
20.
166.
03--
5.81
2.44
2.33
1.43
2.77
0.96
3.33
1.54
0.67
0.45
4.60
1.45
0.91
2.30
--1.
26--
Cong
o, D
em. R
ep.
30.
034.
26--
5.83
2.91
1.68
2.31
1.88
1.09
2.50
1.06
0.46
1.87
5.10
1.39
2.80
2.48
0.14
2.11
2.06
Iraq
40.
952.
98--
--3.
021.
441.
582.
111.
202.
501.
840.
003.
6010
.00
0.00
5.71
7.58
--6.
68--
Buru
ndi
50.
003.
256.
586.
493.
702.
634.
253.
532.
245.
004.
841.
473.
237.
693.
643.
354.
851.
241.
712.
20
Suda
n6
0.65
5.24
--6.
473.
773.
073.
271.
492.
090.
830.
000.
003.
0610
.00
1.69
6.98
4.18
6.76
3.50
4.93
Cent
ral A
fric
an R
ep.
70.
242.
252.
687.
733.
572.
262.
653.
492.
304.
178.
023.
1710
.00
5.54
2.85
3.24
4.06
4.28
0.00
1.02
Zim
babw
e8
0.23
0.00
4.99
0.00
1.20
1.91
2.23
2.01
1.32
0.83
10.0
02.
7910
.00
10.0
04.
045.
456.
003.
867.
450.
52
Libe
ria9
0.04
1.81
--6.
482.
592.
393.
714.
942.
995.
838.
603.
747.
2210
.00
3.95
1.71
3.21
3.45
--1.
71
Cote
D’iv
oire
100.
712.
456.
137.
683.
912.
242.
772.
391.
991.
678.
172.
124.
167.
671.
923.
165.
218.
552.
632.
55
Ango
la11
1.73
7.23
--4.
713.
652.
893.
362.
942.
062.
505.
093.
526.
4910
.00
5.59
0.80
2.97
5.52
--1.
47
Haiti
120.
352.
273.
125.
374.
572.
382.
643.
340.
974.
179.
033.
2410
.00
4.75
3.20
5.89
2.97
4.00
--4.
01
Sier
ra L
eone
130.
136.
11--
6.04
3.84
3.18
3.58
5.29
1.78
5.83
8.23
5.76
5.26
6.14
5.71
0.00
3.70
3.31
--1.
45
Eritr
ea14
0.09
2.63
--5.
252.
022.
774.
171.
335.
190.
838.
744.
1610
.00
10.0
04.
767.
422.
060.
003.
664.
53
Nort
h Ko
rea
15--
----
--0.
471.
423.
380.
260.
240.
0010
.00
2.54
10.0
010
.00
6.22
8.25
7.52
5.79
--6.
58
Chad
160.
356.
89--
7.50
3.78
2.39
3.18
2.53
1.90
2.50
8.38
3.77
9.51
10.0
02.
562.
690.
975.
521.
182.
06
Burm
a17
--5.
10--
5.10
1.13
1.78
2.93
0.00
0.27
0.00
2.58
2.20
5.09
10.0
05.
176.
447.
279.
667.
285.
94
Guin
ea-B
issa
u18
0.08
2.68
5.62
8.48
3.99
3.01
3.56
5.35
2.53
5.00
9.69
6.30
8.72
3.21
5.40
2.98
3.58
4.97
0.57
2.31
Ethi
opia
190.
074.
769.
145.
954.
574.
615.
143.
423.
953.
338.
442.
719.
4410
.00
2.55
4.29
0.00
4.00
4.62
1.75
Cong
o, R
ep.
200.
924.
09--
7.55
3.68
2.57
3.46
3.38
2.31
2.50
9.03
5.01
8.47
8.32
4.52
6.33
3.03
5.79
4.51
4.06
Nige
r21
0.15
3.46
4.90
8.06
5.20
4.08
4.51
5.83
2.60
6.67
9.78
7.00
10.0
06.
245.
960.
951.
455.
930.
722.
27
INDE
X OF
STA
TE W
EAKN
ESS
IN T
HE D
EVEL
OPIN
G W
ORLD
(20
Indi
cato
rs)
The
141
wea
kest
sta
tes
and
thei
r in
dica
tor
scor
es
are
pres
ente
d be
low
. A s
core
of 0
.00
repr
esen
ts th
e w
orst
sco
re in
the
sam
ple,
a s
core
of 1
0.00
sig
nifie
s th
e be
st.
Colo
r Cod
ing
Key
Colo
r cod
ing
and
quin
tiles
ar
e ba
sed
on fu
ll sa
mpl
e of
14
1 co
untri
es
BoTT
om q
uInT
Ile
2nd q
uInT
Ile
3rd q
uInT
Ile
4Th q
uInT
Ile
Top
quIn
TIle
43Fo r e i g n Po l i c y at Br o o k i n g s Br o o k i n g s gl o B a l ec o n o m y a n d de v e l o P m e n t

ECON
OMIC
BAS
KET
POLI
TICA
L BA
SKET
SECU
RITY
BAS
KET
SOCI
AL W
ELFA
RE B
ASKE
T
Coun
try
Overall Ranking
GNI per capita
GDP Growth
Income Inequality
Inflation
Regulatory Quality
Government Effectiveness
Rule of Law
Voice and Accountability
Control of Corruption
Freedom
Conflict Intensity
Gross Human Rights Abuses
Territory Affected by Conflcit
Incidence of Coups
Political Stability and Absence of Violence
Child Mortality
Access to Improved Water and Sanitation
Undernourishment
Primary School Completion
Life Expectancy
Nepa
l22
0.18
3.01
5.60
6.66
5.20
3.78
5.01
3.23
3.32
4.17
7.12
1.01
1.17
10.0
01.
527.
565.
458.
006.
916.
29
Guin
ea23
0.29
3.21
7.36
5.11
4.01
2.19
3.07
3.23
2.62
2.50
9.79
6.82
10.0
010
.00
2.78
4.80
2.00
7.03
4.13
4.34
Rwan
da24
0.14
4.05
5.68
6.42
5.01
5.20
5.26
3.26
5.36
2.50
8.86
4.73
7.94
8.97
5.53
2.87
4.91
5.79
2.12
2.08
Equa
toria
l Gui
nea
257.
516.
31--
6.85
3.22
2.52
3.57
1.39
0.79
0.83
10.0
05.
1210
.00
10.0
06.
412.
803.
70--
4.10
1.66
Togo
260.
233.
01--
7.67
4.40
1.73
4.08
2.98
2.49
2.50
10.0
04.
3910
.00
10.0
04.
775.
203.
157.
035.
524.
58
Ugan
da27
0.18
4.28
5.90
6.56
6.13
4.92
5.50
4.96
3.43
4.17
6.29
2.07
6.50
10.0
04.
035.
314.
127.
724.
323.
41
Nige
ria28
0.50
4.47
6.31
5.84
4.41
3.60
3.42
4.29
1.56
5.00
7.05
2.58
10.0
09.
122.
143.
203.
459.
107.
47--
Cam
eroo
n29
0.90
3.45
6.13
7.70
4.89
3.79
4.09
3.60
2.68
1.67
10.0
03.
6110
.00
10.0
06.
254.
844.
976.
765.
142.
52
Yem
en30
0.61
3.56
8.43
5.62
4.93
3.67
4.20
3.50
3.81
3.33
8.99
3.83
8.92
10.0
03.
536.
554.
555.
105.
136.
09
Com
oros
310.
522.
91--
7.30
2.87
1.43
4.35
5.80
3.84
5.83
10.0
09.
5810
.00
6.46
6.43
7.67
5.09
2.07
3.61
6.29
Zam
bia
320.
494.
104.
855.
665.
204.
225.
205.
543.
225.
0010
.00
4.91
10.0
010
.00
7.45
3.64
4.73
4.00
7.10
0.78
Paki
stan
330.
624.
439.
026.
525.
624.
894.
653.
162.
712.
508.
242.
619.
565.
362.
316.
656.
977.
035.
266.
80
Cam
bodi
a34
0.35
5.99
6.72
7.12
5.05
3.44
3.86
3.71
1.87
2.50
9.55
4.91
9.91
8.32
5.65
5.05
1.39
5.79
9.01
5.02
Turk
men
ista
n35
1.47
--6.
926.
341.
422.
162.
950.
821.
580.
0010
.00
5.09
10.0
010
.00
6.14
6.47
6.00
9.38
--6.
34
Uzbe
kist
an36
0.47
4.54
7.74
5.49
2.53
2.78
2.96
1.20
2.44
0.00
10.0
03.
9410
.00
10.0
02.
267.
786.
916.
909.
577.
37
Mau
ritan
ia37
0.59
4.60
7.28
6.39
5.98
4.52
5.70
3.79
3.80
4.17
10.0
05.
1210
.00
3.83
6.10
5.71
3.15
8.97
2.84
4.25
Djib
outi
380.
883.
46--
7.49
4.30
3.44
4.71
3.68
3.59
3.33
9.93
6.35
10.0
010
.00
6.31
5.42
7.27
7.03
1.20
4.19
Moz
ambi
que
390.
225.
045.
576.
145.
375.
525.
266.
353.
895.
8310
.00
5.30
9.90
10.0
07.
984.
982.
424.
282.
381.
56
Papu
a Ne
w G
uine
a40
0.62
3.12
4.83
7.06
4.87
3.92
4.33
6.36
2.07
6.67
9.78
5.34
9.43
10.0
04.
927.
562.
91--
4.05
4.87
Swaz
iland
412.
153.
044.
936.
825.
294.
344.
983.
374.
211.
6710
.00
6.48
10.0
010
.00
6.44
4.44
4.55
7.31
5.34
1.48
Tajik
ista
n42
0.27
5.35
8.59
6.25
4.19
3.30
4.00
2.89
2.80
2.50
9.12
5.55
8.15
8.51
3.74
7.67
4.55
2.62
10.0
06.
61
East
Tim
or43
0.68
1.55
--7.
383.
014.
313.
725.
562.
875.
8310
.00
6.18
10.0
010
.00
4.48
8.04
3.58
9.10
--4.
95
Burk
ina
Faso
440.
334.
327.
187.
705.
594.
075.
535.
614.
335.
0010
.00
6.66
10.0
010
.00
6.34
3.31
2.36
8.28
1.08
3.07
Laos
450.
374.
708.
186.
293.
913.
724.
302.
012.
340.
8310
.00
5.09
10.0
010
.00
6.56
7.38
2.79
7.72
6.89
--
Mal
awi
460.
064.
307.
286.
005.
023.
915.
615.
643.
355.
8310
.00
5.37
10.0
010
.00
6.82
5.71
6.00
5.52
4.51
1.26
Colo
mbi
a47
2.43
3.94
3.24
6.88
6.80
6.42
5.13
5.81
5.04
6.67
2.58
0.46
0.00
10.0
03.
029.
498.
738.
559.
608.
60
Bang
lade
sh48
0.35
4.37
8.44
6.63
4.45
4.02
4.54
5.02
1.55
5.00
10.0
02.
769.
9510
.00
3.06
7.60
4.73
6.21
6.96
6.58
Mad
agas
car
490.
173.
365.
545.
965.
895.
866.
046.
374.
936.
6710
.00
7.10
10.0
06.
217.
015.
932.
615.
104.
554.
74
Keny
a50
0.44
3.80
6.56
6.19
6.04
4.36
4.22
6.00
2.59
6.67
9.97
3.71
9.50
10.0
04.
255.
894.
186.
079.
353.
19
Gam
bia
510.
193.
674.
976.
545.
654.
246.
103.
943.
665.
0010
.00
6.77
10.0
08.
977.
195.
276.
066.
34--
4.96
44 in d e x o F Stat e We a k n e S S i n t h e De v e l o p i n g Wo r l D

ECON
OMIC
BAS
KET
POLI
TICA
L BA
SKET
SECU
RITY
BAS
KET
SOCI
AL W
ELFA
RE B
ASKE
T
Coun
try
Overall Ranking
GNI per capita
GDP Growth
Income Inequality
Inflation
Regulatory Quality
Government Effectiveness
Rule of Law
Voice and Accountability
Control of Corruption
Freedom
Conflict Intensity
Gross Human Rights Abuses
Territory Affected by Conflcit
Incidence of Coups
Political Stability and Absence of Violence
Child Mortality
Access to Improved Water and Sanitation
Undernourishment
Primary School Completion
Life Expectancy
Mal
i52
0.31
4.07
7.05
8.22
5.57
5.18
6.00
7.47
3.93
8.33
9.89
7.46
9.62
10.0
06.
802.
333.
706.
342.
013.
10
Leso
tho
530.
863.
292.
296.
875.
065.
596.
207.
235.
597.
509.
937.
469.
718.
977.
155.
454.
918.
555.
720.
04
Solo
mon
Isla
nds
540.
534.
02--
6.32
3.82
3.69
4.42
6.68
4.82
5.83
9.34
7.65
10.0
06.
237.
139.
204.
007.
45--
6.36
Tanz
ania
550.
234.
588.
186.
845.
605.
495.
595.
774.
555.
8310
.00
5.68
10.0
010
.00
6.37
5.82
4.48
4.28
6.34
2.58
Sri L
anka
561.
114.
407.
046.
366.
295.
326.
915.
514.
815.
000.
722.
426.
5110
.00
3.04
9.75
8.18
7.31
--9.
03
Alge
ria57
2.70
3.97
8.04
7.38
5.09
5.35
5.16
4.14
4.47
2.50
5.72
2.15
4.30
8.51
4.70
8.84
8.61
9.79
9.46
8.36
Phili
ppin
es58
1.22
4.12
6.14
6.73
6.41
6.34
5.58
6.01
3.50
6.67
4.43
2.72
4.87
10.0
03.
849.
057.
397.
869.
568.
20
Syria
591.
353.
73--
6.17
3.54
3.38
5.36
1.82
3.61
0.00
10.0
04.
9110
.00
10.0
04.
739.
718.
979.
7910
.00
8.83
Guat
emal
a60
2.34
3.33
3.96
6.47
6.35
4.44
4.09
5.69
3.49
5.83
9.19
4.18
8.83
9.12
4.86
8.69
8.85
7.31
6.65
7.48
Sao
Tom
e &
Prin
cipe
610.
634.
72--
5.48
4.70
3.85
5.59
7.21
4.03
8.33
10.0
09.
2210
.00
4.33
7.97
5.96
4.18
8.97
7.06
6.48
Cuba
62--
3.60
----
2.19
3.69
4.40
2.09
4.92
0.00
10.0
05.
8410
.00
10.0
07.
0410
.00
9.33
10.0
09.
209.
62
Gabo
n63
4.52
2.75
--8.
005.
474.
565.
263.
783.
003.
3310
.00
6.19
10.0
010
.00
7.03
6.95
5.39
9.66
5.64
4.29
Boliv
ia64
0.92
3.57
2.94
7.07
4.08
4.36
4.42
6.12
3.68
6.67
10.0
06.
1810
.00
10.0
04.
617.
895.
827.
1710
.00
6.79
Russ
ia65
5.24
4.62
7.09
5.98
5.48
5.13
4.39
4.03
3.29
2.50
4.45
2.37
6.80
10.0
05.
069.
609.
039.
939.
206.
94
Iran
662.
674.
336.
465.
622.
914.
064.
662.
723.
841.
679.
873.
5110
.00
10.0
03.
868.
959.
279.
799.
458.
22
Indi
a67
0.66
5.22
7.73
6.95
6.21
6.26
7.33
7.50
5.08
7.50
4.43
3.25
6.32
10.0
04.
837.
565.
097.
598.
696.
49
Sene
gal
680.
603.
816.
828.
335.
875.
715.
986.
374.
397.
509.
626.
639.
1610
.00
6.16
5.31
5.94
7.59
3.60
4.89
Hond
uras
691.
013.
844.
226.
585.
514.
634.
495.
553.
206.
6710
.00
4.70
10.0
010
.00
5.70
8.80
7.33
7.17
7.28
7.64
Vene
zuel
a70
5.50
4.48
5.39
5.33
3.28
3.81
3.09
4.86
2.34
5.00
10.0
04.
2110
.00
10.0
03.
909.
497.
037.
868.
928.
93
Beni
n71
0.41
3.52
7.80
7.52
5.66
4.93
5.41
7.45
3.11
8.33
10.0
06.
1910
.00
10.0
07.
654.
803.
948.
695.
484.
55
Nica
ragu
a72
0.83
3.44
6.43
6.28
5.40
3.56
4.79
5.88
3.28
6.67
10.0
06.
5610
.00
10.0
05.
758.
915.
526.
626.
948.
06
Kyrg
yzst
an73
0.36
3.35
9.07
7.03
5.18
3.87
3.65
4.52
2.21
4.17
10.0
05.
8410
.00
10.0
03.
987.
826.
129.
799.
677.
59
Chin
a74
1.76
5.98
5.65
7.93
6.11
6.34
5.79
1.78
4.01
0.83
9.41
2.37
9.29
10.0
05.
929.
275.
218.
699.
708.
38
Para
guay
751.
203.
333.
296.
404.
923.
814.
345.
482.
436.
6710
.00
6.09
10.0
010
.00
5.66
9.42
7.94
8.28
8.53
8.29
Fiji
762.
953.
16--
7.35
5.64
6.08
6.66
5.44
4.61
3.33
10.0
07.
7510
.00
0.00
7.06
9.60
5.09
9.66
10.0
07.
59
Indo
nesi
a77
1.22
4.10
8.25
6.24
5.94
5.26
4.63
5.80
3.23
7.50
8.66
3.13
7.29
10.0
04.
068.
955.
889.
5210
.00
7.46
Egyp
t78
1.15
3.89
8.23
6.49
5.50
5.18
6.87
3.42
4.41
0.83
9.62
3.29
8.09
10.0
04.
749.
058.
069.
799.
688.
09
Thai
land
792.
664.
236.
677.
377.
477.
216.
955.
094.
922.
508.
873.
5710
.00
2.74
4.46
9.49
9.88
7.31
7.67
8.17
Azer
baija
n80
1.61
10.0
07.
806.
325.
494.
344.
523.
272.
522.
509.
336.
238.
879.
124.
297.
025.
829.
389.
248.
48
Bela
rus
813.
025.
549.
195.
742.
672.
783.
721.
633.
010.
8310
.00
5.59
10.0
010
.00
7.15
9.82
9.03
9.79
9.97
7.62
45Fo r e i g n Po l i c y at Br o o k i n g s Br o o k i n g s gl o B a l ec o n o m y a n d de v e l o P m e n t

ECON
OMIC
BAS
KET
POLI
TICA
L BA
SKET
SECU
RITY
BAS
KET
SOCI
AL W
ELFA
RE B
ASKE
T
Coun
try
Overall Ranking
GNI per capita
GDP Growth
Income Inequality
Inflation
Regulatory Quality
Government Effectiveness
Rule of Law
Voice and Accountability
Control of Corruption
Freedom
Conflict Intensity
Gross Human Rights Abuses
Territory Affected by Conflcit
Incidence of Coups
Political Stability and Absence of Violence
Child Mortality
Access to Improved Water and Sanitation
Undernourishment
Primary School Completion
Life Expectancy
Nam
ibia
822.
883.
980.
006.
976.
976.
747.
337.
636.
288.
3310
.00
6.89
10.0
010
.00
8.71
8.00
4.67
7.03
6.58
2.72
Viet
nam
830.
545.
127.
706.
475.
375.
305.
712.
373.
601.
6710
.00
5.43
10.0
010
.00
7.75
9.56
6.73
8.14
9.16
8.11
Ghan
a84
0.39
4.26
6.91
5.72
6.34
6.53
6.50
7.58
5.36
9.17
9.96
6.30
10.0
010
.00
7.31
6.18
3.52
8.83
6.39
5.12
Ecua
dor
852.
534.
044.
287.
313.
983.
134.
255.
523.
326.
679.
964.
9110
.00
10.0
04.
679.
358.
979.
5210
.00
9.03
Liby
a86
6.71
3.62
--8.
303.
173.
874.
851.
102.
850.
0010
.00
4.91
10.0
010
.00
7.33
9.56
9.64
10.0
0--
8.96
Guya
na87
0.95
2.66
6.42
6.74
5.41
5.94
4.95
6.55
3.78
7.50
10.0
05.
9010
.00
10.0
05.
407.
967.
159.
2410
.00
6.66
Mol
dova
880.
924.
578.
475.
865.
693.
915.
205.
133.
635.
839.
786.
119.
8910
.00
5.65
9.67
7.58
8.83
8.98
7.57
Kaza
khst
an89
3.40
5.88
8.33
6.38
5.56
4.83
4.63
3.57
2.76
2.50
10.0
06.
2110
.00
10.0
06.
917.
607.
459.
5210
.00
7.11
Geor
gia
901.
355.
336.
986.
496.
045.
905.
226.
064.
576.
679.
874.
919.
429.
254.
788.
628.
559.
108.
288.
26
Dom
inic
an R
epub
lic91
2.53
4.30
4.68
5.47
6.28
5.10
5.51
6.81
3.84
8.33
10.0
05.
3410
.00
10.0
07.
179.
138.
366.
348.
95--
Peru
922.
604.
424.
607.
786.
825.
034.
826.
644.
607.
509.
335.
639.
0010
.00
4.67
9.27
6.73
8.69
9.82
8.12
Leba
non
934.
973.
20--
7.92
6.36
5.07
5.53
5.05
3.89
5.00
9.18
4.91
9.91
10.0
02.
699.
169.
889.
938.
688.
54
Bhut
an94
1.21
5.01
--6.
916.
167.
338.
623.
798.
652.
509.
979.
3310
.00
10.0
09.
807.
535.
88--
----
El S
alva
dor
952.
253.
164.
537.
246.
885.
615.
466.
365.
187.
5010
.00
5.99
9.69
10.0
06.
609.
276.
738.
838.
278.
26
Mor
occo
961.
663.
867.
188.
056.
196.
456.
794.
725.
564.
1710
.00
5.73
10.0
010
.00
6.06
8.80
7.21
9.52
7.45
8.05
Mon
golia
970.
725.
028.
566.
505.
815.
056.
006.
813.
998.
3310
.00
6.36
10.0
010
.00
8.58
8.47
5.21
6.62
9.42
7.25
Turk
ey98
4.88
4.85
6.33
5.98
7.09
7.05
7.08
5.98
5.94
6.67
7.90
4.10
7.21
8.32
5.25
9.20
9.03
9.93
8.34
8.26
Braz
il99
4.27
3.40
3.57
6.56
6.58
6.05
5.56
7.56
4.67
8.33
10.0
02.
3710
.00
10.0
06.
579.
057.
889.
3810
.00
8.25
Mal
dive
s10
02.
385.
44--
7.25
7.21
6.46
7.40
3.59
4.11
2.50
10.0
07.
1110
.00
10.0
08.
588.
736.
488.
9710
.00
7.43
Jam
aica
101
3.12
2.89
5.94
5.94
7.16
6.75
5.24
7.97
4.57
7.50
10.0
04.
7010
.00
10.0
06.
129.
538.
369.
107.
728.
17
Bots
wan
a10
25.
354.
052.
856.
287.
728.
528.
578.
158.
408.
3310
.00
7.46
10.0
010
.00
9.63
5.89
6.18
5.93
9.14
0.00
Mic
rone
sia
103
2.10
2.14
----
6.92
5.72
8.74
9.50
4.87
10.0
010
.00
--10
.00
10.0
09.
378.
735.
27--
--7.
53
Tong
a10
41.
912.
99--
6.10
4.68
4.52
8.34
6.19
1.56
5.83
10.0
0--
10.0
010
.00
8.41
9.38
9.76
--10
.00
8.57
Arm
enia
105
1.69
7.09
8.36
7.35
7.19
5.92
5.46
4.47
3.87
4.17
9.80
6.85
10.0
010
.00
6.07
9.20
8.48
7.03
8.80
8.72
Mar
shal
l Isl
ands
106
2.67
3.20
----
4.23
3.28
6.23
9.82
4.02
10.0
010
.00
--10
.00
10.0
09.
398.
158.
12--
10.0
0--
Ukra
ine
107
1.71
4.86
9.54
5.99
5.44
4.72
4.90
6.19
3.56
7.50
10.0
05.
2010
.00
10.0
06.
149.
649.
5210
.00
9.30
7.50
Serb
ia10
83.
514.
279.
135.
825.
665.
535.
276.
654.
617.
509.
395.
978.
7110
.00
5.18
9.71
8.79
9.10
9.53
8.60
Surin
ame
109
2.86
4.25
--5.
935.
686.
306.
287.
255.
078.
3310
.00
7.67
10.0
010
.00
7.04
8.84
9.15
9.24
8.33
7.90
Sout
h Af
rica
110
4.88
3.84
3.41
7.07
8.22
8.65
7.52
8.22
7.56
8.33
9.51
4.91
9.56
10.0
06.
627.
787.
1510
.00
9.83
2.89
Alba
nia
111
2.64
4.07
8.91
7.69
6.22
5.16
4.96
6.47
3.58
6.67
9.88
6.21
9.50
10.0
05.
929.
609.
219.
529.
669.
21
46 in d e x o F Stat e We a k n e S S i n t h e De v e l o p i n g Wo r l D

ECON
OMIC
BAS
KET
POLI
TICA
L BA
SKET
SECU
RITY
BAS
KET
SOCI
AL W
ELFA
RE B
ASKE
T
Coun
try
Overall Ranking
GNI per capita
GDP Growth
Income Inequality
Inflation
Regulatory Quality
Government Effectiveness
Rule of Law
Voice and Accountability
Control of Corruption
Freedom
Conflict Intensity
Gross Human Rights Abuses
Territory Affected by Conflcit
Incidence of Coups
Political Stability and Absence of Violence
Child Mortality
Access to Improved Water and Sanitation
Undernourishment
Primary School Completion
Life Expectancy
Tuni
sia
112
2.65
3.92
7.12
7.53
7.13
7.97
7.89
3.23
6.40
2.50
10.0
05.
3810
.00
10.0
07.
269.
388.
6710
.00
9.93
8.75
Bosn
ia-H
erze
govi
na11
32.
654.
149.
937.
705.
504.
475.
427.
034.
716.
679.
337.
468.
8510
.00
5.56
9.71
9.52
9.10
--8.
97
Mac
edon
ia11
42.
733.
307.
288.
276.
435.
795.
616.
714.
566.
6710
.00
6.89
10.0
010
.00
5.24
9.64
--9.
669.
678.
84
Arge
ntin
a11
54.
654.
444.
746.
054.
765.
825.
287.
294.
228.
3310
.00
7.28
10.0
010
.00
6.71
9.60
9.21
9.93
9.92
9.07
Vanu
atu
116
1.48
3.50
--8.
086.
285.
248.
127.
956.
428.
3310
.00
10.0
010
.00
10.0
010
.00
8.87
4.55
8.83
8.36
7.85
Beliz
e11
73.
274.
01--
7.30
6.10
5.85
6.72
8.14
4.78
9.17
10.0
06.
9810
.00
10.0
06.
989.
646.
249.
7910
.00
8.38
Jord
an11
82.
364.
627.
317.
037.
566.
928.
094.
766.
984.
1710
.00
6.30
10.0
010
.00
5.55
9.31
9.39
9.52
9.94
8.43
Kirib
ati
119
1.04
2.89
--10
.00
4.12
4.96
9.15
7.92
6.03
10.0
010
.00
--10
.00
10.0
010
.00
7.89
4.24
9.38
10.0
0--
Mex
ico
120
7.16
3.30
5.83
7.19
7.60
6.84
5.53
6.69
4.62
8.33
9.81
4.57
10.0
010
.00
5.83
9.27
8.55
9.66
9.95
9.19
Rom
ania
121
4.38
4.50
8.92
6.20
7.45
6.23
6.45
7.74
5.16
8.33
10.0
06.
3910
.00
10.0
07.
069.
564.
7910
.00
9.93
8.36
Pana
ma
122
4.41
4.51
3.76
8.04
7.36
6.72
6.52
7.90
4.84
9.17
10.0
09.
0810
.00
10.0
06.
999.
387.
767.
179.
579.
16
Cape
Ver
de12
31.
874.
37--
8.70
6.07
6.87
8.53
8.95
7.90
10.0
010
.00
9.06
10.0
010
.00
8.84
8.98
5.33
--7.
598.
13
Mal
aysi
a12
44.
974.
305.
197.
718.
209.
358.
455.
556.
985.
0010
.00
6.18
10.0
010
.00
7.58
9.82
9.58
9.93
8.91
8.81
Sam
oa12
52.
003.
41--
6.83
6.48
6.59
9.37
8.06
6.48
8.33
10.0
010
.00
10.0
010
.00
9.44
9.20
9.27
9.79
9.50
8.13
Seyc
helle
s12
67.
882.
18--
8.22
5.04
6.11
6.95
6.83
6.22
6.67
10.0
08.
7210
.00
10.0
09.
319.
788.
559.
1010
.00
--
Bulg
aria
127
3.59
4.37
9.30
6.89
7.87
6.80
6.39
8.11
5.59
9.17
10.0
06.
8210
.00
10.0
07.
459.
719.
889.
249.
788.
55
Oman
128
8.27
2.95
--7.
968.
387.
728.
804.
318.
072.
5010
.00
9.29
10.0
010
.00
8.30
9.82
----
9.05
9.05
Gren
ada
129
3.98
3.17
--7.
607.
646.
877.
208.
427.
689.
1710
.00
10.0
010
.00
10.0
07.
889.
499.
459.
389.
03--
Cost
a Ri
ca13
04.
504.
335.
065.
897.
647.
228.
378.
926.
9610
.00
10.0
09.
5010
.00
10.0
08.
949.
829.
339.
668.
9710
.00
Croa
tia13
18.
513.
899.
347.
627.
427.
886.
787.
705.
678.
339.
677.
468.
6610
.00
7.85
10.0
010
.00
9.38
8.80
9.25
Urug
uay
132
4.80
3.85
6.07
6.36
7.33
7.78
7.96
9.19
8.35
10.0
010
.00
9.18
10.0
010
.00
8.48
9.71
10.0
010
.00
8.85
9.24
Mau
ritiu
s13
34.
933.
58--
6.85
7.98
8.20
9.08
8.97
6.95
9.17
10.0
0--
10.0
010
.00
8.90
9.71
9.64
9.66
9.68
8.65
Dom
inic
a13
43.
563.
24--
8.20
8.76
8.62
8.65
9.29
7.91
10.0
010
.00
--10
.00
10.0
08.
599.
718.
859.
2410
.00
--
Pola
nd13
57.
463.
748.
228.
028.
117.
817.
559.
226.
2110
.00
10.0
08.
5110
.00
10.0
07.
2910
.00
--10
.00
9.67
9.10
Latv
ia13
67.
375.
727.
566.
689.
148.
498.
278.
887.
0010
.00
10.0
09.
0710
.00
10.0
08.
669.
858.
619.
938.
528.
27
Sain
t Luc
ia13
74.
623.
886.
547.
599.
209.
289.
1110
.00
9.44
10.0
010
.00
7.88
10.0
010
.00
9.04
9.75
9.21
9.66
9.42
8.91
Lith
uani
a13
87.
165.
127.
897.
819.
058.
768.
099.
176.
1110
.00
10.0
09.
6610
.00
10.0
08.
849.
93--
10.0
09.
738.
25
Chile
139
6.34
3.84
4.00
7.59
10.0
010
.00
10.0
09.
8010
.00
10.0
010
.00
8.88
10.0
010
.00
8.76
9.89
9.15
9.79
10.0
09.
82
Hung
ary
140
10.0
03.
759.
796.
919.
238.
448.
859.
777.
4110
.00
10.0
07.
4610
.00
10.0
08.
479.
969.
6410
.00
9.22
8.57
Slov
ak R
epub
lic14
19.
014.
3910
.00
6.91
9.18
9.03
8.04
9.34
6.88
10.0
010
.00
8.46
10.0
010
.00
8.75
9.96
9.94
9.38
9.22
8.85
47Fo r e i g n Po l i c y at Br o o k i n g s Br o o k i n g s gl o B a l ec o n o m y a n d de v e l o P m e n t

Susan E. Rice and Stewart Patrick1775 Massachusetts Avenue, NWWashington, D.C. 20036brookings.edu
Foreign Policyat BROOKINGS
Index of State WeakneSS In the Developing WorlD


![376 388...N Br N O2 S H O F0854 + Pd(OAc)2 H[A1424] DPPB [B1246] Et3SiH [T0662] Na2CO3 DMF, 75-85 oC R N H O O S Br S O Hydrogenation of hydride species from Ei H …](https://static.fdocuments.us/doc/165x107/5ff1769054bb6279720a1605/376-388-n-br-n-o2-s-h-o-f0854-pdoac2-ha1424-dppb-b1246-et3sih-t0662.jpg)


![Lower-Rim Substituted Calixarenes and Their Applicationsdownloads.hindawi.com/journals/bca/2007/065815.pdf · O O O O Br Br O O O Rh Rh O Br O O O O Figure 8: Bis(calix[4]arene) dirhodium](https://static.fdocuments.us/doc/165x107/5f17b04b1356820805672ab4/lower-rim-substituted-calixarenes-and-their-a-o-o-o-o-br-br-o-o-o-rh-rh-o-br-o-o.jpg)