Independent study shows that ReSound LiNX Quattro is ...
8
INTRODUCTION Direct audio streaming to hearing aids has become an important feature of current technology as it introduces multiple benefits for end users. For example, receiving clear audio and video calls in both ears; enjoying stereo music and media broadcasts; or listening to turn-by-turn navigation instructions to name a few. The sound quality of streamed sounds is important and can contribute to posi- tive user outcomes. High sound quality can also contribute to ease and convenience of using hearing aids. For exam- ple, it can allow users to appreciate music and participate in music related activities to a greater degree. Music plays a role in every culture and in many social situations, and has been shown to offer health benefits. 1 Music also plays an important psychological function whereby people of- ten use music in their everyday lives to relieve boredom, create a comfortable personal space, and enhance mood. 2 An extension of this idea is that the sound quality provided by hearing aids can normalize the way users consume me- dia because they don’t need to remove their hearing aids or augment them with bridging devices in order to do so. The ways in which people are consuming music and other audio is undergoing a notable shift to services that pro- vide streaming of audio and video. And consumers over the age of 55 are the primary drivers of increases in the use of smart devices and related services such as stream- ing on demand. 3 The rapid growth in media consumption via smart devices by older adults intersects with the higher prevalence of hearing loss and uptake of hearing aids as adults age. Older adults who wear hearing aids should rea- sonably expect their hearing aids to support the ways in which they use their smart devices. SOUND QUALITY ASSESSMENT A sound quality evaluation methodology using a panel of trained listeners who are hearing aid users has been de- veloped by Senselab in cooperation with several hearing aid manufacturers. SenseLab is an independent test labo- ratory specialized in performing listening tests in a variety of domains. The methodology is inspired by the food and fragrance industry, which uses sensory panels consist- ing of trained assessors to evaluate products based on methodologies that are well-established within food sci- ence. The idea is that methodologies used to assess the sensory domains of taste and smell can be transferred to other sensory domains such as hearing. The methodol- ogy is double-blinded in that neither the assessors nor the tester knows which conditions are presented. This makes the methodology strong in terms of eliminating biases. Le- garth and colleagues 4 reported on how a trained listening Independent study shows that ReSound LiNX Quattro is preferred for direct audio streaming Miguel Aranda de Toro, Jennifer Groth; GN Hearing Søren Vase Legarth; FORCE Technology, Senselab ABSTRACT This study examined sound quality preferences for ReSound LiNX Quattro and other premium hearing aids specifically for sound streamed from an iPhone. The continued increase in smart device usage and media con- sumption via these devices is being driven by older adults, who also make up the majority of hearing aid users. Therefore it is important to carefully consider the quality of the sound provided by the interaction of hearing aids and smart devices. In this test conducted by an independent laboratory, 16 hearing aid users who are part of a trained panel of sound quality assessors evaluated individualized recordings of streamed speech and mu- sic samples through ReSound LiNX Quattro, ReSound LiNX 3D, and five other premium hearing aids. ReSound LiNX Quattro and ReSound LiNX 3D were preferred for different types of streamed content. The influence of various attributes of sound quality are discussed.
Transcript of Independent study shows that ReSound LiNX Quattro is ...
INTRODUCTIONDirect audio streaming to hearing aids has become an important feature of current technology as it introduces multiple benefits for end users. For example, receiving clear audio and video calls in both ears; enjoying stereo music and media broadcasts; or listening to turn-by-turn navigation instructions to name a few. The sound quality of streamed sounds is important and can contribute to posi-tive user outcomes. High sound quality can also contribute to ease and convenience of using hearing aids. For exam-ple, it can allow users to appreciate music and participate in music related activities to a greater degree. Music plays a role in every culture and in many social situations, and has been shown to offer health benefits.1 Music also plays an important psychological function whereby people of-ten use music in their everyday lives to relieve boredom, create a comfortable personal space, and enhance mood.2
An extension of this idea is that the sound quality provided by hearing aids can normalize the way users consume me-dia because they don’t need to remove their hearing aids or augment them with bridging devices in order to do so. The ways in which people are consuming music and other audio is undergoing a notable shift to services that pro-vide streaming of audio and video. And consumers over the age of 55 are the primary drivers of increases in the
use of smart devices and related services such as stream-ing on demand.3 The rapid growth in media consumption via smart devices by older adults intersects with the higher prevalence of hearing loss and uptake of hearing aids as adults age. Older adults who wear hearing aids should rea-sonably expect their hearing aids to support the ways in which they use their smart devices.
SOUND QUALIT Y ASSESSMENTA sound quality evaluation methodology using a panel of trained listeners who are hearing aid users has been de-veloped by Senselab in cooperation with several hearing aid manufacturers. SenseLab is an independent test labo-ratory specialized in performing listening tests in a variety of domains. The methodology is inspired by the food and fragrance industry, which uses sensory panels consist-ing of trained assessors to evaluate products based on methodologies that are well-established within food sci-ence. The idea is that methodologies used to assess the sensory domains of taste and smell can be transferred to other sensory domains such as hearing. The methodol-ogy is double-blinded in that neither the assessors nor the tester knows which conditions are presented. This makes the methodology strong in terms of eliminating biases. Le-garth and colleagues4 reported on how a trained listening
Independent study shows that ReSound LiNX Quattro is preferred for direct audio streaming Miguel Aranda de Toro, Jennifer Groth; GN HearingSøren Vase Legarth; FORCE Technology, Senselab
ABSTRACTThis study examined sound quality preferences for ReSound LiNX Quattro and other premium hearing aids specifically for sound streamed from an iPhone. The continued increase in smart device usage and media con-sumption via these devices is being driven by older adults, who also make up the majority of hearing aid users. Therefore it is important to carefully consider the quality of the sound provided by the interaction of hearing aids and smart devices. In this test conducted by an independent laboratory, 16 hearing aid users who are part of a trained panel of sound quality assessors evaluated individualized recordings of streamed speech and mu-sic samples through ReSound LiNX Quattro, ReSound LiNX 3D, and five other premium hearing aids. ReSound LiNX Quattro and ReSound LiNX 3D were preferred for different types of streamed content. The influence of various attributes of sound quality are discussed.

panel consisting of hearing aid users with similar mild-to-moderately sloping hearing losses was qualified, and found that the panel can make robust and consistent ratings of the key audio features in hearing aids with little bias from experience with their current hearing aids. This methodol-ogy has been used for validating hearing instrument sound quality in hearing aids for several years and has become the acknowledged methodology within the hearing aid in-dustry.
The purpose of the current study was to benchmark sound quality preferences for streamed speech and music from an iPhone with hearing aids that have this capability. Be-cause hearing aid sound processing and prescribed fre-quency-gain characteristics can be different across hear-ings aids from different manufacturers, a variety of high end products were included in addition to ReSound pre-mium hearing aids.
METHODSParticipantsSixteen members of the Senselab expert panel participat-ed including 5 women and 11 men with an average age of 75 years (range 65 to 84 years). Their average audiograms for right and left ear are shown in Figure 1.
Figure 1. Individual and average audiograms of the test participants for right and left ears. Panelists have audiograms which are similar to the standard N35 audiogram.
Hearing aid fitting and recordingsReSound LiNX Quattro, ReSound LiNX 3D and five other premium Receiver-in-the-Ear (RIE) hearing aids that were capable of streaming directly from an iPhone were used in this test. Recordings of the test stimuli were made for each ear of each individual listener for each set of hearing aids. The hearing aids were programmed to manufacturer de-fault settings and the corresponding audiogram of each lis-tener. The selected program for the recordings was the one for music listening, recorded music listening, or streaming depending on the particular product and manufacturer’s recommendation for streamed music. The acoustic micro-phones on the devices were muted, and the devices were fit to a Head-and-Torso-Simulator (HATS type 4128c) with the manufacturer’s most occluding domes in order to make the recordings. Sound stimuli were streamed from
an iPhone 6 to the hearing aids, and the output was cap-tured by the microphones in the ear canals of the HATS. The volume on the iPhone music player was adjusted to ensure that the loudness of the signal output from the hearing aids was as similar as possible across recordings. In post-processing of the recordings, noise below 10 Hz was filtered and corrections were made to account for the re-sponses of the HATS ear canals as well as the Sennheiser HD650 headphones that were used for playback during the assessment. The detailed setup for the recordings is shown in Figure 2.
Figure 2. The audio file was loaded to the iPhone and played back via the Apple music player app on the phone and streamed to the hearing aids placed on the HATS. The output of the hearing aids was recorded by micro-phones in the ear canals of the HATS. The recorded analogue signals were amplified, digitized, and saved as 24-bit, 48 kHz wav files.
Test stimuliThe audio files used for the recordings were a sample of female speech, a sample of male speech, and three mu-sic examples. Because the test participants were native Danish speakers, the speech was a Danish female talker and a Danish male talker reading from a book. Three mu-sic excerpts in different styles including a jazz piece with female vocal, a classical piano piece, and a classical orches-tral piece were used. Because the audio files were looped for playback, the music files were edited to maintain the rhythm when looped. The sound samples are listed in Table 1.
Table 1. Audio files for the recordings of streamed sounds to the hearing aids.
Artist Track Album
Female speech Selection read from book
Senselab Speech Library
Male speech Selection read from book
Senselab Speech Library
Sinne Eeg Highway One Don’t Be So Blue(10th anniversary
edition, 2014)
Schubert Piano Quintet in A Major, Op. 114, D. 667 “The Trout”: Scherzo
(Presto)
Alfred Brendel (Philips Classics)
Chopin Nocturne No.8 in D flat op 27 no2
Best of Lang Lang (Deutsch
Grammophon 2010)
B&K HATS 5935Dual microphone supply
RME MadiFace XT
PC w/Adobe Audition CC
B&K HATS 4128-CHead-and-torso-simulator
iPhone 6sMobile phone
0
10
20
30
40
50
60
70
80
90
100
100 1000 10000
Frequency (Hz)
AVG Right AVG Left N3 Min Max
Hea
ring
Thre
shol
d Le
vel (
dB H
L)

ProcedureFor completion of the testing, the listener was seated in a single walled audiometric test booth. The test stimuli were played back over Sennheiser HD 650 headphones. The headphones were connected to an external FIIO E07K Andes sound card with built-in amplifiers. SenseLabOnline (ver. 4) software developed by FORCE Technology6 was used for execution of all tests. The tests were implemented as full-factorial tests, i.e. with evaluation of every combina-tion of all variables. SenseLabOnline managed the double-blinded stimulus presentation as well as data gathering. A multiple stimulus test type was utilized. The order of all presentations was randomized for each individual assessor.The test was completed in one session that lasted ap-proximately 2 hours. Prior to the test start, the listeners adjusted the recordings to have equal loudness using slid-ers in the test interface. This was to eliminate the known bias that loudness differences can have on preference and perceived attributes.
The listeners completed two tasks during the session. The first was to rate how much they liked or disliked the sound samples. For this preference task, participants evaluated the hearing aids using a visual continuous scale where they indicated to what degree they liked or disliked the sound. As shown in Figure 3, the anchors of the scale were “Ex-tremely like” and “Extremely dislike”. While listening, the participant could switch among the recordings being com-pared, without interrupting playback.
The second task was to rate sound quality attributes. The testing of attributes was done in a similar way, except that the scale corresponded to how much the device was judged to exhibit each attribute, with verbal anchors at each end of the scale. The attributes for this test were cho-sen by the investigator at Senselab on the basis of infor-mal listening to all recordings and refined at a consensus meeting with 6 members of the assessor panel at a 2-hour
meeting. The choices were based on describing the domi-nating perceptual characteristics differentiating the hear-ing aids. The test leader guided the process by which the panel was presented with representative recordings of the streamed audio, and reached consensus on the attributes and their descriptions. The attributes, anchors and defini-tions are described in Table 2.
Figure 3. User interface for the preference test. The user interface for the
attribute test was similar, but the scale indicated the degree to which the
sound fulfilled the particular attribute being evaluated.
RESULTS AND DISCUSSIONTask 1: PreferencesAn overall preference was determined by combining all trials. With 16 assessors and 5 samples, this means that the overall preference is based on 80 samples per device tested. The ReSound LiNX Quattro was rated as most liked for streaming the speech and music samples from an iPhone (Figure 4). This rating was significantly higher (Tukey Honest Significant Difference, p<.05) than all other devices tested except ReSound LiNX 3D and Brand D.
Attribute Low anchor High anchor Definition
Timbre balance Dark Bright Whether the sound is bass-heavy and deep, or thin, sparse and lacking fullness.
Can sound A little A lot Resembling the sound of old-fashioned phones, or radio broadcasts from the 40’s -50’s.
Details Few Many Whether details disappear in a blended and muddy sound scene with low separation of
instruments and sound sources or whether elements in the sound are distinct and clear with
high separation and many details.
Dynamics Flat Varying Liveliness of the sound. Are there differences between the loudest and softest sounds?
Or does it all sound monotonous and squeezed?
Boomy A little A lot Resonance in the deep bass or the sound inside a large barrel. Muddy, inaccurate sound.
Treble spill A little A lot Smearing of the bright tones. A lot of Treble shadow is on speech material perceived as
if ‘S’- and ‘T’-sounds are stretched and prolonged.
Artefact Few Dominating Noise or distortion like hissing, crackling, or whispering sound.
Table 2. Rated attributes with their high level definitions and anchors.
Preference
Dislike Extremely Neither Like nor Dislike Like Extremely
Please evaluate the sounds according to your personal opinion.

Figure 4. Mean preference ratings for the streamed speech and music sam-ples with 95% confidence intervals. ReSound LiNX Quattro was most liked, although not significantly different from ReSound LiNX 3D or Brand D.
Figure 5 examines the preference ratings for the streamed speech and music samples separately. The pattern of pref-erence is similar to the overall preference, with ReSound LiNX Quattro rated as most liked, although not signifi-cantly better than ReSound LiNX 3D or Brand D. This sup-ports a robust preference for streaming different types of content to ReSound devices and ReSound LiNX Quattro in particular. The spread of preference ratings among devices is greater for streamed speech than for the streamed mu-sic. This may be due to the fact that the specialized music program was used where allowed by the manufacturer. Most hearing aid manufacturers today have included spe-cial settings intended for music listening in their products. These settings generally aim for a “less-is-more” approach, in that special features such as directionality and noise re-duction usually are disabled, and compression is reduced in order to preserve the dynamics of music. Offsets to the prescribed hearing loss dependent gain may also be intro-duced in order to enhance a particular quality attribute of music, such as bass. This program may not have been ideal for intelligibility and quality of the streamed speech for all devices. This could be reflected in the larger spread of ratings for speech. It is also possible that gain offsets in a manufacturer’s music program may not be attuned with an individual’s preference or optimum for a particu-lar music genre. The ratings for speech and music are very similar for the ReSound devices in the test. The ReSound music program disables noise management features and reduces the compression ratio slightly but does not other-wise alter the frequency-gain response from the hearing loss prescribed settings. The current results support that this program in ReSound hearing aids can provide equally good quality for both speech and music streamed inputs.In addition, the confidence intervals are smaller for the music ratings than for the speech ratings across devices. While this also can be related to use of the music program, it is conceivable that it is easier for listeners to focus solely on quality when rating streamed music, whereas intelligi-bility may play into preferences for streamed speech, caus-ing more variability in the ratings.
Figure 5. Mean preference ratings for the streamed speech and music sam-ples with 95% confidence intervals. ReSound LiNX Quattro was rated as most liked for both types of stimuli.
Task 2: AttributesOne way to represent the results from the attribute as-sessments is to use profile plots. The profile plots in Figure 6 show the performance of the two ReSound hearing aids and the two least liked hearing aids for seven attributes averaged across all five samples. These plots help iden-tify what differentiates the tested devices perceptually. There is a very high similarity in the plots for ReSound LiNX Quattro and ReSound LiNX 3D with Timbre balance slightly toward “bright”, low degree of Can sound, and high levels of Dynamics and Details. Brand A was the least liked of all products tested, and shows a very different attrib-ute profile. However, Brand E was the next least liked, but showed an overall pattern similar to the ReSound hearing aids. It was rated as more “bright” on Timbre balance and with less Dynamics and Details, which suggests that these attributes may be important differentiators. In fact, the most differentiating attributes among devices were found to be Timbre balance, Boomy, Can Sound, Dynamics and Details.
Music Preference
Speech Preference
Overall Preference
Brand A
Brand A
Brand A
Brand B
Brand B
Brand B
ReSoundLiNX 3D
ReSoundLiNX 3D
ReSoundLiNX 3D
ReSoundLiNX Quattro
ReSoundLiNX Quattro
ReSoundLiNX Quattro
Brand C
Brand C
Brand C
Brand D
Brand D
Brand D
Brand E
Brand E
Brand E
Like extremely Like extremely
Like extremely
Dislike extremely Dislike extremely
Dislike extremely
▲ ▲
▲
▲ ▲
▲

Figure 6. Profile plots of the rated attributes for the two most preferred and the two least preferred hearing aids in the test. ReSound LiNX Quattro and ReSound LiNX 3D were the most preferred and were rated as showing a high level of Dynamics and Details with even Timbre balance.
Frequency responseThe perception of attributes and judgments of overall quality can be influenced by the frequency dependent am-plification provided by the device. For example, the device that was rated as being more Boomy than all the others was the least liked both for streamed speech and music. It is logical to relate this to the low frequency output from the hearing aid. Therefore, it was also of interest to exam-ine the spectra of the recordings made from the devices. Because all recordings were made with the hearing aids mounted on the HATS, acoustic effects of individual ears were not present in the recordings. In addition, all partici-pants had hearing losses with similar slope and configura-tion even though the severity ranged from mild to moder-ately severe. Considering this, frequency-gain prescriptions as a function of participant may have differed in level but probably not much in response shape. Thus it was assumed that relative differences in the output of the various hear-ing aids for different sound samples would be fairly con-stant across test participants. Therefore, the output of the recordings for one participant was analyzed, and the rela-tive differences among music types and hearing aids are assumed to be fairly representative for all participants. The spectra shown in Figures 7 and 8 are normalized to that of ReSound LiNX Quattro. Since it was the most preferred device, it is of interest to see what relative differences in output each device exhibited.
Figure 7. Difference in output spectrum compared to ReSound LiNX Quat-tro for the speech samples for one participant. A systematic difference is that all have vastly reduced output above 7 kHz relative to ReSound LiNX Quattro.
Figure 8. Difference in output spectrum compared to ReSound LiNX Quat-tro for the music samples for one participant. As observed with the speech samples, a systematic difference is that all have reduced output above 7 kHz relative to ReSound LiNX Quattro.
A clear difference between ReSound LiNX Quattro and the other devices tested is that the output above 7kHz is much lower for all of the other devices. This was somewhat surprising in that two of the other devices should have ac-cess to higher bandwidth in the streamed signal, and the hearing aids themselves have the capability to amplify sig-nals above this frequency. This may reflect a choice on the part of each manufacturer not to utilize the full bandwidth available. It may also influence the assessment of greater Details provided by the ReSound LiNX Quattro and ulti-mately the higher preference for this device.
Another observation is that three devices appear to en-hance the bass response in their music or streaming pro-gram more than ReSound hearing aids. Depending on mu-sic genre, this may or may not be an advantage for music listening. For example, rock and pop genres are often char-acterized by a heavy bass line in the music, and it may be preferred to enhance this characteristic. In this test, classi-cal and jazz genres were used, where details in the music and appreciation of different instruments may be masked by too much bass response in the hearing aids. This high-lights the importance of personalisation in tuning hearing aids to individual preferences.
Regarding music listening in particular, it has been pointed out in the literature that generic settings for music listen-ing probably won’t be suitable for everyone.7 ReSound hearing aids give the user an exceptional degree of control over their settings via the ReSound Smart 3D app. Among other things, the Sound Enhancer feature of the app allows them to adjust up to 6 dB above or below the programmed gain setting in the bass, middle and treble ranges, as illus-trated in Figure 9. This would allow a user to add more bass amplification if so desired in addition to many other adjustment possibilities. It is highly recommended that HCPs counsel users regarding the availability and use of the ReSound Smart 3D app and encourage them to create personalized settings.
Timbre balance
Can sound
Details
DynamicsBoomy
ReSound LiNX Quattro ReSound LiNX 3D Brand A Brand E
Treble spill
Artefacts
-40
-30
-20
-10
0
10
20
30
100 1000 10000
Brand A Brand B Brand C Brand D Brand EReSound LiNX 3D ReSound LiNX Quattro
Speech
Frequency (Hz)
Out
put r
elat
ive
to R
eSou
nd L
iNX
Qua
ttro
(dB
)
-40
-30
-20
-10
0
10
20
30
100 1000 10000
Brand A Brand B Brand C Brand D Brand EReSound LiNX 3D ReSound LiNX Quattro
Music
Frequency (Hz)
Out
put r
elat
ive
to R
eSou
nd L
iNX
Qua
ttro
(dB
)
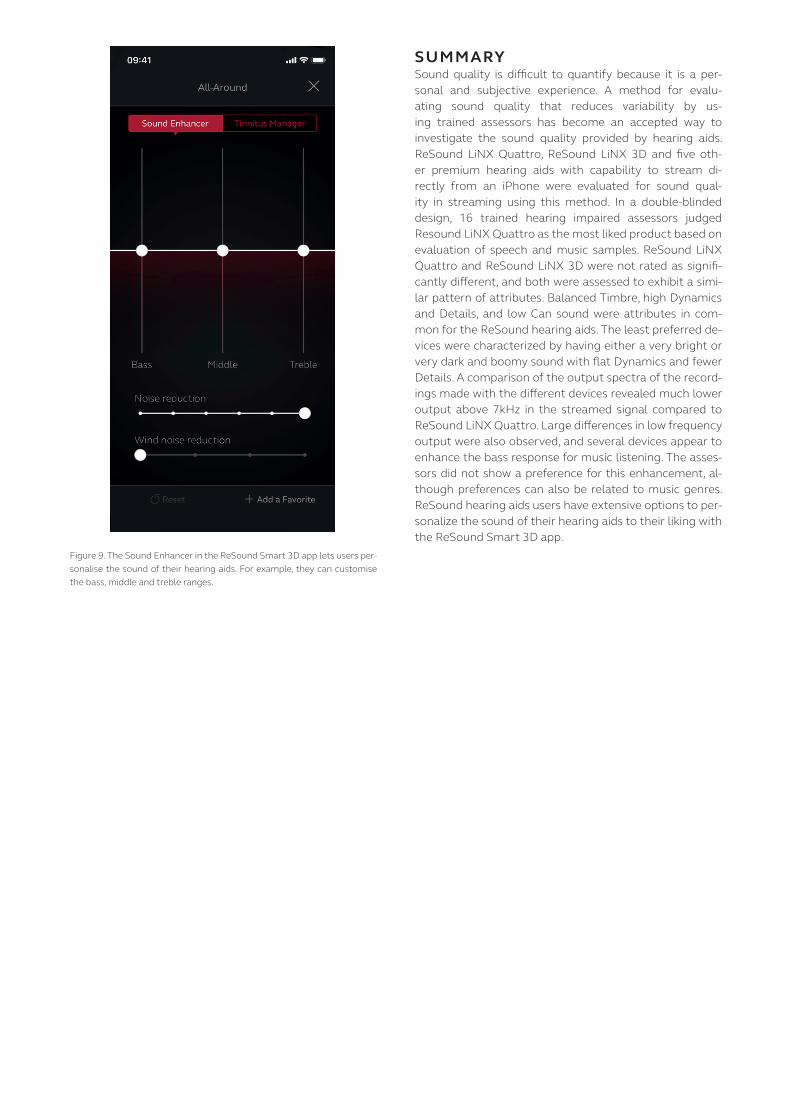
Figure 9. The Sound Enhancer in the ReSound Smart 3D app lets users per-sonalise the sound of their hearing aids. For example, they can customise the bass, middle and treble ranges.
SUMMARYSound quality is difficult to quantify because it is a per-sonal and subjective experience. A method for evalu-ating sound quality that reduces variability by us-ing trained assessors has become an accepted way to investigate the sound quality provided by hearing aids. ReSound LiNX Quattro, ReSound LiNX 3D and five oth-er premium hearing aids with capability to stream di-rectly from an iPhone were evaluated for sound qual-ity in streaming using this method. In a double-blinded design, 16 trained hearing impaired assessors judged Resound LiNX Quattro as the most liked product based on evaluation of speech and music samples. ReSound LiNX Quattro and ReSound LiNX 3D were not rated as signifi-cantly different, and both were assessed to exhibit a simi-lar pattern of attributes. Balanced Timbre, high Dynamics and Details, and low Can sound were attributes in com-mon for the ReSound hearing aids. The least preferred de-vices were characterized by having either a very bright or very dark and boomy sound with flat Dynamics and fewer Details. A comparison of the output spectra of the record-ings made with the different devices revealed much lower output above 7kHz in the streamed signal compared to ReSound LiNX Quattro. Large differences in low frequency output were also observed, and several devices appear to enhance the bass response for music listening. The asses-sors did not show a preference for this enhancement, al-though preferences can also be related to music genres. ReSound hearing aids users have extensive options to per-sonalize the sound of their hearing aids to their liking with the ReSound Smart 3D app.
REFERENCES1. MacDonald RAR. Music health and well-being: a review.
International Journal of Qualitative Studies of Health. 2013; 8(1): 20635.
2. Shäfer T, Sedlmeier P, Städtler C, Huron D. The psychological functions of music listening. Frontiers in Psychology. 2013; 4: article 511.
3. 2017 Global Mobile Customer Survey: US edition. The dawn of the next era in mobile. Available from: https://www2.deloitte.com/content/dam/Deloitte/us/Documents/technology-media-telecommunications/us-tmt-2017-global-mobile-consumer-survey-executive-summary.pdf
4. Legarth SV, Simonsen CS, Dyrlund O, Bramsloev L, Jespersen C. Establishing and qualifying a hearing impaired expert listen-ing panel. Poster presentation at ICHON. 2012, Lake Tahoe.
5. Bisgaard N, Vlaming M, Dahlquist M. Standard audiograms for the IEC 60118-15 measurement procedure. Trends in Amplification. 2010; 14:113-120.
6. Senselab Online. Available at: https://senselab.madebydelta.com/senselabonline/
7. Looi V, Rutledge K, Prvan T. Music Appreciation of Adult Hearing Aid Users and the Impact of Different Levels of Hearing Loss. Ear and Hearing. 2019; 40(3): 529-544.

© 2019 GN Hearing A/S. All rights reserved. ReSound is a trademark of GN Hearing A/S. Apple, the Apple logo, iPhone, iPad and Siri are trademarks of Apple Inc., registered in the U.S. and other countries. Google Assistant are trademarks of Google LLC.
M20
1474
GB
-19.
05-R
ev.A
Worldwide HeadquartersGN Hearing A/SLautrupbjerg 7 DK-2750 BallerupDenmarkTel.: +45 4575 1111 resound.com
CVR no. 55082715