Independent School District No. 742 St. Cloud, Minnesota ... · St. Cloud, Minnesota Financial...
101
Independent School District No. 742 St. Cloud, Minnesota Financial Statements June 30, 2017
Transcript of Independent School District No. 742 St. Cloud, Minnesota ... · St. Cloud, Minnesota Financial...

Independent School District No. 742
St. Cloud, Minnesota
Financial Statements
June 30, 2017

Independent School District No. 742
Table of Contents
Board of Education and Administration 1
Independent Auditor's Report 2
Management's Discussion and Analysis 5
Basic Financial Statements
Government-Wide Financial Statements
Statement of Net Position 18
Statement of Activities 19
Fund Financial Statements
Balance Sheet – Governmental Funds 20
Reconciliation of the Balance Sheet to the Statement of Net Position– Government
Funds 23
Statement of Revenues, Expenditures, and Changes in Fund Balances –
Governmental Funds 24
Reconciliation of the Statement of Revenues, Expenditures, and Changes in Fund
Balances to the Statement of Activities – Governmental Funds 26
Statement of Revenues, Expenditures, and Changes in Fund Balances – Budget and
Actual – General Fund 27
Statement of Revenues, Expenditures, and Changes in Fund Balances – Budget and
Actual – Food Service Special Revenue Fund 28
Statement of Revenues, Expenditures, and Changes in Fund Balances – Budget and
Actual – Community Service Special Revenue Fund 29
Statement of Net Position – Proprietary Funds 30
Statement of Revenues, Expenses, and Changes in Fund Nets Position – Proprietary
Funds 31
Statement of Cash Flows – Proprietary Funds 32
Statement of Fiduciary Net Position 33
Statement of Changes in Fiduciary Net Position 33
Notes to Financial Statements 35
Required Supplementary Information
Schedule of Funding Progress – Other Post Employment Benefits 74
Schedule of Employer Contributions – OPEB 75
Schedule of District's and Non-Employer Proportionate Share of
Net Pension Liability General Employees Retirement Funds 76
Schedule of District's and Non-Employer Proportionate Share of
Net Pension Liability TRA Retirement Funds 76
Schedule of District Contributions General Employees Retirement Funds 77
Schedule of District Contributions TRA Retirement Funds 77
Notes to the Required Supplementary Information 78

Independent School District No. 742
Table of Contents
Supplementary Information
Combining Statement of Net Position – Internal Service Funds 82
Combining Statement of Revenues, Expenses, and Changes in Fund Net Position –
Internal Service Funds 83
Combining Statement of Cash Flows – Internal Service Funds 84
Uniform Financial Accounting and Reporting Standards Compliance Table 85
Schedule of Expenditures of Federal Awards 86
Notes to the Schedule of Expenditures of Federal Awards 87
Report on Internal Control over Financial Reporting and on Compliance and
Other Matters Based on an Audit of Financial Statements Performed in
Accordance with Government Auditing Standards 89
Report on Compliance for each Major Federal Program and on Internal Control
over Compliance Required by the Uniform Guidance 91
Schedule of Findings and Questioned Costs in Accordance
with the Uniform Guidance 94
Report in Legal Compliance 98

1
Independent School District No. 742
Board of Education and Administration
June 30, 2017
Board of Education Position Term Expires
Al Dahlgren Chairperson December 31, 2020
Jerry Von Korff Vice - Chairperson December 31, 2018
Jeff Pollreis Treasurer December 31, 2020
Bruce Mohs Clerk December 31, 2018
Bruce Hentges Director December 31, 2018
Shannon Haws Director December 31, 2020
Monica Segura-Schwartz Director December 31, 2020
Administration
Willie Jett II Superintendent
Amy Skaalerud, CPA Interim Executive Director
of Business Services
David Cooney Interim Controller

2
BerganKDV, Ltd. bergankdv.com
Independent Auditor's Report
To the School Board
Independent School District No. 742
St. Cloud, Minnesota
Report on the Financial Statements
We have audited the accompanying financial statements of the governmental activities, each
major fund, and the aggregate remaining fund information of Independent School District
No. 742, St. Cloud, Minnesota, as of and for the year ended June 30, 2017, and the related
notes to financial statements, which collectively comprise the District's basic financial
statements as listed in the Table of Contents.
Management's Responsibility for the Financial Statements
Management is responsible for the preparation and fair presentation of these financial
statements in accordance with accounting principles generally accepted in the United States
of America; this includes the design, implementation, and maintenance of internal control
relevant to the preparation and fair presentation of financial statements that are free from
material misstatement, whether due to fraud or error.
Auditor's Responsibility
Our responsibility is to express opinions on these financial statements based on our audit.
We conducted our audit in accordance with auditing standards generally accepted in the
United States of America and the standards applicable to financial audits contained in
Government Auditing Standards, issued by the Comptroller General of the United States.
Those standards require that we plan and perform the audit to obtain reasonable assurance
about whether the financial statements are free from material misstatement.
An audit involves performing procedures to obtain audit evidence about the amounts and
disclosures in the financial statements. The procedures selected depend on the auditor's
judgment, including the assessment of the risks of material misstatement of the financial
statements, whether due to fraud or error. In making those risk assessments, the auditor
considers internal control relevant to the District's preparation and fair presentation of the
financial statements in order to design audit procedures that are appropriate in the
circumstances, but not for the purpose of expressing an opinion on the effectiveness of the
District's internal control. Accordingly, we express no such opinion. An audit also includes
evaluating the appropriateness of accounting policies used and the reasonableness of
significant accounting estimates made by management, as well as evaluating the overall
presentation of the financial statements.
We believe that the audit evidence we have obtained is sufficient and appropriate to
provide a basis for our audit opinions.

3
Opinions
In our opinion, the financial statements referred to in the first paragraph present fairly, in all
material respects, the respective financial position of the governmental activities, each major
fund, and the aggregate remaining fund information of Independent School District No. 742,
St. Cloud, Minnesota, as of June 30, 2017, and the respective changes in financial position
and where applicable cash flows thereof, and the respective budgetary comparison for the
General Fund and each major special revenue fund for the year then ended in accordance
with accounting principles generally accepted in the United States of America.
Other Matters
Required Supplementary Information
Accounting principles generally accepted in the United States of America require that the
Management's Discussion and Analysis, which follows this report letter, and the Required
Supplementary Information as listed in the Table of Contents be presented to supplement the
basic financial statements. Such information, although not a part of the basic financial
statements, is required by Governmental Accounting Standards Board (GASB), who
considers it to be an essential part of financial reporting for placing the basic financial
statements in an appropriate operational, economic, or historical context. We have applied
certain limited procedures to the Required Supplementary Information in accordance with
auditing standards generally accepted in the United States of America, which consisted of
inquiries of management about the methods of preparing the information and comparing the
information for consistency with management's responses to our inquiries, the basic
financial statements and other knowledge we obtained during our audit of the basic financial
statements. We do not express an opinion or provide any assurance on the information
because the limited procedures do not provide us with sufficient evidence to express an
opinion or provide any assurance.
Other Information
Our audit was conducted for the purpose of forming opinions on the financial statements
that collectively comprise the District's basic financial statements. The accompanying
supplementary information identified in the Table of Contents is presented for purposes of
additional analysis and is not a required part of the financial statements. The accompanying
Schedule of Expenditures of Federal Awards is presented for purposes of additional analysis
as required by Title 2 U.S. Code of Federal Regulations (CFR) Part 200, Uniform
Administrative Requirements, Cost Principles, and Audit Requirements for Federal Awards,
and is also not a required part of the basic financial statements.

4
Other Matters (Continued)
Other Information (Continued)
The accompanying supplementary information identified in the Table of Contents and the
Schedule of Expenditures of Federal Awards are the responsibility of management and were
derived from and relate directly to, the underlying accounting and other records used to
prepare the basic financial statements. Such information has been subjected to the auditing
procedures applied in the audit of the basic financial statements and certain additional
procedures, including comparing and reconciling such information directly to the underlying
accounting and other records used to prepare the basic financial statements or to the basic
financial statements themselves, and other additional procedures in accordance with auditing
standards generally accepted in the United States of America. In our opinion, the
accompanying supplementary information and the Schedule of Expenditures of Federal
Awards are fairly stated, in all material respects in relation to the basic financial statements
as a whole.
Other Reporting Required by Government Auditing Standards
In accordance with Government Auditing Standards, we have also issued our report dated
November 6, 2017, on our consideration of the District's internal control over financial
reporting and our tests of its compliance with certain provisions of laws, regulations,
contracts and grant agreements and other matters. The purpose of that report is to describe
the scope of our testing of internal control over financial reporting and compliance and the
results of that testing, and not to provide an opinion on internal control over financial
reporting or on compliance. That report is an integral part of an audit performed in
accordance with Government Auditing Standards in considering the District's internal
control over financial reporting and compliance.
St. Cloud, Minnesota
November 6, 2017

5
Independent School District No. 742 Management's Discussion and Analysis
This section of Independent School District No. 742, St. Cloud Area Public Schools' annual financial
report presents our discussion and analysis of the District's financial performance during the fiscal year
that ended on June 30, 2017. Please read it in conjunction with the District's financial statements, which
immediately follow this section.
The Management's Discussion and Analysis (MD&A) is an element of the reporting model required by
GASB Statement No. 34 – Basic Financial Statements – and Management's Discussion and Analysis –
for State and Local Governments issued in June 1999. GASB Statement No. 34 establishes reporting
requirements that include financial statements, expanded disclosure, and supplemental information,
including the MD&A (this section).
Comparative information between the current fiscal year and the prior fiscal year is presented in the
MD&A.
FINANCIAL HIGHLIGHTS
Key financial highlights for the 2016-2017 fiscal year include the following:
• Net position decreased by $36,727,757. The entire decrease was in unrestricted net position due
to an increase in net pension liability which includes the District’s proportionate share of the
state’s TRA and PERA pension liability which is required to be recorded in accordance with
GASB reporting requirements.
• Overall revenues in governmental funds were $154,074,585 while overall expenditures in all
funds totaled $198,822,280.
• The restricted General Fund balance increased by $455,241 from $3,712,823 to $4,168,064. This
increase was primarily due to the addition of the reserve for long term facilities maintenance
which was previously recorded in another fund. This reserve balance at year end is $1,116,473,
however this amount is being offset by a decrease in the operating capital reserve of $817,310.
• The unassigned General Fund balance decreased by $3,870,235 from $12,101,333 to $8,231,098.
The amount unassigned for general purposes decreased $4,836,639 from $14,171,247 to
$9,334,878 as a result of increased spending. The remainder of the unassigned balance represents
the negative reserve for health and safety.
• The amount of bonded indebtedness increased $75,370,000 from $94,115,000 to
$169,485,000. The majority of this increase is due to the issuance of general obligation bonds
which will be used to finance the construction of a new Tech High School.
• Contracts with major bargaining groups expired on June 30, 2017, and are currently being
negotiated.

6
Independent School District No. 742
Management's Discussion and Analysis
OVERVIEW OF THE FINANCIAL STATEMENTS
The financial section of the annual report consists of four parts – Independent Auditor's Report; required
supplementary information, which includes the MD&A (this section); the basic financial statements and
the supplementary information. The basic financial statements include two kinds of statements that
present different views of the District:
• The first two statements are district-wide financial statements that provide both short-term and
long-term information about the District's overall financial status.
• The remaining statements are fund-financial statements that focus on individual parts of the
District, reporting the District's operations in more detail than the district-wide statements. There
are three types of these.
• The first type are governmental funds statements that tell how basic services such as regular and
special education were financed in the short-term as well as what remains for future spending.
• The second type is fiduciary funds statements which provide information about the financial
relationships in which the District acts solely as a trustee or agent for the benefit of others to
whom the resources belong.
• The third type is proprietary funds statements which provide information about activities the
District operates like a business. The District currently has two internal service funds that
account for the District's self-insured risks and other post employment benefits.
The financial statements also include notes that explain some of the information in the statements and
provide more detailed data. The diagram below shows how the various parts of this annual report is
arranged and related to one another.
Summary < ------------------------------------------- > Detail
Management's
Discussion and
Analysis
Basic
Financial
Statements
District-Wide
Financial
Statements
Fund
Financial
Statements
Notes to
Financial
Statements
Required
Supplementary
Information

7
Independent School District No. 742
Management's Discussion and Analysis
The major features of the District's financial statements, including the portion of the District's activities
they cover, and the types of information they contain, are summarized below. The remainder of the
overview section of the MD&A highlights the structure and content of each of the statements.
Fund Financial Statements
District-Wide
Statements
Governmental Funds Fiduciary Funds Proprietary
Funds
Scope
Entire District
(except
fiduciary funds)
The activities of the
District that is not
fiduciary, such as special
education and building
maintenance.
Instances in which
the District
administers
resources on
behalf of someone
else, such as
scholarship
programs and
student activities.
The activities the
District operates
like a business,
such as retiree
severance funds
and self-
insurance funds.
Required
Financial
Statements
• Statement of
Net Position
• Statement of
Activities
• Balance Sheet
• Statement of
Revenues,
Expenditures, and
Changes in Fund
Balances
• Statement of
Fiduciary
Position
• Statement of
Changes in
Fiduciary Net
Position
• Statement of
Net Position
• Statement of
Revenues,
Expenses,
and Changes
in Fund Net
Position
• Statement of
Cash Flows
Accounting Basis
and Measurement
Focus
Accrual
accounting and
economic
resources focus.
Modified accrual
accounting and current
financial focus.
Accrual
accounting and
economic
resources focus.
Accrual
accounting and
economic
resources focus.
Type of
Assets/Liability
Information
All assets and
liabilities, both
financial and
capital, short-
term and long-
term.
Generally assets
expected to be used up
and liabilities that come
due during the year or
soon thereafter; no
capital assets or long-
term liabilities included.
All assets and
liabilities, both
short-term and
long-term; funds
do not currently
contain capital
assets, although
they can.
All assets and
liabilities,
both financial
and capital,
and short-term
and long-term.
Type of
Inflow/Outflow
Information
All revenues and
expenses during
year, regardless
of when cash is
received or paid.
Revenues for which cash
is received during or
soon after the end of the
year; expenditures when
goods or services have
been received and the
related liability is due
and payable.
All additions and
deductions during
the year,
regardless of when
cash is received or
paid.
All revenues and
expenses
during year,
regardless
of when cash is
received or
paid.

8
Independent School District No. 742
Management's Discussion and Analysis
District-Wide Statements
The district-wide statements report information about the District as a whole using accounting methods
similar to those used by private-sector companies. The Statement of Net Position includes all of the
District's assets, deferred outflows of resources, liabilities, and deferred inflows of resources. All of the
current year's revenues and expenses are accounted for in the Statement of Activities regardless of when
cash is received or paid.
The two district-wide statements report the District's net position and how they have changed. Net
position, the difference between the District's assets, deferred outflows of resources, liabilities, and
deferred inflows of resources, is one way to measure the District's financial health or position.
• Over time, increases, or decreases in the District's net position is an indicator of whether its
financial position is improving or deteriorating, respectively.
• To assess the overall health of the District, you need to consider additional nonfinancial factors
such as changes in the District's property tax base and the condition of school buildings and other
facilities.
In the district-wide financial statements, the District's activities are shown in one category:
• Governmental Activities: Most of the District's basic services are included here, such as regular
and special education, transportation, administration, food service, and community education.
Property taxes and state aids finance most of these activities.
Fund Financial Statements
The fund financial statements provide more detailed information about the District's funds, focusing on
its most significant or "major" funds, not the District as a whole. Funds are accounting devices the
District uses to keep track of specific resources of funding and spending on particular programs:
• Some funds are required by state law and by bond covenants.
• The District establishes other funds to control and manage money for particular purposes (e.g.,
repaying its long-term debts) or to show that it is properly using certain revenues.
The District has three kinds of funds:
• Governmental Funds: Most of the District's basic services are included in governmental funds,
which generally focus on (1) how cash and other financial assets can readily be converted to cash
flow in and out and (2) the balances left at year-end that are available for spending. Consequently,
the governmental funds statements provide a detailed short-term view that helps to determine
whether there are more or fewer financial resources that can be spent in the near future to finance
the District's programs. Because this information does not encompass the additional long-term
focus of the district-wide statements, we provide additional information following the
governmental funds statements that explains the relationship (or differences) between them.

9
Independent School District No. 742
Management's Discussion and Analysis
Fund Financial Statements
• Proprietary Funds: The District uses Internal Service Funds to account for operations of the
District's self-insured Dental Insurance plan and to account for its OPEB benefits. The activities of
these funds are reported in a separate Statement of Net Position, Statement of Revenues, Expenses,
and changes in Fund Net Position, and Statement of Cash Flows. This activity is also included in
the Government-Wide Statement of Net Position and Statement of Activities.
• Fiduciary Funds: The District is the trustee, or fiduciary, for assets that belong to others. The
District is responsible for ensuring that the assets reported in these funds are used only by those to
whom the assets belong. The District's fiduciary activities (consisting of an Agency Fund and a
Private Purpose Trust Fund held for others) are reported in a separate Statement of Fiduciary Net
Position. We exclude these activities from the district-wide financial statements because the District
cannot use these assets to finance its operations.
FINANCIAL ANALYSIS OF THE DISTRICT AS A WHOLE (DISTRICT-WIDE FINANCIAL
STATEMENTS)
Net Position
The District's combined net position was ($24,141,139) on June 30, 2017 (see details in Table A-1).
This was a decrease of $36,727,757 from $12,586,618 at June 30, 2016.
Table A-1
2017 2016
Assets
Current and other assets 202,867,887$ 115,713,047$
Capital assets 151,190,011 132,359,618
Total assets 354,057,898$ 248,072,665$
Deferred Outflows of Resources 181,433,498$ 16,553,517$
Liabilities
Long-term liabilities 494,101,501$ 170,415,834$
Other liabilities 33,066,200 47,883,850
Total liabilities 527,167,701$ 218,299,684$
Deferred Inflows of Resources 32,464,834$ 33,739,880$
Net Position
Net investment in capital assets 61,003,661$ 60,777,747$
Restricted 10,677,806 6,191,701
Unrestricted (95,822,606) (54,382,830)
Total net position (24,141,139)$ 12,586,618$
Condensed Statement of Net Position

10
Independent School District No. 742
Management's Discussion and Analysis
Change in Net Position
The District's expenses were greater than revenues for the year ended June 30, 2017. A summary of the
revenues and expenses is presented in Table A-2 below.
Table A-2
2017 2016
Revenues
Program revenues
Charges for services 3,969,732$ 3,944,267$
Operating grants and contributions 59,928,805 56,551,964
Capital grants and contributions 4,173,194 1,793,810
General revenues
Property taxes 26,357,702 26,275,990
Aids and payments from the state 64,251,436 60,722,628
Other sources 1,273,794 3,068,253
Total revenues 159,954,663$ 152,356,912$
Expenses
Administration 7,679,828$ 5,317,470$
District support services 3,302,755 2,857,184
Elementary and secondary regular instruction 77,395,949 53,740,797
Vocational instruction 1,808,611 1,205,210
Special education instruction 44,647,664 29,696,930
Instructional support services 15,733,088 12,349,387
Pupil support services 13,352,137 11,298,899
Sites, buildings and equipment 9,843,852 10,441,132
Fiscal and other fixed cost programs 261,808 252,946
Food service 5,966,306 5,742,292
Community education and services 6,866,679 5,362,513
Unallocated depreciation 4,635,707 3,776,528
Interest and fiscal charges - long-term debt 5,532,062 3,449,203
Total expenses 197,026,446 145,490,491
Change in net position (37,071,783) 6,866,421
Net Position
Beginning, as previously stated 12,586,618 5,720,197
Prior period adjustment 344,026 -
Beginning, as restated 12,930,644 5,720,197
Ending (24,141,139)$ 12,586,618$

11
Independent School District No. 742
Management's Discussion and Analysis
The District's total revenue of $159,954,663 consist of program revenues of $68,071,731 up from
$62,290,041 in 2016; property taxes of $26,357,702 up slightly from $26,275,990 in 2016; aid and
payments from the state of $64,251,436 up from $60,722,628 in 2016 and $1,273,794 from
miscellaneous other sources down from $3,068,253 in 2016.
There were a number of significant changes in revenue from 2016 to 2017, with revenue increasing in
every category except revenue from other sources.
The increase in program revenues is primarily due to an increase in operating grants and contributions in
a number of programs. The largest increase was in operating grants and contributions for elementary and
regular instruction which is primarily due to increases in state compensatory revenue. Operating grants
and contributions for community education and food services increased due to increases in state aid and
federal meal reimbursements, respectively.
Revenue from property taxes did not change significantly from 2016 to 2017. The decrease in revenue
from other sources is due to proceeds that were received in the prior year from the sale of the Colts
Academy building.
Revenue from state aid is largely driven by student enrollment, and the largest single source of funding
for the District is state aid called general education revenue. General education revenue provides the
base funding and represents a per pupil unit funding amount multiplied by adjusted marginal cost pupil
units (referred to here as student enrollment). The increase in state aid from 2016 to 2017 is primarily
due to an increase in the per pupil formula allowance.
Program
Revenues
43%
Property Taxes
16%
State Aid -
General
40%
Other Sources
1%
2016-17 Revenues - Table A-3

12
Independent School District No. 742
Management's Discussion and Analysis
The District's total expenses of $197,026,446 consisted mainly of costs for instructional services
(regular, vocational, and special instruction) of $123,852,224 up from $84,642,937 in 2016. Other areas
of cost included: support services (district, administrative, instructional and pupil) of $40,067,808 up
from $31,822,940 in 2016; site, buildings, and equipment (including unallocated depreciation) of
$14,479,559 up from $14,217,660 in 2016; fiscal and other fixed cost programs of $261,808 up from
$252,946 in 2016; food service of $5,966,306 up from $5,742,292 in 2016; community education and
services of $6,866,679 up from $5,362,513 in 2016; interest and fiscal charges on long-term debt of
$5,532,063 up from $3,449,203 in 2016.
The majority of District expenditures in operating areas are for human resources. Salary and benefits
make up approximately 76% of total expenditures. Many of the other operational costs are fixed
costs, such as utilities and core supplies.
Fiscal and Fixed
Costs
less than 1%Food Service
3%
Community
Service
4%
Interest and Fiscal
Charges on Long-
Term Debt
3%
Instructional
Services
63%Support Services
20%
Site, Building, and
Equipment
7%
2016-17 Expenses - Table A-4

13
Independent School District No. 742
Management's Discussion and Analysis
The net cost of governmental activities is their total cost less program revenues applicable to each
category. Table A-5 presents these costs. Note that site, building, and equipment expenses include
unallocated depreciation expense.
Table A-5
2017 2016 2017 2016
Administration 7,680$ 5,317$ 7,426$ 5,227$
District support services 3,303 2,857 3,303 2,857
Elementary and secondary
regular instruction 77,396 53,741 51,807 30,026
Vocational instruction 1,808 1,205 1,773 1,138
Special education instruction 44,648 29,697 24,720 10,181
Instructional support services 15,733 12,349 12,947 9,835
Pupil support services 13,352 11,299 8,862 6,806
Sites, buildings and equipment 14,479 14,218 10,148 12,267
Fiscal and other fixed-cost
program 262 253 262 253
Food service 5,966 5,742 140 111
Community education and
services 6,867 5,363 2,035 1,050
Interest and fiscal charge
long-term debt 5,532 3,449 5,532 3,449
Total expenses 197,026$ 145,490$ 128,955$ 83,200$
Net Cost of Governmental Activities
(in Thousands of Dollars)
of Services
Total Cost Net Cost
of Services
Fund Balance
The financial performance of the District as a whole is reflected in its governmental funds. As the
District completed the year, its governmental funds reported a combined fund balance of $147,687,987.
This is up $83,092,532 from the June 30, 2016 combined fund balance total which was $64,595,455.
This increase was due to the Building Construction balance increasing $104,985,944 from $18,873,146
in 2016 to $123,859,090 in 2017. This is a result of the District issuing bonds to fund the construction of
a new Tech High School. This increase in Building Construction was offset by a decrease in the Debt
Service fund balance of $21,485,162 due to the District repaying the 2007A School Building Bonds in
2017 using proceeds from crossover refunding bonds which were issued the previous year. The fund
balance in the General Fund decreased $863,590 from a balance of $21,834,195 at June 30, 2016 to
$20,970,605 at June 30, 2017, due to a budgeted spend down of fund balance as well as decreased
enrollment. The Food Service Fund had a slight decrease in fund balance and the Community Service
Fund had an increase in fund balance from June 30, 2016 to June 30, 2017.

14
Independent School District No. 742
Management's Discussion and Analysis
Revenues and Expenditures
Revenues of the District's governmental funds totaled $154,074,585 while total expenditures were
$198,822,280. A summary of the revenues and expenditures reported on the governmental fund financial
statements appear in Table A-6 below.
Table A-6
Other Fund Balance
Financing Increase
Revenue Expenditures Sources (Uses) (Decrease)
General 135,082,106$ 138,392,174$ 2,446,478$ (863,590)$
Food service 5,836,466 5,839,057 - (2,591)
Community service 6,186,854 5,728,923 - 457,931
Capital projects 42,374 20,450,179 125,393,749 104,985,944
Debt service 6,926,785 28,411,947 - (21,485,162)
Total 154,074,585$ 198,822,280$ 127,840,227$ 83,092,532$
FINANCIAL ANALYSIS OF THE DISTRICT'S FUNDS
Budgetary Highlights
During the year ended June 30, 2017, the District revised its operating budget one time. The original
budget was adopted in June 2016 (a budget must be in place prior to the beginning of the fiscal year on
July 1). The final budget was adopted in June 2017.
Significant changes between original budget and final budget: The revised budget was modified from
the original budget to reflect the following changes:
• The budgets for state and federal grant revenues and expenditures were increased as a result of
grant awards being higher than originally anticipated.
• The budget for general fund state aids was amended to adjust for a decline in revenue as a result
of decreased enrollment.
• The revenue and expenditure budgets for the general fund were amended to account for TRA and
PERA state aid revenue and expense as required by GASB 68 which was not included in the
original budget.
• The budget for building construction fund revenue was amended to account for bonds that were
issued during the year that were not included in the original budget. The expenditure budget for
the building construction fund was revised as well to account for the current year construction
costs for these projects.
• Amendments were made in the budgeted expenditures for all programs to account for operational
changes throughout the fiscal year. These include changes in the amount of grant funding
received for various programs as well as budget increases for construction projects, new textbook
adoption, and health insurance as authorized by the Board.

15
Independent School District No. 742
Management's Discussion and Analysis
Variances from Final Budget to Actual
The District's final General Fund budget anticipated that expenditures would exceed revenues by
$7,001,687. The actual result was $3,310,068 excess of expenditures over revenues. General Fund
revenues were under budget by $741,186, or 0.5%. General Fund expenditures were under budget by
$4,432,805 or 3.1%. The primary reason for the variances is due to the TRA and PERA pension state aid
revenue and expense being $1,045,000 less than budget. In addition, there were approximately
$1,625,000 in construction and other expenditures that were budgeted to be spent during the year that
will be spent in the following year due to timing of projects and other purchases.
CAPITAL ASSET AND DEBT ADMINISTRATION
Capital Assets
Additions totaling $42,243,655 consisted primarily of building construction and remodeling projects,
HVAC and other improvement projects, site improvements, vehicles, and equipment. Disposals and
adjustments totaling $18,352,242 consisted of the items sold at the District's annual auction, the trade-in
of vehicles and other equipment, the removal of obsolete equipment, and the reclassification of prior
year construction in progress. Detailed information related to the District's capital assets can be found in
Note 4.
Long-Term Liabilities
At year-end the District had $212,196,273 of long-term liabilities. This consisted of bonded
indebtedness of $169,485,000, certificates of participation of $28,993,333, unamortized bond premiums
of $10,842,705 and compensated absences of $2,875,235. This is an increase of $98,936,439 from
June 30, 2016. This increase is primarily due to the issuance of general obligation bonds that were
issued to fund the construction of a new Tech High School. More detailed information regarding long-
term liabilities can be found in Note 5.
FACTORS BEARING ON THE DISTRICT'S FUTURE
At the time these financial statements were prepared and audited, the District was aware of the following
existing conditions that could significantly affect its financial health in the future:
• Minnesota school districts are paid based on pupil units served, a decline in enrollment results in
less revenue being received for operations. The District's enrollment has become relatively stable
although the District did see a decrease in enrollment in 2017. The District is not currently
expecting a significant increase or decrease in enrollment into the future. The District's average
daily membership (ADM) served for the past five years is shown in Table A-7 on the following
page.

16
Independent School District No. 742
Management's Discussion and Analysis
• The political and economic environment of the State of Minnesota could have a significant effect
on future finances. The State Legislature sets the amount of revenue from aids and levies that
Minnesota school districts will receive. The State regularly faces large budget deficits and since
K-12 education accounts for about 40% of State spending, the future revenues of the District and
other Minnesota school districts is unknown and unstable.
• Negotiated agreements with all employee groups expired on June 30, 2017. Negotiations on new
contracts for July 1, 2017 through June 30, 2019, are currently in process. Negotiations on these
contracts will impact future budget periods.
CONTACTING THE DISTRICT'S FINANCIAL MANAGEMENT
This financial report is designed to provide the District's citizens, taxpayers, customers, and investors
and creditors with a general overview of the District's finances and to demonstrate the District's
accountability for the money it receives. If you have questions about this report or need additional
financial information, contact Amy Skaalerud, CPA, Interim Executive Director of Business Services, at
the District Administration Office, Independent School District No. 742, 1000 44th Ave. N. Suite 100,
St. Cloud, Minnesota 56303.
9,500
9,700
9,900
10,100
10,300
10,500
10,700
Fiscal Year
2013
Fiscal Year
2014
Fiscal Year
2015
Fiscal Year
2016
Fiscal Year
2017
Enrollment Table A-7
ADMs

17
BASIC FINANCIAL STATEMENTS

Independent School District No. 742
Statement of Net Position
June 30, 2017
Governmental
Activities
Assets
Current assets
Cash and investments
(including cash equivalents) 153,526,016$
Cash with fiscal agent 17,705,719
Current property taxes receivable 14,626,302
Delinquent property taxes receivable 249,864
Accounts receivable 131,748
Interest receivable 63,289
Due from Department of Education 11,374,925
Due from other Minnesota school districts 478,771
Due from Federal Government through Department of Education 2,228,544
Due from federal - direct 40,120
Due from other governmental units 153,531
Inventory 103,214
Prepaid items 360,507
Total current assets 201,042,550
Noncurrent assets
Net other post employment benefits (OPEB) asset 1,825,337
Capital assets not being depreciated
Land 5,279,872
Construction in progress 12,568,808
Capital assets, net of accumulated depreciation
Land improvements 10,232,463
Buildings and building improvements 186,862,383
Furniture and equipment 11,130,316
Vehicles 4,199,563
Less accumulated depreciation (79,083,394)
Total capital assets, net of accumulated depreciation 151,190,011
Total noncurrent assets 153,015,348
Total assets 354,057,898
Deferred Outflows of Resources
Deferred outflows of resources related to pensions 181,433,498
Total assets and deferred outflows of resources 535,491,396$
Liabilities
Current liabilities
Accounts and contracts payable 8,204,749$
Salaries, benefits, severance and compensated absences payable 12,731,396
Accrued interest payable 2,689,682
Due to other Minnesota school districts 319,593
Unearned revenue 88,697
Long term liabilities due within one year 9,032,083
Total current liabilities 33,066,200
Noncurrent liabilities
Bond principal payable, net of premiums 179,110,665
Certificates of indebtedness, net of premiums 30,210,373
Compensated absences payable 2,875,235
Net pension liability 290,937,311
Less amount due within one year (9,032,083)
Total noncurrent liabilities 494,101,501
Total liabilities 527,167,701
Deferred Inflows of Resources
Property taxes levied for subsequent year's expenditures 29,572,610
Deferred inflows of resources related to pensions 2,892,224
Total deferred inflows of resources 32,464,834
Net Position
Net investment in capital assets 61,003,661
Restricted for
Capital asset acquisition 7,223,258
Food service 484,090
Community service 1,301,250
Other purposes 1,669,208
Unrestricted (95,822,606)
Total net position (24,141,139)
Total liabilities, deferred inflows of resources, and net position 535,491,396$
See notes to financial statements. 18

Net (Expense)
Revenues and
Changes in
Net Position
Expenses
Charges for
Services
Operating
Grants and
Contributions
Capital Grants
and
Contributions
Governmental
Activities
Governmental activities
Administration 7,679,828$ -$ 253,354$ -$ (7,426,474)$
District support services 3,302,755 - - - (3,302,755)
Elementary and secondary regular instruction 77,395,949 408,055 25,162,380 18,838 (51,806,676)
Vocational education instruction 1,808,611 - 35,696 - (1,772,915)
Special education instruction 44,647,664 1,182,257 18,745,615 - (24,719,792)
Instructional support services 15,733,088 - 2,785,699 - (12,947,389)
Pupil support services 13,352,137 - 4,489,896 - (8,862,241)
Sites and buildings 9,843,852 177,513 - 4,154,356 (5,511,983)
Fiscal and other fixed cost programs 261,808 - - - (261,808)
Food service 5,966,306 1,273,475 4,552,809 - (140,022)
Community education and services 6,866,679 928,432 3,903,356 - (2,034,891)
Unallocated depreciation 4,635,707 - - - (4,635,707)
Interest and fiscal charges on long-term debt 5,532,063 - - - (5,532,063)
Total governmental activities 197,026,446$ 3,969,732$ 59,928,805$ 4,173,194$ (128,954,715)
General revenues
Taxes
Property taxes, levied for general purposes 18,824,306
Property taxes, levied for community service 1,264,072
Property taxes, levied for debt service 6,269,324
State aid-formula grants 64,251,436
Other general revenues 823,899
Investment income 449,895
Total general revenues 91,882,932
Change in net position (37,071,783)
Net position - beginning 12,586,618
Prior period adjustment 344,026
Net position - beginning, restated 12,930,644
Net position - ending (24,141,139)$
19 See notes to financial statements.
Functions/Programs
Independent School District No. 742
Statement of Activities
Year Ended June 30, 2017
Program Revenues

General Food Service
Assets
Cash and investments 26,614,963$ 391,213$
Cash with fiscal agent - -
Current property taxes receivable 8,008,981 -
Delinquent property taxes receivable 188,979 -
Accounts receivable 122,852 -
Interest receivable - -
Due from Department of Education 10,933,638 198
Due from Federal Government
through Department of Education 1,965,276 170,802
Due from Federal - direct 40,120 -
Due from other Minnesota school districts 478,771 -
Due from other governmental units 153,531 -
Due from other funds 1,650,595 -
Inventory 35,842 67,372
Prepaid items 358,027 2,165
Total assets 50,551,575$ 631,750$
Liabilities
Accounts and contracts payable 1,504,467$ 38,478$
Salaries, benefits, severance and
compensated absences payable 12,236,176 20,485
Due to other Minnesota school districts 97,813 -
Unearned revenue - 88,697
Total liabilities 13,838,456 147,660
Deferred Inflows of Resources
Unavailable revenue - delinquent property taxes 188,979 -
Property taxes levied for subsequent year's expenditures 15,553,535 -
Total deferred inflows of resources 15,742,514 -
Fund Balances
Nonspendable 393,869 69,537
Restricted 4,168,064 414,553
Assigned 8,177,574 -
Unassigned 8,231,098 -
Total fund balances 20,970,605 484,090
Total liabilities, deferred inflows of resources, and fund balance 50,551,575$ 631,750$
See notes to financial statements. 20
Balance Sheet - Governmental Funds
June 30, 2017

Community
Service
Building
Construction Debt Service
Total
Governmental
Funds
2,231,921$ 111,295,780$ 7,765,619$ 148,299,496$
- 17,705,719 - 17,705,719
602,444 - 6,014,877 14,626,302
12,690 - 48,195 249,864
8,896 - - 131,748
- 10,578 - 10,578
393,169 - 47,920 11,374,925
92,466 - - 2,228,544
- - - 40,120
- - - 478,771
- - - 153,531
- - - 1,650,595
- - - 103,214
315 - - 360,507
3,341,901$ 129,012,077$ 13,876,611$ 197,413,914$
67,835$ 5,152,987$ -$ 6,763,767$
474,735 - - 12,731,396
221,780 - - 319,593
- - - 88,697
764,350 5,152,987 - 19,903,453
12,690 - 48,195 249,864
1,276,301 - 12,742,774 29,572,610
1,288,991 - 12,790,969 29,822,474
315 - - 463,721
1,288,245 123,859,090 1,085,642 130,815,594
- - - 8,177,574
- - - 8,231,098
1,288,560 123,859,090 1,085,642 147,687,987
3,341,901$ 129,012,077$ 13,876,611$ 197,413,914$
21

22
(THIS PAGE LEFT BLANK INTENTIONALLY)

Reconciliation of the Balance Sheet to
the Statement of Net Position - Governmental Funds
June 30, 2017
Total fund balance - governmental funds 147,687,987$
Cost of capital assets 230,273,405
Less accumulated depreciation (79,083,394)
Long-term liabilities, including bonds payable, are not due and payable in
the current period and, therefore, are not reported as liabilities in the funds.
Long-term liabilities at year-end consist of:
Bonds payable, net of premiums (179,110,665)
Certificates of participation payable, net of premiums (30,210,373)
Compensated absences payable (2,875,235)
Net pension liability (290,937,311)
Deferred outflows of resources and deferred inflows of resources are created
as a result of various differences related to pensions that are not recognized in the
governmental funds.
Deferred outflows of resources related to pensions 181,433,498
Deferred inflows of resources related to pensions (2,892,224)
Delinquent property taxes receivables will be collected in subsequent years,
but are not available soon enough to pay for the current period's expenditures
and, therefore, are deferred in the funds. 249,864
Governmental funds do not report a liability for accrued interest on bonds payable
until due and payable. (2,689,682)
Governmental funds do not report an asset for net OPEB obligations. Since the
District's annual contribution was greater than its required contribution, the
obligation is shown as an asset. 1,825,337
The OPEB internal service fund is used to charge the benefits to the fund that
incurs the cost. This amount represents assets available to fund the OPEB liability.
These assets are included with governmental activities. 981,891
The health and dental insurance internal service funds are used by the district to charge
the cost of health and dental insurance employee premiums and claims to the individual
funds. The assets and liabilities of these internal service funds are included with
governmental activities. 1,205,763
(24,141,139)$
See notes to financial statements. 23
Total net position - governmental activities
Amounts reported for governmental activities in the Statement of Net Position
are different because:
Capital assets used in governmental activities are not current financial resources and, therefore,
are not reported as assets in governmental funds.

General Food Service
Community
Service
Revenues
Local property taxes 18,856,568$ -$ 1,265,932$
Other local and county revenues 3,177,942 11,649 1,020,185
Revenue from state sources 107,145,427 253,581 3,765,949
Revenue from federal sources 5,902,169 4,297,761 134,788
Sales and other conversion of assets - 1,273,475 -
Total revenues 135,082,106 5,836,466 6,186,854
Expenditures
Current
Administration 5,502,478 - -
District support services 3,045,979 - -
Elementary and secondary regular
instruction 54,504,211 - -
Vocational education instruction 1,302,273 - -
Special education instruction 32,775,513 - -
Instructional support services 11,826,804 - -
Pupil support services 11,437,721 - 148,597
Sites and buildings 12,932,650 - -
Fiscal and other fixed cost programs 261,808 - -
Food service - 5,740,206 -
Community education and services - - 5,528,443
Capital outlay
Administration 9,812 - -
District support services 61,300 - -
Elementary and secondary regular
instruction 429,270 - -
Special education instruction 167,976 - -
Instructional support services 1,629,083 - -
Pupil support services 12,966 - 3,753
Sites and buildings 1,309,035 - -
Food service - 98,851 -
Community education and services - - 48,130
Debt service
Principal 795,000 - -
Interest and fiscal charges 388,295 - -
Total expenditures 138,392,174 5,839,057 5,728,923
Excess of revenues over
(under) expenditures (3,310,068) (2,591) 457,931
Other Financing Sources (Uses)
Bond issuance - - -
Bond premium - - -
Insurance recoveries 2,446,478 - -
Total other financing sources (uses) 2,446,478 - -
Net change in fund balances (863,590) (2,591) 457,931
Fund Balances
Beginning of year 21,834,195 142,655 830,629
Prior period adjustment - 344,026 -
Beginning of year, restated 21,834,195 486,681 830,629
End of year 20,970,605$ 484,090$ 1,288,560$
See notes to financial statements. 24
Statement of Revenues, Expenditures, and
Changes in Fund Balances - Governmental Funds
Year Ended June 30, 2017

Building
Construction Debt Service
Total
Governmental
Funds
-$ 6,262,659$ 26,385,159$
42,374 184,928 4,437,078
- 479,198 111,644,155
- - 10,334,718
- - 1,273,475
42,374 6,926,785 154,074,585
- - 5,502,478
- - 3,045,979
- - 54,504,211
- - 1,302,273
- - 32,775,513
- - 11,826,804
- - 11,586,318
- - 12,932,650
- - 261,808
- - 5,740,206
- - 5,528,443
- - 9,812
- - 61,300
- - 429,270
- - 167,976
- - 1,629,083
- - 16,719
19,490,999 - 20,800,034
- - 98,851
- - 48,130
- 24,995,000 25,790,000
959,180 3,416,947 4,764,422
20,450,179 28,411,947 198,822,280
(20,407,805) (21,485,162) (44,747,695)
117,275,000 - 117,275,000
8,118,749 - 8,118,749
- - 2,446,478
125,393,749 - 127,840,227
104,985,944 (21,485,162) 83,092,532
18,873,146 22,570,804 64,251,429
- - 344,026
18,873,146 22,570,804 64,595,455
123,859,090$ 1,085,642$ 147,687,987$
25

Reconciliation of Revenues, Expenditures, and
Changes in Fund Balances - Governmental Funds
Year Ended June 30, 2017
83,092,532$
Capital outlays are reported in governmental funds as expenditures. However,
in the Statement of Activities, the cost of those assets is allocated over the
estimated useful lives as depreciation expense.
Capital outlays 25,006,141
Depreciation expense (5,920,796)
Net disposals (66,956)
Compensated absences are recognized as paid in the governmental funds but
recognized as the expense is incurred in the Statement of Activities. 448,471
Governmental funds recognized pension contributions as expenditures at the time of payment
whereas the Statement of Activities factors in items related to pensions on a full accrual
perspective. (35,819,196)
Principal payments on long-term debt are recognized as expenditures in the
governmental funds but as an increase in the net position in the Statement of Activities. 25,790,000
Proceeds from long-term debt are recognized as other financing sources,
increasing fund balance in the governmental fund statements, but have no effect
on net position in the Statements of Activities. (117,275,000)
Interest on long-term debt in the Statement of Activities differs from the amount
reported in the governmental funds because interest is recognized as an
expenditure in the funds when it is due and thus requires use of current
financial resources. In the Statement of Activities, however, interest expense is
recognized as the interest accrues, regardless of when it is due. (986,480)
Governmental funds report debt issuance premiums and discounts as an other financing
source or use at the time of issuance. Premiums and discounts are reported as an
unamortized asset or liability in the government-wide financial statements.
Issuance of Bond Premium (8,118,749)
Amortization of Bond Premium 218,839
Net OPEB obligations are recognized as paid in the governmental
funds but recognized as the expense is incurred in the Statement of Activities.
The District's obligation exceeded its contribution, therefore, net position is decreased. (438,900)
The change in net position of the internal service funds is reported with governmental activities. (2,974,232)
Delinquent property taxes receivable will be collected in subsequent years,
but are not available soon enough to pay for the current period's
expenditures and, therefore, are deferred in the funds. (27,457)
(37,071,783)$
See notes to financial statements. 26
Change in net position - governmental activities
Total net change in fund balances - governmental funds
Amounts reported for governmental activities in the Statement of Activities are different because:

Independent School District No. 742
Statement of Revenues, Expenditures, and
Changes in Fund Balances -
Budget and Actual - General Fund
Year Ended June 30, 2017
Actual
Original Final Amounts
Revenues
Local property taxes 18,755,025$ 18,755,025$ 18,856,568$ 101,543$
Other local and county revenues 3,624,158 2,787,141 3,177,942 390,801
Revenue from state sources 109,092,329 108,211,641 107,145,427 (1,066,214)
Revenue from federal sources 5,382,000 6,069,485 5,902,169 (167,316)
Total revenues 136,853,512 135,823,292 135,082,106 (741,186)
Expenditures
Current
Administration 5,631,136 5,852,838 5,502,478 (350,360)
District support services 2,846,700 2,976,995 3,045,979 68,984
Elementary and secondary regular
instruction 54,641,364 55,353,489 54,504,211 (849,278)
Vocational education instruction 884,491 915,182 1,302,273 387,091
Special education instruction 32,671,727 32,974,594 32,775,513 (199,081)
Instructional support services 12,268,627 13,042,887 11,826,804 (1,216,083)
Pupil support services 11,634,461 11,727,841 11,437,721 (290,120)
Sites and buildings 13,968,168 13,980,862 12,932,650 (1,048,212)
Fiscal and other fixed cost programs 265,000 265,000 261,808 (3,192)
Capital outlay
Administration 7,000 6,000 9,812 3,812
District support services 108,815 135,117 61,300 (73,817)
Elementary and secondary regular
instruction 225,454 505,661 429,270 (76,391)
Special education instruction 146,390 145,925 167,976 22,051
Instructional support services 1,635,632 1,796,196 1,629,083 (167,113)
Pupil support services 305,830 305,942 12,966 (292,976)
Sites and buildings 250,000 1,655,202 1,309,035 (346,167)
Debt service
Principal 818,515 818,515 795,000 (23,515)
Interest and fiscal charges 370,385 366,733 388,295 21,562
Total expenditures 138,679,695 142,824,979 138,392,174 (4,432,805)
Excess of revenues over
(under) expenditures (1,826,183) (7,001,687) (3,310,068) 3,691,619
Other Financing Sources
Insurance recoveries - - 2,446,478 2,446,478
Net change in fund balances (1,826,183)$ (7,001,687)$ (863,590) 6,138,097$
Fund Balances
Beginning of year 21,834,195
Ending of year 20,970,605$
See notes to financial statements. 27
Budgeted Amounts
Variance with
Final Budget -
Over (Under)

Independent School District No. 742
Statement of Revenues, Expenditures, and
Changes in Fund Balances -
Budget and Actual - Food Service Special Revenue Fund
Year Ended June 30, 2017
Actual
Original Final Amounts
Revenues
Other local and county revenues 5,000$ 5,000$ 11,649$ 6,649$
Revenue from state sources 255,000 255,000 253,581 (1,419)
Revenue from federal sources 3,903,000 4,051,332 4,297,761 246,429
Sales and other conversion of assets 1,444,000 1,444,000 1,273,475 (170,525)
Total revenues 5,607,000 5,755,332 5,836,466 81,134
Expenditures
Current
Food service 5,600,244 5,733,974 5,740,206 6,232
Capital outlay
Food service - 14,602 98,851 84,249
Total expenditures 5,600,244 5,748,576 5,839,057 90,481
Excess of revenues over(under) expenditures 6,756$ 6,756$ (2,591) (9,347)$
Fund balances
Beginning of year 142,655
Prior period adjustment 344,026
Beginning of year, restated 486,681
Ending of year 484,090$
See notes to financial statements. 28
Budgeted Amounts
Variance
with Final
Budget -
Over (Under)

Statement of Revenues, Expenditures, and
Changes in Fund Balances -
Budget and Actual - Community Service Special Revenue Fund
Year Ended June 30, 2017
Actual
Original Final Amounts
Revenues
Local property taxes 1,265,932$ 1,265,932$ 1,265,932$ -$
Other local and county revenues 948,350 948,350 1,020,185 71,835
Revenue from state sources 3,766,010 3,766,010 3,765,949 (61)
Revenue from federal sources 125,000 125,000 134,788 9,788
Total revenues 6,105,292 6,105,292 6,186,854 81,562
Expenditures
Current
Pupil support services 157,906 153,906 148,597 (5,309)
Community education and services 5,967,208 5,943,008 5,528,443 (414,565)
Capital outlay
Pupil support services - 4,000 3,753 (247)
Community education and services 26,000 74,981 48,130 (26,851)
Total expenditures 6,151,114 6,175,895 5,728,923 (446,972)
Excess of revenues over (under) expenditures (45,822)$ (70,603)$ 457,931 528,534$
Fund Balances
Beginning of year 830,629
Ending of year 1,288,560$
See notes to financial statements. 29
Budgeted Amounts
Variance with
Final Budget -
Over (Under)

Total Internal
Service Funds
Assets
Cash and cash equivalents 5,226,520$
Due from other funds 2,254,831
Interest receivable 52,711
Total assets 7,534,062$
Liabilities
Insurance claims payable 1,440,982$
Due to other funds 3,905,426
Total liabilities 5,346,408
Net Position
Unrestricted 2,187,654
Total liabilities and net position 7,534,062$
See notes to financial statements. 30
Independent School District No. 742
Statement of Net Position - Proprietary Funds
As of June 30, 2017

Total Internal
Service Funds
Operating Revenue
Charges for services 16,612,608$
Retiree contributions 367,909
Total revenues 16,980,517
Operating Expenses
Insurance claims 15,660,264
Insurance premiums 4,197,734
Depreciation expense 7,833
Total operating expenses 19,865,831
Operating loss (2,885,314)
Nonoperating Revenue/Expenses
Investment income 91,245
Loss on disposal of assets (180,163)
Total nonoperating revenue/(expenses) (88,918)
Change in net position (2,974,232)
Net Position
Beginning of year 5,161,886
End of year 2,187,654$
See notes to financial statements. 31
Statement of Revenues, Expenses, and Changes
in Fund Net Position - Proprietary Funds
Year Ended June 30, 2017

Total Internal
Service Funds
Cash Flows - Operating Activities
Employee insurance deductions
received from other funds 14,357,777$
Receipts from retirees 367,909
Insurance claims paid (15,749,680)
Insurance premiums paid (367,909)
Net cash flows - operating activities (1,391,903)
Cash Flows - Noncapital Financing Activities
Amounts borrowed from other funds 75,601
Cash Flows - Investing Activities
Interest received 79,848
Net change in cash and cash equivalents (1,236,454)
Cash and Cash Equivalents
Beginning of year 6,462,974
End of year 5,226,520$
Reconciliation of Operating
Income to Net Cash Flows-
Operating Activities
Operating income (loss) (2,885,314)$
Adjustments to reconcile operating income
to net cash flows - operating activities
Depreciation expense 7,833
Change in due from other funds (2,254,831)
Change in insurance claims payable (89,416)
Change in due to other funds 3,829,825
Net cash flows - operating activities (1,391,903)$
Noncash Transactions
Loss on disposal of capital assets 180,163$
See notes to financial Statements. 32
Independent School District No. 742
Statement of Cash Flows - Proprietary Funds
Year Ended June 30, 2017

Independent School District No. 742
Statement of Fiduciary Net Position
Year Ended June 30, 2017
Agency Fund Trust Fund
Assets
Cash and investments $ 961,730 $ 242,350
Liabilities
Accounts payable $ 182 $ 853
Salaries payables 2,738 -
Due to other Minnesota school districts 958,810 -
Total liabilities $ 961,730 853
Net Position
Held in trust for scholarships 241,497$
Trust Fund
Additions
Contributions 73,338$
Investment income 524
Total additions 73,862
Deductions
Scholarships 158,190
Supplies 17,190
Consulting and contracts 634
Total deductions 176,014
Change in net position (102,152)
Net Position
Beginning of year 343,649
End of year 241,497$
See notes to financial statements. 33
Statement of Changes in Fiduciary Net Position
Year Ended June 30, 2017

34
(THIS PAGE LEFT BLANK INTENTIONALLY)

Independent School District No. 742 Notes to Financial Statements
35
NOTE 1 – SUMMARY OF SIGNIFICANT ACCOUNTING POLICIES (CONTINUED)
The District operates under a school board form of government for the purpose of providing educational
services to individuals within the District areas. The governing body consists of a seven member board
elected by the voters of the District to serve three and four-year terms.
The accounting policies of the District conform to accounting principles generally accepted in the United
States of America as applicable to governmental units. The following is a summary of the more significant
policies.
A. Reporting Entity
The financial statements present the District and its component units. The District includes all funds,
organizations, institutions, agencies, departments, and offices that are not legally separate from such.
Component units are legally separate organizations for which the elected officials of the District are
financially accountable and are included within the financial statements of the District because of the
significance of their operational or financial relationships with the District.
The District is considered financially accountable for a component unit if it appoints a voting majority of
the organization's governing body and it is able to impose its will on the organization by significantly
influencing the programs, projects, activities, or level of services performed or provided by the
organization, or there is a potential for the organization to provide specific financial benefits to or impose
specific financial burdens on the District.
As a result of applying the component unit definition criteria above, it has been determined the District
has no component units.
The student activity accounts of the District are not under the School Board's control; therefore,
separate audited financial statements have been issued.
The District has entered into a joint powers agreement with five area school districts to create the
Central Minnesota Area Learning Center (ALC). The ALC is authorized under Minnesota Statutes
Section 471.59. The Joint Powers Board consists of one representative appointed by each member
district school board.
The District has been designated as the fiscal host district. Therefore, the District, on behalf of the
member districts, applies for, receives, and administers educational funding, including state and federal
funds as appropriate to an area learning center.
Separate financial statements have been issued for the Central Minnesota ALC.
B. Basic Financial Statement Information
The government-wide financial statements (i.e. the Statement of Net Position and the Statement of
Activities) display information about the reporting government as a whole. These statements include all
the financial activities of the District, except for the fiduciary funds. The fiduciary funds are only
reported in the Statement of Fiduciary Net Position and the Statement of Changes in Fiduciary Net
Position at the fund financial statement level.

Independent School District No. 742 Notes to Financial Statements
36
NOTE 1 – SUMMARY OF SIGNIFICANT ACCOUNTING POLICIES (CONTINUED)
B. Basic Financial Statement Information (Continued)
The Statement of Activities demonstrates the degree to which the direct expenses of a given function or
segment is offset by program revenues. Direct expenses are those that are clearly identifiable with a
specific function or segment. Program revenues include charges to customers or applicants who
purchase, use, or directly benefit from goods, services, or privileges provided by a given function or
segment and grants and contributions that are restricted to meeting the operational or capital
requirements of a particular function or segment. Taxes and other items not properly included among
program revenues are reported instead as general revenues.
The District applies restricted resources first when an expense is incurred for a purpose for which both
restricted and unrestricted net position is available. Depreciation expense that can be specifically
identified by function is included in the direct expenses of that function. Depreciation expense relating
to assets that serve multiple functions is presented as unallocated depreciation in the Statement of
Activities. Interest on general long-term debt is considered an indirect expense and is reported separately
in the Statement of Activities. The effect of interfund activity has been removed from these statements.
Separate fund financial statements are provided for governmental funds, proprietary funds and fiduciary
funds, even though the latter is excluded from the government-wide financial statements. Major
individual governmental funds are reported as separate columns in the fund financial statements.
Proprietary funds distinguish operating revenues and expenses from nonoperating items. Operating
revenues and expenses generally result from providing services and producing and delivering goods in
connection with a proprietary fund's principal ongoing operations. The principal operating revenues of
the Internal Service Funds are charges to customers for services. Operating expenses for the Internal
Service Funds are insurance claims and premiums. All revenues and expenses not meeting this
definition are reported as nonoperating revenues and expenses.
The Trust and Agency Funds are presented in the fiduciary fund financial statements. Since by definition
these assets are being held for the benefit of a third party (other local governments, private parties, etc.)
and cannot be used to address activities or obligations of the District, these Funds are not incorporated
into the government-wide statements.
C. Measurement Focus and Basis of Accounting
The accounting and financial reporting treatment applied is determined by its measurement focus and
basis of accounting. The government-wide financial statements are reported using the economic
resources measurement focus and the accrual basis of accounting, as are the proprietary fund and
fiduciary fund financial statements. Revenues are recorded when earned and expenses are recorded
when a liability is incurred, regardless of the timing of related cash flows. Governmental fund financial
statements are reported using the current financial resources measurement focus and the modified
accrual basis of accounting. Under this basis of accounting transactions are recorded in the following
manner.

Independent School District No. 742 Notes to Financial Statements
37
NOTE 1 – SUMMARY OF SIGNIFICANT ACCOUNTING POLICIES (CONTINUED)
C. Measurement Focus and Basis of Accounting (Continued)
1. Revenue Recognition
Revenue is recognized when it becomes measurable and available. "Measurable" means the amount
of the transaction can be determined and "available" means collectible within the current period or
soon enough thereafter to be used to pay liabilities of the current period. Property tax revenue is
generally considered as available if collected within 60 days after year-end. State revenue is
recognized in the year to which it applies according to Minnesota Statutes and accounting principles
generally accepted in the United States of America. Minnesota Statutes include state aid funding
formulas for specific years. Federal revenue is recorded in the year in which the related expenditure
is made. Other revenue is considered available if collectable within 60 days.
2. Recording of Expenditures
Expenditures are generally recorded when a liability is incurred. The exceptions to this general rule
are that interest and principal expenditures in the Debt Service Fund, compensated absences and
claims and judgments are recognized when payment is due.
Description of Funds:
Major Funds
General Fund – This Fund is the basic operating fund of the District and is used to account for all
financial resources except those required to be accounted for in another fund.
Food Service Special Revenue Fund – This Fund is used to account for food service revenues and
expenditures.
Community Service Special Revenue Fund – This Fund is used to account for services provided to
residents in the areas of community education, school readiness, early childhood and family
education, or other similar services.
Building Construction Fund – This Fund is used to account for financial resources to be used for the
acquisition or construction of major capital facilities or to account for bonds specifically issued for
technology expenditures.
Debt Service Fund – This Fund is used to account for the accumulation of resources for, and
payment of, general obligation (G.O.) bond principal, interest, and related costs.

Independent School District No. 742 Notes to Financial Statements
38
NOTE 1 – SUMMARY OF SIGNIFICANT ACCOUNTING POLICIES (CONTINUED)
C. Measurement Focus and Basis of Accounting (Continued)
Description of Funds (Continued):
Fiduciary Funds
Private-Purpose Trust Fund – This Fund is used to account for money held by the District in a trustee
capacity. Included in this group of funds is the Scholarship Fund.
Agency Fund – This Fund is used to account for assets held by a governmental unit as an agent for
individuals, private organizations, other governmental units, and other funds. The District acts as the
fiscal agent for the Central Minnesota ALC. The Agency Fund is purely custodial (assets equal
liabilities) and thus do not involve measurement of results of operations.
Proprietary Funds
Dental Insurance Internal Service Fund – This Fund is used to account for operations of the District's
self-insured dental insurance plan. Premiums collected from employees are collected from other
governmental funds and claims for dental claims are paid by this Fund.
Health Insurance Internal Service Fund – This Fund is used to account for operations of the District's
self-insured health insurance plan. Premiums collected from employees are collected from other
governmental funds and claims for health claims are paid by this Fund.
OPEB Internal Service Fund – This Fund is used to account for the financial resources relating to
other post employment benefits.
D. Deposits and Investments
All governmental, proprietary, and fiduciary funds of the District, except for the OPEB Internal Service
Fund, participate in a government-wide investment pool. Cash and investment balances from these funds
are combined and invested to the extent available in various securities as authorized by state law. The
OPEB Fund's deposits and investments are held and invested separately from the rest of the District's
funds as authorized by state law. In addition, deposits and investments related to the 2015A G.O.
Alternative Facilities Bonds, 2015B Capital Facilities Bonds, and 2017B School Buildings Bonds are
held and invested separately from these pooled funds.
Minnesota Statutes authorizes the District to invest in obligations of the U.S. Treasury, agencies and
instrumentalities, shares of investment companies whose only investments are in the aforementioned
securities, obligations of the State of Minnesota or its municipalities, bankers' acceptances, future
contracts, repurchase and reverse repurchase agreements, and commercial paper of the highest quality
with a maturity of no longer than 270 days. Earnings from the pooled investments are allocated to the
respective funds based on the average of month-end cash and investment balances.

Independent School District No. 742 Notes to Financial Statements
39
NOTE 1 – SUMMARY OF SIGNIFICANT ACCOUNTING POLICIES (CONTINUED)
D. Deposits and Investments (Continued)
The District categorizes its fair value measurements within the fair value hierarchy established by
generally accepted accounting principles. The Hierarchy is based on the valuation inputs used to
measure the fair value of the asset. Level 1 inputs are quoted prices in active markets for identical assets;
Level 2 inputs are significant other observable inputs; Level 3 inputs are significant unobservable inputs.
Investments held by investment pools are measured at amortized cost. Cash and investments at June 30, 2017 were comprised of deposits, negotiable certificates of deposit,
shares in the Minnesota School District Liquid Asset Fund (MSDLAF), shares in the Minnesota Trust
(MNTrust) Term Series, shares in the MNTrust Investment Shares Portfolio, government securities,
FHLB, FHLMC, and money market funds. In accordance with GASB Statement No. 79, the various
MSDLAF and MNTrust securities are valued at amortized cost, which approximates fair value. There
are no restrictions or limitations on withdrawals from the MSDLAF or MNTrust Investment Shares
Portfolio. Investments in the MSDLAF MAX must be deposited for a minimum of 14 calendar days
with the exception of direct investments of funds distributed by the State of Minnesota. Withdrawals
prior to the 14-day restriction period may be subject to a penalty and there is a 24 hour hold on all
requests for redemptions. Seven days' notice of redemption is required for withdrawals of investments in
the MNTrust Term Series withdrawn prior to the maturity date of that series. A penalty could be
assessed as necessary to recoup the Series for any charges, losses, and other costs attributable to the
early redemption.
E. Property Tax Receivable
Current property taxes receivable are recorded for taxes certified the previous December and collectible
in the current calendar year, which have not been received by the District. Delinquent property tax
receivables represent uncollected taxes for the past six years, and are deferred and included in the
deferred inflows of resources section of the fund financial statements as unavailable revenue because
they are not available to finance the operations of the District in the current year.
F. Property Taxes Levied for Subsequent Year's Expenditures
Property taxes levied for subsequent year's expenditures consist principally of property taxes levied in
the current year which will be collected and recognized as revenue in the District's following year to
properly match those revenues with the budgeted expenditures for which they were levied. This amount
is equal to the amount levied by the School Board in December 2016, less various components and their
related adjustments as mandated by the state. These portions of that levy were recognized as revenue in
the fiscal year 2017. The remaining portion of the levy will be recognized when measurable and
available.
G. Inventories
Inventories of commodities donated directly by the U.S. Department of Agriculture are recorded at
market value. Other inventories are stated at cost as determined on an average cost basis. Inventories are
recorded as expenditures when consumed rather than when purchased.

Independent School District No. 742 Notes to Financial Statements
40
NOTE 1 – SUMMARY OF SIGNIFICANT ACCOUNTING POLICIES (CONTINUED)
H. Prepaid Items
Certain payments to vendors reflect costs applicable to future accounting periods and are recorded as
prepaid items in both the government-wide and fund financial statements. Prepaid items are recorded as
expenditures at the time of consumption.
I. Property Taxes
The District levies its property tax during the month of December. December 28 is the last day the
District can certify a tax levy to the County Auditor. Such taxes become a lien on January 1. The
property tax is recorded as revenue when it becomes measurable and available. Benton, Sherburne,
Stearns, and Wright Counties are the collecting agency for the levy and remit the collections to the
District three times a year. The Tax levy notice is mailed in March with the first half of the payment due
on May 15 and the second half due on October 15. Delinquent collections for November and December
are received the following January.
A portion of property taxes levied is paid by the State of Minnesota through various tax credits, which
are included in revenue from state sources in the financial statements.
J. Capital Assets
Capital assets are recorded in the government-wide financial statements, but are not reported in the fund
financial statements.
Capital assets are defined by the District as assets with an initial individual cost of more than $5,000.
Such assets are capitalized at historical cost, or estimated historical cost for assets where actual
historical cost is not available. Donated assets are recorded as capital assets at acquisition value at the
date of donation.
The costs of normal maintenance and repairs that do not add to the value of the assets or materially
extend the assets lives are not capitalized.
Capital assets are depreciated using the straight-line method over their estimated useful lives. Since
surplus assets are sold for an immaterial amount when declared as no longer needed for public school
purpose by the District, no salvage value is taken into consideration for depreciation purpose. Useful
lives vary from 20 to 50 years for land improvements, buildings, and building improvements, 5 to 20
years for furniture and equipment including food service equipment, and 8 years for vehicles.
Capital assets not being depreciated include land and construction in progress. The District does not
possess any material amounts of infrastructure capital assets, such as sidewalks and parking lots. Such
items are considered to be part of the cost of buildings or other improvable property.
K. Deferred Outflows/Inflows of Resources
In addition to assets, the Statement of Financial Position will sometimes report a separate section for
deferred outflows of resources. This separate financial statement element represents a consumption of
net position that applies to a future period(s) and so will not be recognized as an outflow of resources
(expense/expenditure) until that time. The District has one item that qualifies for reporting in this
category. A deferred outflow relating to pension activity is reported in the government-wide Statement
of Net Position. A deferred outflows of resources related to pensions is recorded for various estimate
differences that will be amortized and recognized over future years.

Independent School District No. 742 Notes to Financial Statements
41
NOTE 1 – SUMMARY OF SIGNIFICANT ACCOUNTING POLICIES (CONTINUED)
K. Deferred Outflows/Inflows of Resources (Continued)
In addition to liabilities, the Statement of Financial Position and fund financial statements will
sometimes report a separate section for deferred inflows of resources. This separate financial statement
element represents an acquisition of net position that applies to a future period(s) and so will not be
recognized as an inflow of resources (revenue) until that time. The District has three types of items
which qualify for reporting in this category. The first item, unavailable revenue from property taxes,
arises under a modified accrual basis of accounting and is reported only in the Governmental Funds
Balance Sheet. Delinquent property taxes not collected within 60 days of year-end are deferred and
recognized as an inflow of resources in the governmental funds in the period the amounts become
available. The second item is property taxes levied for subsequent year's expenditures, which represent
property taxes received or reported as a receivable before the period for which the taxes are levied, and
is reported as a deferred inflow of resources in both the government-wide Statement of Net Position and
the Governmental Funds Balance Sheet. Property taxes levied for subsequent year's expenditures are
deferred and recognized as an inflow of resources in the government-wide financial statements in the
year for which they are levied and in the governmental fund financial statements during the year for
which they are levied, if available. The third item, deferred inflows of resources related to pensions is
recorded on the government-wide Statement of Net Position for various estimate differences that will be
amortized and recognized over future years.
L. Long-Term Obligations
In the government-wide financial statements, long-term debt and other long-term obligations are
reported as liabilities in the governmental activities Statement of Net Position.
In the fund financial statements, governmental fund types recognize bond premiums and discounts, as
well as bond issuance costs, during the current period. The face amount of debt issued is reported as
other financing sources. Premiums received on debt issuances are reported as other financing sources
while discounts on debt issuances are reported as other financing uses. Issuance costs, whether withheld
or not withheld from the actual debt proceeds received, are reported as debt service expenditures.
M. Pensions
For purposes of measuring the net pension liability, deferred outflows/inflows of resources, and pension
expense, information about the fiduciary net position of the Public Employees Retirement Association
(PERA) and Teachers Retirement Association (TRA) and additions to/deductions from PERA's and
TRA's fiduciary net position have been determined on the same basis as they are reported by PERA and
TRA. For this purpose, plan contributions are recognized as of employer payroll paid dates and benefit
payments and refunds are recognized when due and payable in accordance with the benefit terms.
Investments are reported at fair value.
TRA has a special funding situation created by direct aid contributions made by the State of Minnesota,
City of Minneapolis, and Minneapolis School District. The direct aid is a result of the merger of the
Minneapolis Teachers Retirement Fund Association merger into TRA in 2006. A second direct aid
source is from the State of Minnesota for the merger of the Duluth Teacher's Retirement Fund
Association (DTRFA) in 2015.

Independent School District No. 742 Notes to Financial Statements
42
NOTE 1 – SUMMARY OF SIGNIFICANT ACCOUNTING POLICIES (CONTINUED)
N. Compensated Absences
The District compensates clerical, custodial, and non-represented employees upon termination of
employment for unused vacation. An employee may not carry over more than 15 days of vacation time.
District employees are entitled to sick leave at the following rates:
Maximum Number
Days Earned of Days Allowed
Position Per Year to Accumulate
Administrators 12 100
Teachers 11-13 100
Clerical 10-12 60
Custodial 12 100
Food Service 10 60
Non-Represented 10-12 100
Paraprofessionals 10 60
Interpreters 10 60
Principals 10-12 100
Employees are not compensated for unused sick leave upon termination of employment, unless taken in
conjunction with severance pay as described in Note 1.
Compensated absences payable, as reported in the Statement of Net Position, consists of the severance
payable to eligible employees based on their unused sick leave of $2,549,318 and vacation leave of
$325,917. See Note 1.O.
O. Post Employment Severance and Health Benefits
1. Severance Pay
Teachers who have completed 15 years of continuous service with the District are eligible for
severance pay in the amount of $1,000 per year of service upon retirement or resignation not to
exceed $45,000 per employee. District administrators have a similar arrangement. Employees in all
other bargaining groups who are 55 years of age and have a minimum of 10 years of service are
eligible for severance pay based on his or her accrued accumulative leave up to a maximum number
of days as set forth in each negotiated contract. All severance payments are made directly into a Post
Retirement Health Care Savings Plan. Severance pay is recognized as an expenditure in the year
payment is made in accordance with the Uniform Financial Accounting and Reporting Standards
(UFARS) for Minnesota Schools and accounting principles generally accepted in the United States
of America and is not recorded as a liability on the fund financial statements. The liability for
severance based on years of service is reported in the Statement of Net Position as part of the
District's other post employment benefits and the liability for severance based on accumulated leave
is reported in the Statement of Net Position as compensated absences.

Independent School District No. 742 Notes to Financial Statements
43
NOTE 1 – SUMMARY OF SIGNIFICANT ACCOUNTING POLICIES (CONTINUED)
O. Post Employment Severance and Health Benefits (Continued)
2. Retiree Insurance Benefits
The District has several contractual arrangements for retiree insurance benefits. (1) For retirees and
disabled employees who have retired prior to June 30, 1987, their insurance benefits represent the
computed value of accumulated sick leave benefits to be used to pay medical insurance premiums
for these individuals until death or until their accumulated benefit is fully utilized. For these retirees,
payments for insurance amounted to $6,797 for the year ended June 30, 2017. (2) For retirees after
June 30, 1987, an employee with a minimum of 15 years continuous service in the District, or is age
50 and at June 10, 1988, has completed ten continuous years of service in the District, is eligible to
have medical insurance premiums paid for 10 years or until the employee becomes eligible for
Medicare starting ten years prior to eligibility for Medicare. This is scaled to add an extra year of
benefit for each year of service over 15 to a maximum of ten years of benefits with 20 or more years
of service. Employees hired after 1988 do not receive this benefit.
3. Deferred Compensation Plan
The District has employees in a deferred compensation plan created in accordance with Internal
Revenue Code Section 457. The plan permits them to defer a portion of their salary until future
years. The deferred compensation is not available to employees until termination, retirement, death,
or unforeseen emergency. The plan assets are held in trust for the plan participants and their
beneficiaries. Therefore, the assets and liabilities of the plan are not included in the District's
financial statements.
P. Fund Equity
1. Classifications
In the fund financial statements, governmental funds report classifications that comprise a hierarchy
based primarily on the extent to which the District is bound to honor constraints on the specific
purpose for which amounts in those funds can be spent.
• Nonspendable Fund Balances – These are amounts that cannot be spent because they are not in
spendable form as they are legally or contractually required to be maintained intact and include
inventory and prepaid items.
• Restricted Fund Balances – These are amounts that are restricted to specific purposes either by
legally enforceable constraints placed on the use of resources by creditors, grantors, contributors
or laws or regulations of other governments or are imposed by law through enabling legislation.
• Assigned Fund Balances – These are amounts that as assigned by the Superintendent or
Executive Director of Business Services for specific purposes as delegated by the School Board
through the District's Fund Balance Policy.
• Unassigned Fund Balances – This represents fund balance that has not been assigned to other
funds and that has not been restricted, committed, or assigned to a specific purpose in the
General Fund.

Independent School District No. 742 Notes to Financial Statements
44
NOTE 1 – SUMMARY OF SIGNIFICANT ACCOUNTING POLICIES (CONTINUED)
P. Fund Equity (Continued)
1. Classifications
The District's policy is to strive to spend resources from fund balance classifications in the
following order (first to last) if resources from more than one fund balance classification could
be spent: restricted, committed, assigned, and unassigned.
2. Minimum Fund Balance Policy
The District has a fund balance policy in place that states the District will strive to maintain a
minimum unassigned General Fund balance of 5% to 8% of the annual General Fund
expenditure budget.
Q. Net Position
Net position represents the difference between assets and deferred outflows of resources; and liabilities
and deferred inflows of resources in the government-wide financial statements. Net investment in capital
assets consists of capital assets, net of accumulated depreciation, reduced by the outstanding balance of
any long-term debt used to build or acquire the capital assets. Net position is reported as restricted in the
government-wide financial statement when there are limitations on their use through external restrictions
imposed by creditors, grantors, or laws or regulations of other governments.
R. Use of Estimates
The preparation of financial statements in conformity with accounting principles generally accepted in
the United States of America requires management to make estimates and assumptions that affect the
reported amounts of assets and liabilities and disclosure of contingent assets and liabilities at the date of
the financial statements. Estimates also affect the reported amounts of revenue and expenditures/expense
during the reporting period. Actual results could differ from those estimates.
S. Budgetary Information
The District follows these procedures in establishing the budgetary data reflected in the financial
statements:
1. Prior to July 1, the Superintendent submits to the School Board, a proposed operating budget for
the fiscal year commencing the following July 1. The operating budget includes proposed
expenditures and the means of financing them.
2. The Superintendent is authorized to transfer budgeted amounts between departments within any
fund; however, any revisions that alter the total expenditures of any fund must be approved by the
School Board.
3. Formal budgetary integration is employed as a management control device during the year for
the General, Special Revenue, Capital Projects, and Debt Service Funds.
4. Budgets for all Funds are adopted on a basis consistent with accounting principles generally
accepted in the United States of America.
5. Budgets are as originally adopted or as amended by the School Board. Budgeted expenditure
appropriations lapse at year-end.

Independent School District No. 742 Notes to Financial Statements
45
NOTE 2 – DEPOSITS AND INVESTMENTS
A. Deposits
In accordance with applicable Minnesota Statutes, the District maintains deposits at depository banks
authorized by the School Board.
Custodial Credit Risk – Deposits: This is the risk that in the event of the failure of a depository financial
institution, the District will not be able to recover deposits or collateral securities that are in possession
of an outside party. Minnesota Statutes 118A requires all deposits be protected by federal deposit
insurance, corporate security bonds, or collateral. The market value of collateral pledged must equal
110% of the deposits not covered by Federal Deposit Insurance Corporation (FDIC) insurance or
corporate surety bonds. The District has a policy that requires the District's deposits be collateralized as
required by Minnesota Statutes for an amount exceeding FDIC, SAIF, BIF, or FCUA coverage. As of
June 30, 2016, the District's bank balance was not exposed to custodial credit risk because it was insured
and fully collateralized with securities held by the pledging financial institutions' trust department or
agent in the District's name.
The District's pooled deposits had a book balance as follows:
Checking 948,738$
Scholarship fund savings account 238,133
Certificates of deposit 5,226,500
Total 6,413,371$
The District's nonpooled deposits related to the 2015A and 2015B Facilities Bonds and 2017B School
Building Bonds had a book balance as follows:
Certificates of deposit 66,731,900$

Independent School District No. 742 Notes to Financial Statements
46
NOTE 2 – DEPOSITS AND INVESTMENTS (CONTINUED)
B. Investments
As of June 30, 2017, the District had the following investments:
Less Than 1 to 3
Investment Type Total 1 Year Years
Pooled
MSDLAF+ Liquid Class 1,155,553$ 1,155,553$ -$
MSDLAF+ Max Class 4,003,494 4,003,494 -
MN Trust Term Series 3,000,000 3,000,000 -
Negotiable CD's 248,361 248,361 -
MN Trust Investment Shares Portfolio 13,643,253 13,643,253 -
Total pooled investments 22,050,661 22,050,661 -
Non Pooled
Cash with Fiscal Agent
Negotiable CD's 15,100,000 15,100,000 -
Money Market 2,605,719 2,605,719 -
Total cash with fiscal agent 17,705,719 17,705,719 -
Bond Proceeds Investments
MN Trust Investment Shares Portfolio 7,261,704 7,261,704 -
Government Securities 14,287,633 360,572 13,927,061
FHLB 1,986,208 998,431 987,777
FHLMC 3,985,837 - 3,985,837
Negotiable CD's 249,002 249,002 -
MN Trust Term Series 27,000,000 27,000,000 -
Total 2015A and 2015B bonds 54,770,384 35,869,709 18,900,675
OPEB Investments
MN Trust Investment Shares Portfolio 613,752 613,752 -
Government Securities 1,002,780 - 1,002,780
Negotiable CD's 3,142,473 2,523,418 619,055
Total OPEB investments 4,759,005 3,137,170 1,621,835
Total non-pooled investments 77,235,108 56,712,598 20,522,510
Total investments 99,285,769$ 78,763,259$ 20,522,510$
Investment Maturities
Concentration of Credit Risk: This is the risk of loss attributed to the magnitude of an investment in a
single issuer. The District's investment policy states the District will diversify its investments to avoid
incurring unreasonable risks inherent in over investing in specific instruments, individual financial
institutions, or maturities. As of June 30, 2017, the District's investments in the St. Charles, State Bank
of the Lakes, Crystal Lake, Onewest Bank NA, Bank of the West, Kansas State Bank of Manhattan,
Fieldpoint Private Bank, American Express Centurion Bank, Goldman Sachs CD's and New York
Taxable Bonds within the OPEB nonpooled investments were exposed to concentration of credit risk as
each of these investments exceeded 5% of the total OPEB investments. Additionally, the District's
investments in the State of California within the bond proceeds nonpooled investments was exposed to
concentration of credit risk as it exceeded 5% of the cash with fiscal agent investments.

Independent School District No. 742 Notes to Financial Statements
47
NOTE 2 – DEPOSITS AND INVESTMENTS (CONTINUED)
B. Investments (Continued)
Custodial Credit Risk – Investments: This is the risk that in the event of the failure of the counterparty,
the District will not be able to recover the value of its investments or collateral securities that are in the
possession of an outside party. The District's investment policy on custodial credit risk states securities
will be held in third party safekeeping by an institution designated as custodial agent. The custodial
agent shall issue a safekeeping receipt to the District listing pertinent information related to the
securities held.
Credit Risk: This is the risk that an issuer or other counterparty to an investment will not fulfill its
obligations. Minnesota Statutes 118A.04 and 118A.05 limit investments to the top two ratings issued by
nationally recognized statistical rating organizations. The District's investment policy limits investments
to those specified in the above statutes. As of June 30, 2017, the District's investments in MSDLAF,
MSDLAF+ Max, MN Trust Term Series, and MN Trust Investment Shares Portfolio were rated AAA by
Standard and Poor's. Investments in FHLB and FHLMC were rated Aaa by Moody's. Investments in
government securities were rate at least Aa3 by Moody's. The District's investments in certificates of
deposit and the money market are not rated.
Interest Rate Risk: This is the risk that the market value of securities will fall due to the changes in
market interest rates. The District's policy states investment maturities should be scheduled to coincide
with projected District cash flow needs, taking into account large routine or scheduled expenditures, as
well as anticipated receipt dates of anticipated revenues. The policy also indicates investments shall be
managed to attain a market rate of return through various economic and budgetary cycles, while
preserving and protecting the capital in the investment portfolio and taking into account constraints on
risk and cash flow requirements.
The District has the following recurring fair value measurements as of June 30, 2017:
• Pooled investments of $248,361 were valued using a matrix pricing model (Level 2 inputs)
• Nonpooled investments with fiscal agent of $17,705,719 were valued using a matrix pricing
model (Level 2 inputs)
• Nonpooled bond proceeds of $20,508,680 were valued using a matrix pricing model (Level 2
inputs)
• Nonpooled OPEB investments of $4,145,253 were valued using a matrix pricing model (Level 2
inputs)

Independent School District No. 742 Notes to Financial Statements
48
NOTE 2 – DEPOSITS AND INVESTMENTS (CONTINUED)
B. Investments (Continued)
The following is a summary of total deposits and investments:
Cash on hand 4,775$
Deposits - pooled (Note 2.A.) 6,413,371
Deposits - nonpooled (Note 2.A.) 66,731,900
Investments - pooled (Note 2.B.) 22,050,661
Investments - nonpooled (Note 2.B.) 77,235,108
172,435,815$
Deposits and investments are presented in the June 30, 2017, basic financial statements as follows:
Statement of Net Position
Cash and investments 153,526,016$
Cash with fiscal agent 17,705,719
Statement of Fiduciary Net Position
Cash and investments
Agency fund 961,730
Trust fund 242,350
Total deposits and investments 172,435,815$
NOTE 3 – INTERFUND ACTIVITY
At June 30, 2017, the OPEB Internal Service Fund reported a payable of $3,829,825 due to the General
Fund in the amount of $1,574,994 and the Health Insurance Internal Service Fund in the amount of
$2,254,831 for past health insurance costs.
At June 30, 2017, the Health Insurance Internal Service Fund reported a payable of $75,601 due to the
General Fund for a deficit cash balance.

Independent School District No. 742 Notes to Financial Statements
49
NOTE 4 – CAPITAL ASSETS
Capital asset activity for the year ended June 30, 2017, was as follows:
Beginning Ending
Balance Increases Decreases Balance
Governmental activities
Capital assets not being
depreciated
Land 5,279,872$ -$ -$ 5,279,872$
Construction in progress 8,445,750 21,360,572 17,237,514 12,568,808
Total capital assets
not being depreciated 13,725,622 21,360,572 17,237,514 17,848,680
Capital assets being
depreciated
Land improvements 8,112,184 2,161,041 40,762 10,232,463
Buildings and building improvements 168,942,491 18,136,450 216,558 186,862,383
Furniture and equipment 10,034,332 373,614 727,204 9,680,742
Vehicles 4,054,444 145,119 - 4,199,563
Food service equipment 1,512,919 66,859 130,204 1,449,574
Total capital assets
being depreciated 192,656,370 20,883,083 1,114,728 212,424,725
Less accumulated
depreciation for
Land improvements (3,676,339) (367,148) (40,761) (4,002,726)
Buildings (58,883,269) (4,821,018) (17,551) (63,686,736)
Furniture and equipment (7,853,877) (334,594) (691,762) (7,496,709)
Vehicles (2,575,768) (348,234) - (2,924,002)
Food service equipment (1,033,121) (57,635) (117,535) (973,221)
Total accumulated
depreciation (74,022,374) (5,928,629) (867,609) (79,083,394)
Total capital assets being
depreciated, net 118,633,996 14,954,454 247,119 133,341,331
Governmental activities,
capital assets, net 132,359,618$ 36,315,026$ 17,484,633$ 151,190,011$

Independent School District No. 742 Notes to Financial Statements
50
NOTE 4 – CAPITAL ASSETS (CONTINUED)
Depreciation expense for the year ended June 30, 2017, was charged to the following governmental
functions:
District support services 22,471$
Elementary and secondary regular instruction 187,795
Vocational instruction 4,441
Special education instruction 33,659
Community service 5,741
Instructional support services 77,618
Pupil support services 327,001
Sites and buildings 494,990
Food service 57,636
Unallocated 4,717,277
Total depreciation expense 5,928,629$
NOTE 5 – LONG-TERM DEBT
A. Components of Long-Term Liabilities
Issue Interest Original Final Principal Due Within
Date Rates Issue Maturity Outstanding One Year
Long-term liabilities
G.O. bonds
2015A Alternative Facilities Bonds 03/05/15 2.00%-4.00% 37,715,000$ 02/01/35 36,215,000$ 1,530,000$
2015B Capital Facilities Bonds 10/01/15 2.00%-4.00% 13,130,000 02/01/30 12,445,000 820,000
2015C Crossover Refunding Bonds 11/19/15 2.00%-4.00% 20,460,000 02/01/27 20,460,000 1,765,000
2017B School Building Bonds 02/21/17 3.00%-5.00% 100,365,000 02/01/37 100,365,000 2,780,000
Unamortized bond premium 9,625,665 -
Net bond payable 179,110,665 6,895,000
Certificates of Participation
2012A Certificates of Participation 02/09/12 1.00%-2.80% 1,610,000 02/01/22 773,333 162,083
2013A Certificates of Participation 02/01/13 2.00%-2.30% 5,150,000 02/01/23 2,685,000 425,000
2014A Certificates of Participation 11/05/14 1.00%-4.00% 10,000,000 02/01/35 8,625,000 225,000
2017A Certificates of Participation 02/21/17 2.00%-5.00% 16,910,000 02/01/38 16,910,000 325,000
Unamortized Premium 1,217,040 -
Net Certificates of Participation 30,210,373 1,137,083
Compensated absences payable 2,875,235 1,000,000
Total all long-term
liabilities 212,196,273$ 9,032,083$
The long-term bond liabilities listed above were issued to finance acquisition and construction of capital
facilities. Compensated absences are typically liquidated through the General Fund.
On November 19, 2015, the District issued $20,460,000 G.O Crossover Refunding Bonds, Series 2015C
for a refunding $21,145,000 of the 2007A G.O. School Building Bonds on their call date of February 1,
2017. The net present value savings from the refunding was $1,746,981 with an aggregate difference in
debt service payments of $1,744,500.

Independent School District No. 742 Notes to Financial Statements
51
NOTE 5 – LONG-TERM DEBT (CONTINUED)
B. Minimum Debt Payments for Bonds
Minimum annual principal and interest payments required to retire bond liabilities:
Year Ending G.O. Bonds Energy Loan
June 30, Principal Interest
2018 6,895,000$ 5,779,577$
2019 6,835,000 5,839,569
2020 6,995,000 5,676,519
2021 7,190,000 5,477,319
2022 7,400,000 5,265,319
2023-2027 41,030,000 22,243,281
2028-2032 46,685,000 14,101,906
2033-2037 46,455,000 5,251,237
Total 169,485,000$ 69,634,727$
C. Minimum Debt Payments for Certificates of Participation
Minimum annual principal and interest payments required to retire certificates of participation:
Year Ending Certificates of Participation Energy Loan
June 30, Principal Interest
2018 1,137,083$ 1,082,161$
2019 1,117,083 1,102,050
2020 1,140,000 1,076,842
2021 1,167,083 1,047,151
2022 1,127,084 1,015,441
2023-2027 5,670,000 4,518,459
2028-2032 6,985,000 3,202,000
2033-2037 8,690,000 1,493,100
2038 1,960,000 78,400
Total 28,993,333$ 14,615,604$

Independent School District No. 742 Notes to Financial Statements
52
NOTE 5 – LONG-TERM DEBT (CONTINUED)
D. Changes in Long-Term Liabilities
Beginning Ending
Balance Additions Reductions Balance
Long-term liabilities
G.O. bonds 94,115,000$ 100,365,000$ 24,995,000$ 169,485,000$
Certificates of participation 12,878,333 16,910,000 795,000 28,993,333
Unamortized premiums 2,942,795 8,118,749 218,839 10,842,705
Compensated absences 3,323,706 591,343 1,039,814 2,875,235
Total long-term liabilities 113,259,834$ 125,985,092$ 27,048,653$ 212,196,273$
NOTE 6 – FUND BALANCES/NET POSITION
Certain portions of fund balance are restricted based on state requirements to track special program
funding, to provide for funding on certain long-term liabilities or as required by other outside parties.
Fund equity balances are classified on the following page to reflect the limitations and restrictions of the
respective funds.

Independent School District No. 742 Notes to Financial Statements
53
NOTE 6 – FUND BALANCES/NET POSITION (CONTINUED)
Fund Equity
General Food Community Capital Debt
Fund Service Service Projects Service Total
Nonspendable for
Inventory 35,842$ 67,372$ -$ -$ -$ 103,214$
Prepaid Items 358,027 2,165 315 - - 360,507
Total nonspendable
fund balance 393,869 69,537 315 - - 463,721
Restricted for
Operating Capital 2,498,856 - - - - 2,498,856
Gifted and Talented 60,807 - - - - 60,807
Area Learning Center 445,054 - - - - 445,054
Teacher Development
and Evaluation 46,874 - - - - 46,874
Long-Term Facilities
Maintenance 1,116,473 - - 4,724,402 - 5,840,875
Food Service - 414,553 - - - 414,553
Community Education - - 496,895 - - 496,895
Early Childhood and
Family Education - - 233,860 - - 233,860
School Readiness - - 322,161 - - 322,161
Adult Basic Education - - 146,492 - - 146,492
Community Service - - 88,837 - - 88,837
Projects Funded by COP - - - 15,531,058 - 15,531,058
Capital Projects - - - 103,603,630 - 103,603,630
Debt Service - - - - 1,085,642 1,085,642
Total restricted
fund balance 4,168,064 414,553 1,288,245 123,859,090 1,085,642 130,815,594
Assigned for
Future Projects 8,177,574 - - - - 8,177,574
Unassigned for
General Purposes 9,334,878 - - - - 9,334,878
Health and Safety (1,103,780) - - - - (1,103,780)
Total unassigned
fund balance 8,231,098 - - - - 8,231,098
Total fund balance 20,970,605$ 484,090$ 1,288,560$ 123,859,090$ 1,085,642$ 147,687,987$
Nonspendable for Inventory – This balance represents a portion of the fund balance that is not available
since the amounts have already been spent of inventory.
Nonspendable for Prepaid Items – This balance represents the portion of fund balance that is not available
as the amounts have already been spent by the District on items for the next year.
Restricted/Reserved for Operating Capital – This balance represents available resources in the General
Fund to be used to purchase equipment and facilities.

Independent School District No. 742 Notes to Financial Statements
54
NOTE 6 – FUND BALANCES/NET POSITION (CONTINUED)
Fund Equity (Continued)
A. Fund Balance Restricted/Reserved for Gifted and Talented – The part of General Education Aid revenue for the gifted and talented program that is unspent at year end must be restricted in this Balance Sheet account. Restricted/Reserved for Area Learning Center – This balance represents amounts restricted for students
attending area learning centers. Each district that sends students to an area learning center must restrict
an amount equal to the sum of 1) at lease 90 and no more than 100 percent of the district average
General Education Revenue per adjusted pupil unit minus an amount equal to the product of the formula
allowance according to Minnesota Statutes 126C.10, subd. 2, times .0466, calculated without basic skills
revenue, local optional revenue, and transportation sparsity revenue, times the number of pupil units
attending a state-approved area learning center, plus (2) the amount of basic skills revenue generated by
pupils attending the area learning center. The amount restricted may only be spent on program costs
associated with the area learning center.
Restricted/Reserved for Teacher Development and Evaluation – This balance represents resources
available for teacher development and evaluation uses listed in Minnesota Statutes 122A.40, subd. 8 or
122A.41, subd. 5.
Restricted/Reserved for Long-Term Facilities Maintenance (LTFM) – This balance represents available
resources to be used for LTFM projects in accordance with the 10-year plan (Minnesota Statutes
123B.595, subd. 12).
Restricted for Food Service – The balance represents the resources available for the food service
program.
Restricted/Reserved for Community Education – This balance represents the resources available to
provide programming such as: nonvocational, recreational and leisure time activities, programs for
adults with disabilities, noncredit summer programs, adult basic education programs, youth development
and youth service programming, early childhood and family education, and extended day programs.
Restricted/Reserved for Early Childhood and Family Education – This balance represents the resources
available to provide for services for early childhood and family education programming.
Restricted/Reserved for School Readiness – This balance represents the resources available to provide
for services for school readiness programs (Minnesota Statutes 124D.16).
Restricted/Reserved for Adult Basic Education – This account will represent the balance of carryover
monies for all activity involving adult basic education.
Restricted for Community Service – This balance represents the positive fund balance of the Community
Service Fund.

Independent School District No. 742 Notes to Financial Statements
55
NOTE 6 – FUND BALANCES/NET POSITION (CONTINUED)
A. Fund Balance (Continued)
Restricted/Reserved for Building Projects Funded by Certificates of Participation (COP) – This balance
represents available resources in the Building Construction Fund for projects funded by certificates of
participation with related lease levy authority under Minnesota Statues, Section 126C.40.
Restricted for Capital Projects – This balance represents available resources in the Building
Construction Fund for projects.
Restricted for Debt Service – This amount represents the resources available to pay the principal and
interest on outstanding debt.
Assigned for Future Projects – This amount represents the portion of General Fund balance that is
approved for spending for future capital projects.
Unassigned for Health and Safety – This balance represents available resources to be used for health and
safety projects in accordance with an approved health and safety plan. This balance is classified as
unassigned as the balance was negative at year-end.
B. Net Position
Net position restricted for other purposes on the Statement of Net Position is comprised of the total
positive position of the restricted fund balance portion of the General Fund with the exception of the
operating capital reserve. This reserve is reported as restricted for capital acquisition.
NOTE 7 – DEFINED BENEFIT PENSION PLANS – STATE-WIDE
The District participates in various pension plans, total pension expense for the year ended June 30,
2017, was $45,973,220. The components of pension expense are noted in the following plan summaries.
Teachers' Retirement Association
A. Plan Description
The Teachers Retirement Association (TRA) is an administrator of a multiple employer, cost-sharing,
defined benefit retirement fund. TRA administers a Basic Plan (without Social Security coverage) and a
Coordinated Plan (with Social Security coverage) in accordance with Minnesota Statutes, Chapters 354
and 356. TRA is a separate statutory entity and administered by a Board of Trustees. The Board consists
of four active members, one retired member, and three statutory officials.

Independent School District No. 742 Notes to Financial Statements
56
NOTE 7 – DEFINED BENEFIT PENSION PLANS – STATE-WIDE (CONTINUED)
Teachers' Retirement Association (Continued)
A. Plan Description (Continued)
Teachers employed in Minnesota's public elementary and secondary school, charter schools and certain
educational institutions maintained by the state (except those teachers employed by the city of St. Paul
and by the University of Minnesota system) are required to be TRA members. State university,
community college, and technical college teachers first employed by the Minnesota State College and
Universities (MnSCU) may elect TRA coverage within one year of eligible employment. Alternatively,
these teachers may elect coverage through the Defined Contribution Retirement Plan (DCR)
administered by MnSCU.
B. Benefits Provided
TRA provides retirement benefits as well as disability benefits to members, and benefits to survivors
upon death of eligible members. Benefits are established by Minnesota Statute and vest after three years
of service credit. The defined retirement benefits are based on a member's highest average salary for any
five consecutive years of allowable service, age and a formula multiplier based on years of credit at
termination of service.
Two methods are used to compute benefits for TRA's Coordinated and Basic Plan members. Members
first employed before July 1, 1989 receive the greater of the Tier I or Tier II benefits as described.
Tier 1 Benefits
Tier 1 Step Rate Formula Percentage
Basic First ten years of service 2.2% per year
All years after 2.7% per year
Coordinated First ten years if service years are up to July 1, 2006 1.2% per year
First ten years if service years are July 1, 2006, or after 1.4% per year
All other years of service if service years are up to July 1, 2006 1.7% per year
All other years of service if service years are July 1, 2006, or after 1.9% per year
With these provisions:
• Normal retirement age is 65 with less than 30 years of allowable service and age 62 with 30 or
more years of allowable service.
• 3% per year early retirement reduction factor for all years under normal retirement age.
• Unreduced benefits for early retirement under a Rule of 90 (age plus allowable service equals 90
or more).

Independent School District No. 742 Notes to Financial Statements
57
NOTE 7 – DEFINED BENEFIT PENSION PLANS – STATE-WIDE (CONTINUED)
Teachers' Retirement Association (Continued)
B. Benefits Provided (Continued)
Tier II Benefits
For years of service prior to July 1, 2006, a level formula of 1.7% per year for coordinated members and
2.7% per year for basic members is applied. For years of service July 1, 2006, and after, a level formula
of 1.9% per year for Coordinated members and 2.7% for Basic members applies. Beginning July 1,
2015, the early retirement reduction factors are based on rates established under Minnesota Statute.
Smaller reductions, more favorable to the member, will be applied to individuals who reach age 62 and
have 30 years or more of service credit.
Members first employed after June 30, 1989, receive only the Tier II calculation with a normal
retirement age that is their retirement age for full Social Security retirement benefits, but not to exceed
age 66.
Six different types of annuities are available to members upon retirement. The No Refund Life Plan is a
lifetime annuity that ceases upon the death of the retiree – no survivor annuity is payable. A retiring
member may also choose to provide survivor benefits to a designated beneficiary(ies) by selecting one
of the five plans that have survivorship features. Vested members may also leave their contributions in
the TRA Fund upon termination of service in order to qualify for a deferred annuity at retirement age.
Any member terminating service is eligible for a refund of their employee contributions plus interest.
The benefit provisions stated apply to active plan participants. Vested, terminated employees who are
entitled to benefits but not yet receiving them are bound by the plan provisions in effect at the time they
last terminated their public service.
C. Contribution Rate
Per Minnesota Statutes, Chapter 354 sets the contribution rates for employees and employers. Rates for
each fiscal year ended June 30, 2015, June 30, 2016, and June 30, 2017, were:
Employee Employer
Basic 11.0% 11.5%
Coordinated 7.5% 7.5%

Independent School District No. 742 Notes to Financial Statements
58
NOTE 7 – DEFINED BENEFIT PENSION PLANS – STATE-WIDE (CONTINUED)
Teachers' Retirement Association (Continued)
C. Contribution Rate (Continued)
The following is a reconciliation of employer contributions in TRA's CAFR "Statement of Changes in
Fiduciary Net Position" to the employer contributions used in Schedule of Employer and Non-Employer
Pension Allocations.
Employer contributions reported in TRA's CAFR
Statement of Changes in Fiduciary Net Position 354,961,140$
Deduct Employer contributions not related to future
contribution efforts 26,356
Deduct TRA's contributions not included in allocation (442,978)
Total employer contributions 354,544,518
Total non-employer contributions 35,587,410
Total contributions reported in schedule of employer and
non-employer pension allocations 390,131,928$
Amounts reported in the allocation schedules may not precisely agree with financial statement amounts
or actuarial valuations due to the number of decimal places used in the allocations. TRA has rounded
percentage amounts to the nearest ten thousandths.
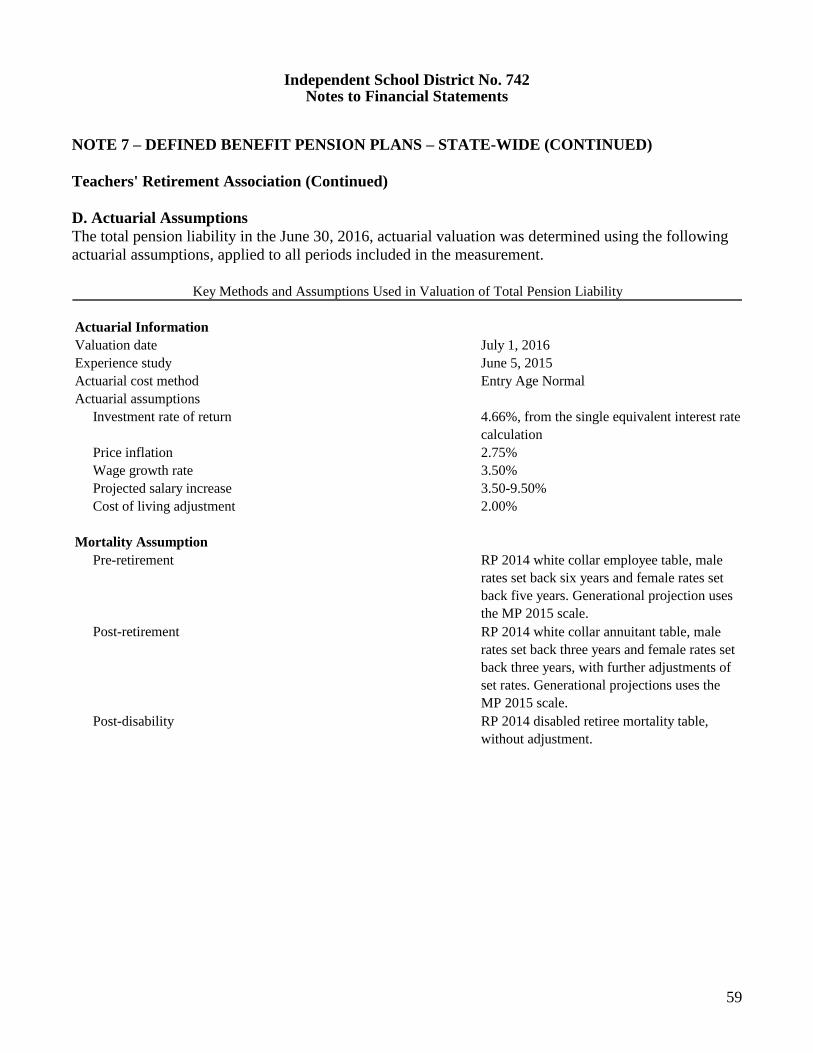
Independent School District No. 742 Notes to Financial Statements
59
NOTE 7 – DEFINED BENEFIT PENSION PLANS – STATE-WIDE (CONTINUED)
Teachers' Retirement Association (Continued)
D. Actuarial Assumptions
The total pension liability in the June 30, 2016, actuarial valuation was determined using the following
actuarial assumptions, applied to all periods included in the measurement.
Actuarial Information
Valuation date July 1, 2016
Experience study June 5, 2015
Actuarial cost method Entry Age Normal
Actuarial assumptions
Investment rate of return 4.66%, from the single equivalent interest rate
calculation
Price inflation 2.75%
Wage growth rate 3.50%
Projected salary increase 3.50-9.50%
Cost of living adjustment 2.00%
Mortality Assumption
Pre-retirement RP 2014 white collar employee table, male
rates set back six years and female rates set
back five years. Generational projection uses
the MP 2015 scale.
Post-retirement RP 2014 white collar annuitant table, male
rates set back three years and female rates set
back three years, with further adjustments of
set rates. Generational projections uses the
MP 2015 scale.
Post-disability RP 2014 disabled retiree mortality table,
without adjustment.
Key Methods and Assumptions Used in Valuation of Total Pension Liability

Independent School District No. 742 Notes to Financial Statements
60
NOTE 7 – DEFINED BENEFIT PENSION PLANS – STATE-WIDE (CONTINUED)
Teachers' Retirement Association (Continued)
D. Actuarial Assumptions (Continued)
The long-term expected rate of return on pension plan investments was determined using a building-
block method in which best-estimate ranges of expected future real rates of return (expected returns, net
of pension plan investment expense and inflation) are developed for each major asset class. These ranges
are combined to produce the long-term expected rate of return by weighting the expected future real
rates of return by the target asset allocation percentage and by adding expected inflation. The target
allocation and best estimates of geometric real rates of return for each major asset class are summarized
in the following table:
Asset Class
Domestic stocks
International stocks
Bonds
Alternative assets
Unallocated cash
Total
2
100%
45%
6.00
1.45
6.40
0.50
5.50%
Target
Long-Term
Expected Real
Rate of Return
15
18
20
The TRA actuary has determined the average of the expected remaining services lives of all members
for fiscal year 2016 is six years. The "Difference Between Expected and Actual Experience", "Changes
of Assumptions", and "Changes in Proportion" use the amortization period of six years in the schedule
presented. The amortization period for "Net Difference between Projected and Actual Investment
Earnings on Pension Plan Investments" is over a period of five years as required by GASB 68.
E. Discount Rate
The discount rate used to measure the total pension liability was 4.66%. This is a decrease from the
discount rate at the prior measurement date of 8.00%. The projection of cash flows used to determine the
discount rate assumed that employee contributions will be made at the fiscal 2017 contribution rate,
contributions from school districts will be made at contractually required rates (actuarially determined),
and contributions from the state will be made at current statutorily required rates. Based on those
assumptions, the pension plan's fiduciary net position was projected to be depleted in 2052 and, as a
result, the Municipal Bond Index Rate was used in determination of the Single Equivalent Interest Rate
(SEIR). The long-term expected rate of return was applied to periods before 2052 and the Municipal
Bond Index Rate of 3.01% was applied to periods on and after 2052, resulting in a SEIR of 4.66%.
Based on Fiduciary Net Position at the prior year measurement date, the discount rate of 8.00% was
used and it was not necessary to calculate the SEIR.

Independent School District No. 742 Notes to Financial Statements
61
NOTE 7 – DEFINED BENEFIT PENSION PLANS – STATE-WIDE (CONTINUED)
Teachers' Retirement Association (Continued)
F. Net Pension Liability
On June 30, 2017, the District reported a liability of $265,977,956 for its proportionate share of the net
pension liability. The net pension liability was measured as of June 30, 2016, and the total pension
liability used to calculate the net pension liability was determined by an actuarial valuation as of that
date. The District's proportion of the net pension liability was based on the District's contributions to
TRA in relation to total system contributions including direct aid from the State of Minnesota, City of
Minneapolis, and Minneapolis School District. District proportionate share was 1.1151% at the end of
the measurement period and 1.0964% for the beginning of the year.
The pension liability amount reflected a reduction due to direct aid provided to TRA. The amount
recognized by the district as its proportionate share of the net pension liability, the direct aid and total
portion of the net pension liability that was associated with the district were as follows:
District's proportionate share of net pension liability 265,977,956$
State's proportionate share of the net pension
liability associated with the District 26,696,660
There was a change in actuarial assumptions that affected the measurement of the total liability since the
prior measurement date. Post-retirement benefit adjustments are now assumed to remain level at 2.0%
annually. While in the previous measurement the COLA increased to 2.5% in 2034.
For the year ended June 30, 2017, the District recognized pension expense of $43,131,184. It recognized
$3,727,748 as an increase to this pension expense for the support provided by direct aid.
On June 30, 2017, the District had deferred resources related to pensions from the following sources:
Deferred
Outflows of
Resources
Deferred
Inflows of
Resources
Differences between expected and actual experience 2,646,408$ 7,415$
Net difference between projected and actual
earnings on plan investments 11,287,820 -
Changes of assumptions 151,600,627 -
Changes in proportion 1,464,249 -
Contributions to TRA subsequent to the measurement date 4,718,103 -
Total 171,717,207$ 7,415$

Independent School District No. 742 Notes to Financial Statements
62
NOTE 7 – DEFINED BENEFIT PENSION PLANS – STATE-WIDE (CONTINUED)
Teachers' Retirement Association (Continued)
F. Net Pension Liability (Continued)
$4,718,103 reported as deferred outflows of resources related to pensions resulting from District
contributions to TRA subsequent to the measurement date will be recognized as a reduction of the net
pension liability in the year ended June 30, 2018.
Other amounts reported as deferred outflows of resources and (deferred inflows of resources) will be
recognized in pension expense as follows:
2018 33,101,823$
2019 33,101,844
2020 36,981,761
2021 34,117,151
2022 29,689,110
Total 166,991,689$
G. Pension Liability Sensitivity
The following presents the District's proportionate share of the net pension liability calculated using the
discount rate of 4.66% as well as the liability measured using 1 percent lower and 1 percent higher.
1% decrease Current 1% increase
(3.66%) (4.66%) (5.66%)
342,646,088$ 265,977,956$ 203,534,263$
District proportionate share of NPL
The District's proportion of the net pension liability was based on the employer contributions to TRA in
relation to TRA's total employer contributions including direct aid contributions from the State of
Minnesota, City of Minneapolis, and Minneapolis School District.
H. Pension Plan Fiduciary Net Position
Detailed information about the plan's fiduciary net position is available in a separately-issued TRA
financial report. That can be obtained at www.MinnesotaTRA.org, or by writing to TRA at 60 Empire
Drive, Suite 400, St. Paul, MN, 55103-4000, or by calling (651) 296-2409 or (800) 657-3669.

Independent School District No. 742 Notes to Financial Statements
63
NOTE 7 – DEFINED BENEFIT PENSION PLANS – STATE-WIDE (CONTINUED)
Public Employees' Retirement Association
A. Plan Description
The District participates in the following cost-sharing multiple-employer defined benefit pension plans
administered by PERA. PERA's defined benefit pension plans are established and administered in
accordance with Minnesota Statutes, Chapters 353 and 356. PERA's defined benefit pension plans are
tax qualified plans under Section 401(a) of the Internal Revenue Code.
General Employees Retirement Plan (General Employees Plan (accounted for in the General Employees
Fund))
All full-time and certain part-time employees of the District other than teachers are covered by the
General Employees Plan. General Employees Plan members belong to the Coordinated Plan.
Coordinated Plan members are covered by Social Security.
B. Benefits Provided
PERA provides retirement, disability, and death benefits. Benefit provisions are established by state
statute and can only be modified by the state legislature.
Benefit increases are provided to benefit recipients each January. Increases are related to the funding
ratio of the plan. Members in plans that are at least 90% funded for two consecutive years are given
2.5% increases. Members in plans that have not exceeded 90% funded, or have fallen below 80%, are
given 1% increases.
The benefit provisions stated in the following paragraphs of this section are current provisions and apply
to active plan participants. Vested, terminated employees who are entitled to benefits but are not
receiving them yet are bound by the provisions in effect at the time they last terminated their public
service.
General Employees Plan Benefits
General Employees Plan benefits are based on a member's highest average salary for any five successive
years of allowable service, age, and years of credit at termination of service. Two methods are used to
compute benefits for PERA's Coordinated Plan members. The retiring member receives the higher of a
step-rate benefit accrual formula (Method 1) or a level accrual formula (Method 2). Under Method 1, the
annuity accrual rate for a Coordinated Plan member is 1.2% of average salary for each of the first ten
years and 1.7% for each remaining year. Under Method 2, the annuity accrual rate is 1.7% for
Coordinated Plan members for each year of service. For members hired prior to July 1, 1989, a full
annuity is available when age plus years of service equal 90 and normal retirement age is 65. For
members hired on or after July 1, 1989, normal retirement age is the age for unreduced Social Security
benefits capped at 66.

Independent School District No. 742 Notes to Financial Statements
64
NOTE 7 – DEFINED BENEFIT PENSION PLANS – STATE-WIDE (CONTINUED)
Public Employees' Retirement Association (Continued)
C. Contributions
Minnesota Statutes Chapter 353 set the rates for employer and employee contributions. Contribution
rates can only be modified by the state legislature.
General Employees Fund Contributions
Coordinated Plan members were required to contribute 6.5% of their annual covered salary in fiscal year
2017. The District was required to contribute 7.5% for Coordinated Plan members in fiscal year 2017.
The District's contributions to the General Employees Fund for the year ended June 30, 2017, were
$1,610,979. The District's contributions were equal to the required contributions as set by state statute.
D. Pension Costs
General Employees Fund Pension Costs
At June 30, 2017, the District reported a liability of $24,959,355 for its proportionate share of the
General Employees Fund's net pension liability. The District's net pension liability reflected a reduction
due to the State of Minnesota's contribution of $6 million to the fund in 2016. The State of Minnesota is
considered a non-employer contributing entity and the State's contribution meets the definition of a
special funding situation. The State of Minnesota's proportionate share of the net pension liability
associated with the District totaled $325,963. The net pension liability was measured as of June 30,
2016, and the total pension liability used to calculate the net pension liability was determined by an
actuarial valuation as of that date. The District's proportion of the net pension liability was based on the
District's contributions received by PERA during the measurement period for employer payroll paid
dates from July 1, 2015, through June 30, 2016, relative to the total employer contributions received
from all of PERA's participating employers. At June 30, 2016, the District's proportion was 0.3074%,
which was a decrease of 0.0037% from its proportion measured as of June 30, 2015.
For the year ended June 30, 2017, the District recognized pension expense of $2,842,036 for its
proportionate share of the General Employees Plan's pension expense. Included in this amount, the
District recognized $97,194 as pension expense (and grant revenue) for its proportionate share of the
State of Minnesota's contribution of $6 million to the General Employees Fund.

Independent School District No. 742 Notes to Financial Statements
65
NOTE 7 – DEFINED BENEFIT PENSION PLANS – STATE-WIDE (CONTINUED)
Public Employees' Retirement Association (Continued)
D. Pension Costs (Continued)
At June 30, 2017, the District reported its proportionate share of deferred outflows of resources and
deferred inflows of resources, and its contributions subsequent to the measurement date, from the
following sources:
Differences between expected and actual economic experience 81,990$ 2,034,021$
Changes in actuarial assumptions 5,437,671 -
Difference between projected and actual investments earnings 2,585,651 -
Changes in proportion - 850,788
District's contributions to PERA subsequent to the measurement
date 1,610,979 -
Total 9,716,291$ 2,884,809$
Deferred
Outflows of
Resources
Deferred
Inflows of
Resources
$1,610,979 reported as deferred outflows of resources related to pensions resulting from District
contributions subsequent to the measurement date will be recognized as a reduction of the net pension
liability in the year ended June 30, 2018. Other amounts reported as deferred outflows and inflows of
resources related to pensions will be recognized in pension expense as follows:
2018 1,292,340$
2019 659,736
2020 2,366,864
2021 901,563
Total 5,220,503$

Independent School District No. 742 Notes to Financial Statements
66
NOTE 8 – DEFINED BENEFIT PENSION PLANS – STATE-WIDE (CONTINUED)
Public Employees' Retirement Association (Continued)
E. Actuarial Assumptions
The total pension liability in the June 30, 2016, actuarial valuation was determined using the entry age
normal actuarial cost method and the following actuarial assumptions:
Inflation 2.50 % Per year
Active member payroll growth 3.25 % Per year
Investment rate of return 7.50 %
Salary increases were based on a service-related table. Mortality rates for active members, retirees,
survivors, and disabilitants were based on RP 2014 tables for males or females, as appropriate, with
slight adjustments. Cost of living benefit increases for retirees are assumed to be 1% per year for all
future years for the General Employees Plan.
Actuarial assumptions used in the June 30, 2016, valuation were based on the results of actuarial
experience studies. The most recent four-year experience study in the General Employees Plan was
completed in 2015.
The following changes in actuarial assumptions occurred in 2016:
• The assumed post-retirement benefit increase rate was changed from 1.0% per year through
2035 and 2.5% per year thereafter to 1.0% per year for all future years.
• The assumed investment return was changed from 7.9% to 7.5%. The single discount rate
was changed from 7.9% to 7.5%.
• Other assumptions were changed pursuant to the experience study dated June 30, 2015. The
assumed future salary increases, payroll growth, and inflation were decreased by 0.25% to
3.25% for payroll growth and 2.50% for inflation.
The State Board of Investment, which manages the investments of PERA, prepares an analysis of the
reasonableness of the long-term expected rate of return using a building-block method in which best-
estimate ranges of expected future rates of return are developed for each major asset class. These ranges
are combined to produce an expected long-term rate of return by weighting the expected future rates of
return by the target asset allocation percentages.

Independent School District No. 742 Notes to Financial Statements
67
NOTE 7 – DEFINED BENEFIT PENSION PLANS – STATE-WIDE (CONTINUED)
Public Employees' Retirement Association (Continued)
E. Actuarial Assumptions (Continued)
The target allocation and best estimates of geometric real rates of return for each major asset class are
summarized in the following table:
Target Allocation
Domestic stocks 45%
International stocks 15%
Bonds 18%
Alternative assets 20%
Cash 2%
Total 100%
6.40
0.50
Asset Class
Long-Term
Expected Real
Rate of Return
5.50%
6.00
1.45
F. Discount Rates
The discount rate used to measure the total pension liability in 2016 was 7.5%, a reduction from the
7.9% used in 2015. The projection of cash flows used to determine the discount rate assumed that
contributions from plan members and employers will be made at rates set in Minnesota Statutes. Based
on these assumptions, the fiduciary net position was projected to be available to make all projected
future benefit payments of current plan members. Therefore, the long-term expected rate of return on
pension plan investments was applied to all periods of projected benefit payments to determine the total
pension liability.
G. Pension Liability Sensitivity
The following table presents the District's proportionate share of the net pension liability for all plans it
participates in, calculated using the discount rate disclosed in the preceding paragraph, as well as what
the District's proportionate share of the net pension liability would be if it were calculated using a
discount rate 1 percentage point lower or 1 percentage point higher than the current discount rate:
1% Decrease in 1% Increase in
Discount Rate Discount Rate Discount Rate
(6.5%) (7.5%) (8.5%)
District's proportionate share of
the PERA net pension liability 35,449,682$ 24,959,355$ 16,318,181$

Independent School District No. 742 Notes to Financial Statements
68
NOTE 7 – DEFINED BENEFIT PENSION PLANS – STATE-WIDE (CONTINUED)
H. Pension Plan Fiduciary Net Position
Detailed information about the General Employees Fund's fiduciary net position is available in a
separately-issued PERA financial report that includes the financial statements and required
supplementary information. That report may be obtained on the Internet at www.mnpera.org.
NOTE 8 – POST EMPLOYMENT HEALTH CARE PLAN
A. Plan Description
The District provides a single-employer defined benefit health care plan to eligible retirees and their
spouses through the District's self-insured health insurance plan. It is the District's policy to periodically
review its medical coverage and to obtain requests for proposals in order to provide the most favorable
benefits and premiums for District employees and retirees.
B. Funding Policy
Retirees and their spouses contribute to the health care plan at the same rate as District employees. This
results in the retirees receiving an implicit rate subsidy. Contribution requirements are established by the
District, based on the contract terms with health insurance providers. The required contributions are
based on projected pay-as-you-go financing requirements. Certain employees are also eligible for retiree
insurance benefits as described in Note 1. O. 2. For 2017, the District contributed $50,179 of implicit
rate subsidy and $532,726 in District paid premiums for retirees to the plan.
As of July 1, 2016, there were 1,478 total active employees, of which 1,066 had elected medical
coverage. There were 15 retirees and beneficiaries receiving medical benefits from the District's health
plan.
C. Annual Other Post Employment Benefits Cost and Net Other Post Employment Benefits
Obligation
The District's annual OPEB cost (expense) is calculated based on the annual required contribution
(ARC) of the District, an amount actuarially determined in accordance with the parameters of GASB
Statement No. 45. The District prospectively implemented this Statement during the 2010 year. The
ARC represents a level of funding that, if paid on an ongoing basis, is projected to cover normal cost
each year and amortize any unfunded actuarial liabilities (or funding excess) as a level dollar amount
over a 30-year open period. The table on the following page shows the components of the District's
annual OPEB cost of the year, the amount actually contributed to the plan and changes in the District's
net OPEB obligation to the plan.
ARC 977,944$
Interest on net OPEB obligation (79,248)
Adjustment to ARC 123,109
Annual OPEB cost (expense) 1,021,805
Contributions made (582,905)
Increase (decrease) in net OPEB obligation 438,900
Net OPEB obligation - beginning of year (2,264,237)
Net OPEB obligation - end of year (1,825,337)$

Independent School District No. 742 Notes to Financial Statements
69
NOTE 8 – POST EMPLOYMENT HEALTH CARE PLAN (CONTINUED)
C. Annual Other Post Employment Benefits Cost and Net Other Post Employment Benefits
Obligation (Continued)
The District's annual OPEB cost, the percentage of annual OPEB cost contributed to the plan and the net
OPEB obligation for the past three years are as follows:
Percentage of
Year Annual OPEB Employer Annual OPEB Net OPEB
Ended Cost Contribution Cost Contributed Obligation
06/30/15 889,875$ 549,419$ 62% (2,913,672)$
06/30/16 1,585,585 936,150 59% (2,264,237)
06/30/17 1,021,805 582,905 57% (1,825,337)
D. Funded Status and Funding Progress
As of July 1, 2016, the most recent actuarial valuation date, the District had no assets deposited to fund
the plan. The actuarial accrued liability for benefits was $8,713,032 and the actuarial value of assets was
$0, resulting in an unfunded actuarial accrued liability (UAAL) of $8,713,032. The covered payroll
(annual payroll of active employees covered by the plan) was $86,525,000, and the ratio of the UAAL to
the covered payroll was 10.1%.
Actuarial valuations involve estimates of the value of reported amounts and assumptions about the
probability of occurrence of events far into the future. Examples include assumptions about future
employment, mortality and the health care cost trend. Amounts determined regarding the funded status
of the plan and the ARC of the employer are subject to continual revision as actual results are compared
with past expectations and new estimates are made about the future.
The Schedule of Funding Progress – Other Post Employment Benefits, presented as required
supplementary information following the notes to financial statements, presents multi-year trend
information about whether the actuarial value of plan assets is increasing or decreasing over time
relative to the actuarial accrued liabilities for benefits.
On October 22, 2009, the District issued $8,000,000 G.O. Taxable OPEB Bonds, Series 2010B to
partially fund the OPEB liability. Since these proceeds were placed in a revocable trust, the financing of
the obligation does not qualify as funding the liability under GASB Statement No. 45. The activity
related to the OPEB revocable trust is presented in the OPEB Internal Service Fund. As of June 30,
2017, the net position of this Fund totaled $981,891.
E. Actuarial Methods and Assumptions
Projections of benefits for financial reporting purposes are based on the substantive plan (the plan as
understood by the employer and the plan members) and include the types of benefits provided at the
time of each valuation and the historical pattern of sharing of benefit costs between the employer and
plan members to that point. The actuarial methods and assumptions used include techniques that are
designed to reduce the effects of short-term volatility in actuarial accrued liabilities, consistent with the
long-term perspective of the calculations.

Independent School District No. 742 Notes to Financial Statements
70
NOTE 8 – POST EMPLOYMENT HEALTH CARE PLAN (CONTINUED)
E. Actuarial Methods and Assumptions (Continued)
At the July 1, 2016, actuarial valuation date, the projected unit credit cost method was used. The
actuarial assumptions included a 3.5% discount rate, which is based on the investment yield expected to
finance benefits. At the actuarial valuation date, the annual health care cost trend rate was calculated to
be 6.6% initially, reduced incrementally to an ultimate rate of 4.4% after sixty years. Both rates included
a 2.75% inflation assumption. The UAAL is being amortized as a level dollar amount on an open basis.
The remaining amortization period at July 1, 2016, was 30 years.
NOTE 9 – RISK MANAGEMENT
The District is exposed to various risks of loss related to torts: theft of, damage to and destruction of
assets; errors and omissions; natural disasters; and injuries to employees for which the District carries
commercial insurance. Settled claims have not exceeded this commercial coverage in any of the past
three fiscal years. There were no significant reductions in the District's insurance coverage during the
year ending June 30, 2017.
Since 2009, the District has provided a dental care self-insurance program. Under this program, the fund
provides up to a maximum of $1,000 for each dental claim. All funds of the District participate in this
program and make payments to the Dental Insurance Internal Service Fund. Based on the requirements
of GASB Statement No. 10, a liability is reported if information prior to the issuance of the financial
statements indicates it is probable a liability has been incurred at the date of the financial statements and
the amount of the loss can be reasonably estimated. The total claims liability reported in the fund at
June 30, 2017 was $111,667 which is comprised of the liability for known claims as well as an estimate
for claims incurred but not yet reported. Changes in the fund's claims liability amounts for the past three
years are as follows.
Beginning Claims Expense Claims Ending
Year Balance and Estimates Payments Balance
2015 83,496$ 1,164,750$ 1,157,165$ 91,081$
2016 91,081 1,160,451 1,168,813 82,719
2017 82,719 1,242,349 1,213,401 111,667

Independent School District No. 742 Notes to Financial Statements
71
NOTE 9 – RISK MANAGEMENT (CONTINUED)
Since 2014, the District has provided a health care self-insurance program. Under this program, the fund
provides up to a maximum of $200,000 for each health claim. All funds of the District participate in this
program and make payments to the Health Insurance Internal Service Fund. Based on the requirements
of GASB Statement No. 10, a liability is reported if information prior to the issuance of the financial
statements indicates it is probable a liability has been incurred at the date of the financial statements and
the amount of the loss can be reasonably estimated. The total claims liability reported in the fund at
June 30, 2017, was $1,329,315 which is comprised of the liability for known claims as well as an
estimate for claims incurred but not yet reported. Changes in the fund's claims liability amounts for the
past three years are as follows:
Beginning Claims Expense Claims Ending
Year Balance and Estimates Payments Balance
2015 1,235,619$ 15,203,714$ 15,207,439$ 1,231,894$
2016 1,231,894 17,282,611 17,066,826 1,447,679
2017 1,447,679 14,103,894 14,222,258 1,329,315
NOTE 10 – CONTINGENCIES
A. Lawsuits
There are several lawsuits pending in which the District is involved. The District estimates the potential
claims against the District, not covered by insurance resulting from such litigation, would not materially
affect the financial statements of the District.
B. Program Compliance
Federal and state program activities are subject to financial and compliance regulation. To the extent any
expenditures are disallowed or other compliance features are not met, a liability to the respective grantor
agencies could result.

Independent School District No. 742 Notes to Financial Statements
72
NOTE 11 – COMMITMENTS
As of June 30, 2017, the District had construction commitments outstanding for the following amounts:
Total Expended Remaining
Project Contract to Date Contract
Apollo HVAC project and controls 15,336,435$ 4,906,959$ 10,429,476$
South secure entrance 396,000 183,871 212,129
Discovery tennis court relocation 453,885 302,750 151,135
Quarryview Education Center 12,315,639 892,415 11,423,224
Apollo roofing 699,544 - 699,544
Talahi roofing 659,700 - 659,700
Clearview roofing 241,790 - 241,790
Lincoln portable classrooms 410,930 - 410,930
North bleacher replacement 105,338 - 105,338
North gym floor replacement 52,675 - 52,675
Oak Hill irrigation repairs 7,595 - 7,595
Talahi intercom system 19,590 - 19,590
Apollo pool upgrades 329,000 - 329,000
Apollo stadium lights 311,987 - 311,987
Talahi playground surfacing 132,653 - 132,653
31,472,761$ 6,285,995$ 25,186,766$
NOTE 12 – PRIOR PERIOD ADJUSTMENT
A prior period adjustment was required in the amount of $344,026 in the Food Service Fund to record
amounts due from the state and federal government for reimbursement for meals served in November
2015 that were not received until August 2016.
NOTE 13 – GASB STANDARDS ISSUED BUT NOT YET IMPLEMENTED
GASB has issued GASB statement 75 relating to accounting and financial reporting for postemployment
benefits other than pensions. The new statement requires governments in all types of OPEB plans to
present more extensive note disclosures and required supplementary information (RSI) about OPEB
liabilities.

73
REQUIRED SUPPLEMENTARY INFORMATION

Independent School District No. 742
Schedule of Funding Progress - Other Post Employment Benefits
Year Ended June 30, 2017
Actuarial
Accrued Liability UAAL as a
Actuarial (AAL) - Unfunded Percentage of
Actuarial Value of Projected Unit AAL Funded Covered Covered
Valuation Assets Credit (UAAL) Ratio Payroll Payroll
Date (a) (b) (b-a) (a/b) (c) ((b-a)/c)
07/01/12 -$ 9,133,245$ 9,133,245$ 0.0% 67,930,468$ 13.4%
07/01/14 - 6,645,178 6,645,178 0.0% 76,139,426 8.7%
07/01/16 - 8,713,032 8,713,032 0.0% 86,525,000 10.1%
74
St. Cloud Area Schools

Annual
Year Ended OPEB Employer Percentage Net OPEB
June 30, Cost Contributions Contributed Obligaton
2014 964,609$ 1,200,006$ 124% (3,254,128)$
2015 889,875 549,419 62% (2,913,672)
2016 1,585,585 936,150 59% (2,264,237)
2017 1,021,805 582,905 57% (1,825,337)
75
Independent School District No. 742
Schedule of Employer Contributions - Other Post Employment Benefits
June 30, 2017

2014 0.3412% 16,027,867$ -$ 16,027,867$ 17,914,041$ 89.5% 78.7%
2015 0.3111% 16,122,817 - 16,122,817 17,982,867 89.7% 78.2%
2016 0.3074% 24,959,355 325,963 25,285,318 19,074,613 130.9% 68.9%
Note: Schedule is intended to show ten year trend. Additional years will be reported as they become available.
For
Fiscal
Year
Ended
June 30,
District's
Proportio
n of the
Net
Pension
Liability
(Asset)
District's
Proportionate
Share of the Net
Pension
Liability
(Asset)
District's
Proportionate
Share of State
of Minnesota's
Proportionated
Share of the
Net Pension
Liability
District's
Proportionate
Share of the
Net Pension
Liability and
District's
Share of the
State of
Minnesota's
Share of the
Net Pension
of Liability
District's
Covered
Payroll
District's
Proportionate
Share of the
Net Pension
Liability
(Asset) as a
Percentage of
its Covered
Payroll
Plan
Fiduciary
Net Position
as a
Percentage
of the Total
Pension
Liability
2014 1.1334% 52,226,256$ 3,673,947$ 55,900,203$ 51,738,486$ 100.9% 81.5%
2015 1.0964% 67,823,183 8,319,269 76,142,452 55,648,787 121.9% 76.8%
2016 1.1151% 265,977,956 26,696,660 292,674,616 58,007,307 458.5% 44.9%
Note: Schedule is intended to show ten year trend. Additional years will be reported as they become available.
See notes to required supplementary information. 76
District's
Covered
Payroll
Schedule of District's and Non-Employer Proportionate Share
Plan
Fiduciary
Net Position
as a
Percentage
of the Total
Pension
Liability
District's
Proportionate
Share of State
of Minnesota's
Proportionated
Share of the
Net Pension
Liability
District's
Proportionate
Share of the
Net Pension
Liability and
District's
Share of the
State of
Minnesota's
Share of the
Net Pension
Independent School District No. 742
Schedule of District's and Non-Employer Proportionate Share
(if Applicable) of Net Pension Liability
Last Ten Years General Employees Retirement Funds
(if Applicable) of Net Pension Liability
Last Ten Years TRA Retirement Funds
For
Fiscal
Year
Ended
June 30,
District's
Proportio
n of the
Net
Pension
Liability
(Asset)
District's
Proportionate
Share of the Net
Pension
Liability
(Asset)
District's
Proportionate
Share of the
Net Pension
Liability
(Asset) as a
Percentage of
its Covered
Payroll

2014 1,298,768$ 1,298,768$ - 17,914,041$ 7.25%
2015 1,348,715 1,348,715 - 17,982,867 7.50%
2016 1,430,596 1,430,596 - 19,074,613 7.50%
2017 1,610,979 1,610,979 - 21,479,720 7.50%
Note: Schedule is intended to show ten year trend. Additional years will be reported as they become available.
2014 3,621,694$ 3,621,694$ -$ 51,738,486$ 7.00%
2015 4,173,659 4,173,659 - 55,648,787 7.50%
2016 4,350,548 4,350,548 - 58,007,307 7.50%
2017 4,718,103 4,718,103 - 62,908,040 7.50%
Note: Schedule is intended to show ten year trend. Additional years will be reported as they become available.
See notes to required supplementary information. 77
Schedule of District Contributions
TRA Retirement Funds
Last Ten Years
Contributions in
Relation to the
Statutorily
Required
Contributions
Contribution
Deficiency
(Excess)
District's
Covered Payroll
Contributions as
a Percentage of
Covered Payroll
Statutorily
Required
Contribution
For Fiscal
Year Ended
June 30,
Independent School District No. 742
Schedule of District Contributions
General Employees Retirement Funds
Last Ten Years
Contributions as
a Percentage of
Covered Payroll
Contributions in
Relation to the
Statutorily
Required
Contributions
Contribution
Deficiency
(Excess)
District's
Covered Payroll
Statutorily
Required
Contribution
For Fiscal
Year Ended
June 30,
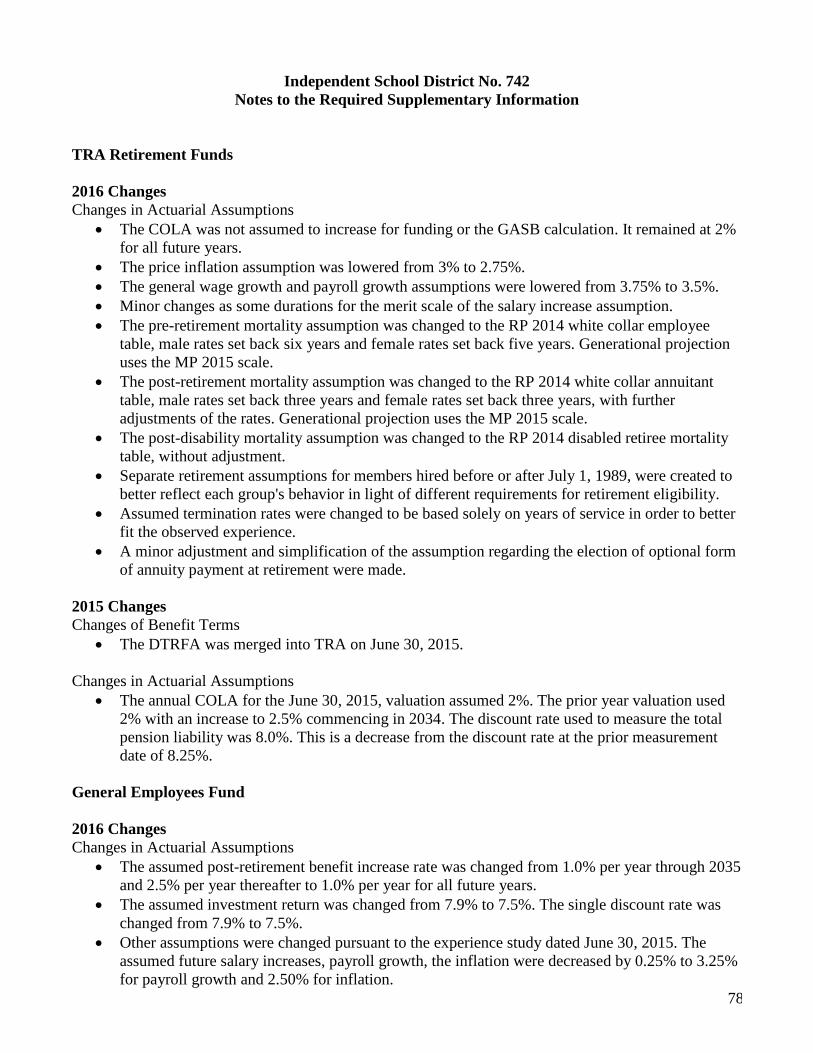
78
Independent School District No. 742
Notes to the Required Supplementary Information
TRA Retirement Funds
2016 Changes
Changes in Actuarial Assumptions
• The COLA was not assumed to increase for funding or the GASB calculation. It remained at 2%
for all future years.
• The price inflation assumption was lowered from 3% to 2.75%.
• The general wage growth and payroll growth assumptions were lowered from 3.75% to 3.5%.
• Minor changes as some durations for the merit scale of the salary increase assumption.
• The pre-retirement mortality assumption was changed to the RP 2014 white collar employee
table, male rates set back six years and female rates set back five years. Generational projection
uses the MP 2015 scale.
• The post-retirement mortality assumption was changed to the RP 2014 white collar annuitant
table, male rates set back three years and female rates set back three years, with further
adjustments of the rates. Generational projection uses the MP 2015 scale.
• The post-disability mortality assumption was changed to the RP 2014 disabled retiree mortality
table, without adjustment.
• Separate retirement assumptions for members hired before or after July 1, 1989, were created to
better reflect each group's behavior in light of different requirements for retirement eligibility.
• Assumed termination rates were changed to be based solely on years of service in order to better
fit the observed experience.
• A minor adjustment and simplification of the assumption regarding the election of optional form
of annuity payment at retirement were made.
2015 Changes
Changes of Benefit Terms
• The DTRFA was merged into TRA on June 30, 2015.
Changes in Actuarial Assumptions
• The annual COLA for the June 30, 2015, valuation assumed 2%. The prior year valuation used
2% with an increase to 2.5% commencing in 2034. The discount rate used to measure the total
pension liability was 8.0%. This is a decrease from the discount rate at the prior measurement
date of 8.25%.
General Employees Fund
2016 Changes
Changes in Actuarial Assumptions
• The assumed post-retirement benefit increase rate was changed from 1.0% per year through 2035
and 2.5% per year thereafter to 1.0% per year for all future years.
• The assumed investment return was changed from 7.9% to 7.5%. The single discount rate was
changed from 7.9% to 7.5%.
• Other assumptions were changed pursuant to the experience study dated June 30, 2015. The
assumed future salary increases, payroll growth, the inflation were decreased by 0.25% to 3.25%
for payroll growth and 2.50% for inflation.

79
Independent School District No. 742
Notes to the Required Supplementary Information
General Employees Fund (Continued)
2015 Changes
Changes in Plan Provisions
• On January 1, 2015, the Minneapolis Employees Retirement Fund was merged into the General
Employees Fund, which increased the total pension liability by $1.1 billion and increased the
fiduciary plan net position by $892 million. Upon consolidation, state and employer
contributions were revised.
Changes in Actuarial Assumptions
• The assumed post-retirement benefit increase rate was changed from 1.0% per year through 2030
and 2.5% per year thereafter to 1.0% per year through 2035 and 2.5% per year thereafter.

80
(THIS PAGE LEFT BLANK INTENTIONALLY)

81
SUPPLEMENTARY INFORMATION

Dental
Insurance
Health
Insurance OPEB
Total Internal
Service Funds
Assets
Cash and investments 467,515$ -$ 4,759,005$ 5,226,520$
Due from other funds - 2,254,831 - 2,254,831
Interest receivable - - 52,711 52,711 Total assets 467,515$ 2,254,831$ 4,811,716$ 7,534,062$
Liabilities
Insurance claims payable 111,667$ 1,329,315$ - 1,440,982$
Due to other funds - 75,601 3,829,825 3,905,426
Total liabilities 111,667 1,404,916 3,829,825 5,346,408
Net Position
Unrestricted 355,848 849,915 981,891 2,187,654
Total liabilities andnet position 467,515$ 2,254,831$ 4,811,716$ 7,534,062$
See notes to financial statements. 82
Independent School District No. 742
Combining Statement of Net Position - Internal Service Funds
June 30, 2017

Dental
Insurance
Health
Insurance OPEB
Total Internal
Service Funds
Operating Revenue
Charges for services 1,199,364$ 15,413,244$ -$ 16,612,608$
Retiree contributions - - 367,909 367,909
Total operating revenues 1,199,364 15,413,244 367,909 16,980,517
Operating Expenses
Insurance claims 1,242,349 14,417,915 - 15,660,264
Insurance premiums - - 4,197,734 4,197,734
Depreciation expense - 7,833 - 7,833
Total operating expenses 1,242,349 14,425,748 4,197,734 19,865,831
Operating income (loss) (42,985) 987,496 (3,829,825) (2,885,314)
Nonoperating Revenue/Expenses
Investment income 1,345 - 89,900 91,245
Loss on disposal of assets - (180,163) - (180,163)
Total nonoperating revenue/
(expenses) 1,345 (180,163) 89,900 (88,918)
Change in net position (41,640) 807,333 (3,739,925) (2,974,232)
Net Position
Beginning of year 397,488 42,582 4,721,816 5,161,886
End of year 355,848$ 849,915$ 981,891$ 2,187,654$
See notes to financial statements. 83
Independent School District No. 742
Combining Statement of Revenues, Expenses, and Changes
in Fund Net Position - Internal Service Funds
Year Ended June 30, 2017

Dental
Insurance
Health
Insurance OPEB
Total Internal
Service Funds
Cash Flows - Operating Activities
Employee insurance deductions
Received from other funds 1,199,364$ 13,158,413$ -$ 14,357,777$
Receipts from retirees - - 367,909 367,909
Insurance claims and fees paid (1,213,401) (14,536,279) - (15,749,680)
Insurance premiums paid - - (367,909) (367,909)
Net cash flows - operating activities (14,037) (1,377,866) - (1,391,903)
Cash Flows - Noncapital Financing
Activities
Amounts borrowed to other funds - - - -
Amounts borrowed from other funds - 75,601 - 75,601
Net cash flows - noncapital financing activities - 75,601 - 75,601
Cash Flows - Investing Activities
Interest received 1,345 - 78,503 79,848
Net Change in Cash and Cash Equivalents (12,692) (1,302,265) 78,503 (1,236,454)
Cash and Cash Equivalents
Beginning of year 480,207 1,302,265 4,680,502 6,462,974
End of year 467,515$ -$ 4,759,005$ 5,226,520$
Reconciliation of Operating
Income (Loss) to Net Cash Flows-
Operating Activities
Operating income (loss) (42,985)$ 987,496$ (3,829,825)$ (2,885,314)$
Adjustments to reconcile operating income
to net cash flows - operating activities
Depreciation expense - 7,833 - 7,833
Change in due from other funds - (2,254,831) - (2,254,831)
Change in insurance claims payable 28,948 (118,364) - (89,416)
Change in due to other funds - - 3,829,825 3,829,825
Net cash flows - operating activities (14,037)$ (1,377,866)$ -$ (1,391,903)$
Noncash Transactions
Loss on disposal of building -$ 180,163$ -$ 180,163$
See notes to financial statements. 84
Independent School District No. 742
St. Cloud Area Schools
Combining Statement of Cash Flows - Internal Service Funds
Year Ended June 30, 2017

Audit UFARS Audit-UFARS Audit UFARS Audit-UFARS
01 General Fund 06 Building Construction Fund
Total revenue 137,528,584$ 137,528,587$ (3)$ Total revenue 42,374$ 42,375$ (1)$
Total expenditures 138,392,174 138,392,171 3 Total expenditures 20,450,179 20,450,180 (1)
Nonspendable: Nonspendable:
460 Nonspendable fund balance 393,869 393,869 - 460 Nonspendable fund balance - - -
Restricted/reserved: Restricted/reserved:
403 Staff Development - - - 407 Capital Projects Levy - - -
406 Health and Safety (1,103,780) (1,103,780) - 413 Building Projects Funded by COP 15,531,058 15,531,058 -
407 Capital Projects Levy - - - 467 Long-term Facitlities Maintenance 4,724,402 4,724,402 -
408 Cooperative Programs - - - Restricted:
413 Project Funded by COP - - - 464 Restricted fund balance 103,603,630 103,603,630 -
414 Operating Debt - - - Unassigned:
416 Levy Reduction - - - 463 Unassigned fund balance - - -
417 Taconite Building Maintenance - - -
424 Operating Capital 2,498,856 2,498,856 - 07 Debt Service Fund
426 $25 Taconite - - - Total revenue 6,926,785$ 6,926,784$ 1$
427 Disabled Accessibility - - - Total expenditures 28,411,947 28,411,946 1
428 Learning and Development - - - Nonspendable:
434 Area Learning Center 445,054 445,055 (1) 460 Nonspendable fund balance - - -
435 Contracted Alternative Programs - - - Restricted/reserved:
436 State Approved Alternative Program - - - 425 Bond Refunding - - -
438 Gifted and Talented 60,807 60,807 - 451 QZAB Payments - - -
440 Teacher Development and Evaluation 46,874 46,874 - Restricted:
441 Basic Skills Programs - - - 464 Restricted fund balance 1,085,642 1,085,642 -
445 Career Technical Programs - - - Unassigned:
448 Achievement and Integration - - - 463 Unassigned fund balance - - -
449 Safe School Crime - - -
450 Transition to Pre-Kindergarten - - - 08 Trust Fund
451 QZAB and QSCB Payments - - - Total revenue 73,862$ 73,862$ -$
452 OPEB Liabilities not Held in Trust - - - Total expenditures 176,014 176,013 1
453 Unfunded Severance and Unassigned:
Retirement Levy - - - 422 Net position 241,497 241,497 -
467 Long-term Facilities Maintenance 1,116,473 1,116,473 -
472 Medical Assistance - - - 20 Internal Service Fund
Restricted: Total revenue 16,613,953$ 16,613,954$ (1)$
464 Restricted fund balance - - - Total expenditures 15,848,260 15,848,261 (1)
Committed: Unassigned:
418 Committed for separation - - - 422 Net position 1,205,763 1,205,762 1
461 Committed - - -
Assigned: 25 OPEB Revocable Trust
462 Assigned fund balance 8,177,574 8,177,574 - Total revenue 457,809$ 457,810$ (1)$
Unassigned: Total Expenditures 4,197,734 4,197,734 -
422 Unassigned fund balance 9,334,878 9,334,880 (2) Unassigned:
422 Net position 981,891 981,891 -
02 Food Services Fund
Total revenue 5,836,466$ 5,836,466$ -$ 45 OPEB Irrevocable Trust
Total expenditures 5,839,057 5,839,059 (2) Total revenue -$ -$ -$
Nonspendable: Total expenditures - - -
460 Nonspendable fund balance 69,537 69,537 - Unassigned:
Restricted/reserved: 422 Net position - - -
452 OPEB liabilities not held in trust - - -
Restricted: 47 Opeb Debt Service
464 Restricted fund balance 414,553 414,553 - Total revenue -$ -$ -$
Unassigned: Total expenditures - - -
463 Unassigned fund balance - - - Nonspendable:
460 Nonspendable fund balance - - -
04 Community Service Fund Restricted:
Total revenue 6,186,854$ 6,186,852$ 2$ 425 Bond refunding - - -
Total expenditures 5,728,923 5,728,918 5 464 Restricted fund balance - - -
Nonspendable: Unassigned:
460 Nonspendable fund balance 315 315 - 463 Unassigned fund balance - - -
Restricted/reserved:
426 $25 Taconite - - -
431 Community Education 496,895 496,895 -
432 ECFE 233,860 233,860 -
444 School Readiness 322,161 322,161 -
447 Adult Basic Education 146,492 146,492 -
452 OPEB Liabilities not Held in Trust - - -
Restricted:
464 Restricted fund balance 88,837 88,838 (1)
Unassigned:
463 Unassigned fund balance - - -
85
Independent School District No. 742
Uniform Financial Accounting and Reporting Standards
Compliance Table
Year Ended June 30, 2017

CFDA
Federal Agency/Pass Through Agency/Program Title Number Expenditures
U.S. Department of Agriculture
Through Minnesota Department of Education
Child Nutrition Cluster
School Breakfast Program 10.553 936,208$
Child Nutrition Type A Lunch 10.555 2,788,680
Commodities (Noncash) 10.555 363,193
Commodities Rebates 10.555 73,496
Special Milk 10.556 4,192
Total Child Nutrition Cluster 4,165,769
Child Nutrition Discretionary Grants 10.579 6,602
Fresh Fruit and Vegetable Program 10.582 125,390
Total U.S. Department of Agriculture 4,297,761
U.S. Department of Education
Received Directly
Indian Education Grants to Local Education Agencies 84.060 40,120
Through Minnesota Department of Education
Library Services and Technology Association 45.310 78,952
Federal Adult Basic Education Aid 84.002 134,788
Title I, Part A
Title I, Part A 84.010 2,370,361
Title I, Part D 84.010A 22,709
Total Title I, Part A 2,393,070
Special Education Cluster
Special Education 84.027 2,505,557
Disabled Early Education 84.173 86,907
Total Special Education Cluster 2,592,464
Infants and Toddlers 84.181 80,088
Title X, Part C - Subdivision B - Education for Homeless Children and Youths 84.196 40,000
Title III, Part A - English Language Acquisition 84.365 252,162
Title II, Part A - Improving Teacher Quality 84.367 328,309
Through Independent School District No. 966 - Wright Technical Center:
Carl Perkins 84.048 81,780
Total U.S. Department of Education 6,021,733
U.S. Department of Health and Human Services
Received Directly
Substance Abuse and Mental Health Services 93.243 15,224
Total Federal Expenditures 10,334,718$
See notes to the Schedule of Expenditures of Federal Awards. 86
Year Ended June 30, 2017
Independent School District No. 742
Schedule of Expenditures of Federal Awards

87
Independent School District No. 742
Notes to the Schedule of Expenditures of Federal Awards
June 30, 2017
NOTE 1 – BASIS OF PRESENTATION
The accompanying Schedule of Expenditures of Federal Awards includes the federal grant activity of
the District and is presented on the modified accrual basis of accounting. The information in this
Schedule is presented in accordance with the requirements of the Uniform Guidance. Therefore, some
amounts presented in this Schedule may differ from amounts presented in, or used in the preparation of
the financial statements.
NOTE 2 – PASS-THROUGH GRANT NUMBERS
All pass-through entities listed above use the same CFDA numbers as the federal grantors to identify
these grants and have not assigned any additional identifying numbers.
NOTE 3 – INVENTORY
Inventories of commodities donated by the U.S. Department of Agriculture are recorded at market value
in the Food Service Fund as inventory. Revenue and expenditures are recorded when commodities are
used.
NOTE 4 – INDIRECT COST RATE
The District did not elect to use the 10 percent de minimis indirect cost rate.

88
(THIS PAGE LEFT BLANK INTENTIONALLY)

89
BerganKDV, Ltd. bergankdv.com
Report on Internal Control over Financial Reporting
and on Compliance and Other Matters Based on an Audit
of Financial Statements Performed in Accordance
with Government Auditing Standards
Independent Auditor's Report
To the School Board
Independent School District No. 742
St. Cloud, Minnesota
We have audited, in accordance with the auditing standards generally accepted in the United
States of America and the standards applicable to financial audits contained in Government
Auditing Standards, issued by the Comptroller General of the United States, the financial
statements of the governmental activities, each major fund and the aggregate remaining fund
information of Independent School District No. 742, St. Cloud, Minnesota, as of and for the
year ending June 30, 2017, and the related notes to financial statements, which collectively
comprise the District's basic financial statements and have issued our report thereon dated
November 6, 2017.
Internal Control over Financial Reporting
In planning and performing our audit of the financial statements, we considered the District's
internal control over financial reporting (internal control) to determine the audit procedures
that are appropriate in the circumstances for the purpose of expressing our opinions on the
financial statements, but not for the purpose of expressing an opinion on the effectiveness of
the District's internal control. Accordingly, we do not express an opinion on the
effectiveness of the District's internal control.
A deficiency in internal control exists when the design or operation of a control does not
allow management or employees, in the normal course of performing their assigned
functions, to prevent, or detect and correct, misstatements, on a timely basis. A material
weakness is a deficiency, or a combination of deficiencies, in internal control such that there
is a reasonable possibility that a material misstatement of the District's financial statements
will not be prevented, or detected and corrected, on a timely basis. A significant deficiency
is a deficiency, or a combination of deficiencies, in internal control that is less severe than a
material weakness, yet important enough to merit attention by those charged with
governance.

90
Internal Control over Financial Reporting (Continued)
Our consideration of the internal control was for the limited purpose described in the first
paragraph of this section and was not designed to identify all deficiencies in the internal
control that might be material weaknesses or significant deficiencies and therefore, material
weaknesses or significant deficiencies may exist that were not identified. Given these
limitations, during our audit, we did not identify any deficiencies in internal control that we
consider to be material weaknesses. We did identify a deficiency in internal control
described in the accompanying Schedule of Findings and Questioned Costs in Accordance
with the Uniform Guidance that we consider to be a significant deficiency in internal
control, Audit Finding 2005-001.
Compliance and Other Matters
As part of obtaining reasonable assurance about whether the District's financial statements
are free from material misstatement, we performed tests of its compliance with certain
provisions of laws, regulations, contracts, and grant agreements, noncompliance with which
could have a direct and material effect on the determination of financial statement amounts.
However, providing an opinion on compliance with those provisions was not an objective of
our audit and, accordingly, we do not express such an opinion. The results of our tests
disclosed no instances of noncompliance or other matters that are required to be reported
under Government Auditing Standards.
District's Response to the Findings
The District's responses to the findings identified in our audit are described in the
accompanying Schedule of Findings and Questioned Costs in Accordance with the Uniform
Guidance. The District's responses were not subjected to the auditing procedures applied in
the audit of the financial statements and, accordingly, we express no opinion on them.
Purpose of this Report
The purpose of this report is solely to describe the scope of our testing of internal control
and compliance and the result of that testing, and not to provide an opinion on the
effectiveness of the District's internal control or on compliance. This report is an integral
part of an audit performed in accordance with Government Auditing Standards in
considering the District's internal control and compliance. Accordingly, this communication
is not suitable for any other purpose.
St. Cloud, Minnesota
November 6, 2017
91
BerganKDV, Ltd. bergankdv.com
Report on Compliance for each Major Federal Program and on Internal
Control over Compliance Required by the Uniform Guidance
Independent Auditor's Report
To the School Board
Independent School District No. 742
St. Cloud, Minnesota
Report on Compliance for Each Major Federal Program
We have audited the compliance of Independent School District No. 742, St. Cloud,
Minnesota with the types of compliance requirements described in the OMB Compliance
Supplement that could have a direct and material effect on each of the District's major
federal programs for the year ended June 30, 2017. The District's major federal programs are
identified in the summary of auditor's results section of the accompanying Schedule of
Findings and Questioned Costs in Accordance with the Uniform Guidance.
Management's Responsibility
Management is responsible for compliance with federal statues, regulations, and the terms
and conditions of its federal awards applicable to its federal programs.
Auditor's Responsibility
Our responsibility is to express an opinion on compliance for each of the District's major
federal programs based on our audit of the types of compliance requirements referred to
above. We conducted our audit of compliance in accordance with auditing standards
generally accepted in the United States of America; the standards applicable to financial
audits contained in Government Auditing Standards, issued by the Comptroller General of
the United States; and the audit requirements of Title 2 U.S. Code of Federal Regulations
Part 200, Uniform Administrative Requirements, Cost Principles, and Audit Requirements
of Federal Awards (Uniform Guidance). Those standards and the Uniform Guidance require
that we plan and perform the audit to obtain reasonable assurance about whether
noncompliance with the types of compliance requirements referred to above that could have
a direct and material effect on a major federal program occurred. An audit includes
examining, on a test basis, evidence about the District's compliance with those requirements
and performing such other procedures as we considered necessary in the circumstances.
We believe that our audit provides a reasonable basis for our opinion on compliance for each
major federal program. However, our audit does not provide legal determination of the
District's compliance.

92
Opinion on Each Major Federal Program
In our opinion, Independent School District No. 742 complied, in all material respects, with
the types of compliance requirements referred to above that could have a direct and material
effect on each of its major federal programs for the year ended June 30, 2017.
Report on Internal Control over Compliance
Management of the District is responsible for establishing and maintaining effective internal
control over compliance with the types of compliance requirements referred to above. In
planning and performing our audit of compliance, we considered the District's internal
control over compliance with the types of requirements that could have a direct and material
effect on each major federal program to determine the auditing procedures that are
appropriate in the circumstances for the purpose of expressing an opinion on compliance for
each major federal program and to test and report on internal control over compliance in
accordance with the Uniform Guidance, but not for the purpose of expressing an opinion on
the effectiveness of internal control over compliance. Accordingly, we do not express an
opinion on the effectiveness of the District's internal control over compliance.
A deficiency in internal control over compliance exists when the design or operation of a
control over compliance does not allow management or employees, in the normal course of
performing their assigned functions, to prevent, or detect and correct, noncompliance with a
type of compliance requirement of a federal program on a timely basis. A material weakness
in internal control over compliance is a deficiency, or combination of deficiencies, in
internal control over compliance, such that there is a reasonable possibility that material
noncompliance with a type of compliance requirement of a federal program will not be
prevented, or detected and corrected, on a timely basis. A significant deficiency in internal
control over compliance is a deficiency, or a combination of deficiencies, in internal control
over compliance with a type of compliance requirement of a federal program that is less
severe than a material weakness in internal control over compliance, yet important enough
to merit attention by those charged with governance.
Our consideration of internal control over compliance was for the limited purpose described
in the first paragraph of this section and was not designed to identify all deficiencies in
internal control over compliance that might be material weaknesses or significant
deficiencies. We identified a certain deficiency in internal control over compliance, as
described in the accompanying schedule of findings and questioned cost as item 2017-001
that we consider to be a material weakness.
District's Response to the Findings
The District's responses to the findings identified in our audit are described in the
accompanying Schedule of Findings and Questioned Costs in Accordance with the Uniform
Guidance. The District's responses were not subjected to the auditing procedures applied in
the audit of the financial statements and, accordingly, we express no opinion on them.
93
The purpose of this report on internal control over compliance is solely to describe the scope
of our testing of internal control over compliance and the results of that testing based on the
requirements of the Uniform Guidance. Accordingly, this report is not suitable for any other
purpose.
St. Cloud, Minnesota
November 6, 2017

94
Independent School District No. 742
Schedule of Findings and Questioned Costs
in Accordance with the Uniform Guidance
SECTION I – SUMMARY OF AUDITOR'S RESULTS
Financial Statements
Type of auditor's report issued: Unmodified
Internal control over financial reporting:
• Material weakness(es) identified? No
• Significant deficiency(ies) identified? Yes, Audit Finding 2005-001
Noncompliance material to financial statements
noted? No
Federal Awards
Type of auditor's report issued on compliance for
major programs: Unmodified
Internal control over major programs:
• Material weakness(es) identified? Yes, Audit Finding 2017-001
• Significant deficiency(ies) identified? No
Any audit findings disclosed that are required to
be reported in accordance with 2 CFR 200.516? No
Identification of Major Programs
CFDA No.: 10.553, 10.555, 10.556
Name of Federal Program or Cluster: Child Nutrition Cluster
Dollar threshold used to Distinguish between type A
and type B programs: $750,000
Auditee qualified as low risk auditee? Yes

95
Independent School District No. 742
Schedule of Findings and Questioned Costs
in Accordance with the Uniform Guidance
SECTION II – FINANCIAL STATEMENT FINDINGS
Audit Finding 2005-001
Criteria or Specific Requirement:
Internal control that supports the District's ability to initiate, record, process and report financial data
consistent with the assertions of management in the financial statements requires adequate segregation
of accounting duties.
Condition:
During the year ended June 30, 2017, the District had a lack of segregation of accounting duties due to a
limited number of office employees. Examples of the lack of segregation of accounting duties include,
but are not limited to the following:
• The Interim Executive Director of Business Services has full access to the general ledger.
• The Controller records and maintains capital asset records and can also approve purchase orders.
• Secretaries at the elementary schools receipt cash, prepare the deposit, and bring the deposit to
the bank. In addition, there is no reconciliation of these receipts to the actual deposit.
• The Business Services Bookkeeper receipts cash, posts amounts into the finance system,
prepares the deposit, and makes the deposit.
• There is no documentation that amounts deposited into the bank are reconciled with revenues
recorded in the general ledger.
• The Payroll Secretary enters timecard information into the system, reviews information, and
processes payroll.
• There is no documentation of approval on bank reconciliations by District Office staff.
• The Secretary to the Community Education Director receipts, community education cash,
prepares the deposit, and brings the deposit to the bank.
• The process for entering NPA forms and changes into the HR system is inefficient. Many
employees are authorized to enter these changes based on the type of change. No one is
reviewing changes made to the system.
In addition, a prior period adjustment was required to record amounts due from the state and federal
government for reimbursement for meals served in November 2015 that was not received until August
2016.
Context:
This finding impacts the internal control for all significant accounting functions.
Effect:
The lack of adequate segregation of accounting duties could adversely affect the District's ability to
initiate, record, process, and report financial data consistent with the assertions of management in the
financial statements.

96
Independent School District No. 742
Schedule of Findings and Questioned Costs
in Accordance with the Uniform Guidance
SECTION II – FINANCIAL STATEMENT FINDINGS (CONTINUED)
Audit Finding 2005-001 (Continued)
Cause:
There are a limited number of office employees.
Recommendation:
Continue to review the accounting system, including changes that may occur. Implement segregation
whenever practical.
Management's Response:
CORRECTIVE ACTION PLAN (CAP):
1. Explanation of Disagreement with Audit Finding
There is no disagreement with the audit finding.
2. Actions Planned in Response to Finding
The District will continue to evaluate the benefits compared to the costs of increased internal
controls.
3. Official Responsible for Ensuring CAP
Amy Skaalerud, Interim Executive Director of Business Services, is the official responsible for
ensuring corrective action of the deficiency.
4. Planned Completion Date for CAP
The planned completion date for the CAP is June 30, 2018.
5. Plan to Monitor Completion of CAP
The School Board will be monitoring this CAP by following up on these items as needed with the
Interim Executive Director of Business Services.
SCHEDULE III – FEDERAL AWARD FINDINGS AND QUESTIONED COSTS
Audit Finding 2017-001
Criteria or Specific Requirement:
Internal control that assures all requests for reimbursement are properly processed.
Condition:
During the course of our engagement, we noted errors in lunch reimbursement requests for the May/June
submission. The number of lunches served submitted was less than the number served per the District's
food service system.

97
Independent School District No. 742
Schedule of Findings and Questioned Costs
in Accordance with the Uniform Guidance
SCHEDULE III – FEDERAL AWARD FINDINGS AND QUESTIONED COSTS (CONTINUED)
Audit Finding 2017-001 (Continued)
Context:
The District could have been requesting reimbursements at incorrect amounts.
Effect:
The reimbursements from the federal government could be misstated.
Cause
District personnel did not ensure all reimbursement requests were for the same amount of meals served
according to the District's food service system.
Recommendation:
Review the reimbursement requests to verify that the appropriate number of meals were submitted for
reimbursement.
Management's Response:
CORRECTIVE ACTION PLAN (CAP):
1. Explanation of Disagreement with Audit Finding
There is no disagreement with the audit finding.
2. Actions Planned in Response to Finding
The District will ensure submitted meals agree to the food service system.
3. Official Responsible for Ensuring CAP
Amy Skaalerud, Interim Executive Director of Business Services, is the official responsible for
ensuring corrective action of the deficiency.
4. Planned Completion Date for CAP
The planned completion date for the CAP is June 30, 2018.
5. Plan to Monitor Completion of CAP
The School Board will be monitoring this CAP by following up on these items as needed with the
Interim Executive Director of Business Services.
SECTION IV – PRIOR YEAR FINDINGS AND QUESTIONED COSTS
None

98
BerganKDV, Ltd. bergankdv.com
Report on Legal Compliance
Independent Auditor's Report
To the School Board
Independent School District No. 742
St. Cloud, Minnesota
We have audited, in accordance with auditing standards generally accepted in the United
States of America and the standards applicable to financial audits contained in Government
Auditing Standards, issued by the Comptroller General of the United States, the financial
statements of the governmental activities, each major fund, and the aggregate remaining
fund information of Independent School District No. 742, St. Cloud, Minnesota, as of and
for the year ended June 30, 2017, and the related notes to financial statements, and have
issued our report thereon dated November 6, 2017.
The Minnesota Legal Compliance Audit Guide for School Districts promulgated by the State
Auditor pursuant to Minnesota Statutes § 6.65, contains seven categories of compliance to
be tested: contracting and bidding, deposits and investments, conflicts of interest, public
indebtedness, claims and disbursements, miscellaneous provisions, and uniform financial
accounting and reporting standards for school districts. Our audit considered all of the listed
categories.
In connection with our audit, nothing came to our attention that caused us to believe that the
District failed to comply with the provisions of the Minnesota Legal Compliance Audit
Guide for School Districts. However, our audit was not directed primarily toward obtaining
knowledge of such noncompliance. Accordingly, had we performed additional procedures,
other matters may have come to our attention regarding the District's noncompliance with
the above referenced provisions.
The purpose of this report is to describe the scope of our testing of compliance and the
results of that testing, and not to provide an opinion on compliance. Accordingly, this
communication is not suitable for any other purpose.
St. Cloud, Minnesota
November 6, 2017