Independent Investment Solutions - My Dealer...
32
Transcript of Independent Investment Solutions - My Dealer...

AssureInvest Copyright, Disclaimer, General Advice Warning and Disclosure
Copyright
Copyright AssureInvest Pty Ltd ABN 55 636 036 188 (AssureInvest). All rights reserved. No part of this publication may be reproduced or distributed in any form without
prior consent in writing from AssureInvest.
Disclaimer
AssureInvest has taken all care in preparing this presentation and the data, information and research commentary within it (together referred to as the 'publication')
but to the extent that the publication is based on information received from other parties no liability is accepted by AssureInvest for errors contained in the publication
or omissions from the publication. AssureInvest gives neither guarantee nor warranty nor makes any representation as to the correctness or completeness of the
publication. AssureInvest bases its data, information and research commentary on information disclosed to it by other parties. No information contained in the
publication constitutes the provision of securities advice. AssureInvest warns that: (a) in preparing the publication, AssureInvest did not take into account the
particular goals and objectives, anticipated resources, current situation or attitudes of any particular person; and (b) before making any investment decisions on the
basis of that publication, any investor or prospective investor needs to consider, with or without the assistance of a securities adviser, whether the information
contained within the publication is appropriate in light of the particular goals and objectives, anticipated resources, current situation or attitudes of the investor or
prospective investor. Past performance is no guarantee of future performance.
General Advice Warning
The information contained within this publication is of a general nature only. It does not take your specific needs or circumstances into consideration. You should look
at your own personal situation and requirements before making any financial decisions.
Disclosure
AssureInvest has no debt or equity relationship with any funds management or financial advisory group. AssureInvest may have an interest in the securities referred to
in the publication in that AssureInvest and/or its staff may hold or intend to hold deposits, shares, units or other rights in respect of such products and from time to time
AssureInvest may provide some of the investment product providers mentioned in the publication with research, consulting and other services for a fee.
AssureInvest Pty Ltd
Authorised Representative (number 460115) of Libertas Financial Planning (ABN 27 160 419 134, AFSL number 429718)
2

Agenda
• Our compelling offer to you
• Investment philosophy
• Our approach to asset allocation and equities portfolio management
• Market outlook and portfolio positioning
• Summary, questions and discussion
3
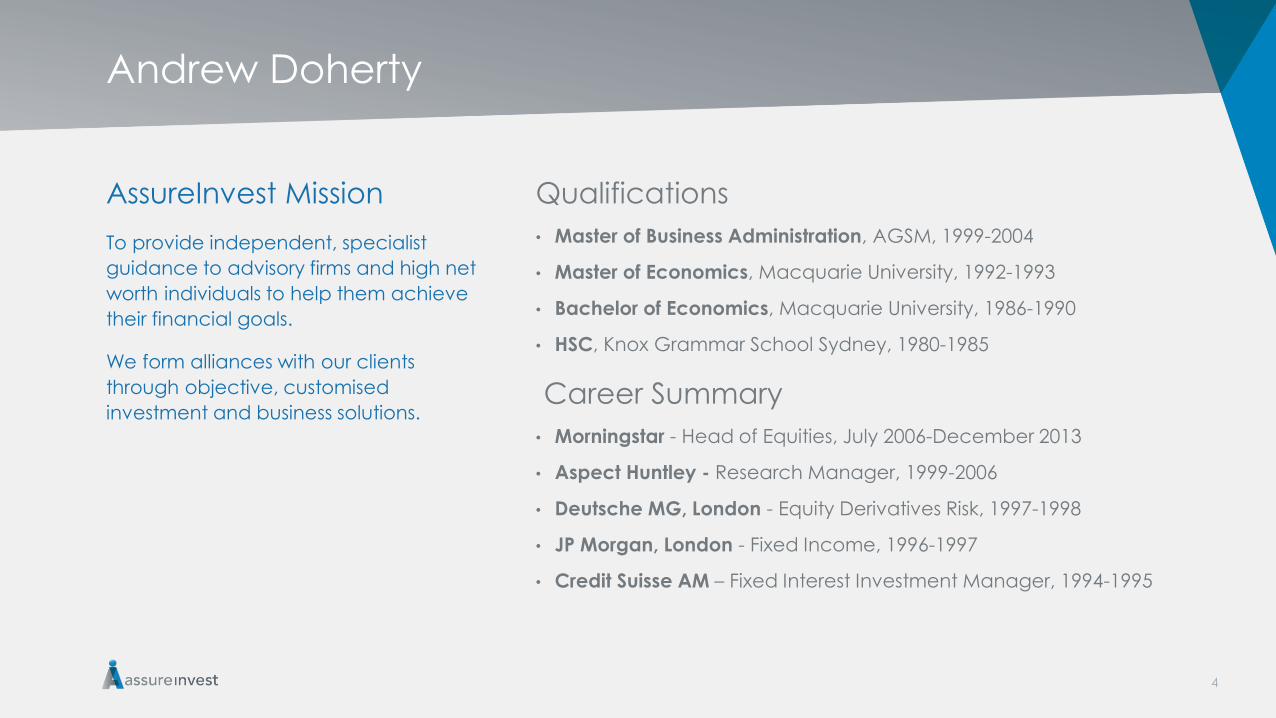
Andrew Doherty
Qualifications
• Master of Business Administration, AGSM, 1999-2004
• Master of Economics, Macquarie University, 1992-1993
• Bachelor of Economics, Macquarie University, 1986-1990
• HSC, Knox Grammar School Sydney, 1980-1985
Career Summary
• Morningstar - Head of Equities, July 2006-December 2013
• Aspect Huntley - Research Manager, 1999-2006
• Deutsche MG, London - Equity Derivatives Risk, 1997-1998
• JP Morgan, London - Fixed Income, 1996-1997
• Credit Suisse AM – Fixed Interest Investment Manager, 1994-1995
AssureInvest Mission
To provide independent, specialist
guidance to advisory firms and high net
worth individuals to help them achieve
their financial goals.
We form alliances with our clients
through objective, customised
investment and business solutions.
4

Equity portfolio outperformance versus market and peers
5
0.7
4.2
7.4
0.6
3.5
6.5
0
1
2
3
4
5
6
7
8
1 month 3 months Since Inception (Feb 14)
Returns to August 2014
AssureInvest Australian Equity S&P/ASX 200
%
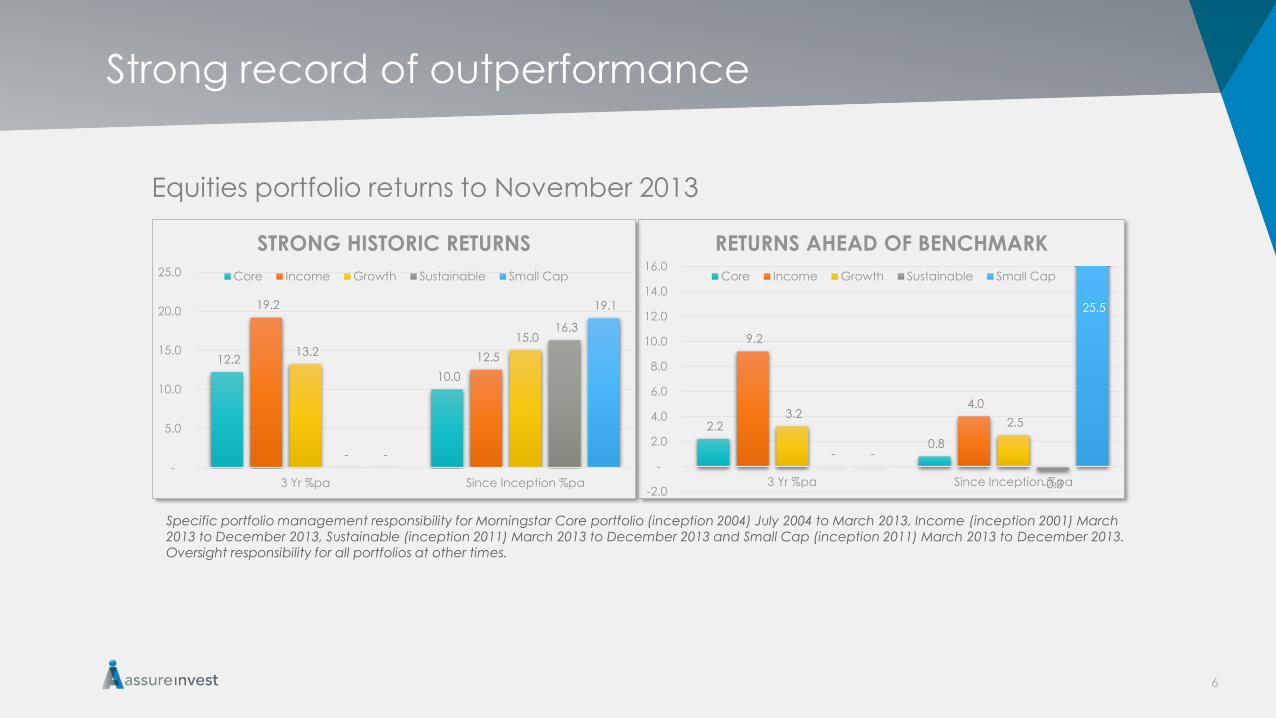
Strong record of outperformance
Equities portfolio returns to November 2013
6
Specific portfolio management responsibility for Morningstar Core portfolio (inception 2004) July 2004 to March 2013, Income (inception 2001) March
2013 to December 2013, Sustainable (inception 2011) March 2013 to December 2013 and Small Cap (inception 2011) March 2013 to December 2013.
Oversight responsibility for all portfolios at other times.
12.2
10.0
19.2
12.5 13.2 15.0
-
16.3
-
19.1
-
5.0
10.0
15.0
20.0
25.0
3 Yr %pa Since Inception %pa
STRONG HISTORIC RETURNS
Core Income Growth Sustainable Small Cap
2.2
0.8
9.2
4.0 3.2
2.5
-
-0.3
-
25.5
-2.0
-
2.0
4.0
6.0
8.0
10.0
12.0
14.0
16.0
3 Yr %pa Since Inception %pa
RETURNS AHEAD OF BENCHMARK
Core Income Growth Sustainable Small Cap

Our compelling offer to you
• We collaborate with our clients to maximise their
business potential
• Experience, record of outperformance
• Exclusivity – we advise a strictly limited number of
highly valued clients
• Independence - trust, integrity, passion, transparency
• Variety of service options
• Investment consulting (governance, portfolio construction)
• Model portfolios
• Managed account portfolio licensing
• Client portfolio review
7

Investment Philosophy
8
Capital Preservation &
Superior Returns
• Long-term focus on fundamental high-quality and value
• Competitively advantaged firms preferred for investment of capital at high rates of return
• Allowing margin of safety increases potential gains while reducing chance of capital loss
• Suitable diversification across assets and sectors reduces risk
• Macroeconomic overlay helps maximise portfolio returns and reduce risk
• Cost focus through direct securities, low turnover and tax management
• Investment success requires patience and discipline to reduce the risk of permanent capital loss

Equities Investment Process
9
Portfolio
Fundamental Data Screens
External Research Checks
Proprietary Research
Macro Overlay
Mandates & Best Practice
Fundamental Data Screens
Return on equity
Return on Invested Capital
Free cash flow
Reliable earnings growth
Responsible Leverage
Net Debt/Equity
EBIT/Interest Cover
EV/EBITDA
Operating Leverage
Valuation Methods
Price/Book
Price/Earnings
Price/Earnings Growth
Free Cash Flow Yield
Dividend Yield
EBIT/Enterprise Value
(EPS Growth + Yield)/PE
Margin of Safety
Measure Mandate
Objective Outperform
S&P/ASX 200
Accumulation
Index over long
term
Investment
Universe
S&P/ASX 200
Strategy Best S&P/ASX
200 high quality
opportunities,
concentrated
Number
stocks held
15 – 30
Maximum
position
weight
20%
Maximum
cash
weight
10%
Derivatives Not used

The importance of sustainable competitive advantage
• Companies able to invest capital at high
rates of return will create value over time
• Firms with sustainable competitive advantages
have unique assets or skills
• They will have strong industry positions in relation to
barriers to entry, rivalry, strength of consumers,
power of suppliers and degree of substitution
• Predictability of cash flows affects the ability
to reliably assess value
• Business risk is determined by revenue cyclicality,
operating leverage, balance sheet strength and
risk of unforeseen events
10

Sources of competitive advantage
11
Cost Advantage
Differentiation Advantage
Switching Costs
Network Effect
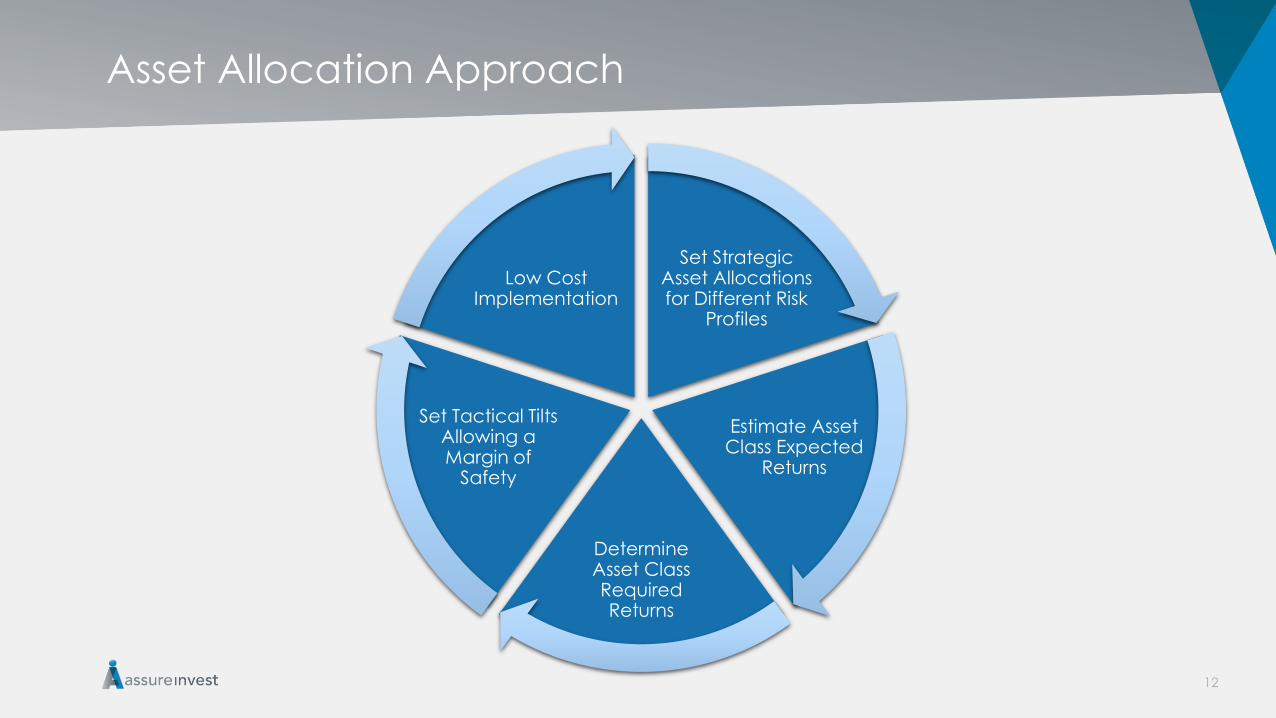
Asset Allocation Approach
Set Strategic Asset Allocations for Different Risk
Profiles
Estimate Asset Class Expected
Returns
Determine Asset Class Required Returns
Set Tactical TiltsAllowing a Margin of
Safety
Low Cost Implementation
12

15%
30%
50%
70%
85%
85%
70%
50%
30%
15%
0%
10%
20%
30%
40%
50%
60%
70%
80%
90%
100%
Defensive Moderately Defensive Balanced Moderate Growth High Growth
Strategic Asset Allocation - Asset Style by Portfolio
Growth Income
Various strategic asset allocations according to investor goals
13

10%
20%
30%
40%
55%
0%
5%
10%
10%
5%
3%
3%
6%
13%
16%
1.4%
1.4%
2.9%
5.7%
7.2%
0%
0%
1%
2%
2%
55%
45%
30%
15%
5%30%
25%20%
15%10%
0%
10%
20%
30%
40%
50%
60%
70%
80%
90%
100%
Defensive Moderately Defensive Balanced Moderate Growth High Growth
Australian Equities Australian REITs US Equities Europe Equities Japan Equities Australian Bonds Australian Cash
Strategic Asset Allocation - Assets Weights by Portfolio
14

Tactical Tilts away from European Equities and Bonds
15
0% 0% 0%
-1%
0%
-6%
7%
-8%
-6%
-4%
-2%
0%
2%
4%
6%
8%
Australian Equities Australian REITs US Equities Europe Equities Japan Equities Australian Bonds Australian Cash
Variance from benchmark asset allocations for Moderate Growth Portfolio
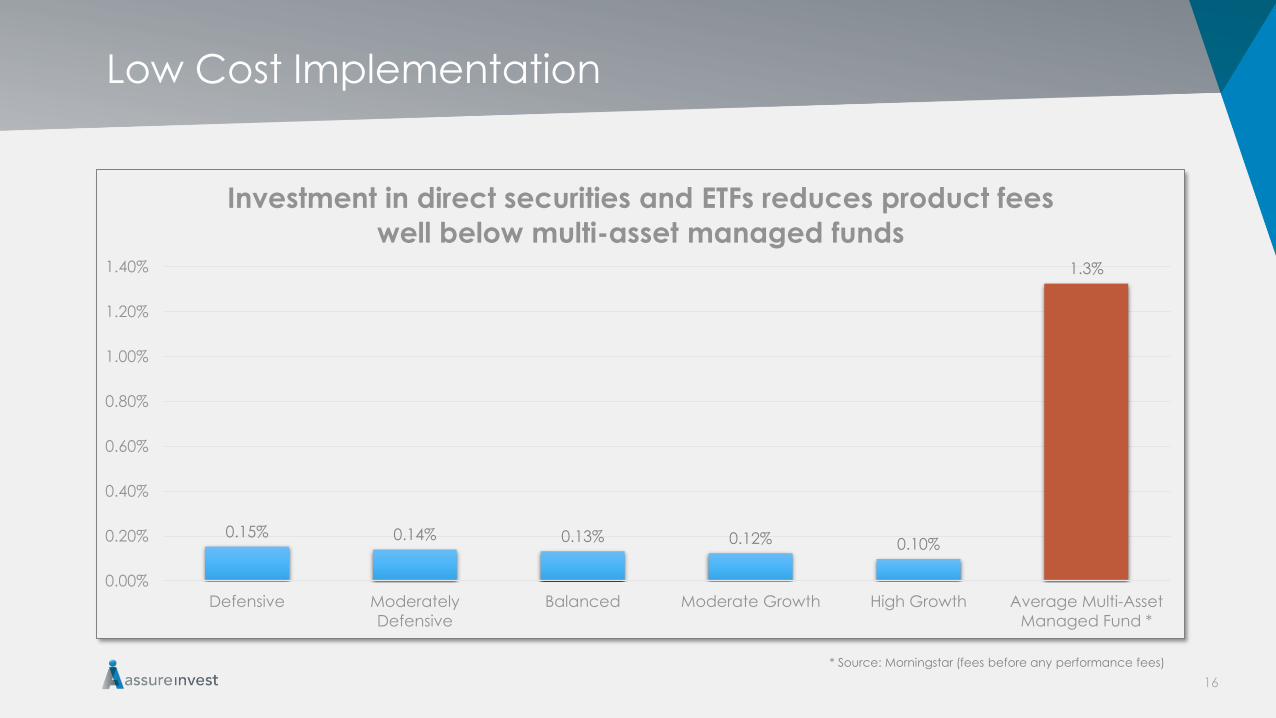
Low Cost Implementation
16
0.15% 0.14% 0.13% 0.12% 0.10%
1.3%
0.00%
0.20%
0.40%
0.60%
0.80%
1.00%
1.20%
1.40%
Defensive Moderately
Defensive
Balanced Moderate Growth High Growth Average Multi-Asset
Managed Fund *
Investment in direct securities and ETFs reduces product fees
well below multi-asset managed funds
* Source: Morningstar (fees before any performance fees)

Moderate Growth Portfolio - Implementation Example
17
10%
5%
4%
13%
5%
2%
22%
40%
Vanguard Australian Prop Secs Index ETF (VAP) iShares UBS Composite Bond ETF
AGB 2.75% 21/4/2024 iShares Core S&P 500
iShares Europe ETF iShares MSCI Japan ETF
BetaShares Aus High Interest Cash ETF (AAA) AssureInvest Australian Equities Portfolio

Investment outlook
18

US Fed Balance Sheet has Expanded by USD 3.3 Tr Since 2008Fed Funds Rate at Historic Lows
19
-
0.5
1.0
1.5
2.0
2.5
3.0
3.5
4.0
4.5
5.0
2002 -12 - 1 8 2004 -12 - 1 8 2006 -12 - 1 8 2008 -12 - 1 8 2010 -12 - 1 8 2012 -12 - 1 8
US FED BALANCE SHEET (USD TR)
0.00
1.00
2.00
3.00
4.00
5.00
6.00
2002 -07 - 0 1 2004 -08 - 0 1 2006 -09 - 0 1 2008 -10 - 0 1 2010 -11 - 0 1 2012 -12 - 0 1
%
US FED FUNDS RATE
Source: FRED

US Economy No Longer Weak…Supporting Fed Funds Rise Mid-2015
20
Avg Since Jan
1993= 4.6 %
-15.0
-10.0
-5.0
-
5.0
10.0
15.0
Ja
n-1
99
3
Se
p-1
99
3
Ma
y-1
99
4
Ja
n-1
99
5
Se
p-1
99
5
Ma
y-1
99
6
Ja
n-1
99
7
Se
p-1
99
7
Ma
y-1
99
8
Ja
n-1
99
9
Se
p-1
99
9
Ma
y-2
00
0
Ja
n-2
00
1
Se
p-2
00
1
Ma
y-2
00
2
Ja
n-2
00
3
Se
p-2
00
3
Ma
y-2
00
4
Ja
n-2
00
5
Se
p-2
00
5
Ma
y-2
00
6
Ja
n-2
00
7
Se
p-2
00
7
Ma
y-2
00
8
Ja
n-2
00
9
Se
p-2
00
9
Ma
y-2
01
0
Ja
n-2
01
1
Se
p-2
01
1
Ma
y-2
01
2
Ja
n-2
01
3
Se
p-2
01
3
Ma
y-2
01
4
US Retail Sales Growth Near Long Term Average
Long Term Avg:
85.1
50.0
60.0
70.0
80.0
90.0
100.0
110.0
120.0
197
8-0
1-0
1
197
9-0
5-0
1
198
0-0
9-0
1
198
2-0
1-0
1
198
3-0
5-0
1
198
4-0
9-0
1
198
6-0
1-0
1
198
7-0
5-0
1
198
8-0
9-0
1
199
0-0
1-0
1
199
1-0
5-0
1
199
2-0
9-0
1
199
4-0
1-0
1
199
5-0
5-0
1
199
6-0
9-0
1
199
8-0
1-0
1
199
9-0
5-0
1
200
0-0
9-0
1
200
2-0
1-0
1
200
3-0
5-0
1
200
4-0
9-0
1
200
6-0
1-0
1
200
7-0
5-0
1
200
8-0
9-0
1
201
0-0
1-0
1
201
1-0
5-0
1
201
2-0
9-0
1
University Michigan Consumer Confidence Now
Around Long Term Average
Average since
1967: 80.6
65.0
70.0
75.0
80.0
85.0
90.0
196
7-0
1-0
1
196
8-1
0-0
1
197
0-0
7-0
1
197
2-0
4-0
1
197
4-0
1-0
1
197
5-1
0-0
1
197
7-0
7-0
1
197
9-0
4-0
1
198
1-0
1-0
1
198
2-1
0-0
1
198
4-0
7-0
1
198
6-0
4-0
1
198
8-0
1-0
1
198
9-1
0-0
1
199
1-0
7-0
1
199
3-0
4-0
1
199
5-0
1-0
1
199
6-1
0-0
1
199
8-0
7-0
1
200
0-0
4-0
1
200
2-0
1-0
1
200
3-1
0-0
1
200
5-0
7-0
1
200
7-0
4-0
1
200
9-0
1-0
1
201
0-1
0-0
1
201
2-0
7-0
1
201
4-0
4-0
1
US Capacity Utilisation @ LT average
LT Avg 2.9%
-20.0%
-15.0%
-10.0%
-5.0%
0.0%
5.0%
10.0%
15.0%
20.0%
25.0%
195
7-0
1-0
1
195
9-0
2-0
1
196
1-0
3-0
1
196
3-0
4-0
1
196
5-0
5-0
1
196
7-0
6-0
1
196
9-0
7-0
1
197
1-0
8-0
1
197
3-0
9-0
1
197
5-1
0-0
1
197
7-1
1-0
1
197
9-1
2-0
1
198
2-0
1-0
1
198
4-0
2-0
1
198
6-0
3-0
1
198
8-0
4-0
1
199
0-0
5-0
1
199
2-0
6-0
1
199
4-0
7-0
1
199
6-0
8-0
1
199
8-0
9-0
1
200
0-1
0-0
1
200
2-1
1-0
1
200
4-1
2-0
1
200
7-0
1-0
1
200
9-0
2-0
1
201
1-0
3-0
1
201
3-0
4-0
1
US Industrial Prod’n (YoY Chg%) modest, steady and near LT Avg
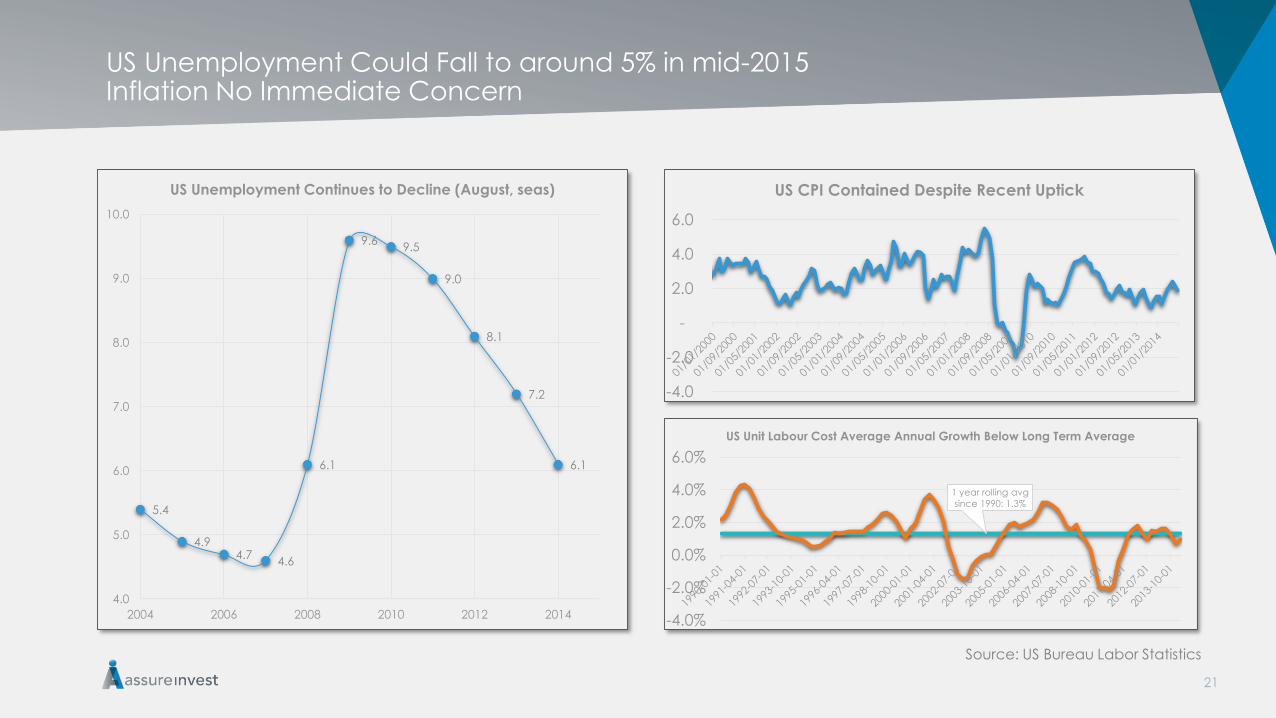
US Unemployment Could Fall to around 5% in mid-2015Inflation No Immediate Concern
21
1 year rolling avg
since 1990: 1.3%
-4.0%
-2.0%
0.0%
2.0%
4.0%
6.0%
US Unit Labour Cost Average Annual Growth Below Long Term Average
5.4
4.94.7
4.6
6.1
9.69.5
9.0
8.1
7.2
6.1
4.0
5.0
6.0
7.0
8.0
9.0
10.0
2004 2006 2008 2010 2012 2014
US Unemployment Continues to Decline (August, seas)
-4.0
-2.0
-
2.0
4.0
6.0
US CPI Contained Despite Recent Uptick
Source: US Bureau Labor Statistics
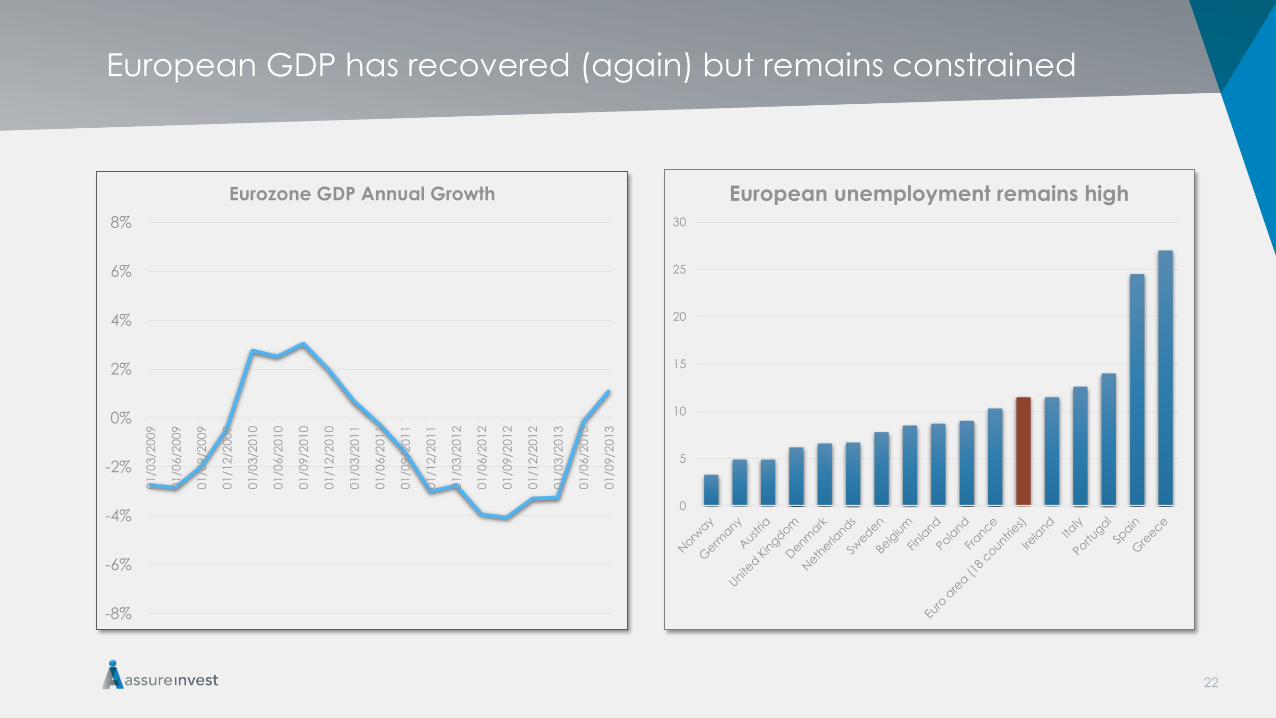
European GDP has recovered (again) but remains constrained
22
-8%
-6%
-4%
-2%
0%
2%
4%
6%
8%
01/0
3/2
00
9
01/0
6/2
00
9
01/0
9/2
00
9
01/1
2/2
00
9
01/0
3/2
01
0
01/0
6/2
01
0
01/0
9/2
01
0
01/1
2/2
01
0
01/0
3/2
01
1
01/0
6/2
01
1
01/0
9/2
01
1
01/1
2/2
01
1
01/0
3/2
01
2
01/0
6/2
01
2
01/0
9/2
01
2
01/1
2/2
01
2
01/0
3/2
01
3
01/0
6/2
01
3
01/0
9/2
01
3
Eurozone GDP Annual Growth
0
5
10
15
20
25
30
European unemployment remains high
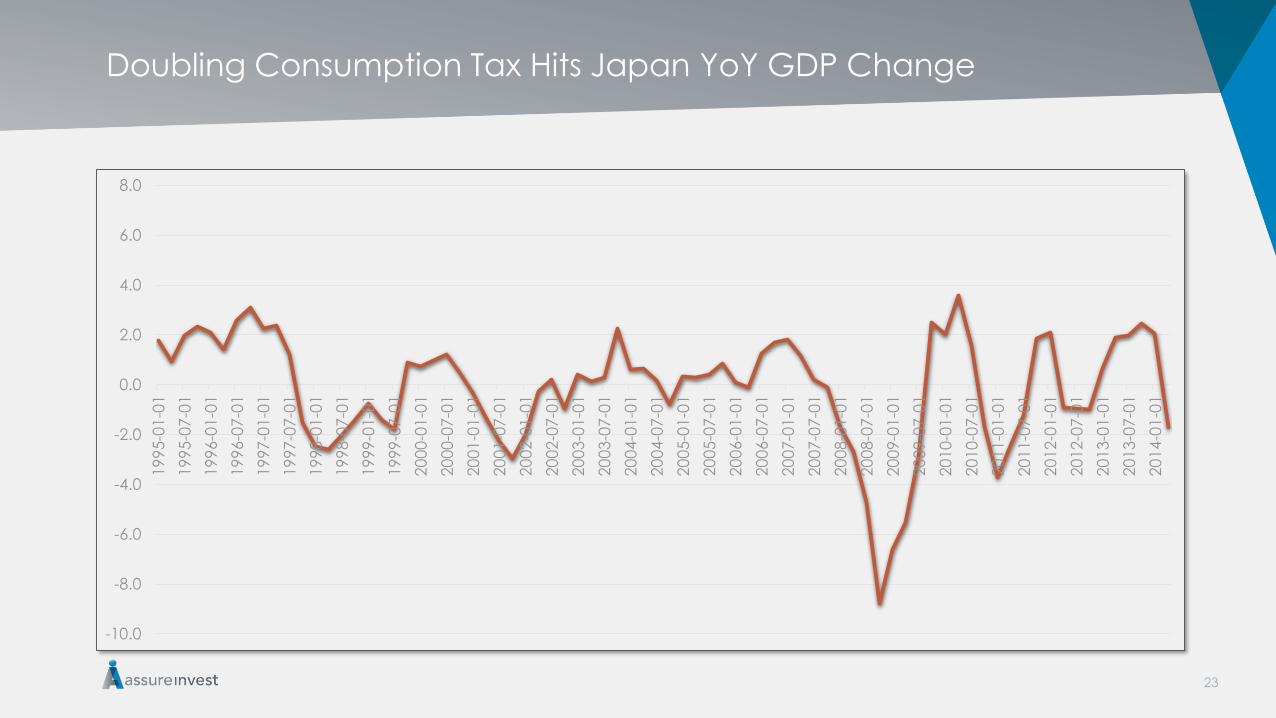
Doubling Consumption Tax Hits Japan YoY GDP Change
23
-10.0
-8.0
-6.0
-4.0
-2.0
0.0
2.0
4.0
6.0
8.0
19
95-0
1-0
1
19
95-0
7-0
1
19
96-0
1-0
1
19
96-0
7-0
1
19
97-0
1-0
1
19
97-0
7-0
1
19
98-0
1-0
1
19
98-0
7-0
1
19
99-0
1-0
1
19
99-0
7-0
1
20
00-0
1-0
1
20
00-0
7-0
1
20
01-0
1-0
1
20
01-0
7-0
1
20
02-0
1-0
1
20
02-0
7-0
1
20
03-0
1-0
1
20
03-0
7-0
1
20
04-0
1-0
1
20
04-0
7-0
1
20
05-0
1-0
1
20
05-0
7-0
1
20
06-0
1-0
1
20
06-0
7-0
1
20
07-0
1-0
1
20
07-0
7-0
1
20
08-0
1-0
1
20
08-0
7-0
1
20
09-0
1-0
1
20
09-0
7-0
1
20
10-0
1-0
1
20
10-0
7-0
1
20
11-0
1-0
1
20
11-0
7-0
1
20
12-0
1-0
1
20
12-0
7-0
1
20
13-0
1-0
1
20
13-0
7-0
1
20
14-0
1-0
1

Australian growth modest while driver shifts from resources
24
0.0
1.0
2.0
3.0
4.0
5.0
6.0
Ma
r-20
05
Ju
n-2
00
5
Se
p-2
00
5
De
c-2
00
5
Ma
r-20
06
Ju
n-2
00
6
Se
p-2
00
6
De
c-2
00
6
Ma
r-20
07
Ju
n-2
00
7
Se
p-2
00
7
De
c-2
00
7
Ma
r-20
08
Ju
n-2
00
8
Se
p-2
00
8
De
c-2
00
8
Ma
r-20
09
Ju
n-2
00
9
Se
p-2
00
9
De
c-2
00
9
Ma
r-20
10
Ju
n-2
01
0
Se
p-2
01
0
De
c-2
01
0
Ma
r-20
11
Ju
n-2
01
1
Se
p-2
01
1
De
c-2
01
1
Ma
r-20
12
Ju
n-2
01
2
Se
p-2
01
2
De
c-2
01
2
Ma
r-20
13
Ju
n-2
01
3
Se
p-2
01
3
De
c-2
01
3
Ma
r-20
14
Australian Annual GDP and CPI Changes
CPI GDPSource: ABS

Bond yields to normalise over a multi-year timeframe
25
2.00
4.00
6.00
8.00
10.00
12.00
14.00
Au
g-1
99
0
Ma
r-19
91
Oc
t-19
91
Ma
y-1
992
De
c-1
99
2
Ju
l-199
3
Fe
b-1
994
Se
p-1
99
4
Ap
r-19
95
No
v-1
995
Ju
n-1
99
6
Ja
n-1
997
Au
g-1
99
7
Ma
r-19
98
Oc
t-19
98
Ma
y-1
999
De
c-1
99
9
Ju
l-200
0
Fe
b-2
001
Se
p-2
00
1
Ap
r-20
02
No
v-2
002
Ju
n-2
00
3
Ja
n-2
004
Au
g-2
00
4
Ma
r-20
05
Oc
t-20
05
Ma
y-2
006
De
c-2
00
6
Ju
l-200
7
Fe
b-2
008
Se
p-2
00
8
Ap
r-20
09
No
v-2
009
Ju
n-2
01
0
Ja
n-2
011
Au
g-2
01
1
Ma
r-20
12
Oc
t-20
12
Ma
y-2
013
De
c-2
01
3
Ju
l-201
4
Australian interest rates
RBA Cash Rate Australian 10YB

AssureInvest Australian Equities Portfolio
26
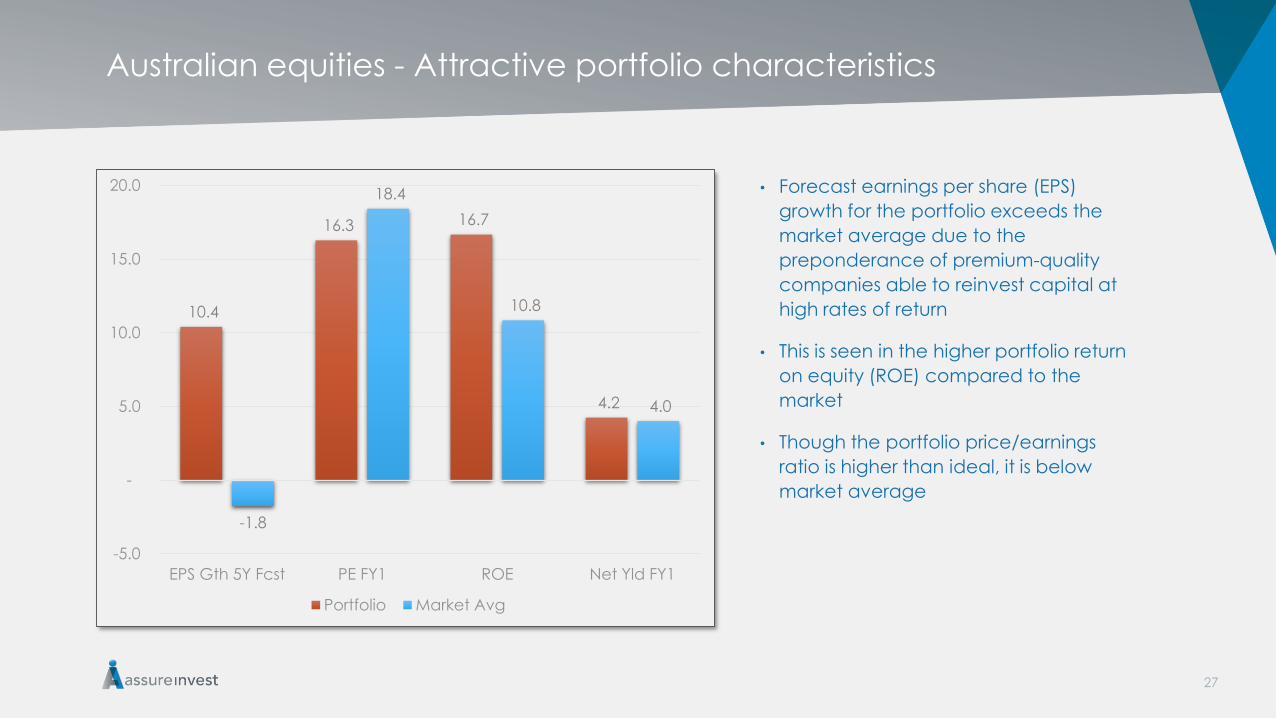
Australian equities - Attractive portfolio characteristics
• Forecast earnings per share (EPS)
growth for the portfolio exceeds the
market average due to the
preponderance of premium-quality
companies able to reinvest capital at
high rates of return
• This is seen in the higher portfolio return
on equity (ROE) compared to the
market
• Though the portfolio price/earnings
ratio is higher than ideal, it is below
market average
27
10.4
16.3 16.7
4.2
-1.8
18.4
10.8
4.0
-5.0
-
5.0
10.0
15.0
20.0
EPS Gth 5Y Fcst PE FY1 ROE Net Yld FY1
Portfolio Market Avg

Australian equities portfolio weighted to conviction sector opportunities
4%
8%6%
45%
5%7%
1%
16%
5%
2%0%
4%
8%
36%
12%
4% 3%
18%
6%
3%
0%
5%
10%
15%
20%
25%
30%
35%
40%
45%
50%
Sector Relative Weights
Index Wt Portfolio Wt
28

Australian equities portfolio - Top 10 holdings
ASX
code Name GICS Sector Price Weight
Mkt Cap
($, 000)
EPS Gth
5Y Fcst
PE
FY1
Net Yld
FY1 P/Book
(EPS Gth
+ Yld) /
PE Equity Style ROE
Int
Cover PEG
WBC Westpac Financials 35.22 7.80% 109,501 5.3 14.3 5.30% 2.3 0.9 Growth 15.2 na 1.9
ANZ ANZ Bank Financials 33.67 6.40% 92,815 5.3 13.3 5.30% 2.1 0.9 Growth 15 na 2.3
TLS Telstra Telecom 5.72 6.30% 71,174 3.8 17.8 5.20% 5.5 0.5 Growth 33.7 7.5 20.1
CBA Commonwealth Financials 81.70 6.00% 132,462 4.8 14.5 5.20% 2.9 0.7 Growth 18.5 na 2.2
SHL
Sonic
Healthcare Health Care 17.71 5.90% 7,098 5.9 17.2 4.10% 2.4 0.8 Income 12.8 10 1.6
BHP BHP Materials 36.20 5.40% 116,263 9.1 14.3 3.80% 2.5 0.8 Growth 19.4 18.3 1.3
NAB National Financials 35.31 5.20% 83,535 4.3 13.2 5.70% 2 0.9 Growth 13.1 na 1.7
Cash Cash 5.00%
WPL Woodside Energy 43.31 4.90% 35,684 7 13.5 5.90% 2.1 1.5 Income 11.9 16.9 0.8
WES Wesfarmers Cons Stap 43.80 4.40% 50,075 6.8 17.9 5.00% 1.9 1.2 Income 10.3 7.2 2.1
Total Portfolio
100.00
% 10.2 16.7 4.10% 2.7 1.2 16.8 2.7
29

Summary
• Investors should acclimatise to lower returns than in the recent past due to full
valuations and modest growth outlook
• Focus on higher-quality companies particularly vital given lack of value in the
market as these will be less affected by unforeseen shocks
• Competitively advantaged firms will rise in value over time due their ability to
invest capital at greater return than the costs
• Additional cash is valuable given likely rise in volatility which may create
opportunity for investment
30

Questions and Discussion
31

Contact Information
Andrew Doherty
Director
AssureInvest
Level 1, 50 Yeo Street
PO Box 612, Neutral Bay NSW 2089
m + 61 400 456 132
p + 612 8094 8410
32

![TERMS AND CONDITIONS zt{ / aGb]h · TERMS AND CONDITIONS zt{ / aGb]h ... 8](https://static.fdocuments.us/doc/165x107/5ecb9c6360da650bc655f7ac/terms-and-conditions-zt-agbh-terms-and-conditions-zt-agbh-8.jpg)