Independent Alignment Review of the Maine Education ... Alignment...2017 No. 073 . Independent...
67
2017 No. 073 Independent Alignment Review of the Maine Education Assessments in Mathematics and English Language Arts/Literacy: eMPowerME Final Report Prepared for: Maine Department of Education Prepared under: Contract Number #00000532 Authors: Yvette Nemeth Caroline Wiley Matthew Swain Elizabeth Patton Anne Woods Amanda Koch Christopher Huber Date: December 19, 2017
Transcript of Independent Alignment Review of the Maine Education ... Alignment...2017 No. 073 . Independent...
2017 No. 073
Independent Alignment Review of the Maine Education Assessments in Mathematics and English
Language Arts/Literacy: eMPowerME Final Report
Prepared for:
Maine Department of Education Prepared under: Contract Number #00000532
Authors: Yvette Nemeth Caroline Wiley Matthew Swain Elizabeth Patton Anne Woods Amanda Koch Christopher Huber
Date:
December 19, 2017
Table of Contents i
Independent Alignment Review of the Maine Education Assessments in Mathematics and English Language Arts/Literacy: eMPowerME
Table of Contents
Executive Summary .................................................................................................................... 1
Chapter 1: Introduction ................................................................................................................ 8
Chapter 2: Alignment Study Design and Methodology ................................................................ 9 Alignment of eMPowerME Assessments and Standards ........................................................ 9
eMPowerME Overview ....................................................................................................... 9 Alignment Methodology and Criteria ..................................................................................10
Alignment Study Participants and Procedures .......................................................................12 Panelists............................................................................................................................12 Training .............................................................................................................................13 Test Security .....................................................................................................................13 Materials............................................................................................................................13 Procedures ........................................................................................................................14
Chapter 3: Alignment Results .................................................................................................... 15 Criterion 1: Items Represent Intended Content .....................................................................15
Contribution of Essay Assessment ....................................................................................21 Criterion 2: Items Represent Intended Categories .................................................................24 Criterion 3: Item DOK Distribution .........................................................................................26 Criterion 4: Item Sufficiency for Score Reporting ...................................................................31
Chapter 4: Summary and Recommendations ............................................................................ 40 eMPowerME Alignment Summary .........................................................................................40
Criterion 1: Items Represent Intended Content ..................................................................42 Criterion 2: Items Represent Intended Categories .............................................................42 Criterion 3: Item DOK Distribution......................................................................................42 Criterion 4: Item Sufficiency for Score Reporting ...............................................................44
Recommendations ................................................................................................................44
References ............................................................................................................................... 46
Appendix A. eMPowerME Alignment Workshop Attendees ..................................................... A-1
Appendix B. Sample Panelist Alignment Review Materials ..................................................... B-1
Appendix C. Summary of Item Workbook Ratings ................................................................... C-1
Appendix D. Math and ELA/Literacy Items Rated as Not Linked to CCSS or Mathematical Practice ................................................................................................................................... D-1
Appendix E. CCSS Associated with the Essay Assessment.................................................... E-1
Table of Contents ii
Appendix F. Debriefing: Analysis of Alignment Outcomes for eMPowerME ELA/Literacy and Mathematics ..................................................................................................................... F-1
List of Tables
Table 1. Professional and Demographic Characteristics of Panelists ........................................12 Table 2. Item Counts Reviewed by Panelists ............................................................................14 Table 3. Standards Covered by Items – Mathematics ...............................................................18 Table 4. Standards Covered by Items – Reading and Writing & Language ...............................19 Table 5. Identified CCSS Unique to Essay Assessment ............................................................22 Table 6. Standards Covered by Items – Reading, Writing & Language, and Essay
Assessments ...................................................................................................................23 Table 7. Test and Domain Distribution of Items – Mathematics .................................................25 Table 8. Test and Domain Distribution of Items – Reading and Writing & Language .................26 Table 9. Distribution of Assigned Item DOKs and Target Range ...............................................27 Table 10. Panelist Assigned DOK Levels for Essay Rubric Traits .............................................30 Table 11. CCSS Domains and Score Categories – Mathematics ..............................................32 Table 12. CCSS Domains and Score Categories – ELA/Literacy ..............................................33 Table 13. Cronbach’s Alpha and SEMs by Grade and Score Category – Mathematics .............35 Table 14. Cronbach’s Alpha and SEMs by Grade and Score Category – ELA/Literacy .............38 Table 15. Percentage of eMPowerME Assessments that Met Each Alignment Criterion ...........41 Table D-1. Items Rated as Not Linked to CCSS ...................................................................... D-1 Table D-2. Items Rated as Not Linked to Mathematical Practice ............................................. D-4 Table E-1. CCSS Identified by Panelists Linked to the Essay ................................................. E-1
List of Figures Figure 1. Panelist agreement with content alignment between item and standard –
ELA/Literacy. ...................................................................................................................16 Figure 2. Panelist agreement with content alignment between item and standard –
Mathematics. ...................................................................................................................17 Figure 3. Panelist agreement of alignment between item and identified Mathematical
Practice. ..........................................................................................................................21 Figure 4. Panelist agreement with assigned item DOK levels for elementary grade
Reading and Writing & Language assessments. ..............................................................28 Figure 5. Panelist agreement with assigned item DOK levels for middle school Reading
and Writing & Language assessments. ............................................................................29 Figure 6. Panelist agreement with assigned item DOK level for Mathematics assessment
at all grades. ....................................................................................................................30
Executive Summary 1
Independent Alignment Review of the Maine Education Assessments in Mathematics and English Language Arts/Literacy: eMPowerME
Executive Summary
Overview
The Every Student Succeeds Act (ESSA) requires states to test students in English Language Arts/Literacy (hereby referred to as ELA/Literacy) and Mathematics in grades 3 through 8 and once in high school. Under ESSA, all states receiving Title I funds must present evidence of a valid and fair assessment system that is based on rigorous standards, alignment between standards and assessments, and student proficiency requirements. An alignment study can demonstrate the validity of a state assessment system by providing evidence that an assessment (a) represents the full range of the content standards intended to be assessed and (b) measures student knowledge in the same manner and at the same level of complexity as expected in the content standards. The Maine Department of Education (DOE) requested an independent review of the alignment between the Maine Education Assessment (eMPowerME) for ELA/Literacy and Mathematics in grades 3 – 8 and the Common Core State Standards (CCSS or standards), which Maine adopted in 2011. The Human Resources Research Organization (HumRRO) conducted the requested alignment study in August 2017. The eMPowerME is a suite of assessments tailored for Maine and comprises three tests: (a) Reading, (b) Writing & Language, and (c) Mathematics. An additional Essay assessment was developed specifically for Maine and is administered as part of eMPowerME. The ELA/Literacy assessment yields an overall score and two subscores, Reading and Writing & Language, which are reported to students and parents. An additional four second-level subscores associated with the Reading assessment and two (grade 7 only) or three second-level subscores associated with the Writing & Language assessment are available to teachers. The Mathematics assessment includes an overall Mathematics score and three subscores reported to students and parents. An additional four (grades 3, 4, and 5) or seven (grades 6, 7, and 8) second-level subscores are available to teachers.
Alignment Methodology and Criteria
HumRRO applied an alignment method that incorporated widely-accepted alignment criteria as well as criteria that addressed several concerns with traditional methods. Our method used (a) expert ratings to evaluate alignment based on three criteria (item content coverage, item coverage of standards, and item depth of knowledge distribution) and (b) extant documentation of student assessment data to evaluate item sufficiency for score reporting. Specifically, the assessment of alignment was based on evaluation of the four criteria described below. Criterion 1: Items Represent Intended Content. This was a basic measure of alignment between the content standards and the test items, which essentially served as a check of the content standard to which item writers assigned each item they wrote. For Mathematics, this included rating the Mathematical Practices1 assigned to items by the item writers. Additionally,
1 Mathematical Practices are a balanced combination of procedure and understanding. They describe ways in which students increasingly ought to engage with the subject matter throughout their elementary, middle, and high school years.
Executive Summary 2
the Maine DOE was interested in determining the contribution of the Essay assessment to the eMPowerME. Since a standard(s) was not assigned for the Essay assessment item during the test construction process, alignment panelists individually assigned standards to the Essay rubric traits, with the option of identifying multiple standards they felt assessed each rubric trait. Criterion 2: Items Represent Intended Categories. For this criterion, we measured whether the distribution of items by CCSS domain, as presented in the test construction blueprint tables, holds true. We compared the expected distribution of items by domain (e.g., Reading Literature and Geometry) to the actual proportion based on panelists’ ratings. The percentage of items per domain intended to be on the assessment also was compared to the actual proportion based on panelists’ ratings. Criterion 3: Item Depth of Knowledge (DOK) Distribution. This was a measure of the cognitive complexity of items. To evaluate the DOK distribution, we focused on the DOK targets identified in the eMPowerME 2016–17 Technical Report (Measured Progress, 2017). This is in contrast with the typical criterion of 50% or more of the items being at the same DOK level as the standards (Webb,1997). This was appropriate given that CCSS content domains were not typically addressed by a single item and there were often multiple, layered skills noted in a standard that were assessed by items that represented a range of DOK levels. This also seemed reasonable given the assumption that a summative end-of-year assessment samples from the full scope of the standards. Criterion 4: Item Sufficiency for Score Reporting. This was a measure of how well items on the eMPowerME worked together to assess what a student knows and can do. Using the eMPowerME 2016–17 Technical Report, we evaluated the reasonableness of the reliability statistics for overall scores and subscores reported to students and parents as well as additional second-level subscores available to teachers.
Alignment Study Participants and Procedures
The alignment study we conducted for Maine DOE involved a comparison between the eMPowerME assessments and the CCSS. Maine DOE recruited five expert panels of current Maine educators who were familiar with the CCSS (as defined and implemented in the state) to provide the content alignment data. HumRRO recruited a Mathematics and an ELA/Literacy national content expert from Student Achievement Partners to serve as a resource for panelists during the workshop. HumRRO conducted the alignment workshop at the Maine DOE office in Augusta, ME on August 3–4, 2017. The workshop began with introductions and was followed by a general training session that highlighted the alignment process and the eMPowerME suite of assessments. At the end of the general training session, panelists reported to their assigned meeting room and were provided laptops for recording their ratings. Each HumRRO facilitator, one per panel group, provided specific alignment task training within his/her assigned panel group. To ensure a common understanding of the CCSS and DOK levels, panelists first completed a DOK consensus task on the CCSS for their assigned subject/grades. This task was meant to ensure that all panelists were cognizant of the CCSS they would be reviewing and provided a means for panelists to reach a collective understanding of the DOK levels. The second task, which panelists began the afternoon of the first day and completed on the second day, involved panelists reviewing the items and CCSS, and determining an alignment rating. After lunch and at the end of each day, the facilitator reviewed the panelists’ data. If significant discrepancies between panelists were
Executive Summary 3
found, the facilitator conducted another calibration session to address panelist misunderstandings.
Alignment Results
We used four key documents, provided by Measured Progress, to evaluate the alignment of the eMPowerME ELA/Literacy and Mathematics assessments with the CCSS in conjunction with ratings from panelists:
(1) eMPowerME Frameworks – listed the tested standards by domain, the DOK levels associated with the standards, number of items by item type, and Mathematical Practices, when applicable.
(2) Test construction blueprint tables – listed the item level data reviewed by panelists, such as the standard and DOK level associated with each item per grade/subject.
(3) Supplemental table of domain targets – listed the percentage of items per domain expected on the assessment.
(4) eMPowerME 2016–17 Technical Report – contained the target DOK levels on the assessment and reliability statistics based on student data.
Criterion 1: Items Represent Intended Content
To examine the first criterion, panelists evaluated the alignment of each item to its assigned standard. Our analyses showed the following:
• Panelists rated more than 90% of the items as either partially or fully linked to the assigned CCSS for all grade/subjects, with one exception.
o Panelists cumulatively rated 87% of the grade 3 Reading assessment items as partially and fully linked, which falls just below the 90% criterion threshold of acceptability.
• On the Mathematics assessment, all grades assessed more than 70% of the CCSS identified in the eMPowerME Frameworks.
• Across the Reading, Writing & Language, and Essay assessments, more than 70% of the ELA/Literacy standards were assessed at grades 3, 5, and 8; 66% of the standards were assessed at grade 4; and 57% of the standards were assessed at grade 7.
• Including the Essay assessment in the eMPowerME enhanced the coverage of ELA/Literacy CCSS.
o Across all grades, panelists identified four additional Reading Informational Text standards, 16 additional Writing standards, and 11 additional Language standards that were not already assessed in the Reading and Writing & Language assessments.
Criterion 2: Items Represent Intended Categories
The second criterion focused on whether the distribution of items by CCSS domain holds true to the table of domain targets. When comparing the percentage of items per domain to that of the target item range, all grades and subjects, with one exception, showed less than a 5% difference. In other words, the distribution of items by domain was consistent with the domain targets. The exception was at grade 4, where one Writing & Language domain had a greater
Executive Summary 4
than 5% difference between the maximum target range specified in the table of domain targets and the actual percentage of assessment items classified as partially and fully linked by panelists. Criterion 3: Item DOK Distribution
To ensure the overall assessment measures an adequate range of DOKs, this criterion examined the DOK level, assigned by item writers, to the items in comparison to the target DOK ranges in the eMPowerME 2016–17 Technical Report. There were four possible DOK levels, but no items were assigned a DOK level 4, nor did we expect any DOK level 4 items on any of the assessments. Overall, the results tended to show a lack of correspondence between target (i.e., DOK ranges in the eMPowerME 2016-17 Technical Report) and actual (i.e., percentage of items at each DOK level on the assessment) DOK ranges. Specifically, our analyses found the following:
• In Mathematics o Grade 6: the percentage of items matched the target DOK ranges within +/- 5%. o Grade 3: the percentage of items matched the target DOK range within +/- 5% for
DOK levels 1 and 2 but contained 6% fewer items at DOK level 3 than the target DOK minimum.
o Grades 4, 5, 7, and 8: the percentage of items matched the target DOK range within +/- 5% for DOK level 1 but contained between 8–15% more items at DOK level 2 and between 5–14% fewer items at DOK level 3 than the target DOK minimum and maximum values.
• For the Reading assessment o Grades 3, 4, 5, 7, and 8: the percentage of items matched the target DOK ranges
within +/- 5%. o Grade 6: the percentage of items at DOK levels 1 and 3 matched the target DOK
range within +/- 5% but contained 6% more items at DOK level 2 than the target DOK maximum.
• For the Writing & Language assessment o Grades 5 and 6: the percentage of items matched the target DOK ranges within
+/- 5%. o Grade 7: the percentage of items at DOK levels 1 and 2 matched the target DOK
range within +/- 5% but contained 9% more items at DOK level 3 than the target DOK maximum.
o Grades 3 and 8: the percentage of items matched the target DOK range within +/- 5% at DOK level 1 but between 10–14% fewer items at DOK level 2 and between 13–22% more items at DOK level 3 than the DOK minimum and maximum values.
o Grade 4: the percentage of items did not match the target DOK ranges within +/- 5% but had 13% more items at DOK level 1, 31% fewer items at DOK level 2, and 9% fewer items at DOK level 3 than the DOK minimum and maximum values.
Executive Summary 5
While the above analysis took the DOK levels assigned by item writers as a given, we also evaluated the extent to which panelists agreed with the assigned item DOK level. Our analyses showed:
• On the Mathematics assessment at grades 5, 6, and 7, panelists agreed with less than 90% of the assigned item DOK levels. When there was disagreement, in general, panelists indicated the assigned item DOK level was too high.
• For the Reading assessment at grades 4, 6, and 7, panelists agreed with at least 90% of the item DOK levels while they agreed less at the other grades (grade 3, 73.1%; grade 5, 89.2%; grade 7, 85.4%).
• Panelists disagreed most with the Writing & Language assigned item DOK levels. o The 90% agreement threshold was met only for grade 6 (90.4%). o Panelists agreed with 80–85% of the assigned item DOK levels at grades 5
(85.2%), 7 (80.0%), and 8 (83.5%). o Panelists agreed with only 57.4% of the assigned item DOK levels at grades 3
and 4.2
• Across the Reading and Writing & Language assessments for grades 3, 4, 7, and 8, panelists typically rated the assigned item DOK levels as being too high. In contrast, panelists’ ratings of the assigned item DOK levels at grades 5 and 6 were approximately the same (i.e., similar percentage of assigned item DOK levels that were too low and a similar percentage of assigned item DOK levels that were too high).
Criterion 4: Item Sufficiency for Score Reporting
Finally, we examined item sufficiency for reporting of an overall score, subscores, and second-level subscores to ensure the scores delivered to students, parents, and teachers reflect what a student knows and can do, based on the set of assessment items administered. As part of the eMPowerME 2016–17 Technical Report, Measured Progress calculated Cronbach’s alpha and raw score standard errors of measurement (SEM). We reviewed these statistics and made the following conclusions:
• The overall score, subscores, and second-level subscores at all grades and assessments have reasonable SEM values.
• Cronbach’s alpha for all overall scores were greater than 0.70; therefore, judged to be acceptable
• In Mathematics o Cronbach’s alpha for all subscores except at grades 4, 6, and 8 were greater
than 0.70. At grades 4, 6, and 8, Cronbach’s alpha was 0.64, 0.59, and 0.65, respectively, for one of the subscore categories.
o At grades 3 and 5, Cronbach’s alpha was greater than 0.70 for at least 75% of the second-level subscores. For grades 4, 6, 7, and 8, Cronbach’s alpha was
2 It is important to note that panelists in grades 3 and 4 requested clarification regarding DOK level interpretations on several occasions. Panelists indicated that their previous training in DOK was inconsistent with DOK reference sheet information provided for the alignment study. Additionally, lack of specific DOK guidance for writing and language items, including the essay, led to requests for clarification from the content expert.
Executive Summary 6
greater than 0.70 for only one second-level subscore, with alphas ranging from 0.33–0.80.
• In Reading and Writing & Language o Cronbach’s alpha for all subscores were greater than 0.70. o Less than 75% of the second-level subscores across all grades had a
Cronbach’s alpha greater than 0.70, with alphas ranging from 0.21–0.73. o Grades 3 and 5 in Reading and grades 5, 6, and 8 in Writing & Language did not
have any second-level subscores with Cronbach’s alpha greater than 0.70. Because reliability generally increases when an assessment includes more items, it is not surprising that there are reliability issues especially with the second-level subscores. Indeed, most assessment subscores and second-level subscores were based on fewer than 15 items, which may present problems for accurately reporting subscores and second-level subscores no matter how high the quality of the items might be.
Recommendations
Overall, the eMPowerME alignment results were generally favorable at the item level. There were also areas where improvements could be implemented to enhance the Mathematics and ELA/Literacy assessments. Based on findings of the present study, we offer the following recommendations:
• eMPowerME Frameworks should include target percentages for domain representation and DOK levels for the Maine DOE to use as a reference. To ensure the eMPowerME assesses students on standards the Maine DOE considers of greatest importance for students to know and master at the end of each grade, the eMPowerME Frameworks should outline the proportion of items to assess each domain. This information is essential for the Maine DOE to determine the extent to which each eMPowerME assessment includes a sufficient distribution of items among domains, and student results are interpreted accurately and used as intended.
• Evaluate the standards being covered by items to ensure that an adequate percentage of standards is assessed. Target ranges of items per domain can lead to erroneous assumptions that all or the majority of standards associated within a domain are represented on an assessment. This inaccurate assumption was detected when evaluating Criteria 1 and 2 results. Based on results associated with Criterion 1, the Reading and Writing & Language assessments at several grades do not include at least 70% of the standards reflecting a restriction of skills evaluated by the assessment. In contrast, results associated with Criterion 2 showed that the percentage of items per domain matched the target percentage of items per domain except for grade 4 Writing & Language. Even though the percentage of items at the domain level met target ranges, the results indicate the breadth of standards covered by the items within a domain could be better. We recommend Maine DOE evaluate all grade/subject assessments that had less than 70% of the standards assessed to identify standards that should be assessed by items, especially the grade 7 Writing & Language assessment. Alternatively, Measured Progress could provide target ranges not only at the domain level but also the standard level.
Executive Summary 7
• Evaluate the distribution of DOK levels for all eMPowerME assessment items. For most grade/subject assessments, more than a 5% difference between actual and target DOK was seen at multiple DOK levels. Therefore, we recommend Maine DOE more closely scrutinize item DOK level to target match during form construction.
• Evaluate DOK levels assigned to items on all eMPowerME assessments. There were numerous grades where panelists agreed with less than 90% of the assigned DOKs, especially in the grades 3 and 4 Writing & Language assessment. In general, panelists rated the assigned item DOK levels as too high. Therefore, we recommend that Maine DOE seek clarification regarding DOK level descriptors used by Measured Progress to ensure common understanding and consistent application by item writers, DOE content specialists, and item review committee members moving forward. Additionally, the DOK level assigned to items where panelists disagreed with assigned DOK should be reviewed to ensure the most appropriate DOK level is identified.
• Review communication to teachers and parents regarding what subscores mean. Except for the grades 3 and 5 Mathematics assessments, all other grade/subject assessments provided subscores with less than acceptable levels of internal consistency to support critical decisions. Teachers and parents want to know, and should obtain from the assessments, as much information as possible about what students know and can do. We recommend that Maine DOE provide clear communication regarding the need to exercise caution in interpreting subscore (and especially second-level subscore) results. High-stakes decisions should be based on total test scores which are considerably more reliable. Subscore data can provide insight about curricular or instructional strengths and weaknesses, but this should be considered in the context of additional information available to the classroom teacher.
Chapter 1: Introduction 8
Independent Alignment Review of the Maine Education Assessments in Mathematics and English Language Arts/Literacy: eMPowerME
Chapter 1: Introduction
As with previous legislation, the Every Student Succeeds Act (ESSA) requires states to test students in English Language Arts/Literacy (hereby referred to as ELA/Literacy) and Mathematics in grades 3 through 8 and once in high school. Under ESSA, all states receiving Title I funds must present evidence of a valid and fair assessment system that is based on rigorous standards, alignment between standards and assessments, and student proficiency requirements. An alignment study can demonstrate the validity of a state assessment system by providing evidence that an assessment (a) represents the full range of the content standards intended to be assessed and (b) measures student knowledge in the same manner and at the same level of complexity as expected in the content standards. To meet state and Federal requirements, the Maine Department of Education (DOE) requested an independent review of the alignment between the Maine Education Assessment (eMPowerME) for ELA/Literacy and Mathematics in grades 3 – 8 and the Common Core State Standards (CCSS or standards), which Maine adopted in 2011. The Human Resources Research Organization (HumRRO) conducted the requested alignment study in August 2017. The remaining chapters of this report present detailed information about the methods we used to examine alignment of the eMPowerME with the CCSS and our analysis of the data we collected. Chapter 2 explains our alignment method, including the activities we completed to evaluate alignment of the eMPowerME assessments with the CCSS. Chapter 3 presents results describing the alignment of the eMPowerME ELA/Literacy and Mathematics assessment items to standards. Finally, Chapter 4 provides recommendations for Maine DOE to strengthen alignment of the eMPowerME assessments over time. Appendix A contains a list of workshop participants, Appendix B contains samples of review materials used in the alignment workshop, Appendix C lists the item ratings completed by panelists, Appendix D contains ELA/Literacy and Mathematics items rated as not linking to a CCSS or Mathematical Practice,3 and Appendix E contains a debriefing survey completed by panelists at the end of the alignment workshop.
3 Mathematical Practices are an additional component of the Mathematics CCSS.
Chapter 2: Alignment Study Design and Methodology 9
Chapter 2: Alignment Study Design and Methodology
In this chapter, we discuss key concepts related to alignment research, followed by a description of the alignment methods we used to complete the present study.
Alignment of eMPowerME Assessments and Standards
Alignment studies, at their core, answer one vital question related to the validity of an assessment: Does the assessment content adequately reflect the content that students are expected to learn as outlined in the state standards? School curriculum must include appropriate content as specified by the state and consequently assessments must measure the same content. Maine adopted the CCSS in 2011 and replaced its previous accountability assessments with the eMPowerME suite of assessments developed by Measured Progress during the 2015–16 school year. As such, alignment of the eMPowerME’s ELA/Literacy and Mathematics content to the respective CCSS is needed to ensure the validity of students’ results. In general, alignment evaluations for any assessment reveal the breadth, or scope, of knowledge as well as the depth of knowledge (DOK), or cognitive processing, expected of students by the state’s content standards. In addition to the question related to assessment validity, alignment analyses help to answer questions such as:
• How much and what type of content is covered by the assessment?
• Are students asked to demonstrate this knowledge at the same level of rigor as expected in the content standards?
eMPowerME Overview
The eMPower, in general, is a suite of assessments developed by Measured Progress and aligned to college and career readiness standards such as the CCSS. The eMPower suite of assessments was not developed specifically for the state of Maine but rather it is available to any state. The eMPowerME is a suite of assessments tailored for Maine and comprises three tests: (a) Reading, (b) Writing & Language, and (c) Mathematics. An additional Essay assessment was developed specifically for Maine and is administered as part of eMPowerME. The eMPowerME includes several different item types such as selected-response (SR), constructed-response (CR), and evidence-based selected response (EBSR). The ELA/Literacy assessment yields an overall score and two subscores, Reading and Writing & Language, which are reported to students and parents. An additional four second-level subscores associated with the Reading assessment and two (grade 7 only) or three second-level subscores associated with the Writing & Language assessment are available to teachers. The Mathematics assessment includes an overall Mathematics score and three subscores reported to students and parents. An additional four (grades 3, 4, and 5) or seven (grades 6, 7, and 8) second-level subscores are available to teachers. We used four key documents, which were provided by Measured Progress, to evaluate the alignment of the eMPowerME ELA/Literacy and Mathematics assessments with the CCSS. The eMPowerME Frameworks listed the tested standards by domain, the DOK levels associated with the standards, number of items by item type, and Mathematical Practices, if applicable; however, the eMPowerME Frameworks did not contain any targets for the percentage of items to be represented on an assessment by domain or DOK level. The test construction blueprint tables were also used, which listed item level data by grade and subject, such as the standard
Chapter 2: Alignment Study Design and Methodology 10
and DOK level associated with each item. The final two documents included a supplemental table of domain targets provided by Measured Progress specifically for the alignment evaluation and the eMPowerME Assessment ELA/Literacy & Mathematics: 2016–17 Technical Report (Measured Progress, 2017; hereby referred as eMPowerME 2016–17 Technical Report). Alignment Methodology and Criteria
We applied an alignment method that incorporated widely-accepted alignment criteria as well as criteria that addressed several concerns with traditional methods. Our method used (a) expert ratings to evaluate alignment based on three criteria (item content coverage, item coverage of standards, and item DOK distribution) and (b) extant documentation of student assessment data to evaluate item sufficiency for score reporting. This method borrowed much from Webb’s alignment methodology (1997, 1999, 2005), but diverged in key ways that allowed us to address the following limitations associated with the traditional alignment method and criteria:
• To decrease panelists’ cognitive load, we asked them to evaluate the information assigned by the item writer and stored in the test bank rather than identify a content standard or DOK level. If the panelist disagreed with an assigned content standard or a DOK level, s/he provided a more appropriate one.
• To expand upon traditional alignment, we had panelists indicate the degree of alignment: not linked, partially linked, or fully linked. On this scale, a rating of 2 (fully linked) indicated the content of the item was entirely covered in the standard and a rating of 1 (partially linked) indicated some of the item content was extraneous to the standard. The degree of alignment was then analyzed to assess the extent to which the assessment captured the intended content.
• Rather than declaring a minimum of six items as sufficient for score reporting (Webb, 1997), we reviewed Cronbach’s alpha and standard error of measurement (SEM) values presented in the eMPowerME 2016–17 Technical Report (Measured Progress, 2017). Taken together, these statistics provided an indication of whether the numbers of items are sufficient to support reporting reliable scores and subscores.
Item content coverage, item coverage of standards, and item DOK distribution were based on alignment data collected during an in-person alignment workshop while item sufficiency for score reporting was based on extant documentation using student assessment data. Criterion 1: Items Represent Intended Content. This was a basic measure of alignment between the content standards and the test items, which essentially served as a check of the content standard to which each item, developed by item writers, was written. Using a previously developed rating scale, panelists rated item alignment to the identified standard as no link, partially linked, or fully linked. For Mathematics, this included rating the Mathematical Practices4 assigned to items. We expected at least 90% of items per grade/subject to be rated as partially or fully linked. In addition, we checked that the standards listed in the eMPowerME Frameworks were indeed covered by items. The number of standards associated with fully and partially linked items were
4 Mathematical Practices are a balanced combination of procedure and understanding. They describe ways in which students increasingly ought to engage with the subject matter throughout their elementary, middle, and high school years.
Chapter 2: Alignment Study Design and Methodology 11
counted and compared to the number of standards in the eMPowerME Frameworks. We expected at least 70% of the CCSS in the eMPowerME Frameworks to be assessed by items. The Maine DOE was interested in determining the contribution of the Essay assessment to the eMPowerME. Since a standard(s) were not assigned for the Essay assessment item, panelists individually assigned standards to the Essay rubric traits, with the option of identifying multiple standards they felt assessed each rubric trait. We report in Chapter 3 the unique standards assigned to the Essay assessment by panelists as well as the contribution of the Essay assessment to ELA/Literacy overall. Criterion 2: Items Represent Intended Categories. For this criterion, we compared the expected distribution of items by domain (i.e., Reading Literature and Geometry), as presented in the test construction blueprint tables, to the actual proportion based on panelists’ ratings. The percentage of items per domain intended to be on the assessment (as indicated in the supplemental table) also was compared to the actual proportion based on panelists’ ratings. We report acceptability in terms of meeting the percentage of items per domain in the supplemental document, with the caveat that most standards within a domain were represented on an assessment. In addition, to better understand the extent to which the CCSS are covered by the eMPowerME, we include in Chapter 3 a frequency distribution of items in each domain that were either verified or identified by panelists. We expected at least 90% of items to be rated partially or fully linked for each CCSS domain. We also expected at least 85% of the CCSS domains per grade on the assessment to be +/- 5% from the minimum and maximum target values. Criterion 3: Item DOK Distribution. This was a measure of the cognitive complexity of items. To evaluate the DOK distribution, we focused on the DOK targets identified in the eMPowerME 2016–17 Technical Report, rather than ensuring 50% or more of the items were at the same DOK level as the standards (Webb’s DOK Consistency criterion [1997]). This was appropriate given that CCSS content domains were not typically addressed by a single item and there were often multiple, layered skills noted in a standard that were assessed by items that represented a range of DOK levels. This also was appropriate given the assumption a summative end-of-year assessment samples from the full scope of the standards. In general, we expected items to cover a range of DOK levels with a relatively equal distribution of items across the DOK levels. Except for DOK level 4, which required extended time to address an item, we also expected at least one item at each DOK level. We examined the DOK of the items and evaluated the distribution of items at each DOK level. Based on the DOK assigned to items during the item writing process, panelists assessed DOK for each item as (1) too low, (2) matching the assigned DOK, or (3) too high. For ratings of 1 or 3, panelists identified the DOK to which the item should have been rated and explained their reasoning why the indicated item DOK was too low or too high given the specific content. We report in Chapter 3 the percentage of items with each rating. Items with ratings of 1 or 3 were identified for scrutiny by Maine DOE or Maine’s vendor, Measured Progress. To meet DOK specifications, we expected 90% of items to match the DOK assigned by item writers. We also expected at least 85% of the DOK levels per domain and grade on the assessment to be +/- 5% from the minimum and maximum target values. Because a DOK rating was not available for the Essay assessment item, panelists individually assigned DOK levels to the Essay rubric traits. We report in Chapter 3 the percentage of rubric traits assigned to each DOK level by panelists. We expected items to contain a range of DOK values with a greater percentage of higher DOK than lower DOK.
Chapter 2: Alignment Study Design and Methodology 12
Criterion 4: Item Sufficiency for Score Reporting. This was a measure of how well items on the eMPowerME worked together to assess what a student knows and can do. In some alignment studies, this criterion is represented by a simple count of items by score/subscore and, if there are more than six items, the test is considered adequate (see Webb’s 1997, 1999, 2005 categorical concurrency alignment criteria). Using the eMPowerME 2016–17 Technical Report, we evaluated the reasonableness of the reliability statistics for overall scores and subscores reported to students and parents as well as additional second-level subscores available to teachers. The reliability statistics were based on the set of items reviewed in this alignment study. In general, overall test score reliability tends to be greater than subscore reliability due to the number of items contributing to the score/subscore. Simply declaring a minimum number of items per score/subscore category is not sufficient. We expected (a) overall scores to have a Cronbach’s alpha of at least 0.70, (b) 75% or more of the subscores and second-level subscores to have a Cronbach’s alpha greater than 0.70, and (c) 85% or more of the overall score, subscores, and second-level subscores to have a SEM less than 5.00. Results of the analyses associated with the above four criteria have the potential to be overwhelming. Generating multiple sets of alignment statistics for each grade/subject can create a challenge for interpretation. We provide in Chapter 4 simplified output in the form of flags that represent insufficient or questionable alignment statistics for that grade/subject.
Alignment Study Participants and Procedures
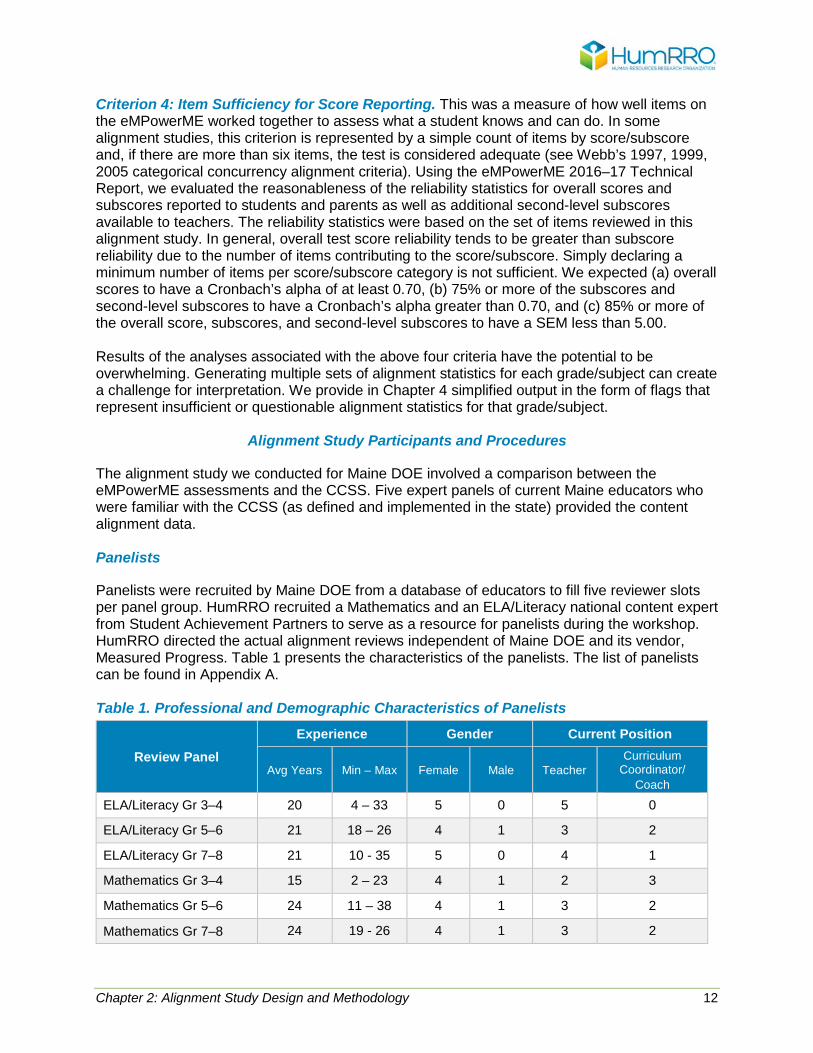
The alignment study we conducted for Maine DOE involved a comparison between the eMPowerME assessments and the CCSS. Five expert panels of current Maine educators who were familiar with the CCSS (as defined and implemented in the state) provided the content alignment data. Panelists
Panelists were recruited by Maine DOE from a database of educators to fill five reviewer slots per panel group. HumRRO recruited a Mathematics and an ELA/Literacy national content expert from Student Achievement Partners to serve as a resource for panelists during the workshop. HumRRO directed the actual alignment reviews independent of Maine DOE and its vendor, Measured Progress. Table 1 presents the characteristics of the panelists. The list of panelists can be found in Appendix A. Table 1. Professional and Demographic Characteristics of Panelists
Review Panel Experience Gender Current Position
Avg Years Min – Max Female Male Teacher Curriculum
Coordinator/ Coach
ELA/Literacy Gr 3–4 20 4 – 33 5 0 5 0
ELA/Literacy Gr 5–6 21 18 – 26 4 1 3 2
ELA/Literacy Gr 7–8 21 10 - 35 5 0 4 1
Mathematics Gr 3–4 15 2 – 23 4 1 2 3
Mathematics Gr 5–6 24 11 – 38 4 1 3 2
Mathematics Gr 7–8 24 19 - 26 4 1 3 2
Chapter 2: Alignment Study Design and Methodology 13
Training
An essential aspect of any alignment study is training for both panelists and facilitators. Because alignment workshops do not occur weekly and all studies are different, it is important to train even experienced alignment facilitators and panelists for the nuances of each study. Accordingly, facilitators attended a 2-hour training session that included a presentation of the eMPowerME suite of assessments, the overall alignment process and individual activities, and examples of the rating documents panelists would use. The alignment steps for facilitators were summarized in a Facilitator Instructions document. Facilitator training included a detailed review of the Facilitator Instructions document and highlights of specific procedural and anecdotal guidance for panelists. Panelists’ training began with a whole-group session that focused on the roles of all workshop participants (Maine DOE, HumRRO, Measured Progress, national experts, and panelists) and provided an overview of the alignment study and tasks. Additionally, a representative from Measured Progress provided additional context on the eMPowerME suite of assessments that focused on item development processes and features specifically related to alignment tasks. Once in the panel groups, HumRRO facilitators provided a detailed review of each specific alignment rating, the rating workbook, criteria and their definitions, and calibration activities to reinforce panelists’ shared understanding. Test Security
Because operational test items were reviewed during the alignment workshop, HumRRO staff followed strict procedures to ensure their security. Immediately upon receipt of the eMPowerME items, HumRRO maintained the items on a secure server and only relevant project staff was provided access. Paper copies of the test forms were numbered for tracking purposes. They were shipped via Federal Express to a designated Maine DOE staff member and a signature was required for acceptance. The paper test forms were secured in a locked room until the beginning of the workshop. Panelists were required to record the number of their assigned test form and to sign an affidavit agreeing to maintain the security of all item information. Materials were never left unattended during the alignment workshop, and all materials were placed in a single room locked by Maine DOE at the end of each workshop day. HumRRO’s lead facilitator was responsible for the security of the forms during the workshop. Cell phones were prohibited during the workshop and panelists were not allowed to use their workshop computers to access the Internet. Test information remained secure for the duration of the workshop. All paper test versions were shred at the Maine DOE office when the workshop ended. Materials
Panelists used hard copy operational test forms to review the items and they were provided hard copies of resource materials (e.g., Panelist Instructions, CCSS grade-level standards, Mathematical Practices, DOK reference sheets, Essay rubric). Panelists used an electronic workbook (Microsoft Excel) to record their ratings and each panelist was provided one laptop to access the electronic rating workbook. Panelist instructions and rating form examples are presented in Appendix B. Test Forms. Panelists evaluated eMPowerME operational items from a form administered in spring 2017. Table 2 presents the number of items that contributed to a student’s score in each content area.
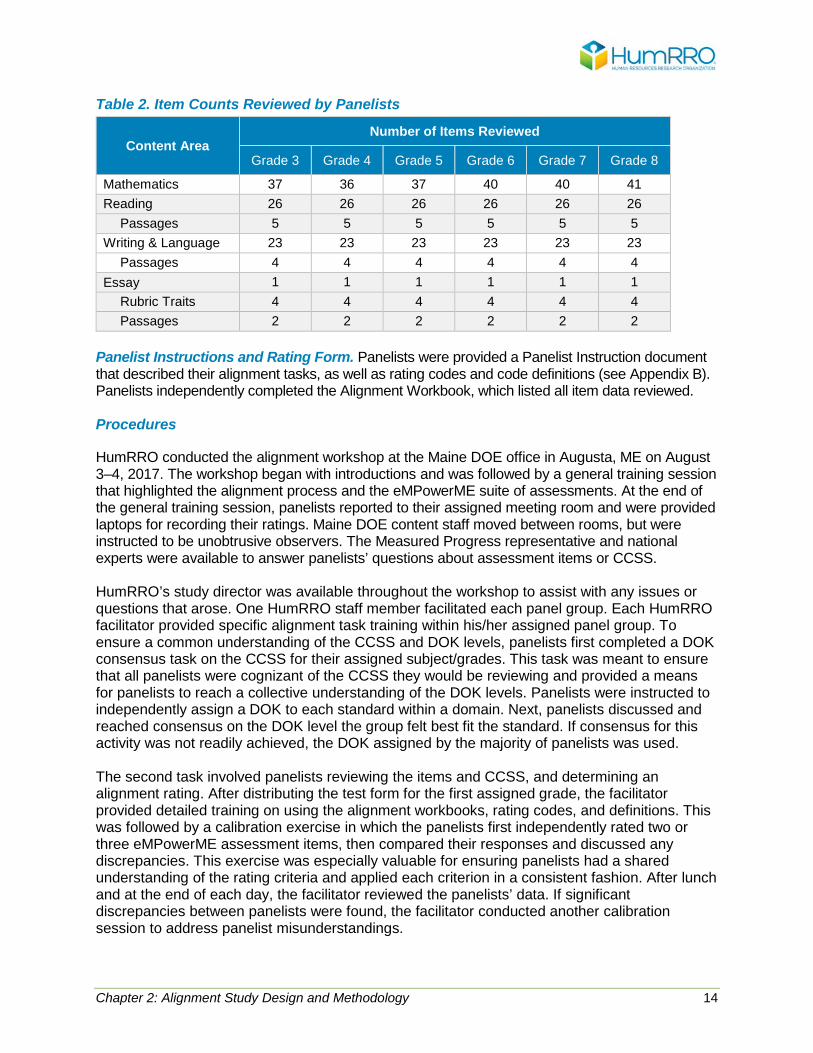
Chapter 2: Alignment Study Design and Methodology 14
Table 2. Item Counts Reviewed by Panelists
Content Area Number of Items Reviewed
Grade 3 Grade 4 Grade 5 Grade 6 Grade 7 Grade 8
Mathematics 37 36 37 40 40 41 Reading 26 26 26 26 26 26
Passages 5 5 5 5 5 5 Writing & Language 23 23 23 23 23 23
Passages 4 4 4 4 4 4 Essay 1 1 1 1 1 1
Rubric Traits 4 4 4 4 4 4 Passages 2 2 2 2 2 2
Panelist Instructions and Rating Form. Panelists were provided a Panelist Instruction document that described their alignment tasks, as well as rating codes and code definitions (see Appendix B). Panelists independently completed the Alignment Workbook, which listed all item data reviewed. Procedures
HumRRO conducted the alignment workshop at the Maine DOE office in Augusta, ME on August 3–4, 2017. The workshop began with introductions and was followed by a general training session that highlighted the alignment process and the eMPowerME suite of assessments. At the end of the general training session, panelists reported to their assigned meeting room and were provided laptops for recording their ratings. Maine DOE content staff moved between rooms, but were instructed to be unobtrusive observers. The Measured Progress representative and national experts were available to answer panelists’ questions about assessment items or CCSS. HumRRO’s study director was available throughout the workshop to assist with any issues or questions that arose. One HumRRO staff member facilitated each panel group. Each HumRRO facilitator provided specific alignment task training within his/her assigned panel group. To ensure a common understanding of the CCSS and DOK levels, panelists first completed a DOK consensus task on the CCSS for their assigned subject/grades. This task was meant to ensure that all panelists were cognizant of the CCSS they would be reviewing and provided a means for panelists to reach a collective understanding of the DOK levels. Panelists were instructed to independently assign a DOK to each standard within a domain. Next, panelists discussed and reached consensus on the DOK level the group felt best fit the standard. If consensus for this activity was not readily achieved, the DOK assigned by the majority of panelists was used. The second task involved panelists reviewing the items and CCSS, and determining an alignment rating. After distributing the test form for the first assigned grade, the facilitator provided detailed training on using the alignment workbooks, rating codes, and definitions. This was followed by a calibration exercise in which the panelists first independently rated two or three eMPowerME assessment items, then compared their responses and discussed any discrepancies. This exercise was especially valuable for ensuring panelists had a shared understanding of the rating criteria and applied each criterion in a consistent fashion. After lunch and at the end of each day, the facilitator reviewed the panelists’ data. If significant discrepancies between panelists were found, the facilitator conducted another calibration session to address panelist misunderstandings.
Chapter 3: Alignment Results 15
Chapter 3: Alignment Results
In this chapter, we report results on the following four alignment criteria:
(1) Items Represent Intended Content – a check of the content standard to which each item, developed by item writers, was written.
(2) Items Represent Intended Categories – a comparison of the expected distribution of items by domain (i.e., Reading Literature and Geometry), as presented in the test construction blueprint tables and the supplemental document provided by Measured Progress, to the actual proportion based on panelists’ ratings.
(3) Item DOK Distribution – a measure of the cognitive complexity of items. (4) Item Sufficiency for Score Reporting – an evaluation of reliability statistics from
Measured Progress for scores, subscores, and second-level subscores reported to students, parents, and teachers.
Recall we used four key documents to evaluate alignment of the eMPowerME ELA/Literacy and Mathematics assessments with the respective CCSS:
(1) eMPowerME Frameworks – listed the tested standards by domain, the DOK levels associated with the standards, number of items by item type, and Mathematical Practices, when applicable.
(2) Test construction blueprint tables – listed the item level data reviewed by panelists, such as the standard and DOK level associated with each item per grade/subject.
(3) Supplemental table of domain targets – listed the percentage of items per domain expected on the assessment.
(4) eMPowerME 2016–17 Technical Report – contained the target DOK levels on the assessment and reliability statistics based on student data.
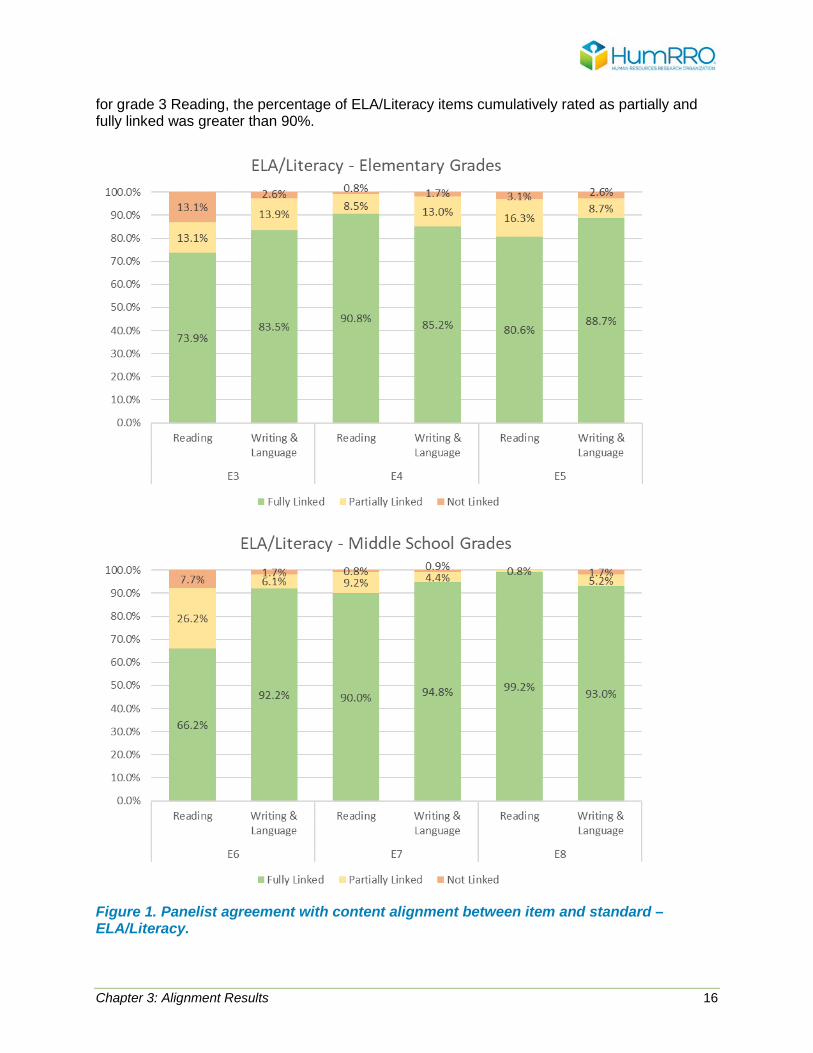
Criterion 1: Items Represent Intended Content
This criterion examined the content alignment between items and standards. We reviewed the extent to which items on a test form covered the intended standards and, when applicable, identified the items where alignment was weak. When developed, each item was written to assess specific content described in one or more CCSS. The results presented here are reported at the level of standards identified within the eMPowerME Frameworks (i.e., domain, standard) for ELA/Literacy and Mathematics. Panelists were asked to evaluate the alignment between the item and standard by indicating whether the content was fully linked (all content in the item was found in the standard), partially linked (most content in the item was found in the standard), or no link (the content in the item and the standard was completely different). Figure 1 presents the average panelist agreement of content match between the item and standard. The number of items given each rating were averaged across panelists and presented in the figure as percentages. To meet this part of the criterion, 90% or more of the items needed to be rated as partially and/or fully linked. As Figure 1 indicates, panelists rated 73.9–90.8% of the elementary grade and 66.2–99.2% of the middle school grade ELA/Literacy (Reading and Writing & Language) items as fully linked. In general, more of the ELA/Literacy items in the middle school grades than the elementary grades were rated as fully linked. The one exception to this trend was the grade 6 Reading items where panelists rated the fewest items (66.2%) across all grades as fully linked. Except
Chapter 3: Alignment Results 16
for grade 3 Reading, the percentage of ELA/Literacy items cumulatively rated as partially and fully linked was greater than 90%.
Figure 1. Panelist agreement with content alignment between item and standard – ELA/Literacy.
Chapter 3: Alignment Results 17
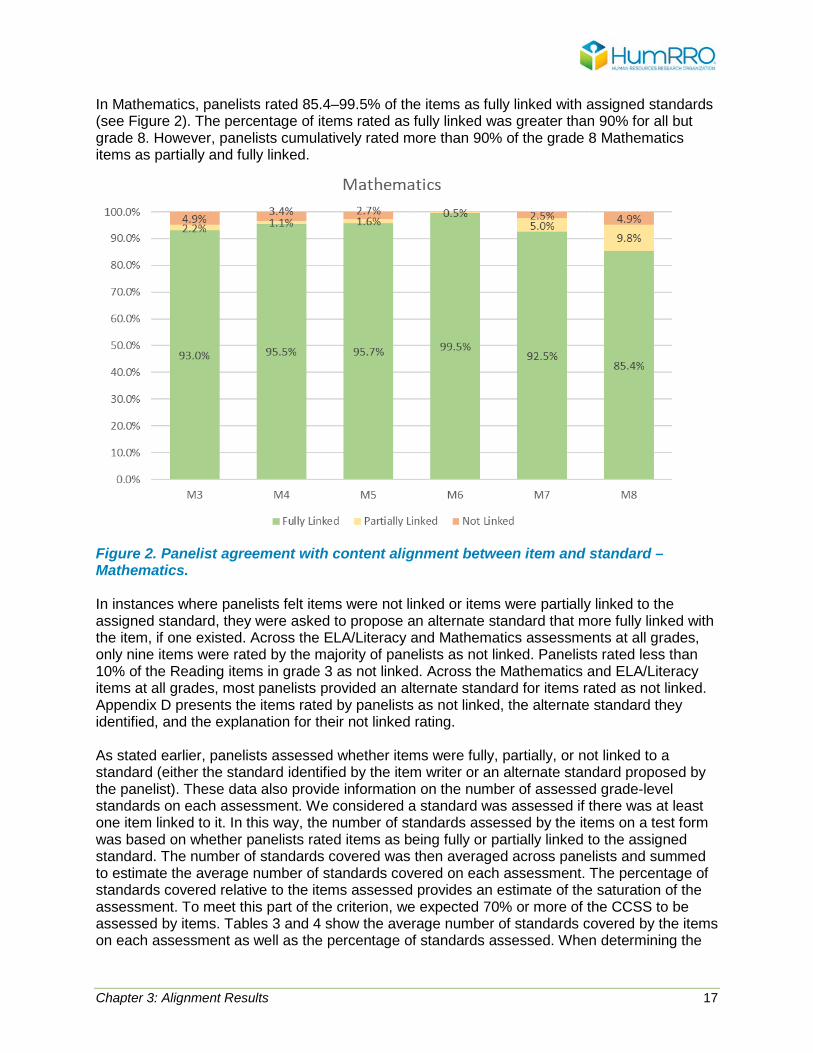
In Mathematics, panelists rated 85.4–99.5% of the items as fully linked with assigned standards (see Figure 2). The percentage of items rated as fully linked was greater than 90% for all but grade 8. However, panelists cumulatively rated more than 90% of the grade 8 Mathematics items as partially and fully linked.
Figure 2. Panelist agreement with content alignment between item and standard – Mathematics. In instances where panelists felt items were not linked or items were partially linked to the assigned standard, they were asked to propose an alternate standard that more fully linked with the item, if one existed. Across the ELA/Literacy and Mathematics assessments at all grades, only nine items were rated by the majority of panelists as not linked. Panelists rated less than 10% of the Reading items in grade 3 as not linked. Across the Mathematics and ELA/Literacy items at all grades, most panelists provided an alternate standard for items rated as not linked. Appendix D presents the items rated by panelists as not linked, the alternate standard they identified, and the explanation for their not linked rating. As stated earlier, panelists assessed whether items were fully, partially, or not linked to a standard (either the standard identified by the item writer or an alternate standard proposed by the panelist). These data also provide information on the number of assessed grade-level standards on each assessment. We considered a standard was assessed if there was at least one item linked to it. In this way, the number of standards assessed by the items on a test form was based on whether panelists rated items as being fully or partially linked to the assigned standard. The number of standards covered was then averaged across panelists and summed to estimate the average number of standards covered on each assessment. The percentage of standards covered relative to the items assessed provides an estimate of the saturation of the assessment. To meet this part of the criterion, we expected 70% or more of the CCSS to be assessed by items. Tables 3 and 4 show the average number of standards covered by the items on each assessment as well as the percentage of standards assessed. When determining the
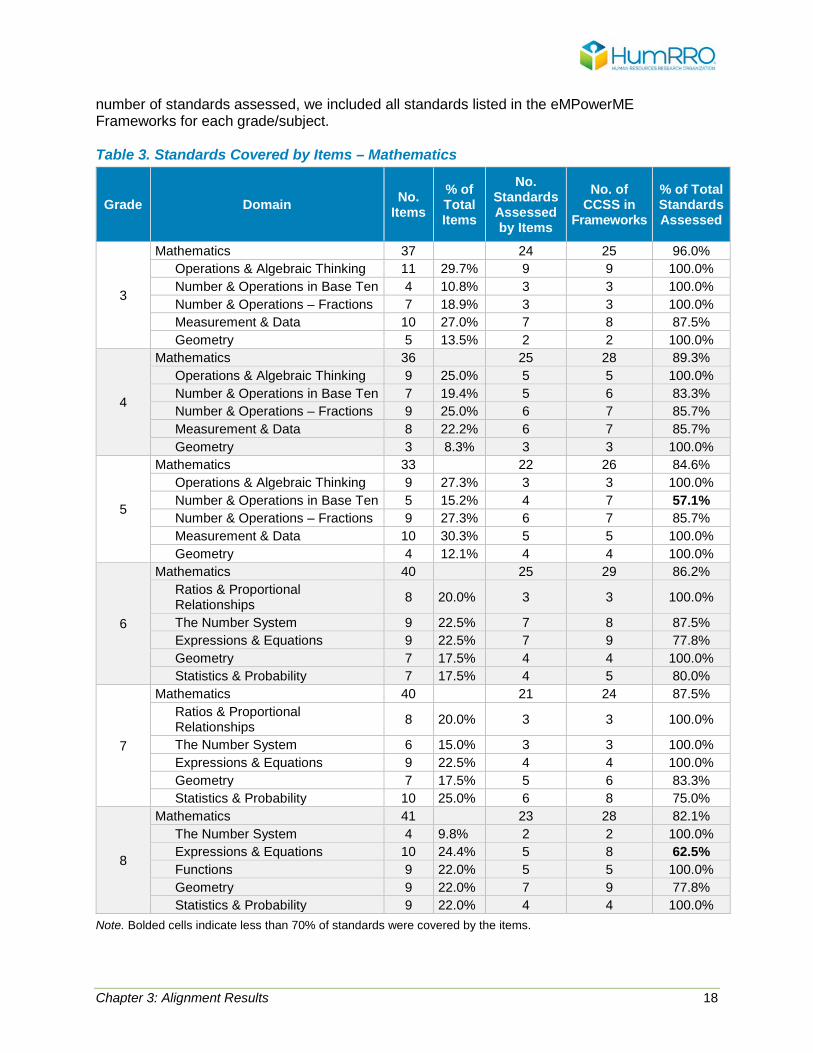
Chapter 3: Alignment Results 18
number of standards assessed, we included all standards listed in the eMPowerME Frameworks for each grade/subject. Table 3. Standards Covered by Items – Mathematics
Grade Domain No. Items
% of Total Items
No. Standards Assessed by Items
No. of CCSS in
Frameworks
% of Total Standards Assessed
3
Mathematics 37 24 25 96.0% Operations & Algebraic Thinking 11 29.7% 9 9 100.0% Number & Operations in Base Ten 4 10.8% 3 3 100.0% Number & Operations – Fractions 7 18.9% 3 3 100.0% Measurement & Data 10 27.0% 7 8 87.5% Geometry 5 13.5% 2 2 100.0%
4
Mathematics 36 25 28 89.3% Operations & Algebraic Thinking 9 25.0% 5 5 100.0% Number & Operations in Base Ten 7 19.4% 5 6 83.3% Number & Operations – Fractions 9 25.0% 6 7 85.7% Measurement & Data 8 22.2% 6 7 85.7% Geometry 3 8.3% 3 3 100.0%
5
Mathematics 33 22 26 84.6% Operations & Algebraic Thinking 9 27.3% 3 3 100.0% Number & Operations in Base Ten 5 15.2% 4 7 57.1% Number & Operations – Fractions 9 27.3% 6 7 85.7% Measurement & Data 10 30.3% 5 5 100.0% Geometry 4 12.1% 4 4 100.0%
6
Mathematics 40 25 29 86.2% Ratios & Proportional Relationships 8 20.0% 3 3 100.0%
The Number System 9 22.5% 7 8 87.5% Expressions & Equations 9 22.5% 7 9 77.8% Geometry 7 17.5% 4 4 100.0% Statistics & Probability 7 17.5% 4 5 80.0%
7
Mathematics 40 21 24 87.5% Ratios & Proportional Relationships 8 20.0% 3 3 100.0%
The Number System 6 15.0% 3 3 100.0% Expressions & Equations 9 22.5% 4 4 100.0% Geometry 7 17.5% 5 6 83.3% Statistics & Probability 10 25.0% 6 8 75.0%
8
Mathematics 41 23 28 82.1% The Number System 4 9.8% 2 2 100.0% Expressions & Equations 10 24.4% 5 8 62.5% Functions 9 22.0% 5 5 100.0% Geometry 9 22.0% 7 9 77.8% Statistics & Probability 9 22.0% 4 4 100.0%
Note. Bolded cells indicate less than 70% of standards were covered by the items.
Chapter 3: Alignment Results 19
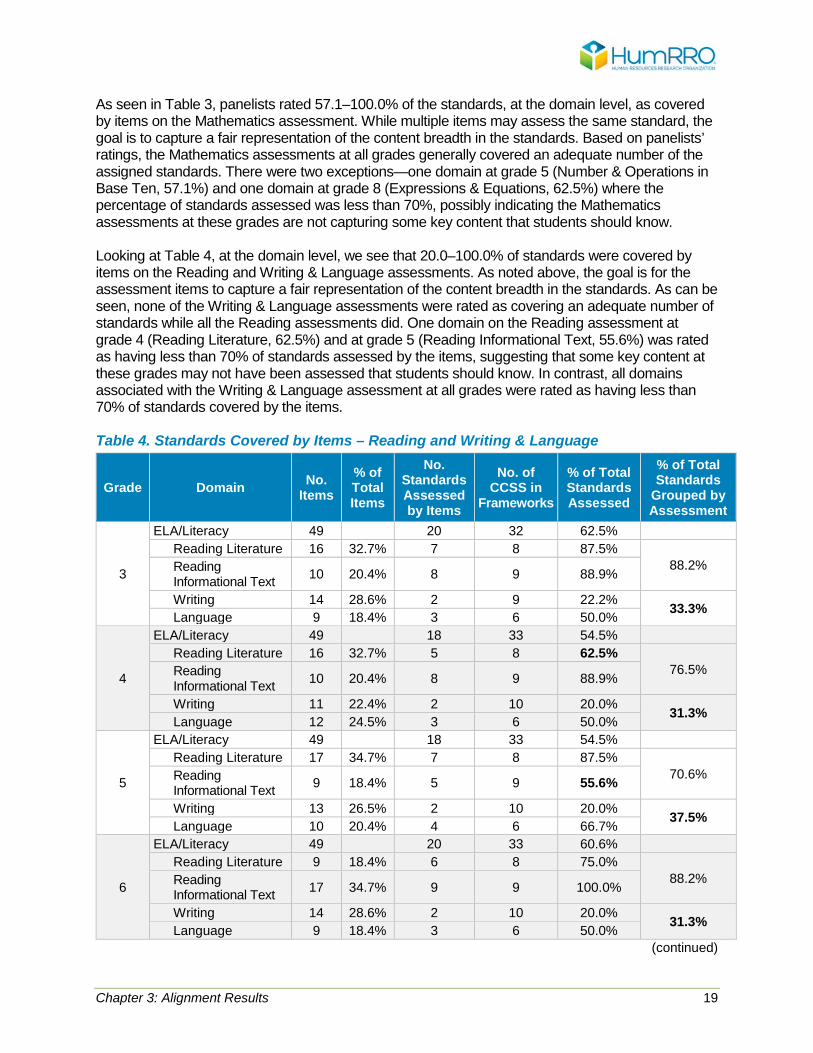
As seen in Table 3, panelists rated 57.1–100.0% of the standards, at the domain level, as covered by items on the Mathematics assessment. While multiple items may assess the same standard, the goal is to capture a fair representation of the content breadth in the standards. Based on panelists’ ratings, the Mathematics assessments at all grades generally covered an adequate number of the assigned standards. There were two exceptions—one domain at grade 5 (Number & Operations in Base Ten, 57.1%) and one domain at grade 8 (Expressions & Equations, 62.5%) where the percentage of standards assessed was less than 70%, possibly indicating the Mathematics assessments at these grades are not capturing some key content that students should know. Looking at Table 4, at the domain level, we see that 20.0–100.0% of standards were covered by items on the Reading and Writing & Language assessments. As noted above, the goal is for the assessment items to capture a fair representation of the content breadth in the standards. As can be seen, none of the Writing & Language assessments were rated as covering an adequate number of standards while all the Reading assessments did. One domain on the Reading assessment at grade 4 (Reading Literature, 62.5%) and at grade 5 (Reading Informational Text, 55.6%) was rated as having less than 70% of standards assessed by the items, suggesting that some key content at these grades may not have been assessed that students should know. In contrast, all domains associated with the Writing & Language assessment at all grades were rated as having less than 70% of standards covered by the items. Table 4. Standards Covered by Items – Reading and Writing & Language
Grade Domain No. Items
% of Total Items
No. Standards Assessed by Items
No. of CCSS in
Frameworks
% of Total Standards Assessed
% of Total Standards
Grouped by Assessment
3
ELA/Literacy 49 20 32 62.5% Reading Literature 16 32.7% 7 8 87.5%
88.2% Reading Informational Text 10 20.4% 8 9 88.9%
Writing 14 28.6% 2 9 22.2% 33.3% Language 9 18.4% 3 6 50.0%
4
ELA/Literacy 49 18 33 54.5% Reading Literature 16 32.7% 5 8 62.5%
76.5% Reading Informational Text 10 20.4% 8 9 88.9%
Writing 11 22.4% 2 10 20.0% 31.3% Language 12 24.5% 3 6 50.0%
5
ELA/Literacy 49 18 33 54.5% Reading Literature 17 34.7% 7 8 87.5%
70.6% Reading Informational Text 9 18.4% 5 9 55.6%
Writing 13 26.5% 2 10 20.0% 37.5% Language 10 20.4% 4 6 66.7%
6
ELA/Literacy 49 20 33 60.6% Reading Literature 9 18.4% 6 8 75.0%
88.2% Reading Informational Text 17 34.7% 9 9 100.0%
Writing 14 28.6% 2 10 20.0% 31.3% Language 9 18.4% 3 6 50.0% (continued)
Chapter 3: Alignment Results 20
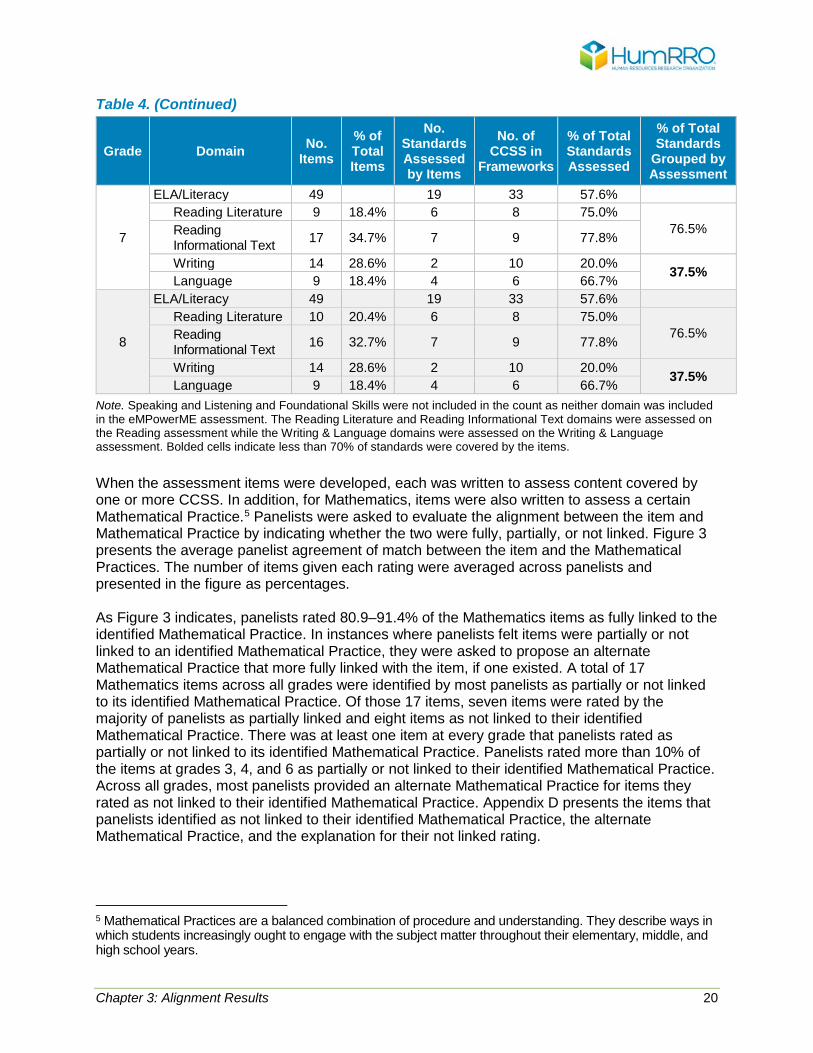
Table 4. (Continued)
Grade Domain No. Items
% of Total Items
No. Standards Assessed by Items
No. of CCSS in
Frameworks
% of Total Standards Assessed
% of Total Standards
Grouped by Assessment
7
ELA/Literacy 49 19 33 57.6% Reading Literature 9 18.4% 6 8 75.0%
76.5% Reading Informational Text 17 34.7% 7 9 77.8%
Writing 14 28.6% 2 10 20.0% 37.5% Language 9 18.4% 4 6 66.7%
8
ELA/Literacy 49 19 33 57.6% Reading Literature 10 20.4% 6 8 75.0%
76.5% Reading Informational Text 16 32.7% 7 9 77.8%
Writing 14 28.6% 2 10 20.0% 37.5% Language 9 18.4% 4 6 66.7% Note. Speaking and Listening and Foundational Skills were not included in the count as neither domain was included in the eMPowerME assessment. The Reading Literature and Reading Informational Text domains were assessed on the Reading assessment while the Writing & Language domains were assessed on the Writing & Language assessment. Bolded cells indicate less than 70% of standards were covered by the items. When the assessment items were developed, each was written to assess content covered by one or more CCSS. In addition, for Mathematics, items were also written to assess a certain Mathematical Practice.5 Panelists were asked to evaluate the alignment between the item and Mathematical Practice by indicating whether the two were fully, partially, or not linked. Figure 3 presents the average panelist agreement of match between the item and the Mathematical Practices. The number of items given each rating were averaged across panelists and presented in the figure as percentages. As Figure 3 indicates, panelists rated 80.9–91.4% of the Mathematics items as fully linked to the identified Mathematical Practice. In instances where panelists felt items were partially or not linked to an identified Mathematical Practice, they were asked to propose an alternate Mathematical Practice that more fully linked with the item, if one existed. A total of 17 Mathematics items across all grades were identified by most panelists as partially or not linked to its identified Mathematical Practice. Of those 17 items, seven items were rated by the majority of panelists as partially linked and eight items as not linked to their identified Mathematical Practice. There was at least one item at every grade that panelists rated as partially or not linked to its identified Mathematical Practice. Panelists rated more than 10% of the items at grades 3, 4, and 6 as partially or not linked to their identified Mathematical Practice. Across all grades, most panelists provided an alternate Mathematical Practice for items they rated as not linked to their identified Mathematical Practice. Appendix D presents the items that panelists identified as not linked to their identified Mathematical Practice, the alternate Mathematical Practice, and the explanation for their not linked rating.
5 Mathematical Practices are a balanced combination of procedure and understanding. They describe ways in which students increasingly ought to engage with the subject matter throughout their elementary, middle, and high school years.
Chapter 3: Alignment Results 21
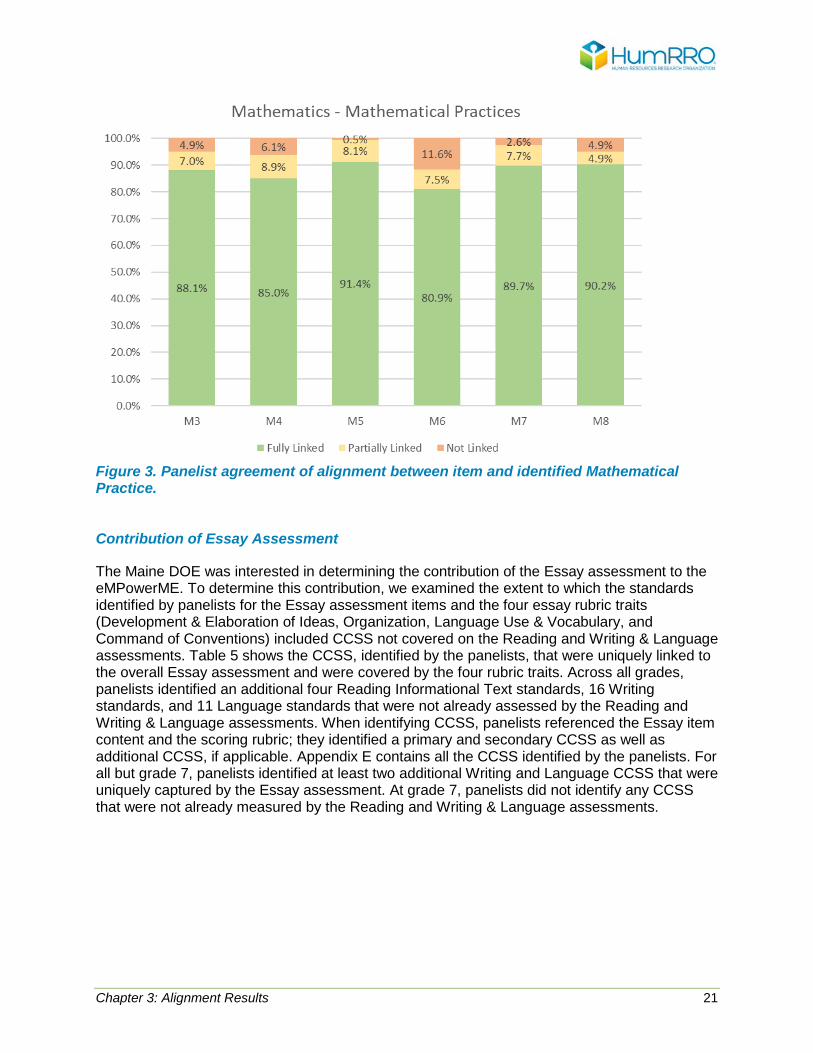
Figure 3. Panelist agreement of alignment between item and identified Mathematical Practice. Contribution of Essay Assessment
The Maine DOE was interested in determining the contribution of the Essay assessment to the eMPowerME. To determine this contribution, we examined the extent to which the standards identified by panelists for the Essay assessment items and the four essay rubric traits (Development & Elaboration of Ideas, Organization, Language Use & Vocabulary, and Command of Conventions) included CCSS not covered on the Reading and Writing & Language assessments. Table 5 shows the CCSS, identified by the panelists, that were uniquely linked to the overall Essay assessment and were covered by the four rubric traits. Across all grades, panelists identified an additional four Reading Informational Text standards, 16 Writing standards, and 11 Language standards that were not already assessed by the Reading and Writing & Language assessments. When identifying CCSS, panelists referenced the Essay item content and the scoring rubric; they identified a primary and secondary CCSS as well as additional CCSS, if applicable. Appendix E contains all the CCSS identified by the panelists. For all but grade 7, panelists identified at least two additional Writing and Language CCSS that were uniquely captured by the Essay assessment. At grade 7, panelists did not identify any CCSS that were not already measured by the Reading and Writing & Language assessments.
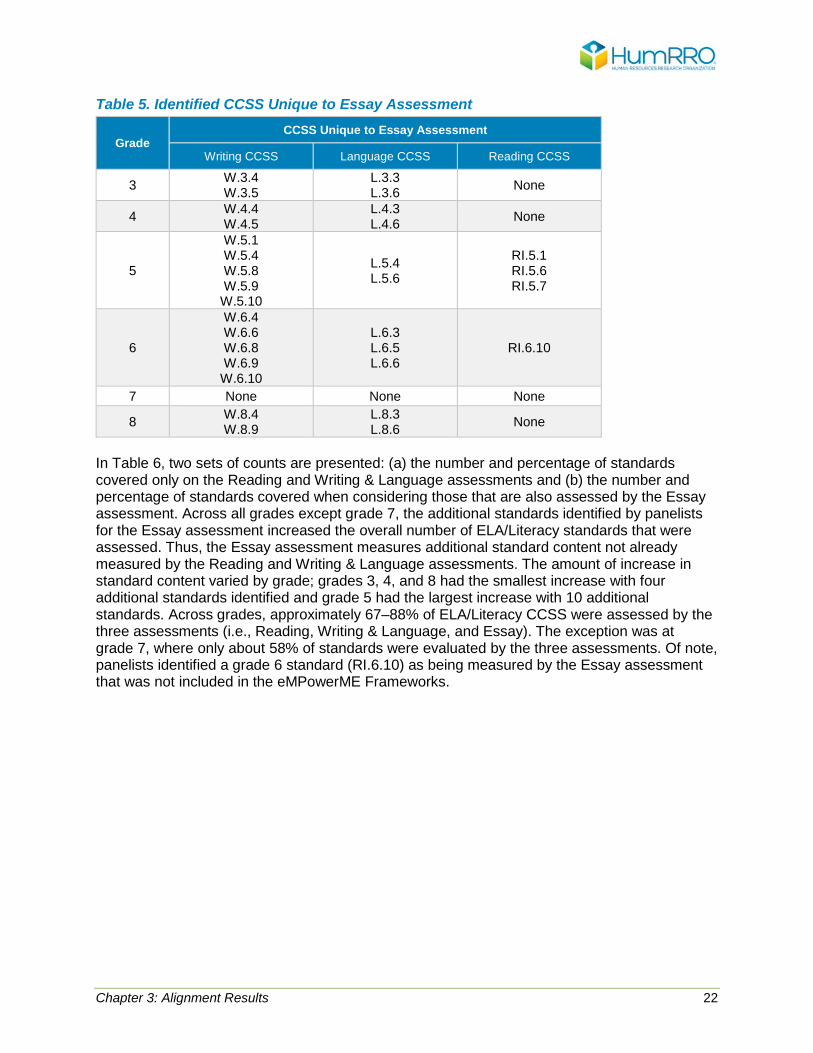
Chapter 3: Alignment Results 22
Table 5. Identified CCSS Unique to Essay Assessment
Grade CCSS Unique to Essay Assessment
Writing CCSS Language CCSS Reading CCSS
3 W.3.4 W.3.5
L.3.3 L.3.6 None
4 W.4.4 W.4.5
L.4.3 L.4.6 None
5
W.5.1 W.5.4 W.5.8 W.5.9 W.5.10
L.5.4 L.5.6
RI.5.1 RI.5.6 RI.5.7
6
W.6.4 W.6.6 W.6.8 W.6.9 W.6.10
L.6.3 L.6.5 L.6.6
RI.6.10
7 None None None
8 W.8.4 W.8.9
L.8.3 L.8.6 None
In Table 6, two sets of counts are presented: (a) the number and percentage of standards covered only on the Reading and Writing & Language assessments and (b) the number and percentage of standards covered when considering those that are also assessed by the Essay assessment. Across all grades except grade 7, the additional standards identified by panelists for the Essay assessment increased the overall number of ELA/Literacy standards that were assessed. Thus, the Essay assessment measures additional standard content not already measured by the Reading and Writing & Language assessments. The amount of increase in standard content varied by grade; grades 3, 4, and 8 had the smallest increase with four additional standards identified and grade 5 had the largest increase with 10 additional standards. Across grades, approximately 67–88% of ELA/Literacy CCSS were assessed by the three assessments (i.e., Reading, Writing & Language, and Essay). The exception was at grade 7, where only about 58% of standards were evaluated by the three assessments. Of note, panelists identified a grade 6 standard (RI.6.10) as being measured by the Essay assessment that was not included in the eMPowerME Frameworks.
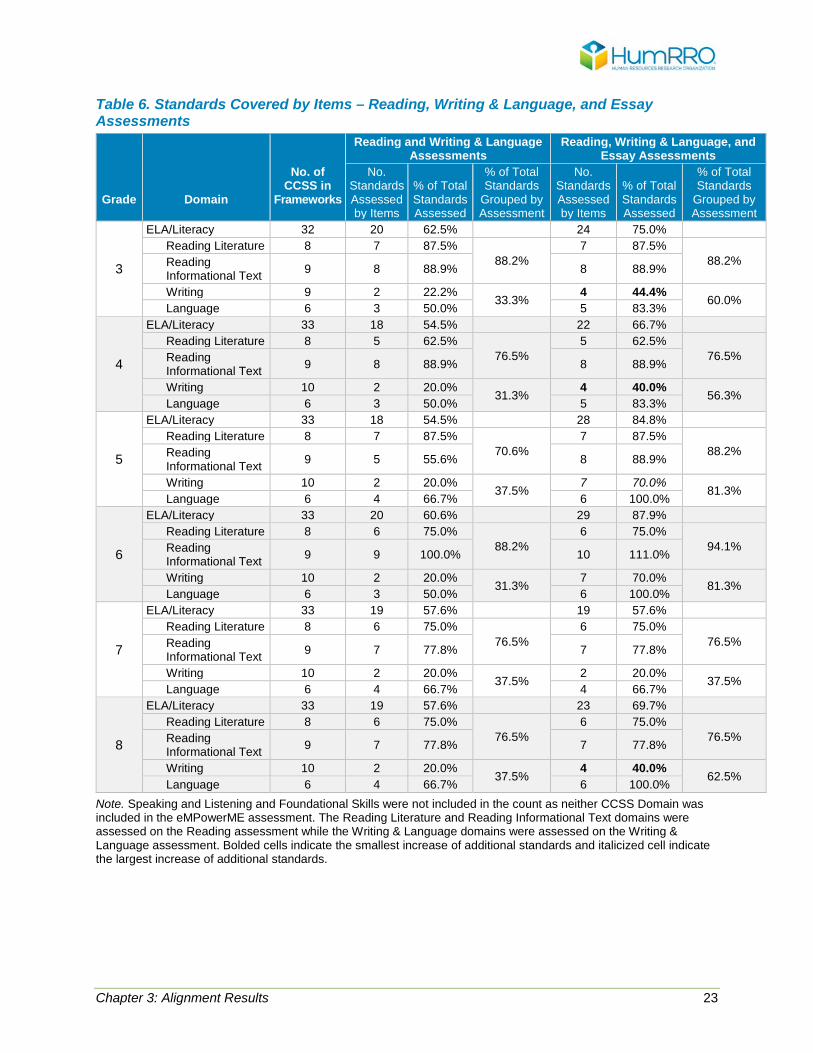
Chapter 3: Alignment Results 23
Table 6. Standards Covered by Items – Reading, Writing & Language, and Essay Assessments
Grade
Domain
No. of CCSS in
Frameworks
Reading and Writing & Language Assessments
Reading, Writing & Language, and Essay Assessments
No. Standards Assessed by Items
% of Total Standards Assessed
% of Total Standards
Grouped by Assessment
No. Standards Assessed by Items
% of Total Standards Assessed
% of Total Standards
Grouped by Assessment
3
ELA/Literacy 32 20 62.5% 24 75.0% Reading Literature 8 7 87.5%
88.2% 7 87.5%
88.2% Reading Informational Text 9 8 88.9% 8 88.9%
Writing 9 2 22.2% 33.3% 4 44.4% 60.0% Language 6 3 50.0% 5 83.3%
4
ELA/Literacy 33 18 54.5% 22 66.7% Reading Literature 8 5 62.5%
76.5% 5 62.5%
76.5% Reading Informational Text 9 8 88.9% 8 88.9%
Writing 10 2 20.0% 31.3% 4 40.0% 56.3% Language 6 3 50.0% 5 83.3%
5
ELA/Literacy 33 18 54.5% 28 84.8% Reading Literature 8 7 87.5%
70.6% 7 87.5%
88.2% Reading Informational Text 9 5 55.6% 8 88.9%
Writing 10 2 20.0% 37.5% 7 70.0% 81.3% Language 6 4 66.7% 6 100.0%
6
ELA/Literacy 33 20 60.6% 29 87.9% Reading Literature 8 6 75.0%
88.2% 6 75.0%
94.1% Reading Informational Text 9 9 100.0% 10 111.0%
Writing 10 2 20.0% 31.3% 7 70.0% 81.3% Language 6 3 50.0% 6 100.0%
7
ELA/Literacy 33 19 57.6% 19 57.6% Reading Literature 8 6 75.0%
76.5% 6 75.0%
76.5% Reading Informational Text 9 7 77.8% 7 77.8%
Writing 10 2 20.0% 37.5% 2 20.0% 37.5% Language 6 4 66.7% 4 66.7%
8
ELA/Literacy 33 19 57.6% 23 69.7% Reading Literature 8 6 75.0%
76.5% 6 75.0%
76.5% Reading Informational Text 9 7 77.8% 7 77.8%
Writing 10 2 20.0% 37.5%
4 40.0% 62.5% Language 6 4 66.7% 6 100.0%
Note. Speaking and Listening and Foundational Skills were not included in the count as neither CCSS Domain was included in the eMPowerME assessment. The Reading Literature and Reading Informational Text domains were assessed on the Reading assessment while the Writing & Language domains were assessed on the Writing & Language assessment. Bolded cells indicate the smallest increase of additional standards and italicized cell indicate the largest increase of additional standards.
Chapter 3: Alignment Results 24
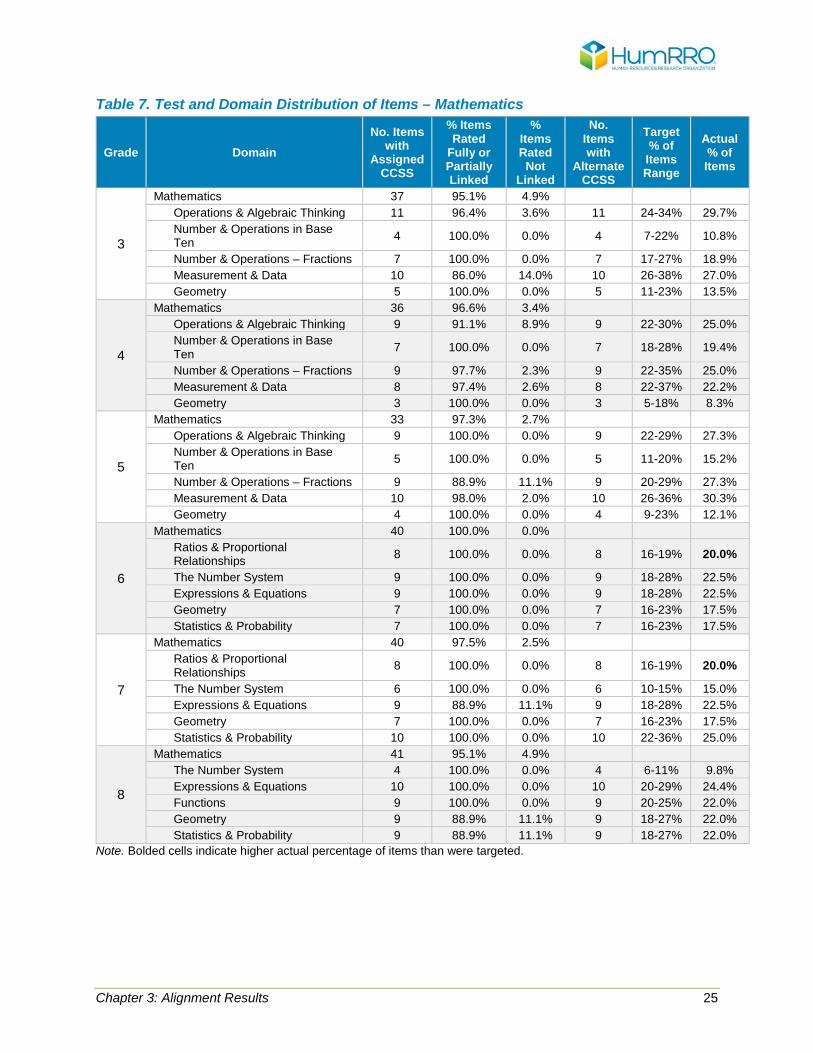
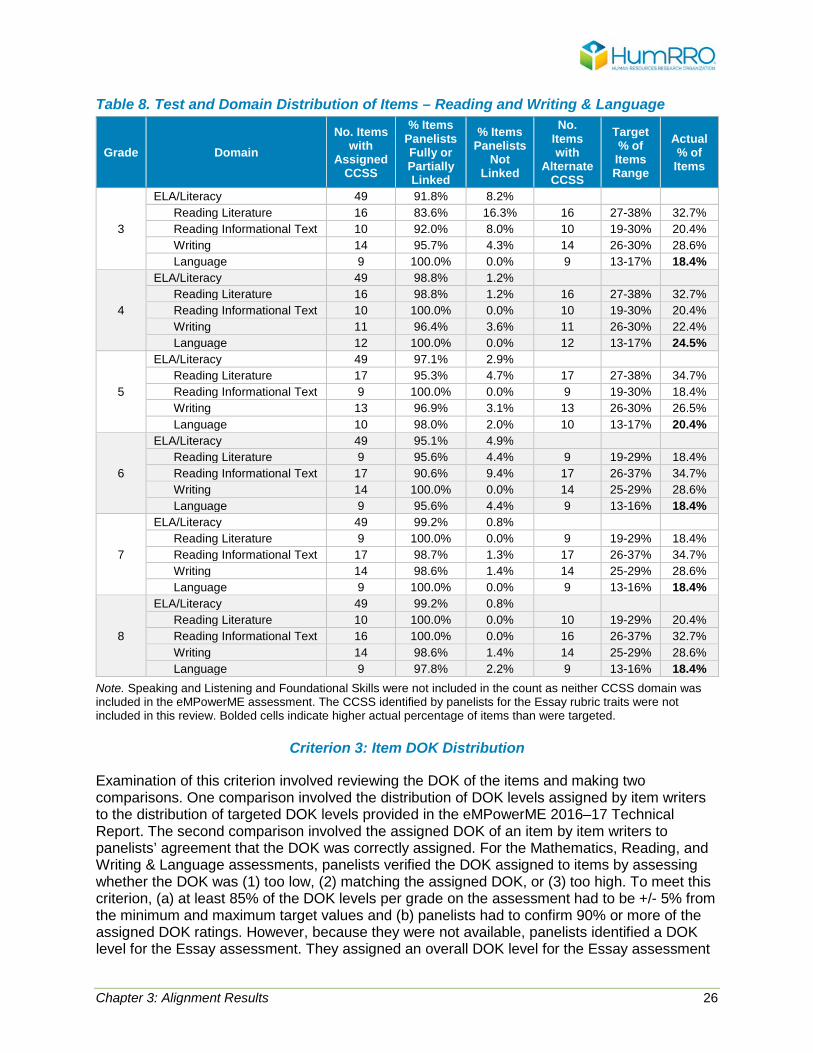
Criterion 2: Items Represent Intended Categories
In this section, we examine how panelists’ ratings of items as fully and partially linked were distributed across CCSS domains. Generally, we compared panelists’ distribution of item-standard linkages to a target stated in assessment documentation such as test specifications. However, neither the eMPowerME Frameworks, which contain only the list of testable standards, nor the test construction blueprint table, which contains item level data, identify targets for the percentage of items associated with each CCSS domain. Thus, we requested that Measured Progress provide a supplemental table of domain targets for all grades/subjects so we could compare the percentage of items assessed in each domain to the domain targets. We evaluated this criterion by examining the percentage of items rated by panelists as fully or partially linked compared to the percentage of items rated as not linked. We used the panelists’ item-to-standard alignment data for this analysis. Because each assigned standard was associated with a domain, panelists also linked items to domains when they agreed with the standard paired with an item or they proposed an alternate standard that better assessed the item. Using the alternate standard, we determined whether the domain changed with the alternate standard or remained the same. In general, we expected that the assigned standard and the alternate standard would be associated with the same domain and for the percentage of items in each domain to fall within the target range provided in the supplemental document from Measured Progress. We considered this criterion to be met when panelists (a) cumulatively rated 90% or more of items as fully and partially linked for each CCSS domain and (b) 85% or more of the CCSS domains per grade on the assessment were +/- 5% from the minimum and maximum target values. Tables 7 and 8 present the accumulated distribution of Mathematics and Reading and Writing & Language assessment items by domain, respectively. The standards associated with the Essay assessment were not included in this analysis because panelists identified standards but they did not verify the standards assigned to the rubric traits. We summed the number of items fully or partially linked to each domain, by panelist, and then we averaged across panelists to determine the average percentage of items in each domain. For any item panelists rated as not linked, the alternate CCSS was evaluated to determine whether the item remained in the same domain as originally intended. The column labeled “No. Items with Alternate CCSS” shows the alternate CCSS that panelists identified for items rated as not linked resulted in the same number of items in each domain across all assessments and grades. For all but one Mathematics domain at grades 6 and 7 (i.e., Ratios & Proportional Relationships for both grades), the percentage of items assessed per domain was within the target percentage of assessment items. In both grades, the percentage of items was only slightly greater than the target maximum. In contrast, as seen in Table 8, all grades show a greater percentage of items in the Language domain than intended by the maximum target value, with grade 4 having approximately 7% more items than the maximum target value. For grades 5, 6, and 7, an additional domain (Reading Literature or Reading Informational Text) shows a slightly lower percentage of items were present on the test than the minimum target value.
Chapter 3: Alignment Results 25
Table 7. Test and Domain Distribution of Items – Mathematics
Grade Domain No. Items
with Assigned
CCSS
% Items Rated
Fully or Partially Linked
% Items Rated
Not Linked
No. Items with
Alternate CCSS
Target % of Items Range
Actual % of Items
3
Mathematics 37 95.1% 4.9% Operations & Algebraic Thinking 11 96.4% 3.6% 11 24-34% 29.7% Number & Operations in Base Ten 4 100.0% 0.0% 4 7-22% 10.8%
Number & Operations – Fractions 7 100.0% 0.0% 7 17-27% 18.9% Measurement & Data 10 86.0% 14.0% 10 26-38% 27.0% Geometry 5 100.0% 0.0% 5 11-23% 13.5%
4
Mathematics 36 96.6% 3.4% Operations & Algebraic Thinking 9 91.1% 8.9% 9 22-30% 25.0% Number & Operations in Base Ten 7 100.0% 0.0% 7 18-28% 19.4%
Number & Operations – Fractions 9 97.7% 2.3% 9 22-35% 25.0% Measurement & Data 8 97.4% 2.6% 8 22-37% 22.2% Geometry 3 100.0% 0.0% 3 5-18% 8.3%
5
Mathematics 33 97.3% 2.7% Operations & Algebraic Thinking 9 100.0% 0.0% 9 22-29% 27.3% Number & Operations in Base Ten 5 100.0% 0.0% 5 11-20% 15.2%
Number & Operations – Fractions 9 88.9% 11.1% 9 20-29% 27.3% Measurement & Data 10 98.0% 2.0% 10 26-36% 30.3% Geometry 4 100.0% 0.0% 4 9-23% 12.1%
6
Mathematics 40 100.0% 0.0% Ratios & Proportional Relationships 8 100.0% 0.0% 8 16-19% 20.0%
The Number System 9 100.0% 0.0% 9 18-28% 22.5% Expressions & Equations 9 100.0% 0.0% 9 18-28% 22.5% Geometry 7 100.0% 0.0% 7 16-23% 17.5% Statistics & Probability 7 100.0% 0.0% 7 16-23% 17.5%
7
Mathematics 40 97.5% 2.5% Ratios & Proportional Relationships 8 100.0% 0.0% 8 16-19% 20.0%
The Number System 6 100.0% 0.0% 6 10-15% 15.0% Expressions & Equations 9 88.9% 11.1% 9 18-28% 22.5% Geometry 7 100.0% 0.0% 7 16-23% 17.5% Statistics & Probability 10 100.0% 0.0% 10 22-36% 25.0%
8
Mathematics 41 95.1% 4.9% The Number System 4 100.0% 0.0% 4 6-11% 9.8% Expressions & Equations 10 100.0% 0.0% 10 20-29% 24.4% Functions 9 100.0% 0.0% 9 20-25% 22.0% Geometry 9 88.9% 11.1% 9 18-27% 22.0% Statistics & Probability 9 88.9% 11.1% 9 18-27% 22.0%
Note. Bolded cells indicate higher actual percentage of items than were targeted.
Chapter 3: Alignment Results 26
Table 8. Test and Domain Distribution of Items – Reading and Writing & Language
Grade Domain No. Items
with Assigned
CCSS
% Items Panelists Fully or Partially Linked
% Items Panelists
Not Linked
No. Items with
Alternate CCSS
Target % of Items Range
Actual % of Items
3
ELA/Literacy 49 91.8% 8.2% Reading Literature 16 83.6% 16.3% 16 27-38% 32.7% Reading Informational Text 10 92.0% 8.0% 10 19-30% 20.4% Writing 14 95.7% 4.3% 14 26-30% 28.6% Language 9 100.0% 0.0% 9 13-17% 18.4%
4
ELA/Literacy 49 98.8% 1.2% Reading Literature 16 98.8% 1.2% 16 27-38% 32.7% Reading Informational Text 10 100.0% 0.0% 10 19-30% 20.4% Writing 11 96.4% 3.6% 11 26-30% 22.4% Language 12 100.0% 0.0% 12 13-17% 24.5%
5
ELA/Literacy 49 97.1% 2.9% Reading Literature 17 95.3% 4.7% 17 27-38% 34.7% Reading Informational Text 9 100.0% 0.0% 9 19-30% 18.4% Writing 13 96.9% 3.1% 13 26-30% 26.5% Language 10 98.0% 2.0% 10 13-17% 20.4%
6
ELA/Literacy 49 95.1% 4.9% Reading Literature 9 95.6% 4.4% 9 19-29% 18.4% Reading Informational Text 17 90.6% 9.4% 17 26-37% 34.7% Writing 14 100.0% 0.0% 14 25-29% 28.6% Language 9 95.6% 4.4% 9 13-16% 18.4%
7
ELA/Literacy 49 99.2% 0.8% Reading Literature 9 100.0% 0.0% 9 19-29% 18.4% Reading Informational Text 17 98.7% 1.3% 17 26-37% 34.7% Writing 14 98.6% 1.4% 14 25-29% 28.6% Language 9 100.0% 0.0% 9 13-16% 18.4%
8
ELA/Literacy 49 99.2% 0.8% Reading Literature 10 100.0% 0.0% 10 19-29% 20.4% Reading Informational Text 16 100.0% 0.0% 16 26-37% 32.7% Writing 14 98.6% 1.4% 14 25-29% 28.6% Language 9 97.8% 2.2% 9 13-16% 18.4%
Note. Speaking and Listening and Foundational Skills were not included in the count as neither CCSS domain was included in the eMPowerME assessment. The CCSS identified by panelists for the Essay rubric traits were not included in this review. Bolded cells indicate higher actual percentage of items than were targeted.
Criterion 3: Item DOK Distribution
Examination of this criterion involved reviewing the DOK of the items and making two comparisons. One comparison involved the distribution of DOK levels assigned by item writers to the distribution of targeted DOK levels provided in the eMPowerME 2016–17 Technical Report. The second comparison involved the assigned DOK of an item by item writers to panelists’ agreement that the DOK was correctly assigned. For the Mathematics, Reading, and Writing & Language assessments, panelists verified the DOK assigned to items by assessing whether the DOK was (1) too low, (2) matching the assigned DOK, or (3) too high. To meet this criterion, (a) at least 85% of the DOK levels per grade on the assessment had to be +/- 5% from the minimum and maximum target values and (b) panelists had to confirm 90% or more of the assigned DOK ratings. However, because they were not available, panelists identified a DOK level for the Essay assessment. They assigned an overall DOK level for the Essay assessment
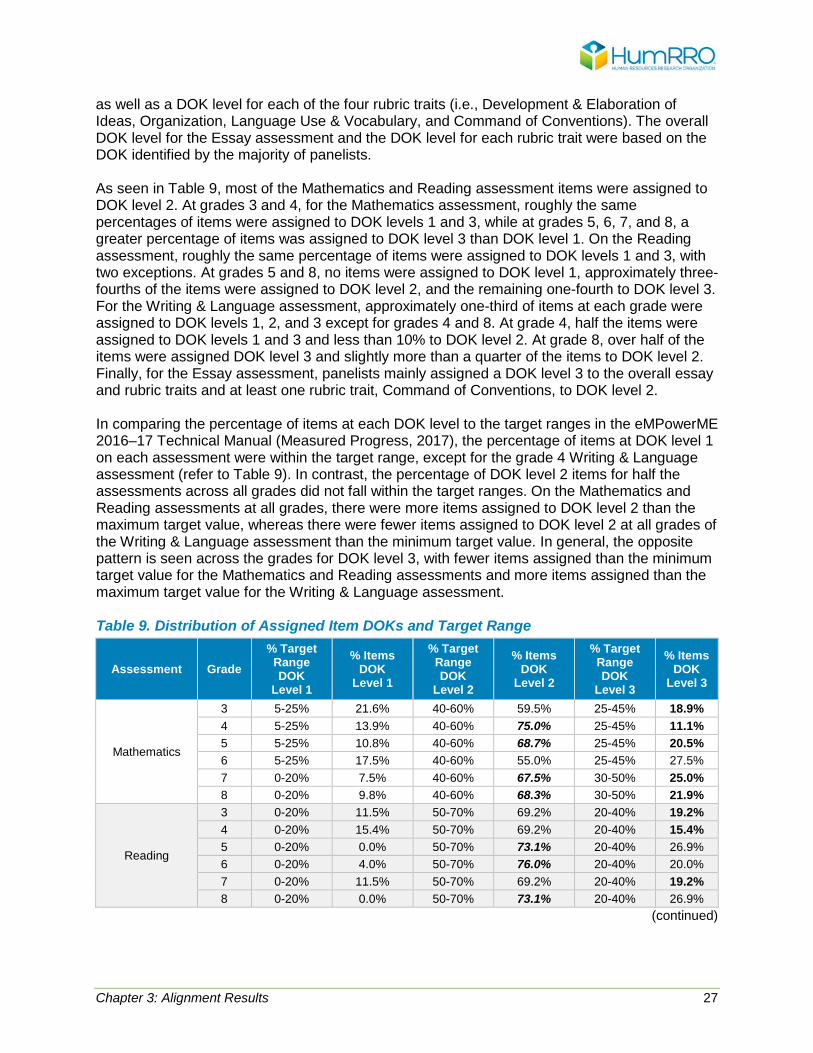
Chapter 3: Alignment Results 27
as well as a DOK level for each of the four rubric traits (i.e., Development & Elaboration of Ideas, Organization, Language Use & Vocabulary, and Command of Conventions). The overall DOK level for the Essay assessment and the DOK level for each rubric trait were based on the DOK identified by the majority of panelists. As seen in Table 9, most of the Mathematics and Reading assessment items were assigned to DOK level 2. At grades 3 and 4, for the Mathematics assessment, roughly the same percentages of items were assigned to DOK levels 1 and 3, while at grades 5, 6, 7, and 8, a greater percentage of items was assigned to DOK level 3 than DOK level 1. On the Reading assessment, roughly the same percentage of items were assigned to DOK levels 1 and 3, with two exceptions. At grades 5 and 8, no items were assigned to DOK level 1, approximately three-fourths of the items were assigned to DOK level 2, and the remaining one-fourth to DOK level 3. For the Writing & Language assessment, approximately one-third of items at each grade were assigned to DOK levels 1, 2, and 3 except for grades 4 and 8. At grade 4, half the items were assigned to DOK levels 1 and 3 and less than 10% to DOK level 2. At grade 8, over half of the items were assigned DOK level 3 and slightly more than a quarter of the items to DOK level 2. Finally, for the Essay assessment, panelists mainly assigned a DOK level 3 to the overall essay and rubric traits and at least one rubric trait, Command of Conventions, to DOK level 2. In comparing the percentage of items at each DOK level to the target ranges in the eMPowerME 2016–17 Technical Manual (Measured Progress, 2017), the percentage of items at DOK level 1 on each assessment were within the target range, except for the grade 4 Writing & Language assessment (refer to Table 9). In contrast, the percentage of DOK level 2 items for half the assessments across all grades did not fall within the target ranges. On the Mathematics and Reading assessments at all grades, there were more items assigned to DOK level 2 than the maximum target value, whereas there were fewer items assigned to DOK level 2 at all grades of the Writing & Language assessment than the minimum target value. In general, the opposite pattern is seen across the grades for DOK level 3, with fewer items assigned than the minimum target value for the Mathematics and Reading assessments and more items assigned than the maximum target value for the Writing & Language assessment. Table 9. Distribution of Assigned Item DOKs and Target Range
Assessment Grade % Target
Range DOK
Level 1
% Items DOK
Level 1
% Target Range DOK
Level 2
% Items DOK
Level 2
% Target Range DOK
Level 3
% Items DOK
Level 3
Mathematics
3 5-25% 21.6% 40-60% 59.5% 25-45% 18.9% 4 5-25% 13.9% 40-60% 75.0% 25-45% 11.1% 5 5-25% 10.8% 40-60% 68.7% 25-45% 20.5% 6 5-25% 17.5% 40-60% 55.0% 25-45% 27.5% 7 0-20% 7.5% 40-60% 67.5% 30-50% 25.0% 8 0-20% 9.8% 40-60% 68.3% 30-50% 21.9%
Reading
3 0-20% 11.5% 50-70% 69.2% 20-40% 19.2% 4 0-20% 15.4% 50-70% 69.2% 20-40% 15.4% 5 0-20% 0.0% 50-70% 73.1% 20-40% 26.9% 6 0-20% 4.0% 50-70% 76.0% 20-40% 20.0% 7 0-20% 11.5% 50-70% 69.2% 20-40% 19.2% 8 0-20% 0.0% 50-70% 73.1% 20-40% 26.9%
(continued)
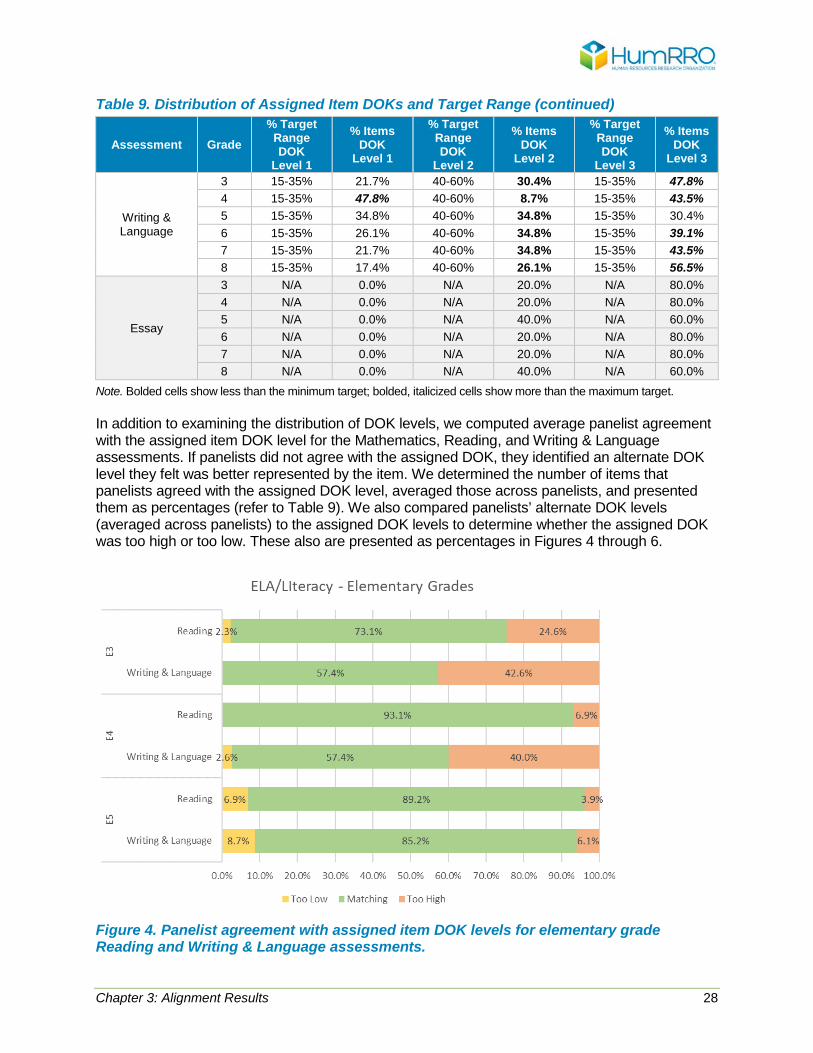
Chapter 3: Alignment Results 28
Table 9. Distribution of Assigned Item DOKs and Target Range (continued)
Assessment Grade % Target
Range DOK
Level 1
% Items DOK
Level 1
% Target Range DOK
Level 2
% Items DOK
Level 2
% Target Range DOK
Level 3
% Items DOK
Level 3
Writing & Language
3 15-35% 21.7% 40-60% 30.4% 15-35% 47.8% 4 15-35% 47.8% 40-60% 8.7% 15-35% 43.5% 5 15-35% 34.8% 40-60% 34.8% 15-35% 30.4% 6 15-35% 26.1% 40-60% 34.8% 15-35% 39.1% 7 15-35% 21.7% 40-60% 34.8% 15-35% 43.5% 8 15-35% 17.4% 40-60% 26.1% 15-35% 56.5%
Essay
3 N/A 0.0% N/A 20.0% N/A 80.0% 4 N/A 0.0% N/A 20.0% N/A 80.0% 5 N/A 0.0% N/A 40.0% N/A 60.0% 6 N/A 0.0% N/A 20.0% N/A 80.0% 7 N/A 0.0% N/A 20.0% N/A 80.0% 8 N/A 0.0% N/A 40.0% N/A 60.0%
Note. Bolded cells show less than the minimum target; bolded, italicized cells show more than the maximum target. In addition to examining the distribution of DOK levels, we computed average panelist agreement with the assigned item DOK level for the Mathematics, Reading, and Writing & Language assessments. If panelists did not agree with the assigned DOK, they identified an alternate DOK level they felt was better represented by the item. We determined the number of items that panelists agreed with the assigned DOK level, averaged those across panelists, and presented them as percentages (refer to Table 9). We also compared panelists’ alternate DOK levels (averaged across panelists) to the assigned DOK levels to determine whether the assigned DOK was too high or too low. These also are presented as percentages in Figures 4 through 6.
Figure 4. Panelist agreement with assigned item DOK levels for elementary grade Reading and Writing & Language assessments.
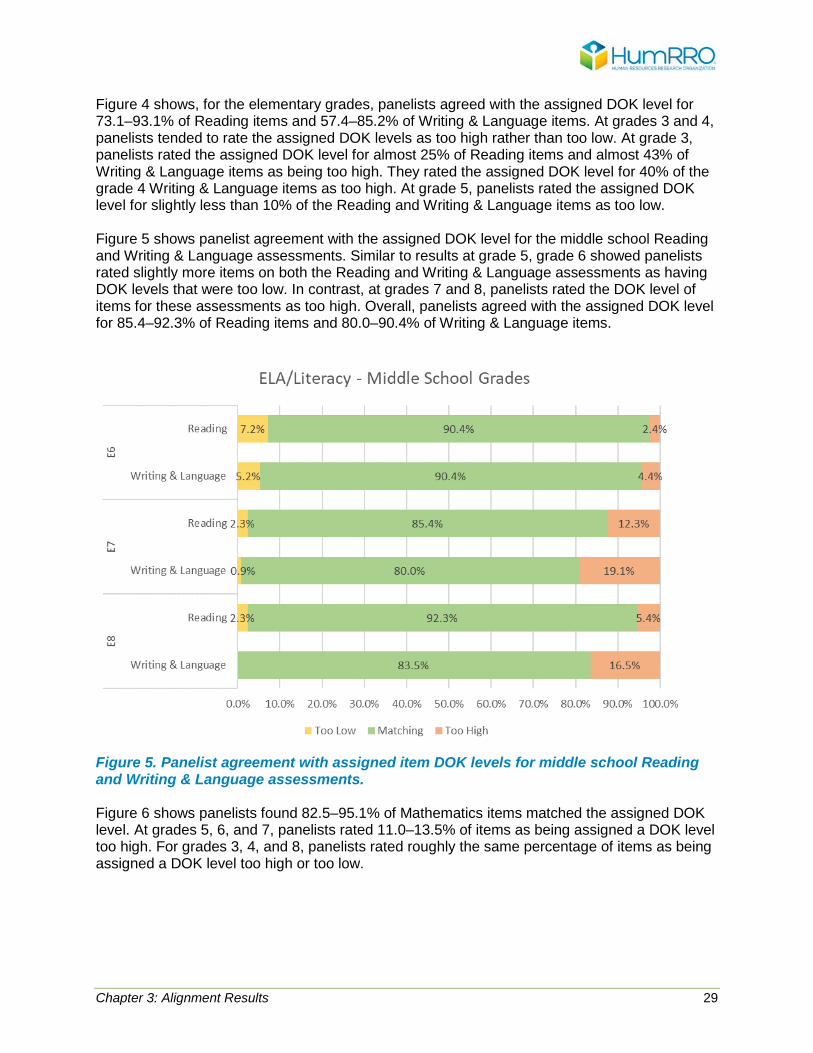
Chapter 3: Alignment Results 29
Figure 4 shows, for the elementary grades, panelists agreed with the assigned DOK level for 73.1–93.1% of Reading items and 57.4–85.2% of Writing & Language items. At grades 3 and 4, panelists tended to rate the assigned DOK levels as too high rather than too low. At grade 3, panelists rated the assigned DOK level for almost 25% of Reading items and almost 43% of Writing & Language items as being too high. They rated the assigned DOK level for 40% of the grade 4 Writing & Language items as too high. At grade 5, panelists rated the assigned DOK level for slightly less than 10% of the Reading and Writing & Language items as too low. Figure 5 shows panelist agreement with the assigned DOK level for the middle school Reading and Writing & Language assessments. Similar to results at grade 5, grade 6 showed panelists rated slightly more items on both the Reading and Writing & Language assessments as having DOK levels that were too low. In contrast, at grades 7 and 8, panelists rated the DOK level of items for these assessments as too high. Overall, panelists agreed with the assigned DOK level for 85.4–92.3% of Reading items and 80.0–90.4% of Writing & Language items.
Figure 5. Panelist agreement with assigned item DOK levels for middle school Reading and Writing & Language assessments. Figure 6 shows panelists found 82.5–95.1% of Mathematics items matched the assigned DOK level. At grades 5, 6, and 7, panelists rated 11.0–13.5% of items as being assigned a DOK level too high. For grades 3, 4, and 8, panelists rated roughly the same percentage of items as being assigned a DOK level too high or too low.
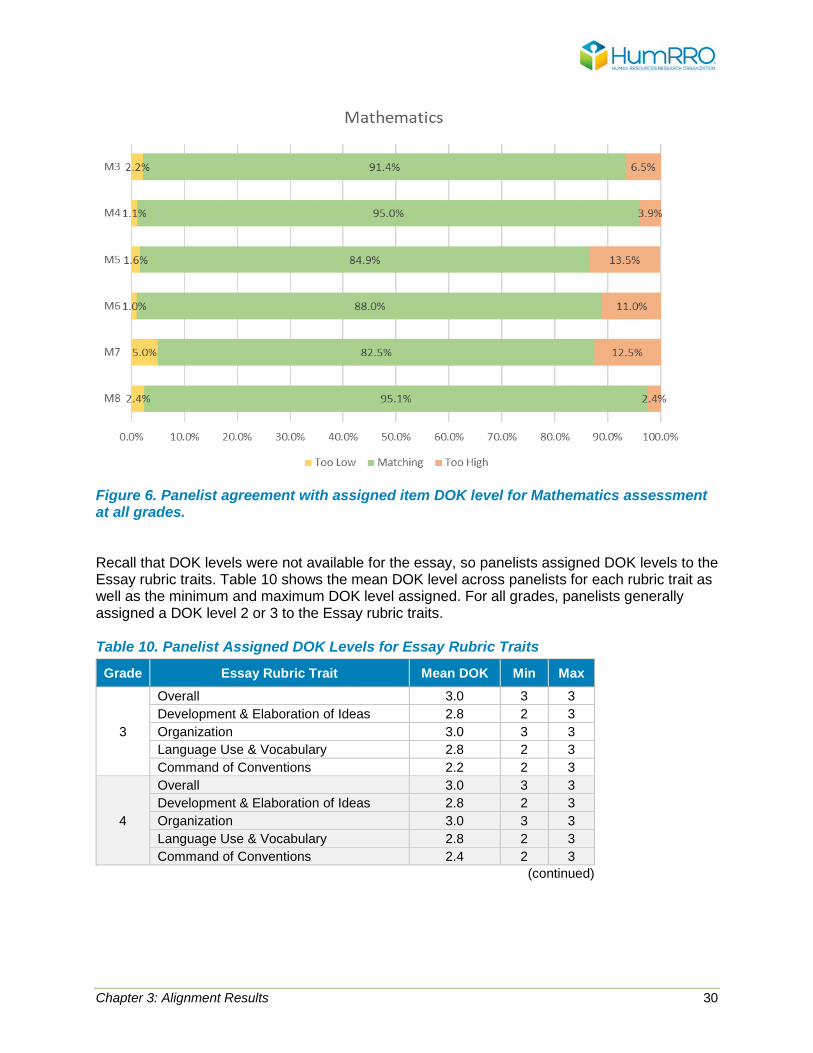
Chapter 3: Alignment Results 30
Figure 6. Panelist agreement with assigned item DOK level for Mathematics assessment at all grades. Recall that DOK levels were not available for the essay, so panelists assigned DOK levels to the Essay rubric traits. Table 10 shows the mean DOK level across panelists for each rubric trait as well as the minimum and maximum DOK level assigned. For all grades, panelists generally assigned a DOK level 2 or 3 to the Essay rubric traits. Table 10. Panelist Assigned DOK Levels for Essay Rubric Traits
Grade Essay Rubric Trait Mean DOK Min Max
3
Overall 3.0 3 3 Development & Elaboration of Ideas 2.8 2 3 Organization 3.0 3 3 Language Use & Vocabulary 2.8 2 3 Command of Conventions 2.2 2 3
4
Overall 3.0 3 3 Development & Elaboration of Ideas 2.8 2 3 Organization 3.0 3 3 Language Use & Vocabulary 2.8 2 3 Command of Conventions 2.4 2 3
(continued)
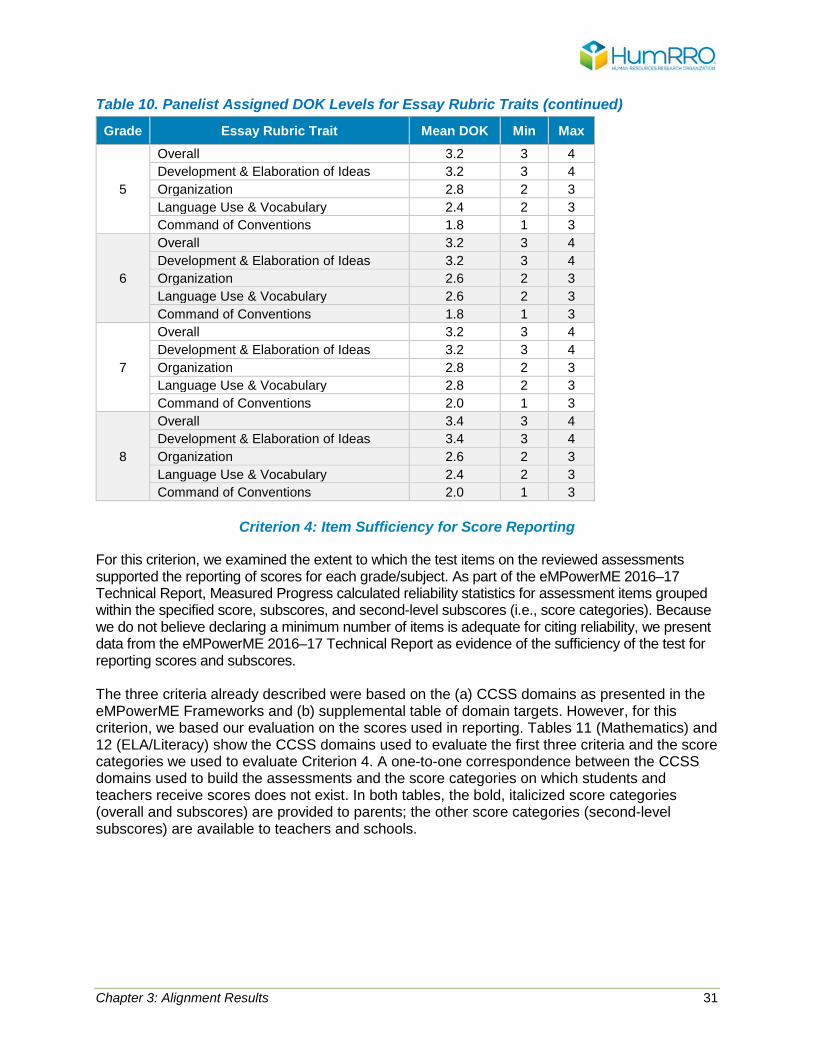
Chapter 3: Alignment Results 31
Table 10. Panelist Assigned DOK Levels for Essay Rubric Traits (continued)
Grade Essay Rubric Trait Mean DOK Min Max
5
Overall 3.2 3 4 Development & Elaboration of Ideas 3.2 3 4 Organization 2.8 2 3 Language Use & Vocabulary 2.4 2 3 Command of Conventions 1.8 1 3
6
Overall 3.2 3 4 Development & Elaboration of Ideas 3.2 3 4 Organization 2.6 2 3 Language Use & Vocabulary 2.6 2 3 Command of Conventions 1.8 1 3
7
Overall 3.2 3 4 Development & Elaboration of Ideas 3.2 3 4 Organization 2.8 2 3 Language Use & Vocabulary 2.8 2 3 Command of Conventions 2.0 1 3
8
Overall 3.4 3 4 Development & Elaboration of Ideas 3.4 3 4 Organization 2.6 2 3 Language Use & Vocabulary 2.4 2 3 Command of Conventions 2.0 1 3
Criterion 4: Item Sufficiency for Score Reporting
For this criterion, we examined the extent to which the test items on the reviewed assessments supported the reporting of scores for each grade/subject. As part of the eMPowerME 2016–17 Technical Report, Measured Progress calculated reliability statistics for assessment items grouped within the specified score, subscores, and second-level subscores (i.e., score categories). Because we do not believe declaring a minimum number of items is adequate for citing reliability, we present data from the eMPowerME 2016–17 Technical Report as evidence of the sufficiency of the test for reporting scores and subscores. The three criteria already described were based on the (a) CCSS domains as presented in the eMPowerME Frameworks and (b) supplemental table of domain targets. However, for this criterion, we based our evaluation on the scores used in reporting. Tables 11 (Mathematics) and 12 (ELA/Literacy) show the CCSS domains used to evaluate the first three criteria and the score categories we used to evaluate Criterion 4. A one-to-one correspondence between the CCSS domains used to build the assessments and the score categories on which students and teachers receive scores does not exist. In both tables, the bold, italicized score categories (overall and subscores) are provided to parents; the other score categories (second-level subscores) are available to teachers and schools.
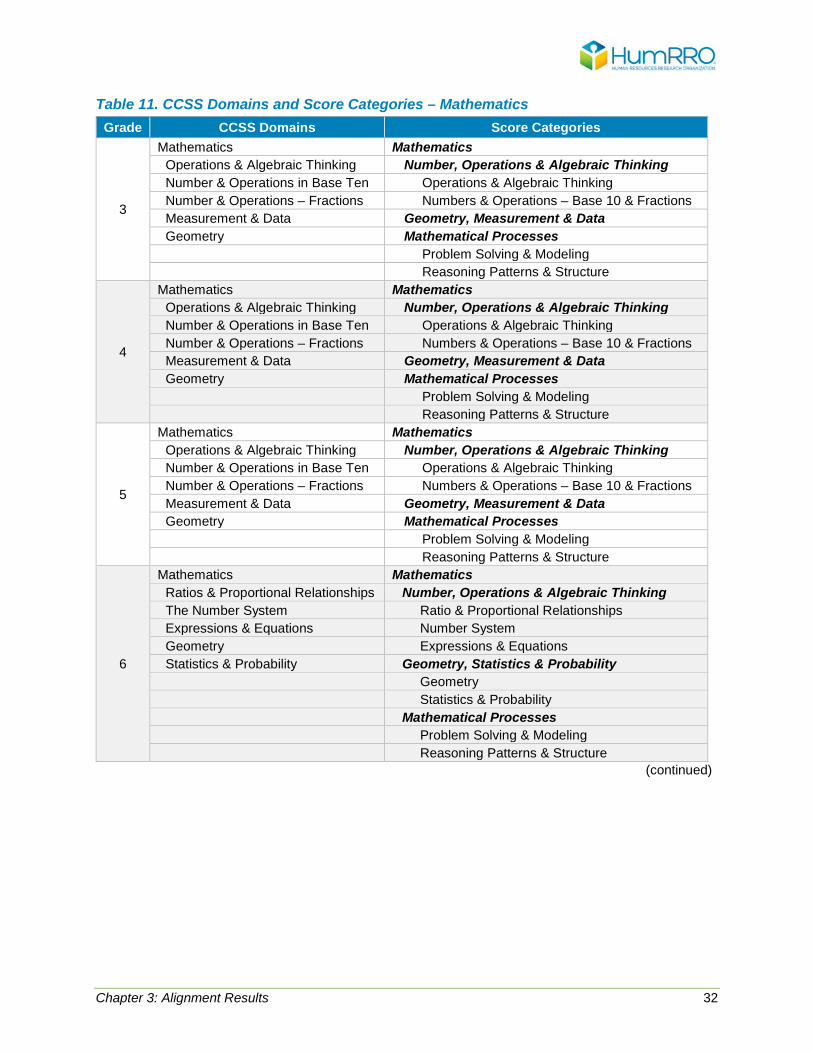
Chapter 3: Alignment Results 32
Table 11. CCSS Domains and Score Categories – Mathematics Grade CCSS Domains Score Categories
3
Mathematics Mathematics Operations & Algebraic Thinking Number, Operations & Algebraic Thinking Number & Operations in Base Ten Operations & Algebraic Thinking Number & Operations – Fractions Numbers & Operations – Base 10 & Fractions Measurement & Data Geometry, Measurement & Data Geometry Mathematical Processes
Problem Solving & Modeling Reasoning Patterns & Structure
4
Mathematics Mathematics Operations & Algebraic Thinking Number, Operations & Algebraic Thinking Number & Operations in Base Ten Operations & Algebraic Thinking Number & Operations – Fractions Numbers & Operations – Base 10 & Fractions Measurement & Data Geometry, Measurement & Data Geometry Mathematical Processes Problem Solving & Modeling Reasoning Patterns & Structure
5
Mathematics Mathematics Operations & Algebraic Thinking Number, Operations & Algebraic Thinking Number & Operations in Base Ten Operations & Algebraic Thinking Number & Operations – Fractions Numbers & Operations – Base 10 & Fractions Measurement & Data Geometry, Measurement & Data Geometry Mathematical Processes Problem Solving & Modeling Reasoning Patterns & Structure
6
Mathematics Mathematics Ratios & Proportional Relationships Number, Operations & Algebraic Thinking The Number System Ratio & Proportional Relationships Expressions & Equations Number System Geometry Expressions & Equations Statistics & Probability Geometry, Statistics & Probability Geometry Statistics & Probability Mathematical Processes Problem Solving & Modeling Reasoning Patterns & Structure
(continued)
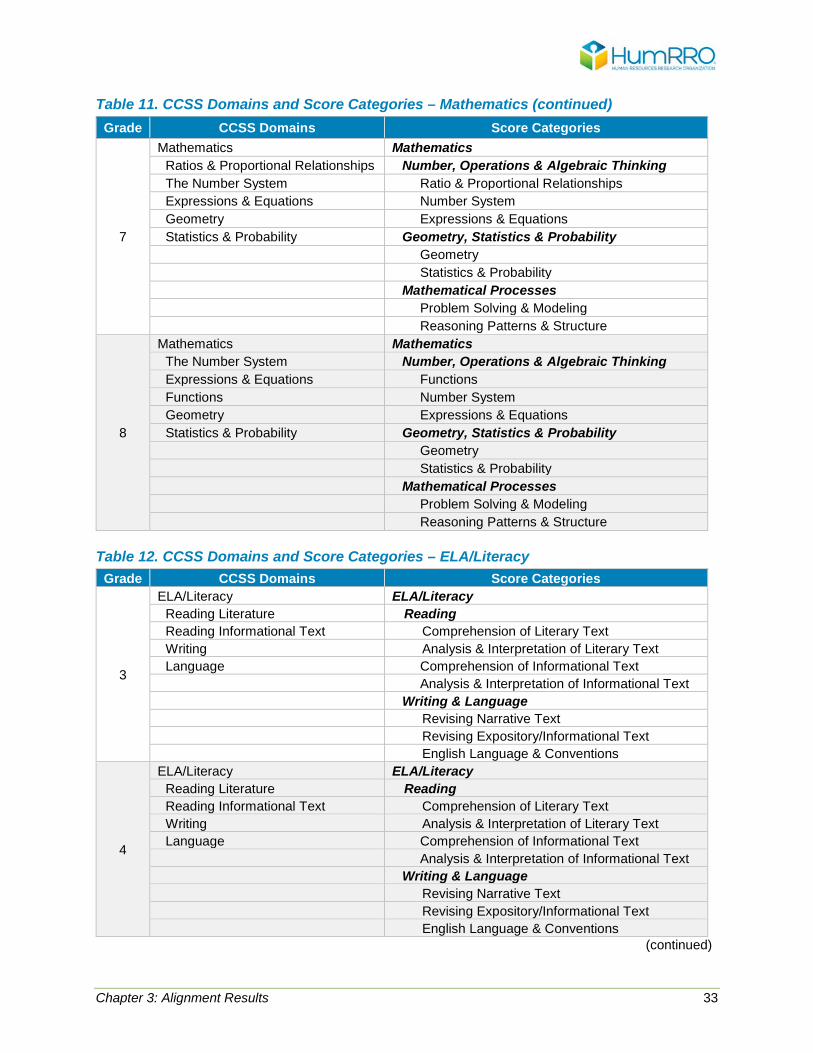
Chapter 3: Alignment Results 33
Table 11. CCSS Domains and Score Categories – Mathematics (continued) Grade CCSS Domains Score Categories
7
Mathematics Mathematics Ratios & Proportional Relationships Number, Operations & Algebraic Thinking The Number System Ratio & Proportional Relationships Expressions & Equations Number System Geometry Expressions & Equations Statistics & Probability Geometry, Statistics & Probability Geometry Statistics & Probability Mathematical Processes Problem Solving & Modeling Reasoning Patterns & Structure
8
Mathematics Mathematics The Number System Number, Operations & Algebraic Thinking Expressions & Equations Functions Functions Number System Geometry Expressions & Equations Statistics & Probability Geometry, Statistics & Probability Geometry Statistics & Probability Mathematical Processes Problem Solving & Modeling Reasoning Patterns & Structure
Table 12. CCSS Domains and Score Categories – ELA/Literacy
Grade CCSS Domains Score Categories
3
ELA/Literacy ELA/Literacy Reading Literature Reading Reading Informational Text Comprehension of Literary Text Writing Analysis & Interpretation of Literary Text Language Comprehension of Informational Text Analysis & Interpretation of Informational Text
Writing & Language Revising Narrative Text Revising Expository/Informational Text English Language & Conventions
4
ELA/Literacy ELA/Literacy Reading Literature Reading Reading Informational Text Comprehension of Literary Text Writing Analysis & Interpretation of Literary Text Language Comprehension of Informational Text Analysis & Interpretation of Informational Text Writing & Language Revising Narrative Text Revising Expository/Informational Text English Language & Conventions
(continued)
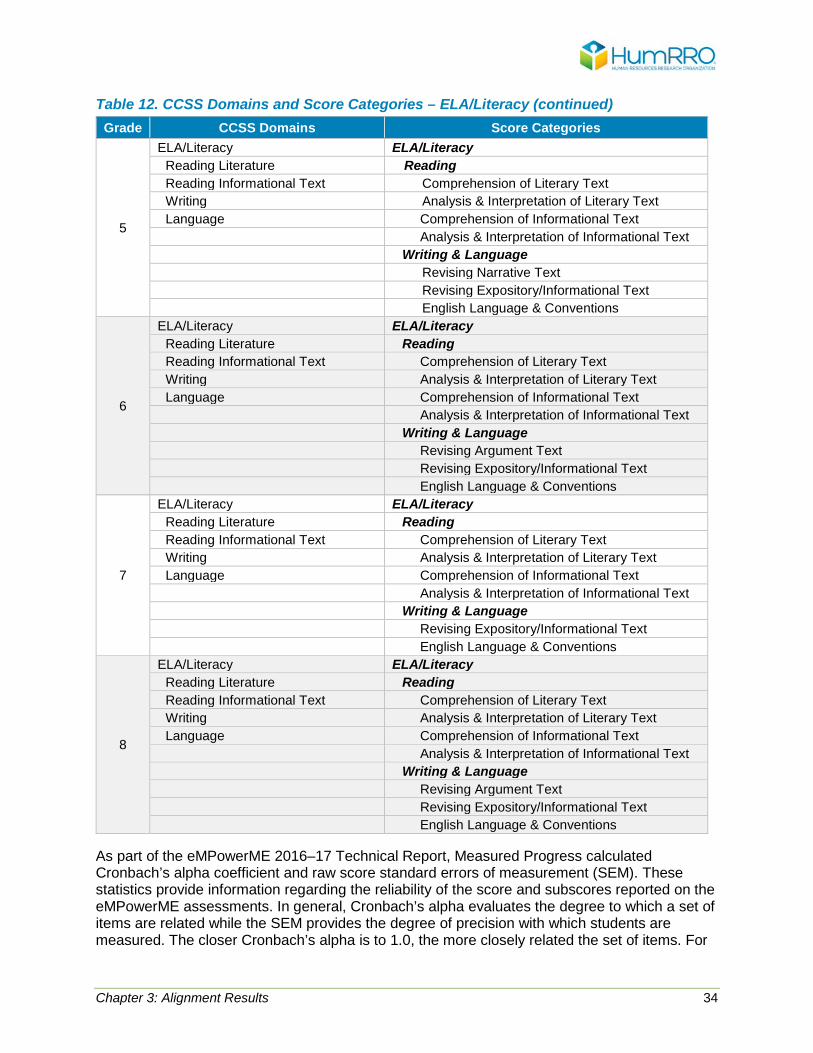
Chapter 3: Alignment Results 34
Table 12. CCSS Domains and Score Categories – ELA/Literacy (continued) Grade CCSS Domains Score Categories
5
ELA/Literacy ELA/Literacy Reading Literature Reading Reading Informational Text Comprehension of Literary Text Writing Analysis & Interpretation of Literary Text Language Comprehension of Informational Text Analysis & Interpretation of Informational Text Writing & Language Revising Narrative Text Revising Expository/Informational Text English Language & Conventions
6
ELA/Literacy ELA/Literacy Reading Literature Reading Reading Informational Text Comprehension of Literary Text Writing Analysis & Interpretation of Literary Text Language Comprehension of Informational Text Analysis & Interpretation of Informational Text Writing & Language Revising Argument Text Revising Expository/Informational Text English Language & Conventions
7
ELA/Literacy ELA/Literacy Reading Literature Reading Reading Informational Text Comprehension of Literary Text Writing Analysis & Interpretation of Literary Text Language Comprehension of Informational Text Analysis & Interpretation of Informational Text Writing & Language Revising Expository/Informational Text English Language & Conventions
8
ELA/Literacy ELA/Literacy Reading Literature Reading Reading Informational Text Comprehension of Literary Text Writing Analysis & Interpretation of Literary Text Language Comprehension of Informational Text Analysis & Interpretation of Informational Text Writing & Language Revising Argument Text Revising Expository/Informational Text English Language & Conventions
As part of the eMPowerME 2016–17 Technical Report, Measured Progress calculated Cronbach’s alpha coefficient and raw score standard errors of measurement (SEM). These statistics provide information regarding the reliability of the score and subscores reported on the eMPowerME assessments. In general, Cronbach’s alpha evaluates the degree to which a set of items are related while the SEM provides the degree of precision with which students are measured. The closer Cronbach’s alpha is to 1.0, the more closely related the set of items. For

Chapter 3: Alignment Results 35
the SEM, a smaller value provides more precision or more consistency in accurately measuring what students know and can do. To meet this criterion, (a) the overall score needed a Cronbach’s alpha greater than 0.70, (b) at least 75% of the subscores and second-level subscores per grade needed a Cronbach’s alpha greater than 0.70, and (c) across the overall score, subscores, and second-level subscores at least 85% of the SEMs needed to be less than 5.00. Table 13 presents Cronbach’s alpha and SEMs on overall scores, subscores, and second-level subscores for Mathematics. Across all grades and overall scores, Cronbach’s alpha ranged from 0.85–0.89. Across all subscores, Cronbach’s alpha was greater than 0.70 at grades 3, 5, and 7. Cronbach’s alpha for one of the three subscores fell below 0.70 for the following: grade 4 Geometry, Measurement, & Data (0.64); grades 6 and 8 Geometry, Statistics, and Probability (0.59 and 0.65, respectively). At grades 3 and 4, Cronbach’s alpha for one and three second-level subscores, respectively, fell in the 0.60s while at grade 5, Cronbach’s alpha for one second-level subscore fell in the 0.50s. Cronbach’s alpha for only one of seven second-level subscores at grades 6, 7, and 8 were greater than 0.70. At grade 6, Cronbach’s alpha for one second-level subscore fell in the 0.30s, two fell in the 0.50s, and three fell in the 0.60s. At grade 7, Cronbach’s alpha for one second-level subscore fell in the 0.40s, two fell in the 0.50s, and three fell in the 0.60s. At grade 8, Cronbach’s alpha for two second-level subscores fell in the 0.30s, three in the 0.50s, and one in the 0.60s. Some, but not all, lower values may be attributable to the lower number of items associated with the score category. Across all grades and score categories, the SEM was reasonable at less than 5.00. Table 13. Cronbach’s Alpha and SEMs by Grade and Score Category – Mathematics
Grade Score Categories No. of Students
No. of Items
Raw Score Cronbach’s Alpha SEM
Max Mean SD
3
Mathematics 12953 51 23.85 9.85 0.89 3.23 Number, Operations & Algebraic Thinking 22 26 13.86 5.54 0.82 2.35
Operations & Algebraic Thinking 11 14 7.86 3.31 0.72 1.76
Numbers & Operations-Base 10 & Fractions 11 12 6.00 2.75 0.68 1.55
Geometry, Measurement & Data 15 19 8.00 3.65 0.71 1.96
Mathematical Processes 35 37 18.79 7.06 0.86 2.66 Problem Solving & Modeling 18 19 9.32 3.76 0.74 1.90
Reasoning Patterns & Structure 17 18 9.46 3.77 0.76 1.86
4
Mathematics 13255 50 20.84 8.65 0.87 3.06 Number, Operations & Algebraic Thinking 25 30 13.37 5.52 0.80 2.45
Operations & Algebraic Thinking 9 12 4.59 2.60 0.64 1.55
Numbers & Operations-Base 10 & Fractions 16 18 8.49 3.40 0.69 1.90
(continued)
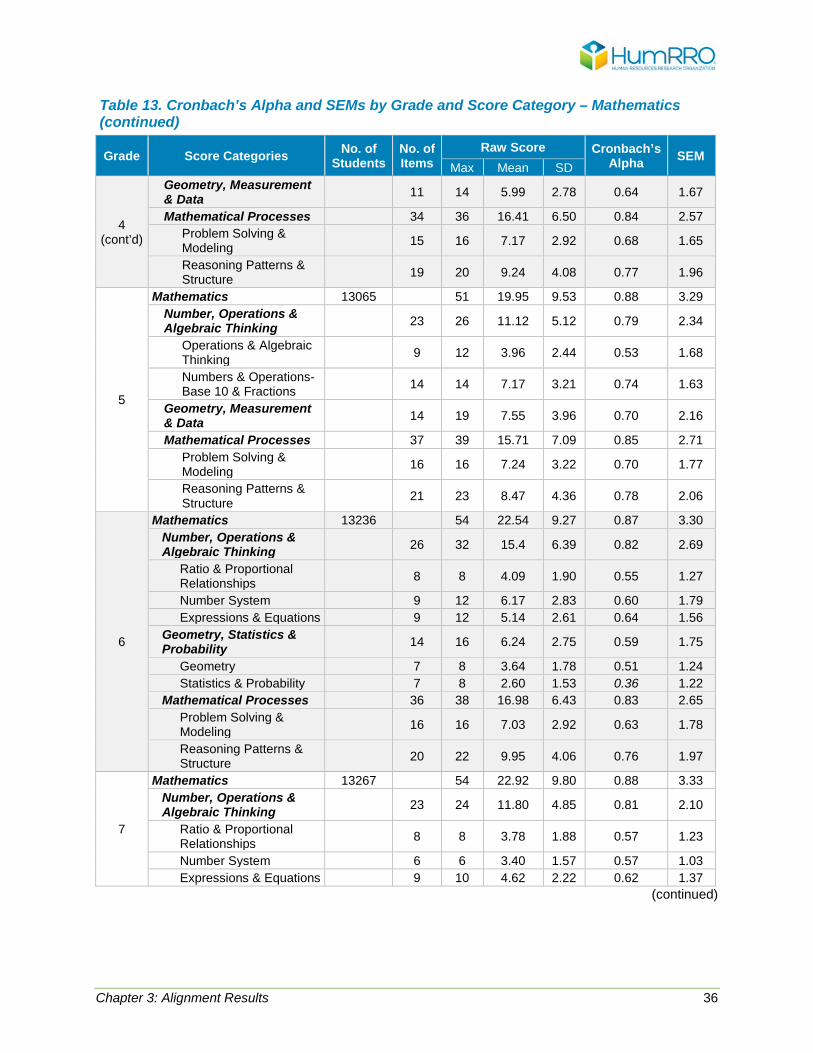
Chapter 3: Alignment Results 36
Table 13. Cronbach’s Alpha and SEMs by Grade and Score Category – Mathematics (continued)
Grade Score Categories No. of Students
No. of Items
Raw Score Cronbach’s Alpha SEM
Max Mean SD
4 (cont’d)
Geometry, Measurement & Data 11 14 5.99 2.78 0.64 1.67
Mathematical Processes 34 36 16.41 6.50 0.84 2.57 Problem Solving & Modeling 15 16 7.17 2.92 0.68 1.65
Reasoning Patterns & Structure 19 20 9.24 4.08 0.77 1.96
5
Mathematics 13065 51 19.95 9.53 0.88 3.29 Number, Operations & Algebraic Thinking 23 26 11.12 5.12 0.79 2.34
Operations & Algebraic Thinking 9 12 3.96 2.44 0.53 1.68
Numbers & Operations-Base 10 & Fractions 14 14 7.17 3.21 0.74 1.63
Geometry, Measurement & Data 14 19 7.55 3.96 0.70 2.16
Mathematical Processes 37 39 15.71 7.09 0.85 2.71 Problem Solving & Modeling 16 16 7.24 3.22 0.70 1.77
Reasoning Patterns & Structure 21 23 8.47 4.36 0.78 2.06
6
Mathematics 13236 54 22.54 9.27 0.87 3.30 Number, Operations & Algebraic Thinking 26 32 15.4 6.39 0.82 2.69
Ratio & Proportional Relationships 8 8 4.09 1.90 0.55 1.27
Number System 9 12 6.17 2.83 0.60 1.79 Expressions & Equations 9 12 5.14 2.61 0.64 1.56
Geometry, Statistics & Probability 14 16 6.24 2.75 0.59 1.75
Geometry 7 8 3.64 1.78 0.51 1.24 Statistics & Probability 7 8 2.60 1.53 0.36 1.22
Mathematical Processes 36 38 16.98 6.43 0.83 2.65 Problem Solving & Modeling 16 16 7.03 2.92 0.63 1.78
Reasoning Patterns & Structure 20 22 9.95 4.06 0.76 1.97
7
Mathematics 13267 54 22.92 9.80 0.88 3.33 Number, Operations & Algebraic Thinking 23 24 11.80 4.85 0.81 2.10
Ratio & Proportional Relationships 8 8 3.78 1.88 0.57 1.23
Number System 6 6 3.40 1.57 0.57 1.03 Expressions & Equations 9 10 4.62 2.22 0.62 1.37
(continued)
Chapter 3: Alignment Results 37
Table 13. Cronbach’s Alpha and SEMs by Grade and Score Category – Mathematics (continued)
Grade Score Categories No. of Students
No. of Items
Raw Score Cronbach’s Alpha SEM
Max Mean SD
7 (cont’d)
Geometry, Statistics & Probability 17 24 9.83 4.58 0.72 2.42
Geometry 7 10 3.12 2.09 0.48 1.51 Statistics & Probability 10 14 6.71 3.11 0.63 1.89
Mathematical Processes 40 42 19.26 7.52 0.86 2.79 Problem Solving & Modeling 16 16 8.28 3.05 0.69 1.69
Reasoning Patterns & Structure 24 26 10.99 4.95 0.80 2.22
8
Mathematics 12929 55 21.29 8.41 0.85 3.28 Number, Operations & Algebraic Thinking 23 27 11.44 4.61 0.73 2.38
Functions 9 10 4.66 2.07 0.53 1.42 Number System 4 4 1.61 1.11 0.38 0.87 Expressions & Equations 10 13 5.16 2.43 0.51 1.71
Geometry, Statistics & Probability 18 22 9.09 3.59 0.65 2.13
Geometry 9 10 3.14 1.75 0.33 1.43 Statistics & Probability 9 12 5.95 2.47 0.60 1.55
Mathematical Processes 41 43 18.43 6.30 0.80 2.82 Problem Solving & Modeling 25 27 12.32 4.35 0.75 2.17
Reasoning Patterns & Structure 16 16 6.11 2.62 0.53 1.79
Note. Bold cells indicate highest or lowest Cronbach’s alpha. Italicized cells indicate score categories with Cronbach’s alpha in 0.30s or 0.40s. Bold and italicized cell indicates lowest Cronbach’s alpha and Cronbach’s alpha in 0.30s. Table 14 presents Cronbach’s alpha and SEMs on overall scores, subscores, and second-level subscores for ELA/Literacy. Across all grades and overall scores, Cronbach’s alpha ranged from 0.89–0.91. Across all grades and subscores, Cronbach’s alpha ranged from 0.78–0.86. Across all grades, Cronbach’s alpha ranged from 0.21–0.73 for the second-level subscores. The lowest Cronbach’s alpha was seen in grade 5 (0.21). There are 13 score categories, across all grades, with a Cronbach’s alpha that fell in the 0.60s range and 10 score categories that fell in the 0.50s range. Of most concern is the 11 score categories in the 0.40s and below. Some, but not all, of the lower values may be attributable to the smaller number of items associated with the score category. Across all grades and score categories, the SEM was reasonable at less than 5.00.
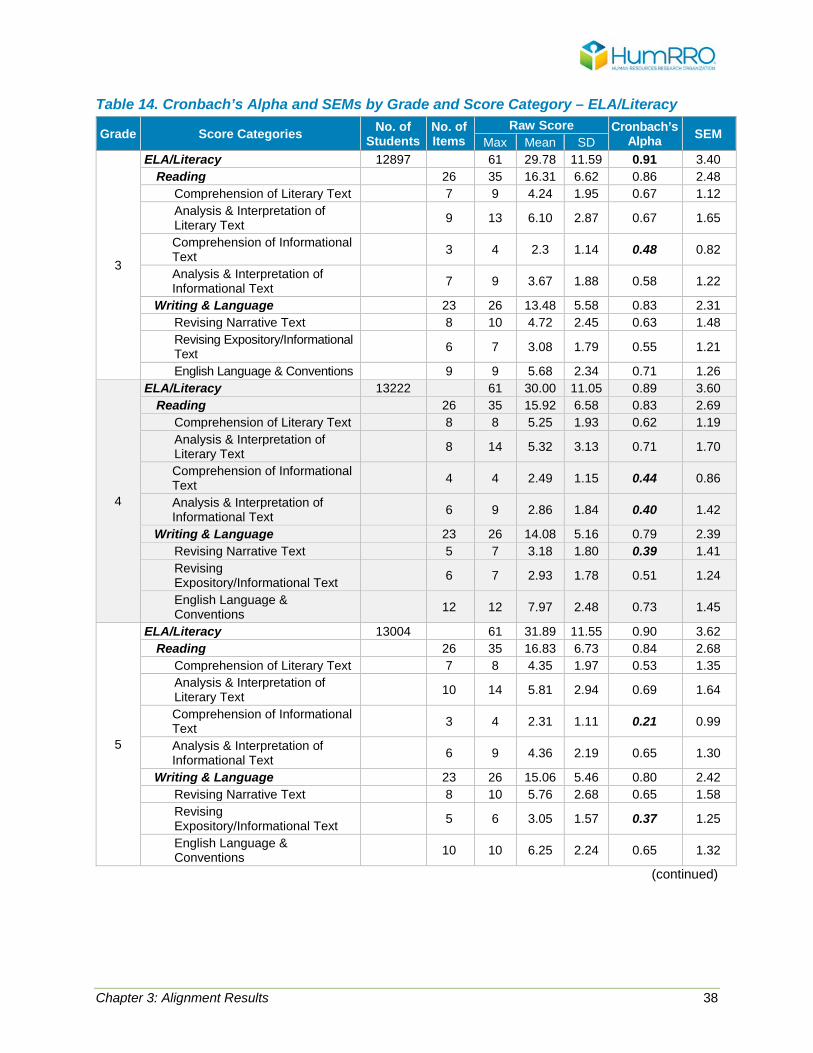
Chapter 3: Alignment Results 38
Table 14. Cronbach’s Alpha and SEMs by Grade and Score Category – ELA/Literacy
Grade Score Categories No. of Students
No. of Items
Raw Score Cronbach’s Alpha SEM Max Mean SD
3
ELA/Literacy 12897 61 29.78 11.59 0.91 3.40 Reading 26 35 16.31 6.62 0.86 2.48
Comprehension of Literary Text 7 9 4.24 1.95 0.67 1.12 Analysis & Interpretation of Literary Text 9 13 6.10 2.87 0.67 1.65
Comprehension of Informational Text 3 4 2.3 1.14 0.48 0.82
Analysis & Interpretation of Informational Text 7 9 3.67 1.88 0.58 1.22
Writing & Language 23 26 13.48 5.58 0.83 2.31 Revising Narrative Text 8 10 4.72 2.45 0.63 1.48 Revising Expository/Informational Text 6 7 3.08 1.79 0.55 1.21
English Language & Conventions 9 9 5.68 2.34 0.71 1.26
4
ELA/Literacy 13222 61 30.00 11.05 0.89 3.60 Reading 26 35 15.92 6.58 0.83 2.69
Comprehension of Literary Text 8 8 5.25 1.93 0.62 1.19 Analysis & Interpretation of Literary Text 8 14 5.32 3.13 0.71 1.70
Comprehension of Informational Text 4 4 2.49 1.15 0.44 0.86
Analysis & Interpretation of Informational Text 6 9 2.86 1.84 0.40 1.42
Writing & Language 23 26 14.08 5.16 0.79 2.39 Revising Narrative Text 5 7 3.18 1.80 0.39 1.41 Revising Expository/Informational Text 6 7 2.93 1.78 0.51 1.24
English Language & Conventions 12 12 7.97 2.48 0.73 1.45
5
ELA/Literacy 13004 61 31.89 11.55 0.90 3.62 Reading 26 35 16.83 6.73 0.84 2.68
Comprehension of Literary Text 7 8 4.35 1.97 0.53 1.35 Analysis & Interpretation of Literary Text 10 14 5.81 2.94 0.69 1.64
Comprehension of Informational Text 3 4 2.31 1.11 0.21 0.99
Analysis & Interpretation of Informational Text 6 9 4.36 2.19 0.65 1.30
Writing & Language 23 26 15.06 5.46 0.80 2.42 Revising Narrative Text 8 10 5.76 2.68 0.65 1.58 Revising Expository/Informational Text 5 6 3.05 1.57 0.37 1.25
English Language & Conventions 10 10 6.25 2.24 0.65 1.32
(continued)
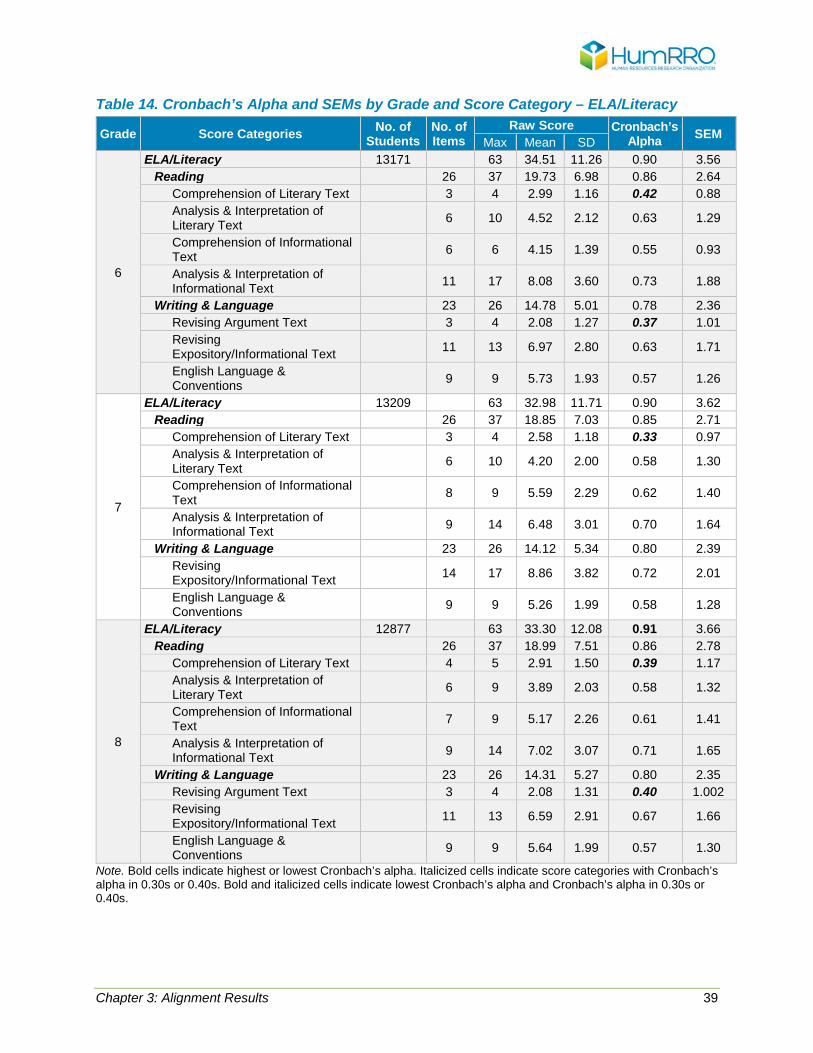
Chapter 3: Alignment Results 39
Table 14. Cronbach’s Alpha and SEMs by Grade and Score Category – ELA/Literacy
Grade Score Categories No. of Students
No. of Items
Raw Score Cronbach’s Alpha SEM Max Mean SD
6
ELA/Literacy 13171 63 34.51 11.26 0.90 3.56 Reading 26 37 19.73 6.98 0.86 2.64
Comprehension of Literary Text 3 4 2.99 1.16 0.42 0.88 Analysis & Interpretation of Literary Text 6 10 4.52 2.12 0.63 1.29
Comprehension of Informational Text 6 6 4.15 1.39 0.55 0.93
Analysis & Interpretation of Informational Text 11 17 8.08 3.60 0.73 1.88
Writing & Language 23 26 14.78 5.01 0.78 2.36 Revising Argument Text 3 4 2.08 1.27 0.37 1.01 Revising Expository/Informational Text 11 13 6.97 2.80 0.63 1.71
English Language & Conventions 9 9 5.73 1.93 0.57 1.26
7
ELA/Literacy 13209 63 32.98 11.71 0.90 3.62 Reading 26 37 18.85 7.03 0.85 2.71
Comprehension of Literary Text 3 4 2.58 1.18 0.33 0.97 Analysis & Interpretation of Literary Text 6 10 4.20 2.00 0.58 1.30
Comprehension of Informational Text 8 9 5.59 2.29 0.62 1.40
Analysis & Interpretation of Informational Text 9 14 6.48 3.01 0.70 1.64
Writing & Language 23 26 14.12 5.34 0.80 2.39 Revising Expository/Informational Text 14 17 8.86 3.82 0.72 2.01
English Language & Conventions 9 9 5.26 1.99 0.58 1.28
8
ELA/Literacy 12877 63 33.30 12.08 0.91 3.66 Reading 26 37 18.99 7.51 0.86 2.78
Comprehension of Literary Text 4 5 2.91 1.50 0.39 1.17 Analysis & Interpretation of Literary Text 6 9 3.89 2.03 0.58 1.32
Comprehension of Informational Text 7 9 5.17 2.26 0.61 1.41
Analysis & Interpretation of Informational Text 9 14 7.02 3.07 0.71 1.65
Writing & Language 23 26 14.31 5.27 0.80 2.35 Revising Argument Text 3 4 2.08 1.31 0.40 1.002 Revising Expository/Informational Text 11 13 6.59 2.91 0.67 1.66
English Language & Conventions 9 9 5.64 1.99 0.57 1.30
Note. Bold cells indicate highest or lowest Cronbach’s alpha. Italicized cells indicate score categories with Cronbach’s alpha in 0.30s or 0.40s. Bold and italicized cells indicate lowest Cronbach’s alpha and Cronbach’s alpha in 0.30s or 0.40s.
Chapter 4: Summary and Recommendations 40
Chapter 4: Summary and Recommendations
In this chapter, we summarize results of the alignment study and provide recommendations to strengthen select portions of Maine’s assessment system.
eMPowerME Alignment Summary
In this alignment study, we evaluated the eMPowerME against four criteria. The first criterion reviewed the extent to which the content was linked between the respective Mathematics and ELA/Literacy CCSS and test items. The second criterion examined the distribution of items by domain. The third criterion evaluated the distribution of assigned item DOK levels and panelists’ agreement with those assignments. Finally, the fourth criterion evaluated item sufficiency for score reporting to students, parents, and teachers. Table 15 provides summary conclusions on the alignment of the eMPowerME Mathematics, Reading, Writing & Language, and Essay assessments. We present a green highlighted box containing a ‘’ to indicate the criterion was met. We present a yellow highlighted box to indicate results fell slightly below the criterion’s threshold. Finally, we present a red highlighted box to indicate results that fell well below the criterion’s threshold.
We applied the rules associated with the four criteria outlined below to evaluate alignment of the eMPowerME and CCSS:
• Criterion 1: Content Representation - 90% or more of items per grade/subject were cumulatively rated as partially and
fully linked - 70% or more of the CCSS were assessed
• Criterion 2: Category Representation - 90% or more of items were cumulatively rated as partially and fully linked for each
CCSS domain - 85% or more of the CCSS domains per grade on the assessment were +/- 5% from
the minimum and maximum target values • Criterion 3: DOK Representation
- 85% or more of the DOK levels per domain and grade on the assessment were +/- 5% from the minimum and maximum target values
- 90% or more of the assigned DOK ratings were confirmed by panelists • Criterion 4: Item Sufficiency for Score Reporting
- The overall score had a Cronbach’s alpha greater than 0.70 - 75% or more of the subscores and second-level subscores per grade had a
Cronbach’s alpha greater than 0.70 - 85% or more of the overall score, subscores, and second-level subscores per grade
had a SEM less than 5.00
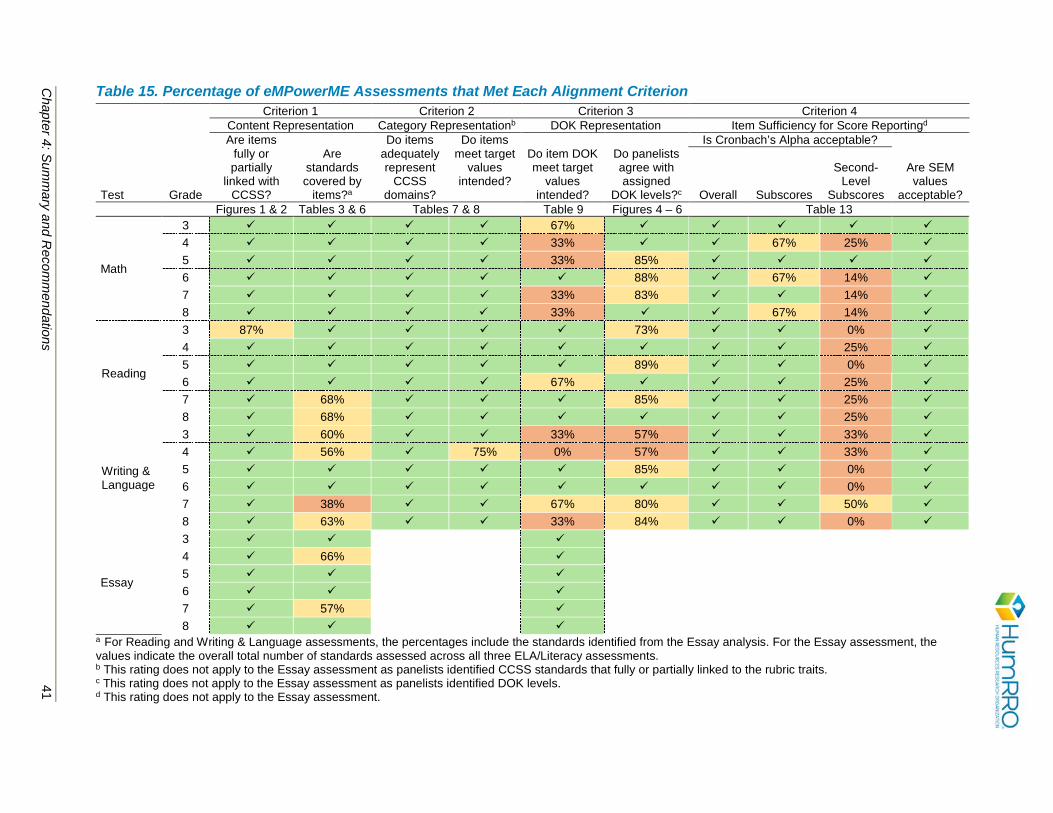
Chapter 4: S
umm
ary and Recom
mendations
41
Table 15. Percentage of eMPowerME Assessments that Met Each Alignment Criterion Criterion 1 Criterion 2 Criterion 3 Criterion 4 Content Representation Category Representationb DOK Representation Item Sufficiency for Score Reportingd
Test Grade
Are items fully or partially
linked with CCSS?
Are standards covered by
items?a
Do items adequately represent
CCSS domains?
Do items meet target
values intended?
Do item DOK meet target
values intended?
Do panelists agree with assigned
DOK levels?c
Is Cronbach’s Alpha acceptable?
Are SEM values
acceptable? Overall Subscores
Second-Level
Subscores Figures 1 & 2 Tables 3 & 6 Tables 7 & 8 Table 9 Figures 4 – 6 Table 13
Math
3 67% 4 33% 67% 25% 5 33% 85% 6 88% 67% 14% 7 33% 83% 14% 8 33% 67% 14%
Reading
3 87% 73% 0% 4 25% 5 89% 0% 6 67% 25% 7 68% 85% 25% 8 68% 25%
Writing & Language
3 60% 33% 57% 33% 4 56% 75% 0% 57% 33% 5 85% 0% 6 0% 7 38% 67% 80% 50% 8 63% 33% 84% 0%
Essay
3 4 66% 5 6 7 57% 8
a For Reading and Writing & Language assessments, the percentages include the standards identified from the Essay analysis. For the Essay assessment, the values indicate the overall total number of standards assessed across all three ELA/Literacy assessments. b This rating does not apply to the Essay assessment as panelists identified CCSS standards that fully or partially linked to the rubric traits. c This rating does not apply to the Essay assessment as panelists identified DOK levels. d This rating does not apply to the Essay assessment.
Chapter 4: Summary and Recommendations 42
Criterion 1: Items Represent Intended Content
To examine the first criterion, panelists evaluated the alignment of each item to its assigned standard. Our analyses showed the following:
• Panelists rated more than 90% of the items as either partially or fully linked to the assigned CCSS for all grade/subjects, with one exception.
o Panelists cumulatively rated 87% of the grade 3 Reading assessment items as partially and fully linked, which falls just below the 90% criterion threshold of acceptability.
• On the Mathematics assessment, all grades assessed more than 70% of the CCSS identified in the eMPowerME Frameworks.
• Across the Reading, Writing & Language, and Essay assessments, more than 70% of the ELA/Literacy standards were assessed at grades 3, 5, and 8; 66% of the standards were assessed at grade 4; and 57% of the standards were assessed at grade 7.
• Including the Essay assessment in the eMPowerME enhanced the coverage of ELA/Literacy CCSS.
o Across all grades, panelists identified four additional Reading Informational Text standards, 16 additional Writing standards, and 11 additional Language standards that were not already assessed in the Reading and Writing & Language assessments.
Criterion 2: Items Represent Intended Categories
The second criterion focused on whether the distribution of items by CCSS domain holds true to the table of domain targets. When comparing the percentage of items per domain to that of the target item range, all grades and subjects, with one exception, showed less than a 5% difference. In other words, the distribution of items by domain was consistent with the domain targets. The exception was at grade 4, where one Writing & Language domain had a greater than 5% difference between the maximum target range specified in the table of domain targets and the actual percentage of assessment items classified as partially and fully linked by panelists. Criterion 3: Item DOK Distribution
To ensure the overall assessment measures an adequate range of DOKs, this criterion examined the DOK level, assigned by item writers, to the items in comparison to the target DOK ranges in the eMPowerME 2016–17 Technical Report. There were four possible DOK levels, but no items were assigned a DOK level 4, nor did we expect any DOK level 4 items on any of the assessments. Overall, the results tended to show a lack of correspondence between target (i.e., DOK ranges in the eMPowerME 2016-17 Technical Report) and actual (i.e., percentage of items at each DOK level on the assessment) DOK ranges. Specifically, our analyses found the following:
• In Mathematics o Grade 6: the percentage of items matched the target DOK ranges within +/- 5%. o Grade 3: the percentage of items matched the target DOK range within +/- 5% for
DOK levels 1 and 2 but contained 6% fewer items at DOK level 3 than the target DOK minimum.
Chapter 4: Summary and Recommendations 43
o Grades 4, 5, 7, and 8: the percentage of items matched the target DOK range within +/- 5% for DOK level 1 but contained between 8–15% more items at DOK level 2 and between 5–14% fewer items at DOK level 3 than the target DOK minimum and maximum values.
• For the Reading assessment o Grades 3, 4, 5, 7, and 8: the percentage of items matched the target DOK ranges
within +/- 5%. o Grade 6: the percentage of items at DOK levels 1 and 3 matched the target DOK
range within +/- 5% but contained 6% more items at DOK level 2 than the target DOK maximum.
• For the Writing & Language assessment o Grades 5 and 6: the percentage of items matched the target DOK ranges within
+/- 5%. o Grade 7: the percentage of items at DOK levels 1 and 2 matched the target DOK
range within +/- 5% but contained 9% more items at DOK level 3 than the target DOK maximum.
o Grades 3 and 8: the percentage of items matched the target DOK range within +/- 5% at DOK level 1 but between 10–14% fewer items at DOK level 2 and between 13–22% more items at DOK level 3 than the DOK minimum and maximum values.
o Grade 4: the percentage of items did not match the target DOK ranges within +/- 5% but had 13% more items at DOK level 1, 31% fewer items at DOK level 2, and 9% fewer items at DOK level 3 than the DOK minimum and maximum values.
While the above analysis took the DOK levels assigned by item writers as a given, we also evaluated the extent to which panelists agreed with the assigned item DOK level. Our analyses showed:
• On the Mathematics assessment at grades 5, 6, and 7, panelists agreed with less than 90% of the assigned item DOK levels. When there was disagreement, in general, panelists indicated the assigned item DOK level was too high.
• For the Reading assessment at grades 4, 6, and 7, panelists agreed with at least 90% of the item DOK levels while they agreed less at the other grades (grade 3, 73.1%; grade 5, 89.2%; grade 7, 85.4%).
• Panelists disagreed most with the Writing & Language assigned item DOK levels. o The 90% agreement threshold was met only for grade 6 (90.4%). o Panelists agreed with 80–85% of the assigned item DOK levels at grades 5
(85.2%), 7 (80.0%), and 8 (83.5%). o Panelists agreed with only 57.4% of the assigned item DOK levels at grades 3
and 4.6 6 It is important to note that panelists in grades 3 and 4 requested clarification regarding DOK level interpretations on several occasions. Panelists indicated that their previous training in DOK was inconsistent with DOK reference sheet information provided for the alignment study. Additionally, lack of specific DOK guidance for writing and language items, including the essay, led to requests for clarification from the content expert.
Chapter 4: Summary and Recommendations 44
• Across the Reading and Writing & Language assessments for grades 3, 4, 7, and 8, panelists typically rated the assigned item DOK levels as being too high. In contrast, panelists’ ratings of the assigned item DOK levels at grades 5 and 6 were approximately the same (i.e., similar percentage of assigned item DOK levels that were too low and a similar percentage of assigned item DOK levels that were too high).
Criterion 4: Item Sufficiency for Score Reporting
Finally, we examined item sufficiency for reporting of an overall score, subscores, and second-level subscores to ensure the scores delivered to students, parents, and teachers reflect what a student knows and can do, based on the set of assessment items administered. As part of the eMPowerME 2016–17 Technical Report, Measured Progress calculated Cronbach’s alpha and raw score standard errors of measurement (SEM). We reviewed these statistics and made the following conclusions:
• The overall score, subscores, and second-level subscores at all grades and assessments have reasonable SEM values.
• Cronbach’s alpha for all overall scores were greater than 0.70; therefore, judged to be acceptable
• In Mathematics o Cronbach’s alpha for all subscores except at grades 4, 6, and 8 were greater
than 0.70. At grades 4, 6, and 8, Cronbach’s alpha was 0.64, 0.59, and 0.65, respectively, for one of the subscore categories.
o At grades 3 and 5, Cronbach’s alpha was greater than 0.70 for at least 75% of the second-level subscores. For grades 4, 6, 7, and 8, Cronbach’s alpha was greater than 0.70 for only one second-level subscore, with alphas ranging from 0.33–0.80.
• In Reading and Writing & Language o Cronbach’s alpha for all subscores were greater than 0.70. o Less than 75% of the second-level subscores across all grades had a
Cronbach’s alpha greater than 0.70, with alphas ranging from 0.21–0.73. o Grades 3 and 5 in Reading and grades 5, 6, and 8 in Writing & Language did not
have any second-level subscores with Cronbach’s alpha greater than 0.70. Because reliability generally increases when an assessment includes more items, it is not surprising that there are reliability issues especially with the second-level subscores. Indeed, most assessment subscores and second-level subscores were based on fewer than 15 items, which may present problems for accurately reporting subscores and second-level subscores no matter how high the quality of the items might be.
Recommendations
Overall, the eMPowerME alignment results were generally favorable at the item level. There were also areas where improvements could be implemented to enhance the Mathematics and ELA/Literacy assessments. Based on findings of the present study, we offer the following recommendations:
Chapter 4: Summary and Recommendations 45
• eMPowerME Frameworks should include target percentages for domain representation and DOK levels for the Maine DOE to use as a reference. To ensure the eMPowerME assesses students on standards the Maine DOE considers of greatest importance for students to know and master at the end of each grade, the eMPowerME Frameworks should outline the proportion of items to assess each domain. This information is essential for the Maine DOE to determine the extent to which each eMPowerME assessment includes a sufficient distribution of items among domains, and student results are interpreted accurately and used as intended.
• Evaluate the standards being covered by items to ensure that an adequate percentage of standards is assessed. Target ranges of items per domain can lead to erroneous assumptions that all or the majority of standards associated within a domain are represented on an assessment. This inaccurate assumption was detected when evaluating Criteria 1 and 2 results. Based on results associated with Criterion 1, the Reading and Writing & Language assessments at several grades do not include at least 70% of the standards reflecting a restriction of skills evaluated by the assessment. In contrast, results associated with Criterion 2 showed that the percentage of items per domain matched the target percentage of items per domain except for grade 4 Writing & Language. Even though the percentage of items at the domain level met target ranges, the results indicate the breadth of standards covered by the items within a domain could be better. We recommend Maine DOE evaluate all grade/subject assessments that had less than 70% of the standards assessed to identify standards that should be assessed by items, especially the grade 7 Writing & Language assessment. Alternatively, Measured Progress could provide target ranges not only at the domain level but also the standard level.
• Evaluate the distribution of DOK levels for all eMPowerME assessment items. For most grade/subject assessments, more than a 5% difference between actual and target DOK was seen at multiple DOK levels. Therefore, we recommend Maine DOE more closely scrutinize item DOK level to target match during form construction.
• Evaluate DOK levels assigned to items on all eMPowerME assessments. There were numerous grades where panelists agreed with less than 90% of the assigned DOKs, especially in the grades 3 and 4 Writing & Language assessment. In general, panelists rated the assigned item DOK levels as too high. Therefore, we recommend that Maine DOE seek clarification regarding DOK level descriptors used by Measured Progress to ensure common understanding and consistent application by item writers, DOE content specialists, and item review committee members moving forward. Additionally, the DOK level assigned to items where panelists disagreed with assigned DOK should be reviewed to ensure the most appropriate DOK level is identified.
• Review communication to teachers and parents regarding what subscores mean. Except for the grades 3 and 5 Mathematics assessments, all other grade/subject assessments provided subscores with less than acceptable levels of internal consistency to support critical decisions. Teachers and parents want to know, and should obtain from the assessments, as much information as possible about what students know and can do. We recommend that Maine DOE provide clear communication regarding the need to exercise caution in interpreting subscore (and especially second-level subscore) results. High-stakes decisions should be based on total test scores which are considerably more reliable. Subscore data can provide insight about curricular or instructional strengths and weaknesses, but this should be considered in the context of additional information available to the classroom teacher.
References 46
References
Measured Progress (2017). eMPowerME Assessment ELA/Literacy & Mathematics: 2016–17 Technical Report. Dover: Measured Progress.
Webb, N. L. (1997). Criteria for alignment of expectations and assessments in Mathematics and Mathematics education (Research Monograph No. 6). Washington, DC: Council of Chief State Schools Officers.
Webb, N. L. (1999). Alignment of Mathematics and Mathematics standards and assessments in four states (Research Monograph 18). Madison, WI: National Institute for Mathematics Education and Council of Chief State School Officers. (ERIC Document Reproduction Service No. ED440852).
Webb, N. L. (2005). Webb alignment tool: Training manual. Madison, WI: Wisconsin Center for Education Research. Available: http://www.wcer.wisc.edu/WAT/index.aspx.
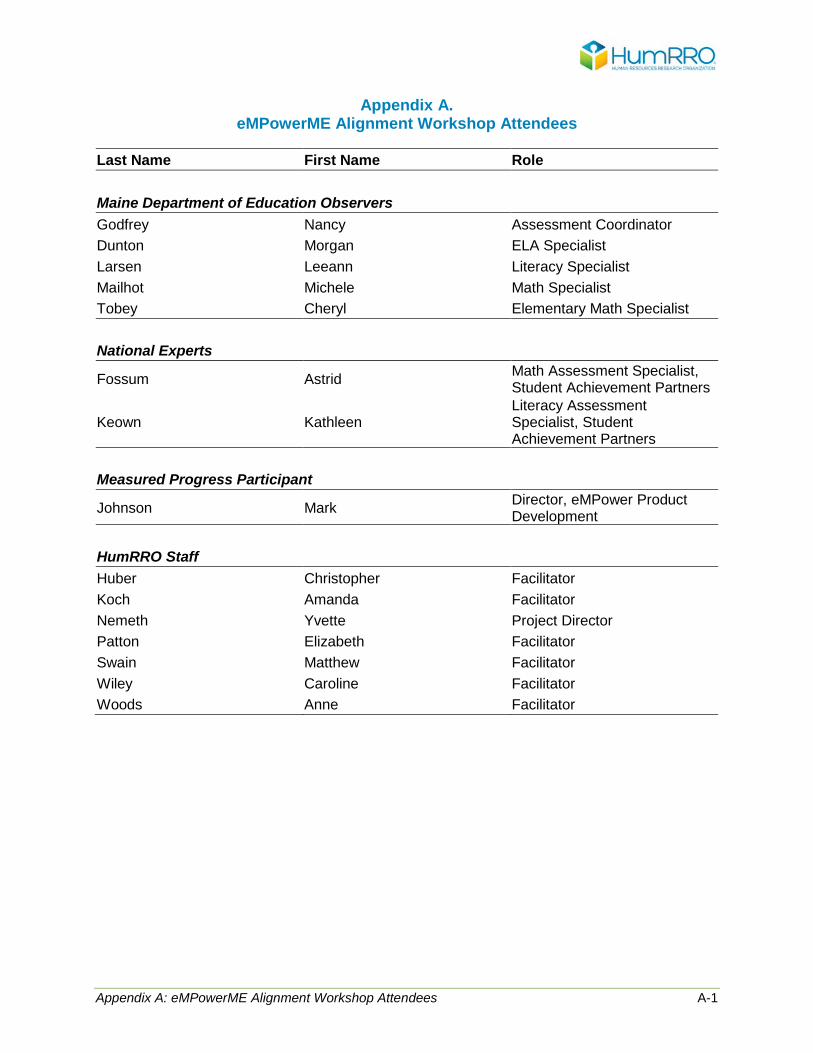
Appendix A: eMPowerME Alignment Workshop Attendees A-1
Appendix A. eMPowerME Alignment Workshop Attendees
Last Name First Name Role Maine Department of Education Observers Godfrey Nancy Assessment Coordinator Dunton Morgan ELA Specialist Larsen Leeann Literacy Specialist Mailhot Michele Math Specialist Tobey Cheryl Elementary Math Specialist
National Experts
Fossum Astrid Math Assessment Specialist, Student Achievement Partners
Keown Kathleen Literacy Assessment Specialist, Student Achievement Partners
Measured Progress Participant
Johnson Mark Director, eMPower Product Development
HumRRO Staff Huber Christopher Facilitator Koch Amanda Facilitator Nemeth Yvette Project Director Patton Elizabeth Facilitator Swain Matthew Facilitator Wiley Caroline Facilitator Woods Anne Facilitator
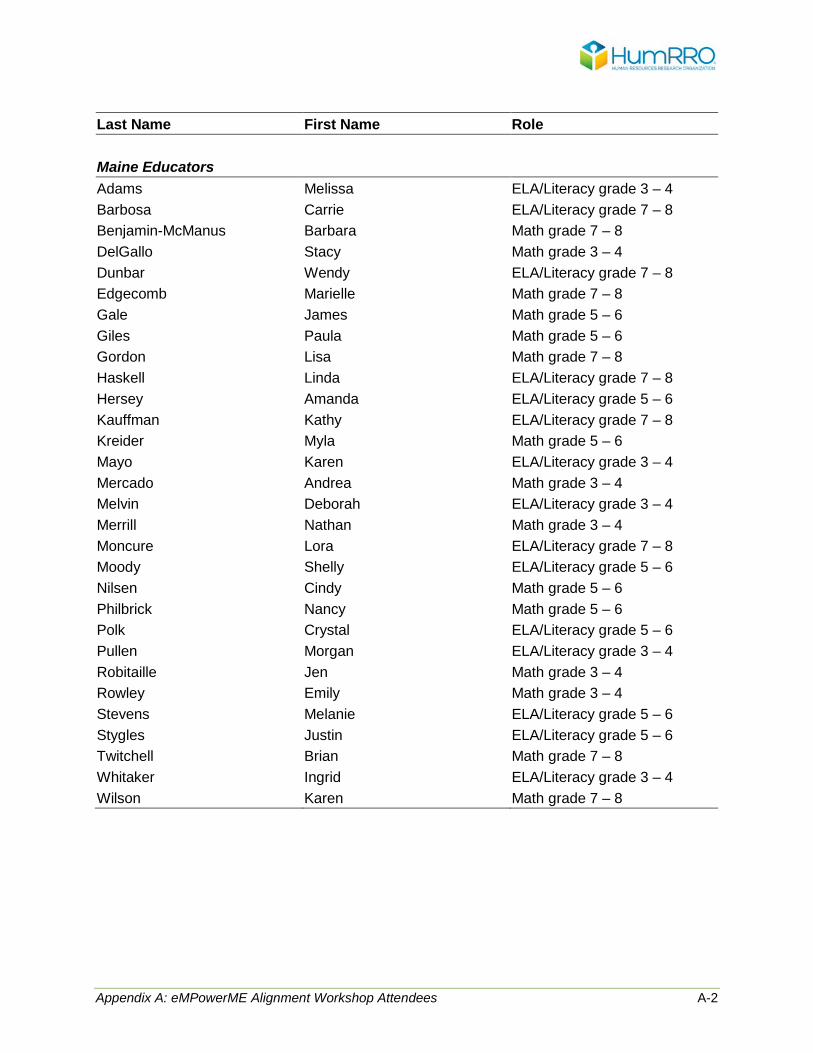
Appendix A: eMPowerME Alignment Workshop Attendees A-2
Last Name First Name Role Maine Educators Adams Melissa ELA/Literacy grade 3 – 4 Barbosa Carrie ELA/Literacy grade 7 – 8 Benjamin-McManus Barbara Math grade 7 – 8 DelGallo Stacy Math grade 3 – 4 Dunbar Wendy ELA/Literacy grade 7 – 8 Edgecomb Marielle Math grade 7 – 8 Gale James Math grade 5 – 6 Giles Paula Math grade 5 – 6 Gordon Lisa Math grade 7 – 8 Haskell Linda ELA/Literacy grade 7 – 8 Hersey Amanda ELA/Literacy grade 5 – 6 Kauffman Kathy ELA/Literacy grade 7 – 8 Kreider Myla Math grade 5 – 6 Mayo Karen ELA/Literacy grade 3 – 4 Mercado Andrea Math grade 3 – 4 Melvin Deborah ELA/Literacy grade 3 – 4 Merrill Nathan Math grade 3 – 4 Moncure Lora ELA/Literacy grade 7 – 8 Moody Shelly ELA/Literacy grade 5 – 6 Nilsen Cindy Math grade 5 – 6 Philbrick Nancy Math grade 5 – 6 Polk Crystal ELA/Literacy grade 5 – 6 Pullen Morgan ELA/Literacy grade 3 – 4 Robitaille Jen Math grade 3 – 4 Rowley Emily Math grade 3 – 4 Stevens Melanie ELA/Literacy grade 5 – 6 Stygles Justin ELA/Literacy grade 5 – 6 Twitchell Brian Math grade 7 – 8 Whitaker Ingrid ELA/Literacy grade 3 – 4 Wilson Karen Math grade 7 – 8
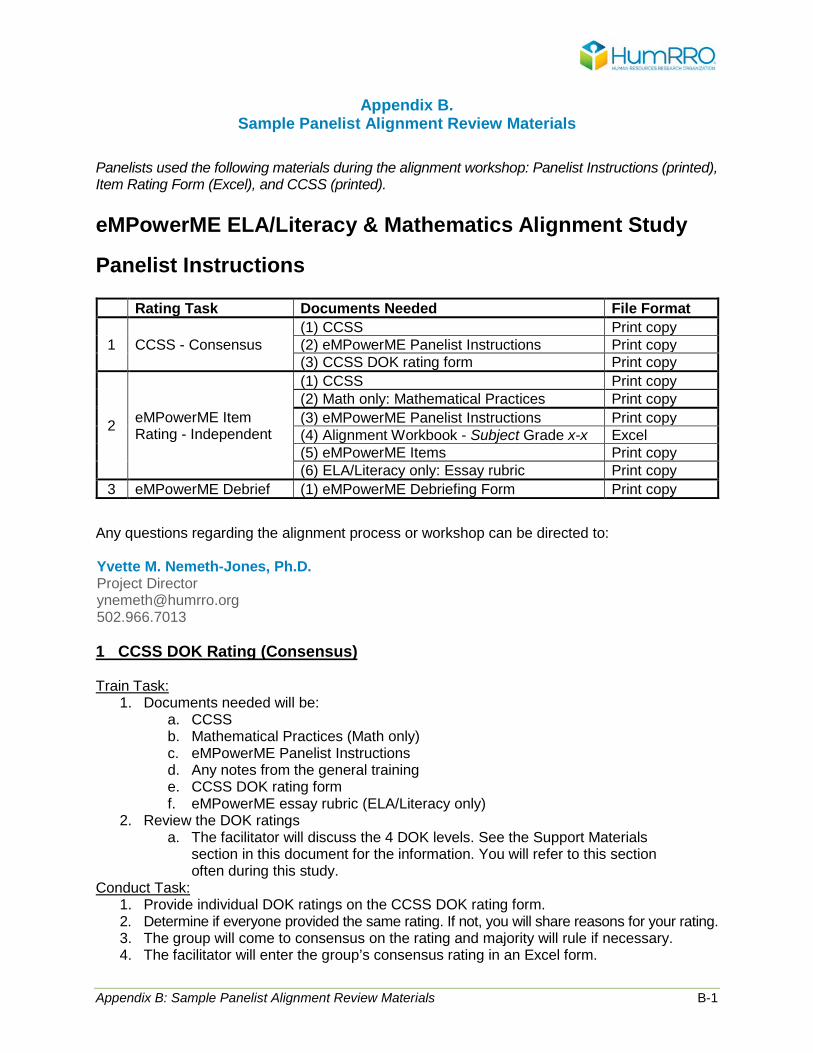
Appendix B: Sample Panelist Alignment Review Materials B-1
Appendix B. Sample Panelist Alignment Review Materials
Panelists used the following materials during the alignment workshop: Panelist Instructions (printed), Item Rating Form (Excel), and CCSS (printed). eMPowerME ELA/Literacy & Mathematics Alignment Study
Panelist Instructions
Rating Task Documents Needed File Format
1 CCSS - Consensus (1) CCSS Print copy (2) eMPowerME Panelist Instructions Print copy (3) CCSS DOK rating form Print copy
2 eMPowerME Item Rating - Independent
(1) CCSS Print copy (2) Math only: Mathematical Practices Print copy (3) eMPowerME Panelist Instructions Print copy (4) Alignment Workbook - Subject Grade x-x Excel (5) eMPowerME Items Print copy (6) ELA/Literacy only: Essay rubric Print copy
3 eMPowerME Debrief (1) eMPowerME Debriefing Form Print copy Any questions regarding the alignment process or workshop can be directed to: Yvette M. Nemeth-Jones, Ph.D. Project Director [email protected] 502.966.7013 1 CCSS DOK Rating (Consensus) Train Task:
1. Documents needed will be: a. CCSS b. Mathematical Practices (Math only) c. eMPowerME Panelist Instructions d. Any notes from the general training e. CCSS DOK rating form f. eMPowerME essay rubric (ELA/Literacy only)
2. Review the DOK ratings a. The facilitator will discuss the 4 DOK levels. See the Support Materials
section in this document for the information. You will refer to this section often during this study.
Conduct Task: 1. Provide individual DOK ratings on the CCSS DOK rating form. 2. Determine if everyone provided the same rating. If not, you will share reasons for your rating. 3. The group will come to consensus on the rating and majority will rule if necessary. 4. The facilitator will enter the group’s consensus rating in an Excel form.
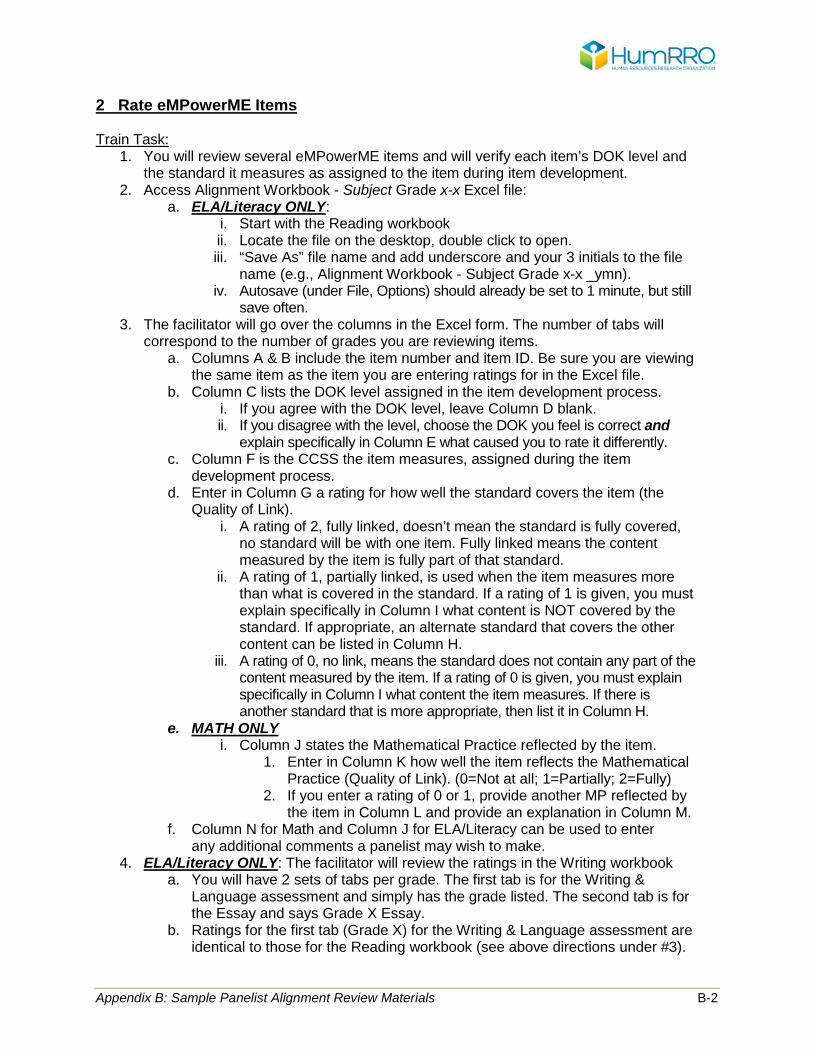
Appendix B: Sample Panelist Alignment Review Materials B-2
2 Rate eMPowerME Items Train Task:
1. You will review several eMPowerME items and will verify each item’s DOK level and the standard it measures as assigned to the item during item development.
2. Access Alignment Workbook - Subject Grade x-x Excel file: a. ELA/Literacy ONLY:
i. Start with the Reading workbook ii. Locate the file on the desktop, double click to open. iii. “Save As” file name and add underscore and your 3 initials to the file
name (e.g., Alignment Workbook - Subject Grade x-x _ymn). iv. Autosave (under File, Options) should already be set to 1 minute, but still
save often. 3. The facilitator will go over the columns in the Excel form. The number of tabs will
correspond to the number of grades you are reviewing items. a. Columns A & B include the item number and item ID. Be sure you are viewing
the same item as the item you are entering ratings for in the Excel file. b. Column C lists the DOK level assigned in the item development process.
i. If you agree with the DOK level, leave Column D blank. ii. If you disagree with the level, choose the DOK you feel is correct and
explain specifically in Column E what caused you to rate it differently. c. Column F is the CCSS the item measures, assigned during the item
development process. d. Enter in Column G a rating for how well the standard covers the item (the
Quality of Link). i. A rating of 2, fully linked, doesn’t mean the standard is fully covered,
no standard will be with one item. Fully linked means the content measured by the item is fully part of that standard.
ii. A rating of 1, partially linked, is used when the item measures more than what is covered in the standard. If a rating of 1 is given, you must explain specifically in Column I what content is NOT covered by the standard. If appropriate, an alternate standard that covers the other content can be listed in Column H.
iii. A rating of 0, no link, means the standard does not contain any part of the content measured by the item. If a rating of 0 is given, you must explain specifically in Column I what content the item measures. If there is another standard that is more appropriate, then list it in Column H.
e. MATH ONLY i. Column J states the Mathematical Practice reflected by the item.
1. Enter in Column K how well the item reflects the Mathematical Practice (Quality of Link). (0=Not at all; 1=Partially; 2=Fully)
2. If you enter a rating of 0 or 1, provide another MP reflected by the item in Column L and provide an explanation in Column M.
f. Column N for Math and Column J for ELA/Literacy can be used to enter any additional comments a panelist may wish to make.
4. ELA/Literacy ONLY: The facilitator will review the ratings in the Writing workbook a. You will have 2 sets of tabs per grade. The first tab is for the Writing &
Language assessment and simply has the grade listed. The second tab is for the Essay and says Grade X Essay.
b. Ratings for the first tab (Grade X) for the Writing & Language assessment are identical to those for the Reading workbook (see above directions under #3).
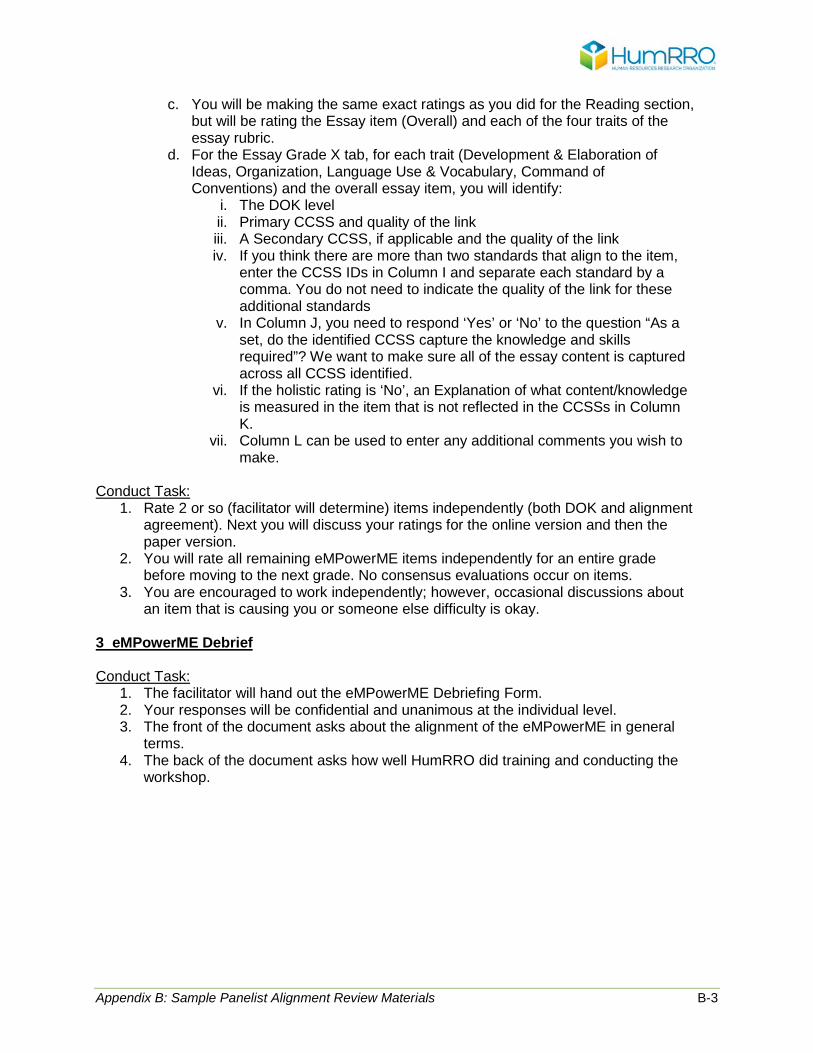
Appendix B: Sample Panelist Alignment Review Materials B-3
c. You will be making the same exact ratings as you did for the Reading section, but will be rating the Essay item (Overall) and each of the four traits of the essay rubric.
d. For the Essay Grade X tab, for each trait (Development & Elaboration of Ideas, Organization, Language Use & Vocabulary, Command of Conventions) and the overall essay item, you will identify:
i. The DOK level ii. Primary CCSS and quality of the link iii. A Secondary CCSS, if applicable and the quality of the link iv. If you think there are more than two standards that align to the item,
enter the CCSS IDs in Column I and separate each standard by a comma. You do not need to indicate the quality of the link for these additional standards
v. In Column J, you need to respond ‘Yes’ or ‘No’ to the question “As a set, do the identified CCSS capture the knowledge and skills required”? We want to make sure all of the essay content is captured across all CCSS identified.
vi. If the holistic rating is ‘No’, an Explanation of what content/knowledge is measured in the item that is not reflected in the CCSSs in Column K.
vii. Column L can be used to enter any additional comments you wish to make.
Conduct Task:
1. Rate 2 or so (facilitator will determine) items independently (both DOK and alignment agreement). Next you will discuss your ratings for the online version and then the paper version.
2. You will rate all remaining eMPowerME items independently for an entire grade before moving to the next grade. No consensus evaluations occur on items.
3. You are encouraged to work independently; however, occasional discussions about an item that is causing you or someone else difficulty is okay.
3 eMPowerME Debrief Conduct Task:
1. The facilitator will hand out the eMPowerME Debriefing Form. 2. Your responses will be confidential and unanimous at the individual level. 3. The front of the document asks about the alignment of the eMPowerME in general
terms. 4. The back of the document asks how well HumRRO did training and conducting the
workshop.
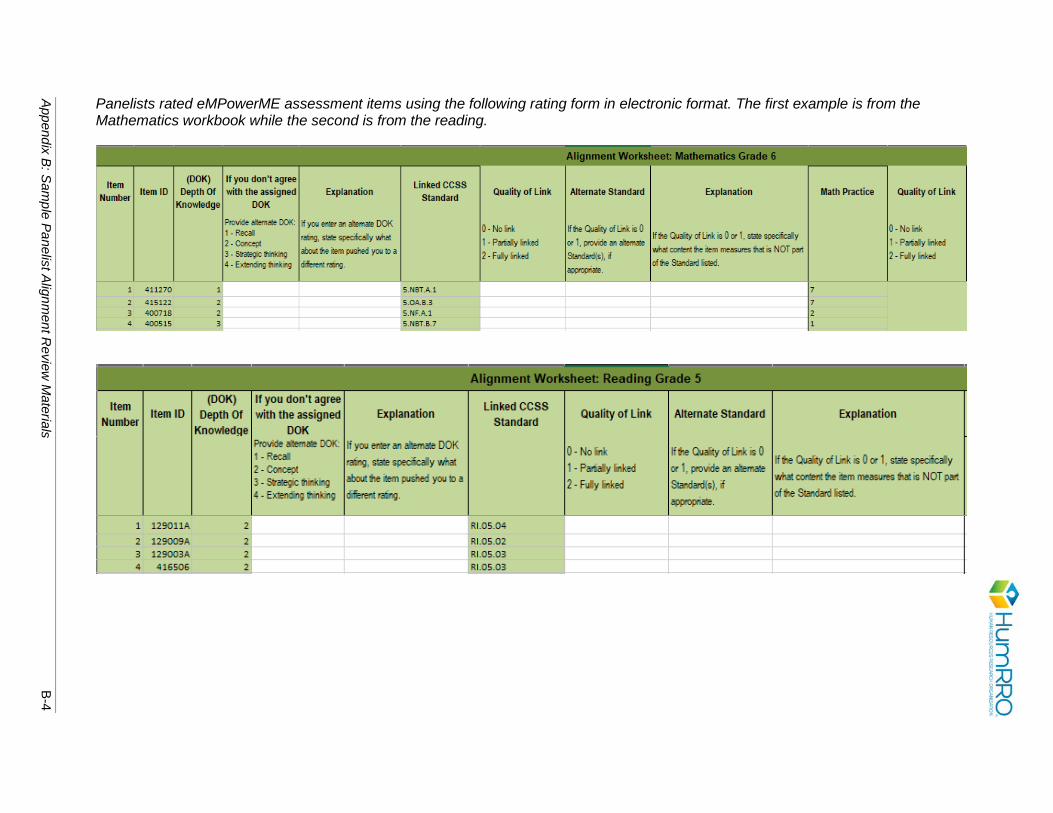
Appendix B
: Sam
ple Panelist A
lignment R
eview M
aterials B-4
Panelists rated eMPowerME assessment items using the following rating form in electronic format. The first example is from the Mathematics workbook while the second is from the reading.
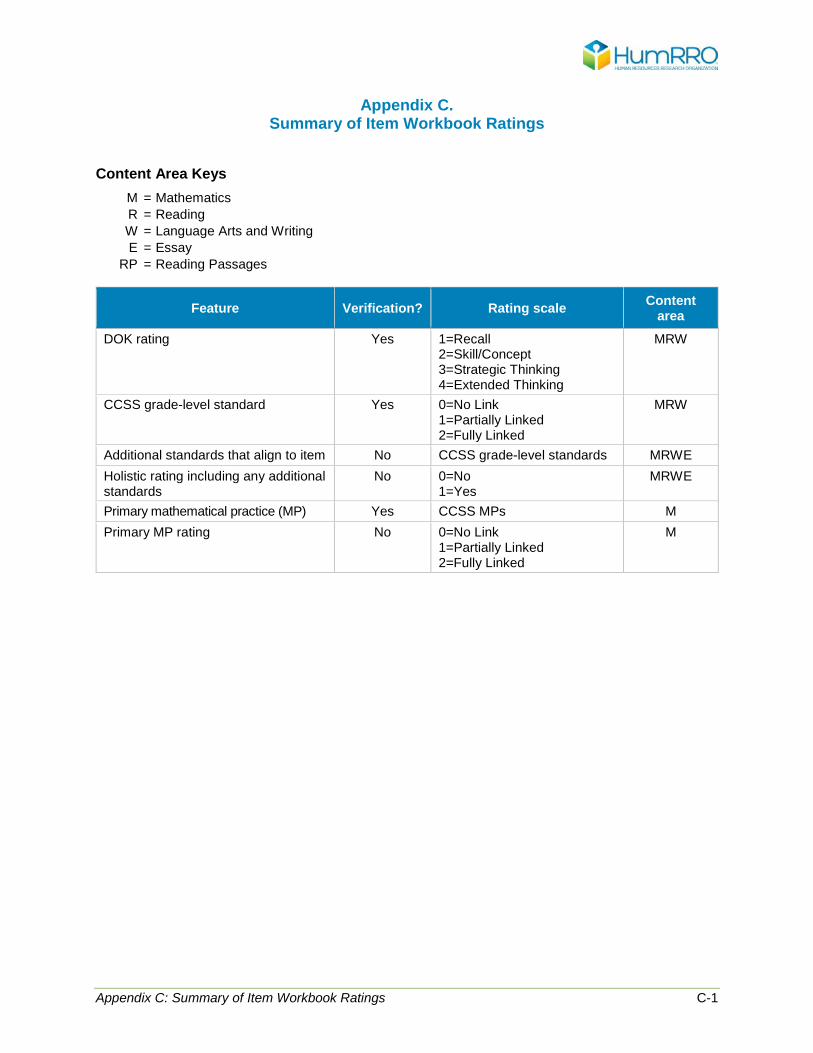
Appendix C: Summary of Item Workbook Ratings C-1
Appendix C. Summary of Item Workbook Ratings
Content Area Keys M = Mathematics R = Reading W = Language Arts and Writing E = Essay RP = Reading Passages
Feature Verification? Rating scale Content area
DOK rating Yes 1=Recall 2=Skill/Concept 3=Strategic Thinking 4=Extended Thinking
MRW
CCSS grade-level standard Yes
0=No Link 1=Partially Linked 2=Fully Linked
MRW
Additional standards that align to item No CCSS grade-level standards MRWE Holistic rating including any additional standards
No 0=No 1=Yes
MRWE
Primary mathematical practice (MP) Yes CCSS MPs M Primary MP rating No 0=No Link
1=Partially Linked 2=Fully Linked
M
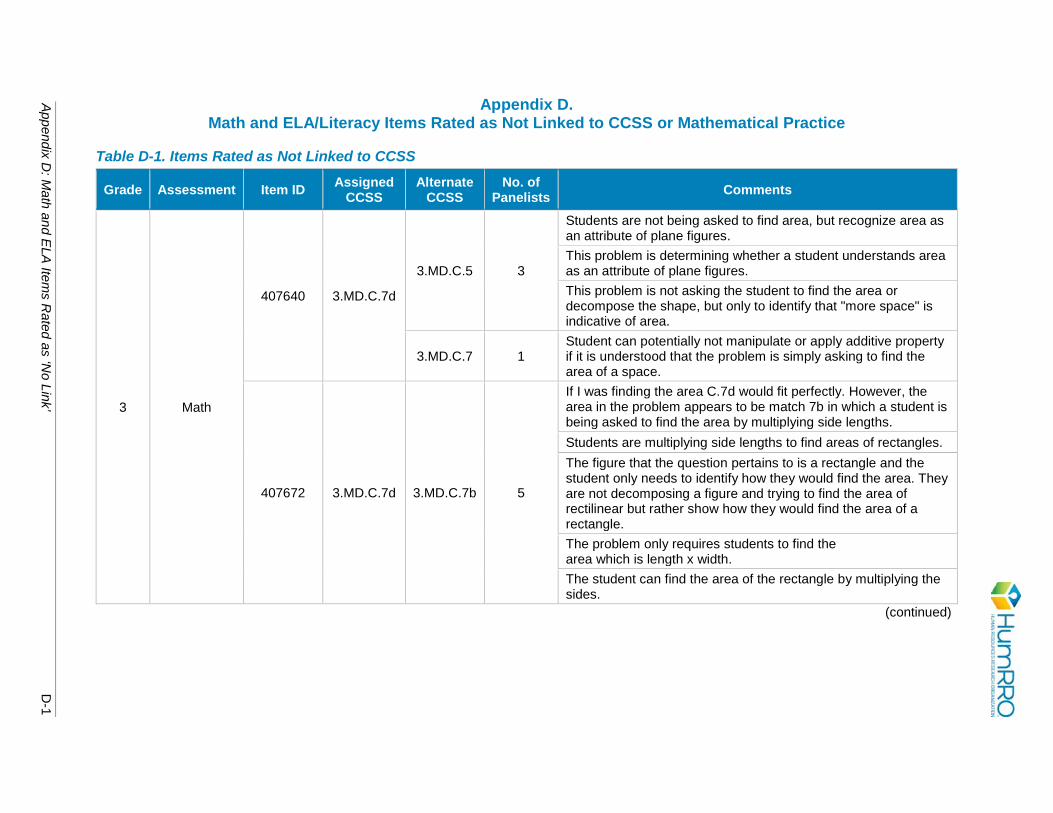
Appendix D
: Math and E
LA Item
s Rated as ‘N
o Link’ D
-1
Appendix D. Math and ELA/Literacy Items Rated as Not Linked to CCSS or Mathematical Practice
Table D-1. Items Rated as Not Linked to CCSS
Grade Assessment Item ID Assigned CCSS
Alternate CCSS
No. of Panelists Comments
3 Math
407640 3.MD.C.7d
3.MD.C.5 3
Students are not being asked to find area, but recognize area as an attribute of plane figures. This problem is determining whether a student understands area as an attribute of plane figures. This problem is not asking the student to find the area or decompose the shape, but only to identify that "more space" is indicative of area.
3.MD.C.7 1 Student can potentially not manipulate or apply additive property if it is understood that the problem is simply asking to find the area of a space.
407672 3.MD.C.7d 3.MD.C.7b 5
If I was finding the area C.7d would fit perfectly. However, the area in the problem appears to be match 7b in which a student is being asked to find the area by multiplying side lengths. Students are multiplying side lengths to find areas of rectangles. The figure that the question pertains to is a rectangle and the student only needs to identify how they would find the area. They are not decomposing a figure and trying to find the area of rectilinear but rather show how they would find the area of a rectangle. The problem only requires students to find the area which is length x width. The student can find the area of the rectangle by multiplying the sides.
(continued)
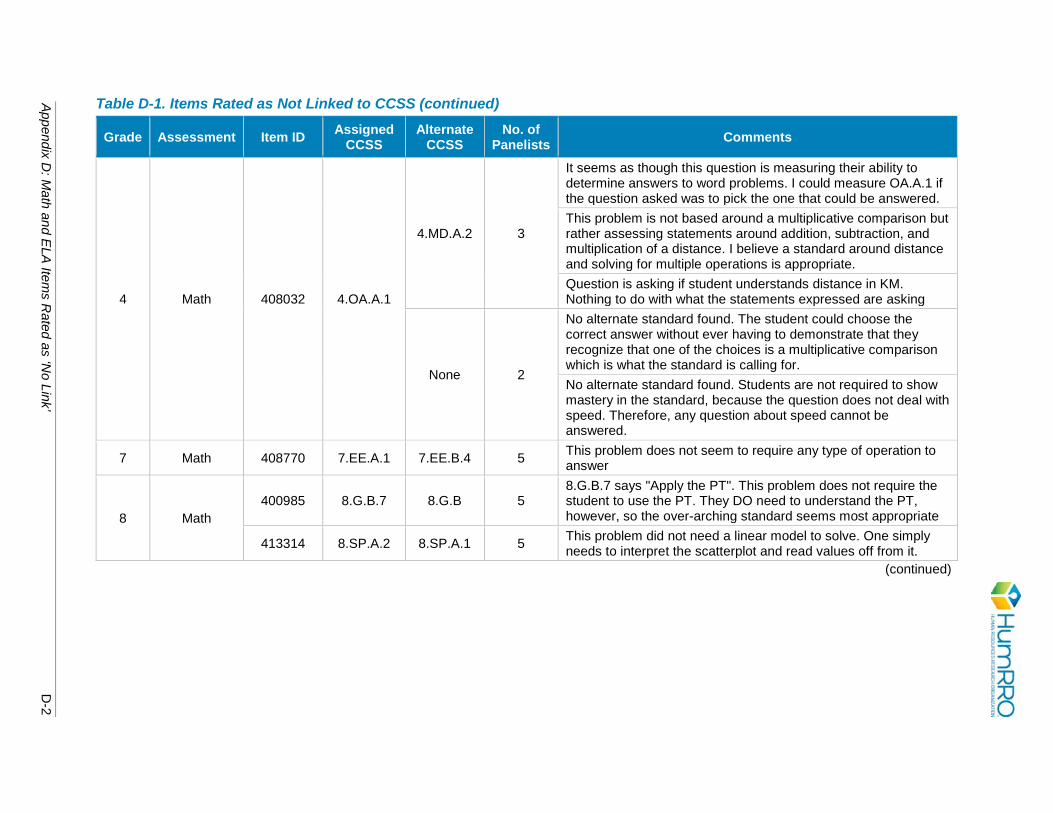
Appendix D
: Math and E
LA Item
s Rated as ‘N
o Link’ D
-2
Table D-1. Items Rated as Not Linked to CCSS (continued)
Grade Assessment Item ID Assigned CCSS
Alternate CCSS
No. of Panelists Comments
4 Math 408032 4.OA.A.1
4.MD.A.2 3
It seems as though this question is measuring their ability to determine answers to word problems. I could measure OA.A.1 if the question asked was to pick the one that could be answered. This problem is not based around a multiplicative comparison but rather assessing statements around addition, subtraction, and multiplication of a distance. I believe a standard around distance and solving for multiple operations is appropriate. Question is asking if student understands distance in KM. Nothing to do with what the statements expressed are asking
None 2
No alternate standard found. The student could choose the correct answer without ever having to demonstrate that they recognize that one of the choices is a multiplicative comparison which is what the standard is calling for. No alternate standard found. Students are not required to show mastery in the standard, because the question does not deal with speed. Therefore, any question about speed cannot be answered.
7 Math 408770 7.EE.A.1 7.EE.B.4 5 This problem does not seem to require any type of operation to answer
8 Math 400985 8.G.B.7 8.G.B 5
8.G.B.7 says "Apply the PT". This problem does not require the student to use the PT. They DO need to understand the PT, however, so the over-arching standard seems most appropriate
413314 8.SP.A.2 8.SP.A.1 5 This problem did not need a linear model to solve. One simply needs to interpret the scatterplot and read values off from it.
(continued)
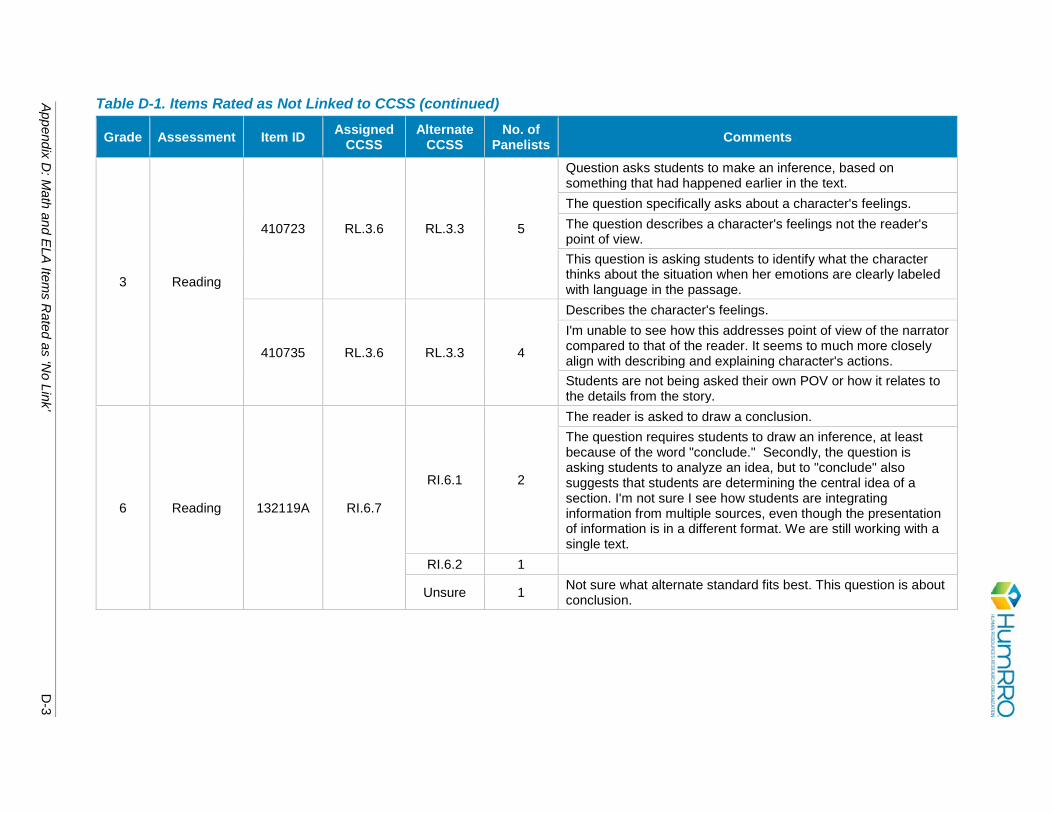
Appendix D
: Math and E
LA Item
s Rated as ‘N
o Link’ D
-3
Table D-1. Items Rated as Not Linked to CCSS (continued)
Grade Assessment Item ID Assigned CCSS
Alternate CCSS
No. of Panelists Comments
3 Reading
410723 RL.3.6 RL.3.3 5
Question asks students to make an inference, based on something that had happened earlier in the text. The question specifically asks about a character's feelings. The question describes a character's feelings not the reader's point of view. This question is asking students to identify what the character thinks about the situation when her emotions are clearly labeled with language in the passage.
410735 RL.3.6 RL.3.3 4
Describes the character's feelings. I'm unable to see how this addresses point of view of the narrator compared to that of the reader. It seems to much more closely align with describing and explaining character's actions. Students are not being asked their own POV or how it relates to the details from the story.
6 Reading 132119A RI.6.7
RI.6.1 2
The reader is asked to draw a conclusion. The question requires students to draw an inference, at least because of the word "conclude." Secondly, the question is asking students to analyze an idea, but to "conclude" also suggests that students are determining the central idea of a section. I'm not sure I see how students are integrating information from multiple sources, even though the presentation of information is in a different format. We are still working with a single text.
RI.6.2 1
Unsure 1 Not sure what alternate standard fits best. This question is about conclusion.
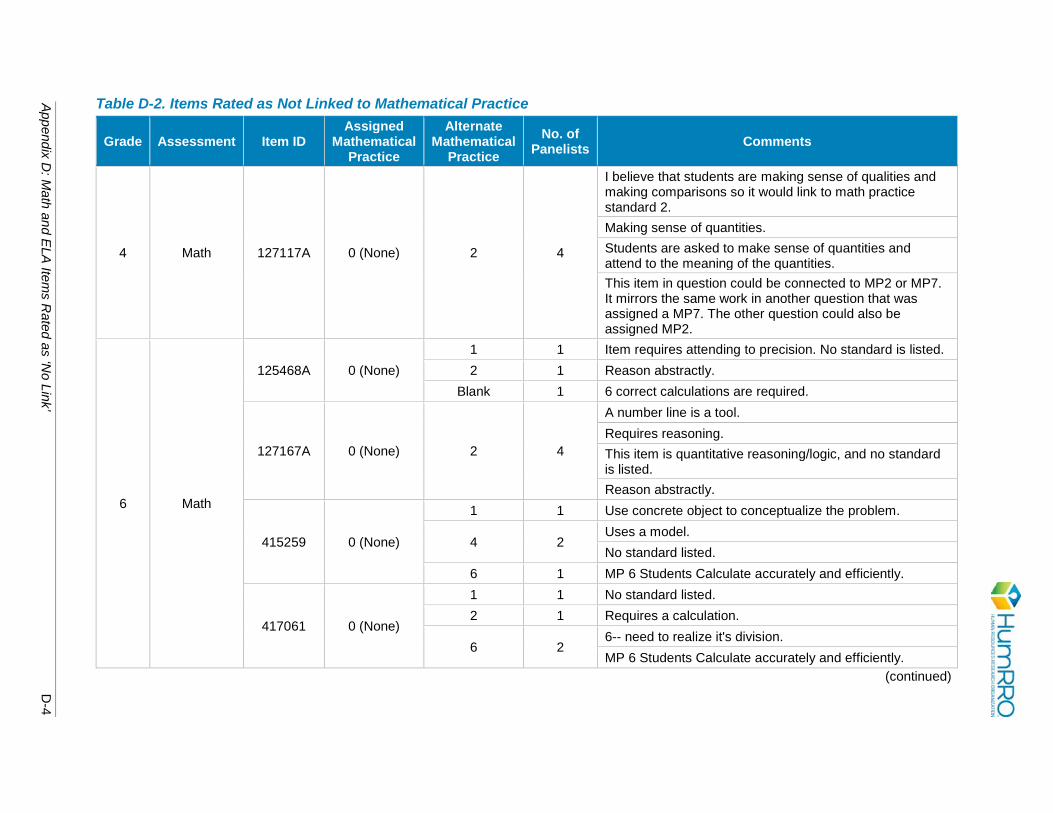
Appendix D
: Math and E
LA Item
s Rated as ‘N
o Link’ D
-4
Table D-2. Items Rated as Not Linked to Mathematical Practice
Grade Assessment Item ID Assigned
Mathematical Practice
Alternate Mathematical
Practice No. of
Panelists Comments
4 Math 127117A 0 (None) 2 4
I believe that students are making sense of qualities and making comparisons so it would link to math practice standard 2. Making sense of quantities. Students are asked to make sense of quantities and attend to the meaning of the quantities. This item in question could be connected to MP2 or MP7. It mirrors the same work in another question that was assigned a MP7. The other question could also be assigned MP2.
6 Math
125468A 0 (None) 1 1 Item requires attending to precision. No standard is listed. 2 1 Reason abstractly.
Blank 1 6 correct calculations are required.
127167A 0 (None) 2 4
A number line is a tool. Requires reasoning. This item is quantitative reasoning/logic, and no standard is listed. Reason abstractly.
415259 0 (None)
1 1 Use concrete object to conceptualize the problem.
4 2 Uses a model. No standard listed.
6 1 MP 6 Students Calculate accurately and efficiently.
417061 0 (None)
1 1 No standard listed. 2 1 Requires a calculation.
6 2 6-- need to realize it's division. MP 6 Students Calculate accurately and efficiently.
(continued)
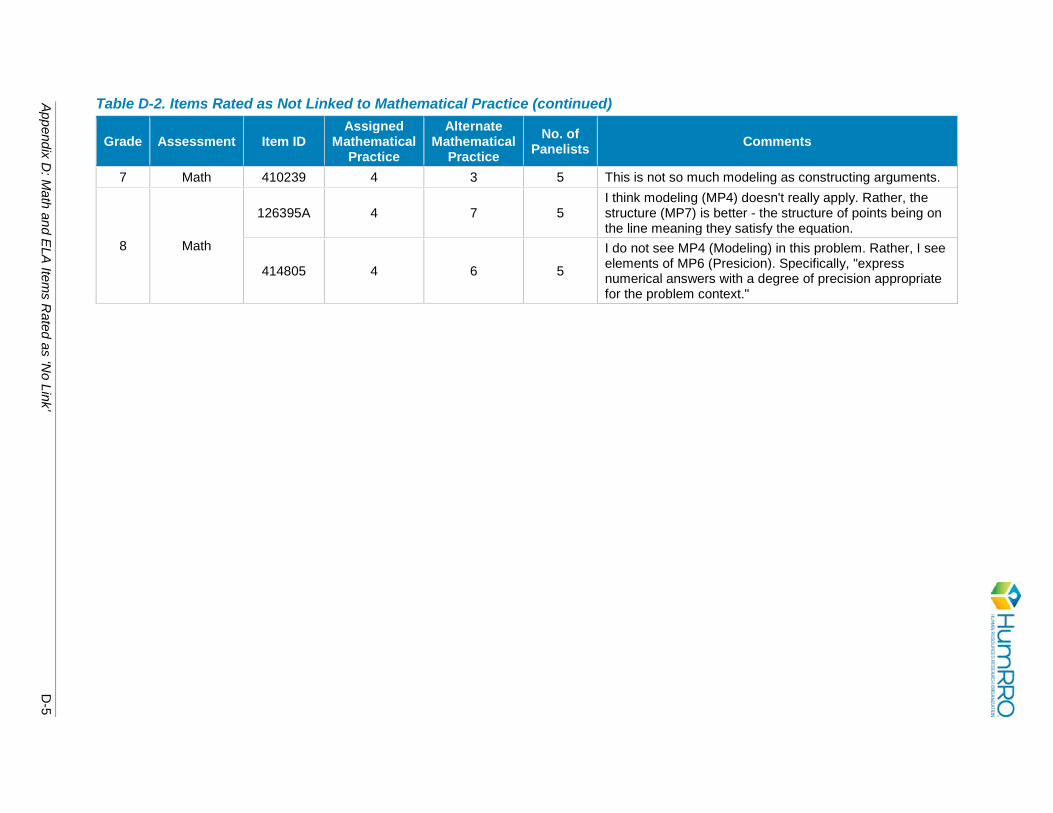
Appendix D
: Math and E
LA Item
s Rated as ‘N
o Link’ D
-5
Table D-2. Items Rated as Not Linked to Mathematical Practice (continued)
Grade Assessment Item ID Assigned
Mathematical Practice
Alternate Mathematical
Practice No. of
Panelists Comments
7 Math 410239 4 3 5 This is not so much modeling as constructing arguments.
8 Math
126395A 4 7 5 I think modeling (MP4) doesn't really apply. Rather, the structure (MP7) is better - the structure of points being on the line meaning they satisfy the equation.
414805 4 6 5
I do not see MP4 (Modeling) in this problem. Rather, I see elements of MP6 (Presicion). Specifically, "express numerical answers with a degree of precision appropriate for the problem context."
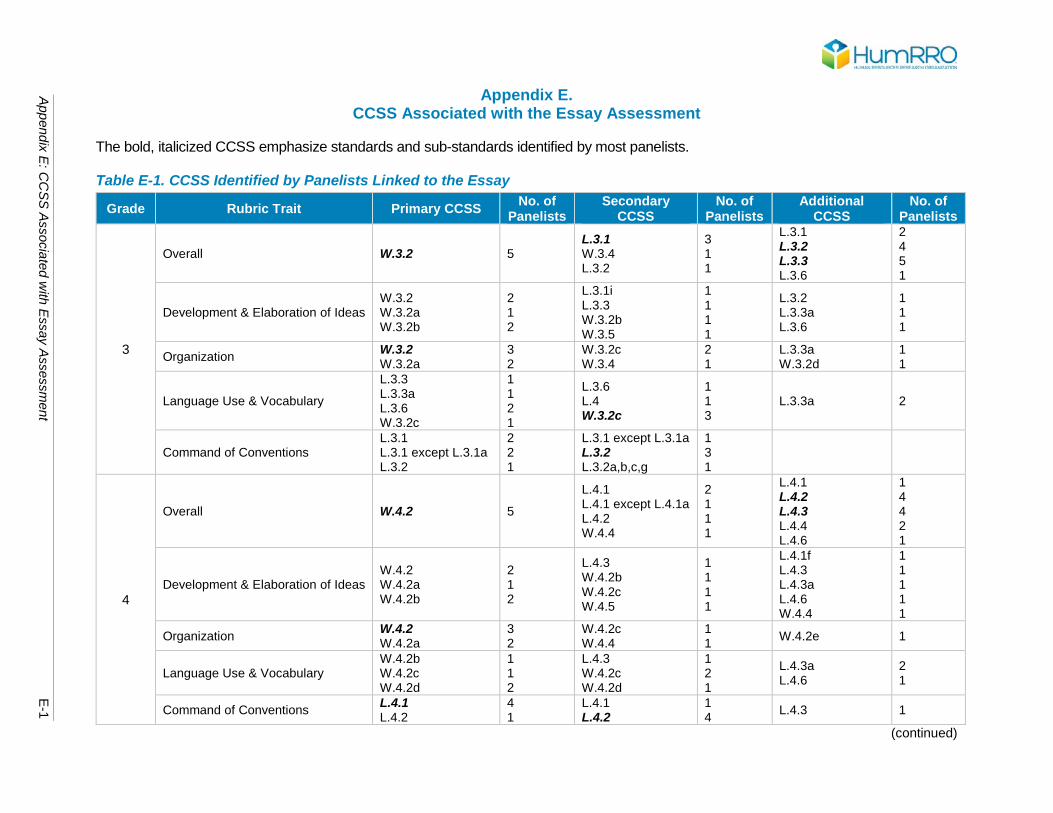
Appendix E
: CC
SS
Associated w
ith Essay A
ssessment
E-1
Appendix E. CCSS Associated with the Essay Assessment
The bold, italicized CCSS emphasize standards and sub-standards identified by most panelists. Table E-1. CCSS Identified by Panelists Linked to the Essay
Grade Rubric Trait Primary CCSS No. of Panelists
Secondary CCSS
No. of Panelists
Additional CCSS
No. of Panelists
3
Overall W.3.2 5 L.3.1 W.3.4 L.3.2
3 1 1
L.3.1 L.3.2 L.3.3 L.3.6
2 4 5 1
Development & Elaboration of Ideas W.3.2 W.3.2a W.3.2b
2 1 2
L.3.1i L.3.3 W.3.2b W.3.5
1 1 1 1
L.3.2 L.3.3a L.3.6
1 1 1
Organization W.3.2 W.3.2a
3 2
W.3.2c W.3.4
2 1
L.3.3a W.3.2d
1 1
Language Use & Vocabulary
L.3.3 L.3.3a L.3.6 W.3.2c
1 1 2 1
L.3.6 L.4 W.3.2c
1 1 3
L.3.3a 2
Command of Conventions L.3.1 L.3.1 except L.3.1a L.3.2
2 2 1
L.3.1 except L.3.1a L.3.2 L.3.2a,b,c,g
1 3 1
4
Overall W.4.2 5
L.4.1 L.4.1 except L.4.1a L.4.2 W.4.4
2 1 1 1
L.4.1 L.4.2 L.4.3 L.4.4 L.4.6
1 4 4 2 1
Development & Elaboration of Ideas W.4.2 W.4.2a W.4.2b
2 1 2
L.4.3 W.4.2b W.4.2c W.4.5
1 1 1 1
L.4.1f L.4.3 L.4.3a L.4.6 W.4.4
1 1 1 1 1
Organization W.4.2 W.4.2a
3 2
W.4.2c W.4.4
1 1 W.4.2e 1
Language Use & Vocabulary W.4.2b W.4.2c W.4.2d
1 1 2
L.4.3 W.4.2c W.4.2d
1 2 1
L.4.3a L.4.6
2 1
Command of Conventions L.4.1 L.4.2
4 1
L.4.1 L.4.2
1 4 L.4.3 1
(continued)
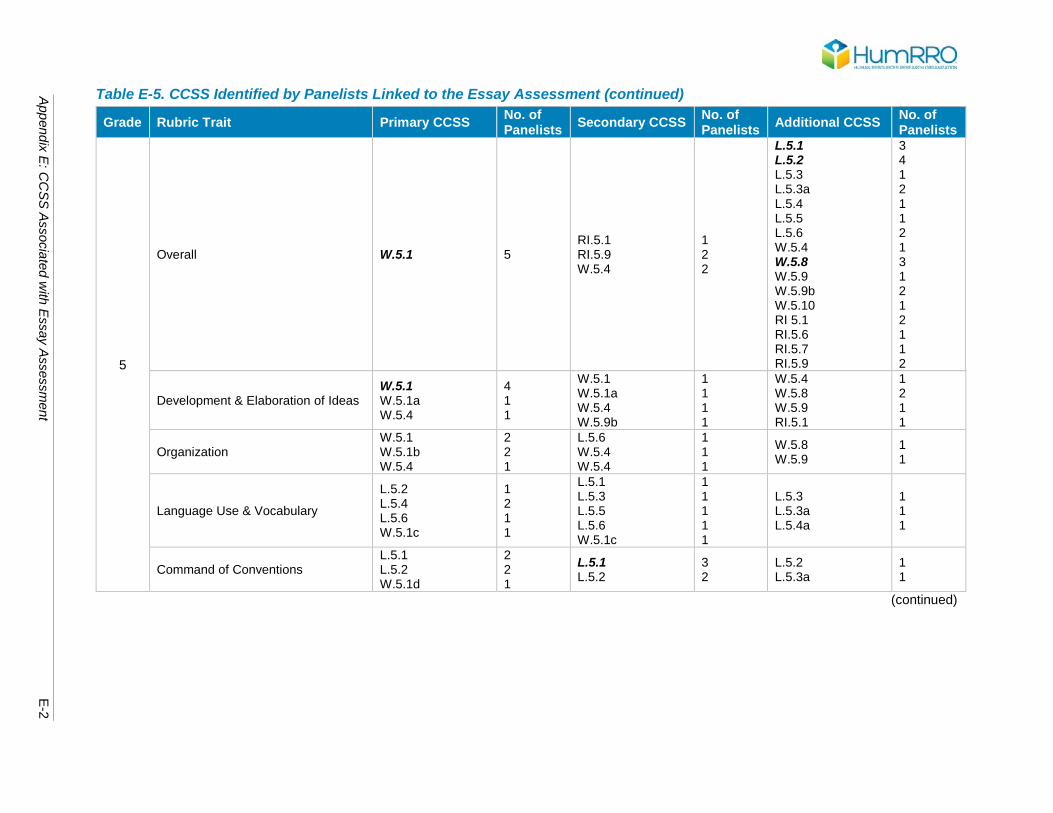
Appendix E
: CC
SS
Associated w
ith Essay A
ssessment
E-2
Table E-5. CCSS Identified by Panelists Linked to the Essay Assessment (continued)
Grade Rubric Trait Primary CCSS No. of Panelists Secondary CCSS No. of
Panelists Additional CCSS No. of Panelists
5
Overall W.5.1 5 RI.5.1 RI.5.9 W.5.4
1 2 2
L.5.1 L.5.2 L.5.3 L.5.3a L.5.4 L.5.5 L.5.6 W.5.4 W.5.8 W.5.9 W.5.9b W.5.10 RI 5.1 RI.5.6 RI.5.7 RI.5.9
3 4 1 2 1 1 2 1 3 1 2 1 2 1 1 2
Development & Elaboration of Ideas W.5.1 W.5.1a W.5.4
4 1 1
W.5.1 W.5.1a W.5.4 W.5.9b
1 1 1 1
W.5.4 W.5.8 W.5.9 RI.5.1
1 2 1 1
Organization W.5.1 W.5.1b W.5.4
2 2 1
L.5.6 W.5.4 W.5.4
1 1 1
W.5.8 W.5.9
1 1
Language Use & Vocabulary
L.5.2 L.5.4 L.5.6 W.5.1c
1 2 1 1
L.5.1 L.5.3 L.5.5 L.5.6 W.5.1c
1 1 1 1 1
L.5.3 L.5.3a L.5.4a
1 1 1
Command of Conventions L.5.1 L.5.2 W.5.1d
2 2 1
L.5.1 L.5.2
3 2
L.5.2 L.5.3a
1 1
(continued)
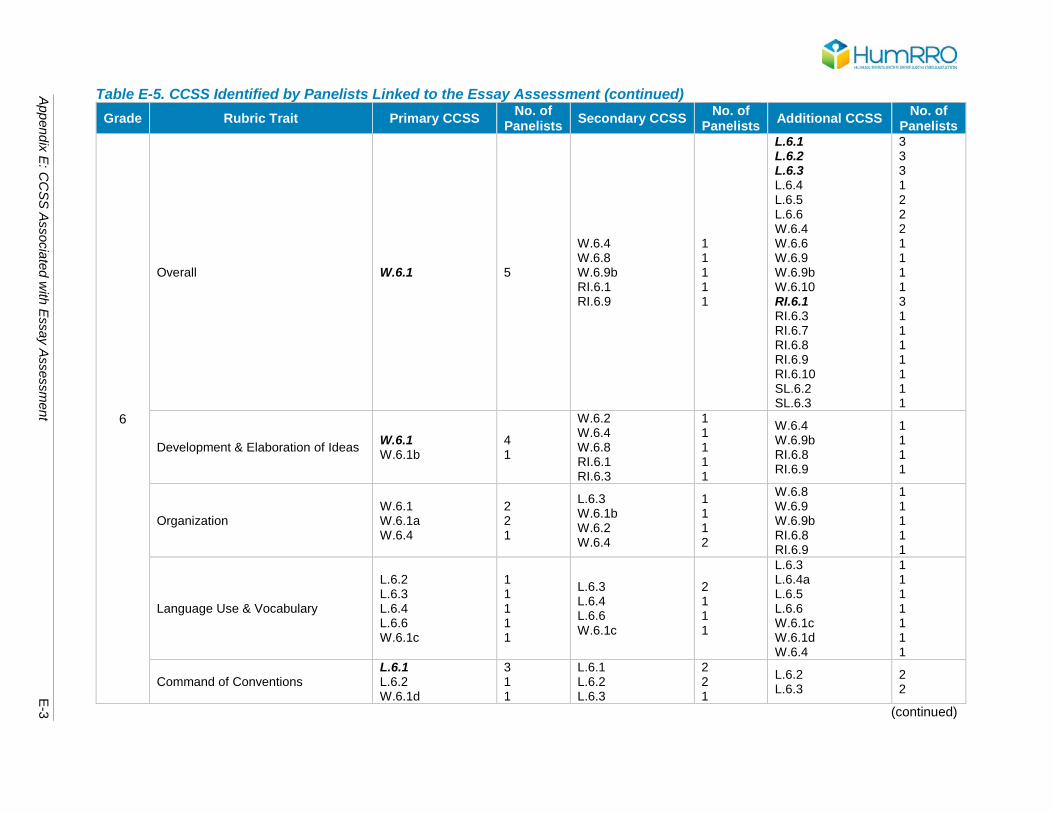
Appendix E
: CC
SS
Associated w
ith Essay A
ssessment
E-3
Table E-5. CCSS Identified by Panelists Linked to the Essay Assessment (continued) Grade Rubric Trait Primary CCSS No. of
Panelists Secondary CCSS No. of Panelists Additional CCSS No. of
Panelists
6
Overall W.6.1 5
W.6.4 W.6.8 W.6.9b RI.6.1 RI.6.9
1 1 1 1 1
L.6.1 L.6.2 L.6.3 L.6.4 L.6.5 L.6.6 W.6.4 W.6.6 W.6.9 W.6.9b W.6.10 RI.6.1 RI.6.3 RI.6.7 RI.6.8 RI.6.9 RI.6.10 SL.6.2 SL.6.3
3 3 3 1 2 2 2 1 1 1 1 3 1 1 1 1 1 1 1
Development & Elaboration of Ideas W.6.1 W.6.1b
4 1
W.6.2 W.6.4 W.6.8 RI.6.1 RI.6.3
1 1 1 1 1
W.6.4 W.6.9b RI.6.8 RI.6.9
1 1 1 1
Organization W.6.1 W.6.1a W.6.4
2 2 1
L.6.3 W.6.1b W.6.2 W.6.4
1 1 1 2
W.6.8 W.6.9 W.6.9b RI.6.8 RI.6.9
1 1 1 1 1
Language Use & Vocabulary
L.6.2 L.6.3 L.6.4 L.6.6 W.6.1c
1 1 1 1 1
L.6.3 L.6.4 L.6.6 W.6.1c
2 1 1 1
L.6.3 L.6.4a L.6.5 L.6.6 W.6.1c W.6.1d W.6.4
1 1 1 1 1 1 1
Command of Conventions L.6.1 L.6.2 W.6.1d
3 1 1
L.6.1 L.6.2 L.6.3
2 2 1
L.6.2 L.6.3
2 2
(continued)
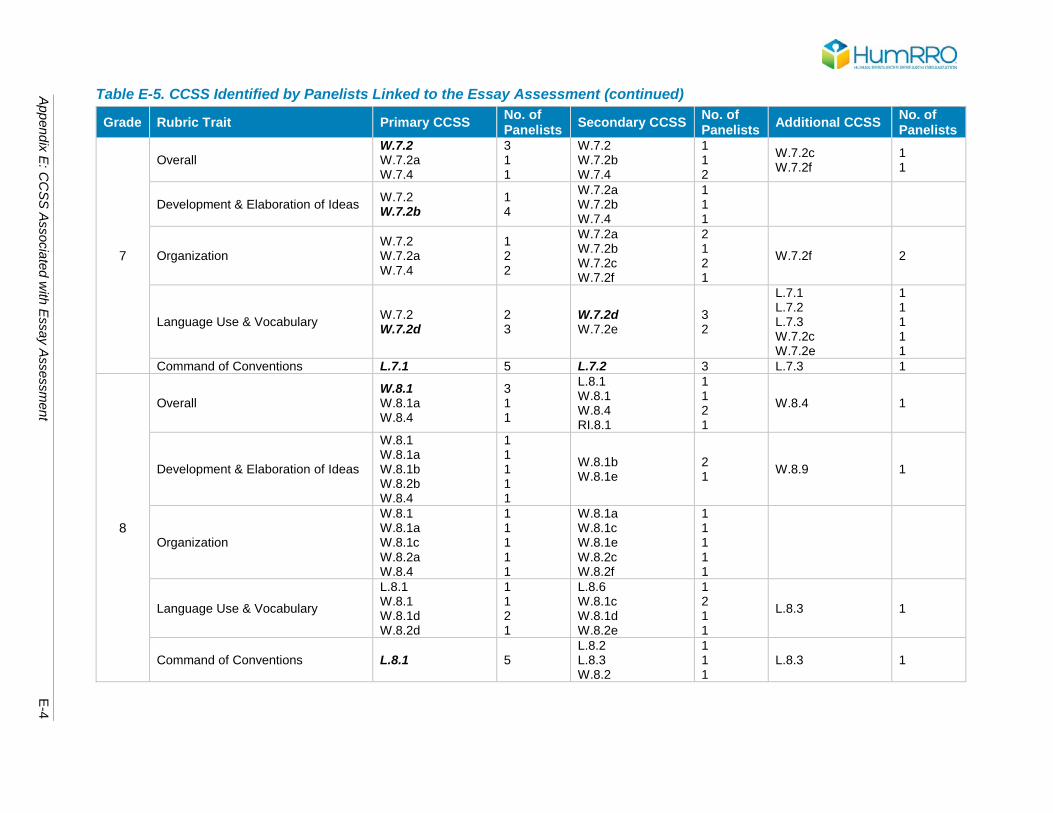
Appendix E
: CC
SS
Associated w
ith Essay A
ssessment
E-4
Table E-5. CCSS Identified by Panelists Linked to the Essay Assessment (continued)
Grade Rubric Trait Primary CCSS No. of Panelists Secondary CCSS No. of
Panelists Additional CCSS No. of Panelists
7
Overall W.7.2 W.7.2a W.7.4
3 1 1
W.7.2 W.7.2b W.7.4
1 1 2
W.7.2c W.7.2f
1 1
Development & Elaboration of Ideas W.7.2 W.7.2b
1 4
W.7.2a W.7.2b W.7.4
1 1 1
Organization W.7.2 W.7.2a W.7.4
1 2 2
W.7.2a W.7.2b W.7.2c W.7.2f
2 1 2 1
W.7.2f 2
Language Use & Vocabulary W.7.2 W.7.2d
2 3
W.7.2d W.7.2e
3 2
L.7.1 L.7.2 L.7.3 W.7.2c W.7.2e
1 1 1 1 1
Command of Conventions L.7.1 5 L.7.2 3 L.7.3 1
8
Overall W.8.1 W.8.1a W.8.4
3 1 1
L.8.1 W.8.1 W.8.4 RI.8.1
1 1 2 1
W.8.4 1
Development & Elaboration of Ideas
W.8.1 W.8.1a W.8.1b W.8.2b W.8.4
1 1 1 1 1
W.8.1b W.8.1e
2 1 W.8.9 1
Organization
W.8.1 W.8.1a W.8.1c W.8.2a W.8.4
1 1 1 1 1
W.8.1a W.8.1c W.8.1e W.8.2c W.8.2f
1 1 1 1 1
Language Use & Vocabulary
L.8.1 W.8.1 W.8.1d W.8.2d
1 1 2 1
L.8.6 W.8.1c W.8.1d W.8.2e
1 2 1 1
L.8.3 1
Command of Conventions L.8.1 5 L.8.2 L.8.3 W.8.2
1 1 1
L.8.3 1
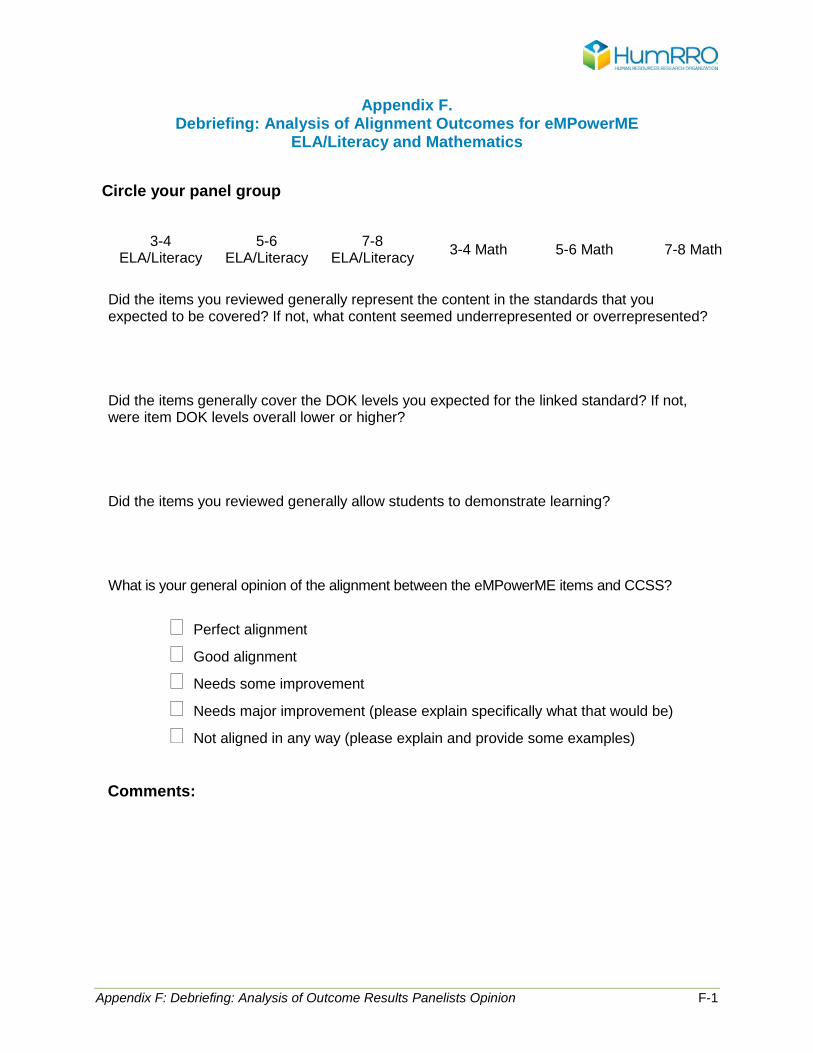
Appendix F: Debriefing: Analysis of Outcome Results Panelists Opinion F-1
Appendix F. Debriefing: Analysis of Alignment Outcomes for eMPowerME
ELA/Literacy and Mathematics
Circle your panel group
3-4 ELA/Literacy
5-6 ELA/Literacy
7-8 ELA/Literacy 3-4 Math 5-6 Math 7-8 Math
Did the items you reviewed generally represent the content in the standards that you expected to be covered? If not, what content seemed underrepresented or overrepresented? Did the items generally cover the DOK levels you expected for the linked standard? If not, were item DOK levels overall lower or higher? Did the items you reviewed generally allow students to demonstrate learning? What is your general opinion of the alignment between the eMPowerME items and CCSS?
� Perfect alignment
� Good alignment
� Needs some improvement
� Needs major improvement (please explain specifically what that would be)
� Not aligned in any way (please explain and provide some examples)
Comments:
Appendix F: Debriefing: Analysis of Outcome Results Panelists Opinion F-2
Evaluation: Alignment Review Training and Procedures Please indicate your agreement by marking an ‘X’ in the appropriate box for each statement.
The training presentation in the large group provided useful information about the eMPowerME assessment systems and alignment method.
Strongly Disagree Disagree Somewhat
Disagree Somewhat
Agree Agree Strongly Agree
If Disagree or Strongly Disagree, suggest how it could be improved:
After the additional training in my small group, I felt prepared to be a panelist.
Strongly Disagree Disagree Somewhat
Disagree Somewhat
Agree Agree Strongly Agree
If Disagree or Strongly Disagree, suggest how it could be improved:
HumRRO staff seemed knowledgeable of the eMPowerME assessment and alignment steps.
Strongly Disagree Disagree Somewhat
Disagree Somewhat
Agree Agree Strongly Agree
If Disagree or Strongly Disagree, suggest how it could be improved:
The Panelist Instruction document was clear, understandable, and useful in performing the alignment steps.
Strongly Disagree Disagree Somewhat
Disagree Somewhat
Agree Agree Strongly Agree
If Disagree or Strongly Disagree, suggest how it could be improved:
The excel files were relatively easy to use to enter data.
Strongly Disagree Disagree Somewhat
Disagree Somewhat
Agree Agree Strongly Agree
If Disagree or Strongly Disagree, suggest how it could be improved:
Please provide any additional comments: