INCREASING RENEWABLE ENERGY BY ALMOND SHELL GASIFICATION€¦ · · 2016-07-18results of this...
41
Energy Research and Development Division FINAL PROJECT REPORT INCREASING RENEWABLE ENERGY BY ALMOND SHELL GASIFICATION Tar Reforming and Tar Removal Report JULY 2016 CEC-500-2016-057 Prepared for: California Energy Commission Prepared by: University of California
Transcript of INCREASING RENEWABLE ENERGY BY ALMOND SHELL GASIFICATION€¦ · · 2016-07-18results of this...

E n e r g y R e s e a r c h a n d D e v e l o p m e n t D i v i s i o n F I N A L P R O J E C T R E P O R T
INCREASING RENEWABLE ENERGY BY ALMOND SHELL GASIFICATION Tar Reforming and Tar Removal Report
JULY 2016 CE C-500-2016-057
Prepared for: California Energy Commission Prepared by: University of California
PREPARED BY: Primary Author(s): Robert Cattolica, UC San Diego Reinhard Seiser, UC San Diego Bryan Jenkins, UC Davis University of California 9500 Gilman Drive La Jolla, CA 92093 Phone: 858-534-2433 | Fax: 858-534-5354 Contract Number: 500-10-048 Prepared for: California Energy Commission Rizaldo Aldas Gail Wigget Contract Managers Aleecia Gutierrez Office Manager Energy Generation Research Office Laurie ten Hope Deputy Director ENERGY RESEARCH AND DEVELOPMENT DIVISION Robert P. Oglesby Executive Director
DISCLAIMER This report was prepared as the result of work sponsored by the California Energy Commission. It does not necessarily represent the views of the Energy Commission, its employees or the State of California. The Energy Commission, the State of California, its employees, contractors and subcontractors make no warranty, express or implied, and assume no legal liability for the information in this report; nor does any party represent that the uses of this information will not infringe upon privately owned rights. This report has not been approved or disapproved by the California Energy Commission nor has the California Energy Commission passed upon the accuracy or adequacy of the information in this report.

i
ACKNOWLEDGEMENTS
We gratefully acknowledge the support of the California Energy Commission and the California Institute for Energy and Environment in conducting this research.
The content of this report was developed by students, research staff, and faculty from the University of California San Diego and Davis campuses. In addition to the principal investigators listed above, the following individuals contributed to the preparation of this report:
Tar Reforming and Tar Removal Report Section 2.1 was prepared under the direction of Professor Bryan Jenkins and the following UC Davis students and research staff: Zach McCaffrey, Michael Long, Li Wang, Melina Cais, Ashwin Bala, Sam Feizi, Dr. Reza Khatami, and Rob Williams. Section 2.2 was prepared under the direction of Professor Robert Cattolica and Dr. Tinku Baidya at the University of California San Diego.

ii
PREFACE
The California Energy Commission Energy Research and Development Division supports public interest energy research and development that will help improve the quality of life in California by bringing environmentally safe, affordable, and reliable energy services and products to the marketplace.
The Energy Research and Development Division conducts public interest research, development, and demonstration (RD&D) projects to benefit California.
The Energy Research and Development Division strives to conduct the most promising public interest energy research by partnering with RD&D entities, including individuals, businesses, utilities, and public or private research institutions.
Energy Research and Development Division funding efforts are focused on the following RD&D program areas:
• Buildings End-Use Energy Efficiency
• Energy Innovations Small Grants
• Energy-Related Environmental Research
• Energy Systems Integration
• Environmentally Preferred Advanced Generation
• Industrial/Agricultural/Water End-Use Energy Efficiency
• Renewable Energy Technologies
• Transportation
Increasing Renewable Energy by Almond Shell Gasification: Tar Reforming and Tar Removal is one of three final reports— for the Increasing Renewable Energy by Almond Shell Gasification project (contract number 500-10-048, work authorization number POEF01-S11 and POEF05-D12 conducted by Univerisy of California. The information from this project contributes to Energy Research and Development Division’s Buildings End-Use Energy Efficiency Program and the Renewable Energy Technologies Program.
When the source of a table, figure, or photo is not otherwise credited, it is the work of the author of the report.
For more information about the Energy Research and Development Division, please visit the Energy Commission’s website at www.energy.ca.gov/research/ or contact the Energy Commission at 916-327-1551.
iii
ABSTRACT
This research project used clean fuel gas from the gasification of almond biomass to: optimize gasification, develop advanced gas cleaning, and reduce combustion exhaust emissions. The results of this project Increasing Renewable Energy by Almond Shell Gasification are presented in three reports: Almond Biomass Characterization (publication number: CEC-500-2016-056), Tar Reforming and Tar Removal (publication number: CEC-500-2016-057), and Catalytic Converter and Emission Reduction (publication number: CEC-500-2016-058).
The second report in this project Tar Reforming and Tar Removal investigates tar reforming with partial oxidation by using air instead of nitrogen for pneumatic delivery of the feedstock with the UC Davis vertical electrically heated fluidized bed reactor. The effect of partial oxidation was measured by a tar sampling following the EU Tar Method.
Catalytic tar reforming was investigated with simulated producer gas with surrogate tars, Ethylene and Toluene in the UC San Diego fixed bed flow reactor. Two Nickel-based catalysts were investigated and surrogate tar conversion, COx selectivity, catalyst stability and regeneration, gas space velocity effects were determined. The catalysts were characterized with X-ray diffraction, Scanning Electron Microscopy, temperature programmed reduction, and temperature programmed desorption analysis.
Keywords: Almond Biomass, Tar Reforming, Partial Oxidation, Catalysts, Gasification, Producer Gas, Methane Number, NOx, CO, Lean Combustion
Please use the following citation for this report:
Cattolica, Robert; Reinhard Seiser; Bryan Jenkins. (University of California San Diego/Davis). 2014. Increasing Renewable Energy by Almond Shell Gasification: Tar Reforming and Tar Remova Report, California Energy Commission. Publication number: CEC-500-2016-057.
iv
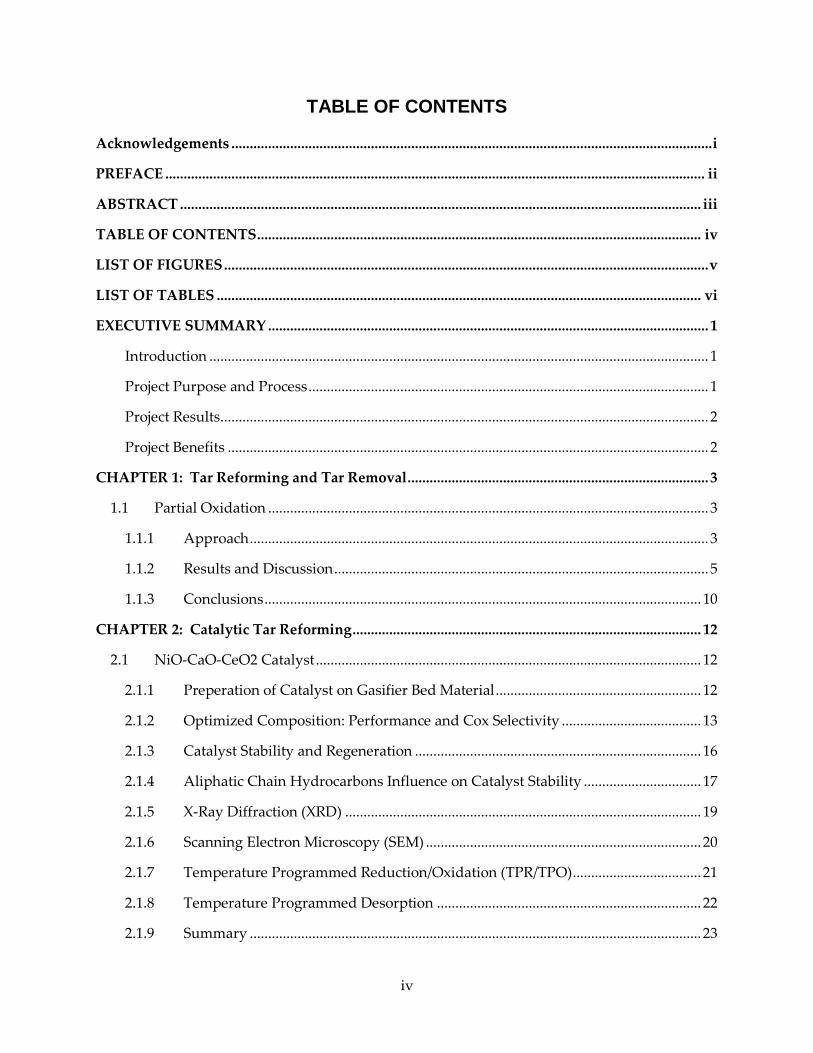
TABLE OF CONTENTS
Acknowledgements ................................................................................................................................... i
PREFACE ................................................................................................................................................... ii
ABSTRACT .............................................................................................................................................. iii
TABLE OF CONTENTS ......................................................................................................................... iv
LIST OF FIGURES .................................................................................................................................... v
LIST OF TABLES .................................................................................................................................... vi
EXECUTIVE SUMMARY ........................................................................................................................ 1
Introduction ........................................................................................................................................ 1
Project Purpose and Process ............................................................................................................. 1
Project Results ..................................................................................................................................... 2
Project Benefits ................................................................................................................................... 2
CHAPTER 1: Tar Reforming and Tar Removal .................................................................................. 3
1.1 Partial Oxidation ........................................................................................................................ 3
1.1.1 Approach ............................................................................................................................. 3
1.1.2 Results and Discussion ...................................................................................................... 5
1.1.3 Conclusions ....................................................................................................................... 10
CHAPTER 2: Catalytic Tar Reforming ............................................................................................... 12
2.1 NiO-CaO-CeO2 Catalyst ......................................................................................................... 12
2.1.1 Preperation of Catalyst on Gasifier Bed Material ........................................................ 12
2.1.2 Optimized Composition: Performance and Cox Selectivity ...................................... 13
2.1.3 Catalyst Stability and Regeneration .............................................................................. 16
2.1.4 Aliphatic Chain Hydrocarbons Influence on Catalyst Stability ................................ 17
2.1.5 X-Ray Diffraction (XRD) ................................................................................................. 19
2.1.6 Scanning Electron Microscopy (SEM) ........................................................................... 20
2.1.7 Temperature Programmed Reduction/Oxidation (TPR/TPO) ................................... 21
2.1.8 Temperature Programmed Desorption ........................................................................ 22
2.1.9 Summary ........................................................................................................................... 23
v
2.2 Ni-Fe-CaO Catalyst .................................................................................................................. 23
2.2.1 Preparation of Catalyst on Gasifier Bed Material ........................................................ 23
2.2.2 Optimized Composition Performance and Cox Selectivity ...................................... 24
2.2.3 Stability Tests: Time-on-Stream and Regeneration ..................................................... 26
2.2.4 X-Ray Diffraction (XRD) ................................................................................................. 27
2.2.5 Temperature Programmed Reduction (TPR) ............................................................... 28
2.2.6 Scanning Electron Microscopy (SEM) .......................................................................... 29
2.2.7 Summary ........................................................................................................................... 30
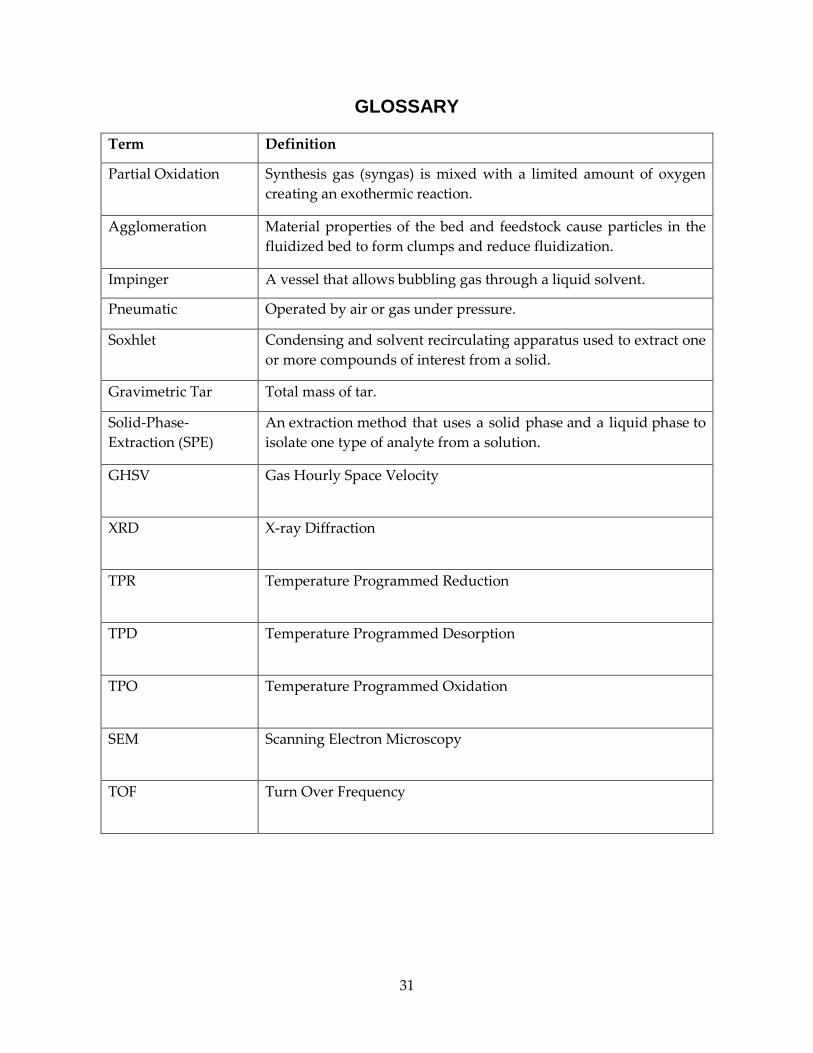
GLOSSARY .............................................................................................................................................. 31
REFERENCES .......................................................................................................................................... 32
LIST OF FIGURES Figure 1: Schematic Diagram of Gasifiesr With Installed Gravimetric Tar Sampling Train ........... 4
Figure 2: Temperature-Time Profile From Partial-Oxidation Gasification Run on 5-29-14 Using Feedstock S7 ................................................................................................................................................ 5
Figure 3: Temperature-Time Profile From Steam Gasification on 6-13-14 Without Partial Oxidation Using Feedstock S7 ................................................................................................................. 6
Figure 4: Tar Concentration of Xylene, Styrene, Naphthalene, and Unidentified Tar Compounds, and Total Measured Using SPE Method ......................................................................... 7
Figure 5: Boxplots for Hydrogen, Methane, Nitrogen, Carbon Monoxide, and Carbon Dioxide Measured During the Partial Oxidation (PO) and Control Experiments .......................................... 8
Figure 6: Gas Hourly Space Velocity (GHSV) Variation Over 2.5 wt%(Ni10Ca70Ce20) Catalyst 15
Figure 7: Activity as a Funtion of Temperature on Steam Reforming of Producer Gas Over 1wt%Ni and 2.5wt%(Ni10Ca70Ce20) Catalysts................................................................................... 16
Figure 8: Time on Stream & Regeneration Study 1% Ni and 2.5%(Ni10Ca70Ce20) for Steam Reforming of Producer Gas at 800 0C; GHSV = 12990 cc g-1 h-1 ...................................................... 17
Figure 9: Steam Reforming of Producer Gas by 2.5%(Ni10Ca70Ce20) (Without C2H4) ................. 18
Figure 10: Steam Reforming of Toluene by 2.5%(Ni10Ca70Ce20) .................................................... 19
Figure 11: XRD Patterns .......................................................................................................................... 20
Figure 12: Scanning Electron Microscopy (SEM) Image of Freshly Reduced (a,b) and Spent (c,d) 2.5% (Ni10Ca70Ce20) Catalyst with 5000 and 20000 Magnifications ............................................... 21
vi
Figure 13: TPR Profiles of Pure CARBO and Spent Catalyst ............................................................. 22
Figure 14: Effect of Temperature on the Steam Reforming Activity Over Various Ni-Fe-CaO Composites Varying Ni/(Ni+Fe) Ratios ................................................................................................ 25
Figure 15: Time on Stream and Regeneration Study .......................................................................... 27
Figure 16: XRD Patterns of Ni-Fe Alloy Peak ...................................................................................... 28
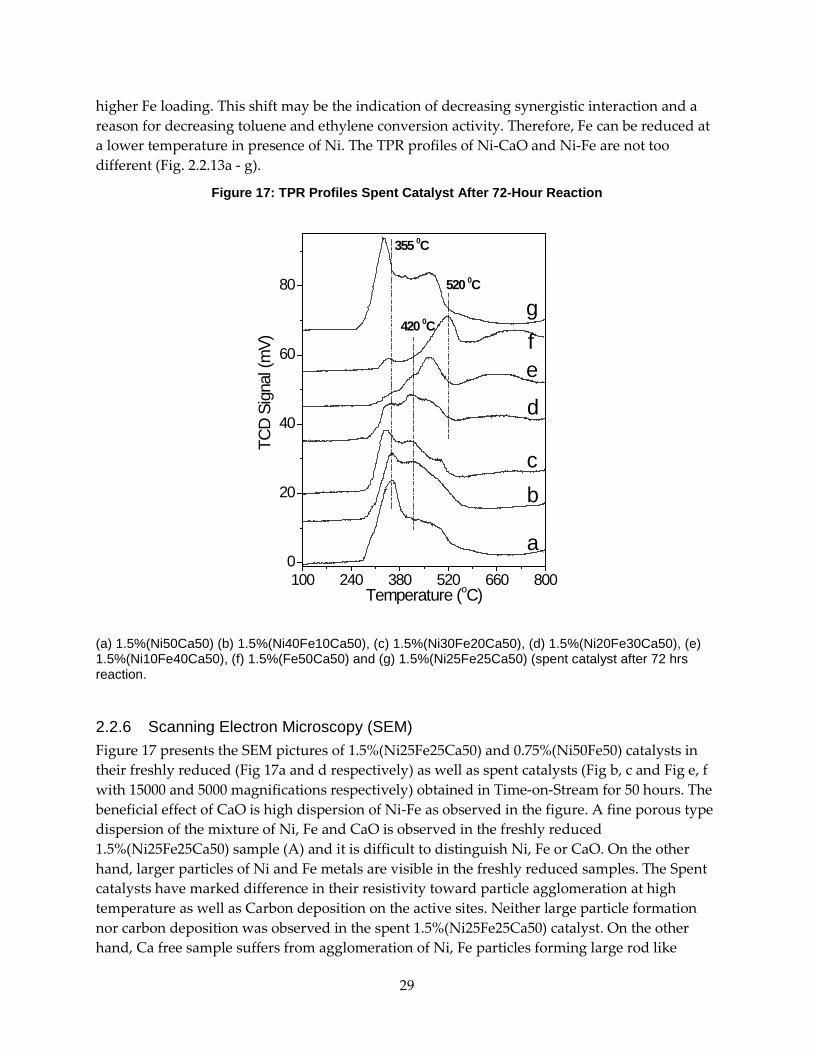
Figure 17: TPR Profiles Spent Catalyst After 72-Hour Reaction ....................................................... 29
Figure 18: SEM Images of Freshly Reduced and Spent Catalyst ....................................................... 30
LIST OF TABLES Table 1: Gravimetric Tar Results .............................................................................................................. 7
Table 2: Sample Data Averages, Standard Deviation, Confidence Intervals, and P-Value ............. 8
Table 3: Average (Avg), Standard Deviation (SD), Confidence Level (CL), and P-Values for Produced Gas during the Partial Oxidation and Control Experiments ............................................. 9
Table 4: Mass, Energy, and Element Balances ..................................................................................... 10
Table 5: Catalyst Loading of Ni, CaO and CeO2 Over Carbo-HSP Support by Wet Impregnation Method....................................................................................................................................................... 13
Table 6: Steam Reformation of Producer Gas Over 1wt% of Ni and 2.5wt% of Ni CaO and 2.5wt%Ni-CaO-CeO2 Catalysts at 700 0C .............................................................................................. 13
Table 7: Catalyst Loading of Ni, Fe, CaO, and CaO Over by Wet Impregnation Method ............ 24
Table 8: Steam Reforming of Producer Gas Over Ni-Fe-Cao Catalysts ........................................... 25
1
EXECUTIVE SUMMARY
Introduction With approximately 6,000 growers, California produces 80 percent of the world’s almonds and 100 percent of the U.S. commercial supply. Almonds also rank as the largest U.S. horticultural export. Almond processing produces large quantities of by-products that can be used for energy and other applications. Almond shells are one of the most important of these potential feedstocks produced during post-harvest processing after almonds are collected from the field. There are two basic types of almond post-harvest processing facilities: hullers that provide hulled (the outer coat), in-shell almonds as a final product, and hullers/shellers that yield hulled, shelled and almond meats as a final product. Each year California’s almond harvest typically produces more than a million tons of biomass waste including 454,000 tons of shells.
During the last several years, interest has increased in using these by-products at higher efficiency or in more local cogeneration facilities to support state level Renewable Portfolio Standards and reduce greenhouse gas emissions from fossil based fuel combustion. Understanding the chemical and thermal characteristics of almond shell feedstock is imperative to effectively using this by-product in gasification facilities to generate electricity.
Project Purpose and Process This study built on a previous project that charterized and evaluated the gasification behavior of almond shells - Increasing Renewable Energy by Almond Shell Gasification: Almond Biomass Characterization. The team investigated the potential to mitigate and remove tar from almond biomass gasification by using partial oxidation.
Removing tars is critical to the efficient design and operation of biomass gasification systems as tars can cause fouling, plugging, corrosion and breakdown of end-use equipment and contamination of downstream processes. Since downstream gas-cleaning steps are relatively expensive, the removing these tars in-situ by using catalyzed gasifier bed material can reduce these costs for power, and liquid-fuel production from biomass gasification. Capturing and disposal of tars adds cost to the overall conversion system because of equipment costs and potential hazardous waste disposal costs. Tar generation and separation without using the end product also adds to system energy losses. To solve this problem, tar generation must be reduced or improved tar removal methods developed. Catalytic tar removal is one of the common approaches applied to eliminate the tars and improve the hydrogen and carbon monoxide content in the cleaned producer gas.
The gasifier system was set up as described in the first report and partial oxidation implemented by using air instead of nitrogen for delivery of the almond feedstock. This partial oxidation effect was measured by taking tar samples at the top of the reactor.
The UC San Diego team evaluated using a gasifier bed material coated with an all-ready tested inexpensive and highly durable catalyst to reduce tars from producer gas as well as methods forapplying this catalyst. This Nickel/Iron catayst was found to have a higher tar removal capacity than the unaltered cermanic bed. However, to find improved tar reforming catalytic

2
material for application to this gasifier bed material, work on new materials was investigated. Two elements (Calcium Oxide and Cerium Dioxide) were added to the Nickel catalysts for higher dispersion and enhancing coke removal capacity and instead of expensive Cerium Dioxide, an alternative cheaper promoter, Iron, was successfully used. In experiments Iron was found to be superior. Ethlyene and Toluene tar surrogates were added to simulated producer gas and the change in composition before and after tar reforming is measured with a micro-gas chromatograph.
Project Results The effects of partial oxidation on gas concentrations were small but were statistically significant for hydrogen, methane, and carbon dioxide and when compared with the average values from the control experiment, partial oxidation resulted in a 4 percent decrease in hydrogen, 6 percent decrease in methane, and 10 increase increase in carbon dioxide. This change may indicate that some hydrogen and methane is reacting with the added oxygen inside the gasifier during the partial oxidation treatment to produce carbon dioxide or that their formation is reduced by intermediate reactions under partial oxidation. Reactor temperatures were found to be similar between partial oxidation and control runs implying no significant changes in the total heat release and heat transfer with the air flow rate used. The 1.5 percent Nickel/Iron/Calcium catalyst demonstrated the best stability and less coking effects, minimizing reforming of tars.
Project Benefits Although partial oxidation was tested for its potential to reduce tar, tar concentrations during the control experiments, using only steam, were found to be less than during the partial oxidation runs implying the added air had a negative effect. These limited experiments are, however, inconclusive and more extensive experimental investigations are required to evaluate impacts of air or oxygen flow rates and injection locations on tar yields for partial oxidation. The results obtained are particularly interesting for additional modeling of the reactor system that might also be used in attempting to optimize any future experiments.
Further testing is necessary regarding the effect of air or oxygen flow rate and injection location on tar species concentration. Consistent with the first report, developing improved tar sampling and analysis methods is recommended. To determine the commercial market potential for this method of tar removal requires additional study of the performance of the catalyst on producer gas from either a laboratory gasifer producing the full range of tar components or longer term tar reforming study at pilot scale.

3
CHAPTER 1: Tar Reforming and Tar Removal 1.1 Partial Oxidation This project investigated the potential for tar mitigation from almond biomass gasification by using partial oxidation.
Removing tars is critical to the design and operation of biomass gasification systems as tars can cause fouling, plugging, and breakdown of end-use equipment and contamination of downstream processes. Capturing and disposal of adds cost to the overall conversion system due to equipment costs and potential hazardous waste disposal costs where direct uses cannot be found. Tar generation and separation without utilization also adds to system energy losses. To solve this problem, tar generation needs to be reduced or improved tar removal methods need to be developed.
A potential solution is secondary air or oxygen injection within the gasification reactor (2,3). Narvaez et al. noticed that injecting secondary air in the freeboard resulted in a 70ºC rise in temperature and tar reduction from 28 to 16 g/m3. Pan et al. observed that a 20% secondary to primary air ratio for forest residue was sufficient to reduce approximately 90% weight percentage of total tar (from 3.70 to 0.42 g/m3) for air-steam gasification temperature between 830 and 850ºC.
1.1.1 Approach 1.1.1.1 Equipment Setup The gasifier system was set up as described in the previous report.To better monitor tar concentrations during the partial oxidation experiments; a tar sampling train was installed at the top of the reactor to pull a slip-stream of the produced syngas. The sample was extracted from the top of the disengagement zone of the reactor as shown in Figure 1. Sampled gases traveled vertically through a heated section containing a sampling shut off valve and thimble filter before descending to an impinger collection train. The heated section was held at 315°C using an external 624 watt heat tape with a PID controller and insulation. Impingers (500 mL) type were used in series for tar collection and were set up as prescribed in the BSI tar standard (1) as an alternate impinger setup method. Beads were placed in impinge numbers 1, 5, and 6 while isopropanol solvent was placed in all impingers except number 6. Impingers 1-4 were held at 40°C by heated bath, while impingers 5-6 were set in a 10°C salt water ice bath. After tar removal, the sampled gas traveled through the sampling pump followed by rotameter and dry gas meter before being exhausted to the laboratory ventilation system. The entire sampling train was leak checked prior to starting each trial.

4
Figure 1: Schematic Diagram of Gasifiesr With Installed Gravimetric Tar Sampling Train
1.1.1.2 Test Procedure and Input Rates Partial oxidation experiments were run using the generalized test procedures0F
1 and fluidization was provided by both air and steam. The primary fluidization was provided by steam at a steam-to-biomass ratio of unity as was done in the steam experiments reported earlier. Pneumatic delivery of the feedstock was provided by air instead of nitrogen. The air flow rate was set to 20 L/min.
Tar sampling began in each test when the reactor had reached nearly steady state and was continued for as long as possible during the run. Failure of the thimble filter was consistently the reason for termination of sampling, either by developing an excessive pressure drop due to blinding, or by rupture due to the high pressure differentials. Immediately after each run, the thimble filter was carefully removed and placed in isopropanol. Impingers were then drained of solvent and carefully rinsed with isopropanol. All plumbing down stream of filter and
1 Almond Biomass Characterization Report
5
upstream of impinger No.6 was also rinsed with isopropanol. All solvent used to rinse the equipment was combined with the impinger solvent and stored in a laboratory refrigerator until analysis.
Tar analysis consisted of first Soxhlet extracting tars from the filter and any solids captured in the impingers into additional isopropanol solvent, combining all tar-containing solvent, and then evaporating the solvent to give a tar mass fraction. Solids were primarily found on the thimble filter. However, in the event of a filter rupture, solids were also found in the leading impingers. In the event solids were found downstream of the filter, all solvent was vacuum filtered over Whatman FG/A filters. If vacuum filtered, the filters were also Soxhlet extracted. Details of the method can be found in the tar standard (1). Solid phase extraction (SPE) cartridges were used at the TS2 sampling point. SPE methods are described in the previous report.
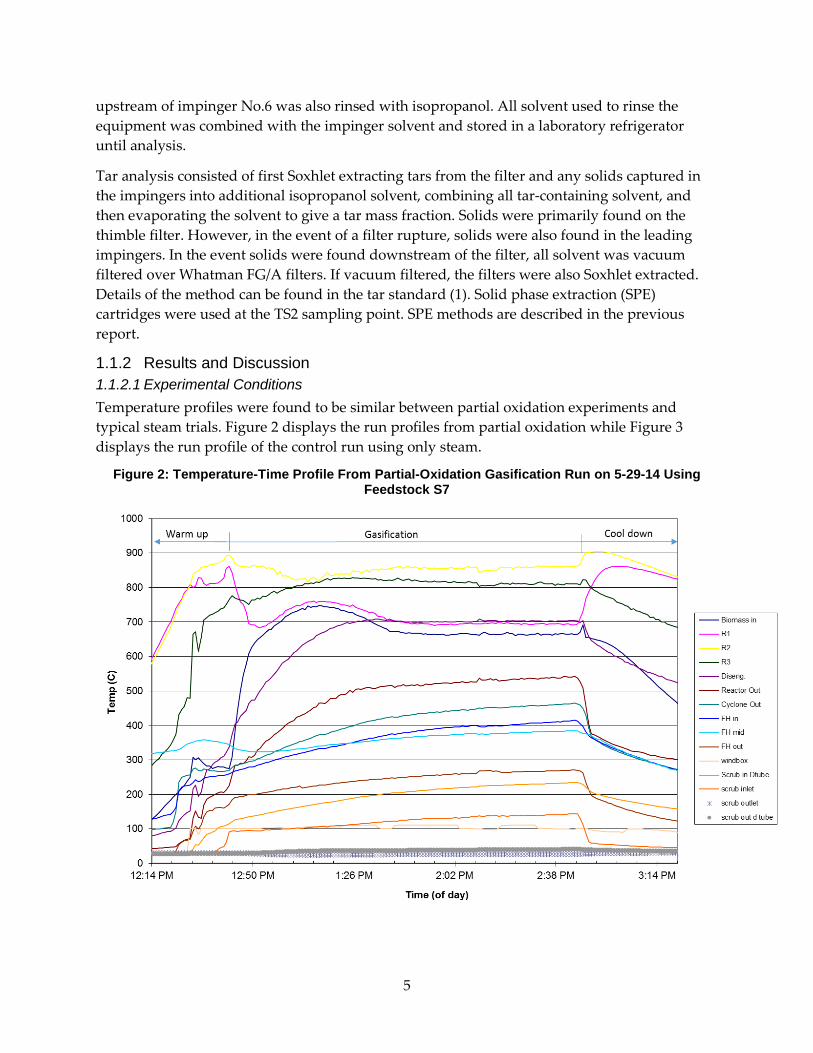
1.1.2 Results and Discussion 1.1.2.1 Experimental Conditions Temperature profiles were found to be similar between partial oxidation experiments and typical steam trials. Figure 2 displays the run profiles from partial oxidation while Figure 3 displays the run profile of the control run using only steam.
Figure 2: Temperature-Time Profile From Partial-Oxidation Gasification Run on 5-29-14 Using Feedstock S7

6
Figure 3: Temperature-Time Profile From Steam Gasification on 6-13-14 Without Partial Oxidation Using Feedstock S7
1.1.2.2 Agglomeration Bed agglomeration was not observed with the partial oxidation experiment. However, wall deposition in the upper reactor before the disengagement was found to be greater in the partial oxidation experiment than in the control run. Without further investigation, the statistical importance of this is unknown. Further investigation is recommended.
1.1.2.3 Gravimetric Tar Results Results of gravimetric tar analysis are displayed in the Table 1. Additional experiments would need to be completed in order to extract statistically meaningful results. The control run without partial oxidation resulted in lower tar yield than the test with partial oxidation. There are a number of possible reasons for this and the results are inconclusive in terms of the utility of partial oxidation as a control mechanism for tar. Clearly additional experiments are needed to evaluate this potential and to optimize any system of deployment.

7
Table 1: Gravimetric Tar Results
1.1.2.4 Solid Phase Extraction (SPE) Tar Results Tar was measured at the TS2 sampling point during both the partial oxidation and control experiments. Two SPE samples were taken during the partial oxidation experiment, and three samples were taken during the control experiment. Concentrations for xylene, styrene, naphthalene, unidentified compounds, and total tar are shown in Figure 4.
Figure 4: Tar Concentration of Xylene, Styrene, Naphthalene, and Unidentified Tar Compounds, and Total Measured Using SPE Method
Tar samples taken from sampling point TS2 during partial oxidation (PO) and control (C) experiments.
Table 2 shows the sample data, averages, standard deviations, confidence levels, and p-values for tar measured at TS2 using SPE method during the partial oxidation and control experiments. P-values were determined using ANOVA to determine statistical difference between mean values of the data sets ( =0.05). Results showed average values for xylene, styrene, naphthalene, unidentified compounds, and total tar for the partial oxidation experiment were higher than for the control experiment, consistent with the gravimetric result. ANOVA only indicated a statistically significant difference between the mean values for xylene and styrene.
0.00
0.20
0.40
0.60
0.80
1.00
1.20
1.40
PO #1 PO #2 C #1 C #2 C #3
Tar c
once
ntra
tion
(g/m
3)
xylene
styrene
naphthalene
unidentified
total

8
Table 2: Sample Data Averages, Standard Deviation, Confidence Intervals, and P-Value
Partial Oxidation Control P-value
Units: g/m3 PO #1
PO #2
Avg SD CL C#1 C#2 C#3 Avg SD CL
Xylene 0.17 0.13 0.15 0.03 0.23 0.00 0.00 0.00 0.00 0.00 0.00 0.002
Styrene 0.26 0.20 0.23 0.04 0.38 0.00 0.00 0.10 0.03 0.06 0.15 0.031
Naphthalene 0.33 0.00 0.17 0.23 2.11 0.00 0.00 0.09 0.03 0.05 0.13 0.372
Unidentified 0.45 0.16 0.30 0.21 1.86 0.00 0.00 0.12 0.04 0.07 0.18 0.121
Total 1.21 0.49 0.85 0.51 4.58 0.00 0.00 0.32 0.11 0.18 0.46 0.091
(α=0.05) for tar measured at TS2 using SPE method during the partial oxidation and control experiments
1.1.2.5 Gas Composition The product gas was analyzed using the online gas analyzer during both experiments. Figure 5 shows boxplots of concentrations for the gases. Tips of the whiskers indicate maximum and minimum values and upper and lower edges of the boxes indicate upper and lower quartiles for the datasets. Mean values are printed next to the boxes.
Figure 5: Boxplots for Hydrogen, Methane, Nitrogen, Carbon Monoxide, and Carbon Dioxide Measured During the Partial Oxidation (PO) and Control Experiments

9
Table 3 shows a statistical summary for the two experiments. P-values were determined using ANOVA (α =0.05) to determine significant differences between means. Results showed average gas concentrations for all the gases of the two experiments were very similar. The greatest difference observed was for carbon monoxide, which averaged 20.27 and 18.36% by volume for the partial oxidation and control experiment, respectively.
Table 3: Average (Avg), Standard Deviation (SD), Confidence Level (CL), and P-Values for Produced Gas during the Partial Oxidation and Control Experiments
Partial Oxidation Control P-value
Avg SD CL Avg SD CL
H2 43.22 0.98 0.16 44.87 0.87 0.16 2.738E-33
CH4 4.60 0.41 0.07 4.90 0.46 0.09 7.117E-8
N2 14.34 0.79 0.13 14.39 1.03 0.19 0.658
CO 17.58 0.57 0.10 17.48 0.57 0.11 0.171
CO2 20.27 0.50 0.08 18.36 0.39 0.07 5.771E-94
1.1.2.6 Mass, Energy, and Element Balances Mass, energy, and elemental balances were developed as described in the previous report using equations (1.2.1- 1.2.17). Nitrogen balance was ignored as remaining elemental balances used nitrogen assumptions in calculations. Results are displayed in Table 4.
10
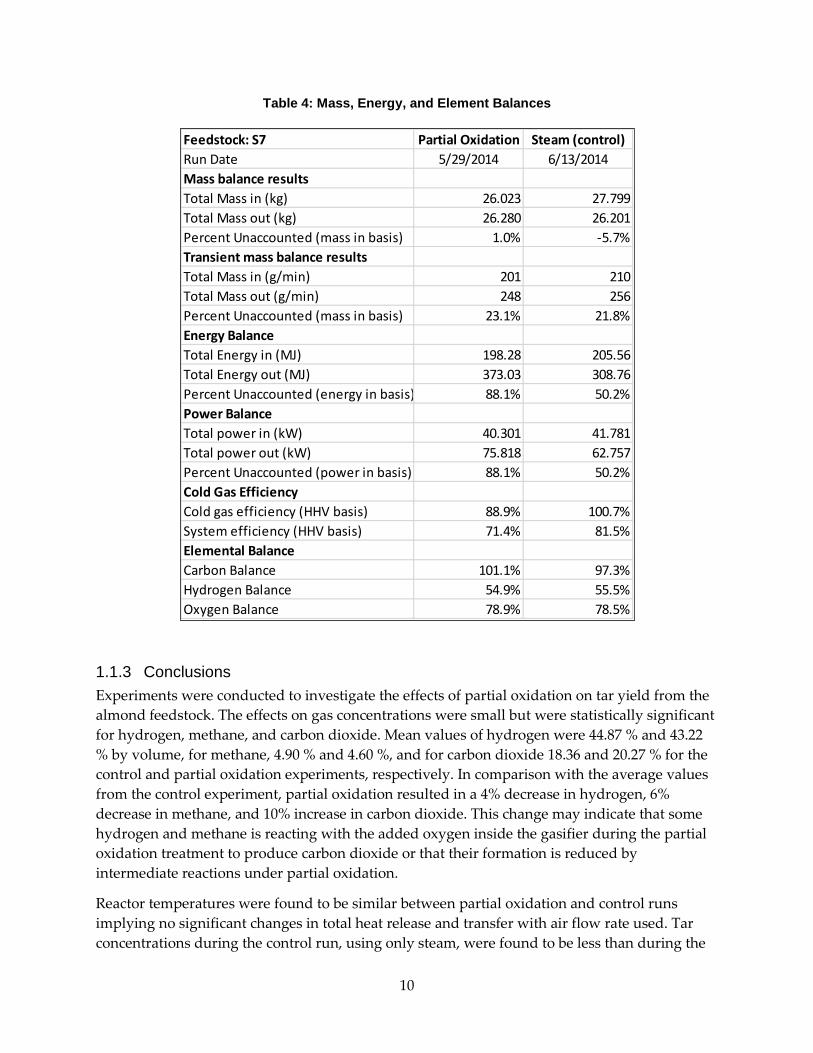
Table 4: Mass, Energy, and Element Balances
1.1.3 Conclusions Experiments were conducted to investigate the effects of partial oxidation on tar yield from the almond feedstock. The effects on gas concentrations were small but were statistically significant for hydrogen, methane, and carbon dioxide. Mean values of hydrogen were 44.87 % and 43.22 % by volume, for methane, 4.90 % and 4.60 %, and for carbon dioxide 18.36 and 20.27 % for the control and partial oxidation experiments, respectively. In comparison with the average values from the control experiment, partial oxidation resulted in a 4% decrease in hydrogen, 6% decrease in methane, and 10% increase in carbon dioxide. This change may indicate that some hydrogen and methane is reacting with the added oxygen inside the gasifier during the partial oxidation treatment to produce carbon dioxide or that their formation is reduced by intermediate reactions under partial oxidation.
Reactor temperatures were found to be similar between partial oxidation and control runs implying no significant changes in total heat release and transfer with air flow rate used. Tar concentrations during the control run, using only steam, were found to be less than during the
Feedstock: S7 Partial Oxidation Steam (control)Run Date 5/29/2014 6/13/2014Mass balance resultsTotal Mass in (kg) 26.023 27.799Total Mass out (kg) 26.280 26.201Percent Unaccounted (mass in basis) 1.0% -5.7%Transient mass balance resultsTotal Mass in (g/min) 201 210Total Mass out (g/min) 248 256Percent Unaccounted (mass in basis) 23.1% 21.8%Energy BalanceTotal Energy in (MJ) 198.28 205.56Total Energy out (MJ) 373.03 308.76Percent Unaccounted (energy in basis) 88.1% 50.2%Power BalanceTotal power in (kW) 40.301 41.781Total power out (kW) 75.818 62.757Percent Unaccounted (power in basis) 88.1% 50.2%Cold Gas EfficiencyCold gas efficiency (HHV basis) 88.9% 100.7%System efficiency (HHV basis) 71.4% 81.5%Elemental BalanceCarbon Balance 101.1% 97.3%Hydrogen Balance 54.9% 55.5%Oxygen Balance 78.9% 78.5%

11
partial oxidation run, implying a negative effect of the added air, however these limited experiments are inconclusive and more extensive experimental investigations are needed to evaluate impacts of air or oxygen flow rates and injection locations on tar yields for partial oxidation. The results obtained are particularly interesting for additional modeling of the reactor system that might also be used in attempting to optimize any future experiments.
12
CHAPTER 2: Catalytic Tar Reforming Biomass resources have received growing attention in recent years as a major renewable energy source to fulfill future energy needs. The thermo-chemical processing of biomass results in a producer gas that can be utilized for the production of power, fuels, and chemicals. The raw producer gas commonly includes H2, CO, CO2, H2O, CH4, C2-C5 hydrocarbons, tars, NH3 and H2S. The steam assisted gasification of biomass in a fluidized-bed gasifier produces a high energy content producer gas with tars. Tars present in a raw producer gas contain a mixture of aromatic hydrocarbons that are condensable at room temperatures. As one of the contaminants in a raw producer gas, tars present numerous challenges for the downstream applications of producer gas, particularly for power generation. Tars need to be removed before entering the downstream processes, as they can cause severe plugging and corrosion problems. Catalytic tar removal is one of the common approaches applied to eliminate the tars and improve the H2 and CO content in the cleaned producer gas. Since downstream gas-cleaning steps are relatively expensive, the removal of tars in-situ by the use of catalyzed gasifier bed material can reduce these costs for power, and liquid-fuel production from biomass gasification.
The project was aimed at the application of catalyzed gasifier bed materials in reducing tar from the producer gas. In previous work [1], the advantage of using inexpensive and highly durable ceramic bed material (Carbo HSP) was demonstrated. It was found that Ni/Fe impregnated into Carbo HSP has a higher tar removal capacity than the unaltered CARBO HSP. However, to find improved tar reforming catalytic material for application to the CARBO HSP gasifier bed material, work on new materials was investigated.
The principal problems of Ni based catalysts are sintering and coke deposition [2]. To address these issues the dispersion of Ni is addressed as well as including redox component. Previous studies show CeO2 as a promising promoter for Ni [3-8]. Therefore, CaO as well as CeO2 was added to Ni for higher dispersion and enhancing coke removal capacity. Further, instead of expensive CeO2, an alternative cheaper promoter Fe was successfully. In experiments Fe was found superior as compared to other metals like Cu, Mo, Co etc. [9-11]. Ni-Fe alloy formation has potential to form coke resistant property in the catalyst [12-16]. However, the role of CeO2 and Fe in promoting Ni accomplished differently and both were responsible for higher activity as well as coke resistance capacity. In this report, two promising catalysts were investigated including Ni/CaO/CeO2 and Ni/Fe/CaO in the consecutive sections.
2.1 NiO-CaO-CeO2 Catalyst 2.1.1 Preperation of Catalyst on Gasifier Bed Material The set of catalysts were prepared by wet impregnation method. 1 wt% of Ni and 2.5 wt% of Ni-CaO and Ni-CaO-CeO2 composites were impregnated on Carbo HSP support. Ni(NO3)2.4H2O, Ca(NO3)2.4H2O and (NH4)2Ce(NO3)6.6H2O were used as precursor and required amounts were dissolved in 5 ml of water to transparent solution. The solution was dropped on 25 g of Carbo HSP support mixing with glass rod until it is homogeneously wet. This was left

13
for 12 h and then kept at 100 0C in an oven for 12 h. The temperature of the furnace was raised by 50 degree up to 800 0C and calcined at this temperature for 12 h. By heating the impregnated nitrate salts, it decomposed to the corresponding oxides like NiO, CaO and CeO2 forming composites. Similar loading of Ni content was maintained in all the catalysts while various compositions with different CaO/CeO2 ratio from 0.0 to 1.0 were prepared. The compositions of the mixed oxides impregnated on Carbo HSP support were represented as following. For Ni:CaO (10:90) or Ni:CaO:CeO2 (10:70:20) ratio (by weight) were represented as 2.5wt %(Ni10Ca90) and 2.5wt%(Ni10Ca70Ce20)respectively. The loading of the active components on Carbo HSP support are mentioned in the following Table 5.
Table 5: Catalyst Loading of Ni, CaO and CeO2 Over Carbo-HSP Support by Wet Impregnation Method
Catalyst Nomenclature Catalyst Prepared(g) Ni (g) CaO (g) CeO2 (g) Total (wt.
%)
2.5%(Ni10Ca90) 25 0.0625 0.5625 0.0 2.5
2.5%(Ni10Ce90) 25 0.0625 0.0 0.5625 2.5
2.5%(Ni10Ca30Ce60) 25 0.0625 0.1875 0.375 2.5
2.5%(Ni10Ca50Ce40) 25 0.0625 0.3125 0.25 2.5
2.5%(Ni10Ca70Ce20) 25 0.0625 0.4375 0.125 2.5
1%Ni (Reference) 25 0.25 0.0 0.0 1.0
2.1.2 Optimized Composition: Performance and Cox Selectivity To determine an optimized composition, all the catalysts were tested for their activities to find an optimized composition with moderately high conversion and COx Selectivity. Table 6 shows the catalytic results of steam reforming of producer gas including C7H8, C2H4 and CH4 conversions, H2/CO ratio and CO2 selectivity at 700 0C.
Table 6: Steam Reformation of Producer Gas Over 1wt% of Ni and 2.5wt% of Ni CaO and 2.5wt%Ni-CaO-CeO2 Catalysts at 700 0C
Catalyst C7H8 C2H4 CH4 H2/CO CO2 Selectivity
1wt%Ni 20 21 - 0.71 44
2.5wt%(Ni10Ca90) 54 41 12 1.18 62
2.5wt%(Ni10Ce90) 56 40 4 1.06 47
2.5wt%(Ni10Ca30Ce60) 72 54 4 1.21 57
2.5wt%(Ni10Ca50Ce40) 79 63 3 1.43 64
2.5wt%(Ni10Ca70Ce20) 66 52 7 1.71 71
There are significant differences in the conversion of Toluene, Ethylene and COx selectivity with the variation in weight ratio of NiO, CaO and CeO2 components in the Ni-CaO-CeO2

14
composites over CARBO support. 1wt%Ni/CARBO catalyst was taken as reference showing very poor activity of nearly 20% of C7H8 and 21% C2H4 conversion. The presence of CaO in Ni catalyst increases C7H8 and C2H4 conversion to 53% and 41%, respectively. Instead of CaO, CeO2 addition into Ni/CARBO also gives almost similar results with 56% of Toluene conversion, but some reduction of CO2 selectivity from 62% to 47%. The addition of a redox component like CeO2 into Ni-CaO further increases C7H8 conversion to 72% by incorporating 30% (out of 2.5wt%) CeO2. To get the best performing composition, relative weight of CaO and CeO2 in the catalysts were varied. In the 2.5%(Ni10Ce90) catalysts, Toluene conversion activity reaches the optimum when 50% CaO is incorporated into it and activity goes down on further addition of CaO. However, CO2 Selectivity consistently increased with Ca addition and reached the maximum value at 70% Ca addition. Similar trend in C2H4 conversion is also observed and it goes through the highest of 63% over 50% Ca incorporated sample and then slightly going down to 52% over 70% Ca addition. CH4 conversion is around or below 10% over the catalysts under this condition. H2/CO ratio is high and it could be increased from 0.71 over 1wt%Ni to 1.71 over 2.5%(Ni10Ca70Ce20. This means higher CaO prevents C2H4 dehydrogenation and therefore leading to higher COx Selectivity due to less carbon deposition.
From the above comparisons, 2.5%(Ni10Ca70Ce20) shows high Toluene conversion and CO2 selectivity of 66.3% and 71% respectively. This catalyst was assumed to be fit for long run against carbon deposition. Therefore, further studies followed based on this particular composition mainly.
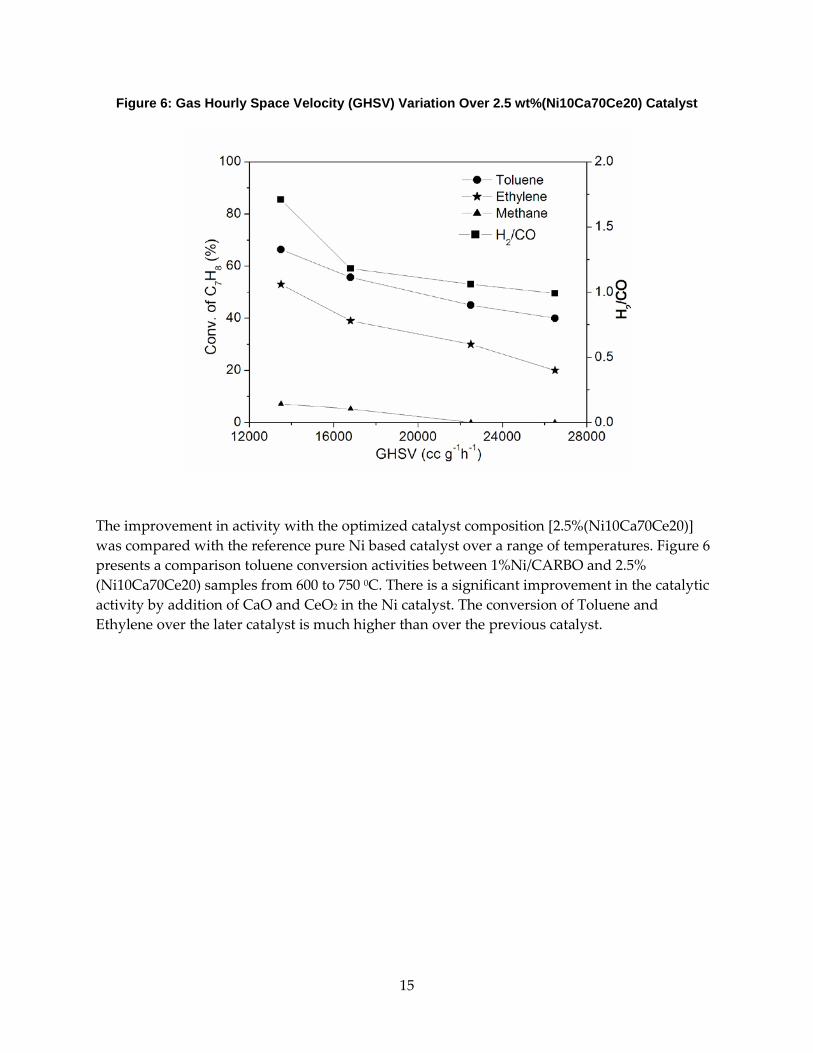
To find a suitable Volume-to-Weight ratio, the activity with changing Gas Hourly Space Velocity (GHSV) was evaluated for the best catalyst. Figure 6 shows Toluene conversion 2.5%(Ni10Ca70Ce20) with the GHSV variation from 12500 to 28500 cc gcat h-1. The conversion is increased with decreasing GHSV and it increases at a higher rate below 17000 cc g-1h-1. Conversion of Toluene goes down from 66.3% to 40% with a variation from 13500 to 26500 cc g-
1h-1. The H2/CO ratio also decreased from 1.71 to 0.99. This means the CO concentration is greater at higher space velocity indicating incomplete oxidation of Carbon during conversion of hydrocarbons as the sticking time is low for further oxidation. So for all experiments, a GHSV was 12990 cc g-1h-1.
15
Figure 6: Gas Hourly Space Velocity (GHSV) Variation Over 2.5 wt%(Ni10Ca70Ce20) Catalyst
The improvement in activity with the optimized catalyst composition [2.5%(Ni10Ca70Ce20)] was compared with the reference pure Ni based catalyst over a range of temperatures. Figure 6 presents a comparison toluene conversion activities between 1%Ni/CARBO and 2.5% (Ni10Ca70Ce20) samples from 600 to 750 0C. There is a significant improvement in the catalytic activity by addition of CaO and CeO2 in the Ni catalyst. The conversion of Toluene and Ethylene over the later catalyst is much higher than over the previous catalyst.
16
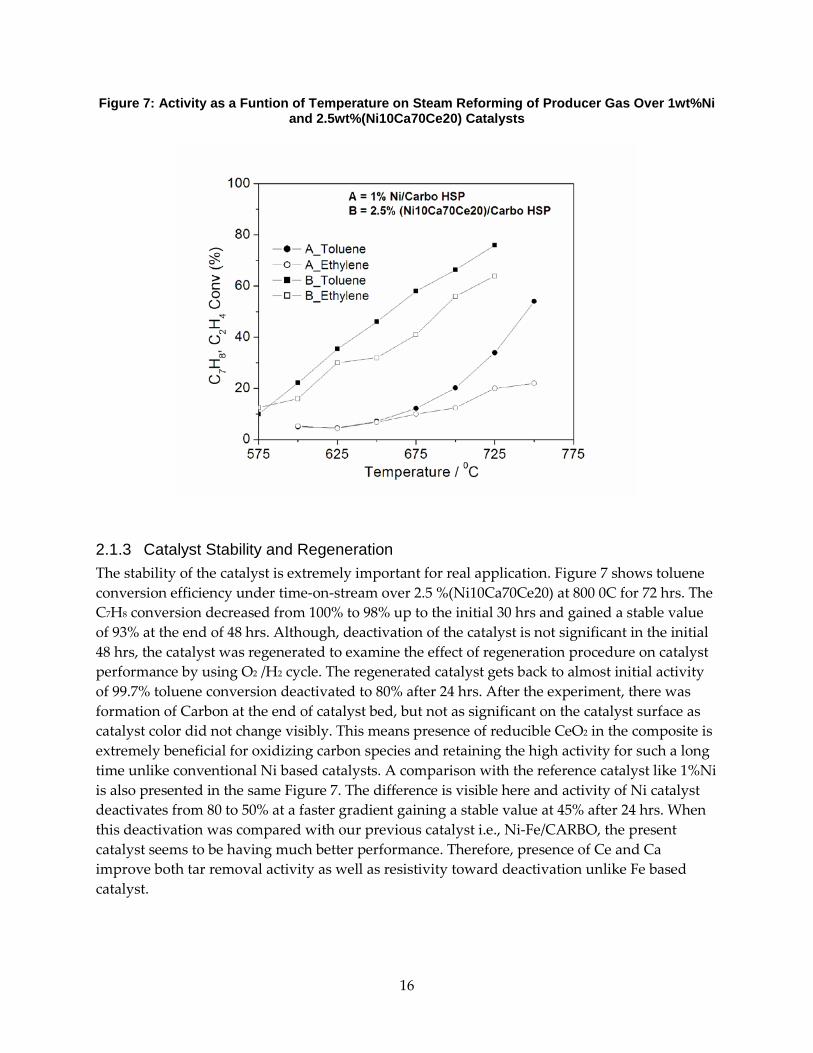
Figure 7: Activity as a Funtion of Temperature on Steam Reforming of Producer Gas Over 1wt%Ni and 2.5wt%(Ni10Ca70Ce20) Catalysts
2.1.3 Catalyst Stability and Regeneration The stability of the catalyst is extremely important for real application. Figure 7 shows toluene conversion efficiency under time-on-stream over 2.5 %(Ni10Ca70Ce20) at 800 0C for 72 hrs. The C7H8 conversion decreased from 100% to 98% up to the initial 30 hrs and gained a stable value of 93% at the end of 48 hrs. Although, deactivation of the catalyst is not significant in the initial 48 hrs, the catalyst was regenerated to examine the effect of regeneration procedure on catalyst performance by using O2 /H2 cycle. The regenerated catalyst gets back to almost initial activity of 99.7% toluene conversion deactivated to 80% after 24 hrs. After the experiment, there was formation of Carbon at the end of catalyst bed, but not as significant on the catalyst surface as catalyst color did not change visibly. This means presence of reducible CeO2 in the composite is extremely beneficial for oxidizing carbon species and retaining the high activity for such a long time unlike conventional Ni based catalysts. A comparison with the reference catalyst like 1%Ni is also presented in the same Figure 7. The difference is visible here and activity of Ni catalyst deactivates from 80 to 50% at a faster gradient gaining a stable value at 45% after 24 hrs. When this deactivation was compared with our previous catalyst i.e., Ni-Fe/CARBO, the present catalyst seems to be having much better performance. Therefore, presence of Ce and Ca improve both tar removal activity as well as resistivity toward deactivation unlike Fe based catalyst.
17
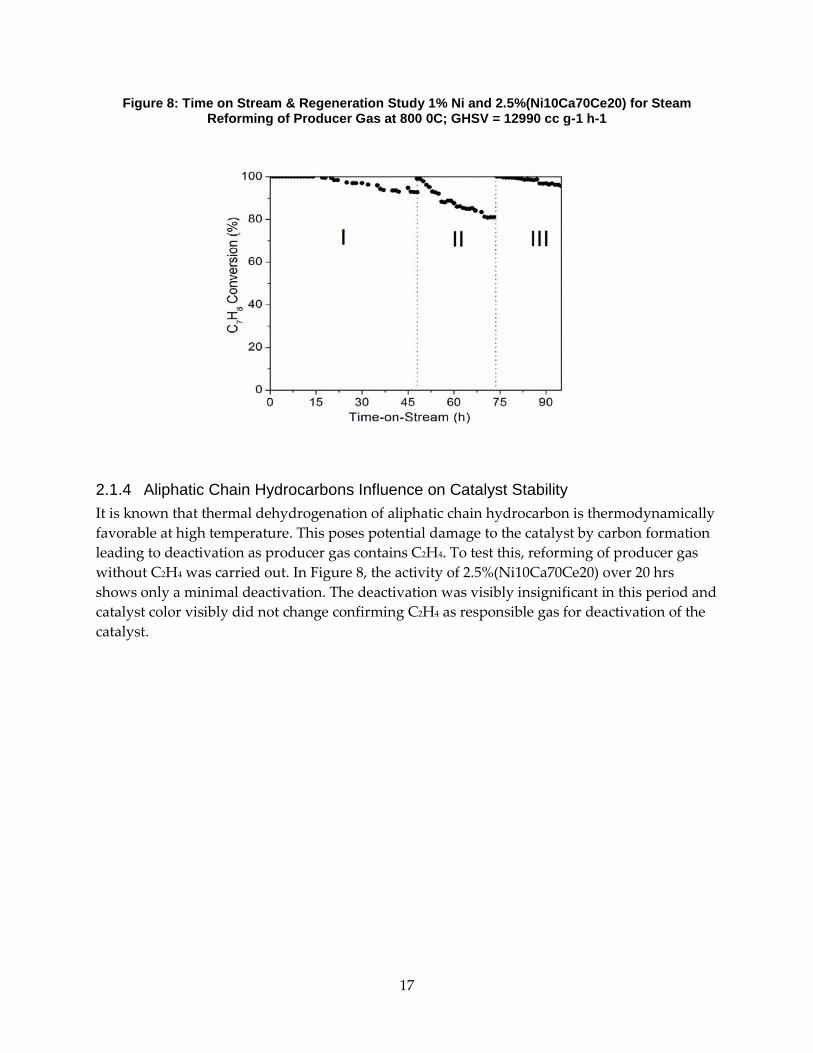
Figure 8: Time on Stream & Regeneration Study 1% Ni and 2.5%(Ni10Ca70Ce20) for Steam Reforming of Producer Gas at 800 0C; GHSV = 12990 cc g-1 h-1
2.1.4 Aliphatic Chain Hydrocarbons Influence on Catalyst Stability It is known that thermal dehydrogenation of aliphatic chain hydrocarbon is thermodynamically favorable at high temperature. This poses potential damage to the catalyst by carbon formation leading to deactivation as producer gas contains C2H4. To test this, reforming of producer gas without C2H4 was carried out. In Figure 8, the activity of 2.5%(Ni10Ca70Ce20) over 20 hrs shows only a minimal deactivation. The deactivation was visibly insignificant in this period and catalyst color visibly did not change confirming C2H4 as responsible gas for deactivation of the catalyst.

18
Figure 9: Steam Reforming of Producer Gas by 2.5%(Ni10Ca70Ce20) (Without C2H4)
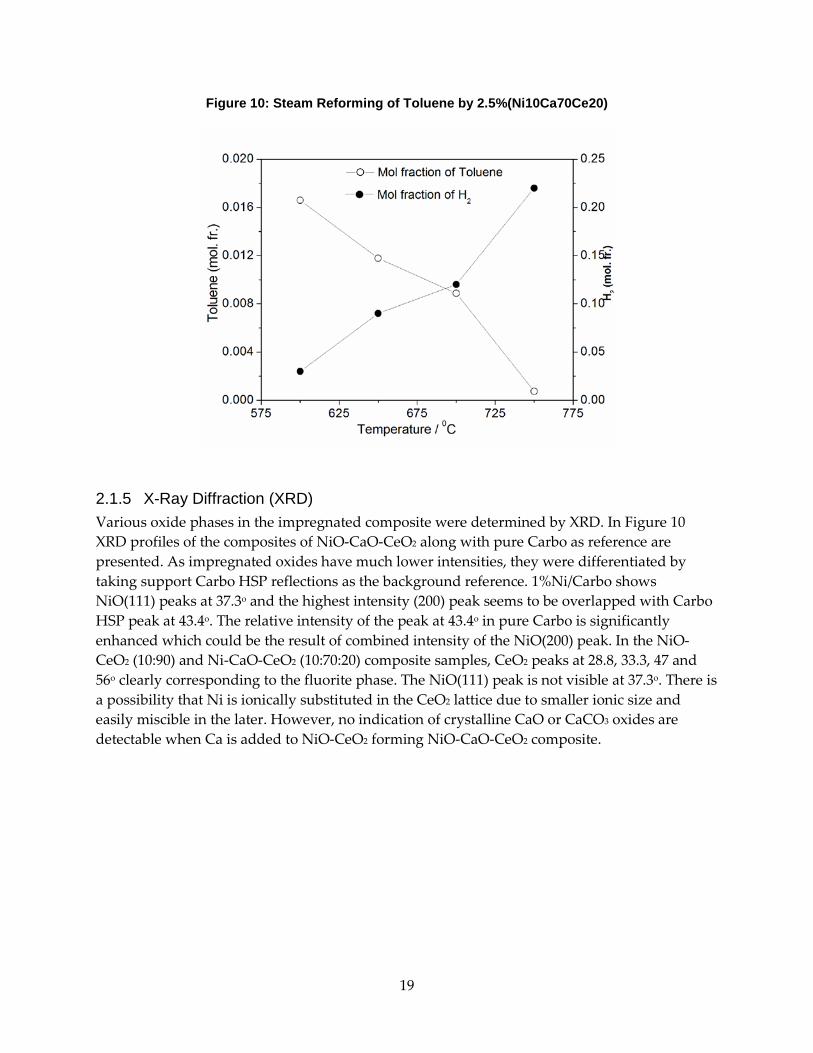
To check the effect of other gases on the toluene conversion, a separate reforming reaction of toluene alone was carried out. In Figure 9, the reduction of toluene and production of H2 (mol fraction) over the temperature range between 600 and 750 0C is shown. Toluene was almost completely converted to H2 and COx at 750 0C. The increase in H2 mole fraction was directly complementary to the disappearance of C7H8. As low as 4.5% CO was formed indicating almost stoichiometric steam reforming reaction occurring in the reactor. The spent catalyst color did not change which generally becomes black with the producer gas mixture. Therefore, C2H4 could be responsible for deposition of carbon during steam reforming of producer gas in the above reactions.
19
Figure 10: Steam Reforming of Toluene by 2.5%(Ni10Ca70Ce20)
2.1.5 X-Ray Diffraction (XRD) Various oxide phases in the impregnated composite were determined by XRD. In Figure 10 XRD profiles of the composites of NiO-CaO-CeO2 along with pure Carbo as reference are presented. As impregnated oxides have much lower intensities, they were differentiated by taking support Carbo HSP reflections as the background reference. 1%Ni/Carbo shows NiO(111) peaks at 37.3o and the highest intensity (200) peak seems to be overlapped with Carbo HSP peak at 43.4o. The relative intensity of the peak at 43.4o in pure Carbo is significantly enhanced which could be the result of combined intensity of the NiO(200) peak. In the NiO-CeO2 (10:90) and Ni-CaO-CeO2 (10:70:20) composite samples, CeO2 peaks at 28.8, 33.3, 47 and 56o clearly corresponding to the fluorite phase. The NiO(111) peak is not visible at 37.3o. There is a possibility that Ni is ionically substituted in the CeO2 lattice due to smaller ionic size and easily miscible in the later. However, no indication of crystalline CaO or CaCO3 oxides are detectable when Ca is added to NiO-CeO2 forming NiO-CaO-CeO2 composite.

20
Figure 11: XRD Patterns
(a) CARBO, (b) 1%Ni, (c) 2.5%(Ni10Ce90), (d) 2.5%(Ni10Ca70Ce20) and (e) Spent 2.5%(Ni10Ca70Ce20) catalysts.
It could be possible that Calcium oxides are partially substituted in CeO2 or it is not in proper crystalline form. The particle sizes of CeO2 were calculated by using Scherrer formula. The crystallite sizes are 20 nm and 16 nm in NiO-CeO2 and Ni-CaO-CeO2 composites, respectively. The smaller size in the later sample indicates that Ca is incorporated into CeO2 and this stops growth into larger particles. The spent catalyst (2.5%(Ni10Ca70Ce20) shows CeO2 peaks intact even after Time-on-Stream experiment at high temperature. This is because reduced Ce2O3 is easily oxidized to CeO2 when removed from the reactor. However, a Ni(111) peak at 44.6o is visible indicating formation of larger particle formation.
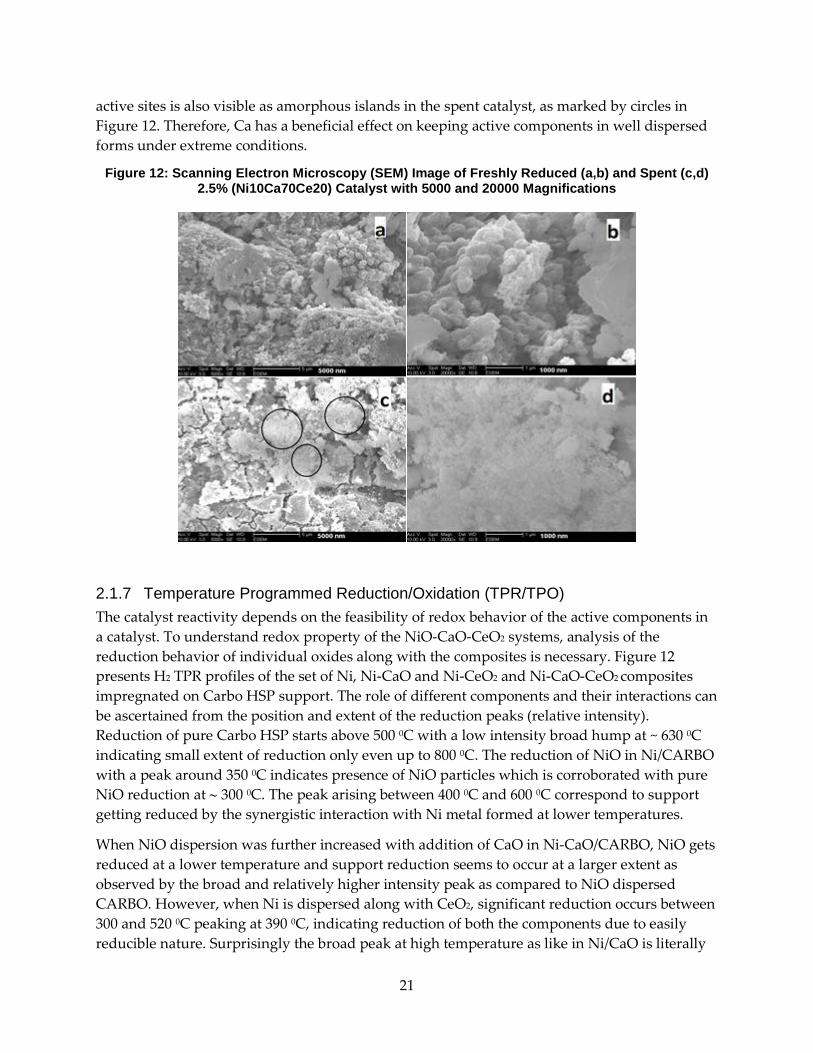
2.1.6 Scanning Electron Microscopy (SEM) Surface microstructure which tell us about the nature of dispersion of the active components in the catalyst, are displayed in Figure 12. The figure shows SEM picture of freshly reduced as well as spent catalyst obtained in time-on-stream and regeneration cycles carried over 2.5%(Ni10Ca70Ce20). Although, the components of impregnating oxides cannot be differentiated, a fine porous type dispersion of the mixture of Ni, CaO and CeO2 is observed. Interestingly, the resistivity toward particle agglomeration at high temperature is obvious, although particles become more compact. However, Carbon deposition accumulated on the
21
active sites is also visible as amorphous islands in the spent catalyst, as marked by circles in Figure 12. Therefore, Ca has a beneficial effect on keeping active components in well dispersed forms under extreme conditions.
Figure 12: Scanning Electron Microscopy (SEM) Image of Freshly Reduced (a,b) and Spent (c,d) 2.5% (Ni10Ca70Ce20) Catalyst with 5000 and 20000 Magnifications
2.1.7 Temperature Programmed Reduction/Oxidation (TPR/TPO) The catalyst reactivity depends on the feasibility of redox behavior of the active components in a catalyst. To understand redox property of the NiO-CaO-CeO2 systems, analysis of the reduction behavior of individual oxides along with the composites is necessary. Figure 12 presents H2 TPR profiles of the set of Ni, Ni-CaO and Ni-CeO2 and Ni-CaO-CeO2 composites impregnated on Carbo HSP support. The role of different components and their interactions can be ascertained from the position and extent of the reduction peaks (relative intensity). Reduction of pure Carbo HSP starts above 500 0C with a low intensity broad hump at ~ 630 0C indicating small extent of reduction only even up to 800 0C. The reduction of NiO in Ni/CARBO with a peak around 350 0C indicates presence of NiO particles which is corroborated with pure NiO reduction at ∼ 300 0C. The peak arising between 400 0C and 600 0C correspond to support getting reduced by the synergistic interaction with Ni metal formed at lower temperatures.
When NiO dispersion was further increased with addition of CaO in Ni-CaO/CARBO, NiO gets reduced at a lower temperature and support reduction seems to occur at a larger extent as observed by the broad and relatively higher intensity peak as compared to NiO dispersed CARBO. However, when Ni is dispersed along with CeO2, significant reduction occurs between 300 and 520 0C peaking at 390 0C, indicating reduction of both the components due to easily reducible nature. Surprisingly the broad peak at high temperature as like in Ni/CaO is literally

22
vanished. This could happen probably because more Ni is attached to CeO2 giving less interaction with the support. With the composite mixture of NiO+CaO+CeO2 impregnated on Carbo HSP, the cumulative reduction profile becomes more interesting. It seems both CaO and CeO2 reduction shift to higher temperature as in Figures 2.2.8A –c and d.
Figure 13: TPR Profiles of Pure CARBO and Spent Catalyst
(A) Pure CARBO (a), 1%Ni (b), 2.5%(Ni10Ca90) (c), 2.5%(Ni10Ce90) (d) and 2.5%(Ni10Ca70Ce20) (e) catalysts ; (B) TPO profiles of Spent (72 hrs) (a) 1%Ni and (b) 2.5%(Ni10Ca70Ce20) Catalyst.
1%Ni and 2.5%(Ni10Ca70Ce20) as shown in Figure 13. The carbon oxidation peak is observed around 600 0C in both the catalysts. The low intensity of TPO signal in 1%Ni catalyst indicates only slight deposition of carbon on the catalyst. However, deactivation in this catalyst was significant. This could be due to agglomeration of Ni particles lowering the toluene removal activity. On the other hand, there is some carbon deposition on 2.5%(Ni10Ca70Ce20). However, catalyst deactivation was minimal of the range below 10%.
2.1.8 Temperature Programmed Desorption In Figure 13A presents the CO2 desorption profile of 2.5%(Ni10Ce90)/CARBO, 2.5%(Ni10Ca50Ce40)/CARBO and 2.5%(Ni10Ca70Ce20)/CARBO catalysts. Obviously, a small peak at 320 0C corresponds to only little amount of CO2 desorption from 2.5%Ni10Ce90/CARBO sample indicating lacking of basic sites. However, the number of basic sites significantly increased with Ca addition into Ni-CeO2, as projected by the peak intensity in Figure 13 B and Celsius. The peak positions occur at 320, 370 and 410 0C for the above mentioned catalysts, respectively and the shift toward higher temperature could be due to stronger basic nature of the catalyst with higher extent of CaO presence. The desorption peak in all the catalysts are not broad and the tail end below 500 0C. This indicates Ca is interacting with other components like

23
CeO2 and therefore forms an unstable carbonate species that decomposes at lower temperatures.
The TPD results have several implications in explaining the catalyst activity as well as the stability toward carbon deactivation. It is known that acid sites promotes carbon residue formation from dehydrogenation of alkenes and get deposited on the catalyst which ultimately deactivates the catalyst. Table 6 shows that COx selectivity is gradually increased with Ca addition into Ni-CeO2 indicating less carbon deposition. In these catalysts, high oxidation state of Ce4+ species could act as a Lewis acid center and therefore lowering Ce content (increasing CaO content) will increase COx Selectivity indicating deposition on the surface. As CaO has higher basic character and they form a composite, unstable carbonate species are formed that can react with deposited carbon producing COx.
2.1.9 Summary A series of catalysts containing NiO-CaO-CeO2 composite deposited on CARBO HSP support was prepared by wet impregnated were prepared. 2.5%(Ni10Ca70Ce20) was found the optimum composition with high toluene conversion as well as CO2 selectivity indicating lower carbon deactivation. C7H8 conversion activity was deactivated from 100% to 98% up to initial 30 hrs and gained a stable value of 93% at the end of 48 hrs. After regeneration with O2/H2 cycle, the catalyst activity gets back to almost initial activity of 99.7% toluene conversion deactivated to 80% after 24 hrs. CaO had a beneficial role in higher dispersion of Ni and CeO2 as well as enhancing basicity character which led to lower carbon deactivation.
2.2 Ni-Fe-CaO Catalyst In the previous study Ni was diluted with CaO and CeO2 was added as a redox component to enhance the carbon oxidation probability on the surface. The utilization of rare earth component is expensive and an alternative substitute is considered in this study in which a Ni-Fe-CaO catalyst is investigated.
2.2.1 Preparation of Catalyst on Gasifier Bed Material The catalysts were prepared by wet impregnation method. 0.75 wt% of Ni, Fe and 1.5 wt% of Ni-Fe-CaO were deposited on Carbo HSP support. Ni(NO3)2.4H2O, Fe(NO3)3.9H2O and Ca(NO3)2.4H2O were used as precursor and required amounts were dissolved in 5 ml of water to transparent solution. The solution was dropped on 20 g of Carbo HSP support mixing with glass rod until it is homogeneously wet. This was left for 12 h and then kept at 110 0C in an oven for 12 h. The temperature of the furnace was raised by 50 degree up to 800 0C and calcined at this temperature for 12 h. By heating the impregnated nitrate salts, it decomposed to the corresponding oxides NiO, Fe2O3 and CaO abd forming composites. Similar loading of CaO content in all the catalysts was maintained while various compositions with different Ni/Fe ratio from 0.0 to 1.0 were prepared. The composition of the catalysts are presented as following. For example: in 1.5%(Ni25Fe25Ca50) catalyst, Ni, Fe and CaO are present by 25%, 25% and 50% respectively. The loading of the active components on Carbo HSP support are mentioned in the following Table 7.

24
Table 7: Catalyst Loading of Ni, Fe, CaO, and CaO Over by Wet Impregnation Method
Catalyst on Carbo HSP Nomenclature Prepared(g) Ni (g) Fe (g) CaO (g) Loading
(%)
0.75%Ni 20 0.15 0.0 0.0 0.75
1.5%(Ni50Ca50) 20 0.15 0.0 0.15 1.5
1.5%(Ni40Fe10Ca50) 20 0.12 0.03 0.15 1.5
1.5%(Ni30Fe20Ca50) 20 0.09 0.06 0.15 1.5
1.5%(Ni25Fe25Ca50) 20 0.075 0.075 0.15 1.5
1.5%(Ni20Fe30Ca50) 20 0.06 0.09 0.15 1.5
1.5%(Ni10Fe40Ca50) 20 0.03 0.12 0.15 1.5
1.5%(Fe50Ca50)/CARBO 20 0.0 0.15 0.15 1.5
0.75%(Ni50Fe50)/CARBO 20 0.075 0.075 0.0 0.75
0.75%Fe/CARBO 20 0.0 0.15 0.0 0.75
2.2.2 Optimized Composition Performance and Cox Selectivity A preliminary comparison of the catalyst activity was done at 700, 750 and 800 0C for Toluene removal from producer gas as presented in Figure 14. It shows the promoting effect of CaO addition to Ni and Ni-Fe combinations over the temperature range. The activity of Ni and Ni-Fe is significantly promoted by the addition of CaO. This observation was supported with catalyst without CaO showing lower activity. The catalyst containing Fe alone too showed slight increase in activity with the addition of CaO. The amount of Ni in 0.75% Ni on the Carbo HSP support could be reduced by substituting Fe with changing ratio (total weight of Ni and Fe loading 0.75%) keeping activity high.

25
Figure 14: Effect of Temperature on the Steam Reforming Activity Over Various Ni-Fe-CaO Composites Varying Ni/(Ni+Fe) Ratios
0
20
40
60
80
100
0.00.20.40.60.81.0Ni/(Ni+Fe)
C 7H8 C
onve
rsio
n (%
)
700 oC 750 oC 800 oC
Table 8: Steam Reforming of Producer Gas Over Ni-Fe-Cao Catalysts
Catalyst on CARBO C7H8 C2H4 CH4 COx Sel Excess H2(% ) H2/CO TOF (s-1)
0.75%Ni 44 40 3* 77 71 0.88 0.0015
1.5%(Ni50Ca50) 92 88 7 83 177 1.28 0.0037
1.5%(Ni40Fe10Ca50) 91 84 7 88 186 1.41 0.0047
1.5%(Ni30Fe20Ca50) 80 71 2* 96 155 1.32 0.0054
1.5%(Ni25Fe25Ca50) 68 64 2* 98 121 1.19 0.0055
1.5%(Ni20Fe30Ca50) 54 45 2* 89 116 1.20 0.0054
1.5%(Ni10Fe40Ca50) 31 28 3* 73 72 1.07 0.006
1.5%(Fe50Ca50) 20 19 4* 60 44 0.82 -
0.75%Fe 18 25 4* 52 32 0.72 -
The product distribution after reforming is measured at the outlet of the flow reactor with the micro-GC. A detailed analysis of the activities of the catalysts with different reactant composition at 750 0C was conducted. The catalytic conversions of C7H8, C2H4 and CH4 for the steam reforming of producer gas as well as H2/CO ratio and COx selectivity over the Ni, Fe and Ni-Fe-CaO samples at 750 0C are presented in Table 8. Pure Ni/ Fe samples have low activity showing only 44 and 18% of Toluene conversion respectively. Addition of CaO along with Ni/or
26
Fe was found to be more effective with Ni showing an enhancement from 44% to 92% conversion over Ni-CaO. On the contrary, CaO addition along with Fe on Carbo HSP had almost no effect increasing from 18 to 20%. A mixture of Ni and Fe varying weight ratio showed an interesting trend. A 50%Ni+50%Fe mixture without CaO on the Carbo HSP support converted 40% Toluene.
Toluene conversion increased significantly when equal weight of CaO (0.75%) was further added to Ni or Ni/Fe mixtures. The variation of Fe ratio in Ni-Fe mixture showed that as the Ni/Fe ratio is decreased, the toluene conversion activity also decreased from 92% on 1.5% (Ni40Fe10Ca50) to 31% on 1.5%(Ni10Fe40Ca50). The toluene conversion is still higher with the 1.5%(Ni20Fe30Ca50) catalyst as compared to 0.75%Ni catalyst. Thus, higher activity was achieved by using much less Ni loading. Similarly, C2H4 conversion also decreased trend from 84% for 1.5%(Ni40Fe10Ca50) to 28% for 1.5%(Ni10Fe40Ca50). However, as Fe concentration was increased, CH4 conversion changed from positive to negative value gradually. This means that CH4 was formed at higher Fe loading which could be due to methane formation by toluene dissociation. However, the selectivity toward COx due to hydrocarbon reforming reaches an optimum value at 1.5%(Ni25Fe25Ca50). The Steam reforming of tar as well as hydrocarbons adds extra H2 enriching energy value of the Producer gas. The excess H2 reached an optimum of 186% in 1.5%(Ni40Fe10Ca50) and then decreases with increasing Fe content. Similarly, H2/CO ratio reached a maximum value of 1.41 on 1.5%(Ni40FeCa50) and then decreased with decreasing Ni/Fe ratio.
Turn Over Frequency (TOF) for the Ni atom was calculated to examine how CaO addition or Ni-Fe alloy formation affects the activity of Ni in the Ni based catalysts. With the addition of CaO to Ni, the TOF increases from 0.0015 to 0.0037 s-1 due to higher dispersion. When Fe added into Ni-CaO, the TOF gradually increases from 0.0037 to 0.006 s-1. This indicates the Ni activity is positively promoted by both Fe and CaO addition and Ni-Fe alloy formation does not affect the activity of Ni.
2.2.3 Stability Tests: Time-on-Stream and Regeneration As 1.5%(Ni25Fe25Ca50) had the highest selectivity toward COx formation as well as a high toluene removal capacity indicating an optimum performance, this formulation was chosen for further studies. Steam reforming over this catalyst was carried out for 50 hours and did decrease the toluene conversion from 93% to 79%, but subsequently remained steady after 10 hours of operation (Figure 3). Although, there was deposition of carbon in the catalyst bed, the activity of the catalyst was significantly affected much even after 50 hours. A TPO analysis of the spent catalyst (Quantachrome Instrument (ChemBET-3000 TPR/TPO/TPD) did not give any indication of significant catalyst blockage by carbon. This indicates that the catalyst was much more resistant to carbon deactivation as compared to the conventional Ni based catalysts.

27
Figure 15: Time on Stream and Regeneration Study
0 10 20 30 40 500
20
40
60
80
100
b
a
C 7H8 C
onv
(%)
Time-on-Stream (h)
(a) 0.75% (Ni50Fe50) and (b) 1.5 %(Ni25Fe25Ca50) catalysts for Steam reforming of Producer gas.
2.2.4 X-Ray Diffraction (XRD) The impregnated phases in the Ni-Fe-CaO composite catalysts were determined by XRD. As the reforming reactions were carried out on the reduced phases of the active metals, characterizations of the reduced samples were more important than the fresh oxides. Figure 15 presents the XRD patterns of the set of Ni-Fe-CaO composites (reduced in H2 at 800 0C). Here the reduced Carbo HSP was used as reference to distinguish the respective peaks of Ni, Fe or NiFe alloy formed. The highest intensity peaks of cubic Ni(111) in NiCa/Carbo are observed at 44.6o and 51.90. Similarly, cubic Fe peak was observed at 44.820 in in FeCa/Carbo. In presence of Fe with Ni, there is possibility of Ni-Fe alloy formation because both are miscible with similar atomic radii. The highest intensity peak of NiFe alloy is located at 43. 90. With gradually increasing of Fe content into Ni, the peak intensity at 44. 50 is lowered as expected (Fig 2.2.12 b - d) and the peak position also shifted to lower angle. In Figure 1d, the Ni peak is very broad and extended toward lower angle indicating new peaks. The broadness of the peak indicates high dispersion of smaller Ni particles along with Fe. However, at higher content of Fe in Ni (Fig 2.2.12 e & f), the new peak belong to neither Ni nor Fe. This means Ni and Fe forms an alloy that has the highest peak at 440. The profile of the spent catalyst of 1.5%(Ni25Fe25Ca50) (time-on-stream) is displayed in Fig –h, showing a distinct peak of Ni-Fe alloy. However, the existence of Ca oxide related peaks are not observed. This may be probably because of not in crystalline form. As CaO is well dispersed, Ni or NiFe particles get good dispersion on the support.

28
Figure 16: XRD Patterns of Ni-Fe Alloy Peak
40 43 46 49 52 55
*
*
* NiFe alloy
*
Fe(111)
Ni(1
10)
Ni(111)
Ni25Fe25-TOS
Fe50
Ni10
Ni20
Ni30
Ni40
Ni50
1%Ca-Carbo
h
g
f
e
d
c
b
a
Inte
nsity
(Nor
mal
ized)
2 Theta (degree)
(a) 1%Ca, (b) 1.5%(Ni50Ca50), (c) 1.5%(Ni40Fe10Ca50), (d) 1.5%(Ni30Fe20Ca50), (e) 1.5%(Ni20Fe30Ca50), (f) 1.5%(Ni10Fe40Ca50), (g) 1.5%(Fe50Ca50) and (h) spent catalyst of 1.5%(Ni25Fe25Ca50) ; * Ni-Fe alloy peak
2.2.5 Temperature Programmed Reduction (TPR) Figure 16 presents the temperature programmed reduction (TPR) profile of Ni-CaO, Fe-CaO and Ni-Fe-CaO containing samples. The reduction profiles of the oxides characterize the influence of Fe on the reducibility Ni and vice versa. From the previous studies, NiO could be reduced with an almost single peak around 350 0C. Therefore, the peak arising at 355 0C is due to reduction of NiO species in the Ni-CaO or Ni-Fe-CaO composites (Fig. 2.2.13a – e). Although reduction peak of Fe-CaO is located at 520 0C (Fig. 2.2.13f), Fe species in the Ni-Fe-CaO composites occur at a lower temperature around 420 0C. This could be due to synergistic interaction between Ni and Fe. Interestingly, Ni oxide reduction temperature does not change, rather peak shift slightly toward lower temperature at higher loading of Fe into Ni-CaO. The reason could be as follows. The oxide form of Ni and Fe may not result in a solid solution. So, as Ni metal is formed at lower temperature, Fe oxide will get dissociated hydrogen from Ni surface by spill over process leading to reduction of Fe oxide at lower temperature. As the Ni/Fe ratio is lowered, the intensity of lower temperature reduction peak related to Ni oxide reduction is reduced. The relative peak intensity between 360 and 510 0C become more pronounced with
29
higher Fe loading. This shift may be the indication of decreasing synergistic interaction and a reason for decreasing toluene and ethylene conversion activity. Therefore, Fe can be reduced at a lower temperature in presence of Ni. The TPR profiles of Ni-CaO and Ni-Fe are not too different (Fig. 2.2.13a - g).
Figure 17: TPR Profiles Spent Catalyst After 72-Hour Reaction
100 240 380 520 660 8000
20
40
60
80 520 0C
355 0C
420 0Cgfe
d
cb
a
TCD
Sign
al (m
V)
Temperature (oC)
(a) 1.5%(Ni50Ca50) (b) 1.5%(Ni40Fe10Ca50), (c) 1.5%(Ni30Fe20Ca50), (d) 1.5%(Ni20Fe30Ca50), (e) 1.5%(Ni10Fe40Ca50), (f) 1.5%(Fe50Ca50) and (g) 1.5%(Ni25Fe25Ca50) (spent catalyst after 72 hrs reaction.
2.2.6 Scanning Electron Microscopy (SEM) Figure 17 presents the SEM pictures of 1.5%(Ni25Fe25Ca50) and 0.75%(Ni50Fe50) catalysts in their freshly reduced (Fig 17a and d respectively) as well as spent catalysts (Fig b, c and Fig e, f with 15000 and 5000 magnifications respectively) obtained in Time-on-Stream for 50 hours. The beneficial effect of CaO is high dispersion of Ni-Fe as observed in the figure. A fine porous type dispersion of the mixture of Ni, Fe and CaO is observed in the freshly reduced 1.5%(Ni25Fe25Ca50) sample (A) and it is difficult to distinguish Ni, Fe or CaO. On the other hand, larger particles of Ni and Fe metals are visible in the freshly reduced samples. The Spent catalysts have marked difference in their resistivity toward particle agglomeration at high temperature as well as Carbon deposition on the active sites. Neither large particle formation nor carbon deposition was observed in the spent 1.5%(Ni25Fe25Ca50) catalyst. On the other hand, Ca free sample suffers from agglomeration of Ni, Fe particles forming large rod like

30
forms. Filament like deposited Carbon species are observed in this sample, as marked by circles (Fig. 2.214 e&f). Therefore, Ca has a beneficial effect on keeping Ni and Fe components in well dispersed forms under extreme conditions.
Figure 18: SEM Images of Freshly Reduced and Spent Catalyst
2.2.7 Summary A set of new catalysts were prepared with the composition by wet impregnation method. The 1.5%(Ni25Fe25Ca50) catalyst showed optimum activity toward C7H8 conversion as well as COx selectivity. This catalyst demonstrated very slow deactivation with a drop in conversion efficiency from 99% of 79% for the first 50 hrs and the conversion efficiency reduced from 97% to 80% after regeneration with Oxygen/Hydrogen treatment to remove the effects of choking. The catalyst seems to be operating at lower temperature with significant tar decomposition as compared to the pure Ni catalyst. Carbon deposition occurred at a slower rate as compared to conventional Ni catalysts.
31
GLOSSARY
Term Definition
Partial Oxidation Synthesis gas (syngas) is mixed with a limited amount of oxygen creating an exothermic reaction.
Agglomeration Material properties of the bed and feedstock cause particles in the fluidized bed to form clumps and reduce fluidization.
Impinger A vessel that allows bubbling gas through a liquid solvent.
Pneumatic Operated by air or gas under pressure.
Soxhlet Condensing and solvent recirculating apparatus used to extract one or more compounds of interest from a solid.
Gravimetric Tar Total mass of tar.
Solid-Phase-Extraction (SPE)
An extraction method that uses a solid phase and a liquid phase to isolate one type of analyte from a solution.
GHSV Gas Hourly Space Velocity
XRD X-ray Diffraction
TPR Temperature Programmed Reduction
TPD Temperature Programmed Desorption
TPO Temperature Programmed Oxidation
SEM Scanning Electron Microscopy
TOF Turn Over Frequency

32
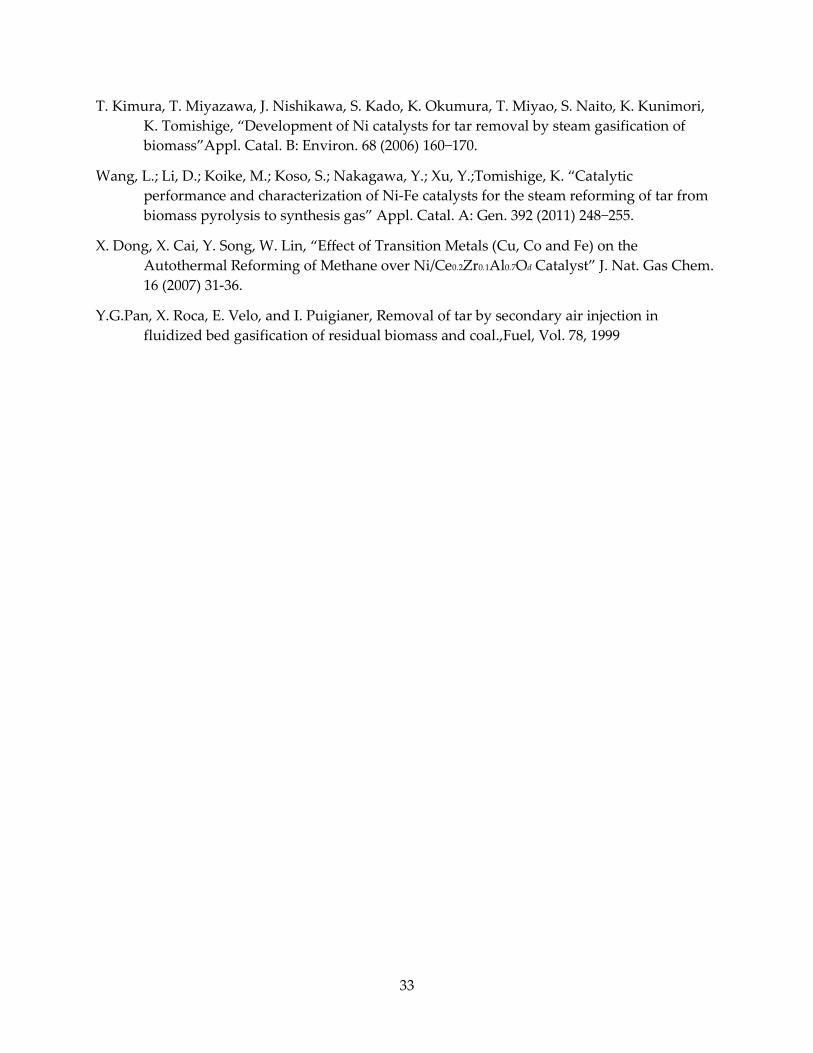
REFERENCES
A. Bambal, K. S. Vacchio, R. J. Cattolica, “Catalytic Effect of Ni and Fe Addition to Gasifier Bed Material in the Steam Reforming of Producer Gas” Ind. Eng. Chem. Res. 53 (2014) 13656 – 13666,
ACS Catal. 4 (2014) 289-301.
Bristich Standards Institution (BSI). Biomass Gasification - Tar and particles in product gases-Sampling and Analysis.: European Committee for Standardization, Technical Specification CEN/TS 15439, 2006.
F. Bimbela, D. Chen, J. Ruiz, L. García, J. Arauzo, “Ni/Al coprecipitated catalysts modified with magnesium and copper for the catalytic steam reforming of model compounds from biomass pyrolysis liquids” Appl. Catal. B: Environ. 119–120 (2012) 1-12.
I. Narvaez, , A. Orso, M.P. Aznar, and J. Corella, Biomass gasification with air in an atmospheric bubbling fluidized bed. Effect on six operational variables on the quality of produced raw gas., Industrial and Engineering Chemistry Research, Vol. 35, 1996.
J. Ashok and S. Kawi, “Nickel–Iron Alloy Supported over Iron–Alumina Catalysts for Steam Reforming of Biomass Tar Model Compound”
J. Nishikawa, T. Miyazawa, K. Nakamura, M. Asadullah, K. Kunimori, K. Tomishige, “Promoting effect of Pt addition to Ni/CeO2/Al2O3 catalyst for steam gasification of biomass” Catal. Commun. 9 (2008) 195–201.
J. Srinakruang, K. Sato, T. Vitidsant, K. Fujimoto, “Highly efficient sulfur and coking resistance catalysts for tar gasification with steam” Fuel, 85 (2006) 2419–26.
Koike, M.; Li, D.; Nakagawa, Y.; Tomishige, K. “A highly active and coke-resistant steam reforming catalyst comprising uniform nickel-iron alloy nanoparticles” ChemSusChem 5 (2012) 2312−2314.
M. A. Geber, “Report: Review of Novel Catalysts for Biomass Tar Cracking and Methane Reforming” PNNL 2007
R. Zhang, H. Wang, X. Hou, “Catalytic reforming of toluene as tar model compound: Effect of Ce and Ce–Mg promoter using Ni/olivine catalyst” Chemosphere 97 (2014) 40–46.
R. Zhang, Y. Wang, R. C. Brown, “Steam reforming of tar compounds over Ni/olivine catalysts doped with CeO2” Energy Convers. Manage. 48 (2007) 68-77.
S. S. Maluf, E. M. Assaf, “Ni catalysts with Mo promoter for methane steam reforming” Fuel 88 (2009) 1547-1553.
T. Baidya, R. J. Cattolica, “Ni-CaO-CeO2 Catalyst on Gasifier Bed Material for Tar Removal from Producer Gas” (Communicated to Journal).
33
T. Kimura, T. Miyazawa, J. Nishikawa, S. Kado, K. Okumura, T. Miyao, S. Naito, K. Kunimori, K. Tomishige, “Development of Ni catalysts for tar removal by steam gasification of biomass”Appl. Catal. B: Environ. 68 (2006) 160−170.
Wang, L.; Li, D.; Koike, M.; Koso, S.; Nakagawa, Y.; Xu, Y.;Tomishige, K. “Catalytic performance and characterization of Ni-Fe catalysts for the steam reforming of tar from biomass pyrolysis to synthesis gas” Appl. Catal. A: Gen. 392 (2011) 248−255.
X. Dong, X. Cai, Y. Song, W. Lin, “Effect of Transition Metals (Cu, Co and Fe) on the Autothermal Reforming of Methane over Ni/Ce0.2Zr0.1Al0.7Od Catalyst” J. Nat. Gas Chem. 16 (2007) 31-36.
Y.G.Pan, X. Roca, E. Velo, and I. Puigianer, Removal of tar by secondary air injection in fluidized bed gasification of residual biomass and coal.,Fuel, Vol. 78, 1999


![Research Articleapp.eng.ubu.ac.th/~app/resproject/upload/p1/L_Natthaya P.pdf · 20]. Furthermore, reports on the study of coconut shell gasification using both potassium hydroxide](https://static.fdocuments.us/doc/165x107/5f8e8691c8b3ef7db73bb592/research-appresprojectuploadp1lnatthaya-ppdf-20-furthermore-reports-on.jpg)