INCREASING DESALINATION BY MITIGATING ANOLYTE PH …
52
The Pennsylvania State University The Graduate School College of Engineering INCREASING DESALINATION BY MITIGATING ANOLYTE PH IMBALANCE USING CATHOLYTE EFFLUENT ADDITION IN A MULTI-ANODE, BENCH SCALE MICROBIAL DESALINATION CELL A Thesis in Environmental Engineering by Robert J. Davis 2013 Robert J. Davis Submitted in Partial Fulfillment of the Requirements for the Degree of Master of Science August 2013
Transcript of INCREASING DESALINATION BY MITIGATING ANOLYTE PH …
The Pennsylvania State University
The Graduate School
College of Engineering
INCREASING DESALINATION BY MITIGATING ANOLYTE PH IMBALANCE
USING CATHOLYTE EFFLUENT ADDITION IN A MULTI-ANODE, BENCH SCALE
MICROBIAL DESALINATION CELL
A Thesis in
Environmental Engineering
by
Robert J. Davis
2013 Robert J. Davis
Submitted in Partial Fulfillment
of the Requirements
for the Degree of
Master of Science
August 2013

The thesis of Robert J. Davis was reviewed and approved* by the following:
Bruce E. Logan
Kappe Professor of Environmental Engineering
Thesis Adviser
John M. Regan
Professor of Environmental Engineering
Fred S. Cannon
Professor of Environmental Engineering
Peggy Johnson
Professor of Civil Engineering
Head of the Department of Civil and Environmental Engineering
*Signatures are on file in the Graduate School

iii
ABSTRACT
A microbial desalination cell (MDC) uses exoelectrogenic bacteria to oxidize organic
matter, producing a current which can be used to desalinate saline water placed between
alternating ion exchange membranes. Protons are produced from the oxidation of organics at the
anode, resulting in acidification of the anolyte which can limit MDC performance. A new method
was used here to mitigate anolyte acidification based on adding non-buffered saline catholyte
effluent from a previous cycle to the anolyte at the beginning of the next desalination cycle. This
method was tested using a larger-scale MDC (267 mL) that contained four anode brushes, an air
cathode, and a three cell pair membrane stack. With an anolyte salt concentration increased by an
equivalent of 75 mM NaCl using the catholyte effluent, salinity was reduced by 26.0 ± 0.5% (35
g/L NaCl initial solution) in a 10 hour cycle, compared to 18.1 ± 2.0% without catholyte addition.
This improvement in performance was primarily due to the increase in buffering capacity of the
anolyte, although raising the conductivity slightly improved performance as well. Substrate was
lost from the anolyte due to diffusion into the desalination membrane stack. This loss of substrate
was decreased from 11% to 2.6% by increasing the anolyte conductivity (7.6 to 14 mS/cm).
These results demonstrated that catholyte effluent can be utilized as a useful product for
mitigating anolyte acidification and improving MDC desalination performance.

iv
TABLE OF CONTENTS
LIST OF FIGURES ................................................................................................................. v
ACKNOWLEDGEMENTS ..................................................................................................... vi
Chapter 1 Introduction ............................................................................................................ 1
1.1 Current global demand for fresh water ...................................................................... 1 1.2 Commercial desalination technologies ...................................................................... 2 1.3 Microbial desalination cells ....................................................................................... 3 1.4 Objectives................................................................................................................... 4 1.5 Literature cited ........................................................................................................... 4
Chapter 2 Literature Review ................................................................................................... 6
2.1 Types of MDCs .......................................................................................................... 6 2.2 Anode acidification in MDCs .................................................................................... 7 2.3 Extent of desalination and power generation in MDCs ............................................. 9 2.4 Multi-electrode bioelectrochemical systems .............................................................. 11 2.5 Anolyte recirculation .................................................................................................. 13 2.6 Literature cited ........................................................................................................... 14
Chapter 3 Increasing desalination by mitigating anolyte pH imbalance using catholyte
effluent addition in a multi-anode, bench scale microbial desalination cell .................... 18
3.1 Introduction ................................................................................................................ 18 3.2 Materials and methods ............................................................................................... 20
3.2.1 MDC construction ........................................................................................... 20 3.2.2 Medium ........................................................................................................... 22 3.2.3 MDC operation and experimental procedures ................................................. 23 3.2.4 Analyses and calculations ............................................................................... 24
3.3 Results ........................................................................................................................ 25 3.3.1 Desalination and current generation ................................................................ 25 3.3.2 Anion transport and the effect on COD removal............................................. 28 3.3.3 Effect of anolyte recirculation on anode performance .................................... 31
3.4 Discussion .................................................................................................................. 32 3.5 Acknowledgments ...................................................................................................... 36 3.6 Literature cited ........................................................................................................... 36
Chapter 4 Conclusions ............................................................................................................ 39
Chapter 5 Future Work ........................................................................................................... 40
Appendix Supplementary Information.................................................................................... 42

v
LIST OF FIGURES
Figure 1. (A) Schematic of bench scale MDC with parallel continuously recycled flow
through the 3 cell pair electrodialysis stack. AEM, anion exchange membrane. CEM,
cation exchange membrane. (B) Photograph of the reactor in operation. ........................ 22
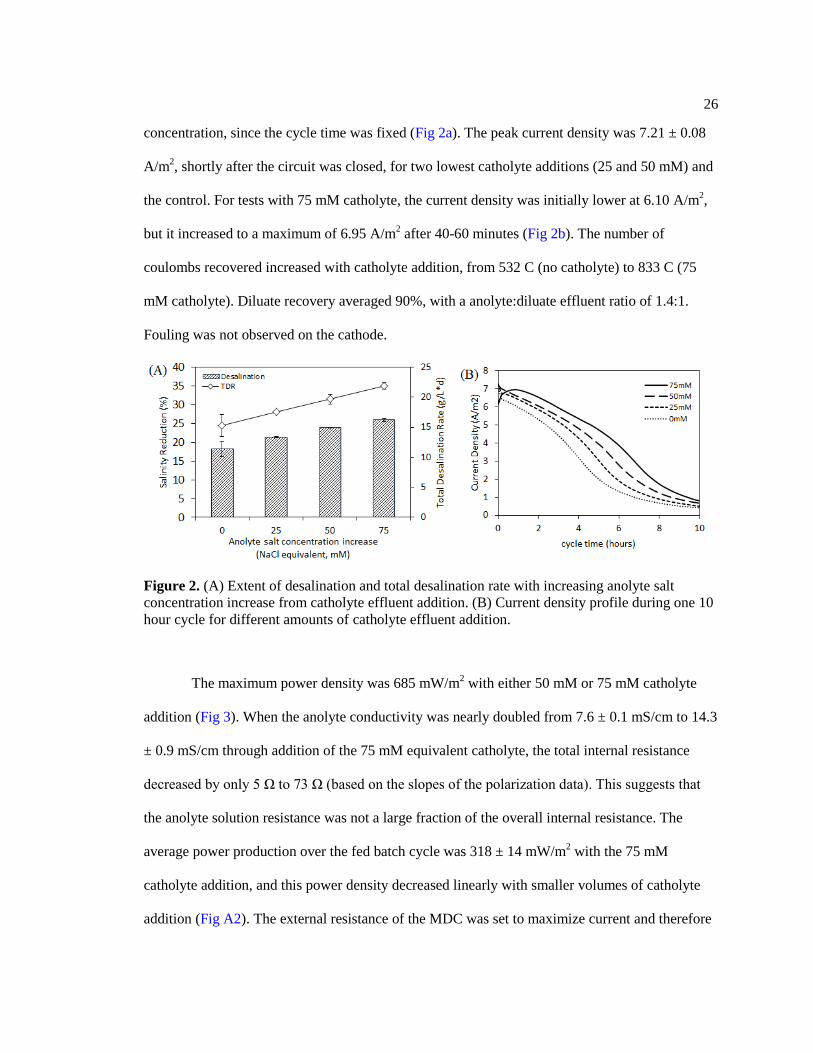
Figure 2. (A) Extent of desalination and total desalination rate with increasing anolyte
salt concentration increase from catholyte effluent addition. (B) Current density
profile during one 10 hour cycle for different amounts of catholyte effluent addition. ... 26
Figure 3. Maximum power density with various amounts of catholyte effluent addition (0
to 75 mM) after ~30 days of operation at 10 Ω external resistance. The internal
resistance is also showed by the slope of the voltage with respect to current. The
closed diamonds “P” represent power density at a given concentration of catholyte
addition, while the open signs “V” are for voltage density points. .................................. 27
Figure 4. Anolyte pH at the beginning and end of one cycle at various concentrations of
anolyte salt increase due to catholyte effluent addition. Increasing the amount of
catholyte effluent addition results in an increase of initial anolyte pH. ........................... 28
Figure 5. Diffusion of acetate and phosphate, across the anion exchange
membrane from the anolyte chamber into the diluate solution. Results are displayed
at various increments of anolyte salt concentration increase due to either NaCl
addition or catholyte effluent addition. ............................................................................ 29
Figure 6. COD removal at various increments of anolyte salt concentration increase due
to NaCl addition with no effect on anolyte pH (open signs) and due to addition of
catholyte effluent with an increase in anolyte pH (closed signs). .................................... 30
Figure 7. Coulombic efficiencies and COD measurements from the anolyte at the
beginning and end of one cycle for various increments of anolyte salt concentration
increase due to catholyte effluent addition. The subscript “diff” indicates data points
where diffusion of acetate out of the anode chamber was taken into account. ................ 31
Figure 8. (A) Current density contribution from each anode with anolyte recycle and (B)
in batch-fed mode. The electrodes are ordered from the bottom (1) to the top anode
(4). .................................................................................................................................... 32
Figure 9. Comparison of diluate solution to anolyte volume ratio and total desalination
rate of various studies. The (50) and (100) values for “this study” indicate PBS
concentration (mM) of the anolyte. An ideal MDC would be in the upper right hand
corner: high diluate to anolyte ratio and high total desalination rate. .............................. 35

vi
ACKNOWLEDGEMENTS
First and foremost, I would like to thank my adviser, Dr. Bruce E. Logan for showing
faith in me and providing me the opportunity to pursue my research interest at the Pennsylvania
State University. His knowledge, patience, and continual guidance have helped me immensely in
my development as a researcher and an engineer. I would also like to thank Dr. Jay Regan and
Dr. Fred Cannon for their kindness, for sharing their expertise with me and for serving as my
committee.
I am extremely appreciative of my lab mates for making my research life colorful and
putting up with me when my anodes died or I experienced other research-related casualties. I
would specifically like to thank Marta Hatzell and Roland Cusick for sharing in the struggles of
stack flow and pressure differences, Dr. Younggy Kim for his patience and constant mentorship
in the early stages of this project when I needed it the most, Dr. Fang Zhang and Dr. Justin
Tokash for their guidance in everything electrochemistry, Dr. Xiuping Zhu for her patience and
help with the HPLC work, Hiroyuki Kashima for his kindness and guidance with the IC, my
classmates Caroline Price and Vanessa Medina, Dr. Michael Siegert for being the second most
interesting man in the lab and especially Hengjing Yan for making every day enjoyable. Some of
those conversations were even work related, though the best were not. It has been my privilege to
work with knowledgeable, kind, and collaborative colleagues, thank you all.
I would also like to thank the King Abdullah University of Science and Technology for
the funding to complete this project.
Robert J. Davis
August 2013

Chapter 1
Introduction
1.1 Current global demand for fresh water
Water is the basis for life on this planet. It is estimated that the Earth contains 332.5
million cubic miles of water, 97% of which are in the oceans, 2% trapped in the icecaps, and less
than 1% available as fresh water in rivers, lakes, and shallow aquifers for human use [1]. This
amount of potable fresh water is becoming even smaller over time due to pollution, over
consumption, and the effects of global warming [2, 3]. To make matters worse, the distribution of
global fresh water resources does not coincide with population distribution. This inherently
makes water supply an international issue as source-water countries can control the volume and
quality of water going to downstream nations. Developing countries are the majority of the water
stressed demographic due to lack of technological advances or water infrastructure for treatment
and distribution. In the developing world, an estimated 1 billion people lack access to safe
affordable drinking water and 2.7 billion lack access to sanitation, with millions dying each year
from preventable waterborne diseases [4]. Water supply is of growing global significance as
nearly two thirds of the world’s population is projected to live in water stressed countries by 2025
[5]. Efforts for conservation and infrastructure improvements will help alleviate this water stress,
but with the global population projected to increase to over 8.9 billion by 2050 and the world’s
water consumption rate estimated to double by 2030, new sources of fresh water are of great
interest and may become necessary to fulfill demand in the near future [6, 7].

2
1.2 Commercial desalination technologies
The increasing global water demand requires new supply streams, which can be
accomplished through water reuse or desalination [8]. While water reuse can be helpful for non-
potable purposes, desalination is the alternative more suited for human consumption. Seawater
desalination is an attractive alternative as nearly half of the world’s major cities are located within
50 kilometers of the coast and the ocean provides an unlimited supply of feed water [9].
Desalination is a process that removes dissolved solids (salts) from water to yield potable water.
In addition to seawater, brackish waters are also commonly used for desalination. Early
desalination was accomplished through thermal processes, in which large amounts of fossil fuels
were used to distill water from saline water that was then condensed and collected. Thermal
processes are still largely used today in fossil fuel rich countries in the Middle East. The energy
consumed by distillation is between 6-12 kWh/m3 (multi-effect distillation) and 10-16 kWh/m
3
(multi-stage flash) based on the water produced [10].
The majority of the desalination plants being designed today use reverse osmosis (RO)
technology, which uses pressure to push solution through a spiral-wound membrane. Water
diffuses through the RO membrane more quickly than salts, allowing fresh water permeate to be
collected. Energy consumption for salt water reverse osmosis has fallen dramatically in the past
40 years and now nearly approaches the thermodynamic limit [11]. Though production from
seawater desalination plants are expected to double between 2008 and 2016 to 38 billion m3 per
year, that projected capacity would still comprise less than 1% of the global water supply [12].
There are a number of environmental barriers that prevent seawater desalination from more wide
spread implementation, but the biggest problem is its high energy cost. State of the art seawater
RO plants consume 3-4 kWh/m3, which is still much greater than treating surface waters or
pumping from an underground aquifer [11]. With the RO process near the theoretical energy
3
limit, energy consumption can only be reduced by improving the pretreatment process, using
renewable energy sources, or by developing new technologies for seawater desalination.
1.3 Microbial desalination cells
A microbial desalination cell (MDC) is a new desalination technology that uses the
energy in wastewater to desalinate saline water while also producing energy. The MDC is a
modified microbial fuel cell (MFC) which consists of an anode and a cathode separated by at
least one pair of anion and cation exchange membranes. The ion exchange membranes enclose
the salt solution to make a desalination chamber. Bacteria on the anode oxidize organic matter in
the anode solution, producing electrons at the electrode and releasing protons into solution. The
electrons pass through an external circuit to the terminal electron acceptor at the cathode, most
commonly oxygen which is reduced to water. Theoretically, as one mole of electrons passes
through the circuit, one mole of sodium chloride molecules dissociates with one mole of chloride
passing through the anion exchange membrane to the anode chamber, and one mole of sodium
passing the cation exchange membrane to the cathode chamber. This leaves a desalinated solution
in the middle chamber. Similar to other desalination processes, water having different salinities
have been tested in an MDC and salt removals greater than 95% have been achieved [13-15].
Since MFCs and MDCs share many commonalities, many of the advances in MFC technologies
such as in electrode materials have direct application to MDCs.

4
1.4 Objectives
The objective of this study was to increase desalination in a bench scale MDC by adding
catholyte effluent to the anolyte in order to mitigate anode acidification. Various amounts of
catholyte effluent were added to the anolyte at the beginning of a cycle and the results were
compared on the basis of: extent of desalination, power generation, and treatment (COD
removal). The effect of anolyte recycle on current generation and electrode potentials was also
explored as well as anion back diffusion out of the anode chamber.
1.5 Literature cited
1. US Geological Survey. The World’s Water, 2005, page accessed 23 April 2013,
http://ga.water.usgs.gov/edu/earthwherewater.html
2. Oki, T., Kanae, S. Global hydrological cycles and world water resources. Science, 2006,
313, 1068-1072
3. Hoekstra, A., Mekonnen, M. The water footprint of humanity. P National Academy of
Science,2012, 109(9), 3232-3237
4. World Health Organization. Progress on drinking water and sanitation: 2012 update.
2012
5. Service, R. Desalination freshens up. Science, 2006, 313, 1088-1090
6. United Nations, World Population Prospects: The 2010 Revision, Vol. 1, Comprehensive
Tables. United Nations, New York, 2011; accessed 10 May 2011,
http://esa.un.org/unpd/wpp/index.htm
7. 2030 Water Resources Group. Charting our water future; economic frameworks to inform
decision-making. 2009, pg 44, accessed 26 April 2013
http://www.2030waterresourcesgroup.com/water_full/Charting_Our_Water_Future_Final
8. Shannon, M., Bohn, P., Elimelech, M., Georgiadis, J., Marinas, B., Mayes, A. Science
and technology for water purification in the coming decades. Nature, 2008, 452, 301-310
9. World Resources Institute, Millennium Ecosystem Assessment, Ecosystems and Human
Well Being. 2005, pg 27, Accessed http://www.unep.org/maweb/en/Synthesis.aspx
10. Semiat, R. Energy issues in desalination processes. Environ. Sci. Technol. 2008, 42 (22),
8193-8201

5
11. Elimelech, M., Phillip, W. The future of seawater desalination: energy, technology, and
the environment. Science, 2011, 333, 712-717
12. Schiermeier, Q. Water purification with a pinch of salt. Nature, 2008, 452, 260-261
13. Cao, X., Huang, X., Liang, P., Xiao, K., Zhou, Y., Zhang, X., Logan, B. A new method
of desalination using microbial desalination cells. Environ. Sci. Technol. 2009, 43, 7148-
7152
14. Jacobson, K., Drew, D., He, Z. Efficient salt removal in a continuously operated upflow
microbial desalination cell with an air cathode. Bioresource Technol. 2011, 102, 376-380
15. Luo, H., Jenkins, P., Ren, Z. Concurrent desalination and hydrogen generation using
microbial electrolysis and desalination cells. Environ. Sci. Technol. 2011, 45, 340-344

Chapter 2
Literature Review
2.1 Types of MDCs
The first MDC was developed in 2009 by Cao et al., and there have been a variety of
advancements in this technology since then. The first MDC achieved 93% desalination of a 35
g/L salt solution over a 24 hour desalination cycle [1]. This design was successful at proving the
MDC concept, but volume of electrolyte solution used was much greater than that of the diluate
(66:1), and a ferricyanide catholyte was used as the terminal electron acceptor. MDCs have since
then almost universally used air cathodes since passive oxygen is free and continuously available.
Various concentrations of salt solutions, including artificial seawater, have also been tested in the
desalination chamber [2]. The three-chamber MDC first proposed by Cao et al. has been
extensively modified and adapted to improve specific aspects of desalination performance. Chen
and Kim increased the current efficiency and diluate volume relative to a three chamber system
by increasing the number of ion exchange membranes between the two electrode chambers [3, 4].
This created an electrodialysis (ED) stack with interchanging diluate and concentrate chambers.
In another study, a bipolar membrane was placed next to the anode chamber to make a four-
chamber system which produced acid, alkali, and desalinated solutions [5]. Applying a voltage
and sealing the cathode chamber from oxygen has produced hydrogen while simultaneously
desalinating water in the middle chamber [5-7]. Many researchers have also constructed osmotic
MDCs (oMDC) by replacing the anion exchange membrane next to the anode chamber of an
MDC with a forward osmosis membrane [8, 9]. The forward osmosis process accomplishes
desalination by pulling water from a dilute anolyte feed solution into the saline draw solution.
7
This process increases the recovery of diluate, though the lack of ion selectivity in the FO
membrane decreases the efficiency of ionic separation from current generation. Capacitive
deionization has been coupled with an MDC to prevent salt migration into the anode and cathode
chambers [10]. An activated carbon cloth assembly with a current collector and a CEM was
placed on both sides of the desalination chamber, and electrically connected to each electrode.
During operation, a potential was created by the BES with deionization of the salt solution in the
middle chamber, transporting anions towards the anode and cations towards the cathode. As ions
were collected by the activated carbon cloth, charge was accumulated (as in a capacitor) that
could be discharged to regenerate the adsorption sites [11].
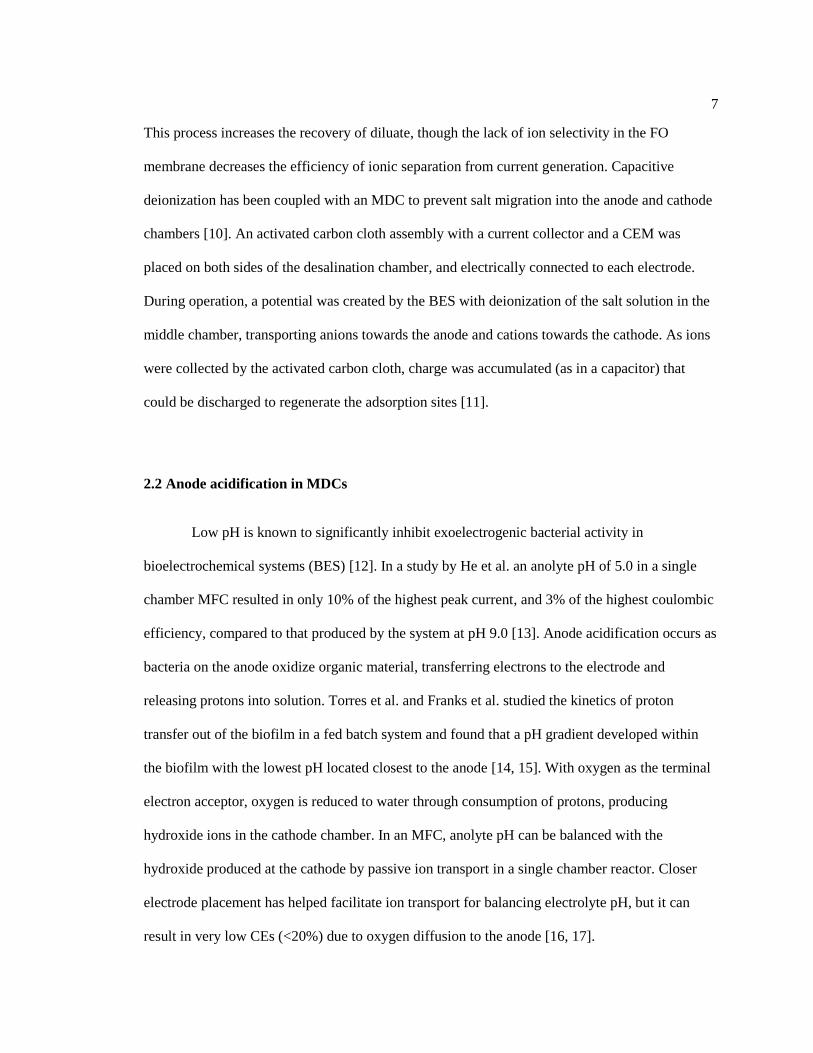
2.2 Anode acidification in MDCs
Low pH is known to significantly inhibit exoelectrogenic bacterial activity in
bioelectrochemical systems (BES) [12]. In a study by He et al. an anolyte pH of 5.0 in a single
chamber MFC resulted in only 10% of the highest peak current, and 3% of the highest coulombic
efficiency, compared to that produced by the system at pH 9.0 [13]. Anode acidification occurs as
bacteria on the anode oxidize organic material, transferring electrons to the electrode and
releasing protons into solution. Torres et al. and Franks et al. studied the kinetics of proton
transfer out of the biofilm in a fed batch system and found that a pH gradient developed within
the biofilm with the lowest pH located closest to the anode [14, 15]. With oxygen as the terminal
electron acceptor, oxygen is reduced to water through consumption of protons, producing
hydroxide ions in the cathode chamber. In an MFC, anolyte pH can be balanced with the
hydroxide produced at the cathode by passive ion transport in a single chamber reactor. Closer
electrode placement has helped facilitate ion transport for balancing electrolyte pH, but it can
result in very low CEs (<20%) due to oxygen diffusion to the anode [16, 17].

8
An MDC has multiple ion exchange membranes placed between the electrodes which
prevents pH balance from passive ion transfer between the anode and cathode. Cycling a large
volume of solution into the anode chamber has been commonly done to avoid acidification at the
anode [1, 3, 6]. Though a large anode solution volume prevents pH from becoming an issue, it
also results in lower COD removals [6]. Storing and pumping large volumes of electrolyte to
produce a much smaller volume of diluate would also increase capital and operational costs.
Electrolyte recycling has been used to specifically address pH imbalance in an MDC. Qu et al.
found that recirculating electrolyte at the end of a batch fed MDC cycle further increased
desalination by 19% [18]. Continuous electrolyte recycling resulted in 40% greater COD removal
and similar levels of desalination as a batch-fed MDC. The final anolyte pH with electrolyte
cycling was 6.7 compared to a pH of 4.1 at the end of a batch cycle without electrolyte
recirculation. Though electrolyte pH was successfully balanced using this method, there was
greater oxygen transfer into the anode chamber, resulting in low coulombic efficiency (25%) and
a biofilm developed on the air cathode, reducing current generation over time. Chen et al.
addressed these problems by using a separator next to the cathode and achieved greater stability
of desalination performance over 60 days compared to tests using MDCs without a separator [19].
Another approach used to mitigate low anolyte pH is placing a bipolar membrane
adjacent to the anode chamber and applying voltage to the system. A bipolar membrane consists
of an anion exchange membrane and cation exchange membrane pressed together. Applying a
potential greater than 0.83 V in theory dissociates water between the two membrane surfaces,
transporting hydroxide ions into the anode chamber to balance anolyte pH. Applying 1.0 V to an
MDC with a bipolar membrane resulted in balanced pH (7.0) compared to a pH of 4.5 at the end
of an electrolysis MDC cycle without a bipolar membrane [7].

2.3 Extent of desalination and power generation in MDCs
Current generation in an MDC creates a charge imbalance at the electrodes with protons
being released at the anode and hydroxide generated at the cathode. This charge imbalance
attracts anions (Cl–) towards the anode and cations (Na
+) towards the cathode chamber,
effectively desalting a solution in the middle chamber. Most methods of increasing desalination in
MDCs involve increasing current generation as the two are directly correlated. Decreasing the
external resistance has been shown to increase current. Chen et al. found that the specific
desalination rate increased from 0.25 g/L-h to 1.96 g/L-h when the external resistance decreased
from 500 Ω to 10 Ω. Decreasing the external resistance further to 5 Ω did not improve the
desalination rate [3]. Using a larger anode solution volume can prolong the time until anode
acidification becomes limiting and increase the amount of substrate available to the biofilm for
current generation. Luo et al. reported an 80% improvement in desalination when the anolyte
volume was increased from 25 mL to 425 mL [6]. Though increasing electrolyte volume keeps
electrode activity from becoming the limiting factor in a system, this is not an economically
viable solution.
Increasing the number of cells in the desalination chamber (ED stack) has been found to
increase the total desalination rate and current efficiency. An ED stack with 2 desalination
chambers examined by Chen et al. had a current efficiency of 283% and a 5 cell pair stack by
Kim and Logan increased current efficiency to 430% as compared with 90-100% current
efficiency in a single desalination chambered system [3, 4]. Though a stack can multiply the
efficiency of ionic separation, increasing the distance between the two electrodes and inserting
more membranes increases the ohmic resistance, which decreases the potential that can be used
by the cell to generate current. Ohmic resistance was also found to increase during the

10
desalination cycle as the diluate solution became less conductive [3]. The ohmic resistance from
the stack can be decreased by minimizing the distance between each cell [4].
Applying a larger voltage to an MEDC has been shown to slightly improve the rate of
desalination. Increasing the applied voltage from 0.4 V to 0.8 V had a greater effect on hydrogen
production than desalination, increasing hydrogen production by 260% while only improving the
average desalination rate by 35%. The desalination rate and hydrogen production rate showed
parallel variations during a desalination cycle, and followed current production. The maximum
desalination rate at 0.8 V was 0.42 mS/cm-h [6].
Electrolyte recirculation was shown to increase desalination when low buffered
electrolyte solutions were used. Desalination increased by 48% when recirculating between 25
mM buffered electrolytes, but decreased 13% with 50 mM buffered solutions [18]. Recirculating
the electrolyte at the end of an MDC cycle increased desalination the most (84%) as less substrate
was lost to aerobic processes in the cathode chamber. Placing a separator next to the cathode
while circulating electrolyte improved long-term performance by preventing biofouling at catalyst
sites. After 60 days of operation, desalination in a circulation MDC with separator decreased
25%, whereas performance was reduced 41% in circulation MDCs without a separator [19].
Osmotic forces disproportionally assist in desalination of higher saline solutions. The
osmotic pressure is approximately 14.4 atm when a 35 g/L NaCl solution is placed next to a dilute
anolyte with an equivalent salt concentration of 0.5 g/L NaCl [20]. Osmosis resulted in a 68%
conductivity reduction of a 20 g/L NaCl solution [21]. The largest MDC to date is an upflow
reactor designed by Jacobson et al. with a total volume of 2.75 L. This MDC achieved 94.3 ±
2.7% removal of a 35 g/L NaCl solution with a 4 day HRT [2].
Power generation in a BES is a function of the electrode potentials and internal
resistance. In an MDC operating with acetate as the electron donor and an air cathode, the
maximum open circuit potential is 1.11 V (0.81 – (–0.30) V). In practice, the maximum open
11
circuit potential is around 0.8 V due to typical electrode overpotentials, which can be improved
by better catalytic activity or larger electrode surface area [22]. The determining factor of power
production is the internal resistance due electrode overpotentials and ohmic losses. The reactor
with the lowest internal resistance has the largest potential available for power production. Salt
solution quality determines the electrolyte resistance and it is an important factor for power
production in MDCs. Maximum power production decreased from 28.9 W/m3 to 11.1 W/m
3 when
using an artificial seawater solution in place of a 35 g/L NaCl solution [2]. The chosen external
resistance in an MDC represents a trade-off between power production and desalination.
Decreasing the external resistance from 500 Ω to 10 Ω improved desalination by 684%, but
further reducing the resistance to 5 Ω decreased performance [3]. In another study, decreasing the
external resistance from 6 Ω to 0.1 Ω doubled the current output [2].
2.4 Multi-electrode bioelectrochemical systems
Multi-reactor connections of BESs, as well as multi-electro systems can differ in
performance compared to single electrode reactors and therefore an understanding of their
electrochemical behavior is crucial for scaling up these systems. In an MFC or MDC, electrically
connecting the anodes in series theoretically adds the voltages from each electrode, while a
parallel connection increases current. In practice, connecting individual MFCs in series often
results in voltage reversal, which is when a cell cannot deliver the current that is demanded of it
from the system. As a result the polarity of the cell switches and that cell becomes a voltage drain
on the system. For example, in a batch fed system with 2 MFCs connected in series, the voltage at
the beginning of the cycle for reactor 1 and 2 were 0.27 V and 0.20 V, respectively. After 5 hours
of operation, the voltage of reactor 1 increased to 0.6 V, while the voltage in reactor 2 decreased
to –0.6 V, resulting in no net voltage [23]. Fuel starvation is one of the main causes of voltage

12
reversal and but it can be avoided by using a high volumetric loading rate in MFCs with
continuous flow operation [24, 25]. Connecting the circuit to a high external resistance generates
lower current, which can also help prevent reversal [23]. Kim et al. successfully increased voltage
and avoided voltage reversal when using 4 MFCs by linking the MFCs to an array of capacitors
that were incrementally charged and discharged. Voltage and maximum power generation were
also increased in this series connection and lower cell performance did not reverse polarity [26].
Hydraulically connecting MFCs in series can also induce losses in voltage and power due
to parasitic current between the series connected electrodes [27]. In two tubular MFCs connected
in series the open circuit voltage dropped from 1.31 V to 0.96 V immediately after switching
from hydraulically isolated reactors to a system with a shared solution [28]. Higher electrolyte
resistance will decrease ion cross-conduction, and this can be accomplished by extending the
distance between the electrodes, enhancing the electrolyte resistivity, or decreasing the cross-
sectional flow area. Though these factors will reduce parasitic current, they will also increase the
internal resistance of the cell which is known to diminish performance. Wang et al. demonstrated
that voltage did not drop between two anodes connected in series when they were separated by
baffles (~700 mW/m2), but it dropped by almost half (366 mW/m
2) without baffle separation
[29].
Connecting multiple anodes in parallel increased current almost linearly and maintained
similar maximum power output as a single MFC. Zhuang et al. found a 4.2 fold increase in
current generation of 5 MFCs connected in parallel [24]. The short circuit current of 6 MFCs
connected in parallel increased by 5.6 times [25]. There was minimal energy loss in parallel
connected electrode MFCs when they were hydraulically connected, which indicated that there
was little effect of lateral ion cross-conduction on performance. The internal resistance in a multi-
anode baffled electrode system decreased as more anodes were connected in parallel, ranging
from 17.8 Ω (1 anode), 11.3 Ω (2 anodes), 9.0 Ω (3 anodes), to 5.4 Ω (4 anodes) [29]. Electrically

13
connecting a multi-electrode MDC in parallel will increase current generation and maximize
desalination.
2.5 Anolyte recirculation
A substrate gradient may form along the vertical length of a batch-fed reactor, decreasing
substrate concentrations and electrical performance. Karra et al. operated a plug flow MFC with 6
brush anodes/air cathode pairs located in 3 channels separated by baffles. Peak power densities
decreased along the flow path of the reactor from 282 mW/m2 (Channel I), 249 mW/m
2 (Channel
II), 159 mW/m2 (Channel III). COD removal also decreased in consecutive channels from 79%
(I), 71% (II), to 64% (III). The decreased substrate removals along the reactor flow path,
relatively long HRT (10 hours), and placement of the electrodes towards the top of the reactor,
suggests that biomass settling and decreased substrate concentration may have been factors in
reduced performance [30]. You et al. observed a substrate gradient along the height of a tubular
MFC at low influent substrate concentrations (400 mg COD/L) for a reactor operated in fed-batch
mode. Recirculation of the anolyte increased the volumetric power two-fold and decreased the
ohmic resistance by 42% and diffusion resistance by 25% [31]. Increasing the recirculation rate in
an upflow MFC improved current generation up to 46% [32]. Acclimating bioanodes under a
high shear rate formed a biofilm twice as thick and 5 times as dense as under low shear rates and
resulted in 2 to 3 times higher current generation and power production in an MFC [33]. These
results all show that recycling anolyte could produce more robust and electrically active biofilms,
reduce substrate concentration gradients along a reactor, and produce higher power and current
densities by reducing ohmic and diffusion resistances.
The electrolyte flow pattern has also been shown to have a significant effect on MFC
performance. In a recirculation or continuous flow anolyte, the electrolyte will flow along the
14
path of least hydraulic resistance, potentially creating areas of the anode with depleted substrate.
Recently, there have been several investigations on the control the flow path of the electrolyte
through the use of a spiral or helical anode geometry [34, 35]. A helical flow pathway in a porous
anode was shown to improve peak power by 2.2 to 6.8 fold compared to an equivalent system
without a helical flow pattern [36]. Zhang et al. developed a spiral spacer which created a helical
flow around a long brush anode. Using the spiral spacer improved maximum power and current
generation (7.1 W/m3, 62.6 A/m
3) compared to performance without a spiral flow path (4.5 W/m
3,
29.2 A/m3). Increasing the recirculation rate through the spiral spacer from 50 mL/min to 300
mL/min further improved the COD removal 12%, maximum power 49%, and maximum current
45% [37]. COD removal with and without the spiral spacer stayed relatively the same, which
indicated that the improved flow path did not increase substrate distribution to the biofilm. The
improved transport of ions or chemical mediators from the spiral flowpath through the anode
biofilm was likely the reason for the improved electrical performance
2.6 Literature cited
1. Cao, X., Huang, X., Liang, P., Xiao, K., Zhou, Y., Zhang, X., Logan, B. A new method
of desalination using microbial desalination cells. Environ. Sci. Technol. 2009, 43, 7148-
7152
2. Jacobson, K., Drew, D., He, Z. Use of a liter-scale microbial desalination cell as a
platform to study bioelectrochemical desalination with salt solution or artificial seawater.
Environ. Sci. Technol. 2011, 45, 4652-4657
3. Chen, X., Xia, X., Liang, P., Cao, X., Sun, H., Huang, X. Stacked microbial desalination
cells to enhance water desalination efficiency. Environ. Sci. Technol. 2011, 45, 2465-
2470
4. Kim, Y., Logan, B. Series assembly of microbial desalination cells containing stacked
electrodialysis cells for partial or complete seawater desalination. Environ. Sci. Technol.
2011, 45, 5840-5845
5. Mehanna, M., Kiely, P., Call, D., Logan, B. Microbial electrodialysis cell for
simultaneous water desalination and hydrogen gas production. Environ. Sci. Technol.
2010, 44, 9578-9583

15
6. Luo, H., Jenkins, P., Ren, Z. Concurrent desalination and hydrogen generation using
microbial electrolysis and desalination cells. Environ. Sci. Technol. 2011, 45, 340-344
7. Chen, S., Liu, G., Zhang, R., Qin, B., Luo, Y. Development of the microbial electrolysis
desalination and chemical-production cell for desalination as well as acid and alkali
productions. Environ. Sci. Technol. 2012, 46, 2467-2472
8. Zhang, B., He, Z. Integrated salinity reduction and water recovery in an osmotic
microbial desalination cell. RSC Adv. 2012, 2, 3265-3269
9. Werner, C., Logan, B., Saikaly, P., Amy, G. Wastewater treatment, energy recovery and
desalination using a forward osmosis membrane in an air-cathode microbial osmotic fuel
cell. J Membr. Sci. 2013, 428, 116-122
10. Forrestal, C., Xu, P., Ren, Z. Sustainable desalination using a microbial capacitive
desalination cell. Energy Environ. Sci. 2012, 5, 7161-7167
11. Welgemoed, T., Schutte, C. Capacitive deionization technology: an alternative
desalination solution. Desalination. 2005, 183, 327-340
12. Patil, S., Harnisch, F., Koch, C., Hubschmann, T., Fetzer, I., Carmona-Martinez, A.,
Muller, S., Schroder, U. Electroactive mixed culture derived biofilms in microbial
bioelectrochemical systems: the role of pH on biofilm formation, performance and
composition. Bioresource Technol.2011, 9683-9690
13. He, Z., Huang, Y., Manohar, A., Mansfeld, F. Effect of electrolyte pH on the rate of the
anodic and cathodic reactions in an air-cathode microbial fuel cell. Bioelectrochemistry,
2008, 78-82
14. Torres, C., Marcus, A., Rittmann, B. Proton transport inside the biofilm limits electrical
current generation by anode-respiring bacteria. Biotechnol. Bioeng., 2008, 100(5), 872-
881
15. Franks, A., Nevin, K., Jia, H., Izallalen, M., Woodard, T., Lovely, D. Novel strategy for
three-dimensional real-time imaging of microbial fuel cell communities: monitoring the
inhibitory effects of proton accumulation within the anode biofilm. Energy Environ. Sci.
2009, 2, 113-119
16. Liu, H., Cheng, S., Logan, B. Power generation in fed-batch microbial fuel cells as a
function of ionic strength, temperature, and reactor configuration. Environ. Sci. Technol.
2005, 39, 14, 5488-5493
17. Cheng, S., Liu, H., Logan, B. Increased power generation in a continuous flow MFC with
advective flow through the porous anode and reduced electrode spacing. Environ. Sci.
Technol. 2006, 40, 7, 2426-2432
18. Qu, Y., Feng, Y., Wang, X., Liu, J., Lv, J., He, W., Logan, B. Simultaneous water
desalination and electricity generation in a microbial desalination cell with electrolyte
recirculation for pH control. Bioresource Technol. 2012, 106, 89-94
19. Chen, X., Liang, P., Wei, Z., Zhang, X., Huang, X. Sustainable water desalination and
electricity generation in a separator coupled stacked microbial desalination cell with
buffer free electrolyte circulation. Bioresource Technol. 2012, 119, 88-93
20. Kim, Y., Logan, B. Microbial desalination cells for energy production and desalination.
Desalination, 2013, 308, 122-130

16
21. Mehanna, M., Saito, T., Yan, J., Hickner, M., Cao, X., Huang, X., Logan, B. Using
microbial desalination cells to reduce water salinity prior to reverse osmosis. Energy
Environ. Sci. 2010, 3, 1114-1120
22. Rabaey, K., Verstraete, W. Microbial fuel cells: novel biotechnology for energy
generation. Trends Biotechnol. 2005, 23(6), 291-298
23. Oh, S., Logan, B.Voltage reversal during microbial fuel cell stack operation. J Power
Sources. 2007, 167, 11-17
24. Aelterman, P., Rabaey, K., Pham, H., Boon, N., Verstraete, W. Continuous electricity
generation at high voltages and currents using stacked microbial fuel cells. Environ. Sci.
Technol. 2006, 40, 3388-3394
25. Zhuang, L., Zheng, Y., Zhou, S., Yuan, Y., Yuan, H., Chen, Y. Scalable microbial fuel
cell (MFC) stack for continuous real wastewater treatment. Bioresource Technol. 2012,
106, 82-88
26. Kim, Y., Hatzell, M., Hutchinson, A., Logan, B. Capturing power at higher voltages from
arrays of microbial fuel cells without voltage reversal. Energy Environ. Sci. 2011, 4,
4662-4667
27. Kim, D., An, J., Kim, B., Jang, J., Kim, B., Chang, I. Scaling-up microbial fuel cells:
configuration and potential drop phenomenon at series connection of unit cells in shared
anolyte. Chem Sus Chem, 2012, 5, 1086-1091
28. Zhuang, L., Zhou, S. Substrate cross-conduction effect on the performance of serially
connected microbial fuel cell stack. Electrochemistry Commun. 2009, 11, 937-940
29. Wang, B., Han, J. A single chamber stackable microbial fuel cell with an air cathode.
Biotechnol Lett, 2009, 31, 387-393
30. Karra, U., Troop, E., Curtis, M., Scheible, K., Tenagler, C., Patel, N., Li, B. Performance
of plug flow microbial fuel cell and complete mixing microbial fuel cell for wastewater
treatment and power generation. Int J Hydrogen Energ, 2013, 38, 13, 5383-5388
31. You, S., Zhao, Q., Zhang, J., Jiang, J., Wan, C., Du, M., Zhao, S. A graphite-granule
membrane-less tubular air-cathode microbial fuel cell for power generation under
continuously operational conditions. J Power Sources, 2007, 173, 172-177
32. Zhang, F., Jacobson, K., Torres, P., He, Z. Effects of anolyte recirculation rates and
catholytes on electricity generation in a litre-scale upflow microbial fuel cell. Energy
Environ. Sci. 2010, 3, 1347-1352
33. Pham, H., Boon, N., Aelterman, P., Clauwaert, P., De Schamphelaire, L., Van Oostveldt,
P., Verbeken, K., Rabaey, K., Verstraete, W. High shear enrichment improves the
performance of the anodophilic microbial consortium in a microbial fuel cell. Microbial
Biotechnology, 2008, 1, 6, 487-496
34. Mardanpour, M., Esfahany, M., Behzad, T., Sedaqatvand, R. Single chamber microbial
fuel cell with spiral anode for dairy wastewater treatment. Biosens Bioelectron, 2012, 38,
264-269
35. Jia, B., Hu, D., Xie, B., Dong, K., Liu, H. Increased power density from a spiral wound
microbial fuel cell.” Biosens Bioelectron, 2013, 41, 894-897
36. Kim, J., Boghani, H., Amini, N., Aguey-Zinsou, K., Michie, I., Dinsdale, R., Guwy, A.,
Guo, Z., Premier, G. Porous anodes with helical flow pathways in bioelectrochemical

17
systems: the effects of fluid dynamics and operating regimes. J Power Sources, 2012,
213, 382-390
37. Zhang, F., Ge, Z., Grimaud, J., Hurst, J., He, Z. Improving electricity production in
tubular microbial fuel cells through optimizing the anolyte flow with spiral spacers.
Bioresource Technol, 2013, 134, 251-256

Chapter 3
Increasing desalination by mitigating anolyte pH imbalance using catholyte
effluent addition in a multi-anode, bench scale microbial desalination cell
3.1 Introduction
It is estimated that more than 4 billion people currently live in high water stressed regions in
the world, and that 2.5 billion lack safe sanitary practices [1, 2]. Conservation and infrastructure
improvement can help alleviate some of the water stress, but with the global water shortage
projected to grow through 2050 due to the effects of climate change, industrialization, and
population growth, new sources of water will be needed [3]. The number of seawater desalination
facilities is predicted to increase exponentially in the next 10 years, but current commercial
desalination techniques such as electrodialysis, thermal desalination and reverse osmosis have
many environmental concerns and high energy costs [4, 5]. Even with state of the art advances in
reverse osmosis technology bringing its energy consumption close to the practical theoretical
minimum, the energy cost for seawater desalination is still too high for widespread
implementation, especially in poorer regions, which are the majority of the water stressed
demographic [6].
A new desalination technology has recently been developed, called a microbial desalination
cell (MDC), that uses exoelectrogenic microorganisms to degrade organic matter in a wastewater
and generate electricity [7]. This process is coupled with a stack of ion exchange membranes to
desalinate water and produce energy. There have been a number of advancements and
modifications of this technology since its development in 2009, that include: use of an
electrodialysis stack rather than a single desalination chamber to increase the current efficiency

19
and ionic separation [8, 9]; applying a voltage to produce hydrogen gas while desalinating water
rather than producing net electrical power [10, 11]; using a non-buffered solution with limited
impacts on desalination rates [9]; and examining the use of actual wastewaters as the anolyte [12].
One of the main factors limiting MDC performance has been anolyte acidification. As organic
matter in wastewater is oxidized by exoelectrogenic bacteria on the anode and electrons are
transferred to the electrode, protons are released into solution, lowering the anolyte pH. The rate
of proton production at the anode is greater than the rate of buffer diffusion into the anode
biofilm, which results in a pH gradient between the solution and the biofilm. This creates an
acidic environment for the anodic microbial community than can occur even before it is detected
in bulk solution [13]. A decrease in the pH below neutral inhibits the respiration of anodic
bacteria [14, 15]. This effect on pH is heightened in MDCs as transport of protons from the anode
chamber is limited due to the anion exchange membrane in the membrane stack located adjacent
to the anode chamber. Similarly, at the cathode the pH increases when a cation exchange
membrane is placed next to the cathode chamber.
Several different approaches have been used to avoid decreases in anode pH such as using
larger volumes of electrolyte solutions [7, 8], applying electrolyte recirculation between the
cathode and anode chambers [16, 17], or inserting a bipolar membrane next to the anode chamber
[18]. Larger electrolyte solution volumes increase cycle time by providing more solution to
balance pH, but they require higher operational and capital costs associated with pumping and
storing larger volumes of water, and they do not solve the inherent pH problem. Electrolyte
recirculation extends cycle time by balancing protons accumulated in the anode chamber with
hydroxide ions which are formed in the cathode chamber, but the introduction of organic matter
into the cathode chamber can result in extensive biofouling of the cathode. A bipolar membrane
can be used instead of the anion exchange membrane next to the anode chamber to dissociate

20
water and balance pH. However, a large voltage (1.0 V) must be used due to the high resistance
of the bipolar membrane, which makes the process energy intensive.
A different approach was used here to mitigate anolyte pH imbalance based on using the
cathode solution. Instead of recycling electrolyte solutions between the electrode chambers, the
non-buffered and saline catholyte effluent was mixed once with fresh anolyte to increase the
anolyte alkalinity and ionic conductivity. Oxygen reduction reaction at the cathode consumes
protons, and increases the pH to approximately 12.8. The catholyte has a high conductivity due to
the salinity of the water being desalinated (~70 mS/cm with 35 g/L NaCl). Therefore, adding the
catholyte to the anolyte increases the conductivity of the anolyte solution and reduces internal
resistance. The effectiveness of amending the anolyte with catholyte was examined here using a
larger-scale, multi- anode electrode MDC in terms of current production, desalination, power
generation, and COD removal. The transport of anions out of the anode chamber during a cycle
by back-diffusion was also measured to determine substrate losses from the anode chamber.
Additional experiments were conducted by adding NaCl directly to the anolyte, allowing
observation of the effect of conductivity separately from that produced by catholyte pH.
3.2 Materials and methods
3.2.1 MDC construction
The anode and cathode chambers were constructed using high density polyethylene (HDPE)
material with a cross sectional area of 52.5 cm2 (17.5 cm × 3 cm) (Fig. 1). The anode chamber
had a volume of 160 mL and the cathode chamber had a volume of 53 mL. Four bars of HDPE
(0.5 cm height) were evenly spaced and placed on the inner face of both chambers in order to

21
prevent membrane deformation. Four heat treated graphite fiber brushes 2.7 cm in diameter and
2.3 cm long were used as the anodes (Mill-Rose Lab Inc., USA). The air cathodes consisted of
wet proofed carbon cloth (30%), with four layers of polytetrafluoroethylene diffusion layers, a
Nafion binder and 0.5 mg Pt/cm2 [19]. The anodes were each connected to individual 10 Ω
external resistors and connected in parallel to the cathode through a single titanium wire current
collector along the length of the cathode.
The electrodialysis stack consisted of 3 cell pairs made of interchanging anion and cation
exchange membranes (Selemion CMV and AMV, Asahi glass, Japan) pretreated in a 0.6 M NaCl
solution for 24 hours, and then rinsed with deionized water. The silicone gaskets used to make a
water tight seal in the stack had a thickness of 1.3 mm, and polyethylene mesh spacers (2.5 × 16
cm2) were used to maintain cell thickness. Each cell held approximately 9 mL. The gaskets and
membranes were cut to allow parallel flow through the stack, entering and leaving through the
anode side of the reactor. Ag/AgCl reference electrodes (RE-5B; BASi, West Lafayette, IN) were
placed between the anodes in the anode chamber, and directly across from the anodes in the
cathode chamber. The reactor was held in place by two anodized aluminum end plates.

22
Figure 1. (A) Schematic of bench scale MDC with parallel continuously recycled flow through
the 3 cell pair electrodialysis stack. AEM, anion exchange membrane. CEM, cation exchange
membrane. (B) Photograph of the reactor in operation.
3.2.2 Medium
The anodes were inoculated (50% v/v) with a pre-acclimated mixed culture community
of microorganisms from a functioning acetate-fed MFC, and acclimated individually in 4 cm cube
reactors with a 10 Ω external resistor for over one month. NaCl concentrations were gradually
increased from 0 to 200 mM NaCl in order to preacclimate bacteria to higher Cl– conditions
typically produced in the MDC [9]. The anode chamber of the MDC was fed a solution of sodium
acetate (1 g/L) in a 50 mM phosphate buffer solution containing (per liter of deionized water):
0.31g NH4Cl, 2.45g NaH2PO4·H2O, 4.58g Na2HPO4, 0.13g KCl, 5 mL vitamins, and 6.25 mL
trace minerals [20]. The catholyte, diluate, and concentrate solutions were all synthetic seawater
consisting of 35 g/L NaCl prepared in deionized water.

23
3.2.3 MDC operation and experimental procedures
The cathode chamber was operated in fed-batch mode. The solution in the anode chamber
was continuously recycled at 1.0 mL/min (from the bottom to the top of the chamber) to avoid
localized differences in substrate concentrations that could affect reactor performance [21]. The
reactor was left in open circuit for an hour previous to operation, with 35 g/L NaCl solution
flushed through the stack at 5 mL/min to remove solution from the previous cycle. During
operation, the diluate solution was continuously recycled using a 100 mL salt water reservoir. The
concentrate stream was continuously recycled to a larger solution reservoir (~450 mL). Both
streams had a flowrate of 1 mL/min. The cycle time was set to 10 hours, to minimize osmotic
losses at the end of a cycle when current decreased to lower levels.
Catholyte effluent (~70 mS/cm, pH~12.8) collected from a previous cycle was added to
the anolyte influent, rather than using the catholyte from the same cycle, to simplify MDC
operation. The volume of catholyte used was evaluated in terms of the equivalent change in salt
concentration, producing increments of 25 mM, 50 mM, and 75 mM higher anolyte salt
concentrations. The substrate concentration was maintained at 1 g/L acetate to avoid the effects of
the different initial substrate concentrations on performance. The amount of PBS added to the
anolyte was also constant for each experimental condition (Fig A1). At 100 mM PBS current was
produced with a maximum salt concentration addition from catholyte of 150 mM. Therefore, with
50 mM PBS as the anolyte, the highest salt concentration from catholyte addition used was 75
mM. As a control, a fed batch cycle was run without addition of catholyte effluent to the anolyte
solution. Addition of catholyte effluent increased both conductivity and pH of the anolyte. In
order to observe the effect of conductivity separately from pH, in separate experiments sodium
chloride was added to the anolyte at 25 mM, 50 mM, and 75 mM NaCl increments, avoiding a pH
change.

24
3.2.4 Analyses and calculations
The voltage (U) for each anode across a 10 Ω external resistor [8] was measured at 10
minute intervals using a multimeter (Keithley Instruments, USA) connected to a personal
computer. Current was calculated as i=U/R, and current density was normalized by the cathode
surface area (52.5 cm2). Influent and effluent solutions for diluate, concentrate, and anolyte and
catholyte solutions were analyzed using conductivity and pH probes (SevenMulti, Mettler-Toledo
International Inc., USA). The total desalination rate (g/L-d) was calculated as the change in
salinity based on total dissolved solids. The salinity was estimated from conductivity
measurements using an in situ conductivity conversion as previously outlined by Bennett [22],
and assuming the conductivity measured was due only to NaCl. Current efficiency (η) was
determined as ratio of ionic separation of NaCl to the total number of electrons passed through
the circuit, as
(1)
where F is Faraday’s constant, c the molar concentration of NaCl in the diluate, v the volume of
the diluate, Ncp the number of cell pairs in the electrodialysis stack, and i the current generated in
the reactor. The subscript “in” indicates conditions at the beginning of the cycle, “out” the end of
the cycle, and the superscript “D” indicates diluate [9].
The chemical oxygen demand (COD) was measured for influent and effluent anolyte
solutions using standard methods (Hach Co., USA). The COD sample was diluted at a 1:10 ratio
in order to minimize the effect of chloride ions on measurements. The coulombic efficiency (CE)
was calculated based on the total COD removed and the number of coulombs collected during the
cycle as previously described [23]. The coulombic efficiency calculated here was modified to
account for acetate losses due to diffusion out of the anode chamber, as
25
(2)
where MO2 is the molecular weight of O2 (32 g/mol), bes the number of electrons exchanged per
mole of oxygen (4 mol e–/mol O2), CODin the measured substrate concentration at the beginning
of the cycle, CODeff the measured concentration at the end of the cycle, and CODdiff the substrate
concentration measured in the adjacent diluate solution due to diffusion through the membrane.
Diluate samples were analyzed for phosphate using ion chromatography (IC, Dionex
ICS-1100) and acetate using high performance liquid chromatography (HPLC, Shimadzu LC-
20AT). The power density was measured for each experimental condition using an external
resistance ranging from 10 to 10,000 Ω at 20 minute intervals, after the reactor was initially set at
an open circuit for ~1 hour. During polarization tests, salt solution (35 g/L NaCl) was
continuously flowed through the electrodialysis stack at a flow rate of 5 mL/min in order to
minimize losses due to junction potential, and to decrease internal resistance as previously
demonstrated [9]. Power densities (mW/m2) were normalized by the cathode projected surface
area.
3.3 Results
3.3.1 Desalination and current generation
The MDC was run under four different operating conditions, each with varying amounts
of catholyte effluent added to the anolyte. The salt concentration in the diluate solution (35 g/L
NaCl) was reduced by 26.0 ± 0.5% when the anolyte salt concentration was increased by 75 mM
using the catholyte effluent, compared to 18.1 ± 2.0% in the control (no catholyte addition). The
total rate of desalination and extent of desalination increased linearly with catholyte
26
concentration, since the cycle time was fixed (Fig 2a). The peak current density was 7.21 ± 0.08
A/m2, shortly after the circuit was closed, for two lowest catholyte additions (25 and 50 mM) and
the control. For tests with 75 mM catholyte, the current density was initially lower at 6.10 A/m2,
but it increased to a maximum of 6.95 A/m2 after 40-60 minutes (Fig 2b). The number of
coulombs recovered increased with catholyte addition, from 532 C (no catholyte) to 833 C (75
mM catholyte). Diluate recovery averaged 90%, with a anolyte:diluate effluent ratio of 1.4:1.
Fouling was not observed on the cathode.
Figure 2. (A) Extent of desalination and total desalination rate with increasing anolyte salt
concentration increase from catholyte effluent addition. (B) Current density profile during one 10
hour cycle for different amounts of catholyte effluent addition.
The maximum power density was 685 mW/m2 with either 50 mM or 75 mM catholyte
addition (Fig 3). When the anolyte conductivity was nearly doubled from 7.6 ± 0.1 mS/cm to 14.3
± 0.9 mS/cm through addition of the 75 mM equivalent catholyte, the total internal resistance
decreased by only 5 Ω to 73 Ω (based on the slopes of the polarization data). This suggests that
the anolyte solution resistance was not a large fraction of the overall internal resistance. The
average power production over the fed batch cycle was 318 ± 14 mW/m2 with the 75 mM
catholyte addition, and this power density decreased linearly with smaller volumes of catholyte
addition (Fig A2). The external resistance of the MDC was set to maximize current and therefore
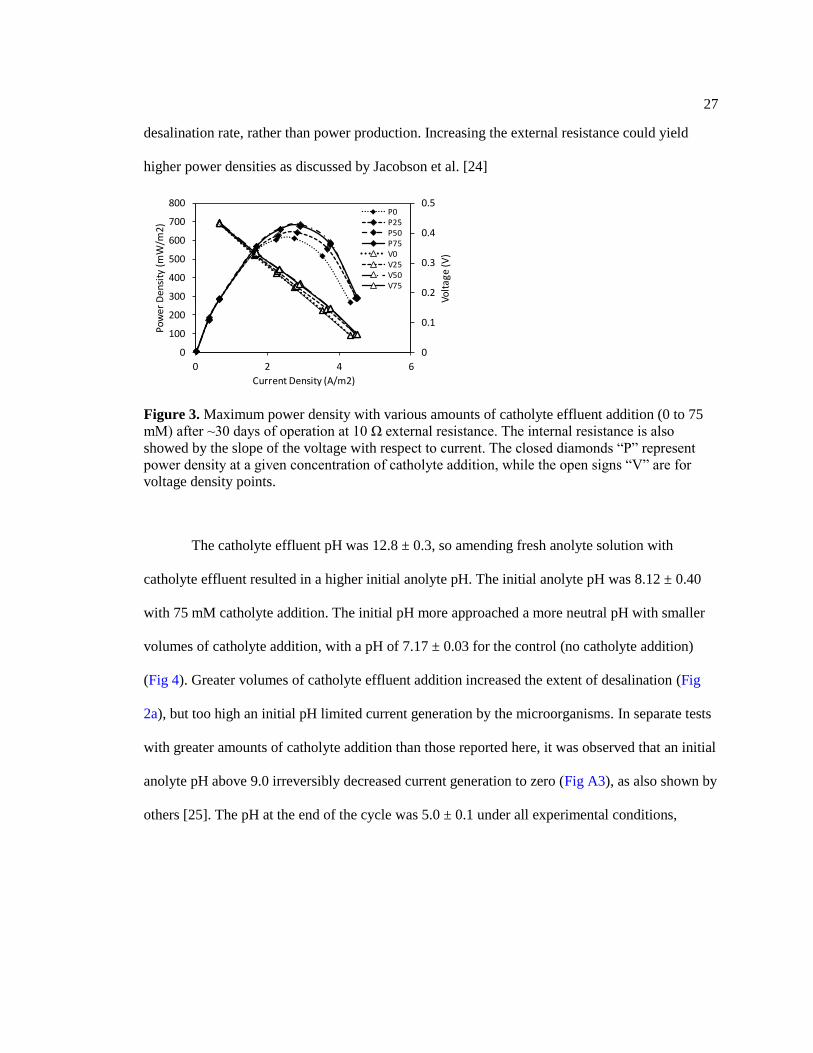
27
desalination rate, rather than power production. Increasing the external resistance could yield
higher power densities as discussed by Jacobson et al. [24]
Figure 3. Maximum power density with various amounts of catholyte effluent addition (0 to 75
mM) after ~30 days of operation at 10 Ω external resistance. The internal resistance is also
showed by the slope of the voltage with respect to current. The closed diamonds “P” represent
power density at a given concentration of catholyte addition, while the open signs “V” are for
voltage density points.
The catholyte effluent pH was 12.8 ± 0.3, so amending fresh anolyte solution with
catholyte effluent resulted in a higher initial anolyte pH. The initial anolyte pH was 8.12 ± 0.40
with 75 mM catholyte addition. The initial pH more approached a more neutral pH with smaller
volumes of catholyte addition, with a pH of 7.17 ± 0.03 for the control (no catholyte addition)
(Fig 4). Greater volumes of catholyte effluent addition increased the extent of desalination (Fig
2a), but too high an initial pH limited current generation by the microorganisms. In separate tests
with greater amounts of catholyte addition than those reported here, it was observed that an initial
anolyte pH above 9.0 irreversibly decreased current generation to zero (Fig A3), as also shown by
others [25]. The pH at the end of the cycle was 5.0 ± 0.1 under all experimental conditions,
0
0.1
0.2
0.3
0.4
0.5
0
100
200
300
400
500
600
700
800
0 2 4 6
Vo
ltag
e (V
)
Po
wer
Den
sity
(m
W/m
2)
Current Density (A/m2)
P0P25P50P75V0V25V50V75

28
which is in the low pH range known to inhibit current generation [15].
Figure 4. Anolyte pH at the beginning and end of one cycle at various concentrations of anolyte
salt increase due to catholyte effluent addition. Increasing the amount of catholyte effluent
addition results in an increase of initial anolyte pH.
3.3.2 Anion transport and the effect on COD removal
The current efficiency is the fractional contribution of the total electrons transferred
through the circuit for ionic separation in the dilute solution. The average current efficiency here
was 96 ± 7% (eq. 1), demonstrating that the ion exchange membranes effectively transported
sodium or chloride counter-ions with current generation, with little back-diffusion of these ions.
Other counter-ions could back-diffuse across the ion exchange membranes, although this is not
accounted for in eq. 1. There was back-diffusion of acetate and phosphate anions across the anion
exchange membrane into the adjacent diluate chamber. This diffusion resulted in a loss of 0.03 ±
0.02 g/L of acetate from the anode chamber with 75 mM catholyte addition, and this increased to
as much as 0.11 ± 0.02 g/L with no catholyte addition (control). Phosphate ions were also lost
from the anode chamber, increasing from 2.3 mM PO43–
(75 mM catholyte addition, 14.3 mS/cm)
to 3.2 mM PO43–
(control, 7.6 mS/cm) (Fig 5). This trend of decreasing diffusive anion transport
was also apparent when NaCl (not catholyte) was directly added to the anolyte, demonstrating
4.0
5.0
6.0
7.0
8.0
9.0
0 25 50 75
An
oly
te p
H
Anolyte salt concentration increase
(NaCl equivalent, mM)
pH in pH out

29
that anion back-diffusion out of the anode chamber was a function of anolyte conductivity.
Figure 5. Diffusion of acetate and phosphate, across the anion exchange membrane from
the anolyte chamber into the diluate solution. Results are displayed at various increments of
anolyte salt concentration increase due to either NaCl addition or catholyte effluent addition.
Final acetate concentrations in the anode chamber decreased with higher concentrations
of catholyte added to the anolyte, with acetate removals ranging from 55.2 ± 1.7% (control) to
62.8 ± 0.4% (75 mM catholyte addition). The greater COD removal was due to higher current
densities associated with catholyte addition. When increasing anolyte conductivity using only
NaCl, there was less COD removal, (Fig 6) which indicated that it was the additional buffering
capacity due to the catholyte rather than the increased conductivity that improved the extent of
substrate oxidation. COD removal from biochemical processes was less than that measured in the
anode chamber, due to acetate diffusion through the adjacent ion exchange membrane. The effect
of diffusion on correcting microbial COD removal was greatest at lower conductivity anode
0
1
2
3
4
0.00
0.02
0.04
0.06
0.08
0.10
0.12
0.14
0.16
0 25 50 75
Ph
osp
ha
te (
mM
)
Ace
tate
(g
/L)
Anolyte salt concentration increase(NaCl equivalent, mM)
Acetate (cat)
Acetate (NaCl)
Phosphate (cat)
Phosphate (NaCl)

30
solutions, decreasing COD removal by 17% compared to the control (7.6 mS/cm) (Fig 7
Figure 6. COD removal at various increments of anolyte salt concentration increase due to NaCl
addition with no effect on anolyte pH (open signs) and due to addition of catholyte effluent with
an increase in anolyte pH (closed signs).
The CE ranged from 59% to 87%, indicating that very little oxygen diffused to the anode
biofilm. CE increased with greater amounts of catholyte effluent addition, from 59 ± 3%
(control), 66 ± 1% (25 mM catholyte), 80 ± 6% (50 mM catholyte), to 84 ± 1% (75 mM
catholyte). The changes in the CEdiff were less variable when acetate losses due to diffusion were
included, ranging from 75 ± 3% (control) to 87 ± 4% (75 mM). The effect of acetate diffusion on
CEdiff was greatest at lower anolyte conductivities (28% increase at 7.6 mS/cm) and lessened with
higher anolyte conductivity (4% increase at 14.3 mS/cm) (Fig 7).
40
45
50
55
60
65
0 25 50 75
CO
D r
emov
al (
%)
Anolyte salt concentration increase
(NaCl equivalent, mM)
catholyte addition
NaCl addition

31
Figure 7. Coulombic efficiencies and COD measurements from the anolyte at the beginning and
end of one cycle for various increments of anolyte salt concentration increase due to catholyte
effluent addition. The subscript “diff” indicates data points where diffusion of acetate out of the
anode chamber was taken into account.
3.3.3 Effect of anolyte recirculation on anode performance
Anolyte recirculation resulted in a more equal distribution of current generation along the
height of the reactor and improved overall current density. When the anode chamber was initially
filled (batch mode), each anode contributed almost equally to performance based on measured
currents. The nearly equal current production by each anode at the beginning of the cycle
indicates that when the anode chamber was initially filled, it functioned as a completely mixed
reactor. As the cycle progressed, however, the current produced by the anode at the top of the
reactor first declined, followed successively by the other anodes down along the length of the
reactor (Fig 8b). The difference in current generation from each anode was most likely caused by
a substrate gradient that developed over time as has been observed by others [26, 27]. Over eight
24 hour batch fed cycles, the contribution of the top anode towards current generation decreased
from 37% to 11% suggesting that there were difference in substrate concentrations developing
within the reactor over time.
40
50
60
70
80
90
100
0
400
800
1200
1600
0 25 50 75
Co
ulo
mb
ic E
ffic
ien
cy (
%)
CO
D (m
g/L
)
Anolyte salt concentration increase(NaCl equivalent, mM)
COD in COD outCOD out_diff CECE_diff

32
To test the hypothesis that substrate gradients within the anode chamber were producing
different current production by the anodes, the anolyte was recycled from the bottom to the top of
the reactor at 1 mL/min. Anolyte recirculation successfully balanced the contribution of current
from each anode (Fig 8a) and increased total current generation by 7.9 ± 2.2% based on total
coulombs recovered in the circuit. The COD removal increased to 86 ± 4% (recycle) from 78±
3% (batch). Recirculation minimized the difference in anode potentials between electrodes and
had a minimal effect on cathode potentials (Fig A4).
Figure 8. (A) Current density contribution from each anode with anolyte recycle and (B) in
batch-fed mode. The electrodes are ordered from the bottom (1) to the top anode (4).
3.4 Discussion
Catholyte effluent addition increased desalination and substrate removal in the MDC by
delaying anode acidification, although a near-neutral anolyte pH was not sustained for the full
cycle. Batch fed addition of catholyte to the anolyte at the beginning of the cycle was only partly
successful in improving anode performance, as the initial current density was slightly inhibited
with 75 mM addition (6.10 A/m2) compared to the control (7.21 A/m
2), and adding too much
catholyte detached the biofilm. In future tests, an incremental addition of catholyte could be used
to better mitigate anolyte acidification throughout the whole cycle. This addition of catholyte over

33
the whole cycle would avoid a high initial pH, allowing for a greater total catholyte volume to be
used. For incremental addition to be effective, the catholyte must have a high pH at an early stage
of the cycle. This could be done by using a large cathode surface area to volume ratio.
Performance would not improve indefinitely with greater catholyte addition, as Cl– ions from the
adjacent diluate stream, with the addition of high concentrations of NaCl from the catholyte,
could also inhibit microbial activity.
COD removal and number of recovered coulombs increased with catholyte effluent
addition, but the approach used here did not take into account substrate dilution resulting from
catholyte addition. The initial substrate concentration (1 g/L sodium acetate) was kept constant in
order to minimize the number of variables in the system during experiments. The addition of
catholyte would have decreased the substrate concentration by 6% (25 mM), 10% (50 mM), and
15% (75 mM catholyte addition). Small changes in the initial concentrations of COD (>850 mg
COD/L) would have had little effect on power generation, but at lower COD concentrations
power can decrease substantially with the COD concentration [26, 28, 29]. Substrate
concentration is therefore only a factor at lower COD concentrations. At high COD
concentrations, other factors are more important for maximizing current production such as pH
and conductivity. Substrate dilution could therefore have an impact on performance of the MDC
with either incremental or continuous addition of the catholyte to anolyte, in terms of reduced
cycle times, desalination rates, or extent of desalination.
Substrate losses by anion diffusion out of the anode chamber affected both the CEdiff and
COD removal. The CE is a measure of the ratio of recovered coulombs as current to the total
theoretical amount of coulombs that could be produced by the oxidized substrate. Losses in CE
typically arise from the use of alternate electron acceptors by the bacteria on the anode, such as
oxygen, nitrate, or sulfate, or from the incomplete oxidation of a substrate. The CE typically is
calculated based only on current production, with the assumption that all of the other substrate

34
losses are due to other biological processes [23]. However, as shown in MDC tests here, there
was significant loss (11%) of substrate through physical diffusion through the membrane. When
an anion exchange membrane is placed adjacent to the anode chamber, transport of negatively
charged species, such as acetate anions, should be measured and accounted for in the COD
removal and CE calculations (eq. 2). In a two chamber MFC, substrate losses through the
membrane have also been show to decrease cathode electrode performance [30]. Without
considering substrate diffusion, total COD degradation will be overestimated, and CE under
estimated.
In considering scale up of MDCs, two important factors are the ratio of substrate to
diluate volumes, and the desalination rate. Many MDCs have been shown to achieve over 90%
desalination of saline water, but these extents of desalination have required 13 to 66 times more
anolyte volumes than the volume of desalinated water produced in the process (Fig 9). The use of
such large volumes of anolyte solutions is not practical for scale up due to high capital and
operational costs. A high level of desalination has also previously required over 48 hours [12, 24].
A long fed-batch cycle time results in a small rate of desalted water production [31, 32]. The
desalination rate produced here using the bench scale MDC was 22.5 g/L-d, with an anolyte
volume 1.4 times that of the diluate effluent. The only report of a similar desalination rate
required the use of 66 times more anolyte to desalination effluent [7]. Design aspects used here
that improved performance compared to these previous studies were: the rectangular shape of the
reactor, which minimized the possibility for dead zones in the stack; use of a larger concentrate
solution to decrease osmotic water losses from adjacent cells; use of thin electrodialysis cells to
minimize solution resistances; and choosing a more optimal cycle time, based on ending the cycle
at a time that maximized the extent of desalination, avoiding back diffusion of ions from the
concentrate to diluate chambers (Fig A5). The diluate volume in this operation was also easily
adjustable since diluate was collected in a separate container and recycled through the stack. If a

35
smaller diluate volume had been used, greater desalination would be expected.
Figure 9. Comparison of diluate solution to anolyte volume ratio and total desalination rate of
various studies. The (50) and (100) values for “this study” indicate PBS concentration (mM) of
the anolyte. An ideal MDC would be in the upper right hand corner: high diluate to anolyte ratio
and high total desalination rate.
Recycling the anolyte was also shown here to have a positive effect on MDC
performance. The average current output when the anolyte was recycled was 8% higher than that
obtained in batch mode operation (no recycle). While the exact reason for this change is not
known, current generation without recycle may have been a result in the development of a
substrate gradient in the anolyte chamber over time. It was observed that electrodes near the top
of the reactor produced less current than those at the bottom. Recycling anolyte from the bottom
to the top would have eliminated the development of substrate gradients in the anode chamber,
facilitated better mass transport of substrate to the biofilm, and increased ion transport into and
out of the biofilm. Transport of protons from the biofilm into solution can hinder microbial
activity on the anode due to the development of localized low pH [13]. Pumping fluid through the
anode chamber could have reduced concentration boundary layers around the anode, and
improved ion transport rates and therefore pH gradients in the biofilm. The recycle rate used here
1:35
1:2.2
1:1.4
1:5.9
1:66
1:3
1:1.3
1:30
10
20
30
40
50
60
0.00 0.20 0.40 0.60 0.80 1.00
Tota
l Des
alin
atio
n R
ate
(g/L
-d)
Ratio (Vdiluate : Vanolyte)
[8] [24]
this study (50) [11]
[7] [18]
this study (100) [16]

36
was low (1 mL/min), resulting in replacement of about 0.4 times the volume of the anolyte per
hour. However, increasing the recycle rate to 2 mL/min decreased current densities over 3 cycles,
for reasons which are not known (data not shown). Other studies have reported the use of much
higher recycle rates. For example, an upflow MFC recycled 3.5 and 12.5 times the volume of
anolyte per hour and reported 38% and 46% improvement in current generation, respectively
[33]. The results obtained here suggest that reactor performance can be improved using only
minimal recirculation.
3.5 Acknowledgments
The authors would like to thank Siemens Corp. for kindly donating an electrodialysis
reactor as a design reference for this project, Hiroyuki Kashima for his help with ion
chromatography and Dr. Xiuping Zhu for conducting the HPLC analysis. This research was
supported by Award KUS-11-003-13 from the King Abdullah University of Science and
Technology (KAUST).
3.6 Literature cited
1. WHO, Progress on Drinking Water and Sanitation, 2012, World Health Organization
and UNICEF.
2. Vorosmarty, C., McIntyre, P., Gessner, M., Dudgeon, D., Prusevich, A., Green, P.,
Glidden, S., Bunn, S., Sullivan, C., Liermann, C., Davies, P., Global threats to human
water security and river biodiversity. Nature, 2010. 467: p. 555.
3. Oki, T., Kanae, S., Global hydrological cycles and world water resources. Science, 2006.
313: p. 1068.
4. Zhou, Y., Tol, R., Evaluating the costs of desalination and water transport. Water
Resour. Res., 2005. 41(3): p. 1-10.
5. Christen, K., Environmental costs of desalination. Environ. Sci. Technol., 2007. 41: p.
5579.
6. Elimelech, M., Phillip, W., The future of seawater desalination: energy, technology, and
the environment. Science, 2011. 333: p. 712.
37
7. Cao, X., Huang, X., Liang, P., Xiao, K., Zhou, Y., Zhang, X., Logan, B., A new method
for water desalination using microbial desalination cells. Environ. Sci. Technol., 2009.
43: p. 7148-7152.
8. Chen, X., Xia, X., Liang, P., Cao, X., Sun, H., Huang, X., Stacked Microbial
Desalination Cells to Enhance Water Desalination Efficiency. Environ. Sci. Technol.,
2011. 45: p. 2465-2470.
9. Kim, Y., Logan, B., Series assembly of microbial desalination cells containing stacked
electrodialysis cells for partial or complete seawater desalination. Environ. Sci.
Technol., 2011. 45: p. 5840-5845.
10. Mehanna, M., Kiely, P., Call, D., Logan, B., Microbial electrodialysis cell for
simultaneous water desalination and hydrogen gas production. Environ. Sci. Technol.,
2010. 44: p. 9578-9583.
11. Luo, H., Jenkins, P., Ren, Z., Concurrent desalinationa and hydrogen generation using
microbial electrolysis and desalination cells. Environ. Sci. Technol., 2011. 45: p. 340-
344.
12. Luo, H., Xu, P., Roane, T., Jenkins, P., Ren, Z., Microbial desalination cells for
improved performance in wastewater treatment, electricity production, and desalination.
Bioresour. Technol., 2012. 105: p. 60-66.
13. Torres, C., Marcus, A., Rittmann, B., Proton transport inside the biofilm limits electrical
current generation by anode-respiring bacteria. Biotechnol. Bioeng., 2008. 100(5): p.
872-881.
14. Franks, A., Nevin, K., Jia, H., Izallalen, M., Woodard, T., Lovely, D., Novel strategy for
three-dimensional real-time imaging of microbial fuel cell communities: monitoring the
inhibitory effects of proton accumulation within the anode biofilm. Energy Environ. Sci.,
2009. 2: p. 113-119.
15. He, Z., Huang, Y., Manohar, A., Mansfeld, F., Effect of electrolyte pH on the rate of the
anodic and cathodic reactions in an air-cathode microbial fuel cell. Bioelectrochemistry,
2008. 74: p. 78-82.
16. Qu, Y., Feng, Y., Wang, X., Liu, J., Lv, J., He, W., Logan, B., Simultaneous water
desalination and electricity generation in a microbial desalination cell with electrolyte
recirculation for pH control. Bioresour. Technol., 2012. 106: p. 89-94.
17. Chen, X., Liang, P., Wei, Z., Zhang, X., Huang, X., Sustainable water desalination and
electricity generation in a separator coupled stacked microbial desalination cell with
buffer free electrolyte circulation. Bioresour. Technol., 2012. 119: p. 88-93.
18. Chen, S., Liu, G., Zhang, R., Qin, B., Luo, Y., Development of the microbial electrolysis
desalination and chemical-production cell for desalination as well as acid and alkali
productions. Environ. Sci. Technol., 2012. 46: p. 2467-2472.
19. Cheng, S., Liu, H., Logan, B.E., Increased performance of single-chamber microbial fuel
cells using an improved cathode structure. Electrochem. Commun., 2006. 8: p. 489-494.
20. Cheng, S., Xing, D., Call, D., Logan, B., Direct biological conversion of electrical
current into methane by electromethanogenesis. Environ. Sci. Technol., 2009. 43(10): p.
3953-3958.
21. Ahn, Y., Logan, B., Domestic wastewater treatment using multi-electrode continuous
flow MFCs with a separator electrode assembly design. Appl. Microbiol. Biotechnol.,
2013. 97: p. 409-416.
22. Bennett, A.S., Conversion of in situ measurements of conductivity to salinity. Deep -Sea
Res., 1976. 23: p. 157-165.
23. Logan, B., Microbial Fuel Cells2008, Hoboken, New Jersey: John Wiley & Sons, Inc.

38
24. Jacobson, K., Drew, D., He, Z., Use of a liter-scale microbial desalination cell as a
platform to study bioelectrochemical desalination with salt solution or artificail
seawater. Environ. Sci. Technol., 2011. 45: p. 4652-4657.
25. Patil, S., Harnisch, F., Koch, C., Hubschmann, T., Fetzer, I., Carmona-Martinez, A.,
Muller, S., Schroder, U., Electroactive mixed culture derived biofilms in microbial
bioelectrochemical systems: The role of pH on biofilm formation, performance and
composition. Bioresour. Technol., 2011. 102: p. 9683-9690.
26. You, S., Zhao, Q., Zhang, J., Jiang, J., Wan, C., Du, M., Zhao, S., A graphite-granule
membrane-less tubular air-cathode microbial fuel cell for power generation under
continuously operational conditions. J. Power Sources, 2007. 173: p. 172-177.
27. Karra, U., Troop, E., Curtis, M., Scheible, K., Tenaglier, C., Patel, N., Li, B.,
Performance of plug flow microbial fuel cell (PF-MFC) and complete mixing microbial
fuel cell (CM-MFC) for wastewater treatment and power generation. Int J Hydrogen
Energ, 2013. 38(13): p. 5383-5388.
28. Jiang, D., Li, B., Granular activated carbon single-chamber microbial fuel cells (GAC-
SCMFCs): a design suitable for large-scale wastewater treatment processes. Biochem.
Eng. J., 2009. 47: p. 31-37.
29. Cheng, S., Logan, B., Increasing power generation for scaling up single-chamber air
cathode microbial fuel cells. Bioresour. Technol., 2011. 102: p. 4468-4473.
30. Harnisch, F., Wirth, S., Schroder, U., Effects of substrate and metabolite crossover on the
cathodic oxygen reduction reaction in microbial fuel cells: Platinum vs. iron(II)
phthalocyanine based electrodes. Electrochem. Commun., 2009. 11: p. 2253-2256.
31. Mehanna, M., Saito, T., Yan, J., Hickner, M., Cao, X., Huang, X., Logan, B., Using
microbial desalination cells to reduce water salinity prior to reverse osmosis. Energy
Environ. Sci., 2010. 3: p. 1114-1120.
32. Kim, Y., Logan, B., Microbial desalination cells for energy production and desalination.
Desalination, 2013. 308: p. 122-130.
33. Zhang, F., Jacobson, K., Torres, P., He, Z., Effects of anolyte recirculation rates and
catholytes on electricity generation in a litre-scale upflow microbial fuel cell. Energy
Environ. Sci., 2010. 3: p. 1347-1352.

Chapter 4
Conclusions
Adding catholyte effluent to the anolyte successfully increased MDC performance in
terms of: extent of desalination and desalination rate (46% improvement); coulombs recovered
(36%); COD removal (24%); and coulombic efficiency, CEdiff (17%). Acetate was lost by
diffusion from the anode chamber through the adjacent ion exchange membrane into the adjacent
diluate chamber (0.11 g/L). This acetate loss should be included in COD and coulombic balance
calculations when an anion exchange membrane is placed next to the anode chamber. Recycling
anolyte balanced the performance of the four anodes connected in parallel, and increased current
generation (8%) and COD removal (10%). Catholyte effluent could be a useful resource for
mitigating anolyte acidification in MDCs.

Chapter 5
Future Work
There are several other aspects of catholyte effluent addition that should to be addressed
to assess the practicality of this approach and improve performance in the system, including:
1) The effect of substrate dilution on desalination performance and power generation.
Instead of keeping the initial substrate concentration constant, there should be a
change in initial COD concentrations depending on the volume of cathode solution
added to the anolyte.
2) Incremental addition of catholyte could also be used instead of batch addition at the
beginning of the cycle. The anode and cathode chamber pH values should also be
continuously monitored to determine the best time intervals for catholyte addition.
An energy balance for the electricity required for pumping compared to the
additional desalination and power generation from the system would be of interest.
3) The anodes could be acclimated under higher flow rate conditions for longer than
tested previously in this system (>3 cycles). The effect of higher recirculation rates
on the potential and current generation of each anode along the reactor could be
studied. Different flow paths could also be created to optimize substrate and ion
transport into the biofilm.
The reactor design could also be modified by adding another AEM next to the anode
chamber, to have 4 concentrate chambers and 3 diluate chambers in the ED stack. Following the
same procedures as outlined in this study, hydroxide being produced at the cathode would pass
into the concentrate stream, raising the pH of the concentrate through the desalination cycle. The

41
AEM between the concentrate and anode chamber would facilitate hydroxide transport into the
anolyte. Hydroxide ions will be more readily transported into the biofilm with a high anolyte
recirculation rate to more effectively balance anolyte pH. The optimal ED stack flowpath would
connect the concentrate cells next to the anode and cathode chambers in order to maximize the
concentration and likelihood of hydroxide ions transporting into the anode solution.

Appendix
Supplementary Information
Figure A1. This shows the method for making the anolyte for “catholyte addition” solutions.
The amount of PBS for each experimental condition was constant, while the amount of DI water
and catholyte effluent used to dilute the solution to 50 mM PBS was adjusted according to the
amount of salt concentration increase desired. The anolyte conductivity for each experimental
condition (with catholyte addition) was equal to the anolyte conductivity of the control solution
plus a given amount of NaCl addition (25 mM, 50 mM, or 75 mM).
0%
25%
50%
75%
100%
0 25 50 75
Ano
lyte
com
posi
tion
(%
)
Anolyte salt concentration increase
(NaCl equivalent, mM)
Catholyte
DI water
200 mM PBS

43
Figure A2. The average power density calculated during operation over one desalination cycle at
10 Ω external resistance, using various amounts of catholyte addition.
149
199
265
318
0
50
100
150
200
250
300
350
0 25 50 75Ave
rag
e P
ow
er
De
nsi
ty (
mW
/m2
)
Anolyte salt concentration increase
(NaCl equivalent, mM)

44
Figure A3. (A) Current density as a function of catholyte addition using 100 mM PBS. Current
went to zero with 200 mM catholyte addition and did not recover in subsequent cycles. (B) Initial
anolyte pH for the various amounts of catholyte effluent addition.
0
1
2
3
4
5
6
7
8
9
0 2 4 6
Cur
rent
Den
sity
(A/m
2)
cycle time (hours)
0mM50mM100mM150mM200mM
6.0
7.0
8.0
9.0
10.0
0mM 50mM 100mM 150mM 200mM
pH
Anolyte salt concentration increase (NaCl equivalent, mM) at 100 PBS
50 PBS
100 PBS

45
Figure A4. (A) Electrode potentials in 1 mL/min anolyte recirculation mode. The cathode
potentials are on the top graph and anode potentials on the bottom. (B) Electrode potentials in
anolyte batch-fed mode. The electrodes are ordered by placement in the reactor from bottom (1)
to the top electrode (4). Note: the top cathode electrode potentials are not shown because of a
malfunction in the reference electrode.
0.0
0.1
0.2
0.3
0 2 4 6 8 10
Cat
ho
de
Po
ten
tial
(V
)
321
0.0
0.1
0.2
0.3
0 2 4 6 8 10
-0.5
-0.4
-0.3
-0.2
-0.1
0
0 2 4 6 8 10
An
od
e P
ote
nti
al (
V)
cycle time (hours)
4321
-0.5
-0.4
-0.3
-0.2
-0.1
0
0 2 4 6 8 10
cycle time (hours)

46
Figure A5. (A) Conductivity of diluate solution as a function of time for various volumes of
catholyte effluent addition. The cycle time was set for when the diluate conductivity was at a
minimum, which was at about 10 hours for all conditions. (B) The diluate concentration increased
when osmotic water loss into the adjacent concentrate chamber was greater than ionic separation
from current generation. Current generation decreased along the cycle and reverse desalination is
shown at the end of this cycle.
40
42.5
45
47.5
50
52.5
55
0 2 4 6 8 10
Co
nd
uct
ivit
y (m
S/cm
)
time (hours)
0mM25mM50mM75mM
35
40
45
50
55
0 5 10 15 20 25
Co
nd
uct
ivit
y (m
S/cm
)
time (hours)