
Increased SHP-1 expression results in radioresistance ... · radioresistance of solid tumors such...
10
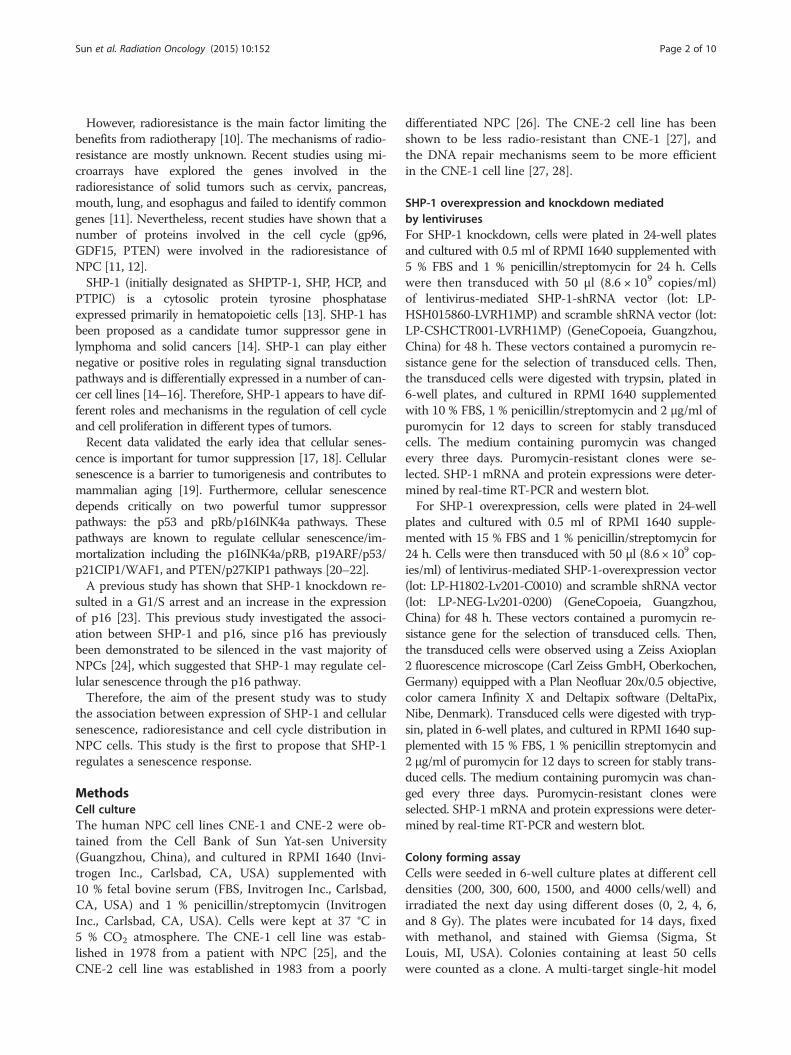
RESEARCH Open Access Increased SHP-1 expression results in radioresistance, inhibition of cellular senescence, and cell cycle redistribution in nasopharyngeal carcinoma cells Ziyi Sun 1† , Xiaofen Pan 1,2† , Zhenwei Zou 1 , Qian Ding 1 , Gang Wu 1 and Gang Peng 1* Abstract Background: Radioresistance is the main limit to the efficacy of radiotherapy in nasopharyngeal carcinoma (NPC). SHP-1 is involved in cancer progression, but its role in radioresistance and senescence of NPC is not well understood. This study aimed to assess the role of SHP-1 in the radioresistance and senescence of NPC cells. Methods: SHP-1 was knocked-down and overexpressed in CNE-1 and CNE-2 cells using lentiviruses. Cells were irradiated to observe their radiosensitivity by colony forming assay. BrdU incorporation assay and flow cytometry were used to monitor cell cycle. A β-galactosidase assay was used to assess senescence. Western blot was used to assess SHP-1, p21, p53, pRb, Rb, H3K9Me3, HP1γ, CDK4, cyclin D1, cyclin E, and p16 protein expressions. Results: Compared with CNE-1-scramble shRNA cells, SHP-1 downregulation resulted in increased senescence (+107 %, P < 0.001), increased radiosensitivity, higher proportion of cells in G0/G1 (+33 %, P < 0.001), decreased expressions of CDK4 (-44 %, P < 0.001), cyclin D1 (-41 %, P = 0.001), cyclin E (-97 %, P < 0.001), Rb (-79 %, P < 0.001), and pRb (-76 %, P = 0.001), and increased expression of p16 (+120 %, P = 0.02). Furthermore, SHP-1 overexpression resulted in radioresistance, inhibition of cellular senescence, and cell cycle arrest in the S phase. Levels of p53 and p21 were unchanged in both cell lines (all P > 0.05). Conclusion: SHP-1 has a critical role in radioresistance, cell cycle progression, and senescence of NPC cells. Down-regulating SHP-1 may be a promising therapeutic approach for treating patients with NPC. Keywords: Nasopharyngeal carcinoma, SHP-1, Cellular senescence, Cell cycle distribution, p16, Rb Background Nasopharyngeal carcinoma (NPC) is a cancer with a dis- tinctly skewed geographic and ethnic distribution, and is endemic in Southern China and South East Asia [1]. In- deed, type I NPC represents 25 % of the cases in North America and 2 % in Southern China, while type III repre- sents 95 % of the cases in China and 63 % in North Amer- ica [1]. NPC mostly affects men (men:women ratio of 4.4:1), and the median age at diagnosis is in the early 60s. Worldwide incidence is <1 per 100,000 for either men or women, but the incidence is 20–30 per 100,000 in Hong Kong and 15–20 per 100,000 in Guangdong [1]. Tobacco and alcohol are the two main risk factors for NPC [2–4]. Human papillomavirus and Epstein-Barr virus also increase the risk of NPC, particularly in endemic regions [5, 6]. Mean survival of patients with stage I, II, or III NPC is about 3 years [7]. Radiotherapy (RT) is the main treatment for NPC since radical resection is typically not possible [4]. The advent of megavoltage radiotherapy has transformed a once lethal cancer into one that is readily curable. Non-keratinizing un- differentiated carcinoma (type III NPC) is the most com- mon of the three forms of NPC, and is sensitive to radiations [4]. Overall survival exceeding 50 % at five years may now be achieved [8, 9]. * Correspondence: [email protected] † Equal contributors 1 Cancer Center, Union hosipital, Wuhan 430022, Hubei Province, China Full list of author information is available at the end of the article © 2015 Sun et al. This is an Open Access article distributed under the terms of the Creative Commons Attribution License (http://creativecommons.org/licenses/by/4.0), which permits unrestricted use, distribution, and reproduction in any medium, provided the original work is properly credited. The Creative Commons Public Domain Dedication waiver (http:// creativecommons.org/publicdomain/zero/1.0/) applies to the data made available in this article, unless otherwise stated. Sun et al. Radiation Oncology (2015) 10:152 DOI 10.1186/s13014-015-0445-1
Transcript of Increased SHP-1 expression results in radioresistance ... · radioresistance of solid tumors such...

Sun et al. Radiation Oncology (2015) 10:152 DOI 10.1186/s13014-015-0445-1
RESEARCH Open Access
Increased SHP-1 expression results inradioresistance, inhibition of cellularsenescence, and cell cycle redistribution innasopharyngeal carcinoma cells
Ziyi Sun1†, Xiaofen Pan1,2†, Zhenwei Zou1, Qian Ding1, Gang Wu1 and Gang Peng1*Abstract
Background: Radioresistance is the main limit to the efficacy of radiotherapy in nasopharyngeal carcinoma (NPC).SHP-1 is involved in cancer progression, but its role in radioresistance and senescence of NPC is not wellunderstood. This study aimed to assess the role of SHP-1 in the radioresistance and senescence of NPC cells.
Methods: SHP-1 was knocked-down and overexpressed in CNE-1 and CNE-2 cells using lentiviruses. Cells wereirradiated to observe their radiosensitivity by colony forming assay. BrdU incorporation assay and flow cytometrywere used to monitor cell cycle. A β-galactosidase assay was used to assess senescence. Western blot was used toassess SHP-1, p21, p53, pRb, Rb, H3K9Me3, HP1γ, CDK4, cyclin D1, cyclin E, and p16 protein expressions.
Results: Compared with CNE-1-scramble shRNA cells, SHP-1 downregulation resulted in increased senescence(+107 %, P < 0.001), increased radiosensitivity, higher proportion of cells in G0/G1 (+33 %, P < 0.001), decreasedexpressions of CDK4 (−44 %, P < 0.001), cyclin D1 (−41 %, P = 0.001), cyclin E (−97 %, P < 0.001), Rb (−79 %, P < 0.001),and pRb (−76 %, P = 0.001), and increased expression of p16 (+120 %, P = 0.02). Furthermore, SHP-1 overexpressionresulted in radioresistance, inhibition of cellular senescence, and cell cycle arrest in the S phase. Levels of p53 andp21 were unchanged in both cell lines (all P > 0.05).
Conclusion: SHP-1 has a critical role in radioresistance, cell cycle progression, and senescence of NPC cells.Down-regulating SHP-1 may be a promising therapeutic approach for treating patients with NPC.
Keywords: Nasopharyngeal carcinoma, SHP-1, Cellular senescence, Cell cycle distribution, p16, Rb
BackgroundNasopharyngeal carcinoma (NPC) is a cancer with a dis-tinctly skewed geographic and ethnic distribution, and isendemic in Southern China and South East Asia [1]. In-deed, type I NPC represents 25 % of the cases in NorthAmerica and 2 % in Southern China, while type III repre-sents 95 % of the cases in China and 63 % in North Amer-ica [1]. NPC mostly affects men (men:women ratio of4.4:1), and the median age at diagnosis is in the early 60s.Worldwide incidence is <1 per 100,000 for either men orwomen, but the incidence is 20–30 per 100,000 in Hong
* Correspondence: [email protected]†Equal contributors1Cancer Center, Union hosipital, Wuhan 430022, Hubei Province, ChinaFull list of author information is available at the end of the article
© 2015 Sun et al. This is an Open Access artic(http://creativecommons.org/licenses/by/4.0),provided the original work is properly creditedcreativecommons.org/publicdomain/zero/1.0/
Kong and 15–20 per 100,000 in Guangdong [1]. Tobaccoand alcohol are the two main risk factors for NPC [2–4].Human papillomavirus and Epstein-Barr virus also increasethe risk of NPC, particularly in endemic regions [5, 6].Mean survival of patients with stage I, II, or III NPC isabout 3 years [7].Radiotherapy (RT) is the main treatment for NPC since
radical resection is typically not possible [4]. The advent ofmegavoltage radiotherapy has transformed a once lethalcancer into one that is readily curable. Non-keratinizing un-differentiated carcinoma (type III NPC) is the most com-mon of the three forms of NPC, and is sensitive toradiations [4]. Overall survival exceeding 50 % at five yearsmay now be achieved [8, 9].
le distributed under the terms of the Creative Commons Attribution Licensewhich permits unrestricted use, distribution, and reproduction in any medium,. The Creative Commons Public Domain Dedication waiver (http://) applies to the data made available in this article, unless otherwise stated.
Sun et al. Radiation Oncology (2015) 10:152 Page 2 of 10
However, radioresistance is the main factor limiting thebenefits from radiotherapy [10]. The mechanisms of radio-resistance are mostly unknown. Recent studies using mi-croarrays have explored the genes involved in theradioresistance of solid tumors such as cervix, pancreas,mouth, lung, and esophagus and failed to identify commongenes [11]. Nevertheless, recent studies have shown that anumber of proteins involved in the cell cycle (gp96,GDF15, PTEN) were involved in the radioresistance ofNPC [11, 12].SHP-1 (initially designated as SHPTP-1, SHP, HCP, and
PTPIC) is a cytosolic protein tyrosine phosphataseexpressed primarily in hematopoietic cells [13]. SHP-1 hasbeen proposed as a candidate tumor suppressor gene inlymphoma and solid cancers [14]. SHP-1 can play eithernegative or positive roles in regulating signal transductionpathways and is differentially expressed in a number of can-cer cell lines [14–16]. Therefore, SHP-1 appears to have dif-ferent roles and mechanisms in the regulation of cell cycleand cell proliferation in different types of tumors.Recent data validated the early idea that cellular senes-
cence is important for tumor suppression [17, 18]. Cellularsenescence is a barrier to tumorigenesis and contributes tomammalian aging [19]. Furthermore, cellular senescencedepends critically on two powerful tumor suppressorpathways: the p53 and pRb/p16INK4a pathways. Thesepathways are known to regulate cellular senescence/im-mortalization including the p16INK4a/pRB, p19ARF/p53/p21CIP1/WAF1, and PTEN/p27KIP1 pathways [20–22].A previous study has shown that SHP-1 knockdown re-
sulted in a G1/S arrest and an increase in the expressionof p16 [23]. This previous study investigated the associ-ation between SHP-1 and p16, since p16 has previouslybeen demonstrated to be silenced in the vast majority ofNPCs [24], which suggested that SHP-1 may regulate cel-lular senescence through the p16 pathway.Therefore, the aim of the present study was to study
the association between expression of SHP-1 and cellularsenescence, radioresistance and cell cycle distribution inNPC cells. This study is the first to propose that SHP-1regulates a senescence response.
MethodsCell cultureThe human NPC cell lines CNE-1 and CNE-2 were ob-tained from the Cell Bank of Sun Yat-sen University(Guangzhou, China), and cultured in RPMI 1640 (Invi-trogen Inc., Carlsbad, CA, USA) supplemented with10 % fetal bovine serum (FBS, Invitrogen Inc., Carlsbad,CA, USA) and 1 % penicillin/streptomycin (InvitrogenInc., Carlsbad, CA, USA). Cells were kept at 37 °C in5 % CO2 atmosphere. The CNE-1 cell line was estab-lished in 1978 from a patient with NPC [25], and theCNE-2 cell line was established in 1983 from a poorly
differentiated NPC [26]. The CNE-2 cell line has beenshown to be less radio-resistant than CNE-1 [27], andthe DNA repair mechanisms seem to be more efficientin the CNE-1 cell line [27, 28].
SHP-1 overexpression and knockdown mediatedby lentivirusesFor SHP-1 knockdown, cells were plated in 24-well platesand cultured with 0.5 ml of RPMI 1640 supplemented with5 % FBS and 1 % penicillin/streptomycin for 24 h. Cellswere then transduced with 50 μl (8.6 × 10⁹ copies/ml)of lentivirus-mediated SHP-1-shRNA vector (lot: LP-HSH015860-LVRH1MP) and scramble shRNA vector (lot:LP-CSHCTR001-LVRH1MP) (GeneCopoeia, Guangzhou,China) for 48 h. These vectors contained a puromycin re-sistance gene for the selection of transduced cells. Then,the transduced cells were digested with trypsin, plated in6-well plates, and cultured in RPMI 1640 supplementedwith 10 % FBS, 1 % penicillin/streptomycin and 2 μg/ml ofpuromycin for 12 days to screen for stably transducedcells. The medium containing puromycin was changedevery three days. Puromycin-resistant clones were se-lected. SHP-1 mRNA and protein expressions were deter-mined by real-time RT-PCR and western blot.For SHP-1 overexpression, cells were plated in 24-well
plates and cultured with 0.5 ml of RPMI 1640 supple-mented with 15 % FBS and 1 % penicillin/streptomycin for24 h. Cells were then transduced with 50 μl (8.6 × 10⁹ cop-ies/ml) of lentivirus-mediated SHP-1-overexpression vector(lot: LP-H1802-Lv201-C0010) and scramble shRNA vector(lot: LP-NEG-Lv201-0200) (GeneCopoeia, Guangzhou,China) for 48 h. These vectors contained a puromycin re-sistance gene for the selection of transduced cells. Then,the transduced cells were observed using a Zeiss Axioplan2 fluorescence microscope (Carl Zeiss GmbH, Oberkochen,Germany) equipped with a Plan Neofluar 20x/0.5 objective,color camera Infinity X and Deltapix software (DeltaPix,Nibe, Denmark). Transduced cells were digested with tryp-sin, plated in 6-well plates, and cultured in RPMI 1640 sup-plemented with 15 % FBS, 1 % penicillin streptomycin and2 μg/ml of puromycin for 12 days to screen for stably trans-duced cells. The medium containing puromycin was chan-ged every three days. Puromycin-resistant clones wereselected. SHP-1 mRNA and protein expressions were deter-mined by real-time RT-PCR and western blot.
Colony forming assayCells were seeded in 6-well culture plates at different celldensities (200, 300, 600, 1500, and 4000 cells/well) andirradiated the next day using different doses (0, 2, 4, 6,and 8 Gy). The plates were incubated for 14 days, fixedwith methanol, and stained with Giemsa (Sigma, StLouis, MI, USA). Colonies containing at least 50 cellswere counted as a clone. A multi-target single-hit model
Sun et al. Radiation Oncology (2015) 10:152 Page 3 of 10
was used to describe the survival fraction using theequation SF = 1-(1-e-D/D0)N, where SF is the cell survivalfraction, D is the radiation dose, e is the natural loga-rithm, D0 is the mean lethal dose, and N is the extrapo-lated number. Survival curves were made using these SF.
BrdU incorporation assayCells were cultured on glass slides and were incubatedwith 10 μM BrdU (Sigma, St Louis, MI, USA) for 6 h be-fore fixation with 4 % formaldehyde. After DNA de-naturation in 2 M HCl for 30 min, cells were washed inPBS and incubated with mouse anti-human primaryantibody against BrdU (RPN20AB, 1:300, AP-BiotechS.R.L., Buenos Aires, Argentica). The secondary antibodyAlexa Fluor® 568 goat anti-mouse (#A110-31, 1:500,Invitrogen Inc., Carlsbad, CA, USA) was then appliedfor 60 min at room temperature, followed by a finalwash in PBS. Glass slides were mounted in VectashieldMounting Medium with HOCHEST (Vector Laborator-ies, Burlingame, CA, USA). Images were acquired usingan AxioObserver fluorescence microscope (Carl ZeissGmbH, Oberkochen, Germany) equipped with a PlanApochromat 20x/0.8 objective, camera Coolsnap HQ(Photometrics, Tucson, AZ, USA) and the Metamorphsoftware (Universal Imaging, Bedford Hills, NY, USA).Two independent observers blinded to grouping countedthe BrdU-positive cells in 35 random fields (approxi-mately 500 cells) for each glass slide, and the percentageof BrdU-positive cells was calculated. Data analysis wasperformed using ImageJ 1.43u (National Institutes ofHealth, Bethesda, MD, USA).
Senescence-associated β-galactosidaseStaining for senescence-associated-β-galactosidase activitywas performed using a Senescence β-Galactosidase StainingKit (#9860, Cell Signaling, Danvers, MA, USA) accordingto the manufacturer’s protocol. β-galactosidase positive cells(green) were viewed by light microscopy.
ImmunofluorescenceFor immunofluorescence, cells were cultured on glassslides, fixed in 4 % formaldehyde and permeabilized by0.1 % Triton X-100 in two consecutive steps, each for15 min at room temperature. After washing with PBS,cells were blocked for 30 min in 10 % fetal calf serum.The following primary antibodies were used: rabbit anti-human polyclonal antibody against histone H3 trimethy-lated at lysine 9 (H3K9Me3, #07-442, 1:1,000, Milliporecorp., Billerica, MA, USA) and mouse anti-human poly-clonal antibody against heterochromatin protein-1γ(HP1γ, #MAB3450, 1:4,000, Millipore corp., Billerica,MA, USA). Incubation with the primary antibodies wasperformed for 60 min at room temperature and the cellswere washed with PBS. The secondary antibodies Alexa
Fluor® 568 goat anti-mouse (#A110-31, 1:500, InvitrogenInc., Carlsbad, CA, USA) and Alexa Fluor® 488 goat anti-rabbit (#A-11008, 1:500, Invitrogen Inc., Carlsbad, CA,USA) were then applied for 60 min at room temperature,followed by a final wash in PBS. Glass slides were mountedin Vectashield Mounting Medium with HOCHEST (Vec-tor Laboratories, Burlingame, CA, USA). Confocal imageswere acquired using a LSM-510 microscope (Carl ZeissGmbH, Oberkochen, Germany) equipped with a Plan-Apochromat 63x/1.4 oil immersion objective and theZEN2009 software (Carl Zeiss GmbH, Oberkochen,Germany). Identical image acquisition parameters wereused for quantitative and comparative imaging. Percentageof senescence-associated heterochromatin foci (SAHF)-positive cells (based on Hoechst staining) and numbers ofH3K9Me3 and HP1γ foci per cell were counted by two in-dependent observers blinded to grouping from at least 200cells from each glass slide. Data analysis was performedusing ImageJ 1.43u (National Institutes of Health,Bethesda, MD, USA).
Flow cytometryAfter transduction with the indicated lentiviruses, cellswere fixed overnight with 70 % ethanol, followed by re-suspension in PBS containing 1 mg/ml of RNase and50 μg/ml of propidium iodide (Sigma, St Louis, MI,USA). Cellular DNA content was determined using aFACScan flow cytometer (BD Biosciences, Franklin Lake,NJ, USA).
Real-time RT-PCRTotal RNA was extracted using TRIzol (Invitrogen, NM,USA), and cDNA synthesis was performed using thePrime Script RT-PCR kit (Takara, Shiga, Japan), accord-ing to the manufacturers’ instructions. Then, real-timePCR was performed using SYBR Green PCR Master Mix(Applied Biosystems, USA) in a PCR amplifier (ABI Prism7000, USA). The StepOneTM Software v2.1 was used toanalyze the data. The primer sequences for SHP-1 were:Forward, 5’-ACCATCATCCACCTCAAGTACC-3’ andReverse, 5’-CTGAGCACAGAAAGCACGAA-3’. β-actinwas used as an internal control, and the primer sequenceswere: Forward, 5’-GATGAGATTGGCATGGCTTT-3’ andReverse, 5’-CACCTTCACCGTTCCAGTTT-3’. 2-ΔΔCt
was calculated to represent the relative mRNA expressionof target genes.
Western blotCells were lysed with the RIPA buffer (Invitrogen Inc.,Carlsbad, CA, USA), and then centrifuged (12,000 rpm,15 min, 4 °C). Protein content was measured using a BCAassay. Equal amounts of proteins (20–80 μg) were separatedwith 10 % sodium docecyl sulfate-polyacrylamide gel elec-trophoresis, and transferred to polyvinylidene difluoride
Sun et al. Radiation Oncology (2015) 10:152 Page 4 of 10
membranes (Santa Cruz Biotechnology, Santa Cruz, CA,USA). Membranes were blocked with 5 % BSA for 1 h, andprobed using mouse anti-human p21 (1:400; Abcam, Cam-bridge, MA, USA), mouse anti-human p53 (1:1000, CellSignaling, Danvers, MA, USA), mouse anti-human pRb(Ser795) (1:1000, Cell Signaling, Danvers, MA, USA),mouse anti-human Rb (1:2000, Cell Signaling, Danvers,MA, USA), mouse anti-human H3K9Me3 (1:500, Milliporecorp., Billerica, MA, USA), mouse anti-humanHP1-γ(1:500, Millipore corp., Billerica, MA, USA), mouse anti-human SHP1 (1:1000, Epitomic, San Francisco, CA, USA),mouse anti-human CDK4 (1:1000, Abcam, Cambridge,MA, USA), mouse anti-human cyclin D1 (1:1000, Epitomic,San Francisco, CA, USA), mouse anti-human cyclin E(1:1000, Bioworld Technology Inc., Louis Park, MN, USA),mouse anti-human p16 (1:1000, Santa Cruz Biotechnology,Santa Cruz, CA, USA), or rabbit anti-human β-actin(1:2500; Sigma, St Louis, MI, USA) polyclonal antibodiesovernight at 4 °C. Primary antibodies were detected usinghorseradish peroxidase-conjugated secondary antibodies(Invitrogen Inc., Carlsbad, CA, USA), and were visualizedusing enhanced chemiluminescence (SuperSignal, Pierce,Rockford, IL, USA). Grayscale images were analyzed usingImageJ 1.43b (National Institutes of Health, Bethesda,MD, USA).
Statistical analysisStatistical analysis was performed using SPSS 12.0 (SPSSInc., Chicago, IL, USA). Data are expressed as means ±standard deviation (SD) of at least three independent ex-periments and evaluated by one-way analysis of variance(ANOVA) with the least significant difference (LSD) testfor post hoc analysis or student’s t-test. P-values <0.05were considered statistically significant.
ResultsExpression of SHP-1 by lentivirus-mediated RNAinterference and overexpressionFigure 1a and b show the baseline expression of SHP-1 andradiosensitivity in CNE-1 and CNE-2 cells. The majority ofcells above 90 % displayed green fluorescence 48 h afterlentivirus transduction (Fig. 1c and d). Real-time RT-PCRshowed that SHP-1 mRNA expression was suppressed by62.5 % in CNE-1 cells transduced with lentivirus-mediatedSHP-1 shRNA (CNE-1 SHP-1 shRNA), compared withcells transduced with lentivirus-mediated scramble shRNA(CNE-1-scramble shRNA), while SHP-1 mRNA expressionwas overexpressed 249.2 folds in CNE-2 cells transducedwith lentivirus-mediated SHP-1 overexpression (CNE-2SHP-1 overexpression), compared with cells transducedwith lentivirus vector (CNE-2-empty vector) (Fig. 1e). Real-time RT-PCR results were confirmed by western blotting(Fig. 1f, g, and h), i.e. -47.2 % in CNE-1 SHP-1 shRNA cells,and +90.3 % in CNE-2 SHP-1 overexpression cells.
Effects of SHP-1 knockdown and overexpression in CNE-1and CNE-2 cells on radiosensitivitySurvival curves of CNE-1, CNE-1-empty vector, CNE-1-scramble shRNA, CNE-1 SHP-1 shRNA, and CNE-1SHP-1 overexpression cells after irradiation are shown inFig. 2a, and the survival curves of CNE-2, CNE-2-emptyvector, CNE-2-scramble shRNA, CNE-2 SHP-1 shRNA,and CNE-2 SHP-1 overexpression cells after irradiationare shown in Fig. 2b. The curves show that SHP-1 over-expression cells had a higher radioresistance comparedwith nontransduced cells or cells transduced with emptyvector (P < 0.001 for all radiation doses) (Fig. 2). Notably,SHP-1 overexpression cells had higher D0, Dq, and SF2values compared with non-transduced cells, indicatinghigher radioresistance (Table 1). By contrast, D0, Dq,and SF2 values were similar between the non-transducedcells and cells transduced with empty vector. On theother hand, SHP-1 shRNA cells had a lower radioresis-tance compared with non-transduced cells or cells trans-duced with scramble shRNA (P < 0.001 for all radiationdoses) (Fig. 2 and Table 1).
Effects of SHP-1 knockdown in CNE-1 cells andoverexpression in CNE-2 cells on NPC cell senescenceCell cycle arrest is the central feature of senescent cells.Morphologically, CNE-2 and CNE-2-empty vector cellswere vacuolated, flattened and much larger in size com-pared with CNE-2 SHP-1 overexpression cells (Fig. 3a).β-galactosidase staining revealed higher senescence inCNE-1 SHP-1 shRNA cells compared with CNE-1-scramble shRNA cells (23.6 ± 3.4 % vs. 11.4 ± 1.8 %, P <0.001), and lower senescence in CNE-2 SHP-1 overex-pression cells compared with CNE-2-empty vector cells(3.6 ± 2.7 % vs. 13.2 ± 3.3 %, P = 0.001) (Fig. 3a).H3K9Me3 and HP1γ analyses showed that more CNE-1
SHP-1 shRNA cells were positive for H3K9Me3 (13.6 ±2.7 % vs. 4.6 ± 1.9 %, P < 0.001) and HP1γ (12.0 ± 2.2 % vs.2.8 ± 1.5 %, P < 0.001) compared with CNE-1-scrambleshRNA cells, while fewer CNE-2 SHP-1 overexpressioncells were positive for H3K9Me3 (2.6 ± 1.5 % vs. 9.6 ±2.1 %, P < 0.001) and HP1γ (3.6 ± 1.5 % vs. 10.0 ± 2.3 %,P = 0.001) (Fig. 3b). These results were confirmed bywestern blot for H3K9Me3 and HP1γ, i.e. +292 % forH3K9Me3 and +54 % for HP1γ in CNE-1 SHP-1shRNA cells compared with CNE-1-scramble shRNAcells, and −37 % for H3K9Me3 and −83 % for HP1γ inCNE-2 SHP-1 overexpression cells compared withCNE-2-empty vector cells (all P < 0.001) (Fig. 3c).
Effects of SHP-1 knockdown in CNE-1 cells andoverexpression in CNE-2 cells on NPC cell cycle distributionAs shown in Fig. 4a, compared with CNE-1-scrambleshRNA cells, CNE-1 SHP-1 shRNA cells had a higherproportion of cells in G0/G1 (80.0 ± 1.7 % vs. 60.3 ±
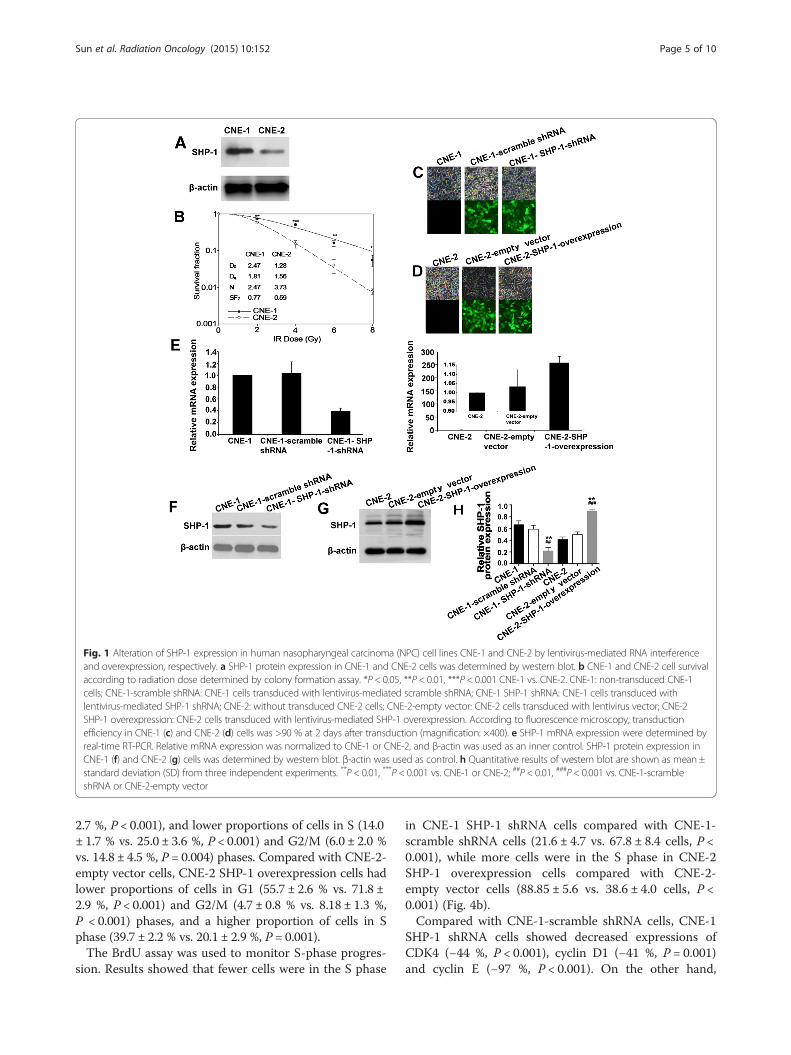
Fig. 1 Alteration of SHP-1 expression in human nasopharyngeal carcinoma (NPC) cell lines CNE-1 and CNE-2 by lentivirus-mediated RNA interferenceand overexpression, respectively. a SHP-1 protein expression in CNE-1 and CNE-2 cells was determined by western blot. b CNE-1 and CNE-2 cell survivalaccording to radiation dose determined by colony formation assay. *P < 0.05, **P < 0.01, ***P < 0.001 CNE-1 vs. CNE-2. CNE-1: non-transduced CNE-1cells; CNE-1-scramble shRNA: CNE-1 cells transduced with lentivirus-mediated scramble shRNA; CNE-1 SHP-1 shRNA: CNE-1 cells transduced withlentivirus-mediated SHP-1 shRNA; CNE-2: without transduced CNE-2 cells; CNE-2-empty vector: CNE-2 cells transduced with lentivirus vector; CNE-2SHP-1 overexpression: CNE-2 cells transduced with lentivirus-mediated SHP-1 overexpression. According to fluorescence microscopy, transductionefficiency in CNE-1 (c) and CNE-2 (d) cells was >90 % at 2 days after transduction (magnification: ×400). e SHP-1 mRNA expression were determined byreal-time RT-PCR. Relative mRNA expression was normalized to CNE-1 or CNE-2, and β-actin was used as an inner control. SHP-1 protein expression inCNE-1 (f) and CNE-2 (g) cells was determined by western blot. β-actin was used as control. h Quantitative results of western blot are shown as mean ±standard deviation (SD) from three independent experiments. **P < 0.01, ***P < 0.001 vs. CNE-1 or CNE-2; ##P < 0.01, ###P < 0.001 vs. CNE-1-scrambleshRNA or CNE-2-empty vector
Sun et al. Radiation Oncology (2015) 10:152 Page 5 of 10
2.7 %, P < 0.001), and lower proportions of cells in S (14.0± 1.7 % vs. 25.0 ± 3.6 %, P < 0.001) and G2/M (6.0 ± 2.0 %vs. 14.8 ± 4.5 %, P = 0.004) phases. Compared with CNE-2-empty vector cells, CNE-2 SHP-1 overexpression cells hadlower proportions of cells in G1 (55.7 ± 2.6 % vs. 71.8 ±2.9 %, P < 0.001) and G2/M (4.7 ± 0.8 % vs. 8.18 ± 1.3 %,P < 0.001) phases, and a higher proportion of cells in Sphase (39.7 ± 2.2 % vs. 20.1 ± 2.9 %, P = 0.001).The BrdU assay was used to monitor S-phase progres-
sion. Results showed that fewer cells were in the S phase
in CNE-1 SHP-1 shRNA cells compared with CNE-1-scramble shRNA cells (21.6 ± 4.7 vs. 67.8 ± 8.4 cells, P <0.001), while more cells were in the S phase in CNE-2SHP-1 overexpression cells compared with CNE-2-empty vector cells (88.85 ± 5.6 vs. 38.6 ± 4.0 cells, P <0.001) (Fig. 4b).Compared with CNE-1-scramble shRNA cells, CNE-1
SHP-1 shRNA cells showed decreased expressions ofCDK4 (−44 %, P < 0.001), cyclin D1 (−41 %, P = 0.001)and cyclin E (−97 %, P < 0.001). On the other hand,
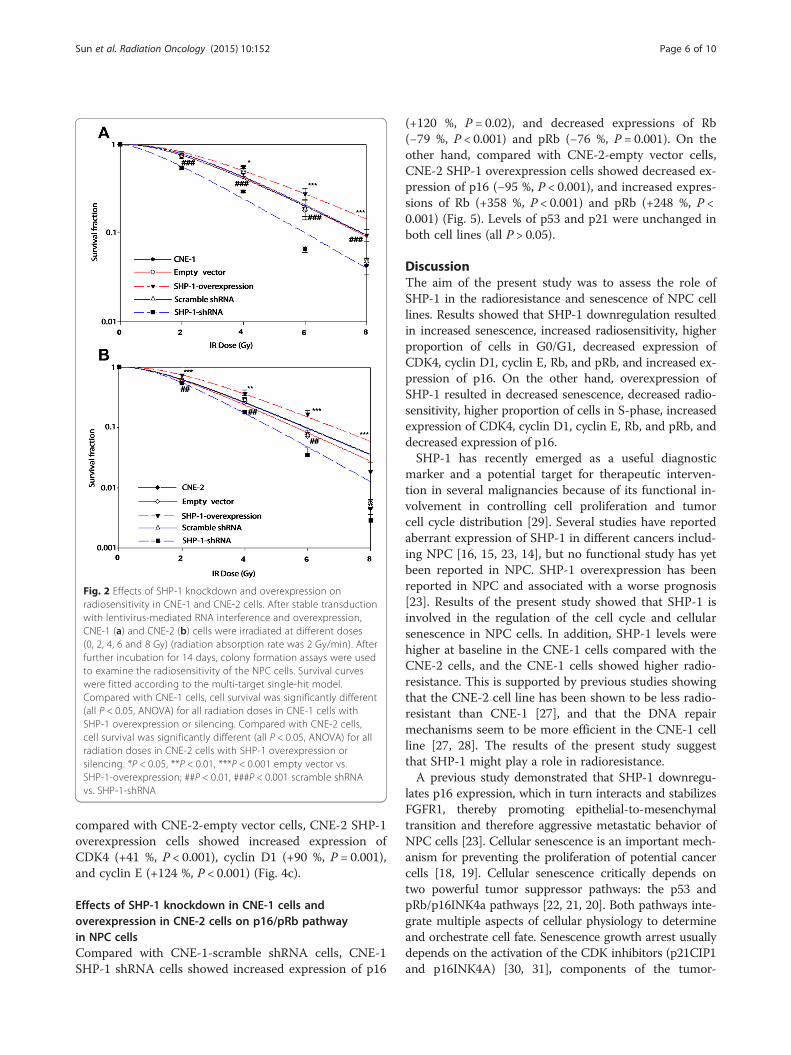
Fig. 2 Effects of SHP-1 knockdown and overexpression onradiosensitivity in CNE-1 and CNE-2 cells. After stable transductionwith lentivirus-mediated RNA interference and overexpression,CNE-1 (a) and CNE-2 (b) cells were irradiated at different doses(0, 2, 4, 6 and 8 Gy) (radiation absorption rate was 2 Gy/min). Afterfurther incubation for 14 days, colony formation assays were usedto examine the radiosensitivity of the NPC cells. Survival curveswere fitted according to the multi-target single-hit model.Compared with CNE-1 cells, cell survival was significantly different(all P < 0.05, ANOVA) for all radiation doses in CNE-1 cells withSHP-1 overexpression or silencing. Compared with CNE-2 cells,cell survival was significantly different (all P < 0.05, ANOVA) for allradiation doses in CNE-2 cells with SHP-1 overexpression orsilencing. *P < 0.05, **P < 0.01, ***P < 0.001 empty vector vs.SHP-1-overexpression; ##P < 0.01, ###P < 0.001 scramble shRNAvs. SHP-1-shRNA
Sun et al. Radiation Oncology (2015) 10:152 Page 6 of 10
compared with CNE-2-empty vector cells, CNE-2 SHP-1overexpression cells showed increased expression ofCDK4 (+41 %, P < 0.001), cyclin D1 (+90 %, P = 0.001),and cyclin E (+124 %, P < 0.001) (Fig. 4c).
Effects of SHP-1 knockdown in CNE-1 cells andoverexpression in CNE-2 cells on p16/pRb pathwayin NPC cellsCompared with CNE-1-scramble shRNA cells, CNE-1SHP-1 shRNA cells showed increased expression of p16
(+120 %, P = 0.02), and decreased expressions of Rb(−79 %, P < 0.001) and pRb (−76 %, P = 0.001). On theother hand, compared with CNE-2-empty vector cells,CNE-2 SHP-1 overexpression cells showed decreased ex-pression of p16 (−95 %, P < 0.001), and increased expres-sions of Rb (+358 %, P < 0.001) and pRb (+248 %, P <0.001) (Fig. 5). Levels of p53 and p21 were unchanged inboth cell lines (all P > 0.05).
DiscussionThe aim of the present study was to assess the role ofSHP-1 in the radioresistance and senescence of NPC celllines. Results showed that SHP-1 downregulation resultedin increased senescence, increased radiosensitivity, higherproportion of cells in G0/G1, decreased expression ofCDK4, cyclin D1, cyclin E, Rb, and pRb, and increased ex-pression of p16. On the other hand, overexpression ofSHP-1 resulted in decreased senescence, decreased radio-sensitivity, higher proportion of cells in S-phase, increasedexpression of CDK4, cyclin D1, cyclin E, Rb, and pRb, anddecreased expression of p16.SHP-1 has recently emerged as a useful diagnostic
marker and a potential target for therapeutic interven-tion in several malignancies because of its functional in-volvement in controlling cell proliferation and tumorcell cycle distribution [29]. Several studies have reportedaberrant expression of SHP-1 in different cancers includ-ing NPC [16, 15, 23, 14], but no functional study has yetbeen reported in NPC. SHP-1 overexpression has beenreported in NPC and associated with a worse prognosis[23]. Results of the present study showed that SHP-1 isinvolved in the regulation of the cell cycle and cellularsenescence in NPC cells. In addition, SHP-1 levels werehigher at baseline in the CNE-1 cells compared with theCNE-2 cells, and the CNE-1 cells showed higher radio-resistance. This is supported by previous studies showingthat the CNE-2 cell line has been shown to be less radio-resistant than CNE-1 [27], and that the DNA repairmechanisms seem to be more efficient in the CNE-1 cellline [27, 28]. The results of the present study suggestthat SHP-1 might play a role in radioresistance.A previous study demonstrated that SHP-1 downregu-
lates p16 expression, which in turn interacts and stabilizesFGFR1, thereby promoting epithelial-to-mesenchymaltransition and therefore aggressive metastatic behavior ofNPC cells [23]. Cellular senescence is an important mech-anism for preventing the proliferation of potential cancercells [18, 19]. Cellular senescence critically depends ontwo powerful tumor suppressor pathways: the p53 andpRb/p16INK4a pathways [22, 21, 20]. Both pathways inte-grate multiple aspects of cellular physiology to determineand orchestrate cell fate. Senescence growth arrest usuallydepends on the activation of the CDK inhibitors (p21CIP1and p16INK4A) [30, 31], components of the tumor-
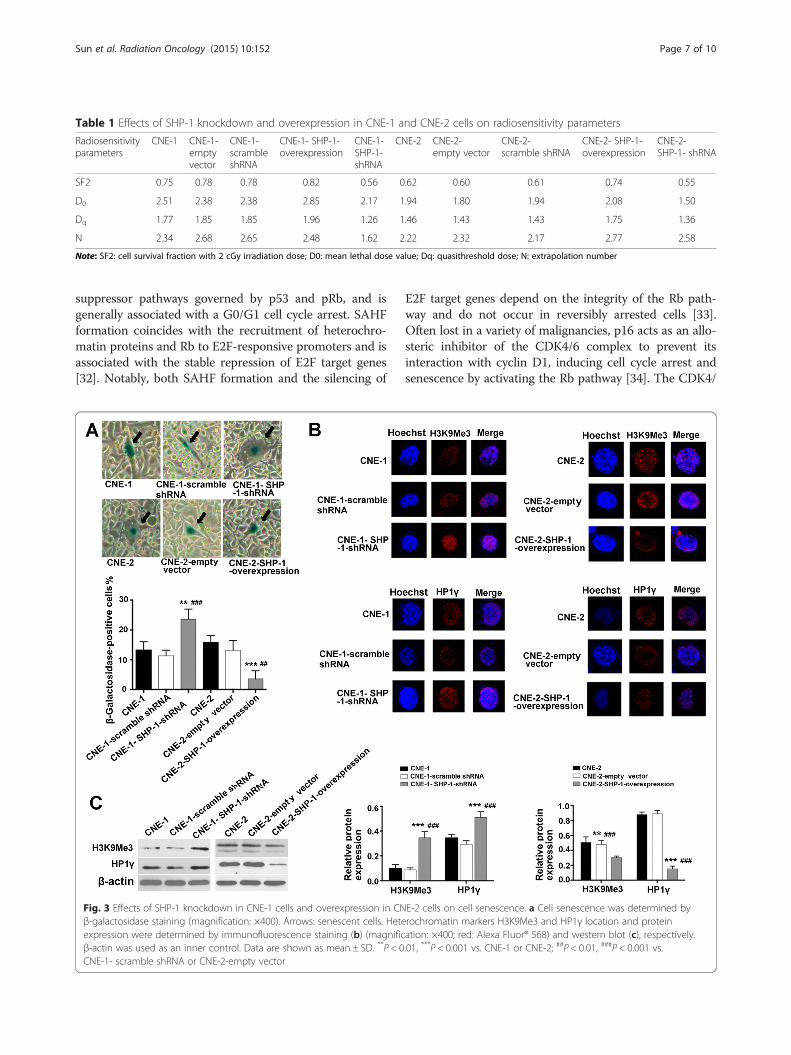
Table 1 Effects of SHP-1 knockdown and overexpression in CNE-1 and CNE-2 cells on radiosensitivity parameters
Radiosensitivityparameters
CNE-1 CNE-1-emptyvector
CNE-1-scrambleshRNA
CNE-1- SHP-1-overexpression
CNE-1-SHP-1-shRNA
CNE-2 CNE-2-empty vector
CNE-2-scramble shRNA
CNE-2- SHP-1-overexpression
CNE-2-SHP-1- shRNA
SF2 0.75 0.78 0.78 0.82 0.56 0.62 0.60 0.61 0.74 0.55
D0 2.51 2.38 2.38 2.85 2.17 1.94 1.80 1.94 2.08 1.50
Dq 1.77 1.85 1.85 1.96 1.26 1.46 1.43 1.43 1.75 1.36
N 2.34 2.68 2.65 2.48 1.62 2.22 2.32 2.17 2.77 2.58
Note: SF2: cell survival fraction with 2 cGy irradiation dose; D0: mean lethal dose value; Dq: quasithreshold dose; N: extrapolation number
Sun et al. Radiation Oncology (2015) 10:152 Page 7 of 10
suppressor pathways governed by p53 and pRb, and isgenerally associated with a G0/G1 cell cycle arrest. SAHFformation coincides with the recruitment of heterochro-matin proteins and Rb to E2F-responsive promoters and isassociated with the stable repression of E2F target genes[32]. Notably, both SAHF formation and the silencing of
Fig. 3 Effects of SHP-1 knockdown in CNE-1 cells and overexpression in CNβ-galactosidase staining (magnification: ×400). Arrows: senescent cells. Heteexpression were determined by immunofluorescence staining (b) (magnificβ-actin was used as an inner control. Data are shown as mean ± SD. **P < 0CNE-1- scramble shRNA or CNE-2-empty vector
E2F target genes depend on the integrity of the Rb path-way and do not occur in reversibly arrested cells [33].Often lost in a variety of malignancies, p16 acts as an allo-steric inhibitor of the CDK4/6 complex to prevent itsinteraction with cyclin D1, inducing cell cycle arrest andsenescence by activating the Rb pathway [34]. The CDK4/
E-2 cells on cell senescence. a Cell senescence was determined byrochromatin markers H3K9Me3 and HP1γ location and proteination: ×400; red: Alexa Fluor® 568) and western blot (c), respectively..01, ***P < 0.001 vs. CNE-1 or CNE-2; ##P < 0.01, ###P < 0.001 vs.
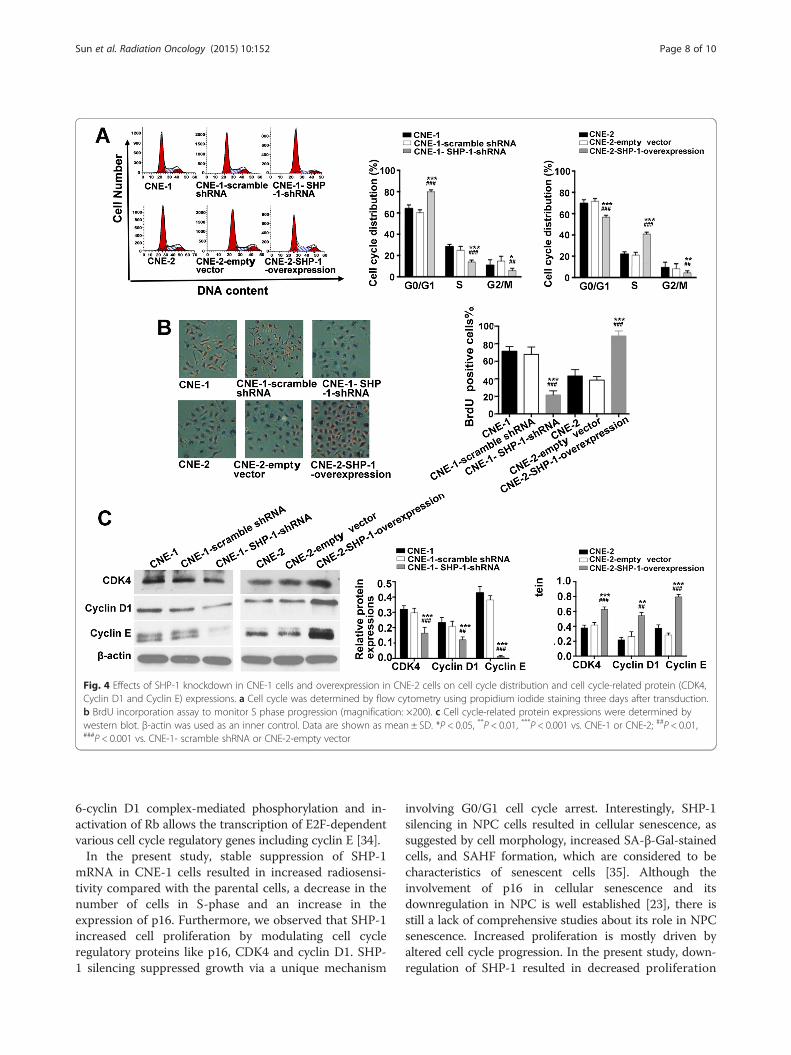
Fig. 4 Effects of SHP-1 knockdown in CNE-1 cells and overexpression in CNE-2 cells on cell cycle distribution and cell cycle-related protein (CDK4,Cyclin D1 and Cyclin E) expressions. a Cell cycle was determined by flow cytometry using propidium iodide staining three days after transduction.b BrdU incorporation assay to monitor S phase progression (magnification: ×200). c Cell cycle-related protein expressions were determined bywestern blot. β-actin was used as an inner control. Data are shown as mean ± SD. *P < 0.05, **P < 0.01, ***P < 0.001 vs. CNE-1 or CNE-2; ##P < 0.01,###P < 0.001 vs. CNE-1- scramble shRNA or CNE-2-empty vector
Sun et al. Radiation Oncology (2015) 10:152 Page 8 of 10
6-cyclin D1 complex-mediated phosphorylation and in-activation of Rb allows the transcription of E2F-dependentvarious cell cycle regulatory genes including cyclin E [34].In the present study, stable suppression of SHP-1
mRNA in CNE-1 cells resulted in increased radiosensi-tivity compared with the parental cells, a decrease in thenumber of cells in S-phase and an increase in theexpression of p16. Furthermore, we observed that SHP-1increased cell proliferation by modulating cell cycleregulatory proteins like p16, CDK4 and cyclin D1. SHP-1 silencing suppressed growth via a unique mechanism
involving G0/G1 cell cycle arrest. Interestingly, SHP-1silencing in NPC cells resulted in cellular senescence, assuggested by cell morphology, increased SA-β-Gal-stainedcells, and SAHF formation, which are considered to becharacteristics of senescent cells [35]. Although theinvolvement of p16 in cellular senescence and itsdownregulation in NPC is well established [23], there isstill a lack of comprehensive studies about its role in NPCsenescence. Increased proliferation is mostly driven byaltered cell cycle progression. In the present study, down-regulation of SHP-1 resulted in decreased proliferation
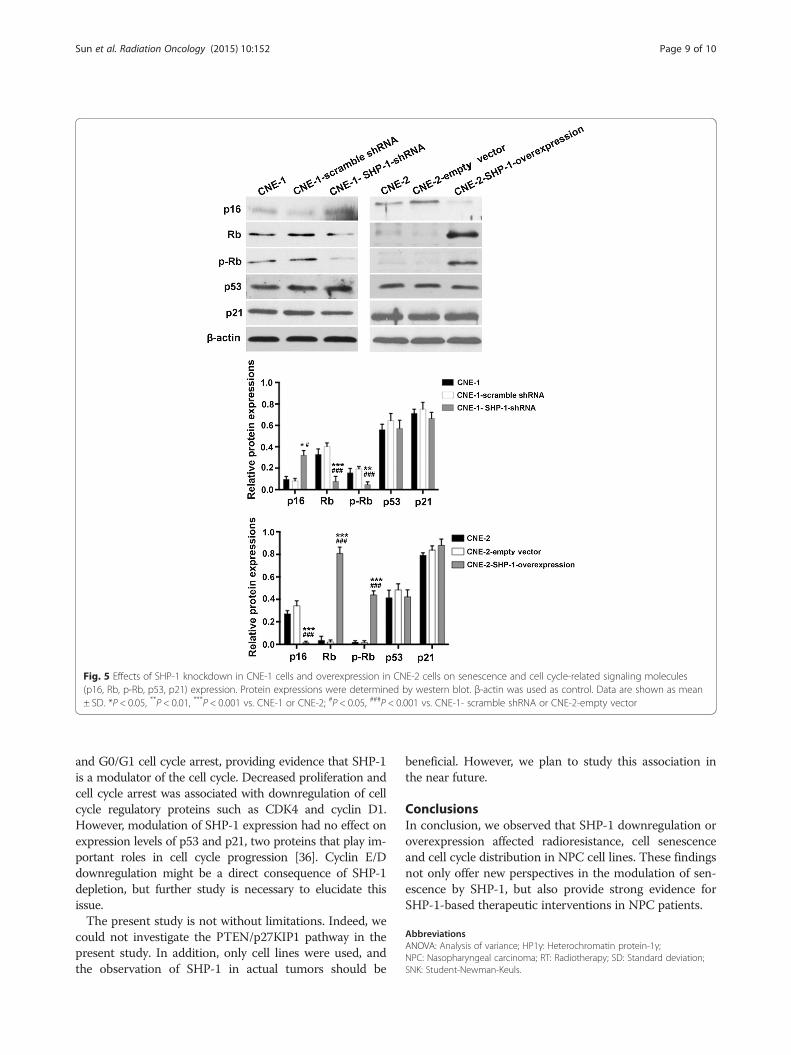
Fig. 5 Effects of SHP-1 knockdown in CNE-1 cells and overexpression in CNE-2 cells on senescence and cell cycle-related signaling molecules(p16, Rb, p-Rb, p53, p21) expression. Protein expressions were determined by western blot. β-actin was used as control. Data are shown as mean± SD. *P < 0.05, **P < 0.01, ***P < 0.001 vs. CNE-1 or CNE-2; #P < 0.05, ###P < 0.001 vs. CNE-1- scramble shRNA or CNE-2-empty vector
Sun et al. Radiation Oncology (2015) 10:152 Page 9 of 10
and G0/G1 cell cycle arrest, providing evidence that SHP-1is a modulator of the cell cycle. Decreased proliferation andcell cycle arrest was associated with downregulation of cellcycle regulatory proteins such as CDK4 and cyclin D1.However, modulation of SHP-1 expression had no effect onexpression levels of p53 and p21, two proteins that play im-portant roles in cell cycle progression [36]. Cyclin E/Ddownregulation might be a direct consequence of SHP-1depletion, but further study is necessary to elucidate thisissue.The present study is not without limitations. Indeed, we
could not investigate the PTEN/p27KIP1 pathway in thepresent study. In addition, only cell lines were used, andthe observation of SHP-1 in actual tumors should be
beneficial. However, we plan to study this association inthe near future.
ConclusionsIn conclusion, we observed that SHP-1 downregulation oroverexpression affected radioresistance, cell senescenceand cell cycle distribution in NPC cell lines. These findingsnot only offer new perspectives in the modulation of sen-escence by SHP-1, but also provide strong evidence forSHP-1-based therapeutic interventions in NPC patients.
AbbreviationsANOVA: Analysis of variance; HP1γ: Heterochromatin protein-1γ;NPC: Nasopharyngeal carcinoma; RT: Radiotherapy; SD: Standard deviation;SNK: Student-Newman-Keuls.
Sun et al. Radiation Oncology (2015) 10:152 Page 10 of 10
Competing interestsThe authors declare that they have no competing interests.
Authors’ contributionsZYS and XFP carried out the study design, data collection and analysis, wrotethe manuscript. ZWZ, QD and GW participated in data collection, statisticalanalysis, and provided the critical revision. GP conceived of the study, andparticipated in its design and coordination and provided the critical revision.All authors read and approved the final manuscript.
Authors’ informationZiyi Sun and Xiaofen Pan are co-first author.
AcknowledgementsThis work was supported by grants from the Natural Sciences Foundation ofChina (No. 81301976) and the Wu Jieping Medical Foundation.
Author details1Cancer Center, Union hosipital, Wuhan 430022, Hubei Province, China.2Cancer center, Affliated Hospital of Guangdong Medical College, Zhanjiang524001, Guangdong Province, China.
Received: 2 March 2015 Accepted: 23 June 2015
References1. Wei WI, Sham JS. Nasopharyngeal carcinoma. Lancet. 2005;365:2041–54.2. Anantharaman D, Marron M, Lagiou P, Samoli E, Ahrens W, Pohlabeln H,
et al. Population attributable risk of tobacco and alcohol for upperaerodigestive tract cancer. Oral Oncol. 2011;47:725–31.
3. Freedman ND, Abnet CC, Leitzmann MF, Hollenbeck AR, Schatzkin A.Prospective investigation of the cigarette smoking-head and neck cancerassociation by sex. Cancer. 2007;110:1593–601.
4. Chan AT, Gregoire V, Lefebvre JL, Licitra L, Hui EP, Leung SF, et al.Nasopharyngeal cancer: EHNS-ESMO-ESTRO Clinical Practice Guidelines fordiagnosis, treatment and follow-up. Ann Oncol. 2012;23 Suppl 7:vii83–5.
5. Chien YC, Chen JY, Liu MY, Yang HI, Hsu MM, Chen CJ, et al. Serologicmarkers of Epstein-Barr virus infection and nasopharyngeal carcinoma in Tai-wanese men. N Engl J Med. 2001;345:1877–82.
6. Mork J, Lie AK, Glattre E, Hallmans G, Jellum E, Koskela P, et al. Humanpapillomavirus infection as a risk factor for squamous-cell carcinoma of thehead and neck. N Engl J Med. 2001;344:1125–31.
7. Medow MA, Weed HG, Schuller DE. Simple predictors of survival in headand neck squamous cell carcinoma. Arch Otolaryngol Head Neck Surg.2002;128:1282–6.
8. Fang FM, Chien CY, Tsai WL, Chen HC, Hsu HC, Lui CC, et al. Quality of lifeand survival outcome for patients with nasopharyngeal carcinoma receivingthree-dimensional conformal radiotherapy vs. intensity-modulatedradiotherapy-a longitudinal study. Int J Radiat Oncol Biol Phys. 2008;72:356–64.
9. Yeh SA, Tang Y, Lui CC, Huang YJ, Huang EY. Treatment outcomes and latecomplications of 849 patients with nasopharyngeal carcinoma treated withradiotherapy alone. Int J Radiat Oncol Biol Phys. 2005;62:672–9.
10. Feng XP, Yi H, Li MY, Li XH, Yi B, Zhang PF, et al. Identification of biomarkersfor predicting nasopharyngeal carcinoma response to radiotherapy byproteomics. Cancer Res. 2010;70:3450–62.
11. Chang JT, Chan SH, Lin CY, Lin TY, Wang HM, Liao CT, et al. Differentiallyexpressed genes in radioresistant nasopharyngeal cancer cells: gp96 andGDF15. Mol Cancer Ther. 2007;6:2271–9.
12. Qu C, Liang Z, Huang J, Zhao R, Su C, Wang S, et al. MiR-205 determinesthe radioresistance of human nasopharyngeal carcinoma by directly targetingPTEN. Cell Cycle. 2012;11:785–96.
13. Lorenz U. SHP-1 and SHP-2 in T cells: two phosphatases functioning atmany levels. Immunol Rev. 2009;228:342–59.
14. Wu C, Sun M, Liu L, Zhou GW. The function of the protein tyrosinephosphatase SHP-1 in cancer. Gene. 2003;306:1–12.
15. Evren S, Wan S, Ma XZ, Fahim S, Mody N, Sakac D, et al. Characterization ofSHP-1 protein tyrosine phosphatase transcripts, protein isoforms andphosphatase activity in epithelial cancer cells. Genomics. 2013;102:491–9.
16. Amin S, Kumar A, Nilchi L, Wright K, Kozlowski M. Breast cancer cellsproliferation is regulated by tyrosine phosphatase SHP1 through c-jun
N-terminal kinase and cooperative induction of RFX-1 and AP-4 transcriptionfactors. Mol Cancer Res. 2011;9:1112–25.
17. Sharpless NE, DePinho RA. Cancer: crime and punishment. Nature.2005;436:636–7.
18. Cairney CJ, Bilsland AE, Evans TR, Roffey J, Bennett DC, Narita M, et al.Cancer cell senescence: a new frontier in drug development. Drug DiscovToday. 2012;17:269–76.
19. Campisi J. Aging, cellular senescence, and cancer. Annu Rev Physiol.2013;75:685–705.
20. Reinhardt HC, Schumacher B. The p53 network: cellular and systemic DNAdamage responses in aging and cancer. Trends Genet. 2012;28:128–36.
21. Purvis JE, Karhohs KW, Mock C, Batchelor E, Loewer A, Lahav G. p53dynamics control cell fate. Science. 2012;336:1440–4.
22. Bian Y, Hall B, Sun ZJ, Molinolo A, Chen W, Gutkind JS, et al. Loss of TGF-beta signaling and PTEN promotes head and neck squamous cell carcinomathrough cellular senescence evasion and cancer-related inflammation.Oncogene. 2012;31:3322–32.
23. Peng G, Cao RB, Li YH, Zou ZW, Huang J, Ding Q. Alterations of cell cyclecontrol proteins SHP1/2, p16, CDK4 and cyclin D1 in radioresistantnasopharyngeal carcinoma cells. Mol Med Rep. 2014;10:1709–16.
24. Hwang CF, Cho CL, Huang CC, Wang JS, Shih YL, Su CY, et al. Loss of cyclinD1 and p16 expression correlates with local recurrence in nasopharyngealcarcinoma following radiotherapy. Ann Oncol. 2002;13:1246–51.
25. Zeng Y. Establishment of an epitheloid cell line and a fusiform cell line froma patient with nasopharyngeal carcinoma. Sci Sin. 1978;21:127–34.
26. Gu S, Tang W, Zeng Y, Zhao M. An epithelial cell line established frompoorly differentiated nasopharyngeal carcinoma. Chin J Cancer. 1983;2:70–6.
27. He YX, Zhong PP, Yan SS, Liu L, Shi HL, Zeng MS, et al. DNA-dependentprotein kinase activity and radiosensitivity of nasopharyngeal carcinoma celllines CNE1/CNE2. Sheng Li Xue Bao. 2007;59:524–33.
28. Wang HM, Wu XY, Xia YF, Qian JY. Expression of ATM protein in nasopharyngealcarcinoma cell lines with different radiosensitivity. Ai Zheng. 2003;22:579–81.
29. Fan LC, Teng HW, Shiau CW, Lin H, Hung MH, Chen YL, et al. SHP-1 is atarget of regorafenib in colorectal cancer. Oncotarget. 2014;5:6243–51.
30. Li XN, Shu Q, Su JM, Perlaky L, Blaney SM, Lau CC. Valproic acid inducesgrowth arrest, apoptosis, and senescence in medulloblastomas byincreasing histone hyperacetylation and regulating expression of p21Cip1,CDK4, and CMYC. Mol Cancer Ther. 2005;4:1912–22.
31. Collado M, Gil J, Efeyan A, Guerra C, Schuhmacher AJ, Barradas M, et al.Tumour biology: senescence in premalignant tumours. Nature. 2005;436:642.
32. Maehara K, Yamakoshi K, Ohtani N, Kubo Y, Takahashi A, Arase S, et al.Reduction of total E2F/DP activity induces senescence-like cell cycle arrestin cancer cells lacking functional pRB and p53. J Cell Biol. 2005;168:553–60.
33. Narita M, Narita M, Krizhanovsky V, Nunez S, Chicas A, Hearn SA, et al. Anovel role for high-mobility group a proteins in cellular senescence and het-erochromatin formation. Cell. 2006;126:503–14.
34. Ely S, Di Liberto M, Niesvizky R, Baughn LB, Cho HJ, Hatada EN, et al.Mutually exclusive cyclin-dependent kinase 4/cyclin D1 and cyclin-dependent kinase 6/cyclin D2 pairing inactivates retinoblastoma proteinand promotes cell cycle dysregulation in multiple myeloma. Cancer Res.2005;65:11345–53.
35. Cho KA, Ryu SJ, Oh YS, Park JH, Lee JW, Kim HP, et al. Morphologicaladjustment of senescent cells by modulating caveolin-1 status. J Biol Chem.2004;279:42270–8.
36. Narayanan BA, Geoffroy O, Willingham MC, Re GG, Nixon DW. p53/p21(WAF1/CIP1) expression and its possible role in G1 arrest and apoptosisin ellagic acid treated cancer cells. Cancer Lett. 1999;136:215–21.


