Increase ROI by Digitally Transforming Your Marketing
34
WEBINAR INCREASE ROI BY DIGITALLY TRANSFORMING YOUR MARKETING 1
-
Upload
perficient-inc -
Category
Technology
-
view
174 -
download
1
Transcript of Increase ROI by Digitally Transforming Your Marketing
WEBINAR
INCREASE ROI BY DIGITALLY TRANSFORMINGYOUR MARKETING
1
WHO IS PERFICIENT?
PERFICIENT OVERVIEW
2
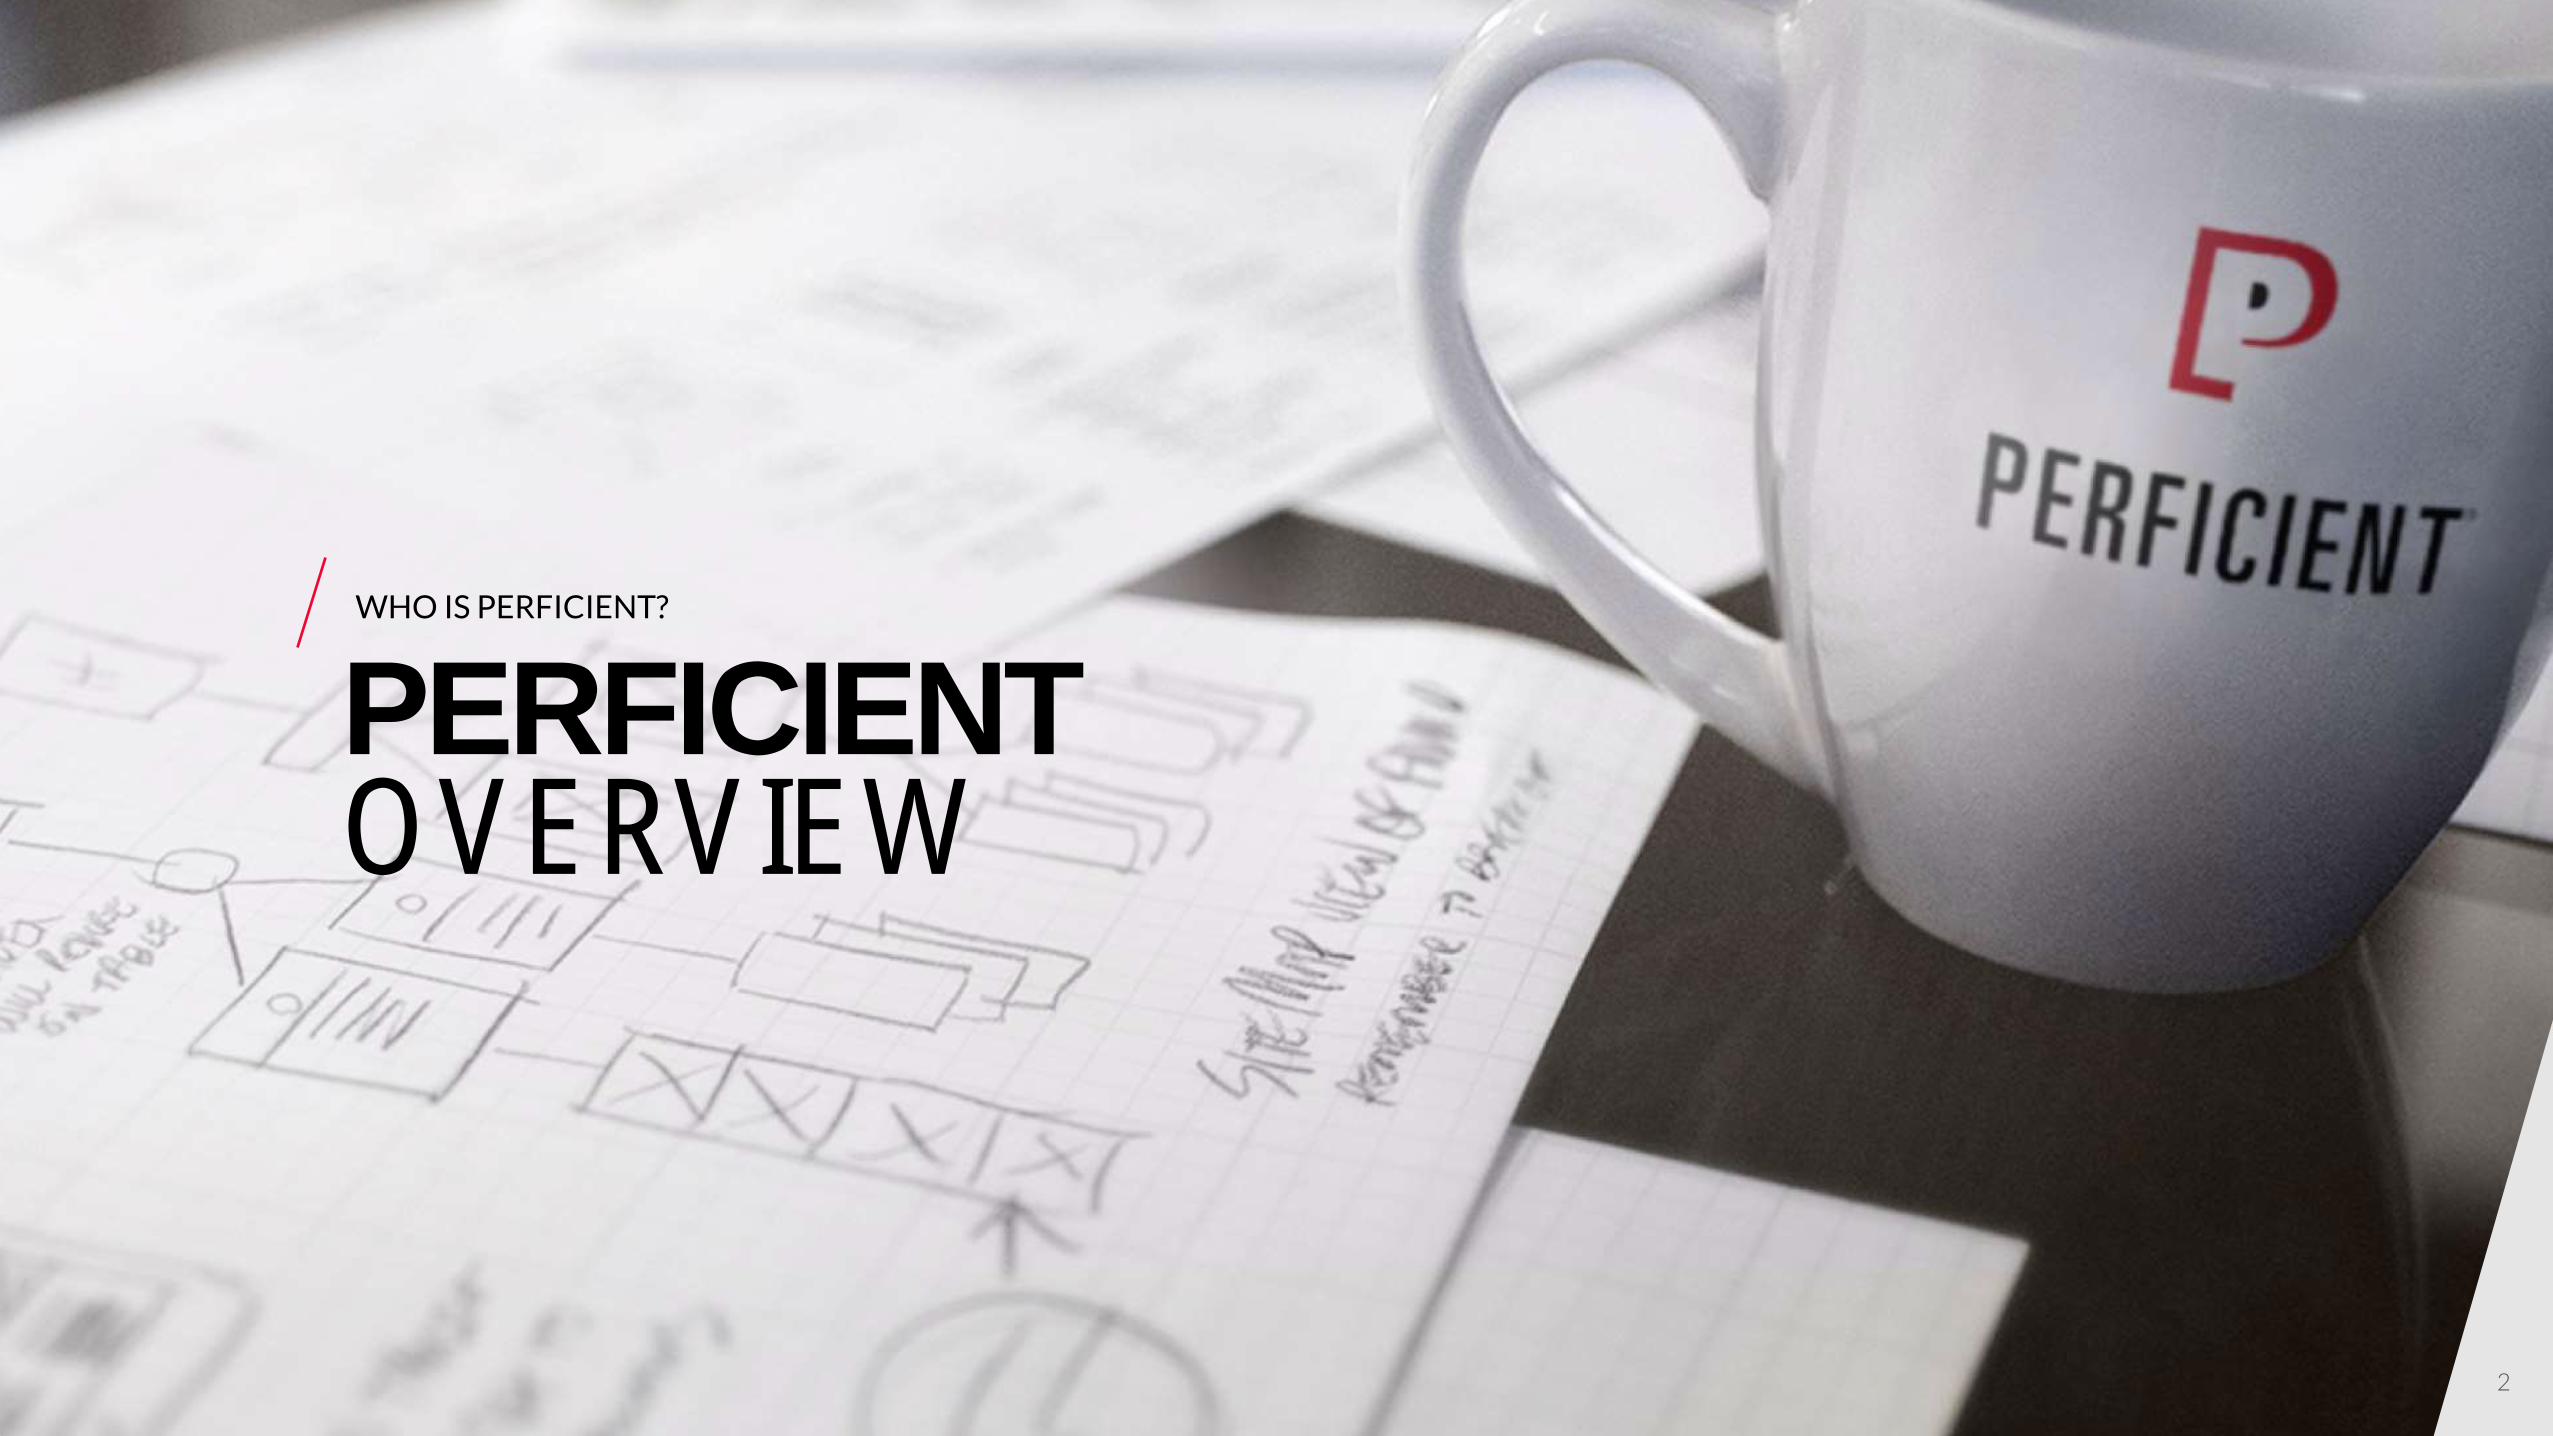
*2016 projection
$500+ Million in Revenue*
1997 Founded
PRFT Listed on NASDAQ
90% Repeat Business Rate
Employees2800+
N. America Locations23
Global US, EU, China + India
3
4
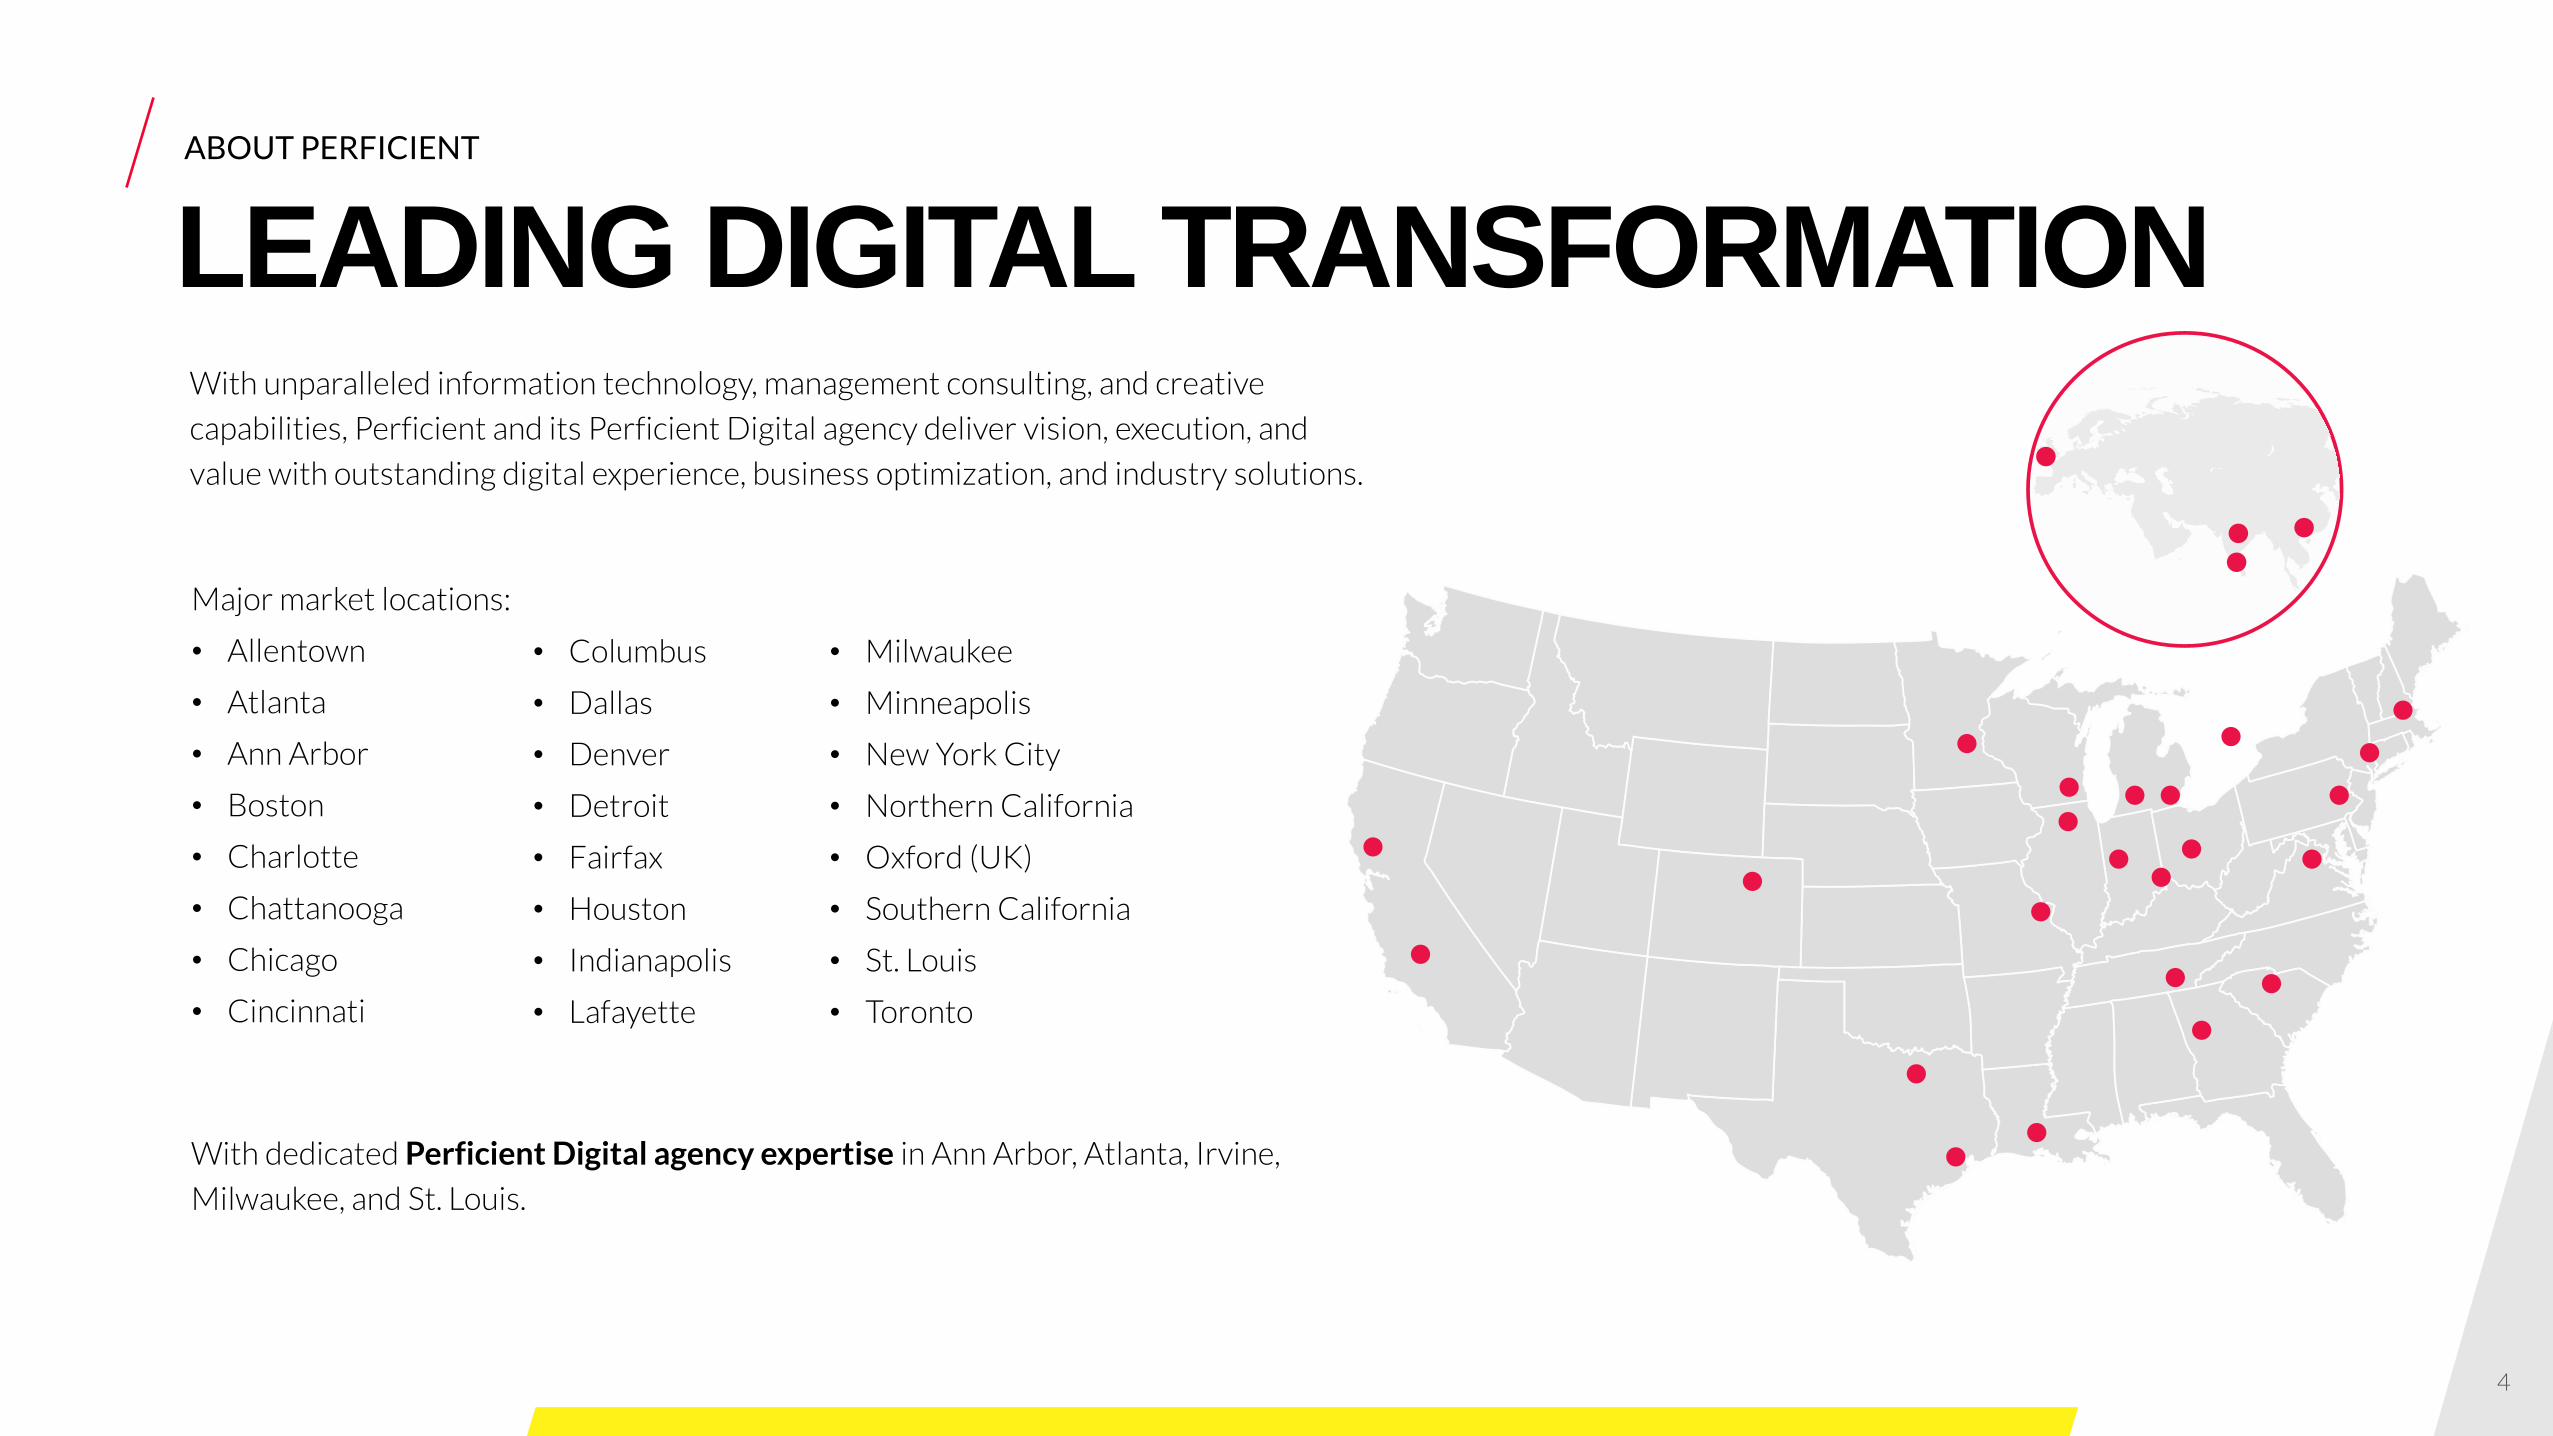
With unparalleled information technology, management consulting, and creative
capabilities, Perficient and its Perficient Digital agency deliver vision, execution, and
value with outstanding digital experience, business optimization, and industry solutions.
ABOUT PERFICIENT
LEADING DIGITAL TRANSFORMATION
Major market locations:
• Allentown
• Atlanta
• Ann Arbor
• Boston
• Charlotte
• Chattanooga
• Chicago
• Cincinnati
• Columbus
• Dallas
• Denver
• Detroit
• Fairfax
• Houston
• Indianapolis
• Lafayette
With dedicated Perficient Digital agency expertise in Ann Arbor, Atlanta, Irvine,
Milwaukee, and St. Louis.
• Milwaukee
• Minneapolis
• New York City
• Northern California
• Oxford (UK)
• Southern California
• St. Louis
• Toronto
5
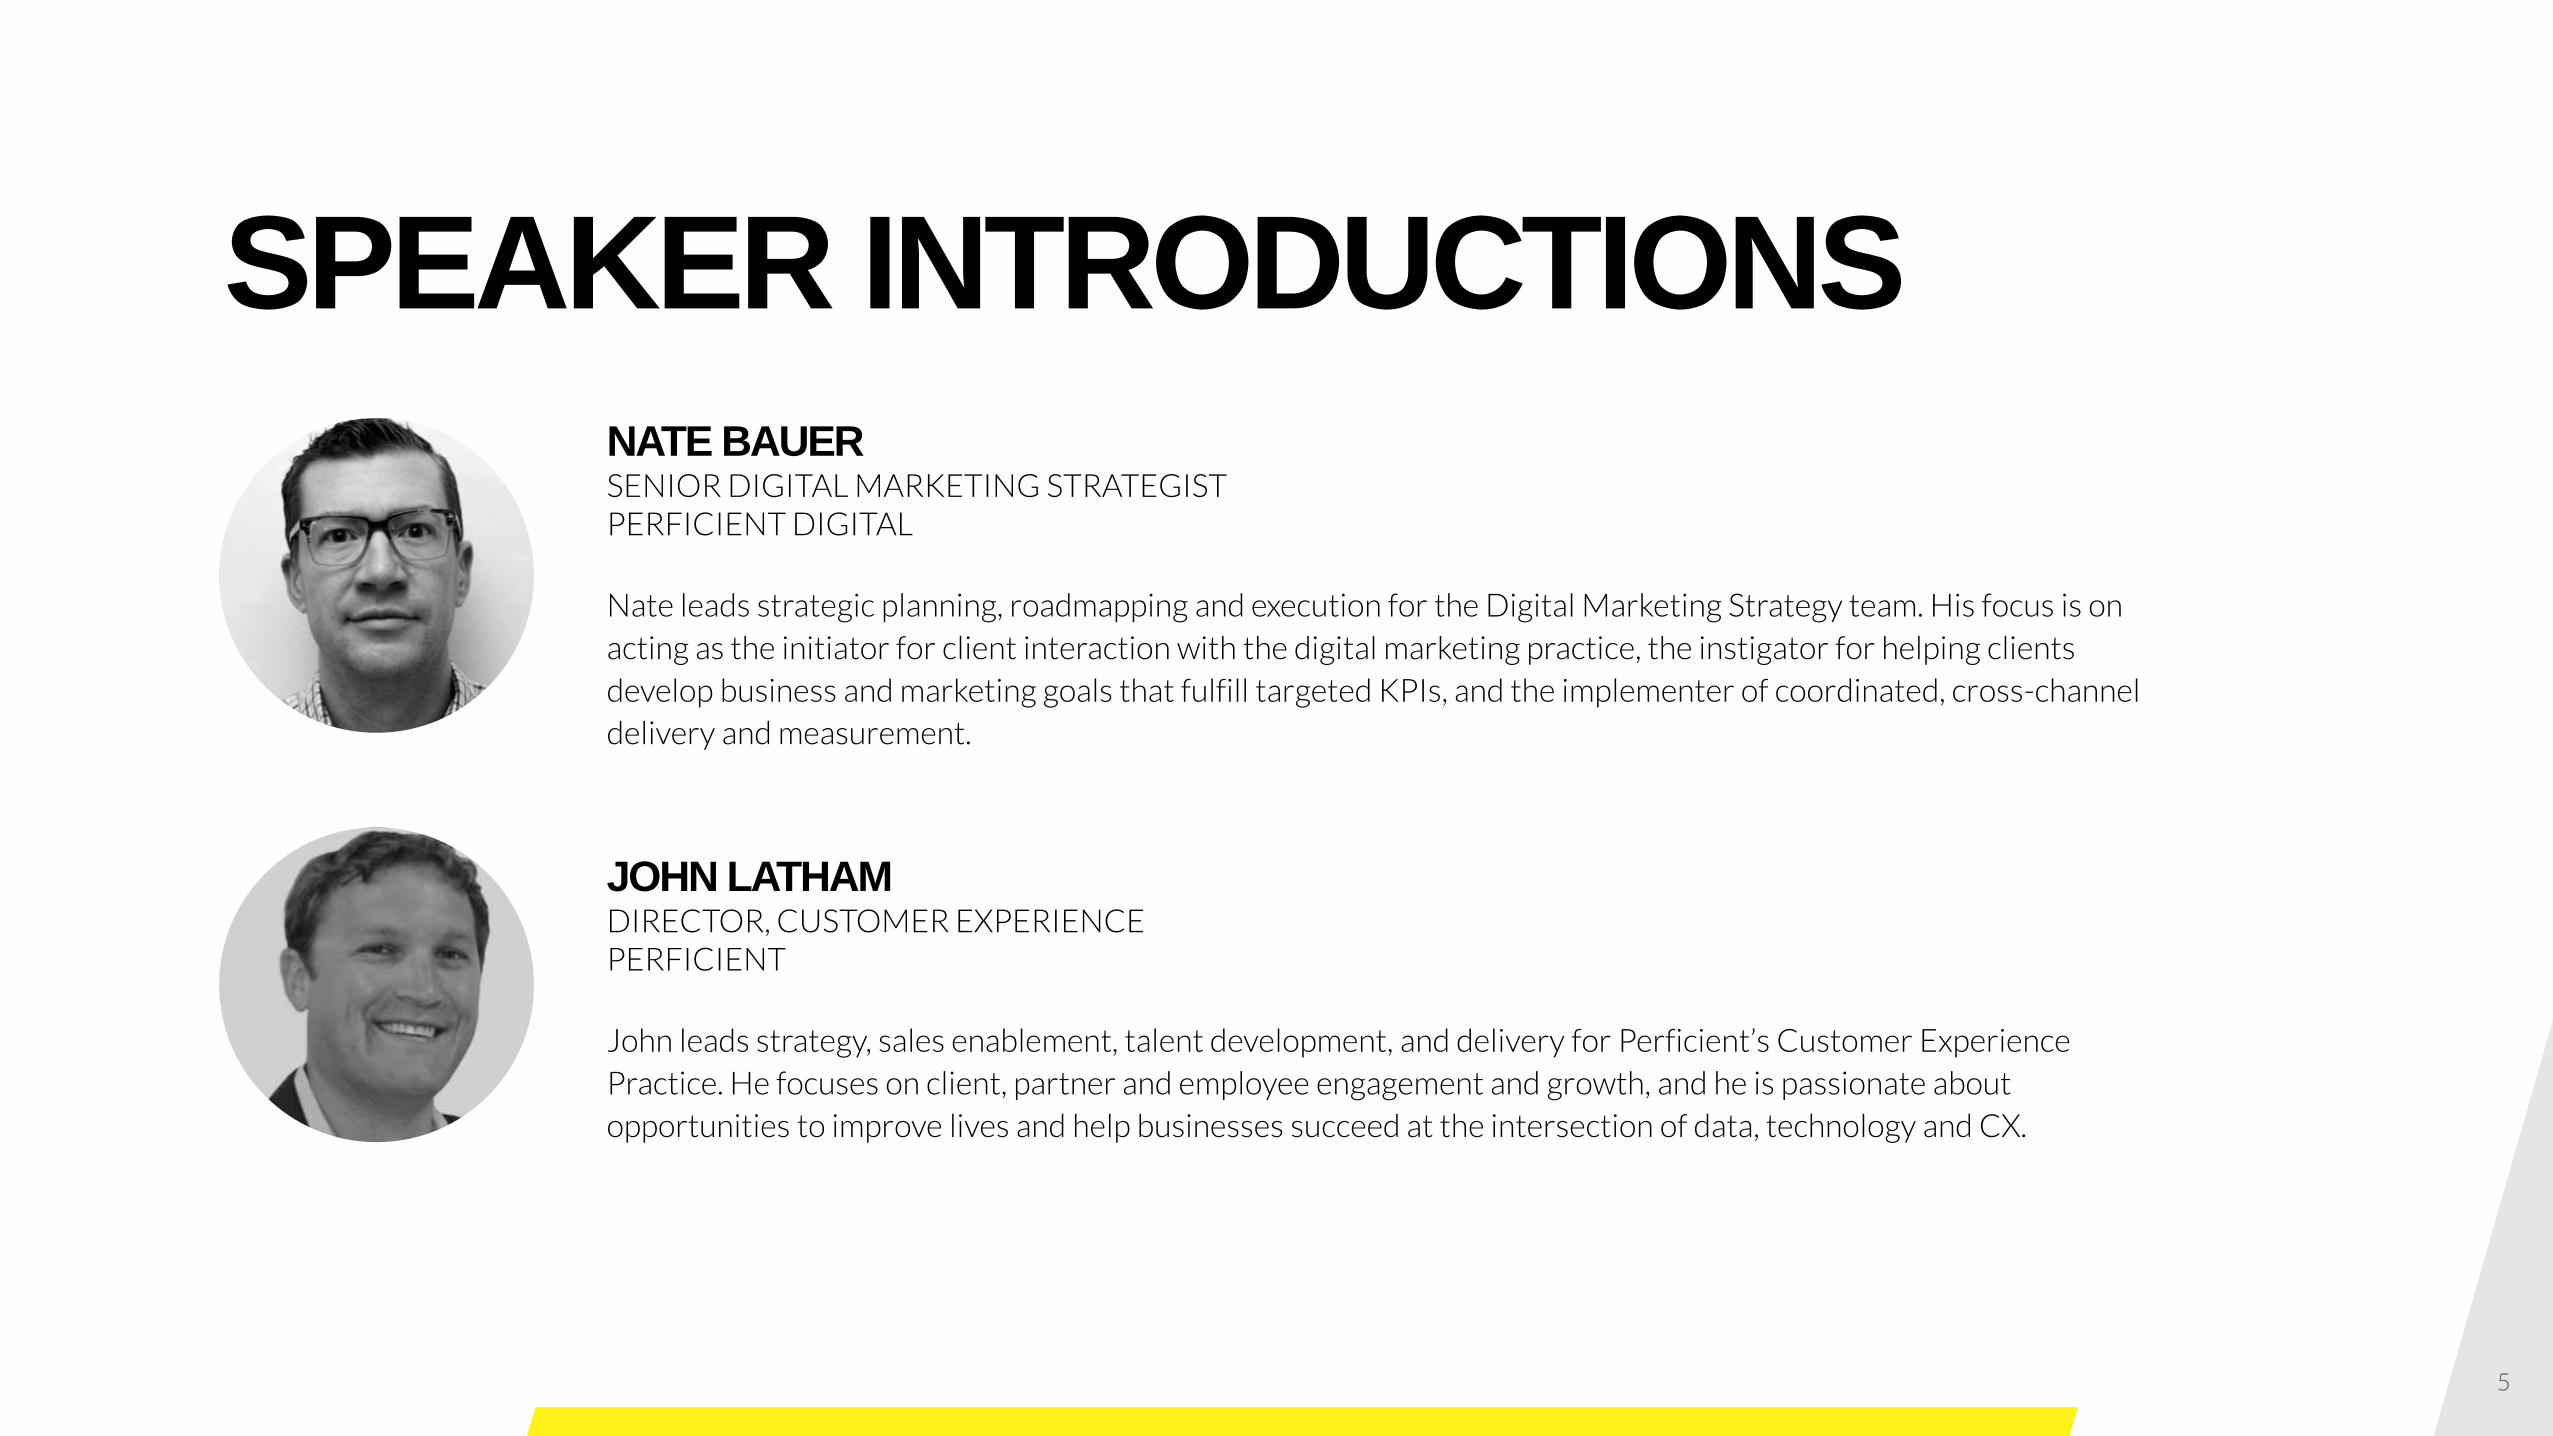
SPEAKER INTRODUCTIONS
JOHN LATHAMDIRECTOR, CUSTOMER EXPERIENCEPERFICIENT
John leads strategy, sales enablement, talent development, and delivery for Perficient’s Customer Experience
Practice. He focuses on client, partner and employee engagement and growth, and he is passionate about
opportunities to improve lives and help businesses succeed at the intersection of data, technology and CX.
NATE BAUERSENIOR DIGITAL MARKETING STRATEGIST PERFICIENT DIGITAL
Nate leads strategic planning, roadmapping and execution for the Digital Marketing Strategy team. His focus is on
acting as the initiator for client interaction with the digital marketing practice, the instigator for helping clients
develop business and marketing goals that fulfill targeted KPIs, and the implementer of coordinated, cross-channel
delivery and measurement.
6
AGENDA⟩ Backdrop: Impetus for Change
⟩ Digital Transformation Strategy
⟩ Digital Transformation Execution
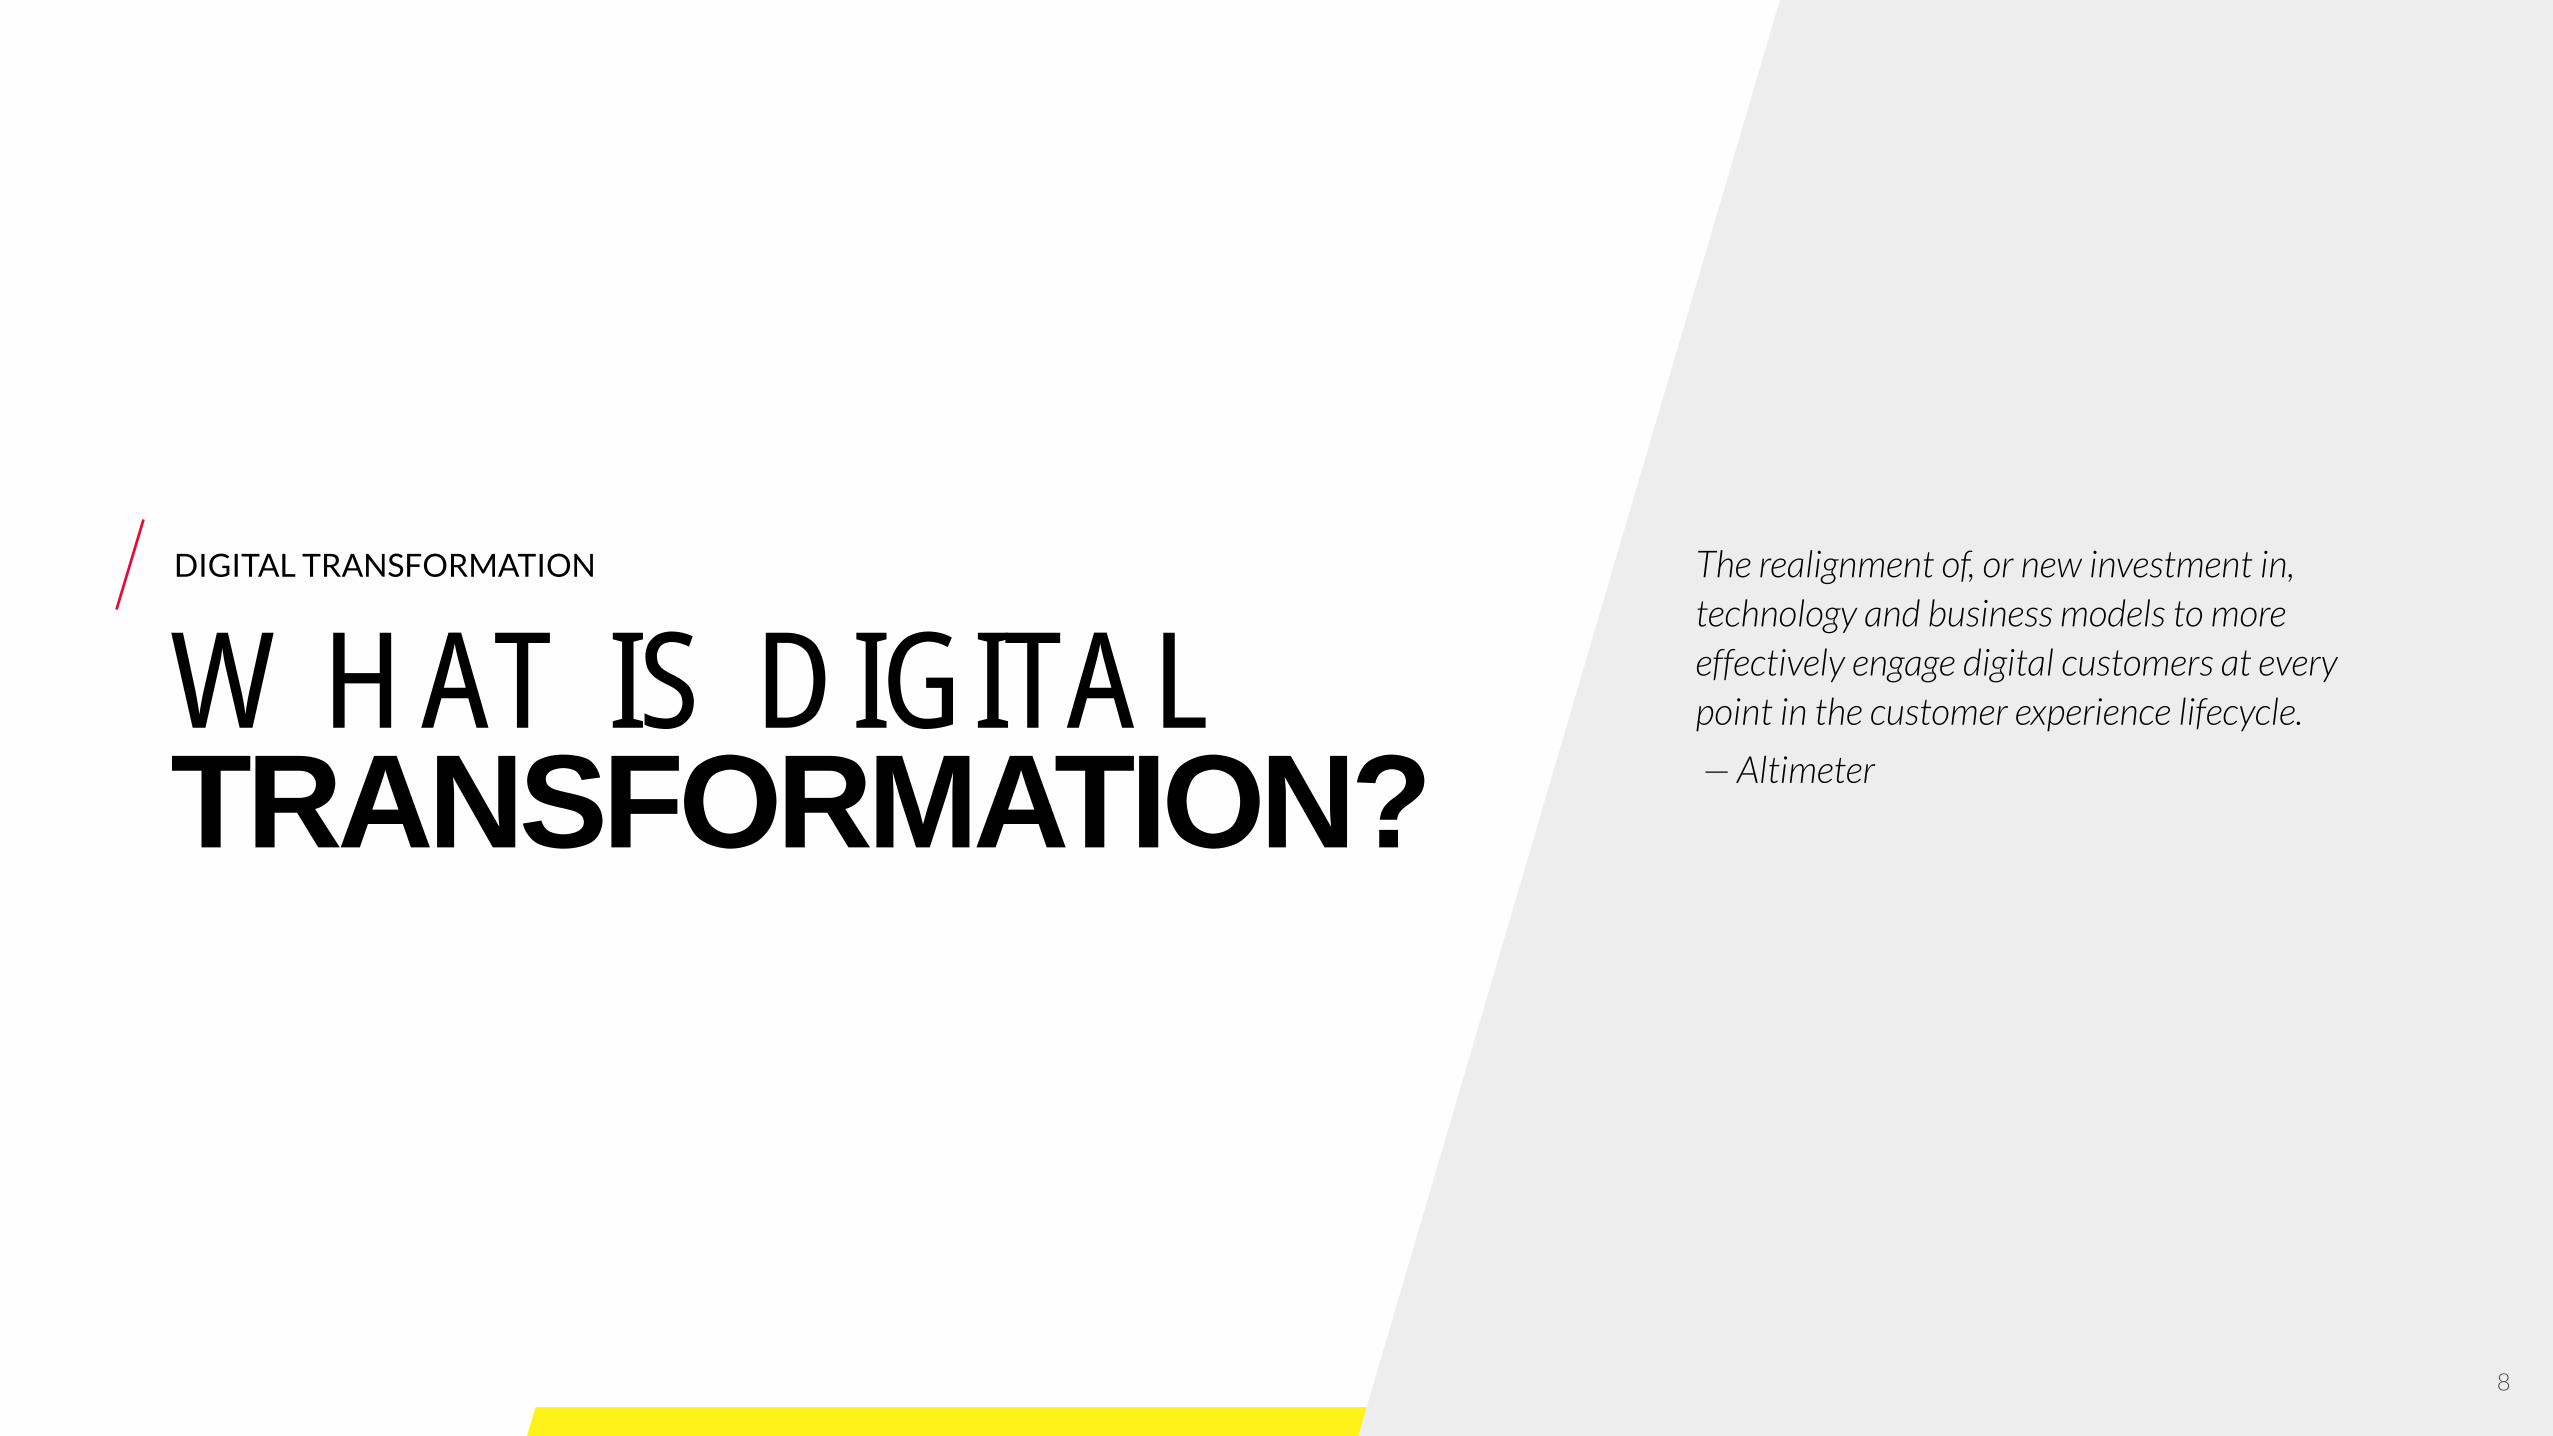
DIGITAL TRANSFORMATION
WHAT IS DIGITAL TRANSFORMATION?
The realignment of, or new investment in,
technology and business models to more
effectively engage digital customers at every
point in the customer experience lifecycle.
— Altimeter
8
DIGITAL TRANSFORMATION
WHY TRANSFORM?
9
10
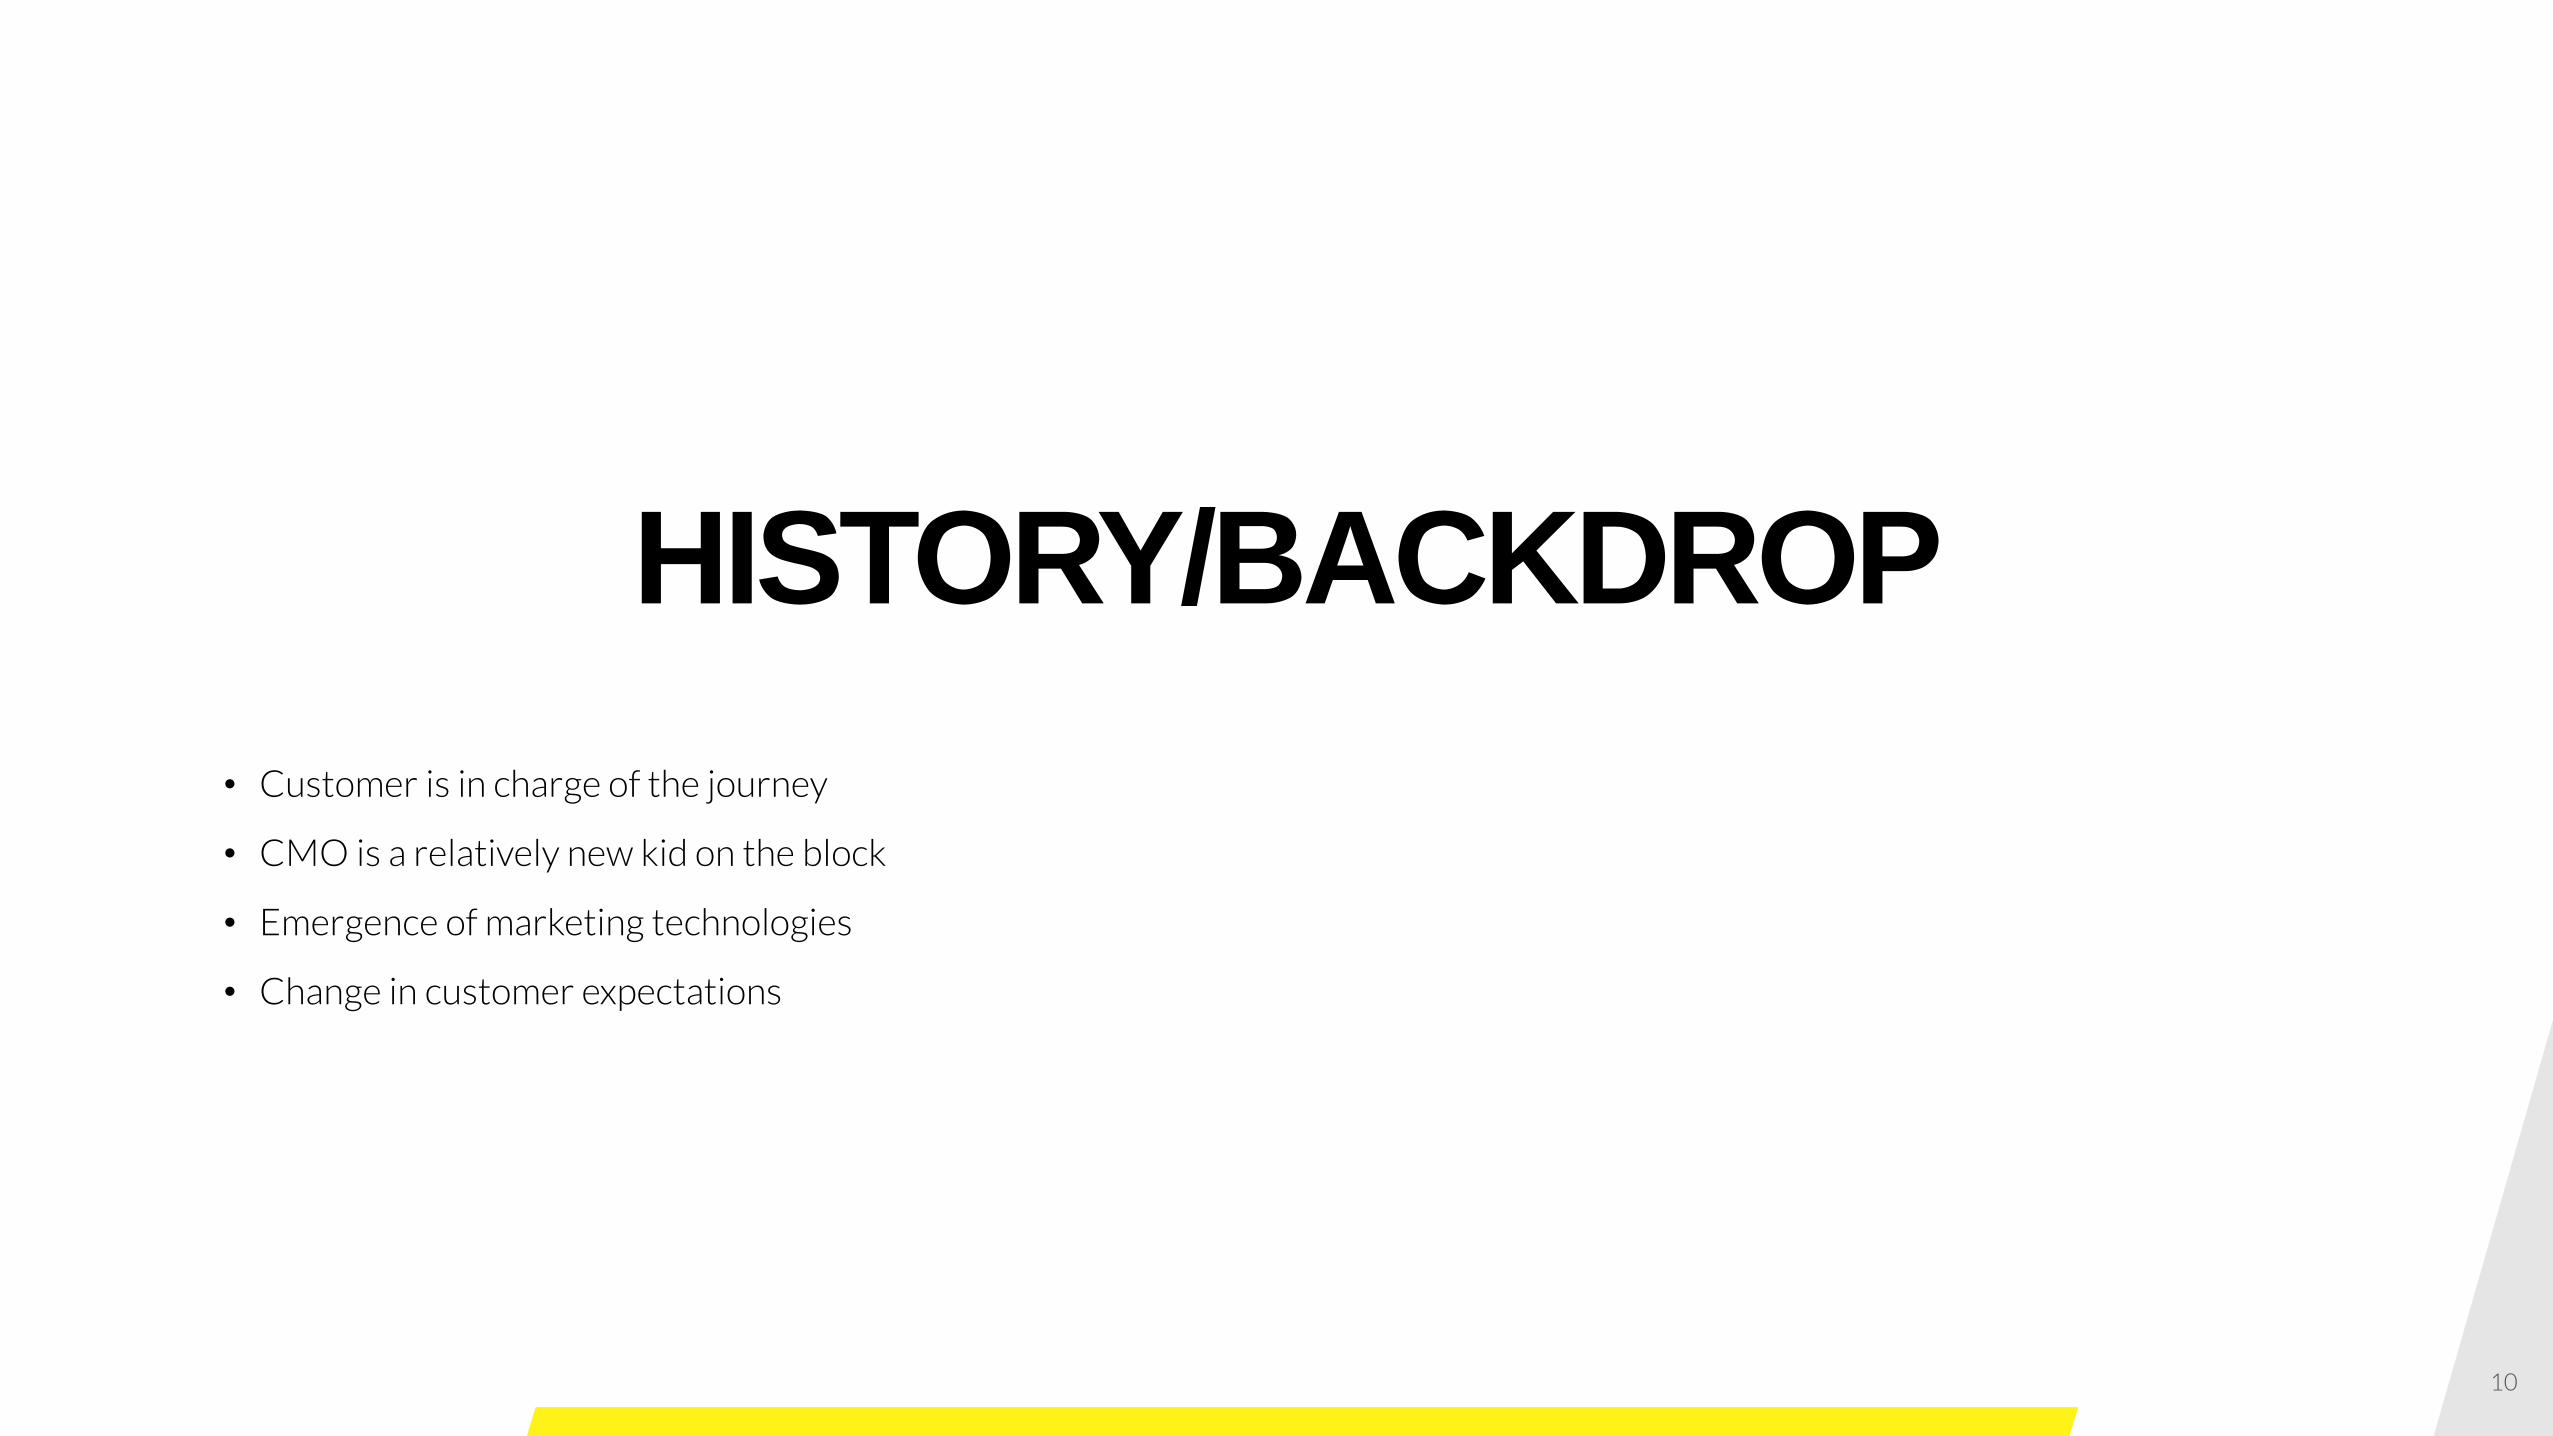
HISTORY/BACKDROP
• Customer is in charge of the journey
• CMO is a relatively new kid on the block
• Emergence of marketing technologies
• Change in customer expectations
11
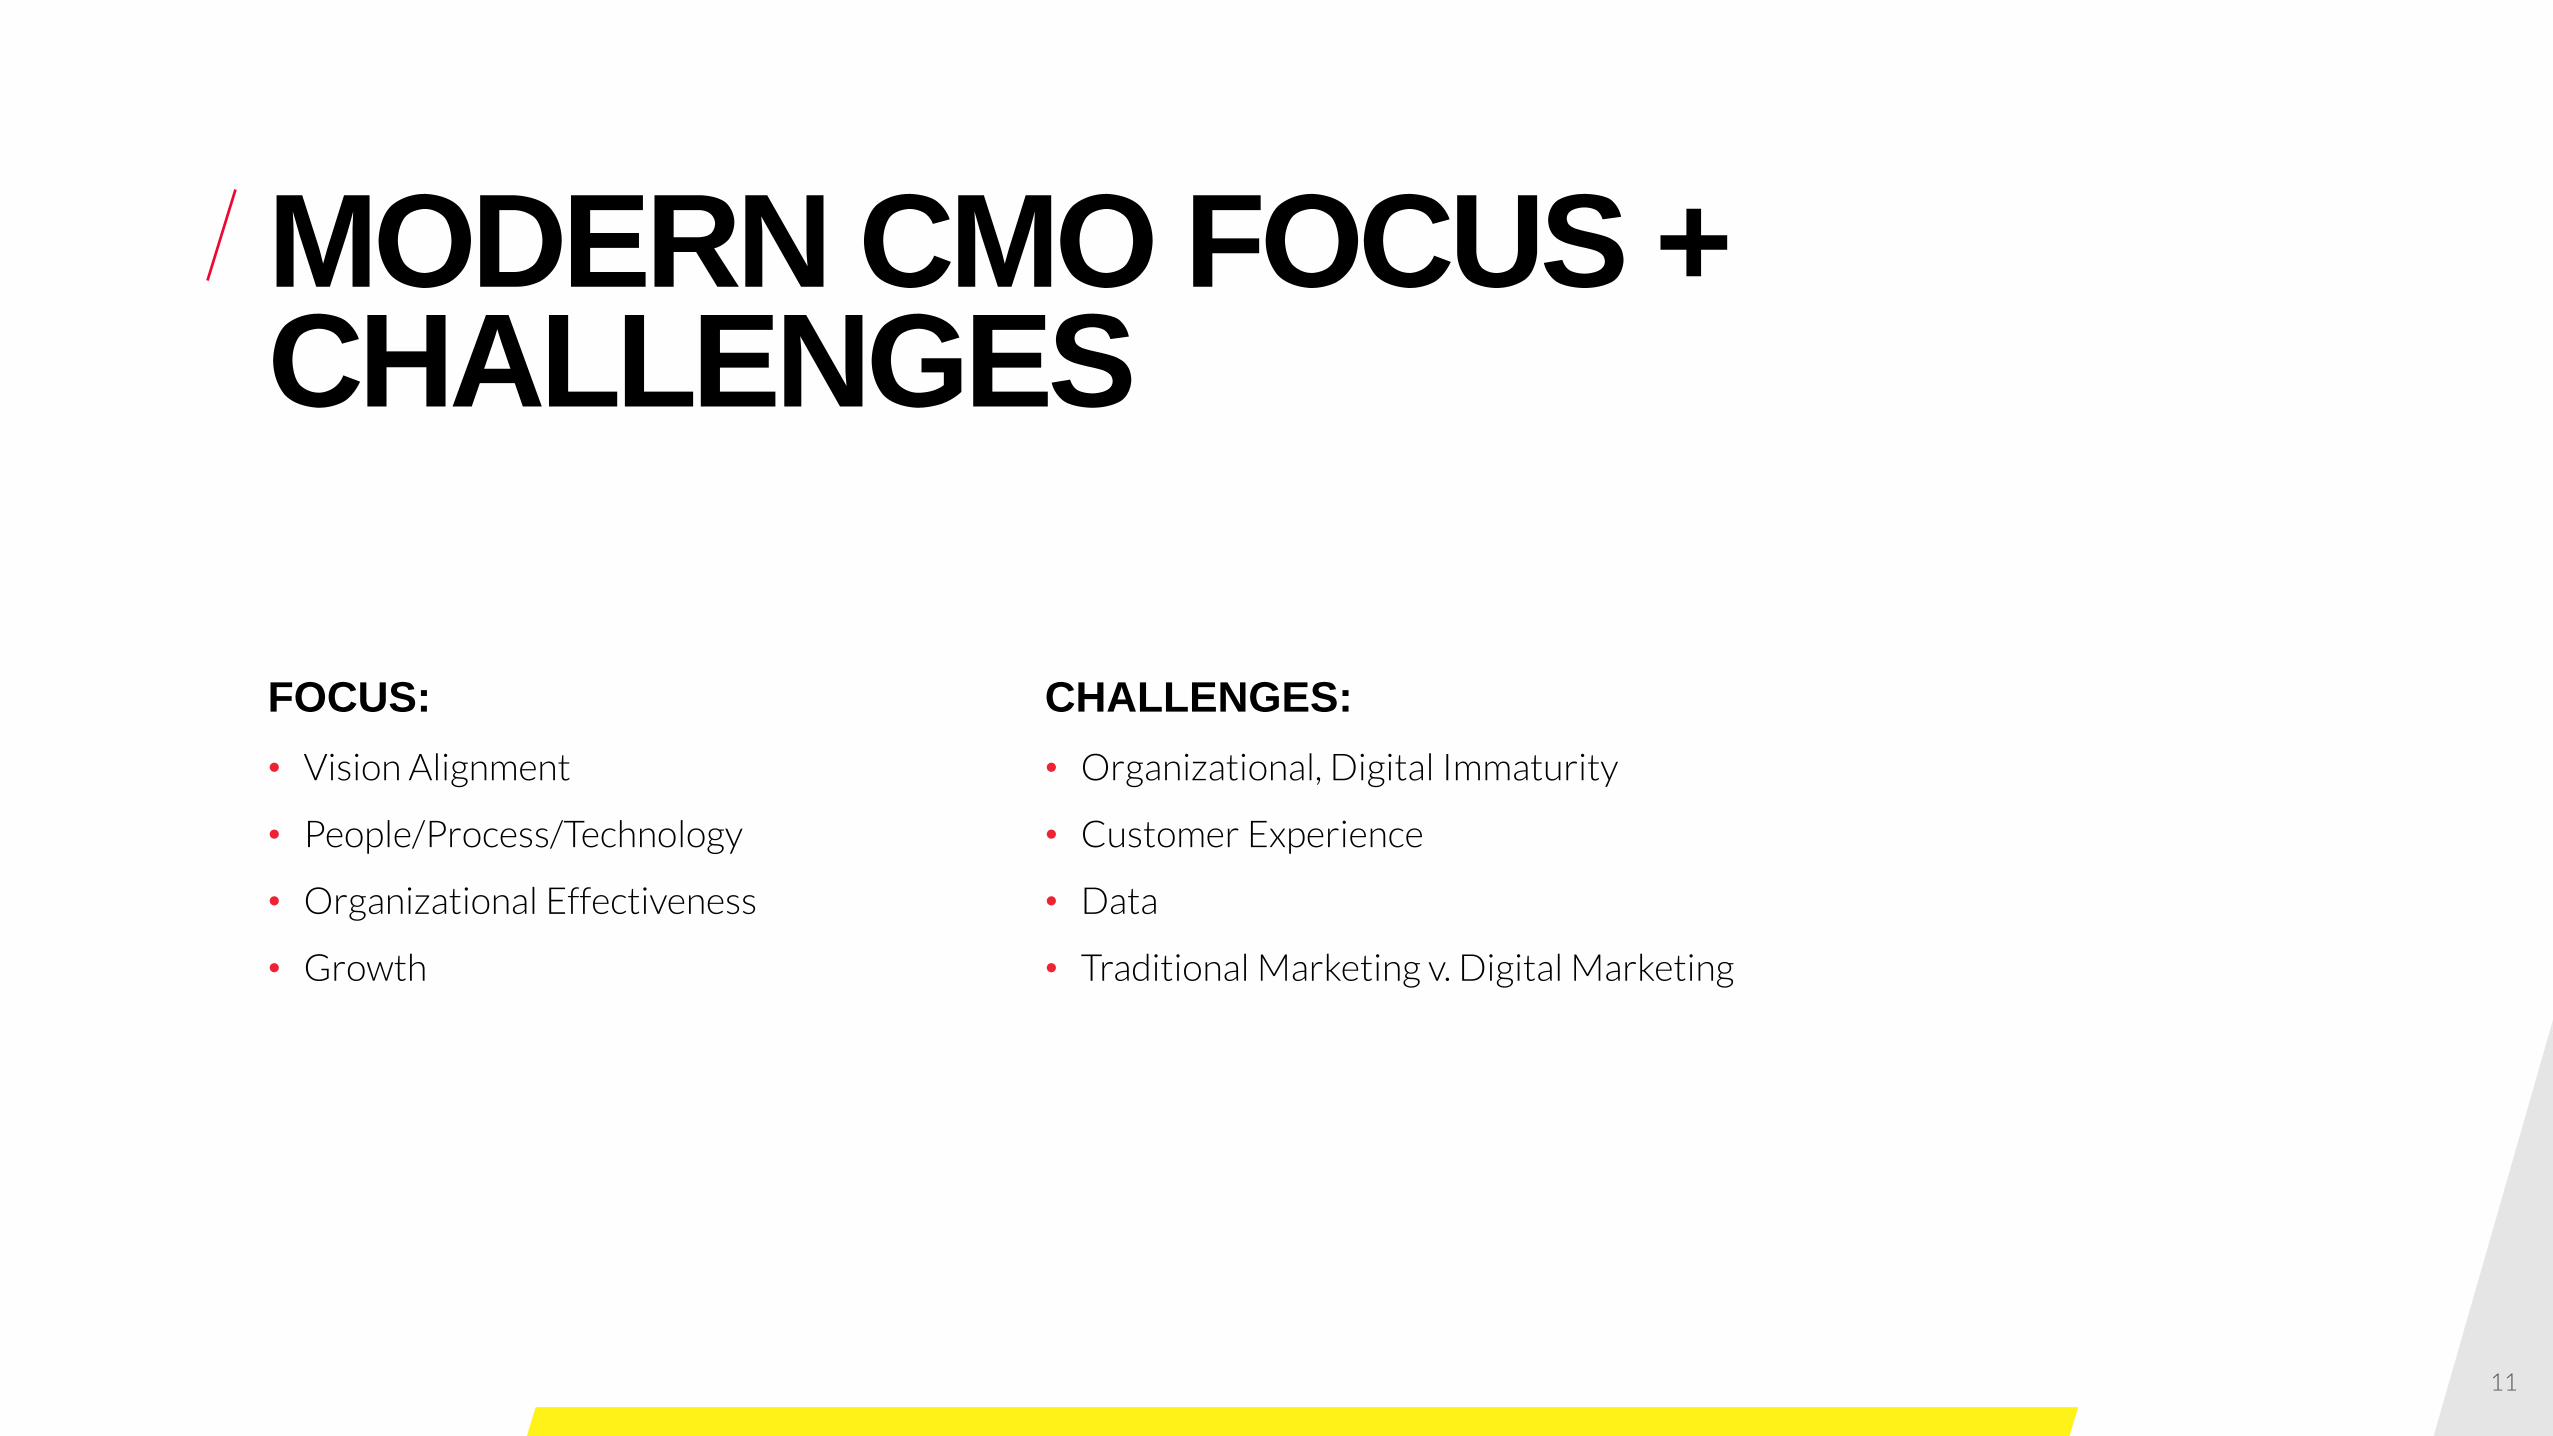
MODERN CMO FOCUS + CHALLENGES
CHALLENGES:
• Organizational, Digital Immaturity
• Customer Experience
• Data
• Traditional Marketing v. Digital Marketing
FOCUS:
• Vision Alignment
• People/Process/Technology
• Organizational Effectiveness
• Growth

12
OKAY, BUT HOW?
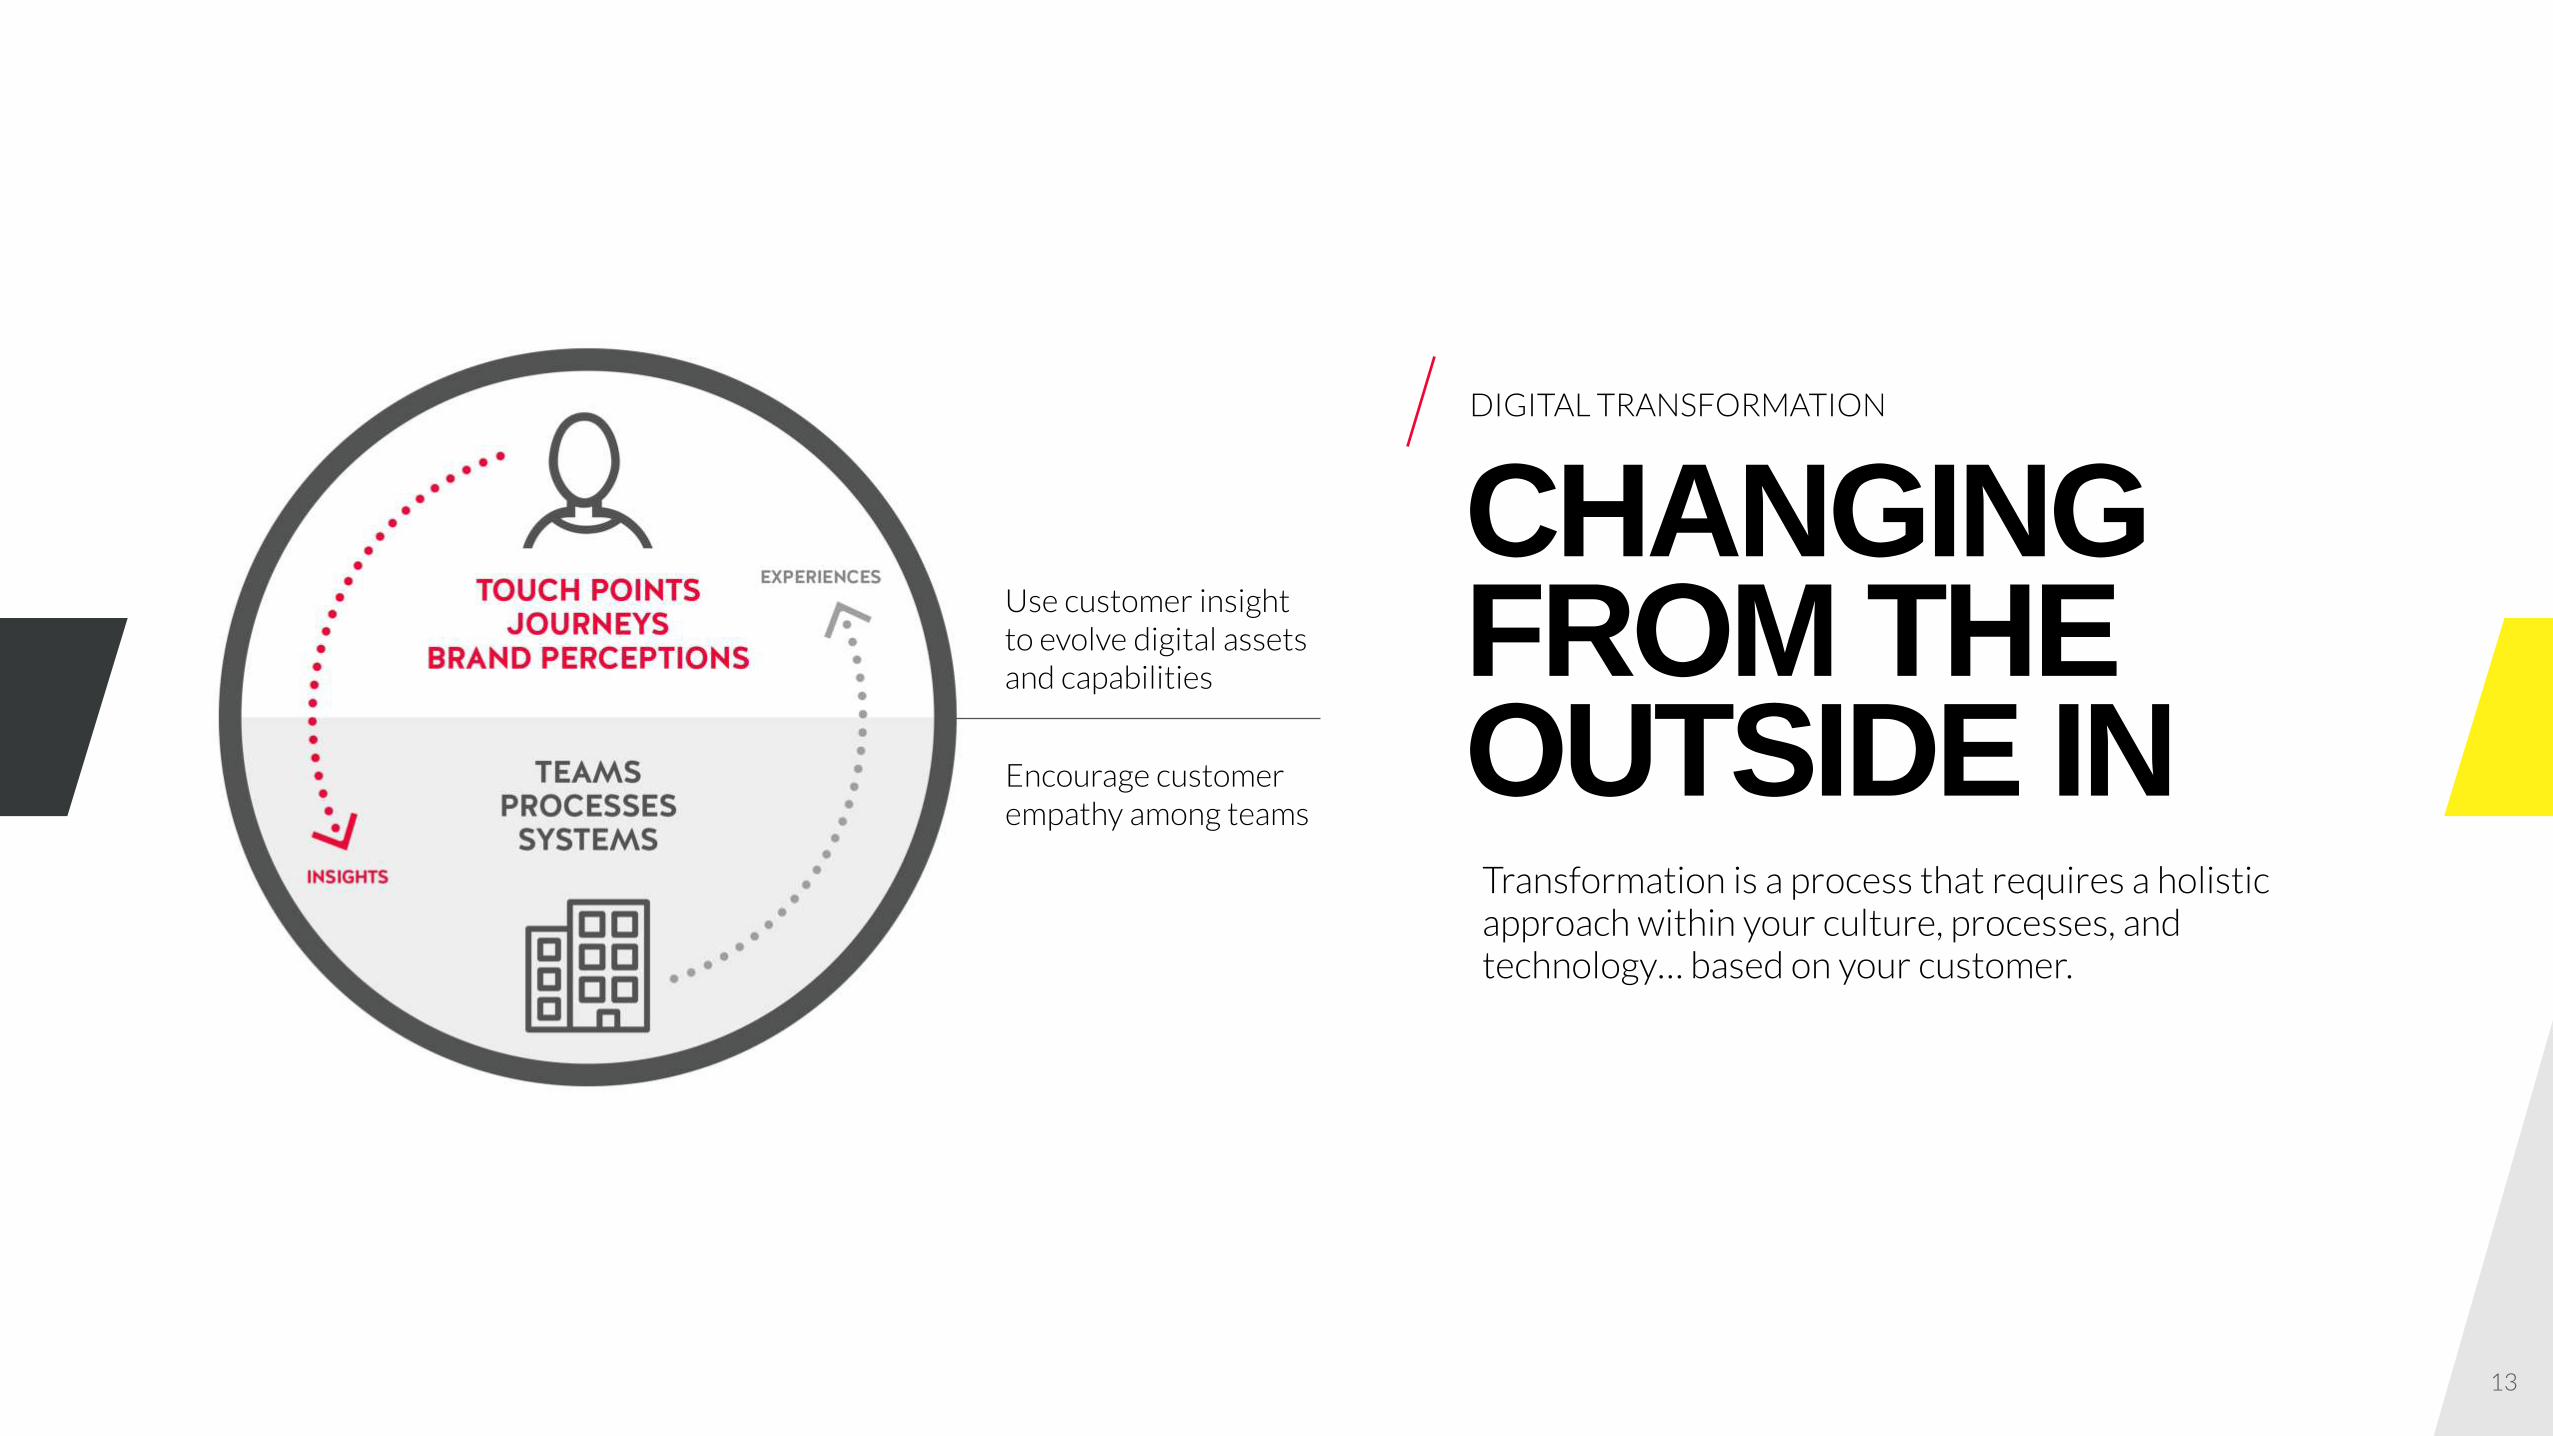
Use customer insight to evolve digital assets and capabilities
Encourage customer empathy among teams
DIGITAL TRANSFORMATION
CHANGING FROM THE OUTSIDE IN
Transformation is a process that requires a holistic approach within your culture, processes, and technology… based on your customer.
13

14
UNDERSTAND THE CUSTOMER• Customer Experience, Journey Map
• Qualitative & Quantitative Research
• Digital Opportunities & Gaps
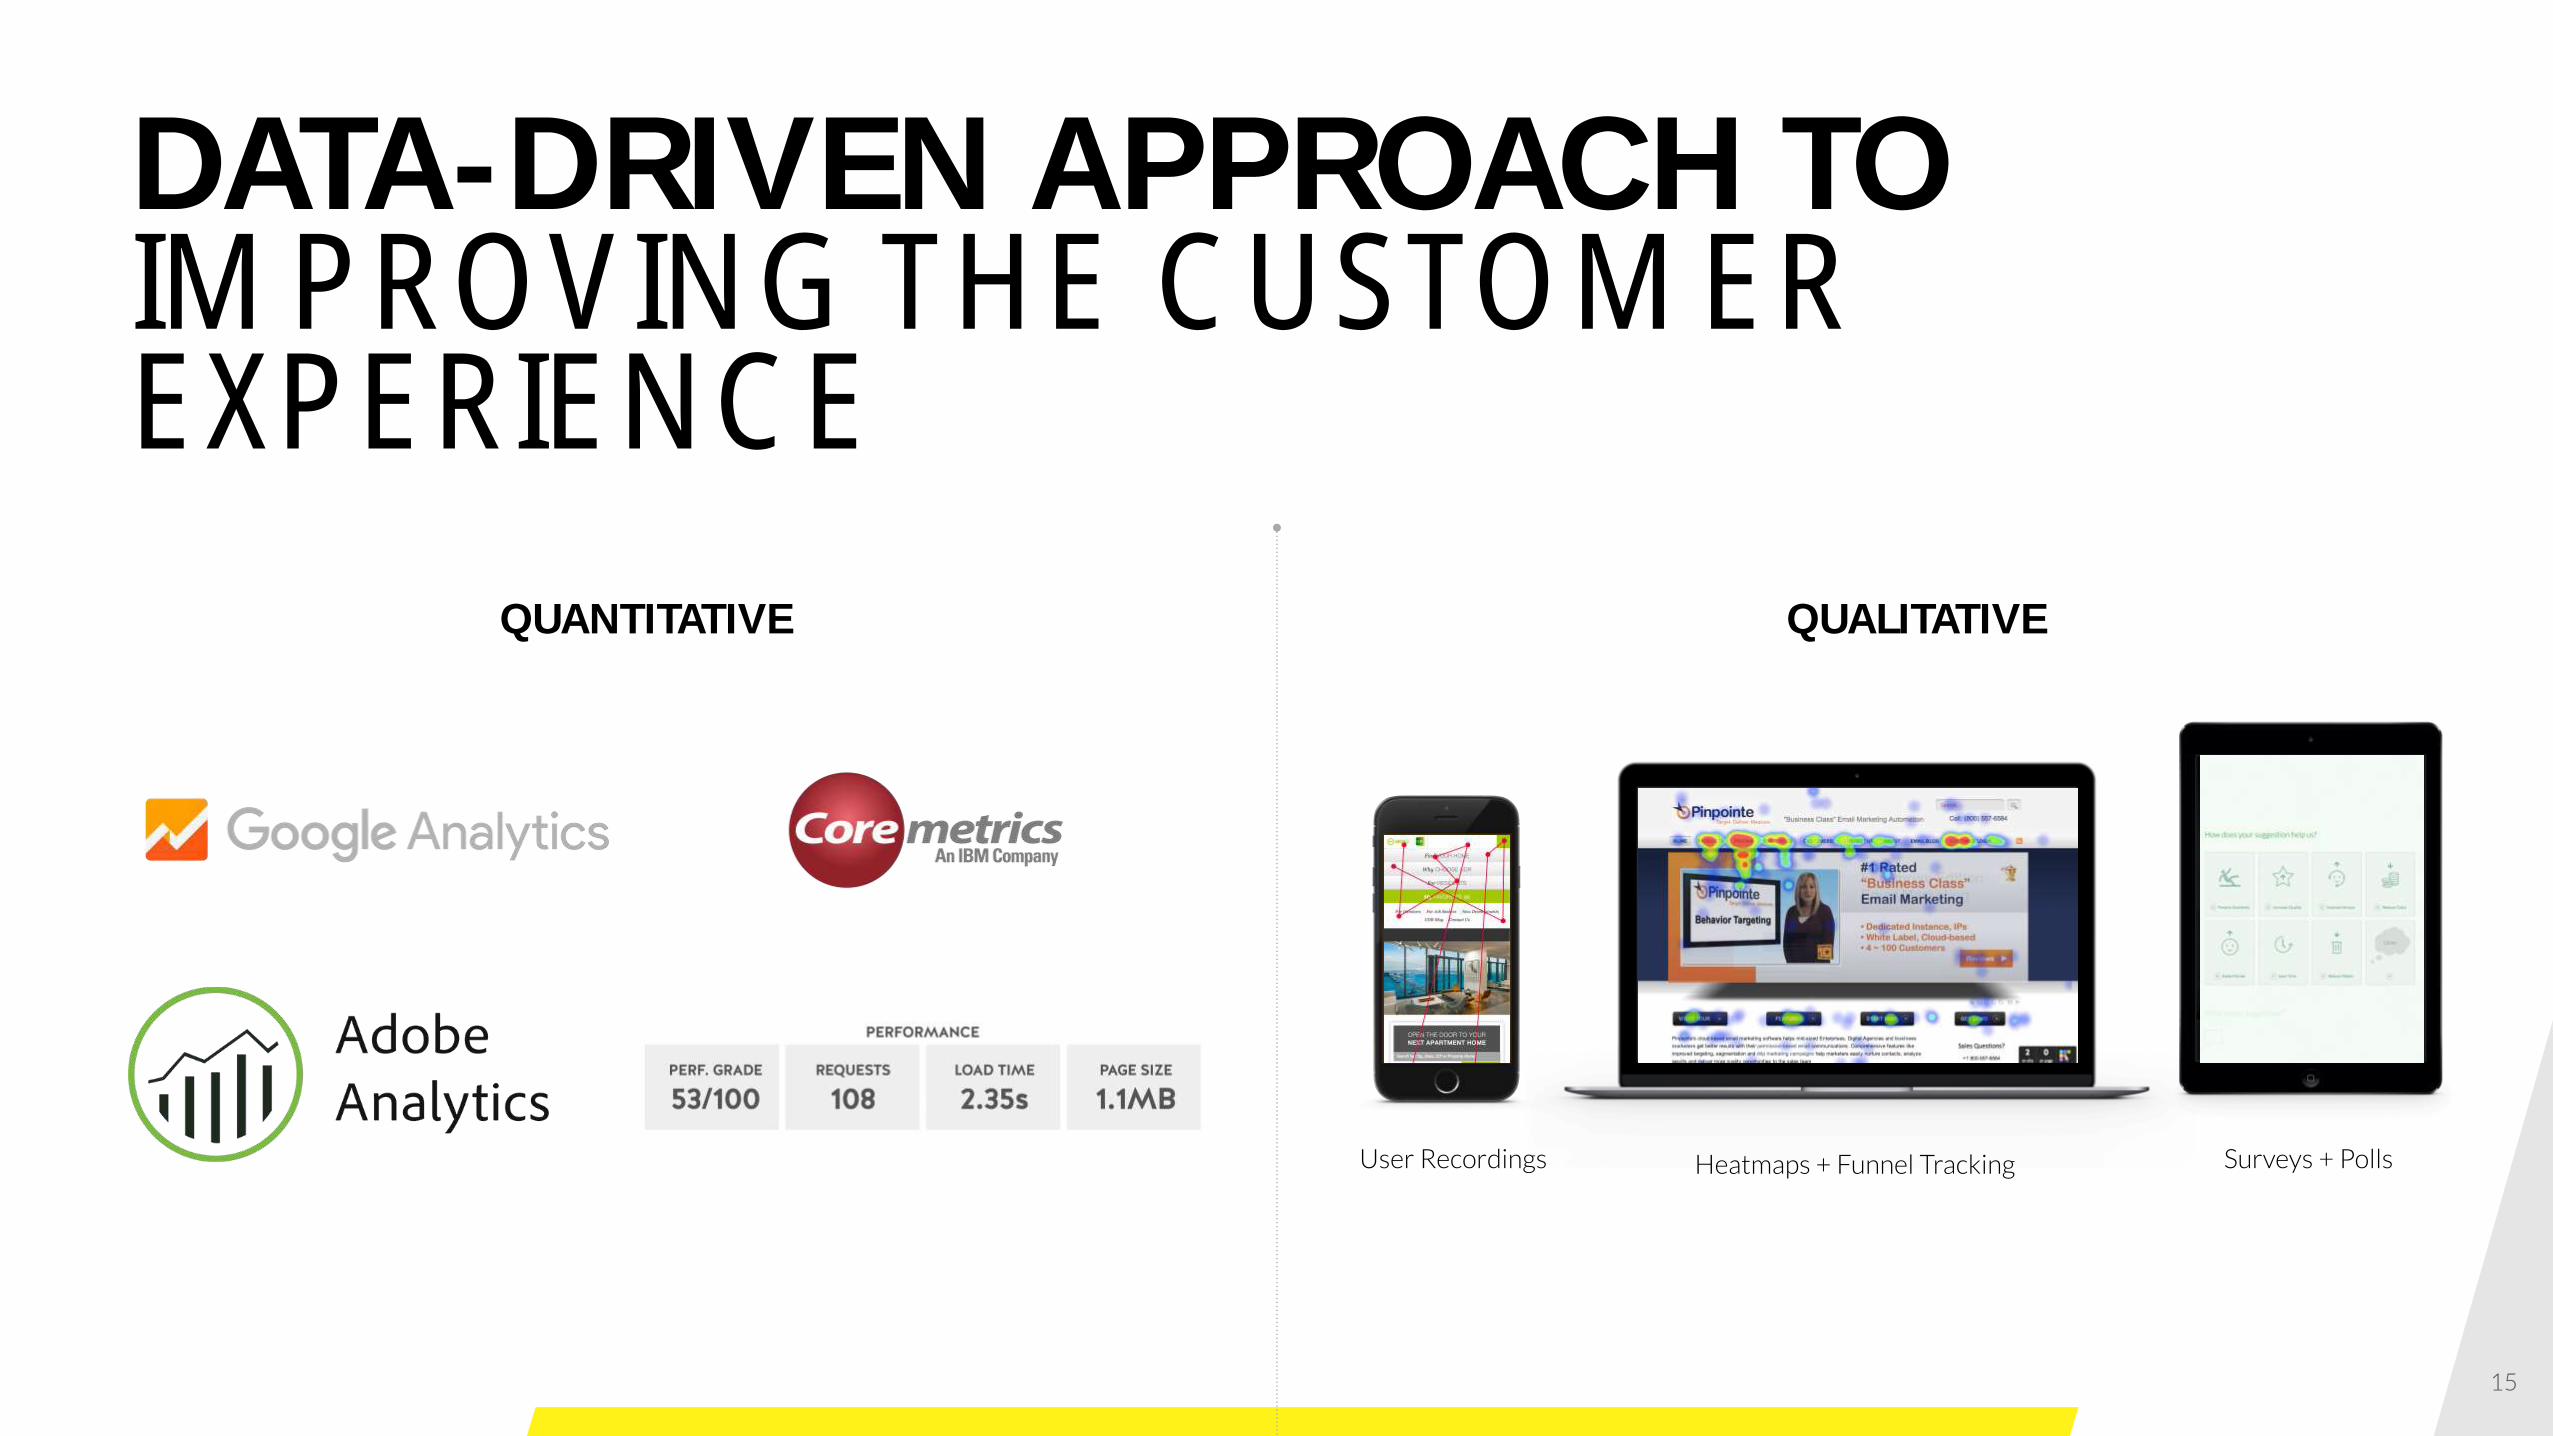
DATA-DRIVEN APPROACH TOIMPROVING THE CUSTOMEREXPERIENCE
QUANTITATIVE QUALITATIVE
User Recordings Heatmaps + Funnel Tracking Surveys + Polls
15
16
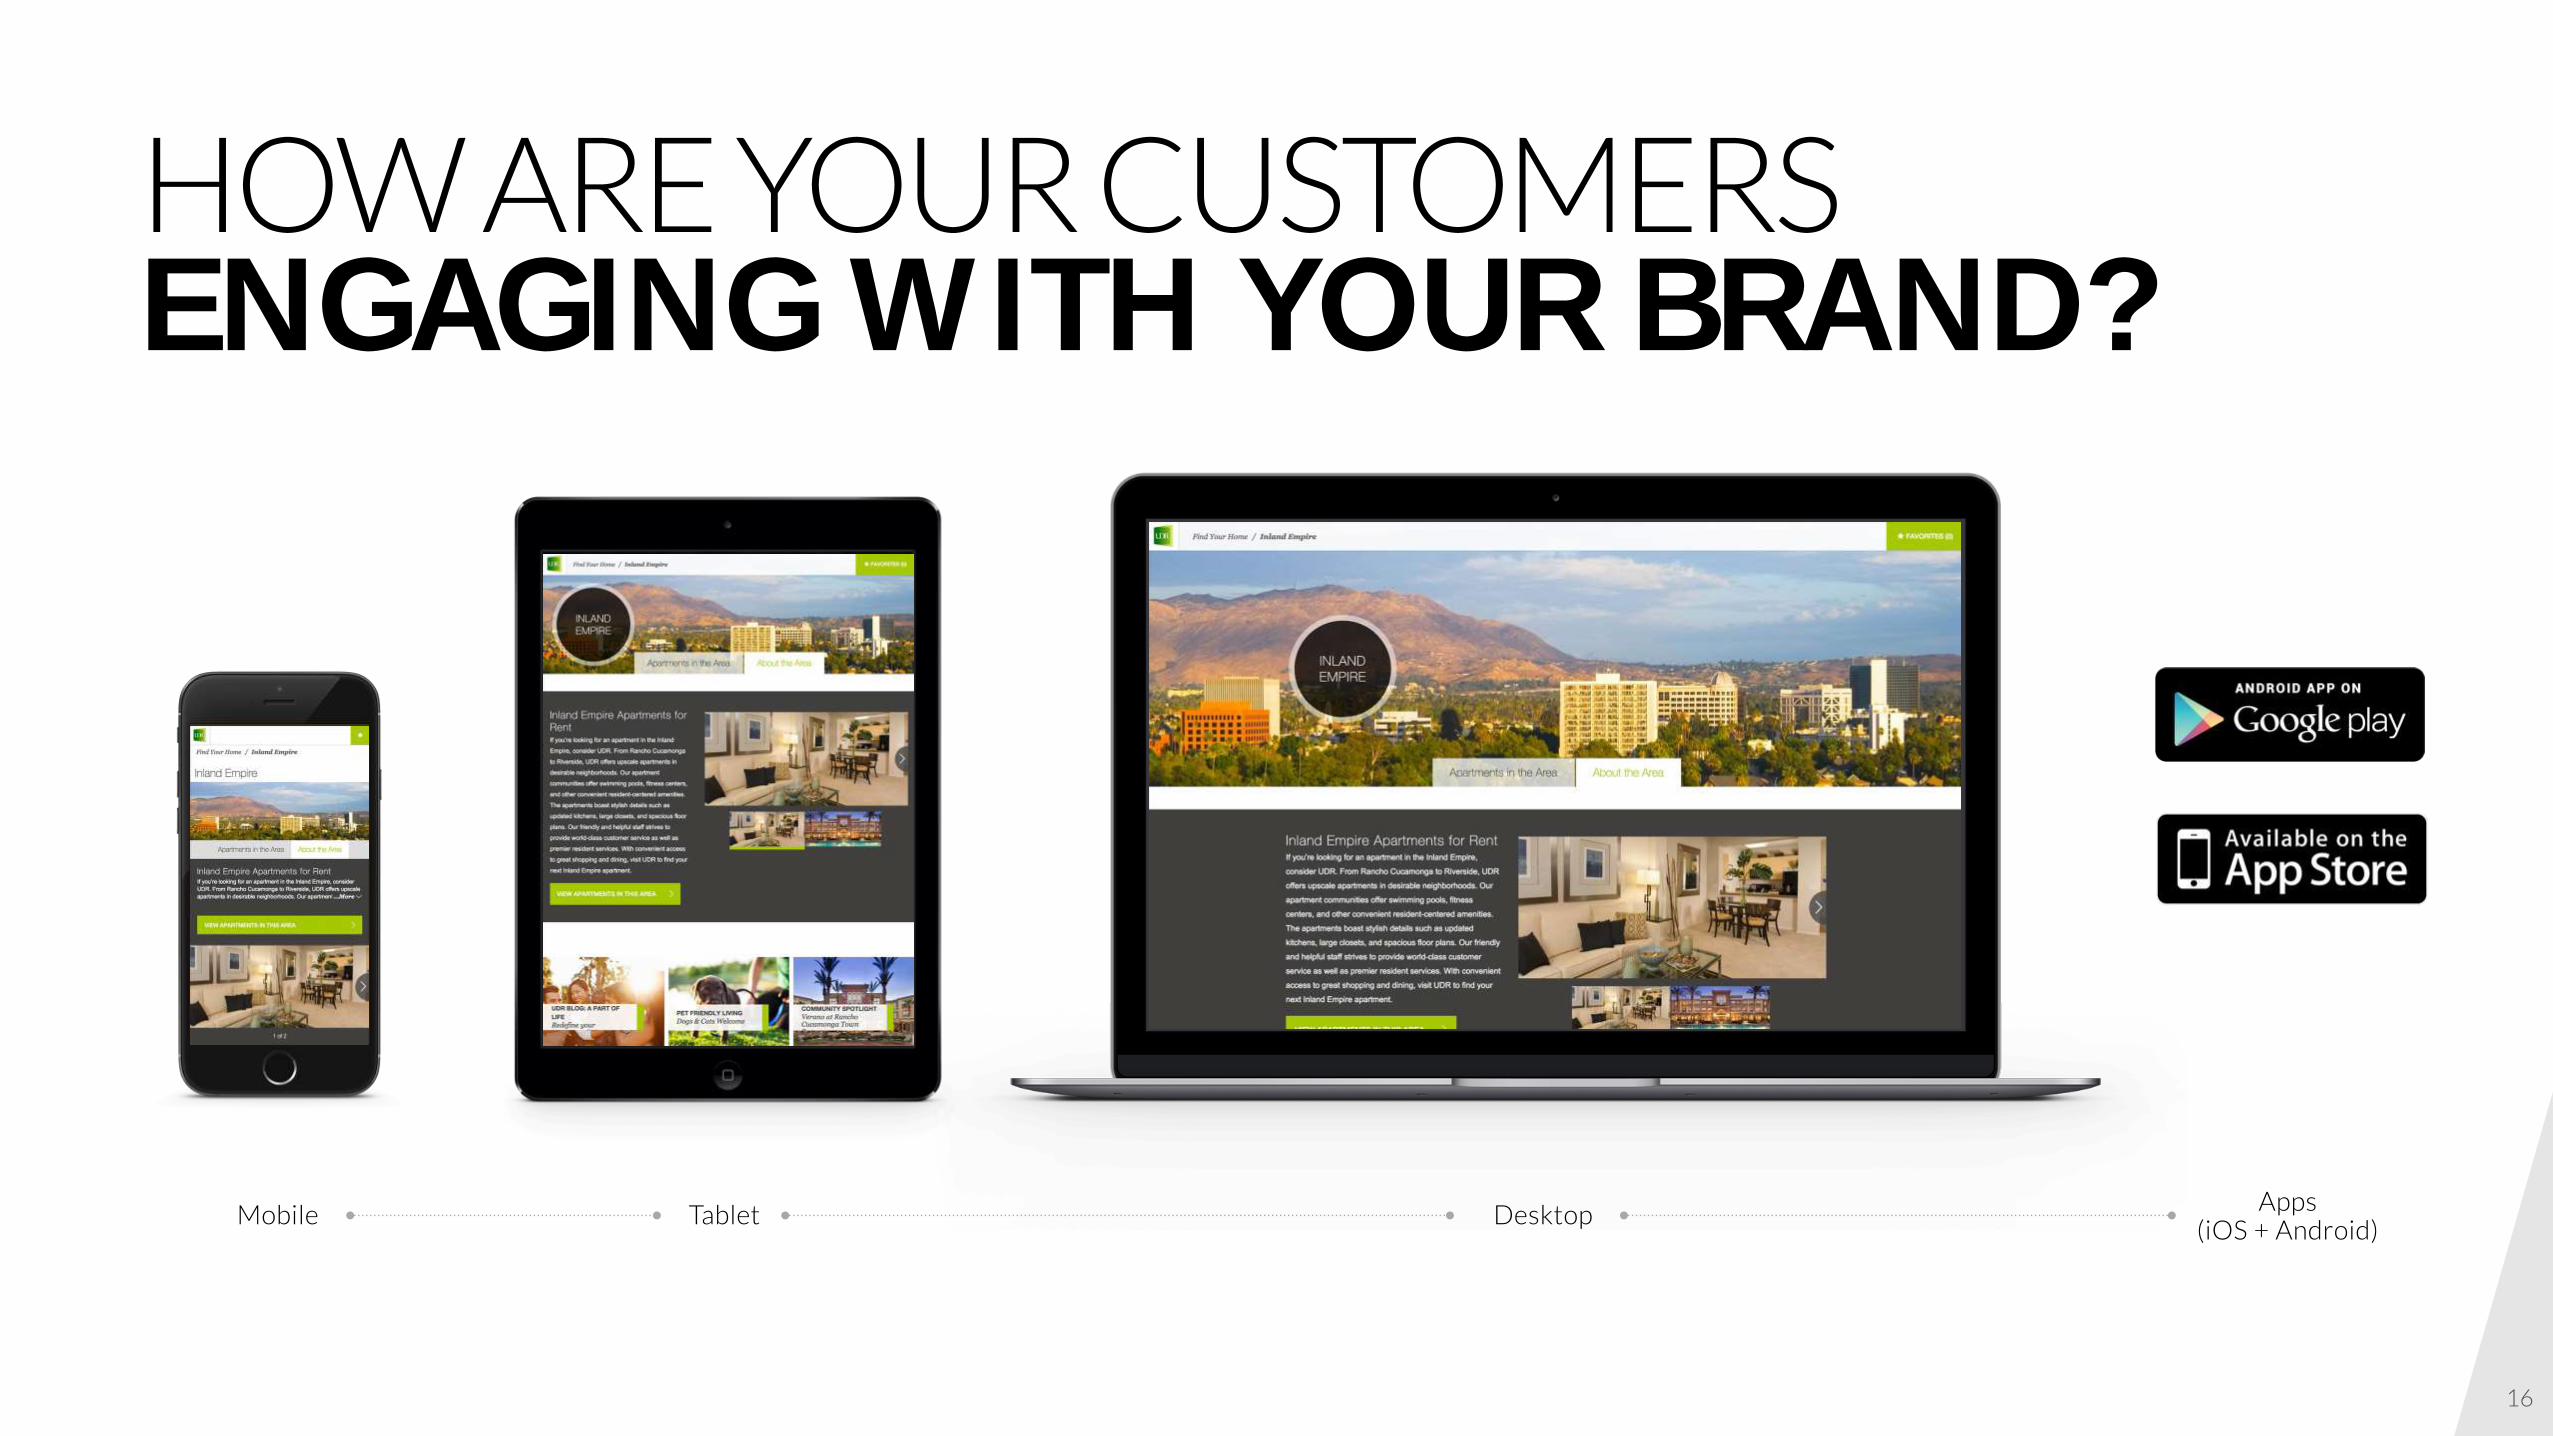
Desktop
HOW ARE YOUR CUSTOMERS ENGAGING WITH YOUR BRAND?
TabletMobileApps
(iOS + Android)
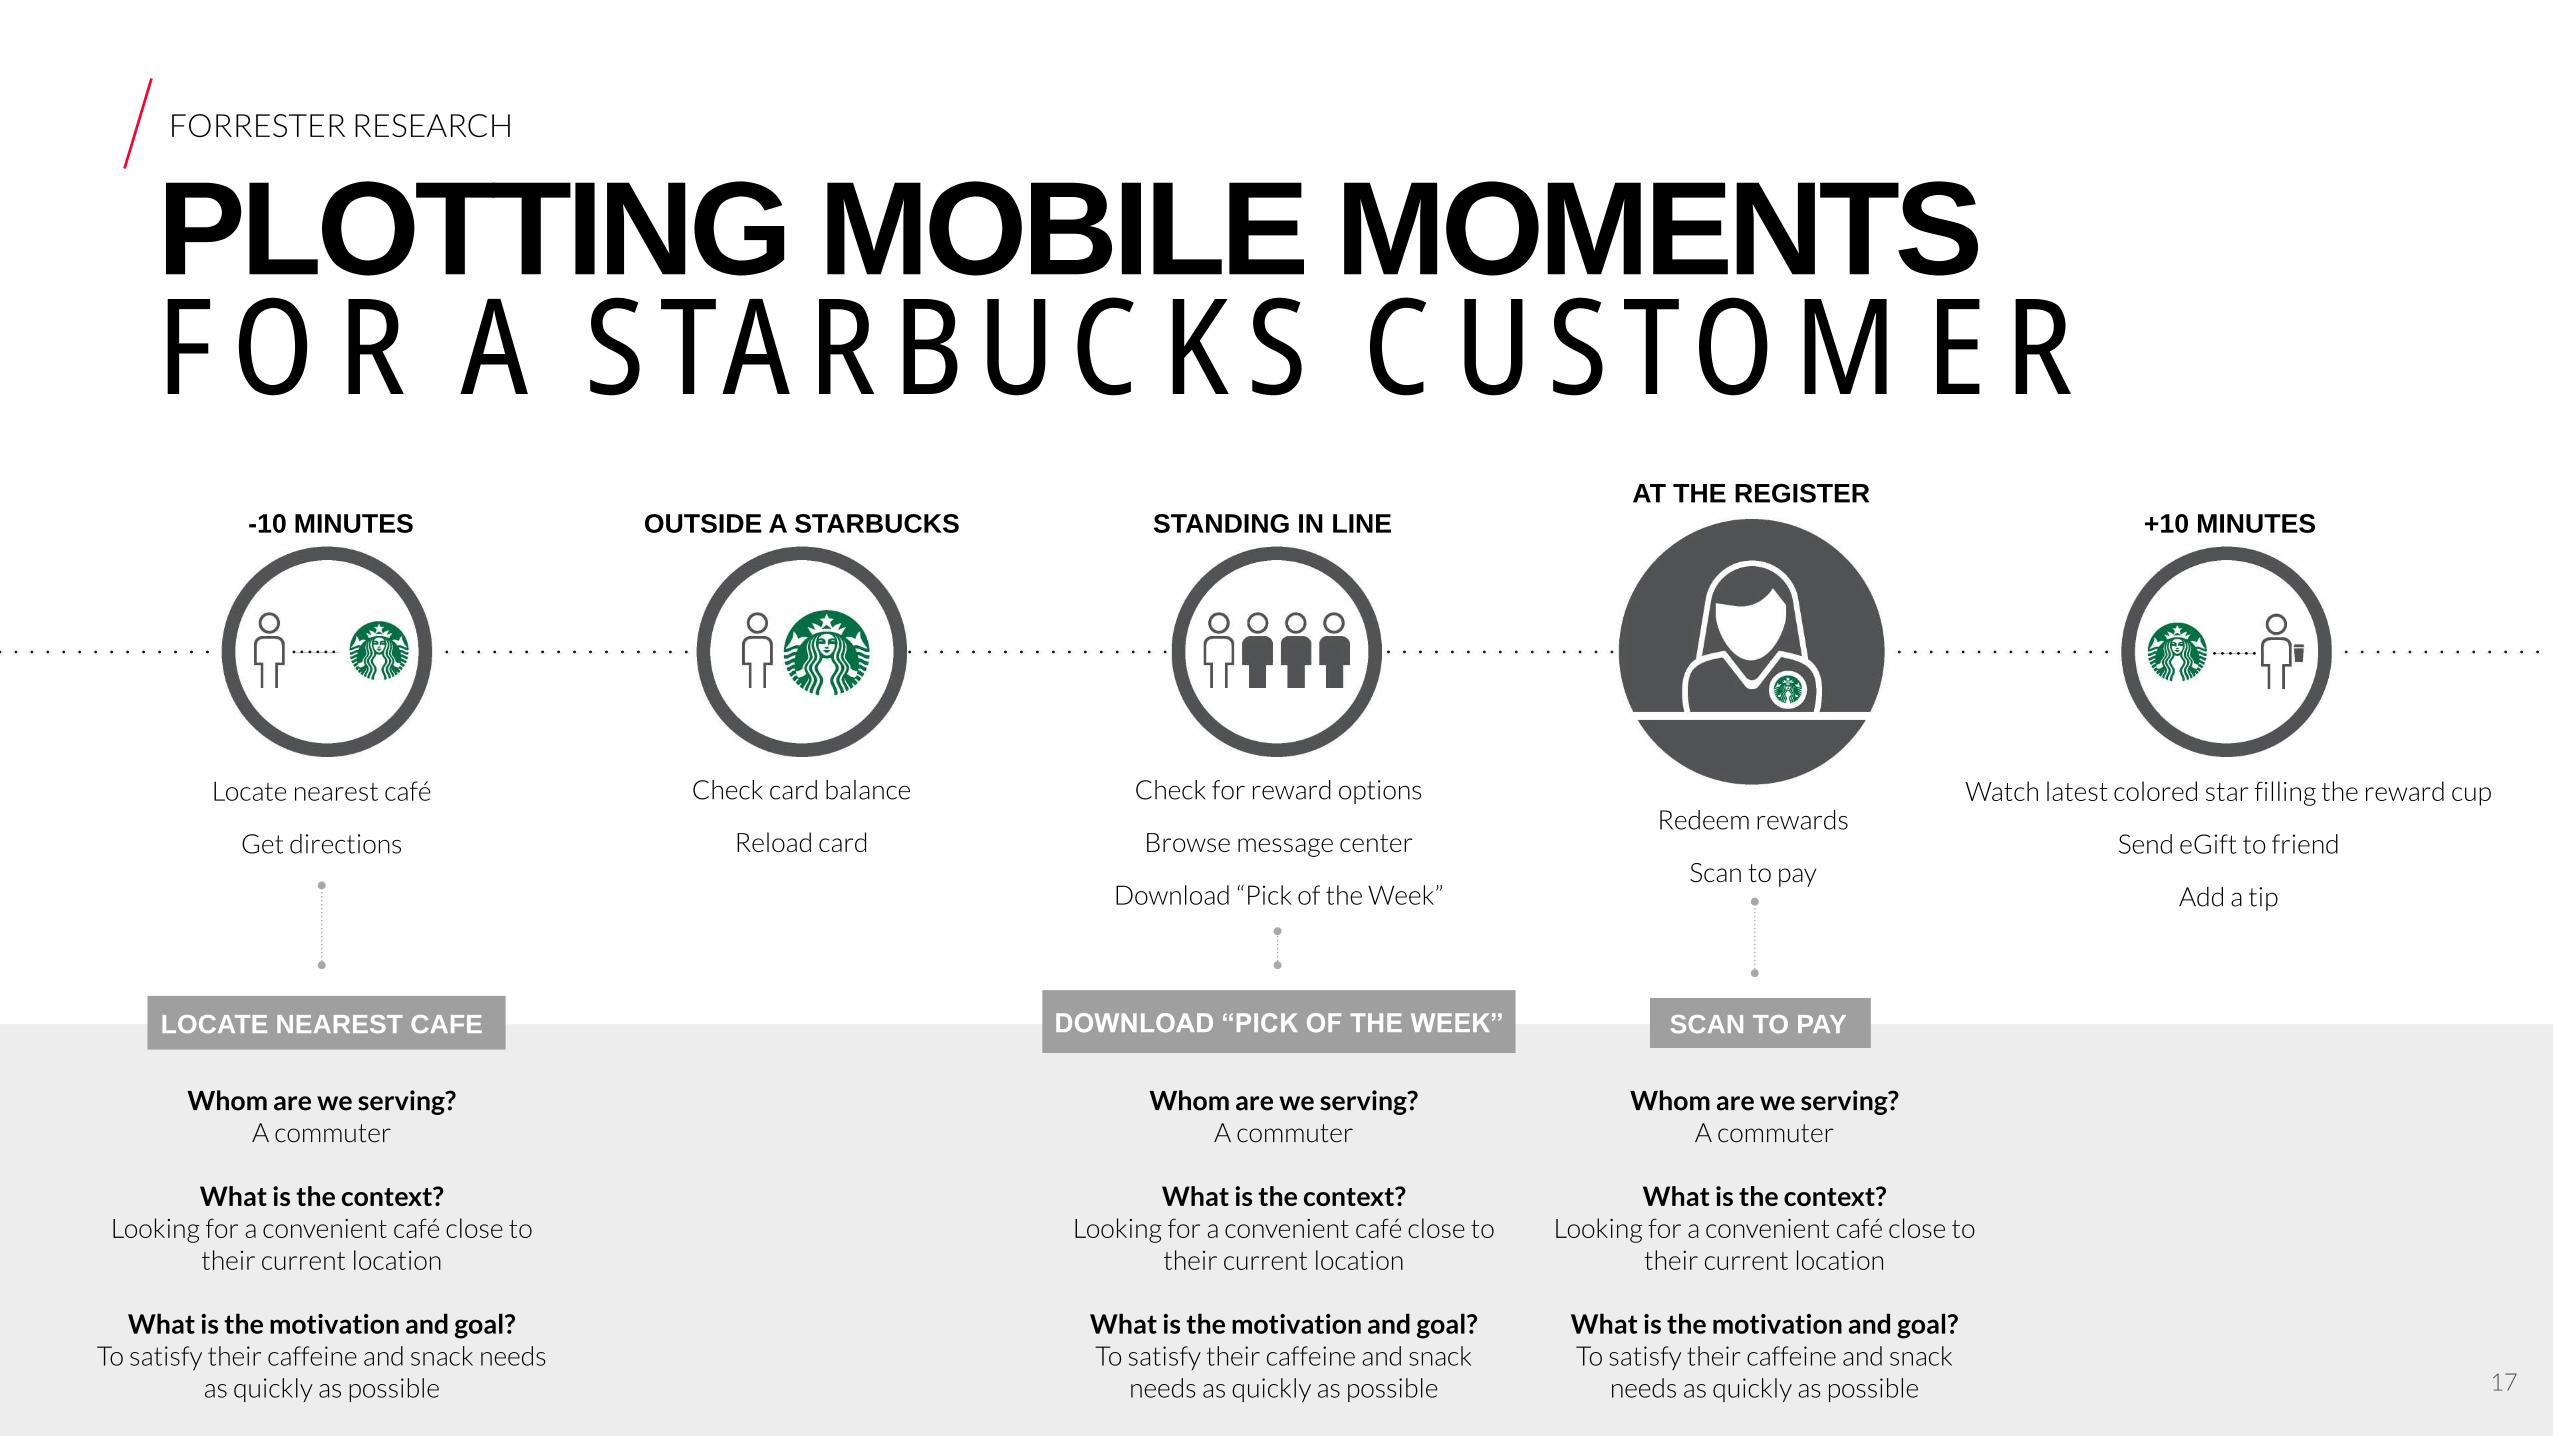
PLOTTING MOBILE MOMENTS FOR A STARBUCKS CUSTOMER
FORRESTER RESEARCH
-10 MINUTES OUTSIDE A STARBUCKS STANDING IN LINEAT THE REGISTER
+10 MINUTES
Locate nearest café
Get directions
Check card balance
Reload card
Check for reward options
Browse message center
Download “Pick of the Week”
Redeem rewards
Scan to pay
Watch latest colored star filling the reward cup
Send eGift to friend
Add a tip
LOCATE NEAREST CAFE DOWNLOAD “PICK OF THE WEEK” SCAN TO PAY
Whom are we serving?A commuter
What is the context?Looking for a convenient café close to
their current location
What is the motivation and goal?To satisfy their caffeine and snack needs
as quickly as possible
Whom are we serving?A commuter
What is the context?Looking for a convenient café close to
their current location
What is the motivation and goal?To satisfy their caffeine and snack
needs as quickly as possible
Whom are we serving?A commuter
What is the context?Looking for a convenient café close to
their current location
What is the motivation and goal?To satisfy their caffeine and snack
needs as quickly as possible 17
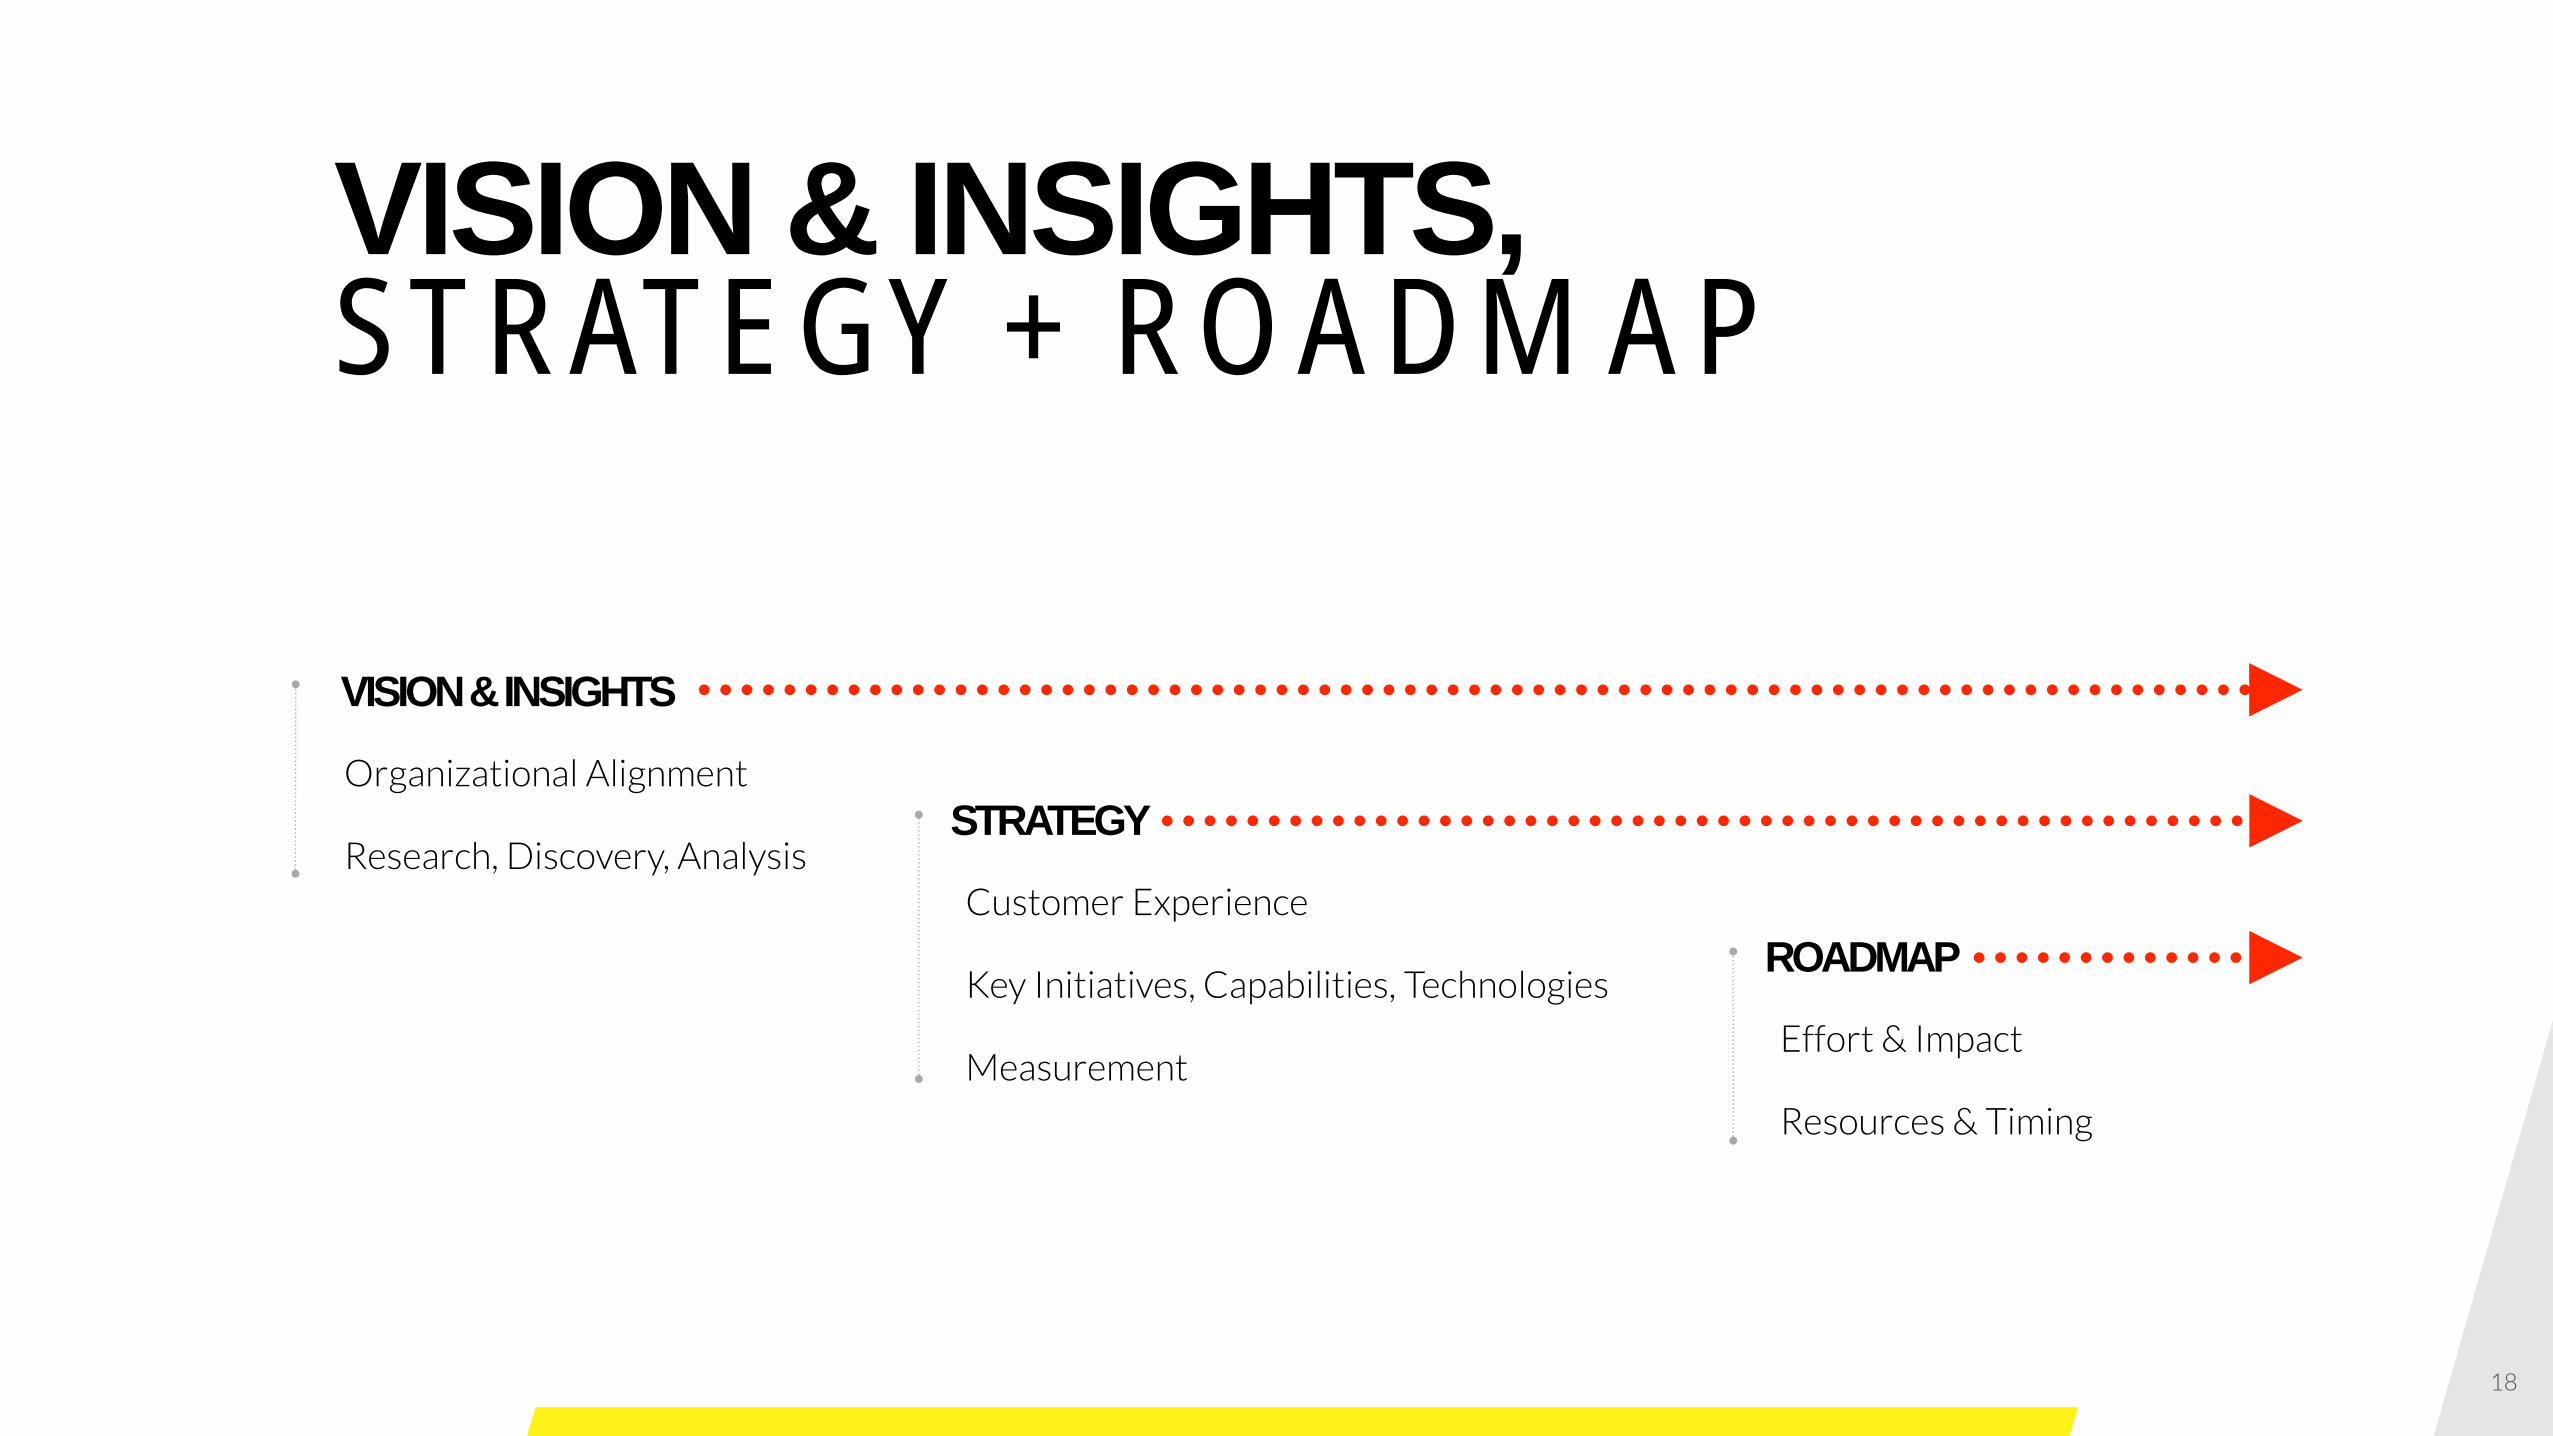
Organizational Alignment
Research, Discovery, Analysis
18
VISION & INSIGHTS
STRATEGY
Customer Experience
Key Initiatives, Capabilities, Technologies
Measurement
ROADMAP
Effort & Impact
Resources & Timing
VISION & INSIGHTS, STRATEGY + ROADMAP
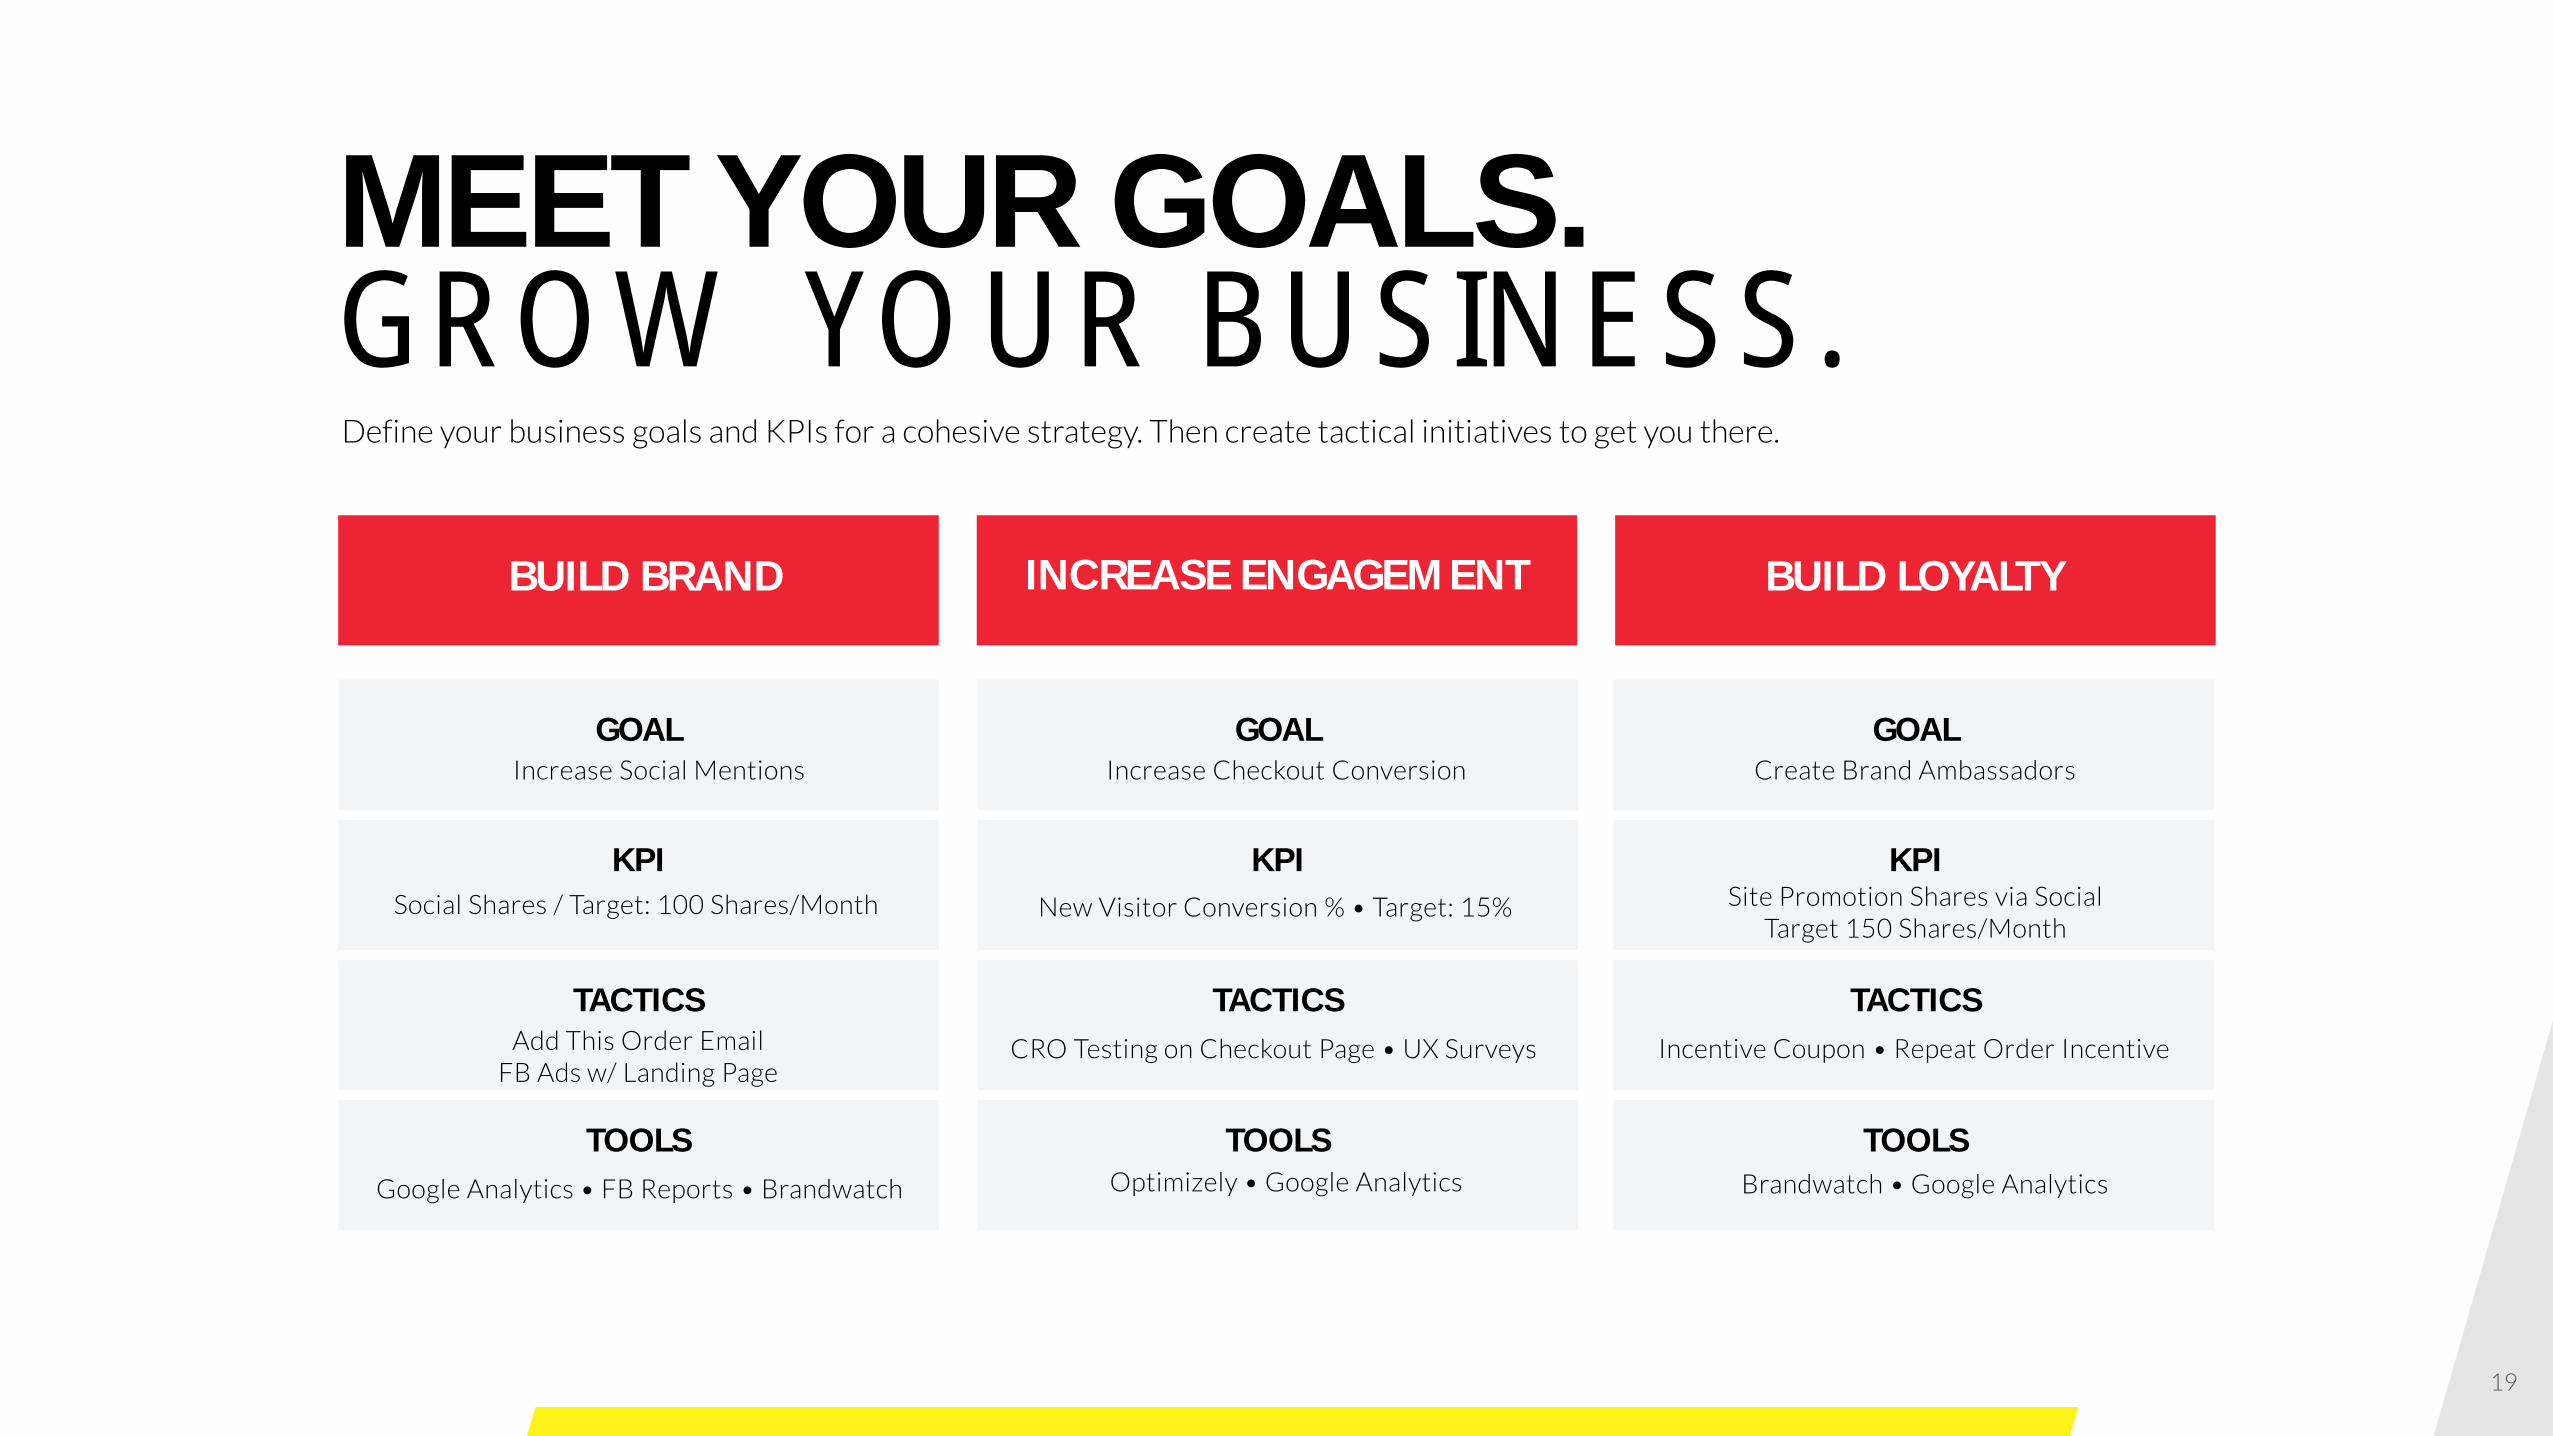
Define your business goals and KPIs for a cohesive strategy. Then create tactical initiatives to get you there.
MEET YOUR GOALS. GROW YOUR BUSINESS.
BUILD BRAND INCREASE ENGAGEMENT BUILD LOYALTY
GOALIncrease Social Mentions
KPISocial Shares / Target: 100 Shares/Month
TACTICSAdd This Order Email
FB Ads w/ Landing Page
TOOLS
Google Analytics • FB Reports • Brandwatch
GOALIncrease Checkout Conversion
KPINew Visitor Conversion % • Target: 15%
TACTICS
CRO Testing on Checkout Page • UX Surveys
TOOLSOptimizely • Google Analytics
GOALCreate Brand Ambassadors
KPISite Promotion Shares via Social
Target 150 Shares/Month
TACTICS
Incentive Coupon • Repeat Order Incentive
TOOLSBrandwatch • Google Analytics
19
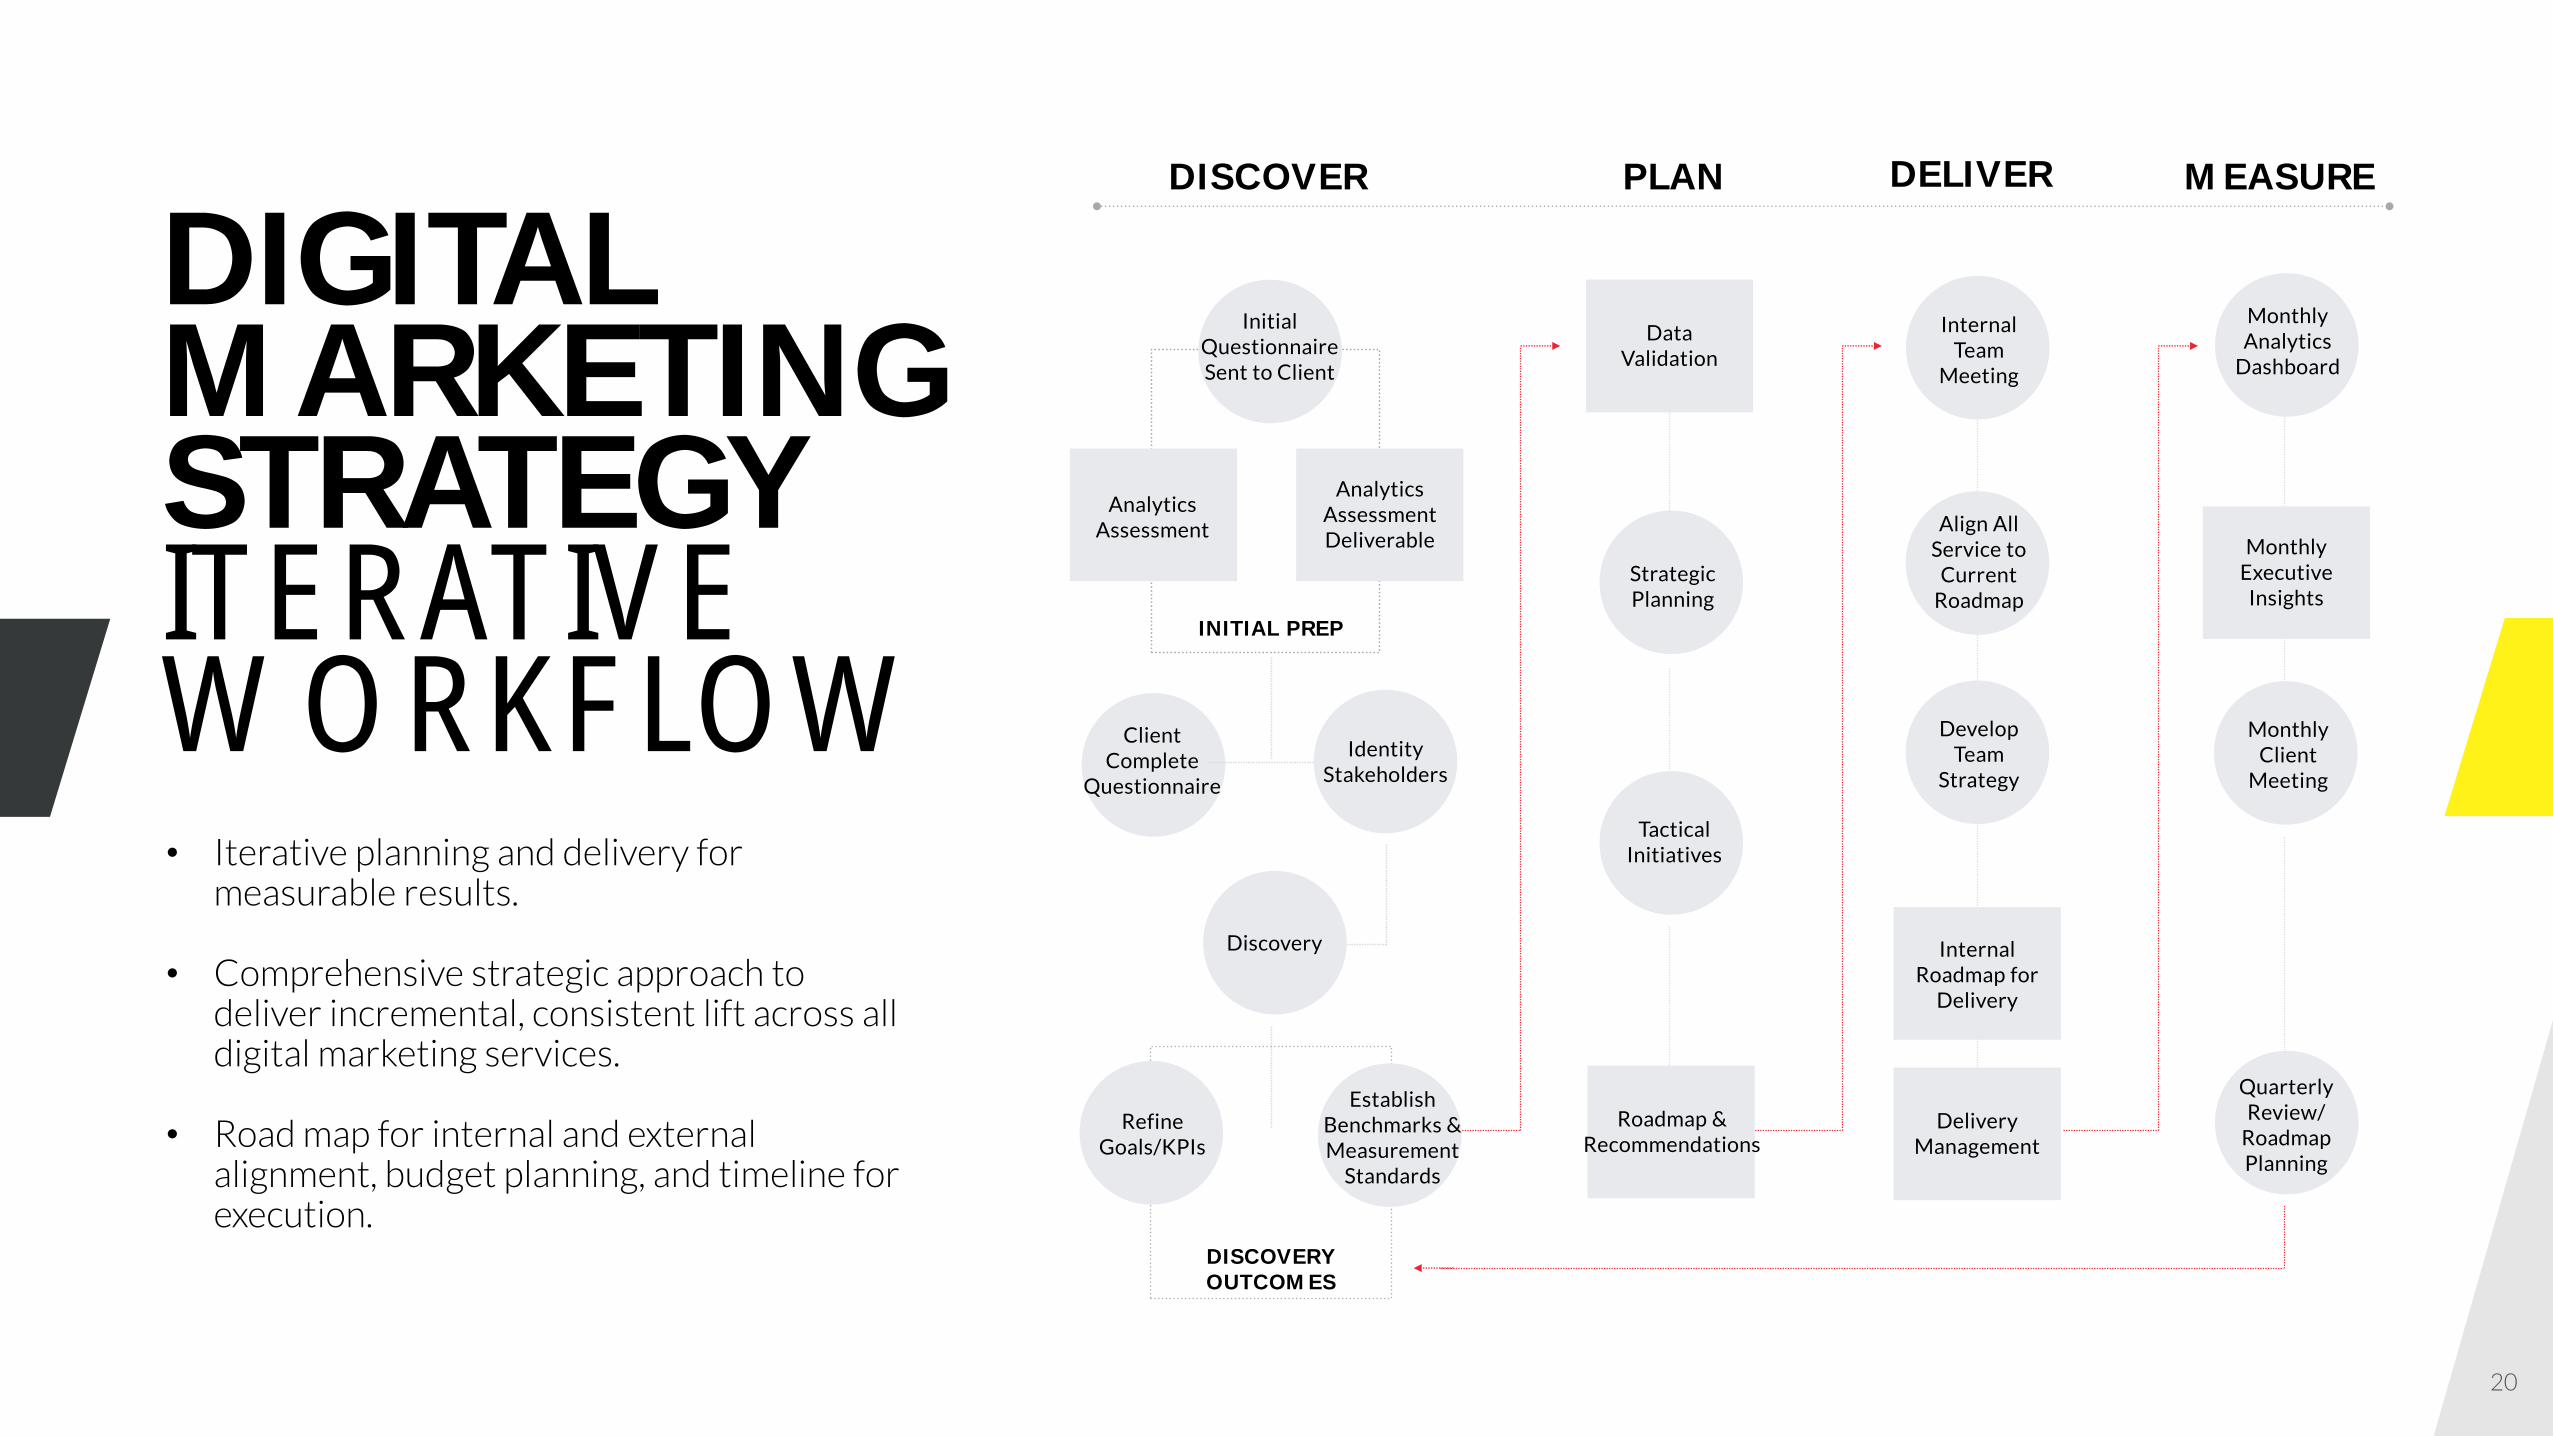
• Iterative planning and delivery for measurable results.
• Comprehensive strategic approach to deliver incremental, consistent lift across all digital marketing services.
• Road map for internal and external alignment, budget planning, and timeline for execution.
DIGITAL MARKETINGSTRATEGY ITERATIVEWORKFLOW
AnalyticsAssessmentDeliverable
IdentityStakeholders
Discovery
RefineGoals/KPIs
DISCOVERY OUTCOMES
InitialQuestionnaireSent to Client
AnalyticsAssessment
AnalyticsAssessmentDeliverable
INITIAL PREP
ClientComplete
Questionnaire
RefineGoals/KPIs
EstablishBenchmarks &Measurement
Standards
Data Validation
StrategicPlanning
TacticalInitiatives
Roadmap &Recommendations
Internal Team
Meeting
Align AllService to
CurrentRoadmap
Develop Team
Strategy
Internal Roadmap for
Delivery
Delivery Management
MonthlyAnalytics
Dashboard
MonthlyExecutive
Insights
MonthlyClient
Meeting
Quarterly Review/
RoadmapPlanning
DISCOVER PLAN DELIVER MEASURE
20
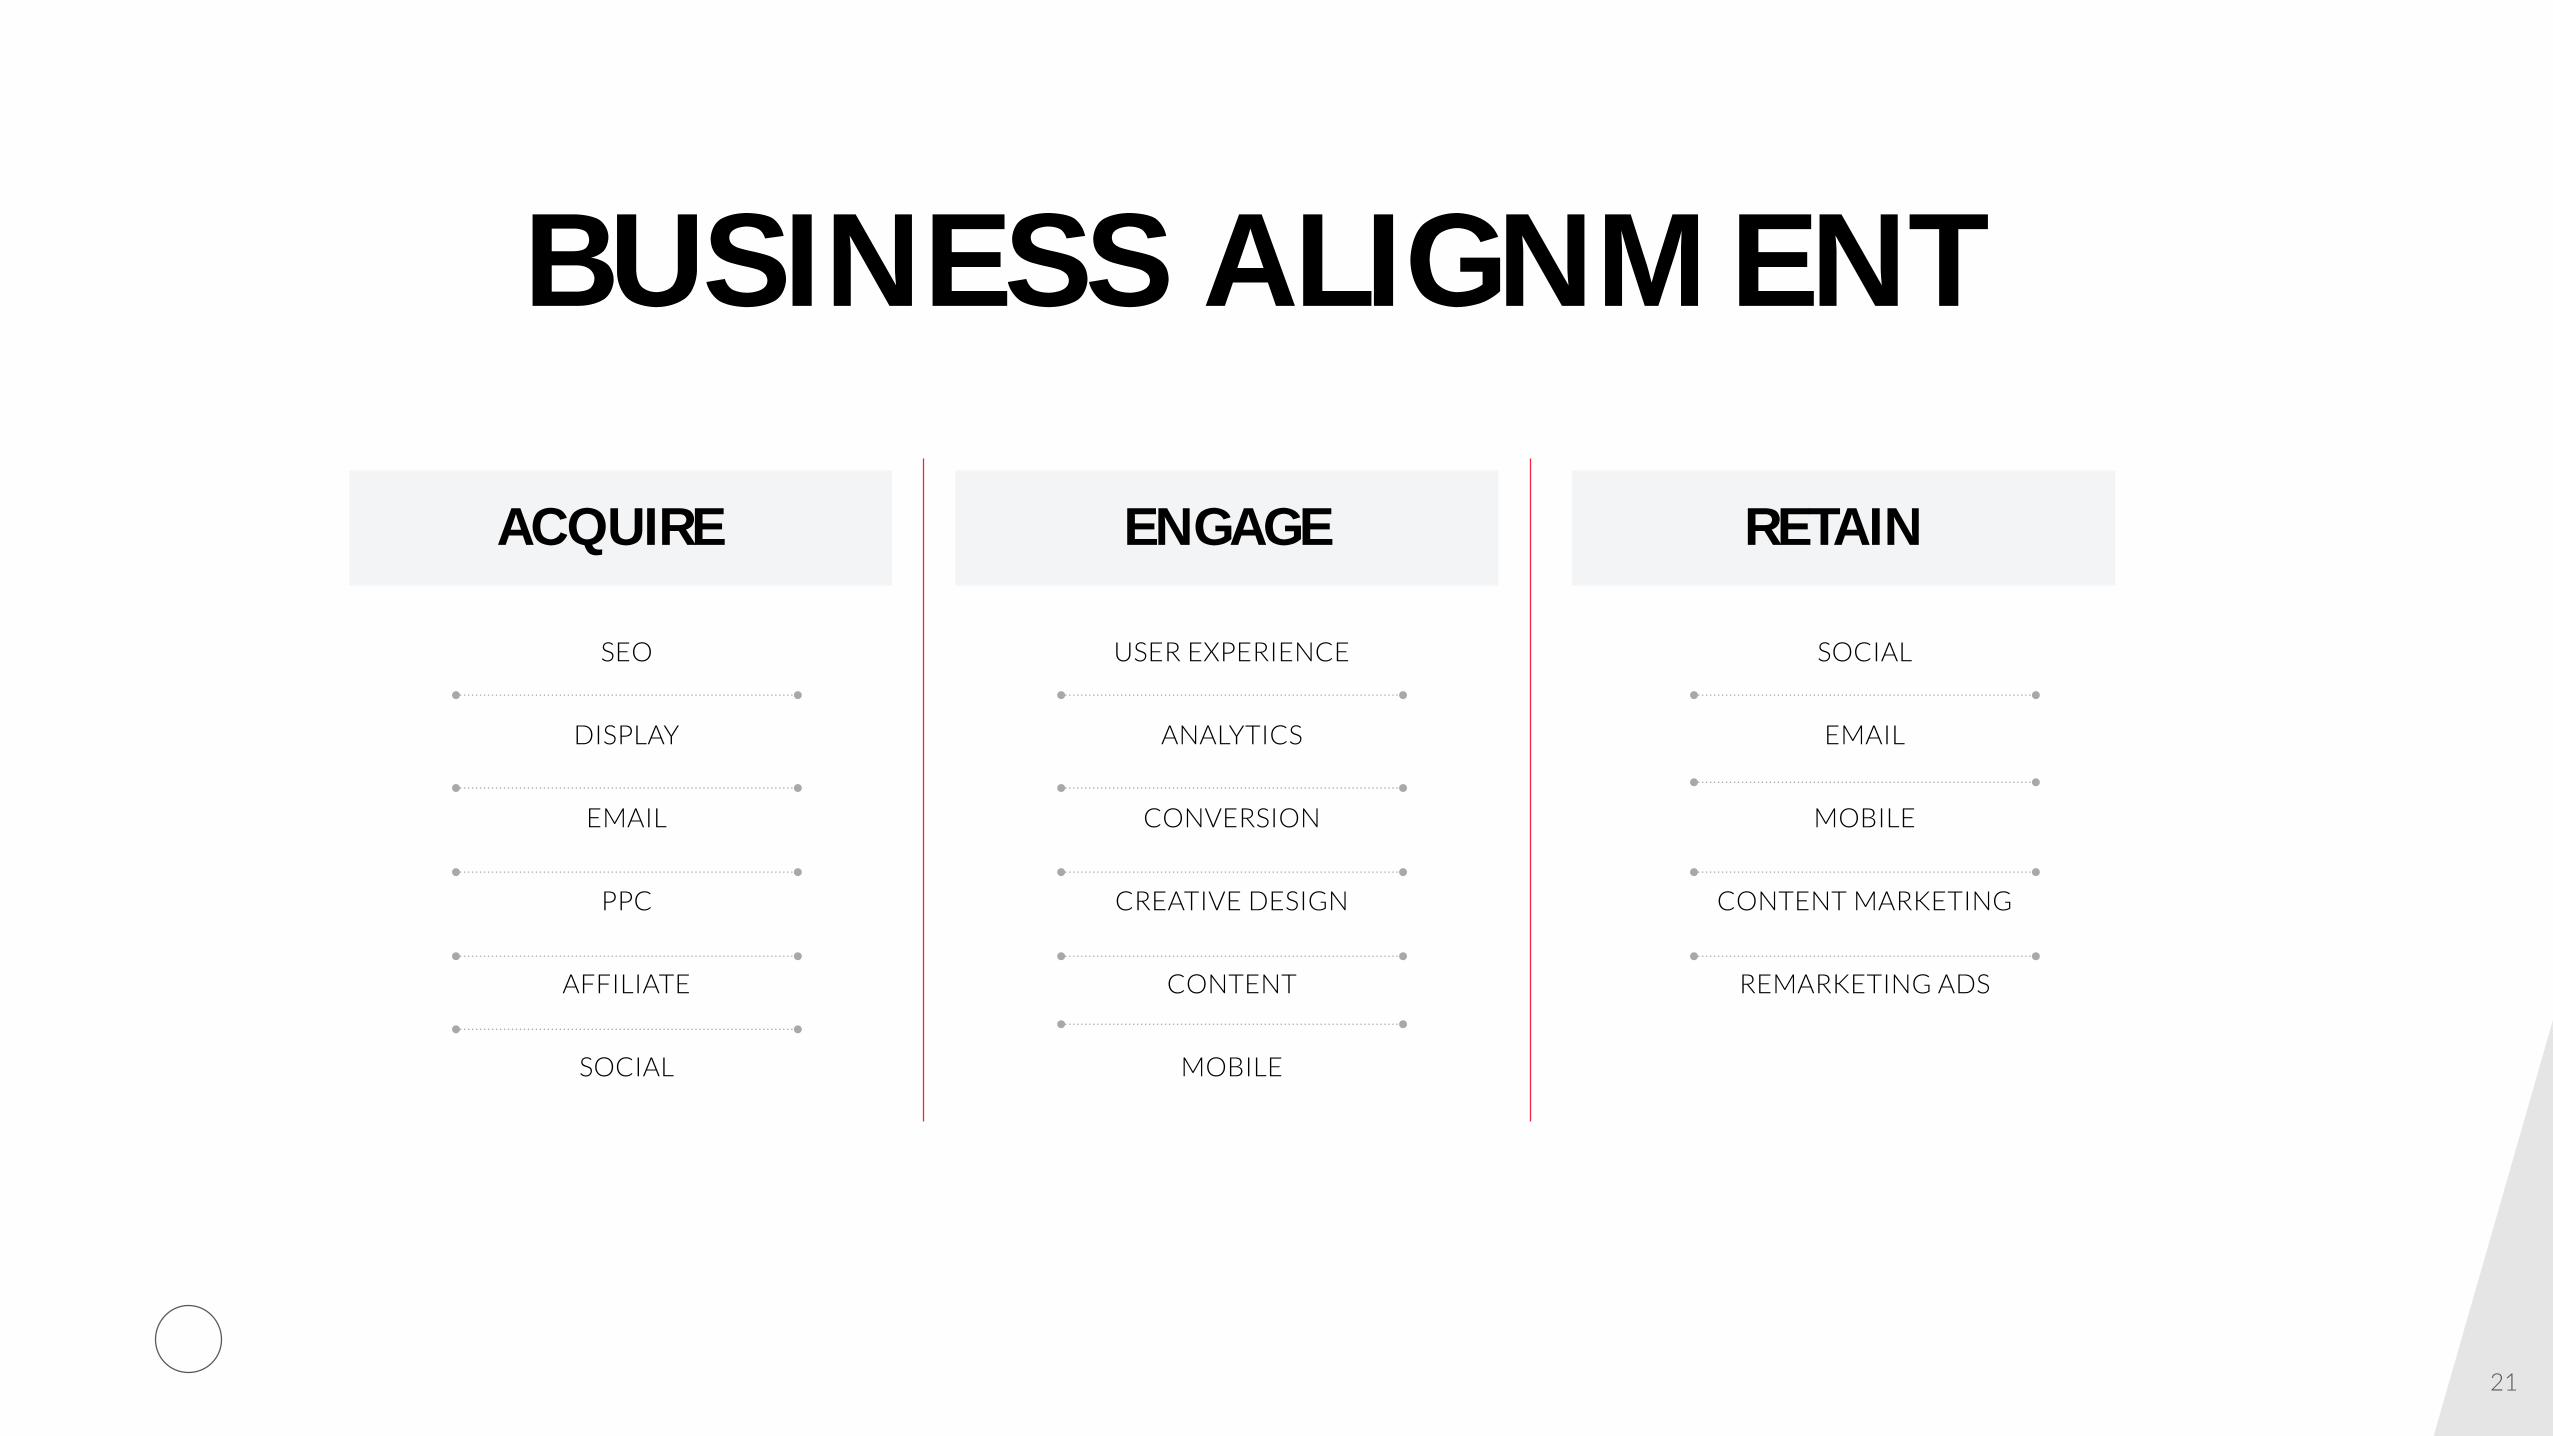
BUSINESS ALIGNMENT
ENGAGE RETAINACQUIRE
SEO
DISPLAY
PPC
AFFILIATE
SOCIAL
USER EXPERIENCE
ANALYTICS
CONVERSION
CREATIVE DESIGN
CONTENT
MOBILE
SOCIAL
MOBILE
CONTENT MARKETING
REMARKETING ADS
21
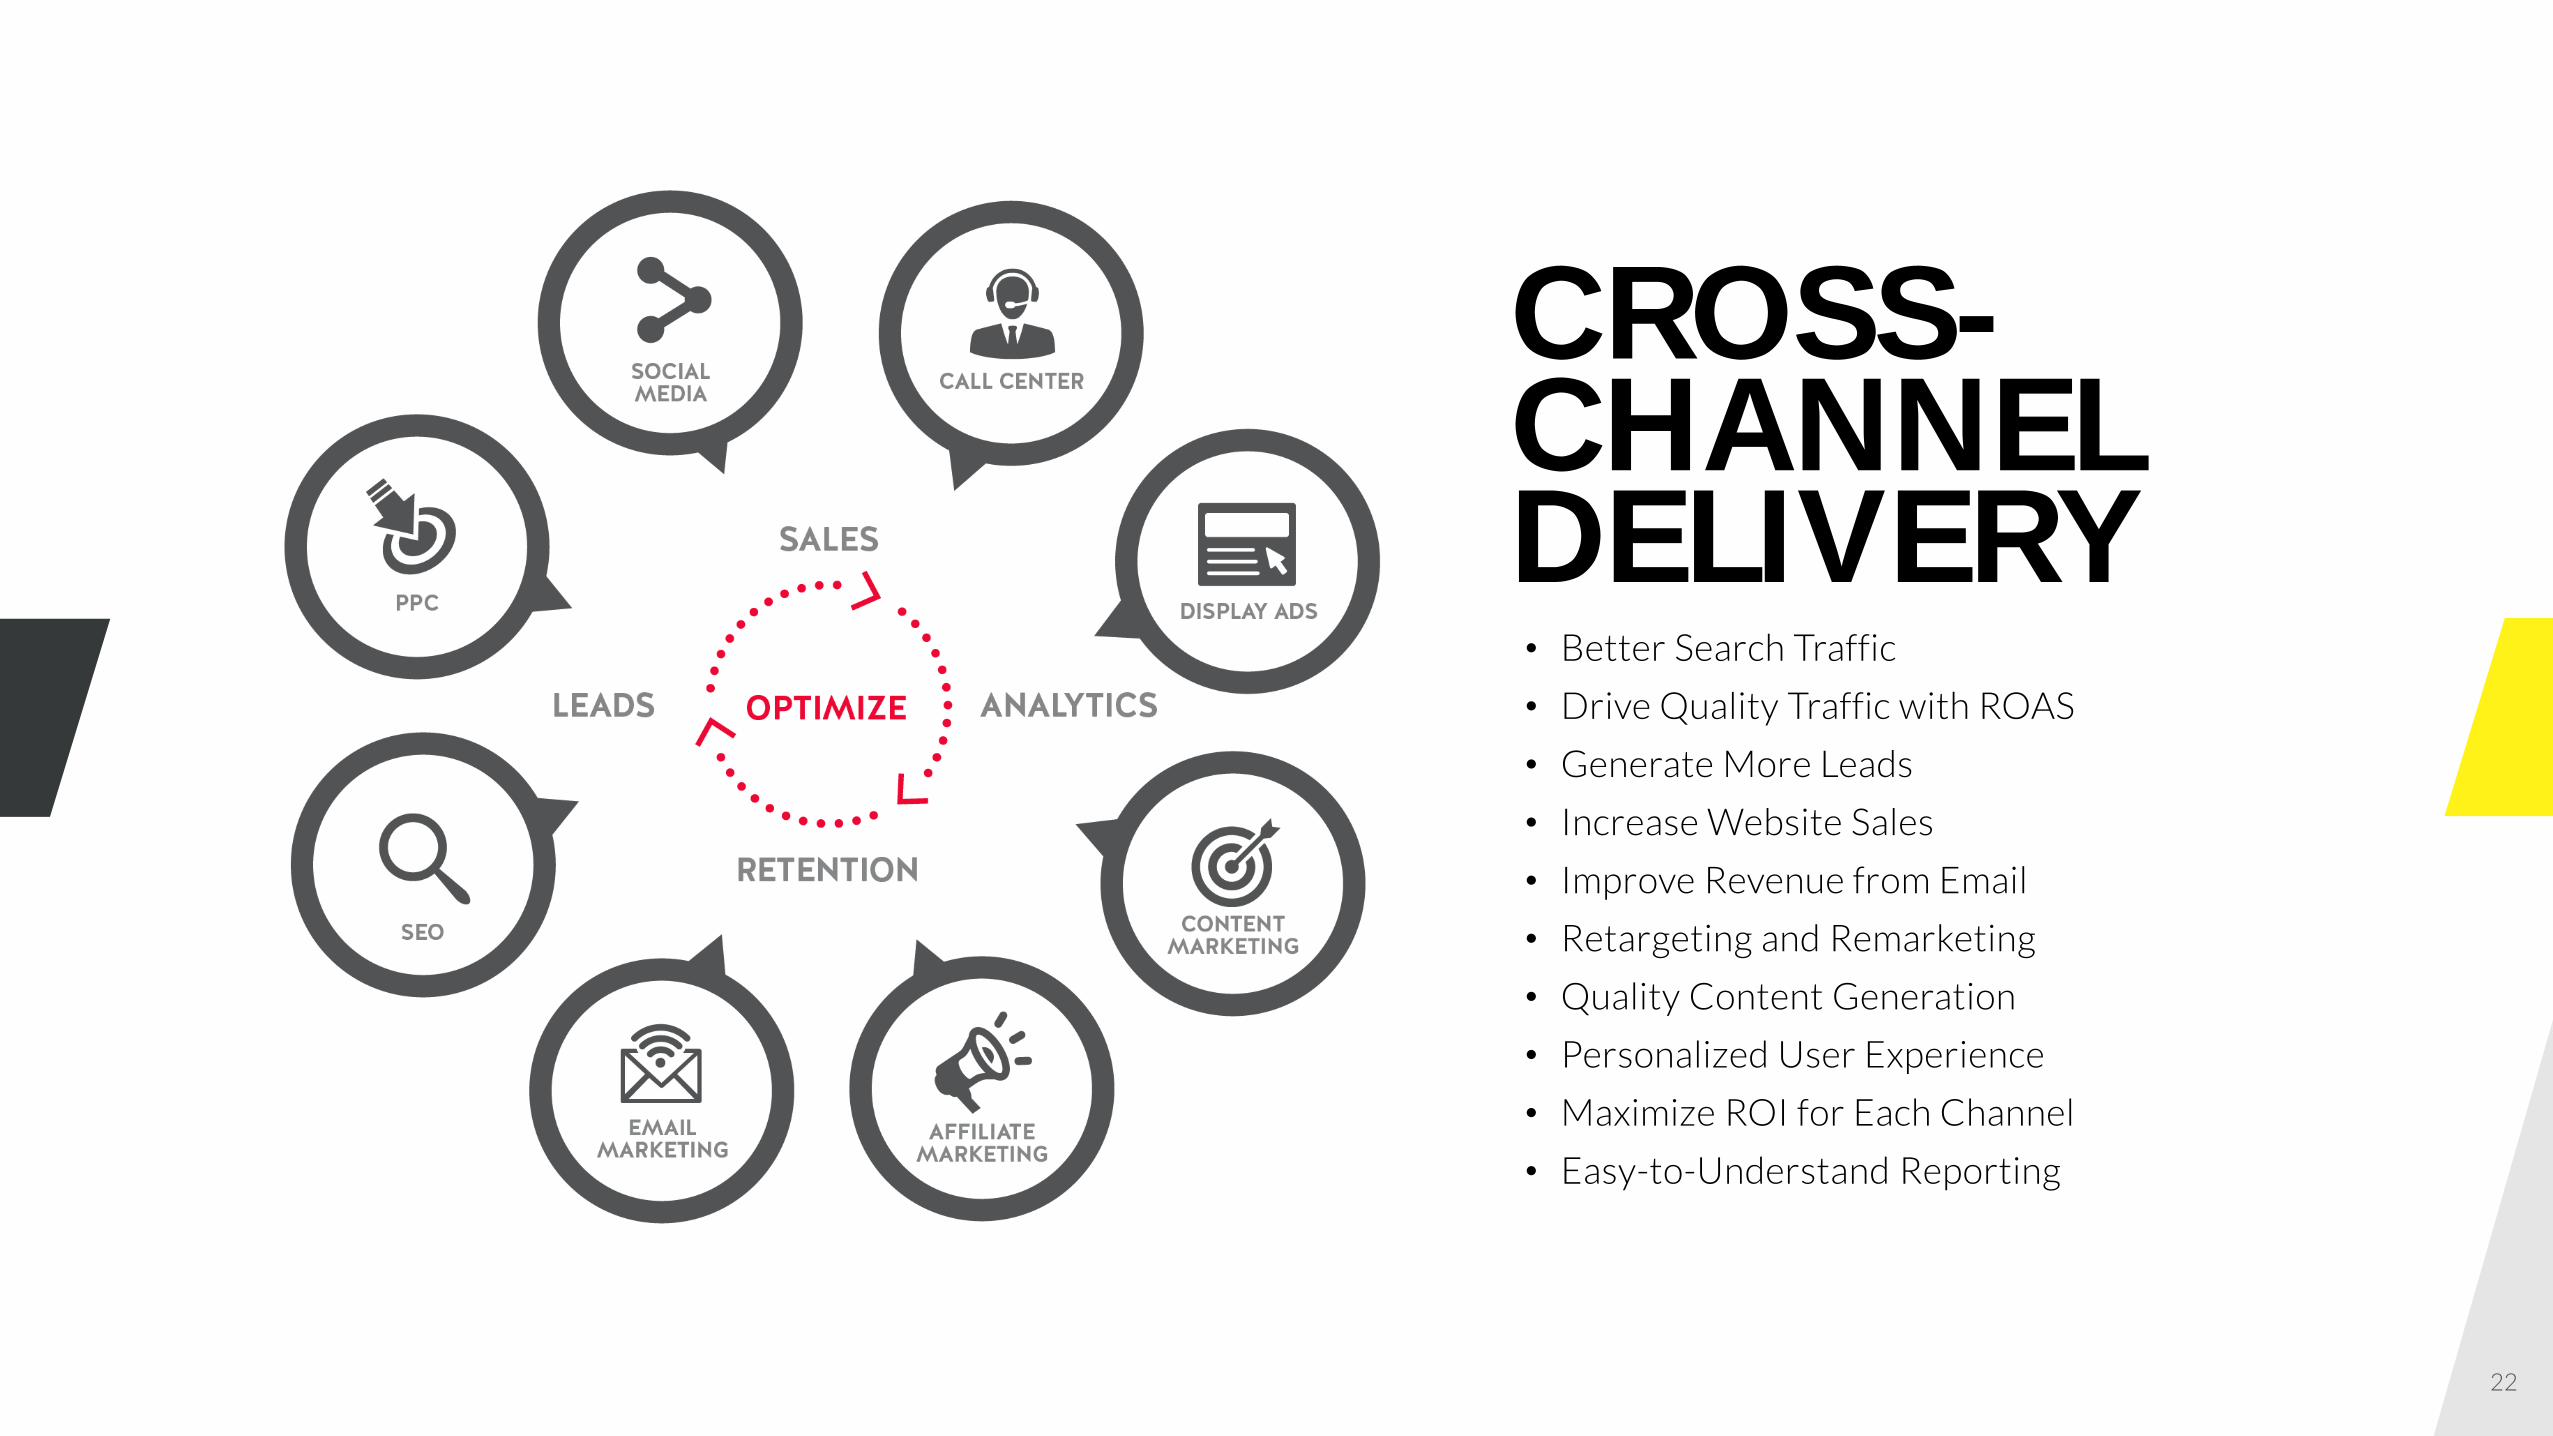
• Better Search Traffic
• Drive Quality Traffic with ROAS
• Generate More Leads
• Increase Website Sales
• Improve Revenue from Email
• Retargeting and Remarketing
• Quality Content Generation
• Personalized User Experience
• Maximize ROI for Each Channel
• Easy-to-Understand Reporting
CROSS-CHANNEL DELIVERY
22
23
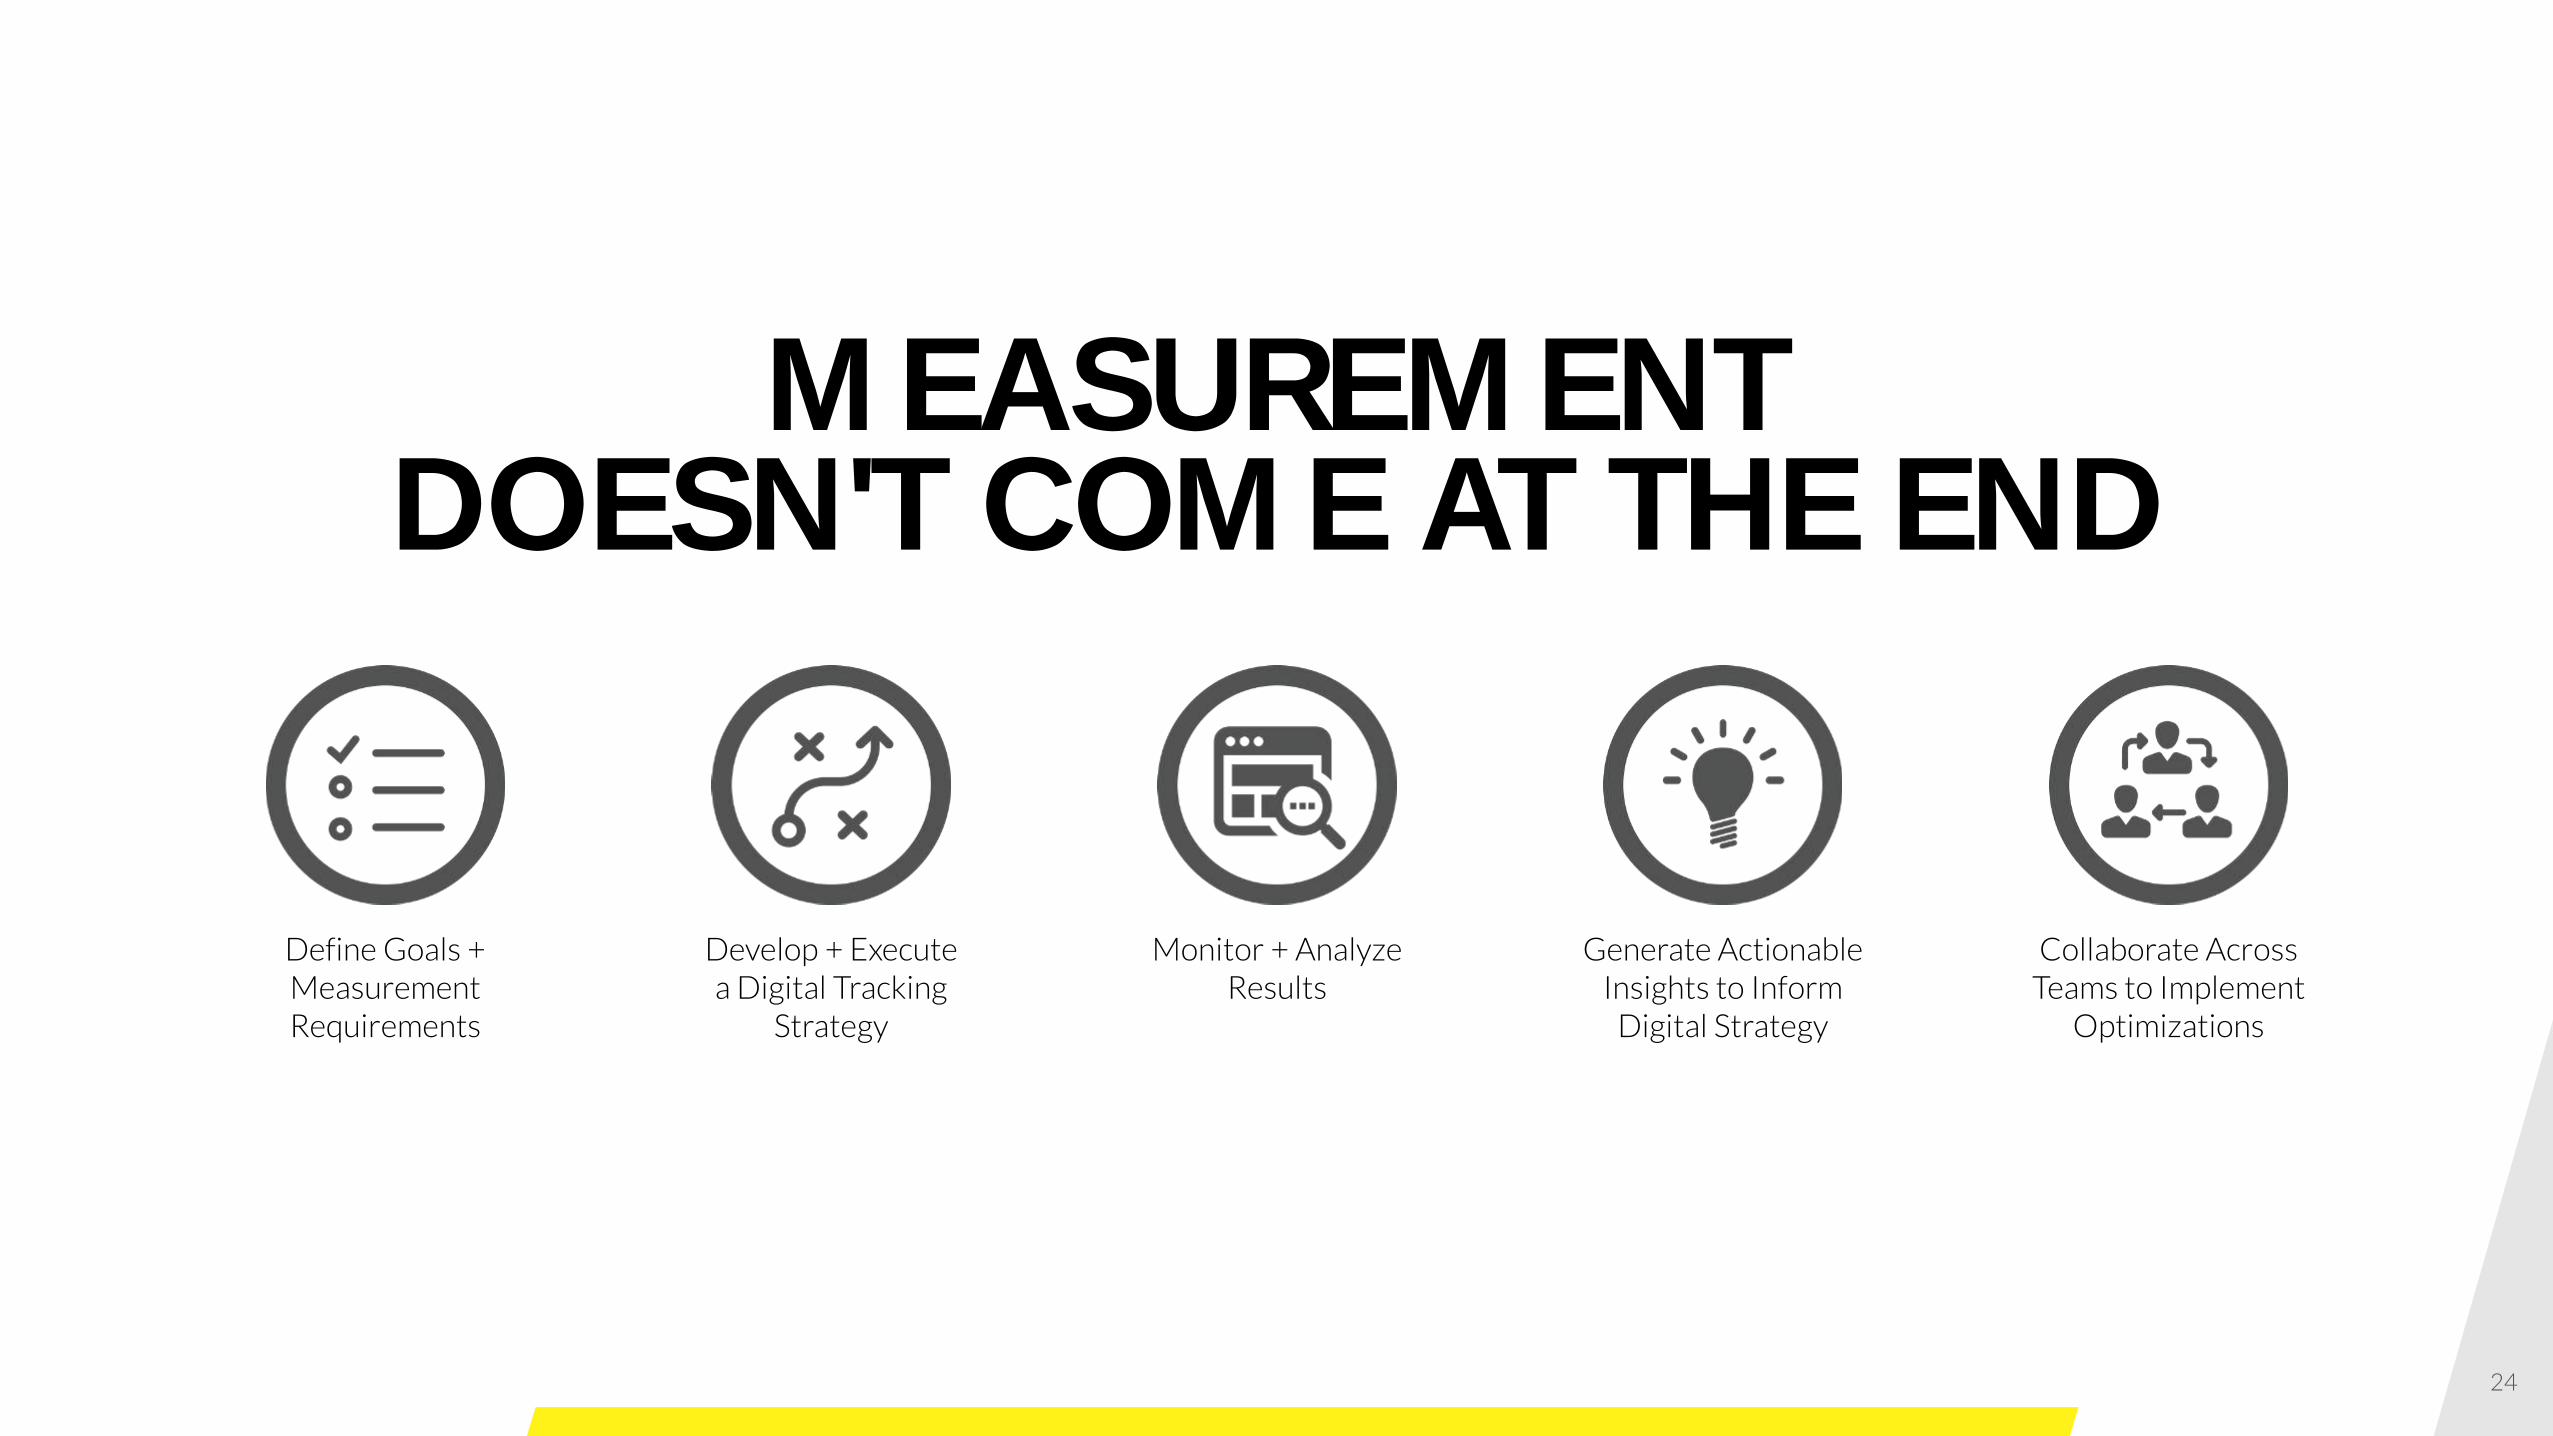
MEASUREMENT DOESN'T COME AT THE END
Define Goals + Measurement Requirements
Develop + Execute a Digital Tracking
Strategy
Monitor + Analyze Results
Generate Actionable Insights to Inform
Digital Strategy
Collaborate Across Teams to Implement
Optimizations
24
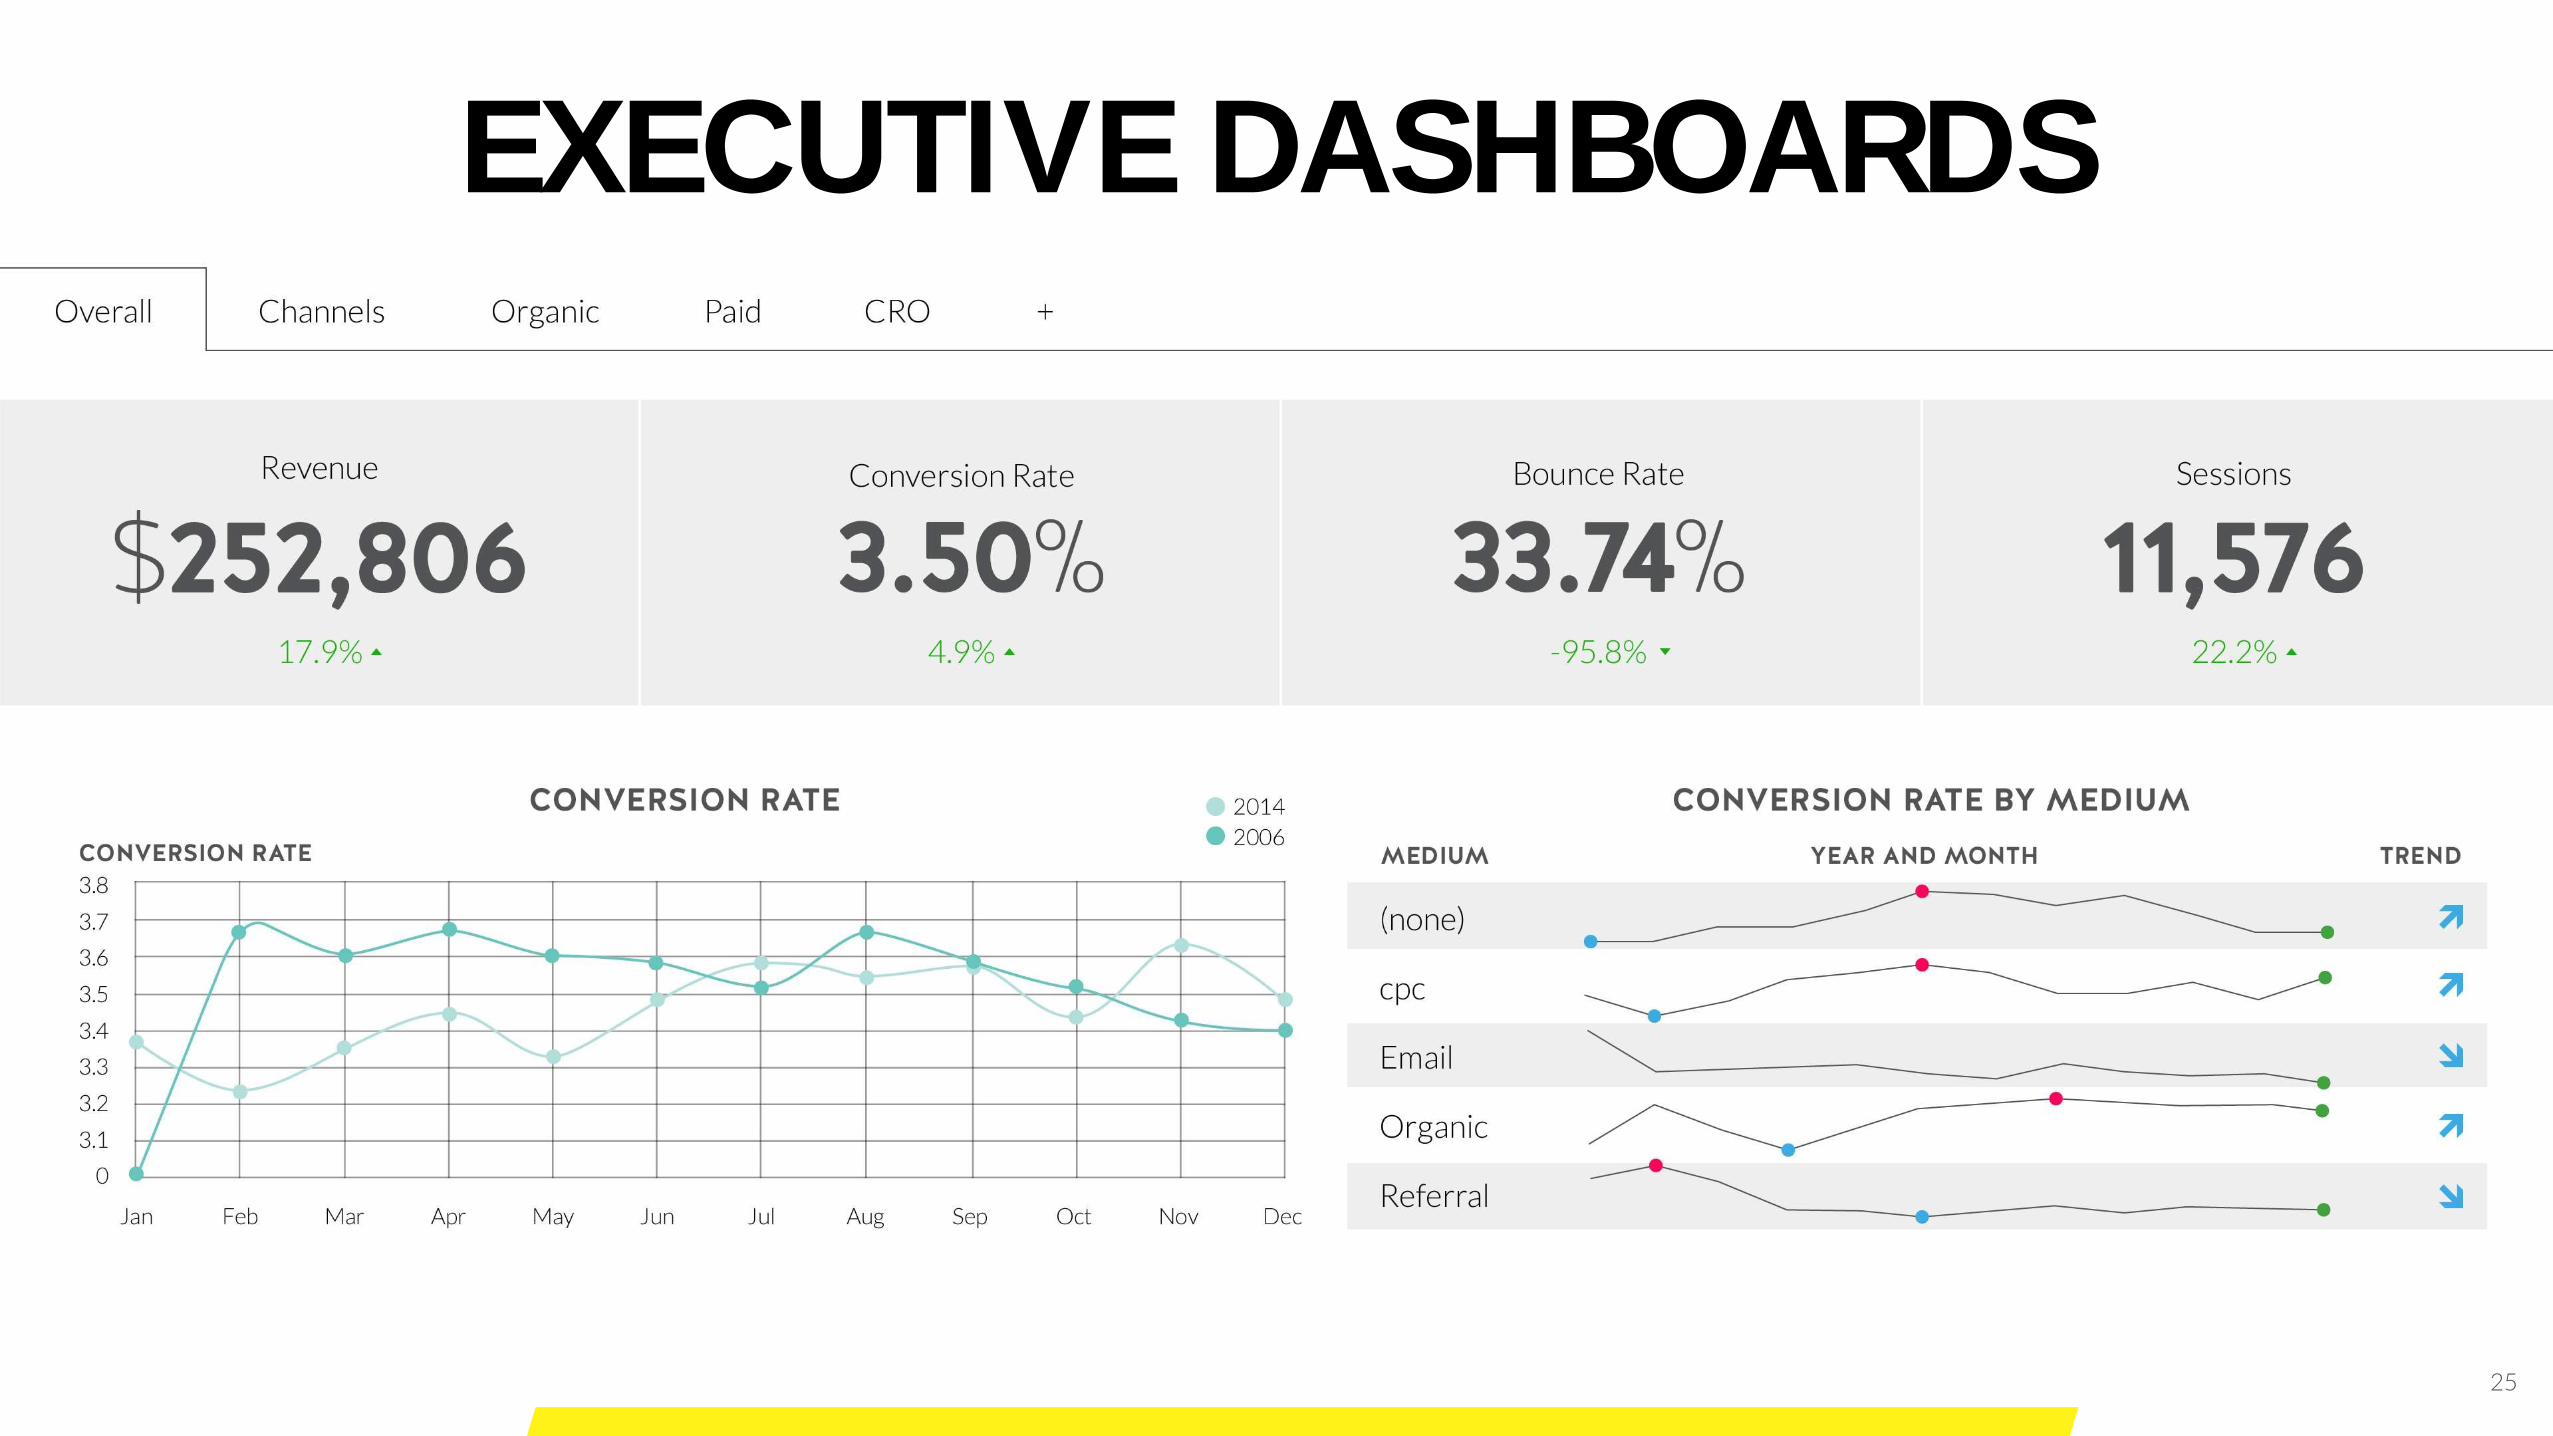
EXECUTIVE DASHBOARDS
25
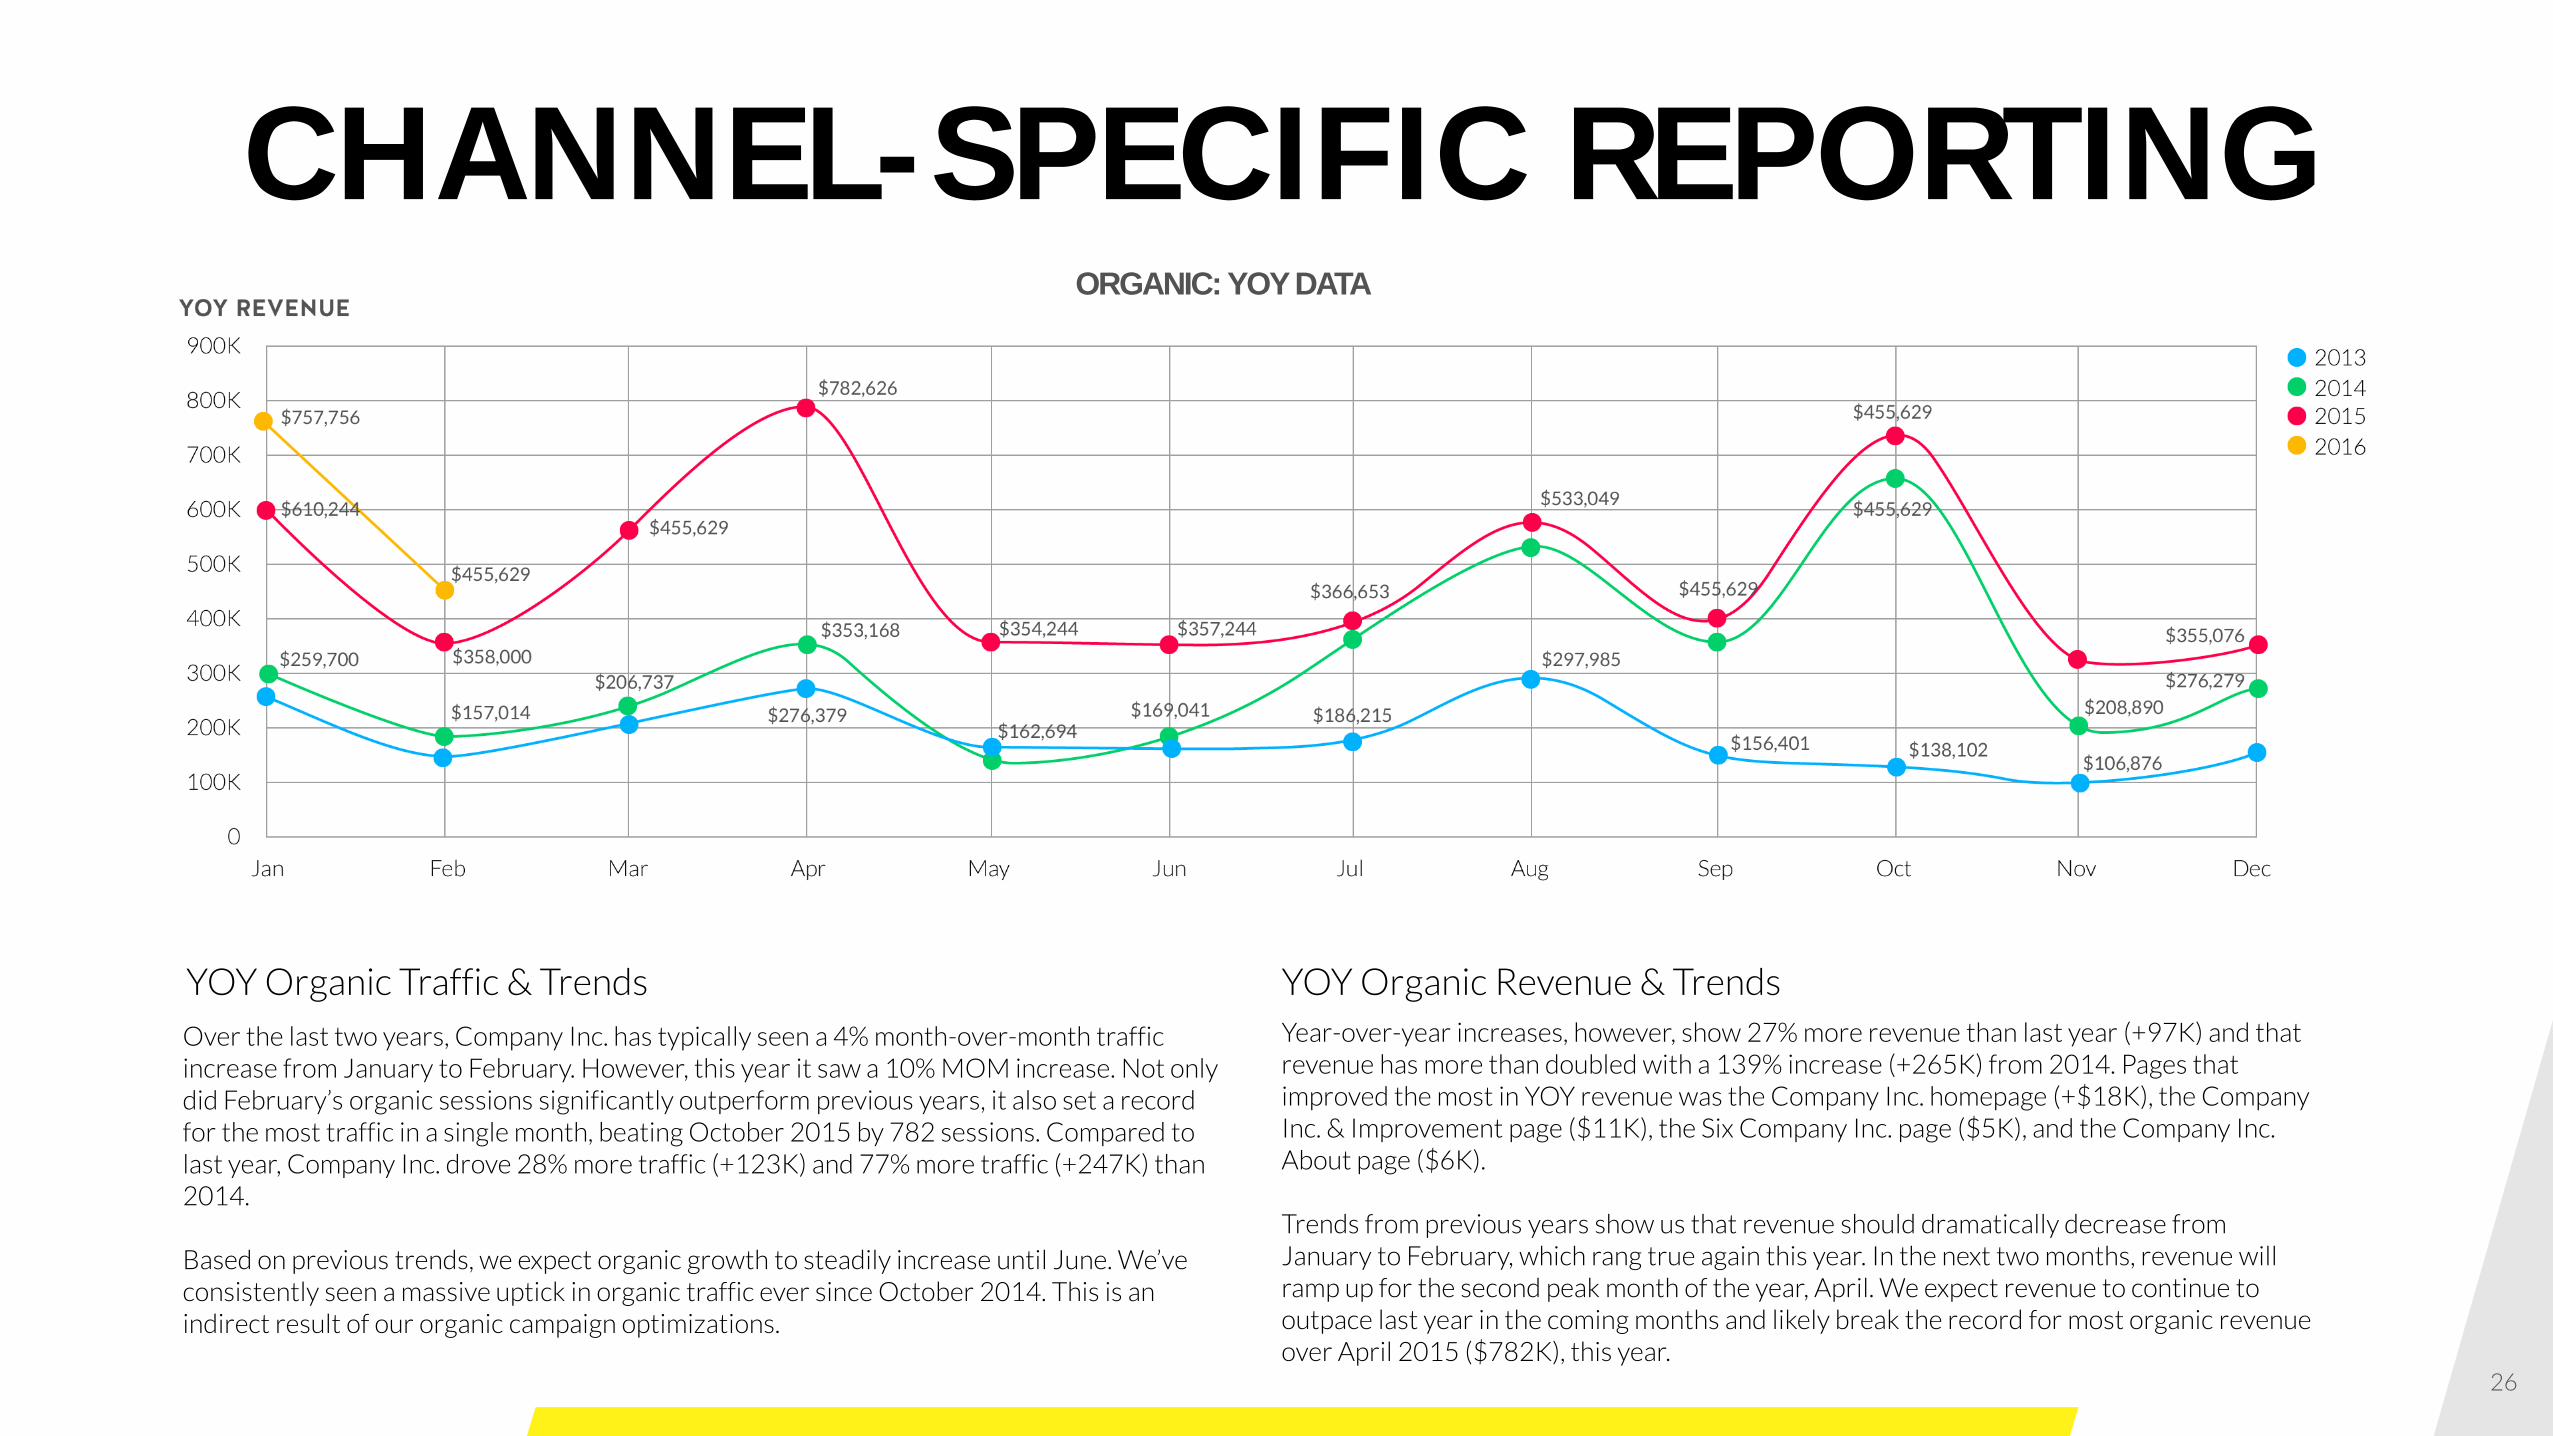
CHANNEL-SPECIFIC REPORTING
Over the last two years, Company Inc. has typically seen a 4% month-over-month traffic increase from January to February. However, this year it saw a 10% MOM increase. Not only did February’s organic sessions significantly outperform previous years, it also set a record for the most traffic in a single month, beating October 2015 by 782 sessions. Compared to last year, Company Inc. drove 28% more traffic (+123K) and 77% more traffic (+247K) than 2014.
Based on previous trends, we expect organic growth to steadily increase until June. We’ve consistently seen a massive uptick in organic traffic ever since October 2014. This is an indirect result of our organic campaign optimizations.
Year-over-year increases, however, show 27% more revenue than last year (+97K) and that revenue has more than doubled with a 139% increase (+265K) from 2014. Pages that improved the most in YOY revenue was the Company Inc. homepage (+$18K), the Company Inc. & Improvement page ($11K), the Six Company Inc. page ($5K), and the Company Inc. About page ($6K).
Trends from previous years show us that revenue should dramatically decrease from January to February, which rang true again this year. In the next two months, revenue will ramp up for the second peak month of the year, April. We expect revenue to continue to outpace last year in the coming months and likely break the record for most organic revenue over April 2015 ($782K), this year.
YOY Organic Traffic & Trends YOY Organic Revenue & Trends
ORGANIC: YOY DATA
26
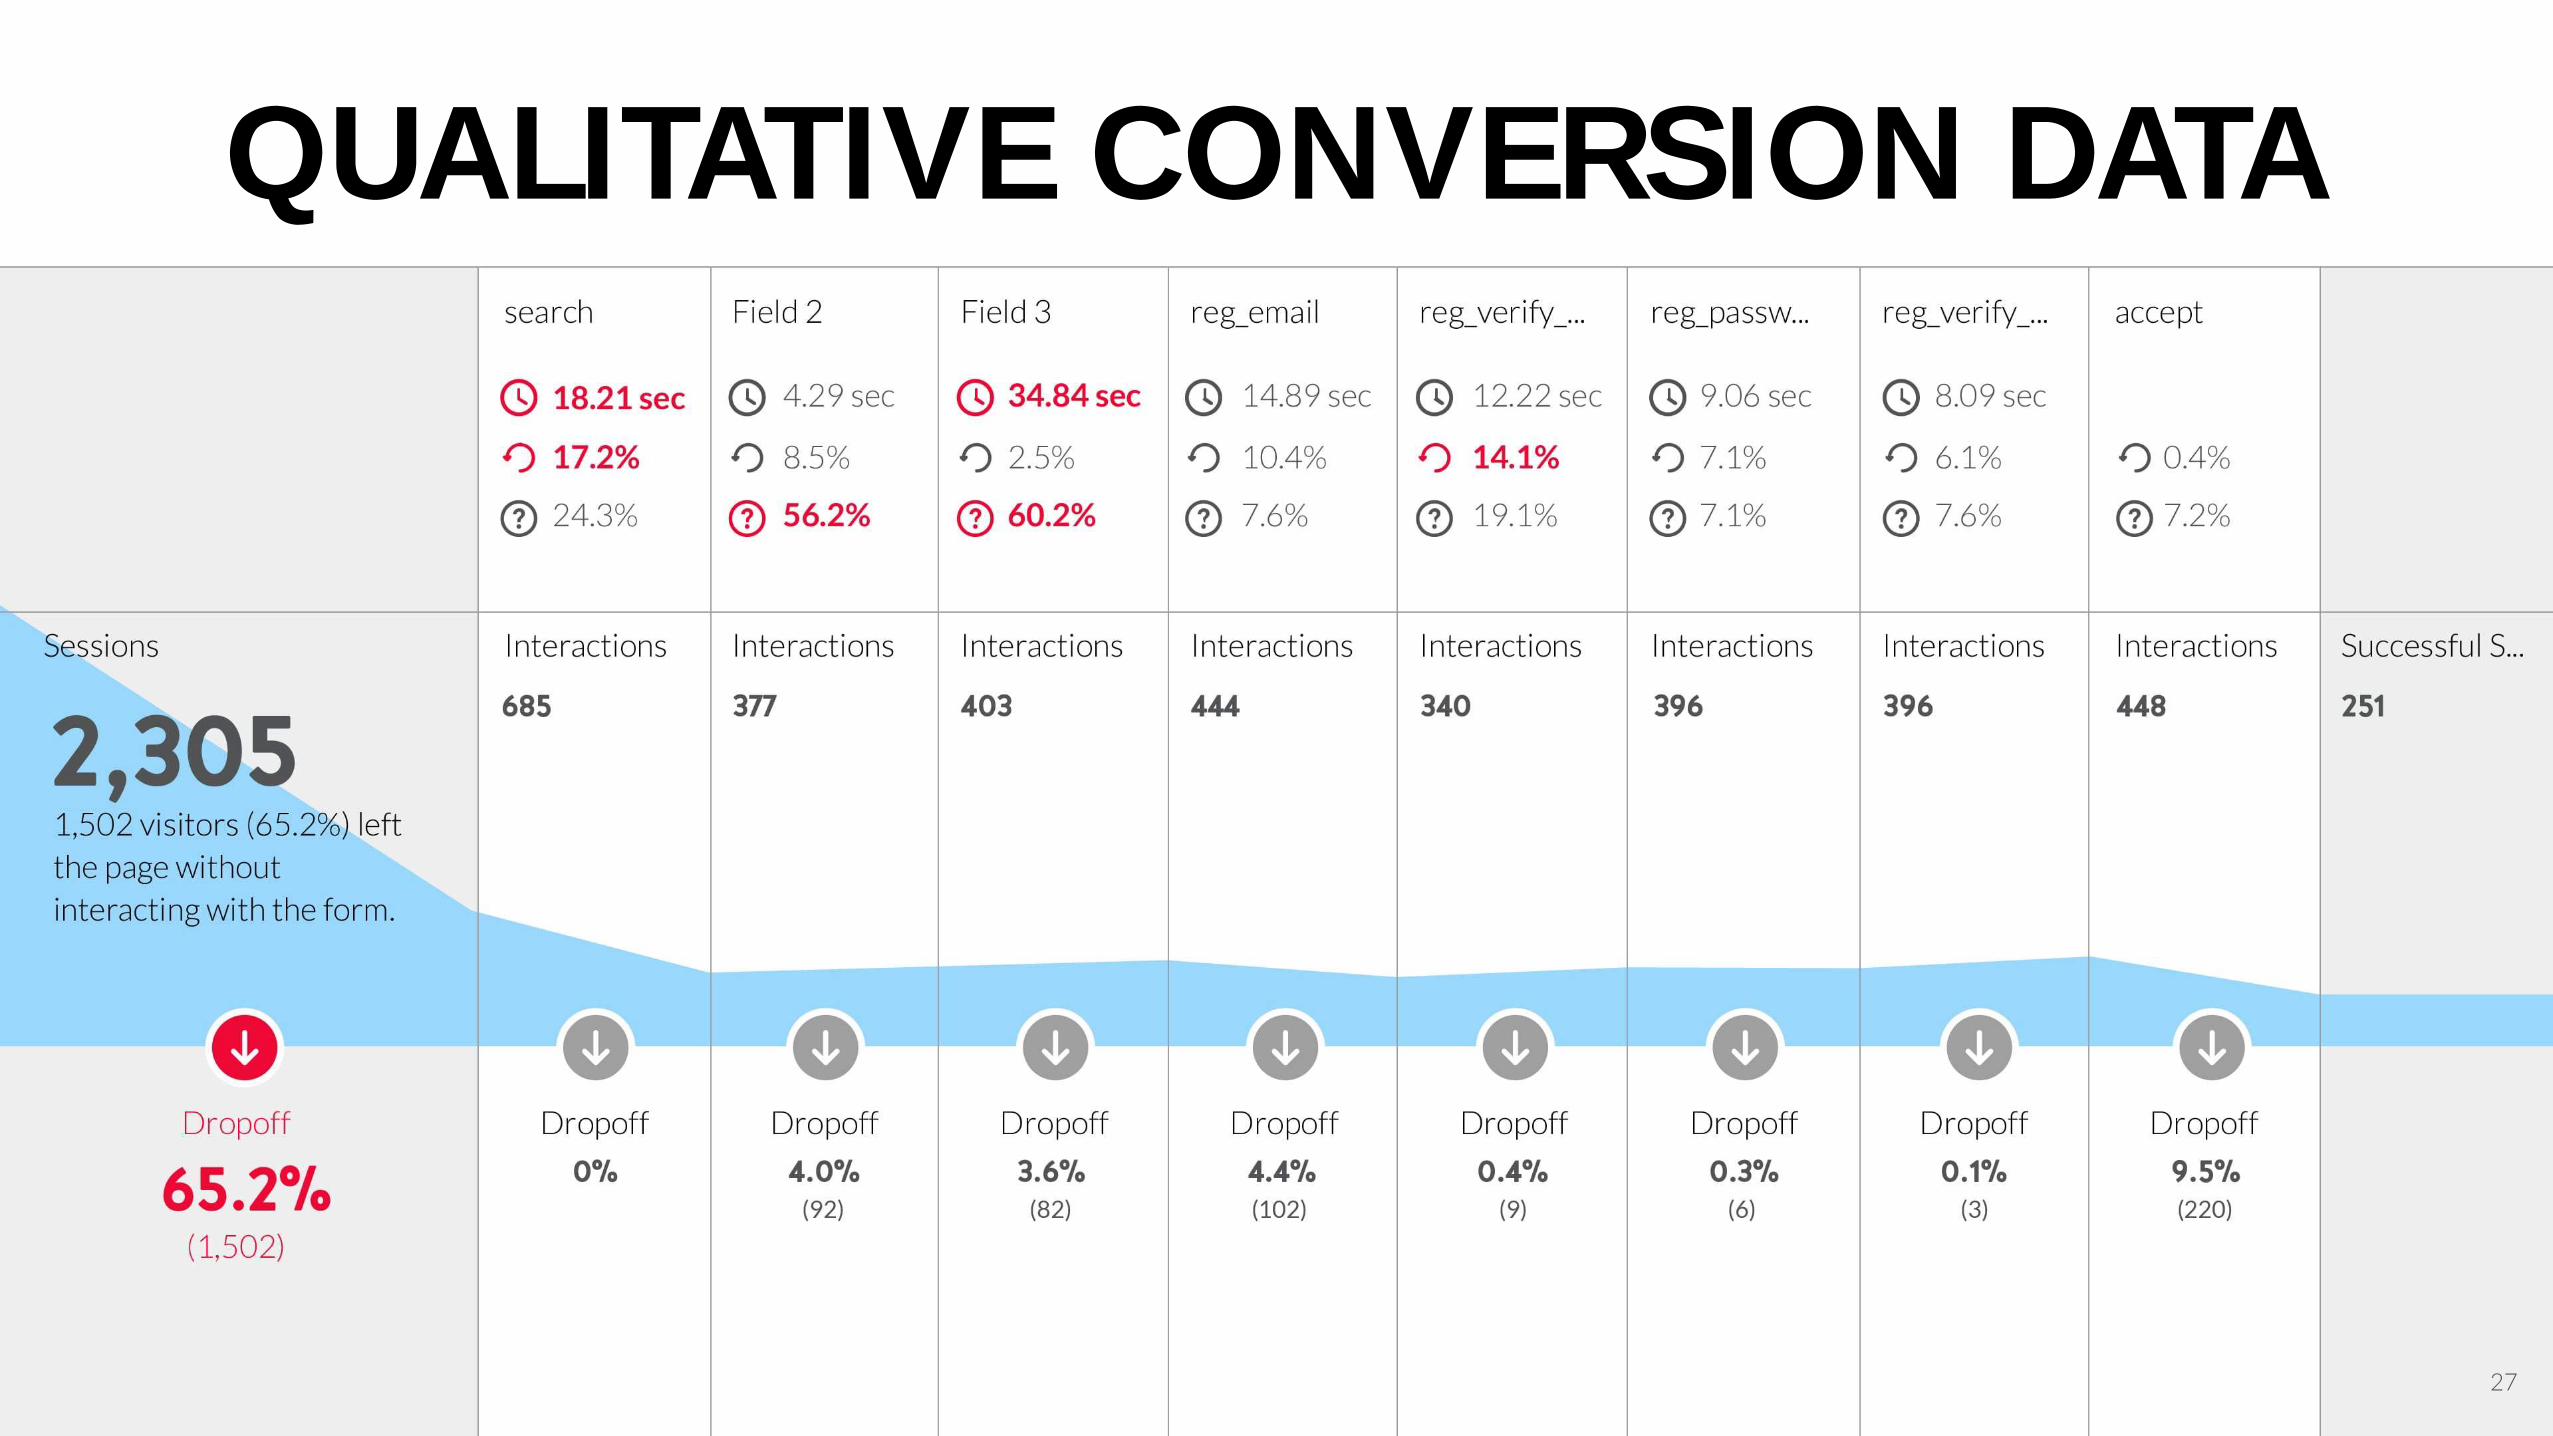
QUALITATIVE CONVERSION DATA
27

OUR WORK
CATEGORYPRODUCT DISPLAY PAGE
CHECKOUT
+46% YOY Conversion Rate Increase
+68% Revenue Per User Increase
We were commissioned to conduct a conversion audit and perform conversion testing aimed to improve eCommerce revenue for an online ceiling fan and lighting retailer. More than 20 tests ran across 2014 to 2016. This data-driven growth plan helped our client get ready for an upgrade to a newer version of its enterprise eCommerce platform. All website changes were tested to mitigate loss, resulting in a 68% increase in revenue.
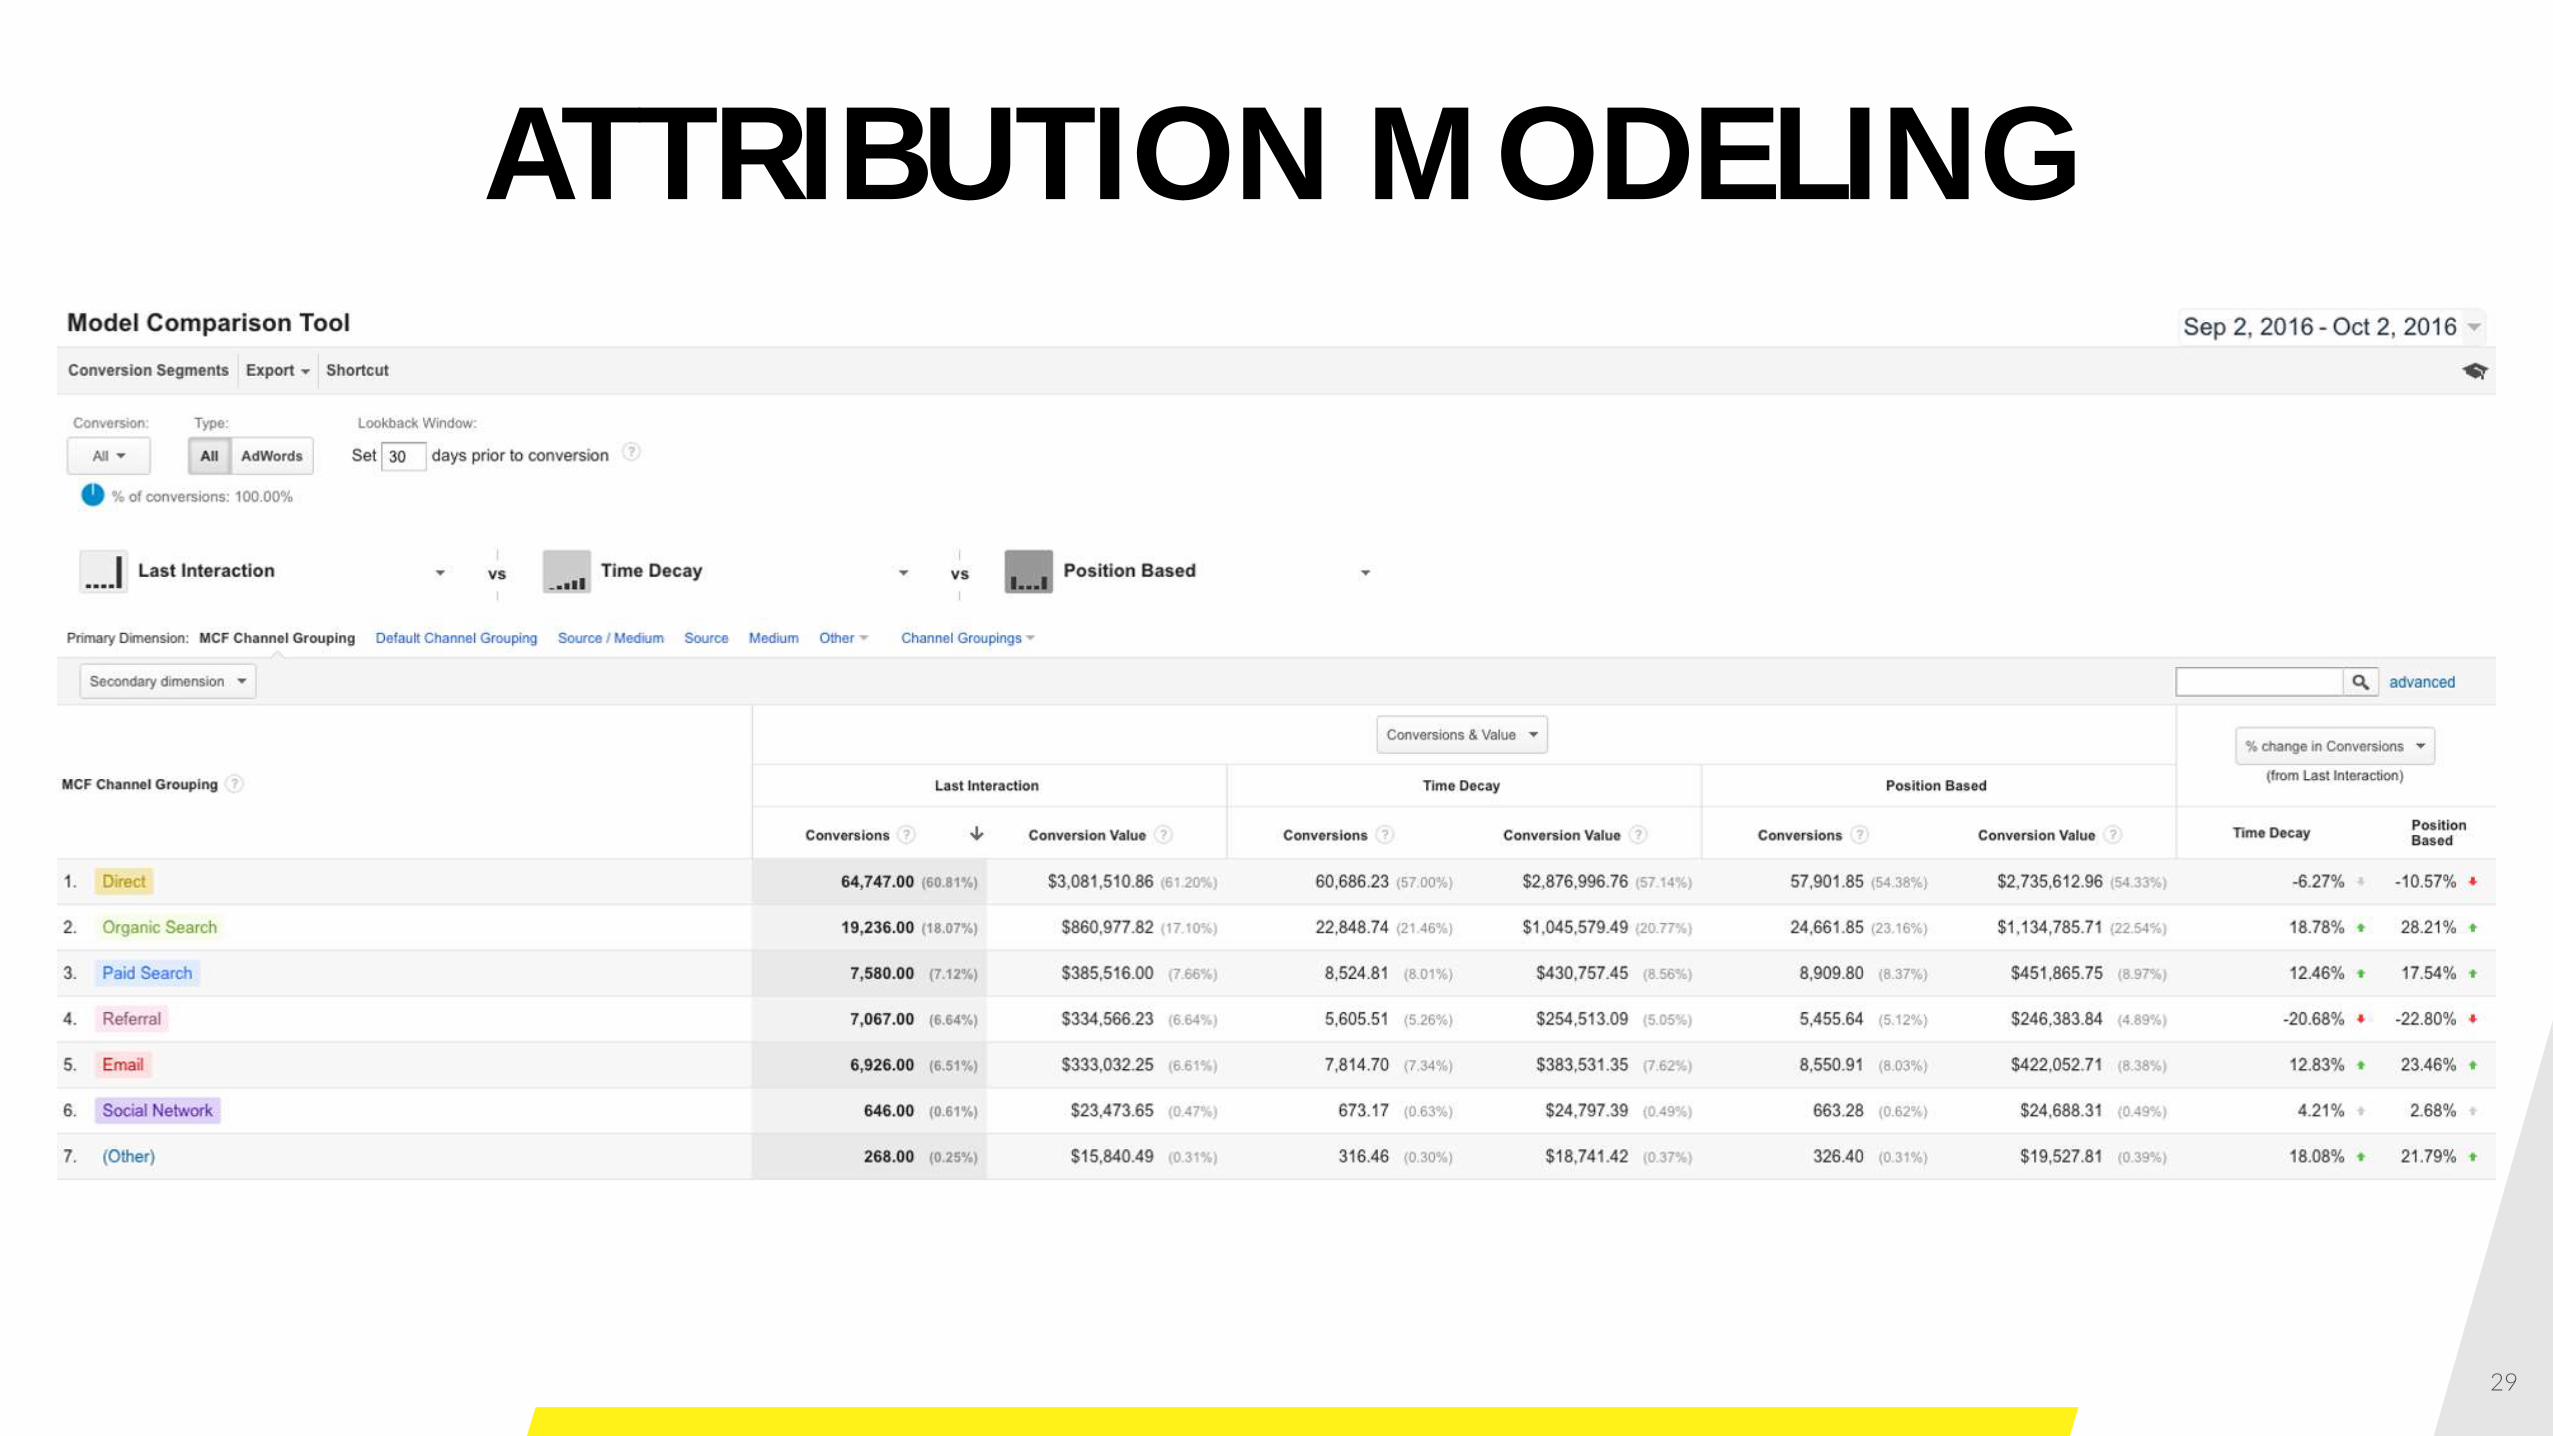
ATTRIBUTION MODELING
29
30
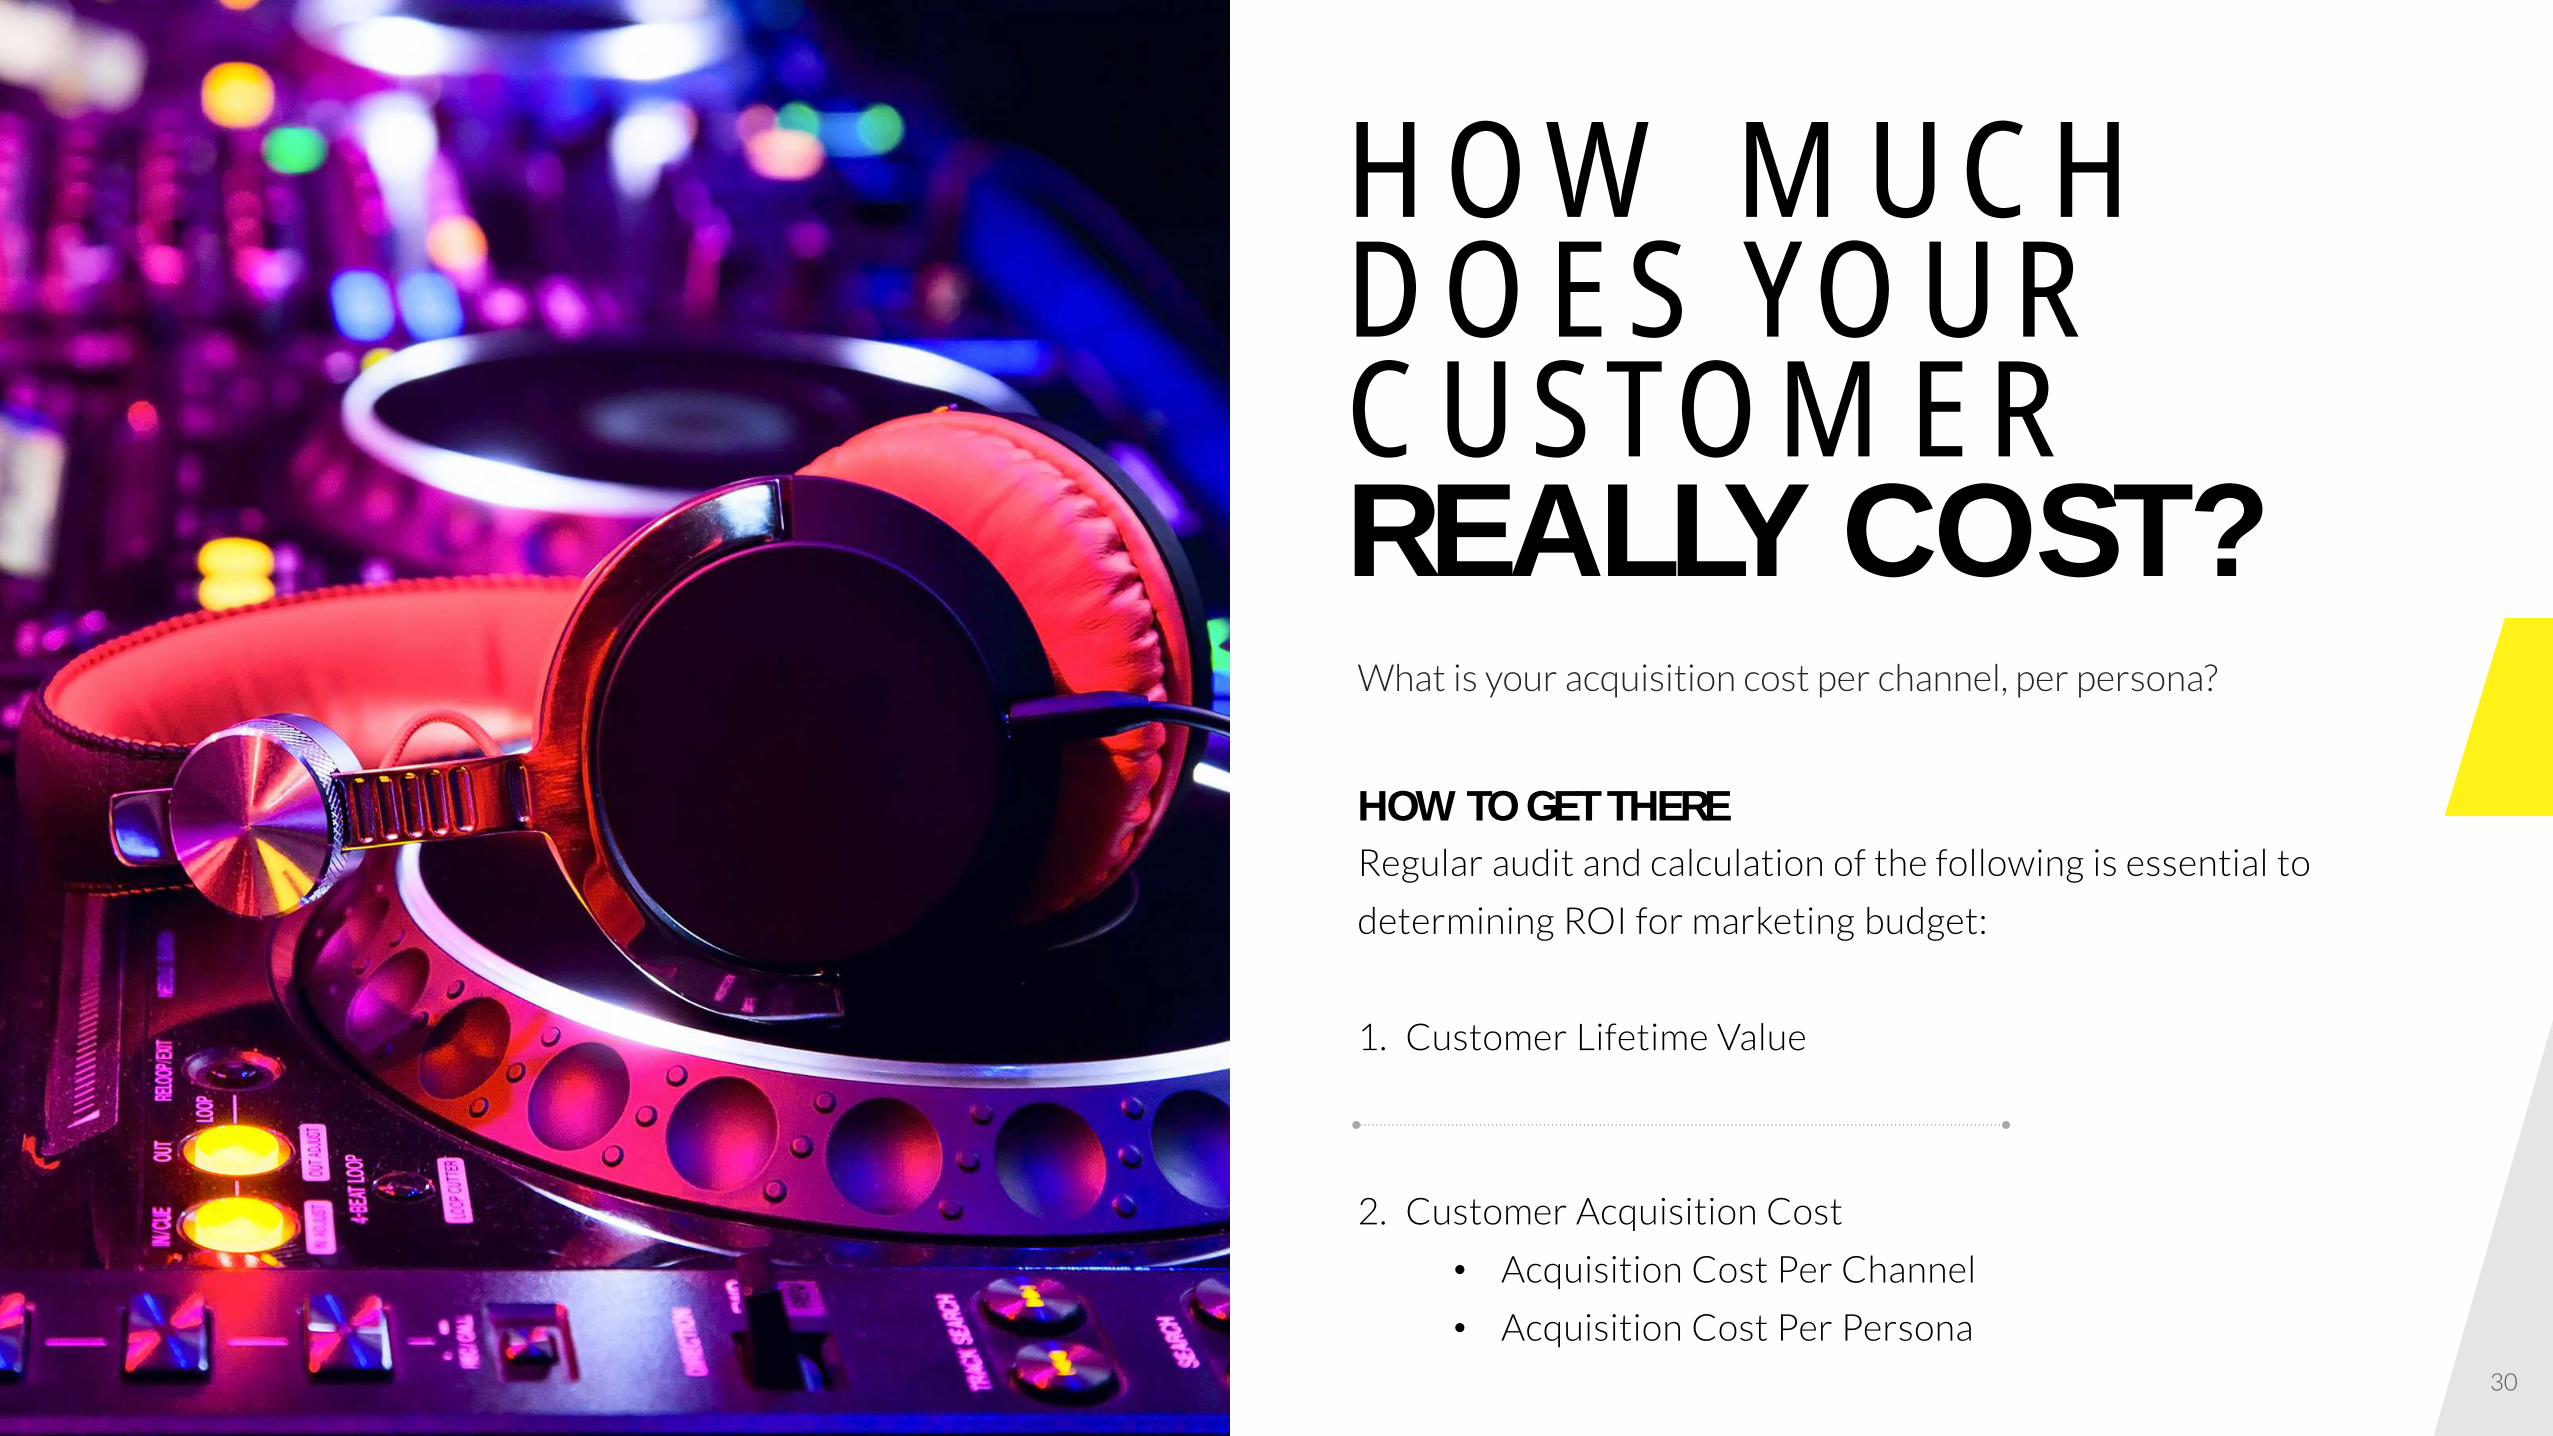
What is your acquisition cost per channel, per persona?
HOW MUCH DOES YOUR CUSTOMER REALLY COST?
HOW TO GET THERERegular audit and calculation of the following is essential to
determining ROI for marketing budget:
1. Customer Lifetime Value
2. Customer Acquisition Cost
• Acquisition Cost Per Channel
• Acquisition Cost Per Persona
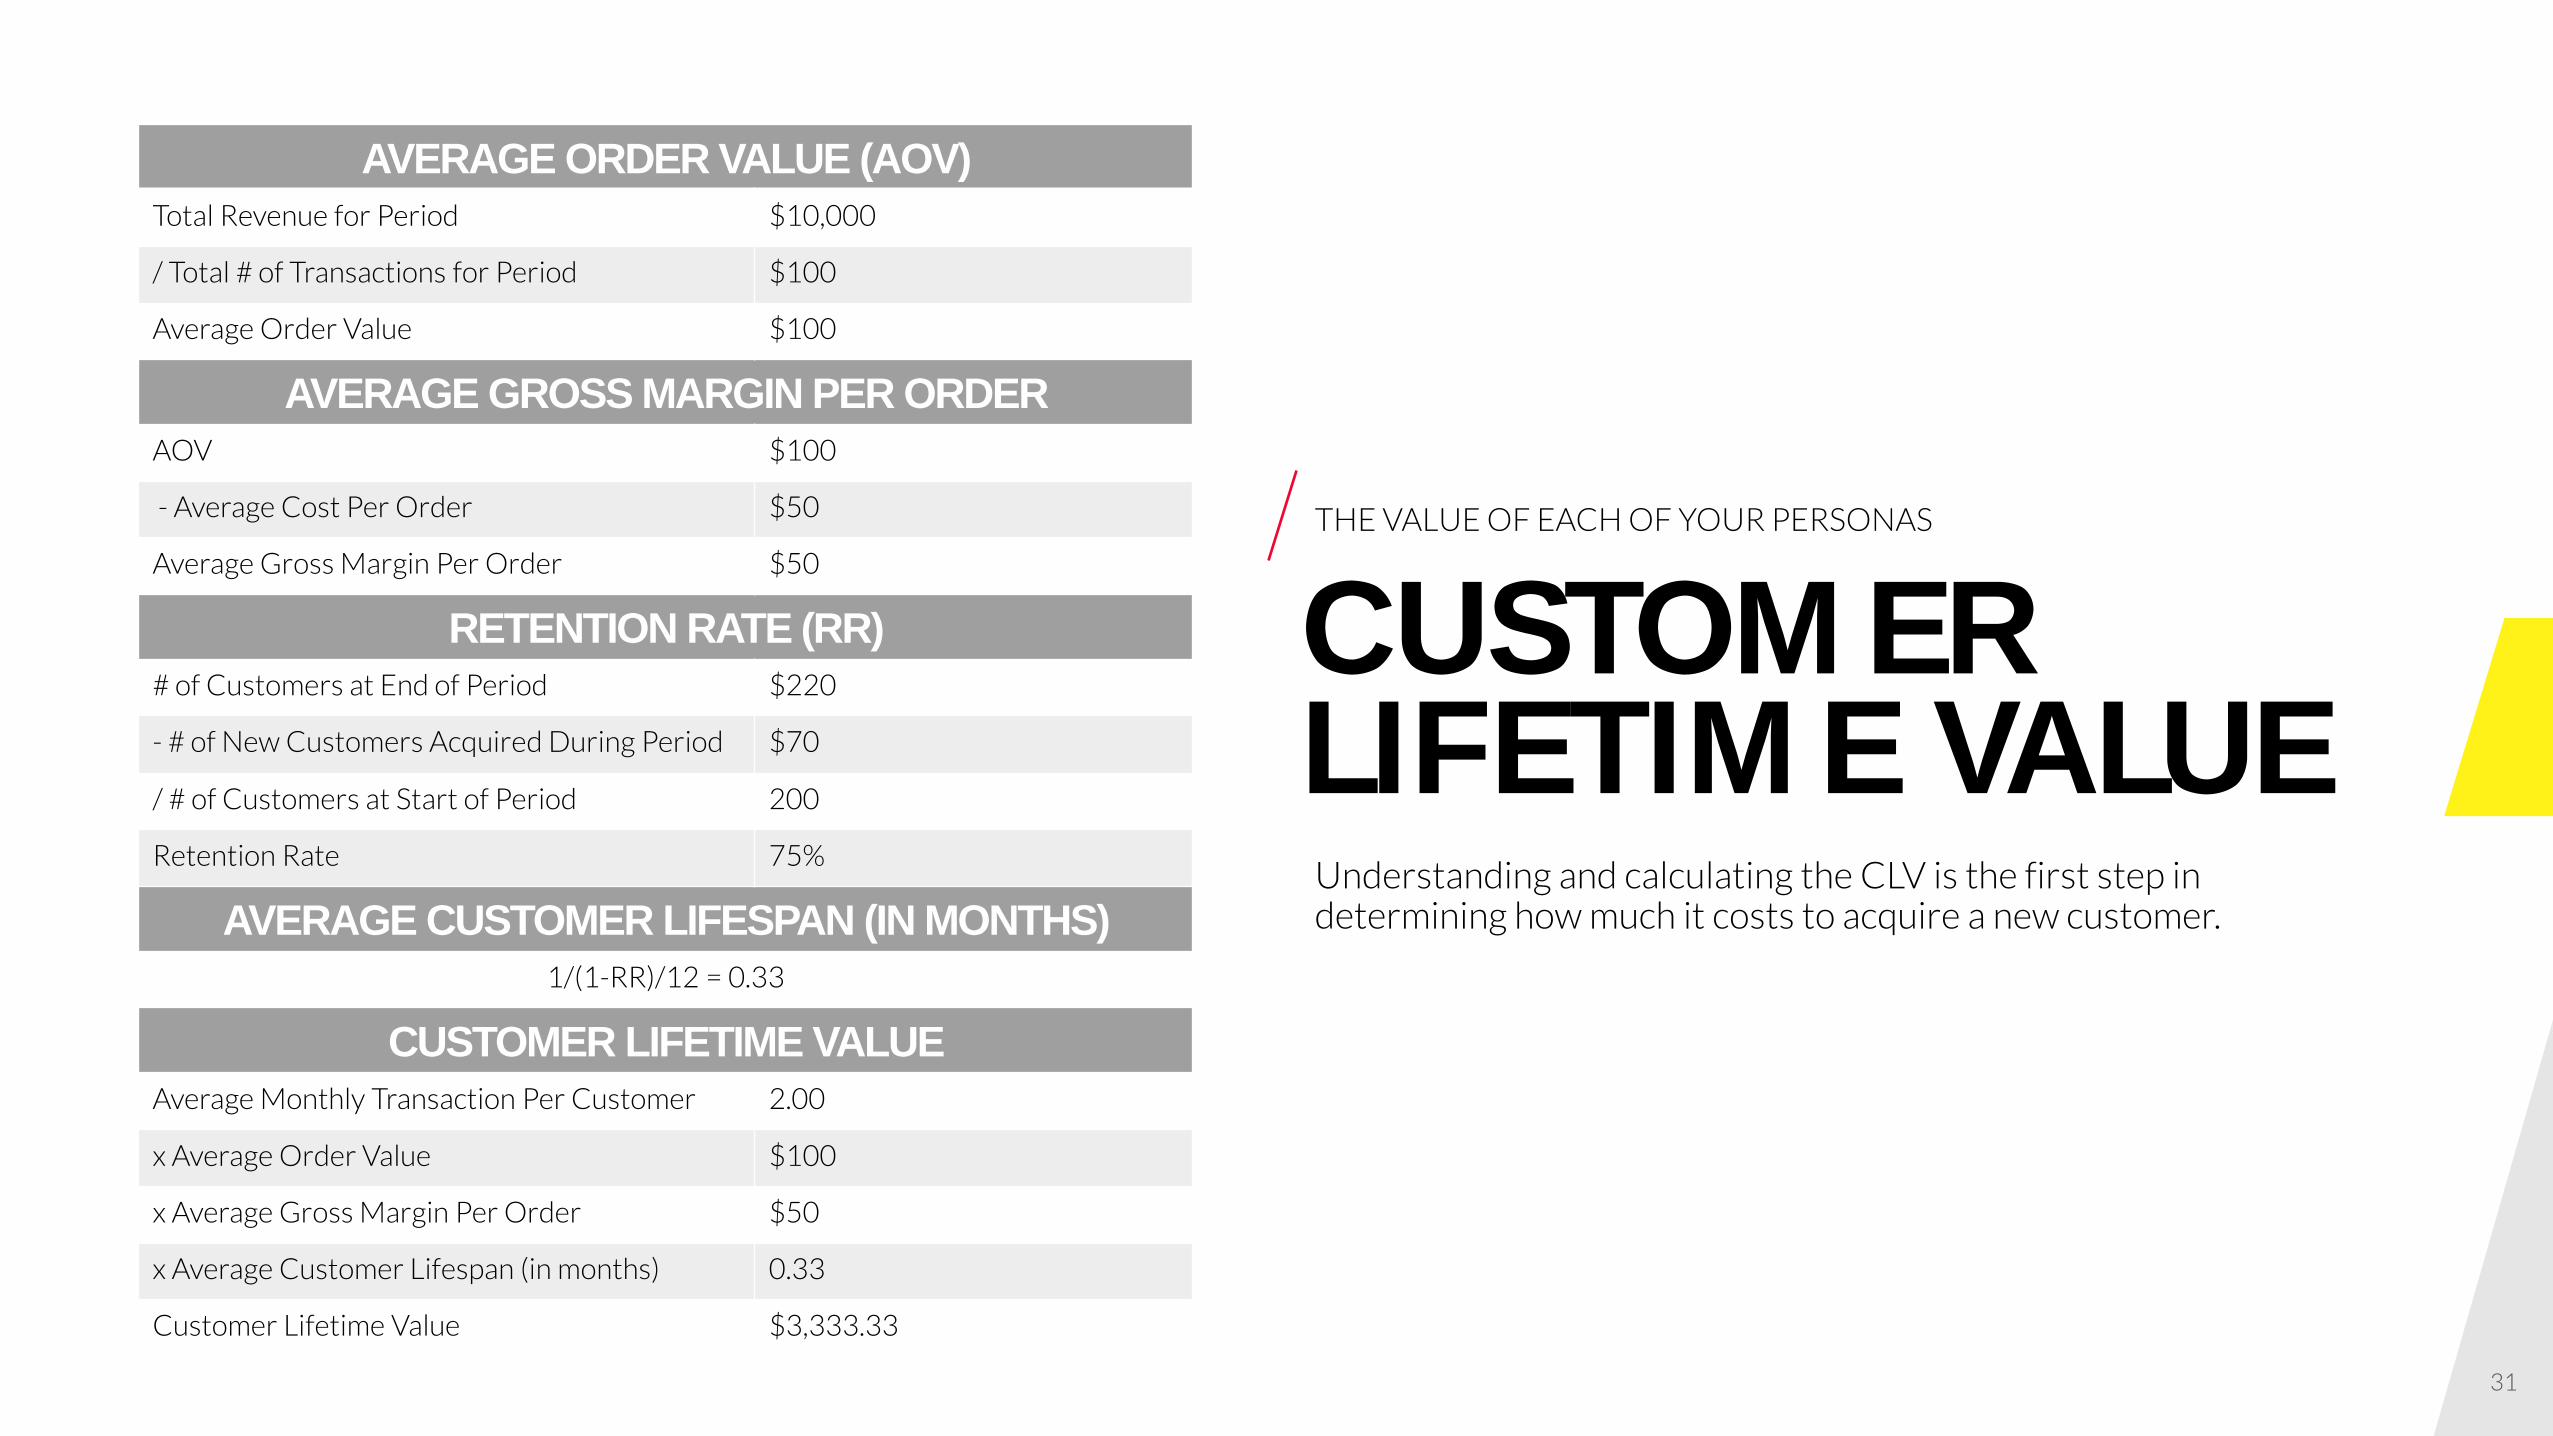
AVERAGE ORDER VALUE (AOV)
Total Revenue for Period $10,000
/ Total # of Transactions for Period $100
Average Order Value $100
AVERAGE GROSS MARGIN PER ORDER
AOV $100
- Average Cost Per Order $50
Average Gross Margin Per Order $50
RETENTION RATE (RR)
# of Customers at End of Period $220
- # of New Customers Acquired During Period $70
/ # of Customers at Start of Period 200
Retention Rate 75%
AVERAGE CUSTOMER LIFESPAN (IN MONTHS)
1/(1-RR)/12 = 0.33
CUSTOMER LIFETIME VALUE
Average Monthly Transaction Per Customer 2.00
x Average Order Value $100
x Average Gross Margin Per Order $50
x Average Customer Lifespan (in months) 0.33
Customer Lifetime Value $3,333.33
THE VALUE OF EACH OF YOUR PERSONAS
CUSTOMER LIFETIME VALUEUnderstanding and calculating the CLV is the first step in determining how much it costs to acquire a new customer.
31
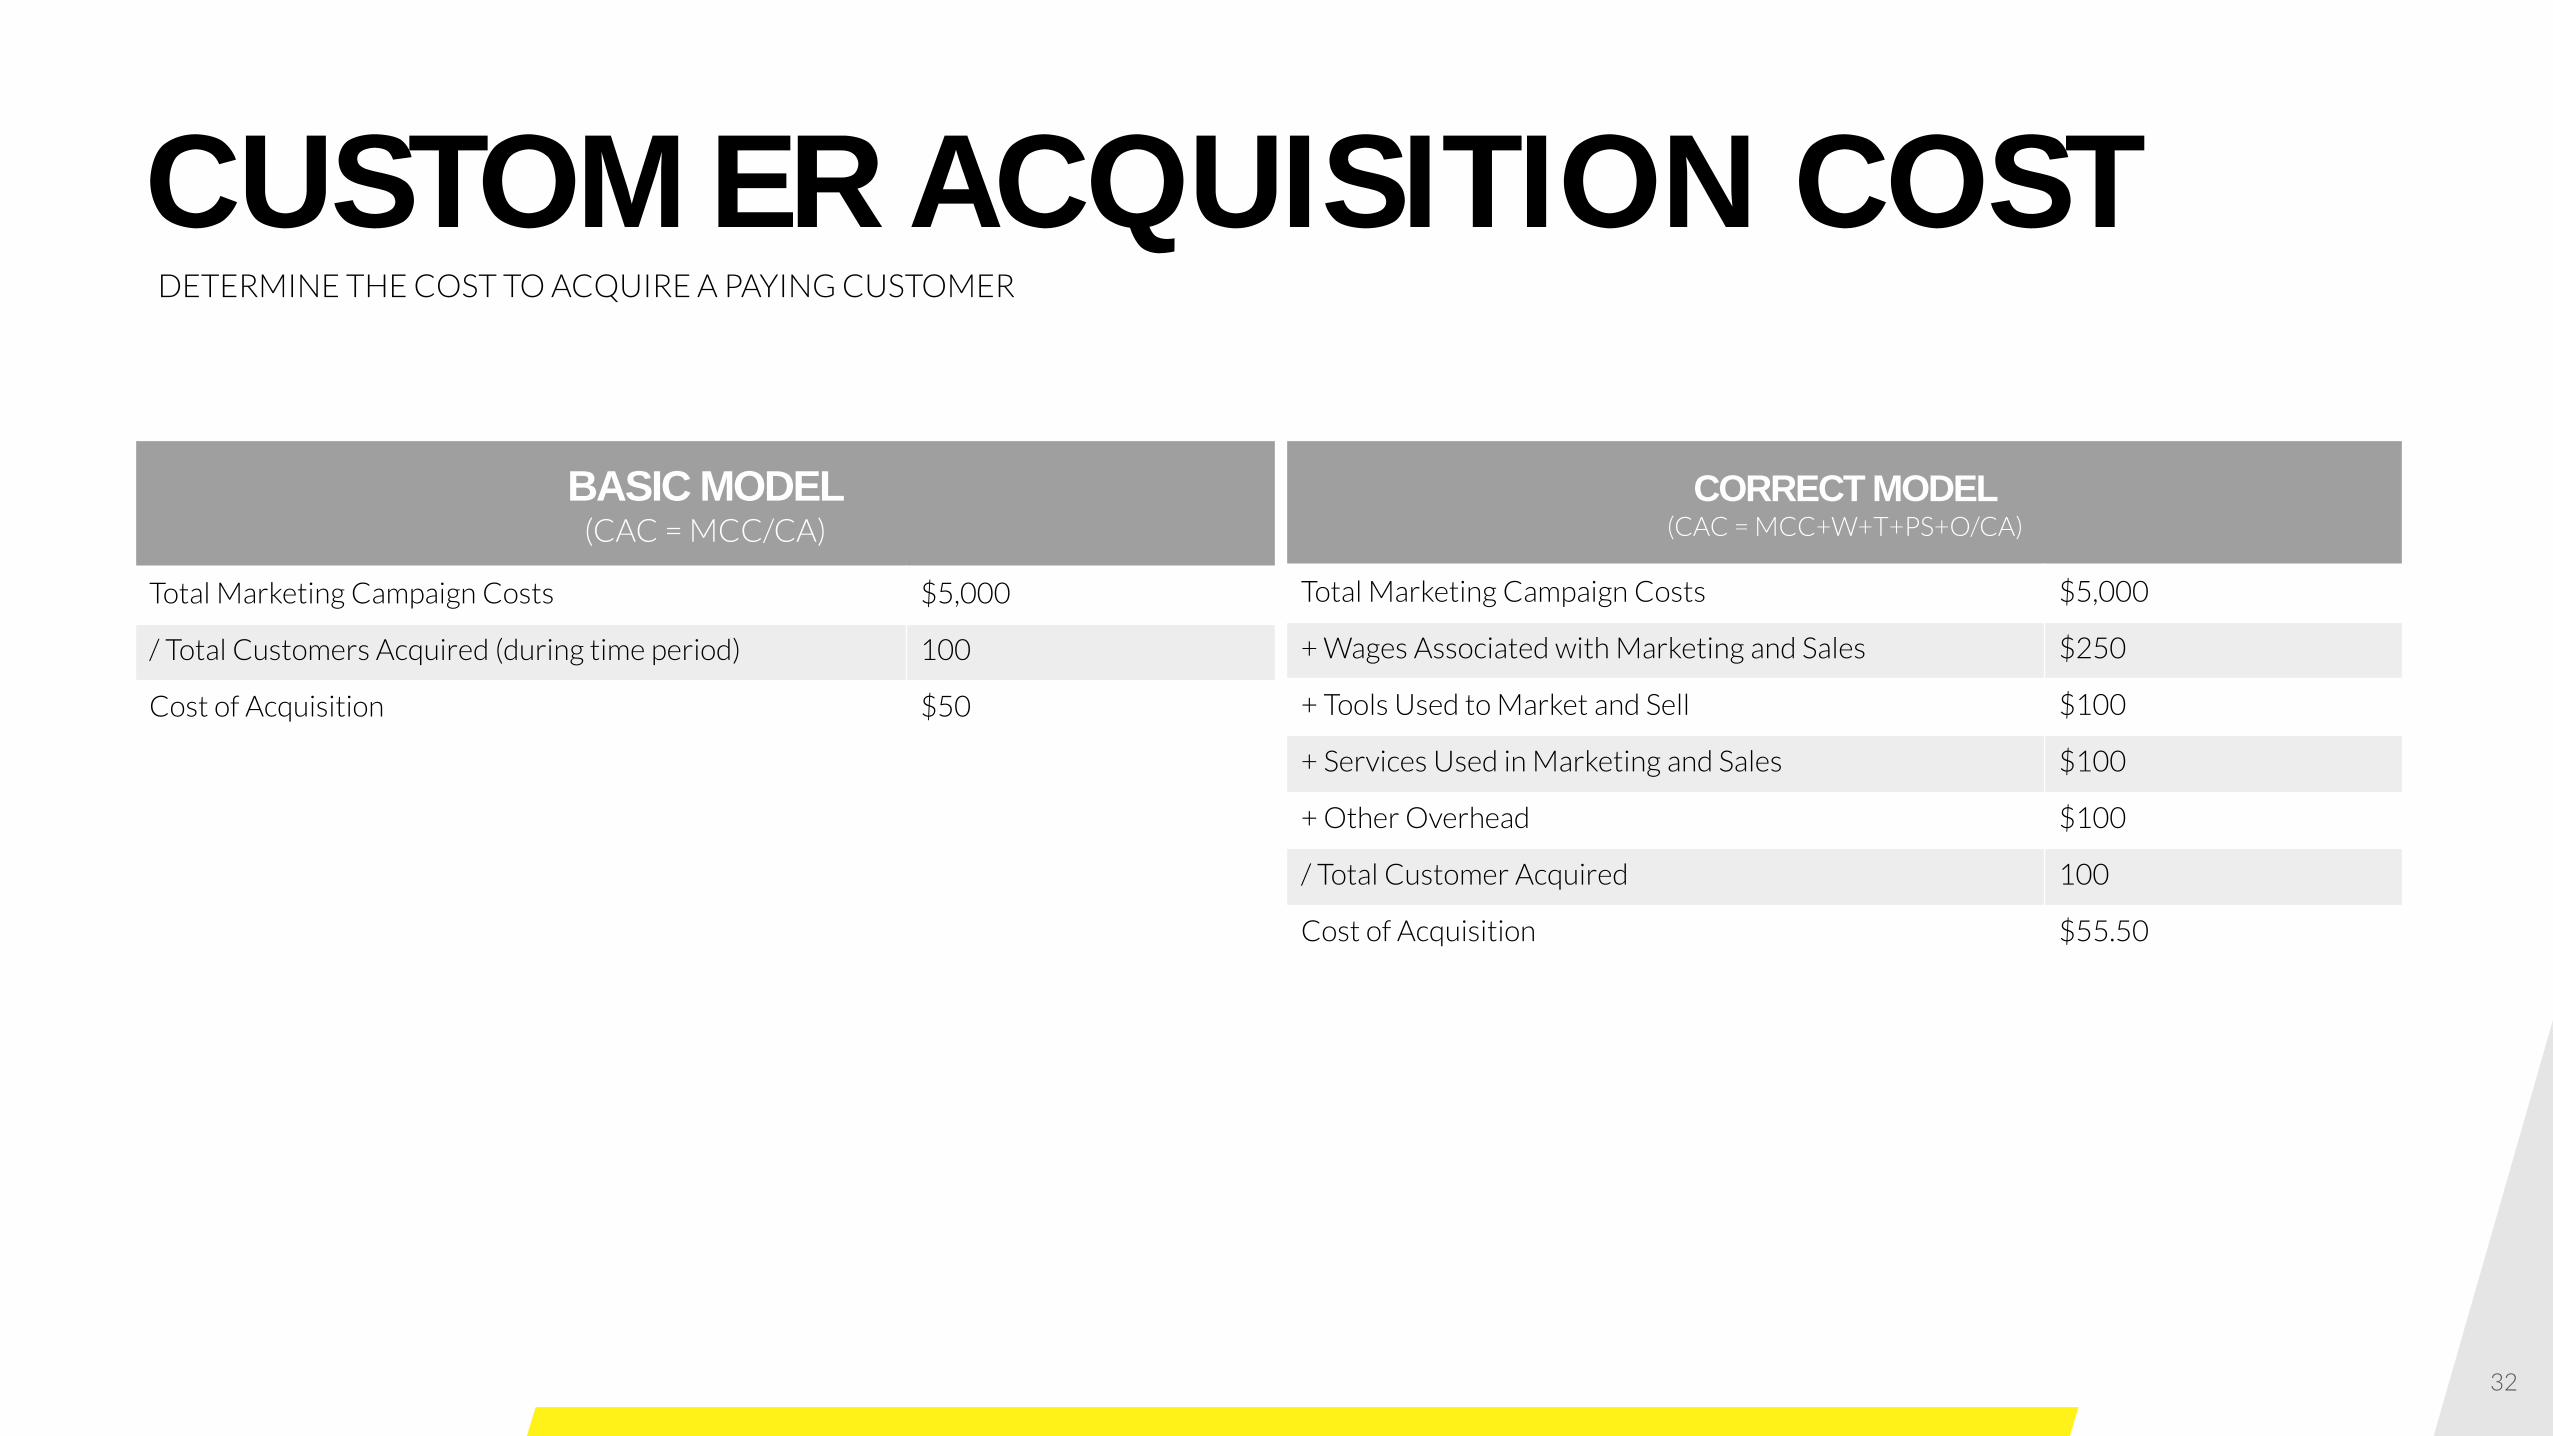
CUSTOMER ACQUISITION COST DETERMINE THE COST TO ACQUIRE A PAYING CUSTOMER
BASIC MODEL(CAC = MCC/CA)
Total Marketing Campaign Costs $5,000
/ Total Customers Acquired (during time period) 100
Cost of Acquisition $50
CORRECT MODEL(CAC = MCC+W+T+PS+O/CA)
Total Marketing Campaign Costs $5,000
+ Wages Associated with Marketing and Sales $250
+ Tools Used to Market and Sell $100
+ Services Used in Marketing and Sales $100
+ Other Overhead $100
/ Total Customer Acquired 100
Cost of Acquisition $55.50
32

33
33
GOAL FULFILLMENTREALIZING ROI FROM DIGITAL TRANSFORMATION

Q+A
35
36
WHAT’S NEXT?
CONNECT WITH US
@PRFTDIGITAL
Facebook.com/PerficientDigital
Blogs.Perficient.com/PerficientDigital
PerficientDigital.com
UPCOMING WEBINAR
Cloud First Series: Why Business is Better in the Cloud
Thursday, October 20, 1:00 -2:00 PM CT