incorporating satisfaction measures into a restaurant productivity index
32
Reynolds, D., & Biel, D. (2007). Incorporating satisfaction measures into a restaurant productivity index. International Journal of Hospitality Management, 26, 352-361 (Awarded Best Paper of the Year 2007 by IJHM). INCORPORATING SATISFACTION MEASURES INTO A RESTAURANT PRODUCTIVITY INDEX Dennis Reynolds College of Business and Economics Washington State University Todd Hall 477 Pullman, WA 99164 509-335-4344 509-335-3857 (fax) [email protected] David Biel School of Hotel Administration Cornell University 119 The Knoll Ithaca, NY 14850 [email protected] An earlier version of this manuscript received the “Editor’s Choice Award” at the 2005 International Conference on Services Management in Delhi, India. We thank the meeting-paper reviewers, and especially Dr. Vinnie Jauhari, Conference Program Chair, as
Transcript of incorporating satisfaction measures into a restaurant productivity index

Reynolds, D., & Biel, D. (2007). Incorporating satisfaction measures into a restaurant productivity index. International Journal of Hospitality Management, 26, 352-361
(Awarded Best Paper of the Year 2007 by IJHM).
INCORPORATING SATISFACTION MEASURES INTO A RESTAURANT PRODUCTIVITY INDEX
Dennis ReynoldsCollege of Business and Economics
Washington State UniversityTodd Hall 477
Pullman, WA 99164509-335-4344
509-335-3857 (fax)[email protected]
David BielSchool of Hotel Administration
Cornell University119 The Knoll
Ithaca, NY [email protected]
An earlier version of this manuscript received the “Editor’s Choice Award” at the 2005 International Conference on Services Management in Delhi, India. We thank the meeting-paper reviewers, and especially Dr. Vinnie Jauhari, Conference Program Chair, as well as the IJHM
editor and his reviewers for their advice and counsel.
Dennis Reynolds, Ph.D., is the Ivar Haglund Distinguished Professor of Hospitality Management at the Washington State University School of Business and Economics in
Pullman, Washington, USA.
David Biel is a research assistant and student at the Cornell University School of Hotel Administration in Ithaca, New York, USA.

INCORPORATING SATISFACTION MEASURES INTO A RESTAURANT PRODUCTIVITY INDEX
ABSTRACT
The increasing stature of the foodservice industry in the global service economy suggests
that productivity analyses—similar to those performed in non-service-based settings—would
benefit multiunit operators by maximizing their desirable operational outcomes while
minimizing expenses and other detrimental conditions such as low job satisfaction. This paper
suggests that such analyses might be possible through the application of a holistic productivity
metric—one that includes traditional operational variables such as revenue, profit, food cost, and
labor cost, and previously ignored variables such as guest and employee satisfaction as well as
retention equity. Through data gathered from a single chain’s 36 corporate-owned, same-brand
casual-theme restaurants located in metropolitan centers across the United States, we found that
factors leading to maximum outputs such as controllable profit and retention equity include
employee satisfaction in addition to expected variables such as cost of goods sold and number of
seats. Most notably, employee satisfaction as an input proved to be the most volatile variable in
maximizing operational outputs.
Keywords: Productivity, data envelopment analysis, employee satisfaction, guest satisfaction
1

INCORPORATING SATISFACTION MEASURES INTO A RESTAURANT PRODUCTIVITY INDEX
In today’s highly competitive global foodservice arena, multi-unit restaurant operators
are embracing every opportunity to maximize their operational efficiency. The methods used to
benchmark and assess productivity have been limited, however, to overly simplistic approaches
and, as a result, have offered limited utility. As Sigala (2004) noted, “Although there have been
attempts to identify satisfactory productivity-monitoring procedures, these have been heavily
criticized and no generally accepted means of productivity measurement exists” (p. 39).
Consider also the increasing complexity of restaurant operations, which, conjoined with
constantly escalating consumer expectations and demands, adds to the challenges faced by
foodservice operators. Traditional partial-factor productivity statistics, such as meals-per-labor
hour, simply do not reflect adequately the many factors that influence the metric. Moreover,
service-process matrices, such as those detailed by Schmenner (1986), offer constructive
guidelines for assessing productivity but are difficult to integrate into some distinct service-
industry segments such as foodservice.
Following Reynolds’s (1999) call for a productivity index that is truly holistic and Kohli
and Jaworski’s (1990) assertions regarding business analyses that include a customer-service
orientation, this study explores several input and output variables while introducing a
comprehensive productivity metric. In particular, we investigate the effects of the customary
unit-level financial indicators (e.g., profit, revenue, cost of goods, labor cost, occupancy cost),
constraining variables (e.g., number of seats, square footage), and previously unexplored
variables such as employee and guest satisfaction; we also consider related factors such as
retention equity. The study makes its primary contribution in developing a more holistic
2

productivity metric than those considered previously. We also evaluate the importance of guest
and employee satisfaction data in assessing unit-level restaurant productivity.
LITERATURE REVIEW
Researchers have demonstrated that superior financial performance correlates strongly
with productivity. Most notably, Schmenner (2004) provided theoretical support for this
relationship using the service businesses as the primary focus. Others have presented empirical
support using a variety of service-industry segments including lodging (Morey and Dittman
1995; Hu and Cai 2004), midscale restaurants (Reynolds 2004), and on-site foodservice
(Reynolds 1998).
Correspondingly, the use of and focus on productivity has evolved dramatically during
the last 25 years. This development has been fueled largely by increasingly stringent resource
constraints with a disproportionate rise in labor-related expenses. Given the labor intensiveness
of hospitality-related businesses, interest in productivity analyses has focused predominately on
labor and its corollaries: service outcomes per employee (e.g., rooms cleaned, meals served),
labor hour, or labor-dollar value (Ball, Johnson, and Slattery 1986).
Variable Identification
Building on Reynolds’s (1998) definition of productivity as the effective use of resources
to achieve operational goals, researchers and practitioners have recently acknowledged the
importance of productivity analyses that are more comprehensive than any single-factor indices.
Brown and Dev (1999), for example, posited the use of capital productivity output by
considering three single-factor statistics, including income before fixed charges per full-time
equivalent employee. Similarly, Jones and Hall (1996) used multiple single-factor statistics as a
3

means to consider desirable service-delivery outcomes such as perceived service relative to labor
expenditure.
In moving toward what Bucklin (1978) termed “multi-factor” productivity analysis,
Sigala (2004) aptly explained that the largest problem is the identification of inputs and outputs.
Reynolds (1998) added that any meaningful productivity statistic must not only accurately
identify inputs and outputs, but must integrate all critical variables if such a measure is used to
assess overall operational productivity.
So which variables are critical for a holistic productivity measure in a restaurant setting?
Ball, Johnson, and Slattery (1986) suggested that three broad categories of variables are
essential: financial, physical, and composite (reflecting financial and physical variables).
Furthermore, many researchers (e.g., Rimmington and Clark 1996) have explained that discreet
quantitative measures, such as revenue and net profit, are ideal since these encapsulate broader
aspects of the operation.
Regarding outputs, then, several researchers have demonstrated the criticality of revenue
(e.g., Pilling, Donthu, and Henson 1999; Thore, Phillips, Ruefli, and Yue 1996). Perhaps of
greater importance to operators, profit—often calculated as controllable income to reflect profit
before corporate overhead costs are allocated—has proved vital to any robust measure of unit-
level productivity (Grifell-Tatjé and Lovell 1999). Moreover, consideration of both revenue and
profit is considered paramount to gauging an individual operating unit’s financial viability
(Ingenito and Trehan 1996).
Guest satisfaction has been the most elusive output variable, yet many consider it the
most important as an indicator of long-term success. Lee-Ross (1994) and Witt and Witt (1989)
underscored the importance of service quality and guest satisfaction even before complex
4
analyses of productivity in the service industry had been developed. This output has also been
identified as a consequence of service quality that explains a considerable portion of customers’
intentions to purchase (Brady, Cronin, and Brand 2002). Central to the notion that quality service
leads to positive guest satisfaction, Mohr and Bitner (2000) reported that the effort of the service
provider has a strong positive influence on satisfaction with the transaction as an output.
Finally, two empirical studies focusing on guest satisfaction as a viable output variable in
productivity analyses offered strong evidence of its significance (Lothgren and Tambour 1999;
Parasuramam, Zeithaml, and Berry 1994). Heskett et al. (1994) highlighted this finding by noting
how one quick-service restaurant chain has found units in the top quadrant in guest-service
ratings outperform the others by all measures. Ojasalo (2003) summarized the point well: “Due
to customers’ increasing influence . . . they cannot be regarded as passive recipients of the
provider’s outputs, but should be seen as an integrated part” (p. 14).
Related to guest satisfaction is retention equity. Rust, Zeithaml, and Lemon (2000) define
retention equity as the strength of the relationship between the customer and the firm. Retention
equity is a potentially valuable output variable, as these authors note, since high retention equity
indicates “the customer’s tendency to stick with the brand, above and beyond objective and
subjective assessments of the brand” (p. 95). Furthermore, retention equity is linked to emotional
ties that the customer has with the brand. Typically measured through purchasing frequency,
retention equity indicates customers’ perception of extraordinary benefits and relational linkages
that make them very reluctant to switch to another dining option (Blattberg, Getz, and Thomas
2001).
As for inputs, financial measures that have proved important to productivity analysis
include labor cost (Burritt 1967; Yoo, Donthu, and Pilling 1997), cost of goods sold (Brown and
5
Hoover 1990; Burritt 1967), controllable fixed expenses (Sarkis 2000), and uncontrollable
expenses (Reynolds and Thompson 2002). Physical inputs that have proved important include
service capacity, such as square footage or number of seats (Doutt 1984), and environmental
characteristics, such as proximity to shopping centers and competitive conditions (Goldman
1992; Ortiz-Buonafina 1992).
Employee satisfaction intrigues us in having been posited as critical while going largely
untested in productivity-analysis studies. Koys’s (2003) comprehensive study provided evidence
of the strong relationship between employee satisfaction and restaurant performance. Similarly,
Rucci, Kim, and Quinn (1998) offered both theoretical and case-study evidence of the effect of
employee satisfaction on sales and profit. Spinelli and Cavanos (2000) identified a significant
correlation between employee and customer satisfaction in a hospitality company. As
substantiation for including this variable in productivity analyses, Kennedy, Lassk, and Goolsby
(2002) presented evidence of an indisputable relationship between employee satisfaction and
organizational goals such as sales and profit.
Data-Envelopment Analysis
Given the large number of aforementioned output and input variables, the challenge is to
integrate and analyze them simultaneously so as to identify meaningful differences among
operating units. As Caplow notes (1983), “An organization is efficient if, among similar
organizations, its output is relatively high in relation to its input” (pp. 80-81). A widely accepted
approach is Data-Envelopment Analysis (DEA), a non-parametric method that considers both
controllable and uncontrollable variables and produces a single relative-to-best productivity
index corresponding to each unit under comparison. Such a metric also allows operators, as
6

recommended decades ago by Farrell (1957), to use the best performing units as the bases for
evaluation.
As fully described by Charnes, Cooper, Lewin, and Seiford (2001), DEA extends the
productivity ratio analysis by integrating the weighted sum of outputs to the weighted sum of
inputs. In applying DEA, the weights are estimated separately for each restaurant to maximize
efficiency. Moreover, the weights estimated for restaurant i are such that when they are applied
to corresponding outputs and inputs from other units in the analysis, the ratio of weighted outputs
to weighted inputs is less than or equal to 1 (interpreted as a percentage). On a more general
basis, assuming that the number of outputs and inputs is infinite, the maximum efficiency of
restaurant o as compared with n other restaurants is calculated as follows:
Maximum Po = subject to 1 for all j = 1,…n
Ur, Vi > 0; r = 1,…, s; i = 1,…m
where
Yrj is the rth output for the jth restaurant
Xij is the ith input for the jth restaurant
Ur and Vi are the variable weights estimated and used to determine the relative efficiency of o
s is the number of outputs
m is the number of inputs
As Avkiran (2002) noted, DEA benchmarks units by comparing their ratios of multiple
inputs to produce corresponding outputs and plotting them on a multidimensional frontier. Such
7

a frontier allows for units that are most similar to be assessed by comparison with the top
performers in their peer groups. Wöber (2002) explained that benchmarking is useful particularly
when indicators span operations that are dissimilar but compete for similar target-market
constituents. Using DEA-generated productivity indices facilitates such comparison.
Furthermore, the method’s ability to take into account such a wide variety of output and input
variables makes it ideal for hospitality applications (Reynolds 2003).
METHODOLOGY
The sample consisted of all 36 same-brand corporate units of a casual-theme restaurant
chain with stores located in major metropolitan centers across the United States. The company
was selected in part for the geographic diversity of its locations; the company also allowed us
access to all financial information required for this study. These financial data were gathered
from month-ending financial statements. Physical characteristics (e.g., number of seats, square
footage) were also provided by the privately held corporation. The chain has positioned each unit
in densely populated metropolitan settings using a uniform location-selection strategy; thus,
environmental characteristics are similar across units.
Guest satisfaction data were obtained through a random sample of guests visiting each
store during the period corresponding to the aforementioned financial information. The voluntary
survey, which was distributed randomly to guests (one per table) and did not include any
incentive except for the opportunity to provide feedback, included questions corresponding to the
firm’s primary objectives: food quality, service quality, ambiance, value, and overall dining
experience (α. = .91). We also asked questions regarding patronage frequency as a measure of
retention equity, as discussed by Blattberg et al. (2001). On average, 32 surveys were completed
8

per store with an average response rate of 72%. (One unit within the chain failed to complete this
aspect of the study and was therefore dropped from the analyses.)
Employee satisfaction was assessed though a confidential, anonymous survey. The
survey included questions corresponding to the job-descriptive index (see Kinicki, et al. 2002)
and featured a summated five-point Likert scale (α. = .93). Owing to differing staffing levels, all
front-of-the house employees (n = 37.8 per unit) were surveyed with a 100% response rate
(average surveys per unit = 33.7).
In addition to traditional financial indicators such as revenue and cost of goods, we
included rent and taxes and insurance as a method for adjusting for regional economies.
Similarly, constraining variables such as number of seats and square footage were considered
since larger restaurants should be expected to produce larger sales, which are proportional to
greater expenses. Table 1 presents the complete list of factors for which we obtained data.
Table 1: Inputs and Outputs Considered
Variable Input/Output Measured As Controllable/Uncontrollable
Revenue Output $ for the period N/AControllable Income (profit)
Output $ for the period N/A
Guest Satisfaction Output Summated scale N/A
Retention Equity Output Average purchase
frequency N/A
Cost of goods sold Input $ for the period Controllable
Labor cost Input $ for the period Controllable
Employee satisfaction Input Summated scale Controllable
9

Rent Input $ for the period Uncontrollable
Taxes and Insurance Input $ for the period Uncontrollable
Square Footage Input Ft2 Uncontrollable
Number of Seats Input Number Uncontrollable
Prior to applying DEA, we ensured that each input was related to at least one output, that
the inputs are independent, and that the outputs are independent. This analysis indicated a very
strong relationship between total income and controllable income. While most firms pursue
maximization of both sales and profit (e.g., Ingenito and Trehan 1996), the ultimate goal of this
(and other) firms is improving the bottom line. Moreover, since the controllable input variables
provide adequate scaling indices for subsequent steps in the analyses, we removed total sales as
an output variable prior to proceeding.
Our next step, then, was to perform stepwise multiple regressions, using the output
variables as dependent variables and the input variables as independent variables. As
demonstrated in Table 2, while guest satisfaction did not appear to play a significant role,
retention equity did contribute to the model. Similarly, rent and square footage proved
unimportant for the subsequent DEA application.
As a confirmatory step, the data were then fit with a semiparametric regression model. As
a variation to the more traditional linear model, this approach allows us to evaluate the empirical
evidence with a broader application of the causal linkages previously suggested. Unlike classic
regression methods, semiparametric methods automatically fit linear and nonlinear functional
relationships (Ruppert, Wand, & Carroll, 2003). Thus, semiparametric regression models allow
10

for better estimation since they can be formulated to include fewer unjustified assumptions than
traditional regression models. These models supported the relationships identified in Table 2.
Furthermore, there were no substantial violations of the regression assumptions
underlying this analysis. Additionally, no individual units were found to be overly influential in
the analysis. We performed a Bootstrap model validation, with 5000 trials, to check the
robustness of the model fit (Harrell 2001). The bias-corrected estimate of the coefficient of
determination and the estimated global shrinkage parameters for the intercept and slope are -
suggest a robust model fit with little evidence of being overfit.
Table 2: Relationships between Inputs and Outputs
Variables Controllable Income
Guest Satisfaction
Retention Equity
Cost of Goods Sold 1.36*** N/A .019**
Labor Cost 1.71*** N/A N/AEmployee Satisfaction N/A N/A 3.455**
Rent N/A N/A N/ATaxes and Insurance 9.08** N/A N/A
Square Footage N/A N/A N/ANumber of Seats 1,134.84*** N/A N/A
*p<0.05, **p<0.01, ***p<0.001
As model specification, we employed an output-oriented model drawing from the
assumptions discussed earlier. Radial efficiency measures were taken using the CCR model to
provide an aggregate measure of technical efficiency, which lead to the unit-efficiency scores
described in the following section. Borger, Ferrier, and Kerstens (1998) demonstrated this logical
11
approach, which is particularly appropriate here as the inputs are not subject to radial reductions.
Furthermore, the constant returns to scale is suitable since the observed variability of outputs and
inputs is homothetic. As a test for nonradial slack, we also applied the BCC model, which
offered sufficient evidence for the associated rationale.
RESULTS
Average sales for this chain for the given 31-day period were $627,779 (SD = $120,630)
while controllable income averaged $181,149 (SD = $55,303). Average cost of goods, at 31.8%,
was $199,601 (SD = $38,751) and average total labor cost, at 27.5%, was $172,375 (SD =
$22,096). Taxes and insurance per unit averaged $15,267 (SD = $2,722). The chain averages 206
seats per store (SD = 27.5) occupying an average of 7,517 square feet (SD = 732).
According to guests’ self-reports, they typically patronize a given unit 5.7 times per
month. In terms of employees, the average front-of-house worker is 26.7 years of age and has
worked for the company some 2.8 years. Women represent a slight majority of the staff (59.4%);
a large number of the employees are single (82.9%).
Building on the regression results from Table 2, the final set of variables included five
input and two output variables (see Table 3). These were used to complete the data envelopment
analysis, which indicated that eight of the units were efficient (showing scores of 100%), with
the average efficiency score at 86%. Figure 1 shows the efficiency scores of the restaurants,
which are rank-ordered based on declining efficiency scores. The lowest-scoring restaurant had
an efficiency score of 0.6184 (or 61.8%).
12
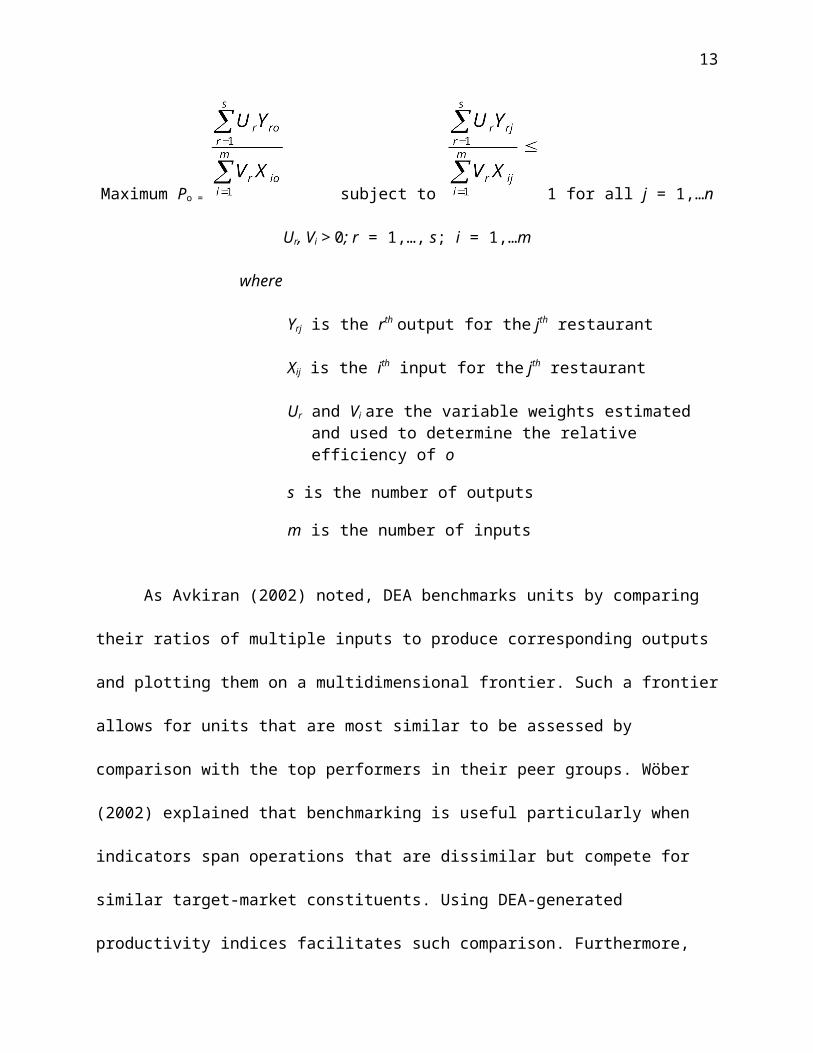
Table 3: Inputs and Outputs Used
Controllable Inputs Uncontrollable Inputs Outputs
Cost of goods sold
Labor cost Employee
satisfaction
Taxes and Insurance
Number of Seats
Controllable Income
Retention Equity
The analysis also indicates that retention equity could be increased, on average, by
34.75% while controllable income could be increased by 13.14% if inputs were used more
efficiently. In the most extreme case, retention equity could be enhanced by 54.02%.
Furthermore, the DEA suggests that the most critical variable contributing to these potential
improvements in almost every underperforming unit is employee satisfaction. In most cases, it
appears that food and labor costs are well managed and offer little room for improvement in
terms of increasing outputs, as dictated by DEA’s weighting schema.
Figure 1: DEA Efficiency Scores of the 35 Restaurants, Rank-ordered in Terms of Declining Score
13
505560657075
80859095100
1 3 5 7 9 11 13 15 17 19 21 23 25 27 29 31 33 35
Ranked Restaurants
Effic
ienc
y Sc
ores
DISCUSSION
The findings regarding traditional productivity inputs, such as cost of goods sold and
labor costs, are not surprising, particularly given the variety of productivity approaches reported
during the past few decades (e.g., Ball, Johnson, and Slattery 1986; Morey and Dittman
1995; .Reynolds 2004). Similarly, the inclusion of constraining uncontrollable variables, such as
number of seats, offers little revelation. The importance of employee satisfaction, however,
represents an important contribution to the area of productivity analysis.
While many have explained the likely importance of the linkage between employee
satisfaction and the bottom line, most researchers have focused on such relationships more from
the service-profit-chain perspective than from an operations-management, efficiency perspective
(e.g., Allen and Wilburn 2002). The findings reported here suggest that the role this variable
plays may have more pervasive impact organizationally with direct implications to efficiency—
and profit.
The related consideration of retention equity is also interesting. First, we must consider
the interplay between employee satisfaction and guest loyalty, operationalized here as retention
equity. Since front-line employees are often most involved with the employee-customer
interface, these individuals ultimately will determine the external customers’ impressions of the
organization (Hartline et al. 2000; Kelley 1992). Thus, we see how such a relationship offers
utility in a holistic productivity analysis. As Banker et al (2000) noted, “Customer satisfaction is
considered a key short-term measure that is a lead indicator of long-term performance,” (p. 72)
leading ultimately to retention equity. Thus, to ignore such variables in exploring true unit-level
efficiency is naïve, particularly given the implications of this study.
14

While provocative, this study is limited in having targeted a relatively small chain.
Furthermore, the number of guest satisfaction surveys per store, while providing reasonable
variability, was limited. Finally, other variables, such as competition—which was demonstrated
to be unimportant in earlier studies (e.g., Reynolds 2004)—was not included in this study
because of the uniformity of the site-selection process used by the firm. Nonetheless, it is
possible that such an input may contribute to the accuracy of the efficiency analysis.
Despite these limitations, this study provides empirical support for the efficacy of
integrating non-financial data into the productivity analysis. It also opens the door for further
research in this field. While we recognize that data such as employee-satisfaction and retention-
equity indices may not always be easy to obtain, we assert that these and other variables must be
integrated to complete a truly holistic—and accurate—productivity assessment.
15

REFERENCES
Allen, D. R., Wilburn, M., 2002. Linking customer and employee satisfaction to the bottom line. Milwaukee, WI: American Society for Quality.
Avkiran, N. K., 2002. Productivity analysis in the service sector. Camira, Queensland: University of Queensland.
Ball, S. D., Johnson, K., Slattery, P., 1986. Labor productivity in hotels: An empirical study. International Journal of Hospitality Management 13(3) 141-147.
Banker, R. D., Potter, G., Srinivasan, D., 2000. An empirical investigation of an incentive plan that includes nonfinancial performance measures, The Accounting Review, 75, 65-92.
Blattberg, R. C., Getz, G., Thomas, J. S., 2001. Customer equity: Building and managing relationships as valuable assets. Cambridge, MA: Harvard Business School Publishing Corporation.
Brady, M. K., Cronin, J. J., Brand, R. R., 2002. Performance-only measurement of service quality: A replication and extension. Journal of Business Research, 55(January) 17-31.
Borger, B.D., Ferrier, G.D. Kerstens, K., 1998. The Choice of a Technical Efficiency Measure on the Free Disposal Hull Reference Technology: A Comparison Using US Banking Data. European Journal of Operational Research, 105, 427-446.
Brown, J. R., Dev, C. S., 1999. Looking beyond RevPAR: Productivity consequences of hotel strategies. Cornell Hotel and Restaurant Administration Quarterly, 40(2) 23-33.
Brown, D. M., Hoover, L. W., 1990. Productivity measurement in foodservice: Past accomplishments—a future alternative. Journal of the American Dietetic Association, 90, 973-981.
Bucklin, L. P., 1978. Productivity in marketing. Chicago: American Marketing Association.
Burritt, M. B., 1967. Projected labor costs in future food systems. Cornell Hotel and Restaurant Administration Quarterly, 8, 55-63.
Caplow, T., 1983. Managing an organization (2nd ed.),Chicago: Holt, Rinehart and Winston, Inc.
Charnes, A. C., Cooper, W. W., Lewin, A. Y., Seiford, L. M. (Eds.). 2001. Data envelopment analysis: Theory, methodology, and application. Norwell, MA: Kluwer Academic Publishers.
Doutt, J. T. 1984. Comparative productivity performance in fast-food retail distribution. Journal of Retailing, 60, 98-106.
16

Farrell, M., 1957. The measurement of productive efficiency. Journal of the Royal Statistical Society, Series A, General 120, Part 3 253-281.
Goldman, A., 1992. Evaluating the performance of the Japanese distribution system. Journal of Retailing, 68 11-39.
Grifell-Tatjé, E., Lovell, C. A. K., 1999. Profits and productivity. Management Science, 45(9) 1177 – 1193.
Harrell, F. E., Jr., 2001. Regression modeling strategies with applications to linear models, logistic regression and survival analysis. Verlag, New York: Springer.
Hartline, M. D., Maxham III, J. G., McKee, D. O., 2000. Corridors of influence in the dissemination of customer-oriented strategy to customer contact service employees,” Journal of Marketing, 64, 35-50.
Heskett, J. L., Jones, T. O., Loveman, G. W., Sasser, W. E., Schlesinger, L. A., March-April 1994. Putting the service-profit chain to work. Harvard Business Review. 164-174.
Hu, B. A., Cai, L. A., 2004. Hotel labor productivity assessment: A data envelopment analysis. Journal of Travel and Tourism Marketing 16(2/3) 27-38.
Ingenito, R., Trehan, B., 1996. Using monthly data to predict quarterly output. Federal Reserve Bank of San Francisco Economic Review, 3, 3-11.
Jones, P., Hall, M., 1996. Productivity and the new service paradigm, or servicity and the neo-service paradigm. In n. Johns (Ed.), Managing productivity in hospitality and tourism (pp. 227-240), London: Cassell.
Kelley, S. W., 1992. Developing customer orientation among service employees. Journal of the Academy of Marketing Science 20 (winter) 27-36.
Kennedy, K. N., Lassk, F. G., Goolsby, J. R., 2002. Customer mind-set of employees throughout the organization. Journal of the Academy of Marketing Science, 30(2) 159-171.
Kinicki, A. J., McKee-Ryan, F. M., Schriesheim, C. A., Carson, K. P., 2002. Assessing the construct validity of the job descriptive index: A review and meta-analysis. Journal of Applied Psychology, 87(1) 14-32.
Kohli, A. K., Jaworski, B. J., 1990. Market orientation: The construct, research propositions and managerial implications,” Journal of Marketing, 54 1-18.
Koys, D. J., 2003. How the achievement of human-resources goals drives restaurant performance. Cornell Hotel and Restaurant Administration Quarterly, 44 17-24.
Lee-Ross, D., 1994. Increasing productivity in small hotels: Are academic proposals realistic? International Journal of Hospitality Management 113(3) 201-207.
17

Lothgren, M., Tambour, M., 1999. Productivity and customer satisfaction in Swedish pharmacies. European Journal of Operational Research 115(3), 449-458.
Mohr, L., Bitner, M. J., 2000. The role of employee effort in satisfaction with service transactions. Journal of Business Research, 32(March) 239-252.
Morey, R. C., Dittman, D. A., 1995. Evaluating a hotel GM’s performance: A case study in benchmarking. Cornell Hotel and Administration Quarterly, 35(5), 30-35.
Ojasalo, K., 2003. Customer influence on service productivity. Advanced Management Journal, 68(3) 14-19.
Ortiz-Buonafina, M., 1992. The evolution of retail institutions: A case study of the Guatemalan retail sector. Journal of Macromarketing 12 16-27.
Parasuraman, A., Zeithaml, V. A., Berry, L. L., 1994. Alternative scales for measuring service quality: A comparative assessment based on psychometric and diagnostic criteria. Journal of Retailing, 70 193-199.
Pilling, B. K., Donthu, N., Henson, S., 1999. Accounting for the impact of territory characteristics on sales performance: Relative efficiency as a measure of salesperson performance. Journal of Personal Selling and Sales Management 19(2), 35-45.
Reynolds, D., 1998. Productivity analysis in the on-site food-service segment. Cornell Hotel and Restaurant Administration Quarterly, 39(3) 22-31.
Reynolds, D., 2003. Hospitality-productivity assessment using data envelopment analysis. Cornell Hotel and Restaurant Administration Quarterly, 44(2) 130-137.
Reynolds, D., 2004. An exploratory investigation of multiunit restaurant productivity assessment using data envelopment analysis. Journal of Travel and Tourism Marketing 16(2/3) 19-26.
Reynolds, D., Thompson, G., 2002. Multiunit restaurant productivity assessment: A test of data-envelopment analysis. The Center for Hospitality Research at Cornell University Report. Ithaca, NY: Cornell University.
Rimmington, M., Clark, G., 1996. Productivity measurement in food service systems. In N. Johns (Ed.), Productivity management in hospitality and tourism, (pp. 194-208), London: Cassell.
Rucci, A., Kim, S. P., Quinn, R. T., January-February 1998. The employee-customer-profit chain at Sears. Harvard Business Review 21-30.
Ruppert, D., Wand, M. P., Carroll, R. J., 2003. Semiparametric regression. Cambridge University Press.
18

Rust, R. T., Zeithaml, V. A., Lemon, K. N., 2000. Driving customer equity: How customer lifetime value is reshaping corporate strategy. New York: The Free Press.
Sarkis, J., 2000. An analysis of the operational efficiency of major airports in the United States. Journal of Operations Management 18(3), 335-351.
Schmenner, R. W., 1986. How can service businesses survive and prosper? Sloan Business Review 28(3) 21-32.
Schmenner, R. W., 2004. Service business and productivity. Decision Sciences, 35(3), 333-348.
Sigala, M., 2004. Using data envelopment analysis for measuring and benchmarking productivity in the hotel sector. Journal of Travel and Tourism Marketing 16(2/3), 39-60.
Spinelli, M., Cavanos, G., 2000. Investigating the relationship between Employee Satisfaction and Guest Satisfaction. Cornell Hotel and Restaurant Administration Quarterly, 41(6) 29-33.
Thore, S., Phillips, F., Ruefle, T. W., Yue, P., 1996. DEA and the management of the product cycle: The U.S. computer industry. Computers and operations Research 23(4), 341-347.
Yoo, B., Donthu, N., Pilling, B. K., 1997. Channel efficiency: Franchise versus non-franchise systems. Journal of Marketing Channels, 4(1), 211-223.
Witt, C. A., and Witt, S. F., 1989. Why productivity in the hotel sector is low. International Journal of Contemporary Hospitality Management 1(2) 28-34.
Wöber, K. W., 2002. Benchmarking in tourism and hospitality industries. London: CABI.
19