INCORPORATING POTABLE REUSE IN BIG …€¦ · incorporating potable reuse in big spring, texas. a...
36
INCORPORATING POTABLE REUSE IN BIG SPRING, TEXAS A CASE STUDY SW AWWA October 14, 2014 Rob Haas
Transcript of INCORPORATING POTABLE REUSE IN BIG …€¦ · incorporating potable reuse in big spring, texas. a...
INCORPORATING POTABLE REUSE IN BIG SPRING, TEXASA CASE STUDY
SW AWWAOctober 14, 2014
Rob Haas

Only about 0.5% of global water is “available” for consumption - all other water is sea-water or ice.
WATER STRESS

• Water “availability” generally looks at that 0.5% of total water and considers:
– Quality
– Quantity
– Accessibility
– Sustainability
– Affordability
• Availability of that 0.5% of water is very limited
WATER STRESS

• Reduce Growth
• Conserve Existing Water Stores
• Develop New Water Sources
• Water Transfer
• Desalination
– Seawater
– Brackish Water
Water Reuse
• Non-Potable Reuse to Offset DW
• Indirect or Direct Potable Reuse (IPR/DPR)
WATER STRESS: WHAT ARE THE OPTIONS?
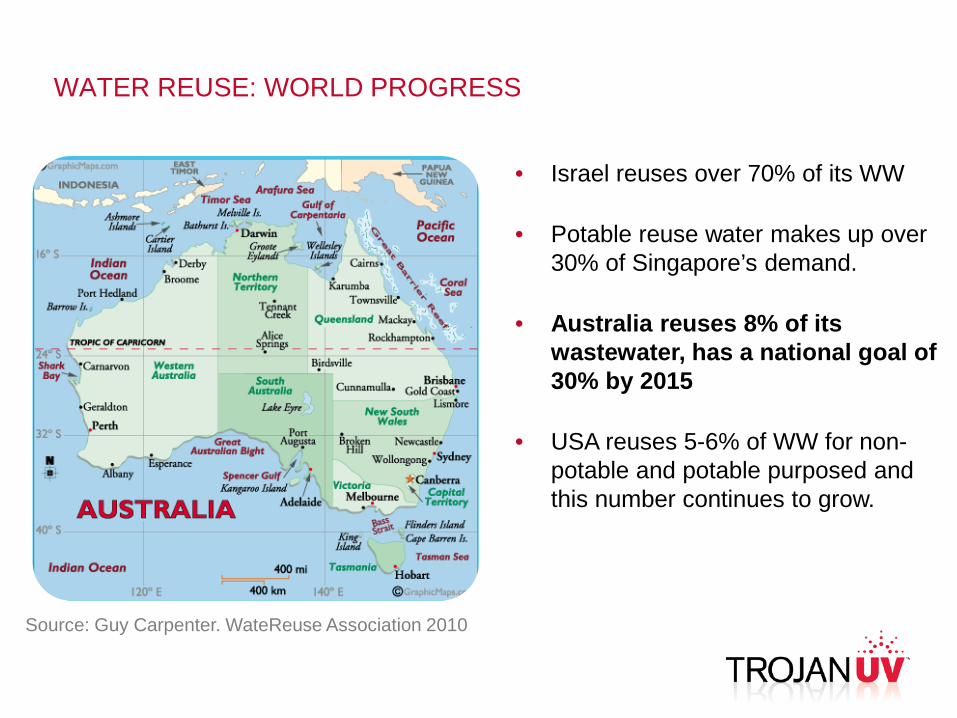
WATER REUSE: WORLD PROGRESS
• Israel reuses over 70% of its WW
• Potable reuse water makes up over 30% of Singapore’s demand.
• Australia reuses 8% of its wastewater, has a national goal of 30% by 2015
• USA reuses 5-6% of WW for non-potable and potable purposed and this number continues to grow.
Source: Guy Carpenter. WateReuse Association 2010

CaliforniaSouthern cities (e.g. Los Angeles and San Diego) receive the bulk of their water from the Colorado river and from the northern part of the state
• Extreme costs associated with transportation
• 20% of energy used in state is used to move water
TexasExtreme drought conditions causing strain on natural drinking water sources
WATER STRESS IN THE UNITED STATES
Source: U.S. Drought Monitor (University of Nebraska, Lincoln), 2012
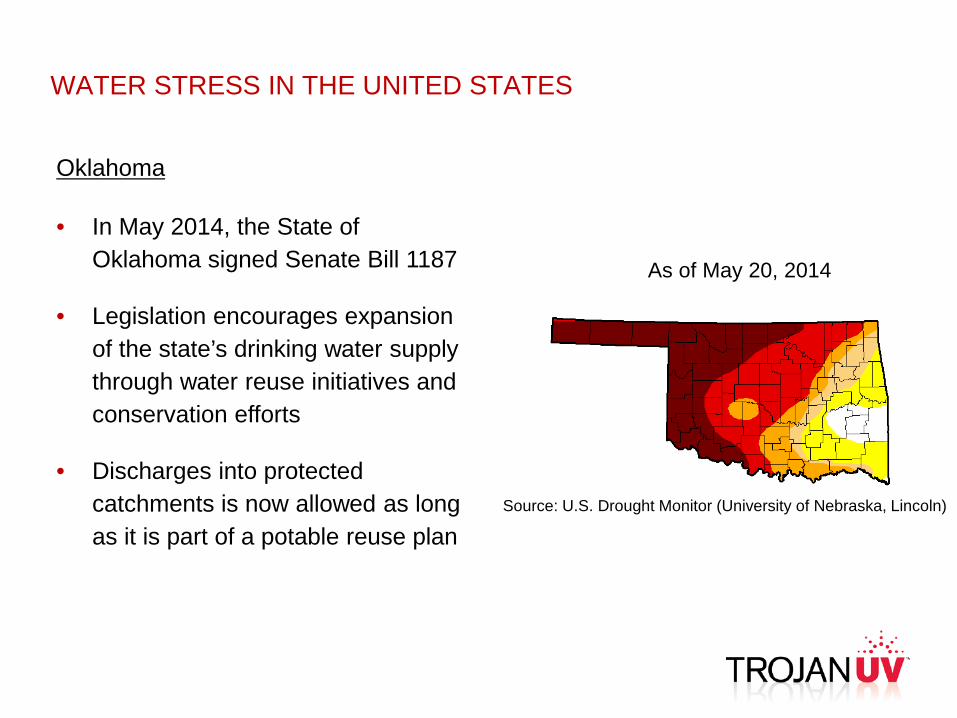
Oklahoma
• In May 2014, the State of Oklahoma signed Senate Bill 1187
• Legislation encourages expansion of the state’s drinking water supply through water reuse initiatives and conservation efforts
• Discharges into protected catchments is now allowed as long as it is part of a potable reuse plan
WATER STRESS IN THE UNITED STATES
Source: U.S. Drought Monitor (University of Nebraska, Lincoln)
As of May 20, 2014

COLORADO RIVER MUNICIPAL WATER DISTRICT
• Provides a privatized drinking water supply to municipalities in West Texas
– Odessa– Snyder– Big Spring
• Population of service area = ~150,000
• Traditional Sources of Raw Water:– E.V. Spence Reservoir = 1.4 % FULL AS OF SEPT 8, 2014– Lake J.B. Thomas= 0.9 % FULL AS OF SEPT 8, 2014
– O.H. Ivie Reservoir= 16.9 % FULL AS OF SEPT 8, 2014

COLORADO RIVER MUNICIPAL WATER DISTRICT

COLORADO RIVER MUNICIPAL WATER DISTRICT
• In 2004, the traditional reservoirs used to supply drinking water were at only 10% of their capacity
‒ Today two of the three sources of raw water are UNDER 2% capacity
• In response to this as well as state mandated legislation to develop a long-term regional plan for drinking water supply, the CRMWD evaluated possible approaches to conserving or augmenting declining drinking water supplies.

COLORADO RIVER MUNICIPAL WATER DISTRICT
Evaluated options in the study included:
1. Use of other water catchments
2. Non-potable reuse of reclaimed wastewater‒ Irrigation, Recreation, Agriculture
3. Potable reuse of reclaimed wastewater‒ Drinking water‒ Re-supply local reservoirs with
high-purity treated wastewater
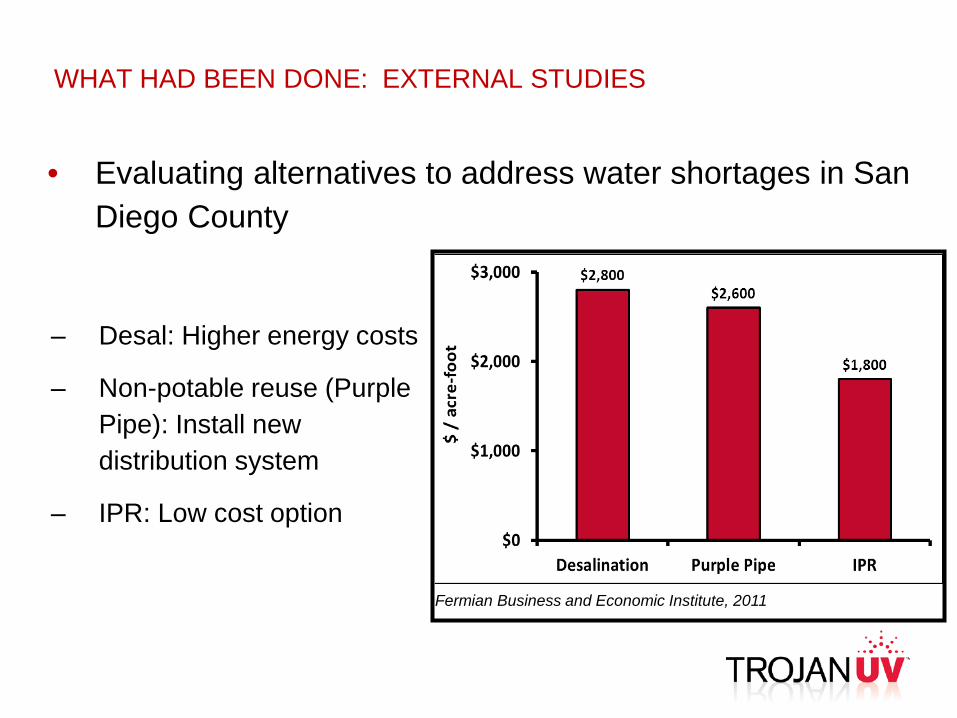
– Desal: Higher energy costs
– Non-potable reuse (Purple Pipe): Install new distribution system
– IPR: Low cost option
WHAT HAD BEEN DONE: EXTERNAL STUDIES
Fermian Business and Economic Institute, 2011
• Evaluating alternatives to address water shortages in San Diego County
00.5
11.5
22.5
33.5
44.5
Desalination IPR LocalSurfaceWater
WaterTransfer
kWh/
m3
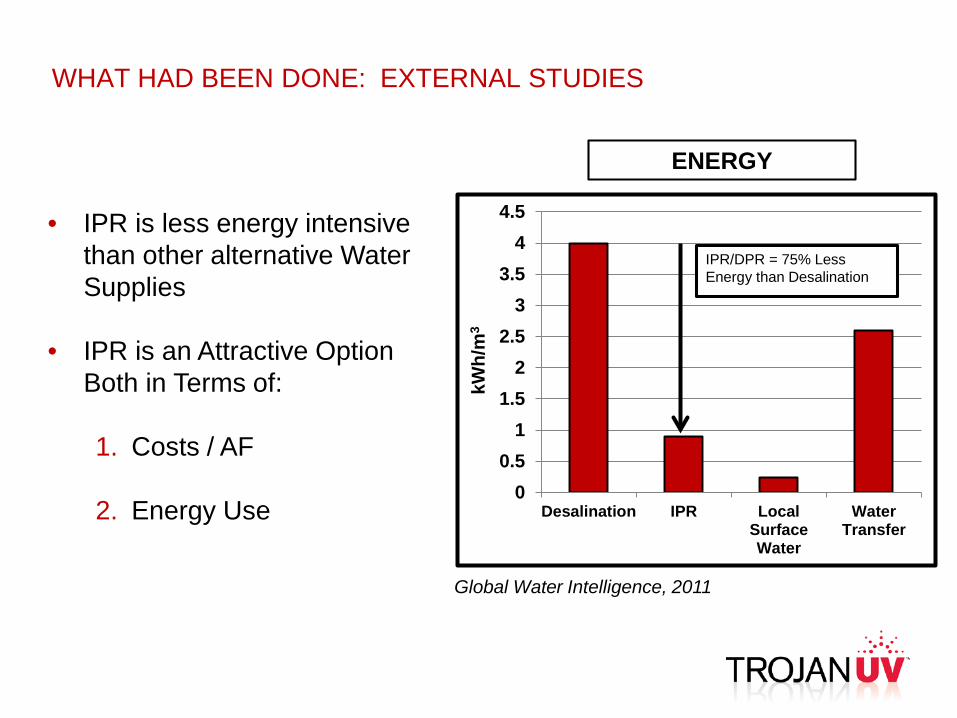
IPR/DPR = 75% Less Energy than Desalination
• IPR is less energy intensive than other alternative Water Supplies
• IPR is an Attractive Option Both in Terms of:
1. Costs / AF
2. Energy Use
ENERGY
Global Water Intelligence, 2011
WHAT HAD BEEN DONE: EXTERNAL STUDIES

1) COMPARING OTHER WATER SOURCES
• Local groundwater aquifers were evaluated to show little recharge capability and withdrawal was not sustainable
• Other surface water sources too far away and at much lower elevations than end-users in the CRMWD– This would result in economically unfavorable pumping costs
• As a result, obtaining raw drinking water from alternative sources was not an option

2) COMPARING POTABLE AND NON-POTABLE REUSE
• Non-potable Reuse– Agriculture and recreational demand for
reused wastewater is seasonal– Increasing aridity in the region could
reduce agriculture and future demand
• Potable Reuse– Consistent demand throughout the year
Reason #1 – Year-Round Demand

2) COMPARING POTABLE AND NON-POTABLE REUSE
• Non-potable Reuse– Offset withdrawals from reservoir not
consistent (especially during the winter)
– Drinking water would still need to be collected from existing raw water catchments (<2% capacity in areas)
– A sustainable supply of drinking water would not be obtained
• Potable Reuse– Allows year-round supplementation of
raw water and therefore year-round augmentation
Reason #2 – Drinking Water Supply Sustainability

2) COMPARING POTABLE AND NON-POTABLE REUSE
Reason #3 – Distribution
• Non-potable Reuse– Requires an exclusive distribution
system– CRMWD customers are spread out
over a wide area– Additional pumping costs
• Potable Reuse– Drinking water distribution system
already in place.

2) COMPARING POTABLE AND NON-POTABLE REUSE
Reason #4 – Wastewater Treatment Upgrades
• Non-potable Reuse– Local wastewater treatment plants
would require upgrades– High levels of dissolved solids in
wastewater• Reverse Osmosis required
• Potable Reuse– One centralized treatment facility, no
WWTP upgrades

SELECTING POTABLE vs. NON-POTABLE REUSE
• Similar feasibility studies carried out in other areas
• Cost ranges for various approaches to drinking water augmentation
$0
$1,000
$2,000
$3,000
$4,000
Desalination Non-Potable Reuse Potable Reuse
$/Ac
re-F
oot
Source: Fermanian Business & Economic Institute, 2010
SELECTING POTABLE vs. NON-POTABLE REUSE
• CRMWD decided to build a single treatment plant that would treat secondary wastewater from surrounding communities to an “advanced” level
• Known as the “Raw Water Production Facility” (RWPF)
• The RWPF will generate “synthesized” raw water that will be BLENDED with “natural” surface raw water of the E.V. Spence Reservoir upstream of the local drinking water treatment facilities
• Raw water will be re-treated as drinking water at existing drinking water treatment plants
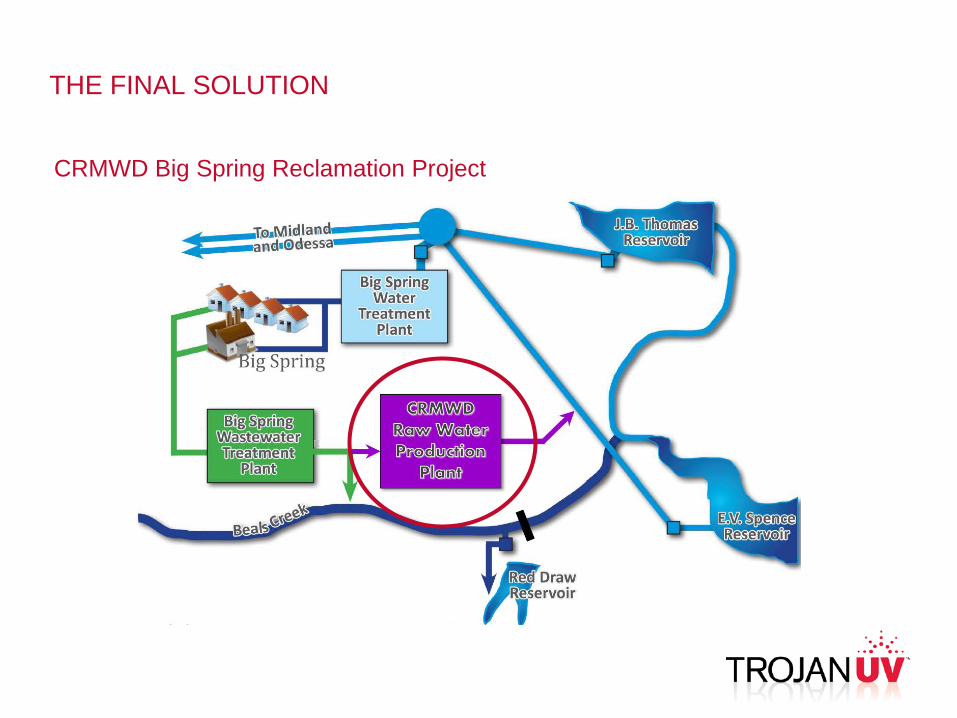
THE FINAL SOLUTION
CRMWD Big Spring Reclamation Project

RWPF PLANT DESIGN DETAILS AND CALIFORNIA PRECEDENT
• Advanced Treatment uses microfiltration, reverse osmosis and UV-oxidation similar to existing facilities in California; designed per CA regulations for Full Advanced Treatment
• CA and Orange County GWRS precedent aids in Public Acceptance
• UV-oxidation system sized based on treatment of NDMA and 1,4-Dioxane as surrogates
• UV-oxidation serves a number of unique purposes
– Treatment of NDMA and 1,4-Dioxane
– Treatment of pharmaceuticals and endocrine-disrupting chemicals not removed by MF or RO
– Additional disinfection barrier of 4-log virus credit
Raw Water Production Facility Design Parameters
Design Flow: 1.8 MGD
Target Contaminants: NDMA 1,4-Dioxane
Design NDMA Reduction: 1.2 - Log
Design 1,4-Dioxane: 0.5 - Log
Oxidant: H2O2
Disinfection Method: UV Light
PROTECTING PUBLIC HEALTH – TREATMENT AT RWPF
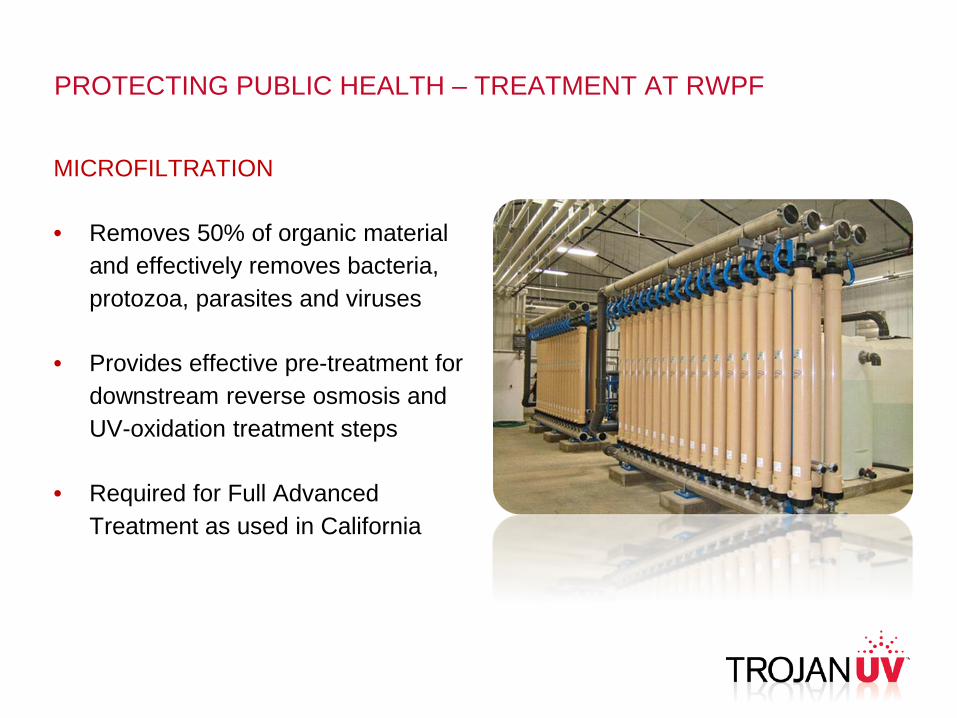
MICROFILTRATION
• Removes 50% of organic material and effectively removes bacteria, protozoa, parasites and viruses
• Provides effective pre-treatment for downstream reverse osmosis and UV-oxidation treatment steps
• Required for Full Advanced Treatment as used in California

REVERSE OSMOSIS
• Removes molecules as small as 100 atomic mass units and 95% of organic contaminants
• Removes salts, generating a reject stream (“brine”)
• As used implemented in California
PROTECTING PUBLIC HEALTH – TREATMENT AT RWPF

UV-OXIDATION
• Removes molecular contaminants that pass through MF and RO
• Removes compounds destroyed by UV-photolysis (e.g. NDMA and other nitrosamines)
• Removes compounds destroyed by UV-Oxidation (e.g. pharmaceuticals, hormones, industrial solvents, etc.)
PROTECTING PUBLIC HEALTH – TREATMENT AT RWPF

UV-OXIDATION
• Provides a final Disinfection Barrier (including Cryptosporidium, Giardia, Virus)
• An extra measure of protection that builds public confidence in the water quality
PROTECTING PUBLIC HEALTH – TREATMENT AT RWPF

THE SCIENCE OF UV-OXIDATION
UV-Oxidation: Using UV and hydrogen peroxide to destroy trace organic contaminants through:
UV-PhotolysisUV light alone breaks down the contaminant molecules
UV-OxidationUV light plus hydrogen peroxide (H2O2)
Hydrogen peroxide absorbs UV and produces hydroxyl radicals that oxidize contaminants
28

UV-PHOTOLYSIS
Chemical bonds arebroken by UV light
29
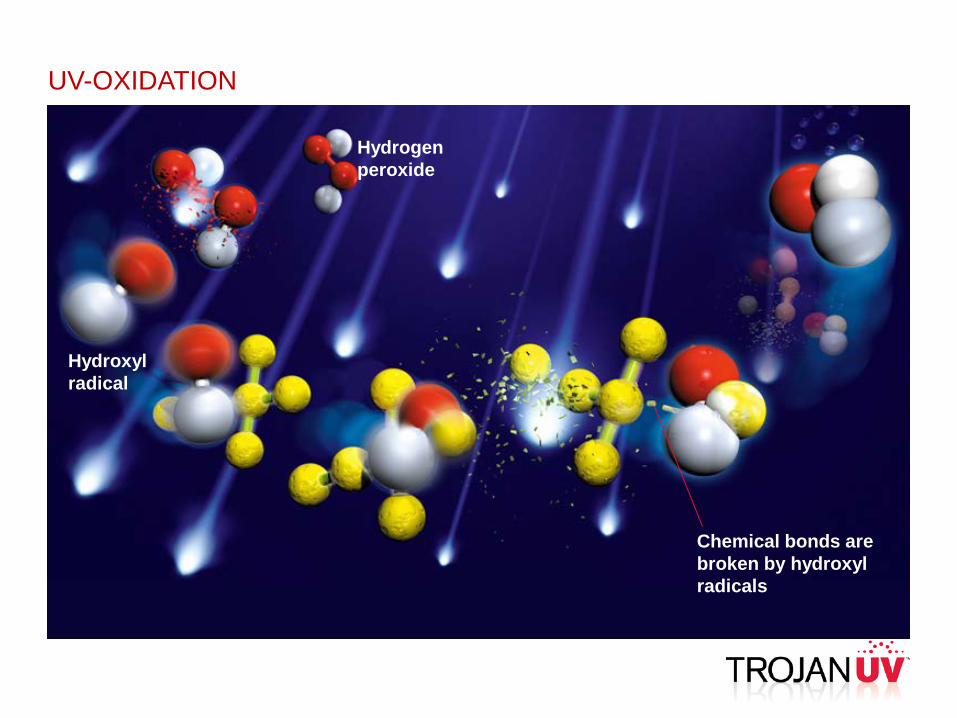
UV-OXIDATION
Hydrogen peroxide
Hydroxylradical
Chemical bonds arebroken by hydroxyl radicals
PROTECTING PUBLIC HEALTH – CONTAMINANTS
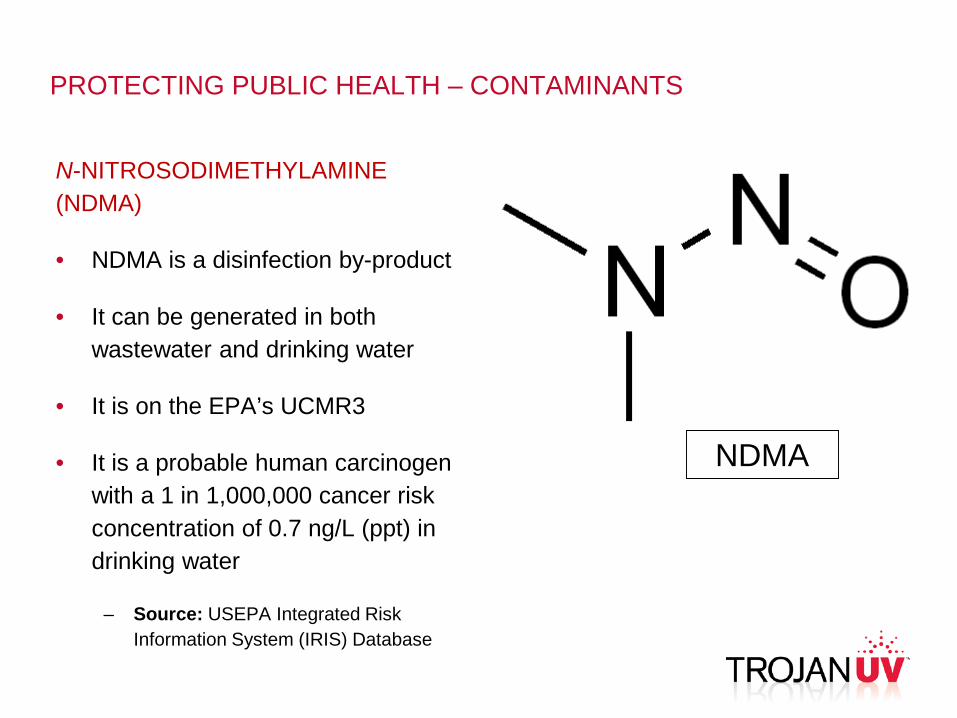
N-NITROSODIMETHYLAMINE (NDMA)
• NDMA is a disinfection by-product
• It can be generated in both wastewater and drinking water
• It is on the EPA’s UCMR3
• It is a probable human carcinogen with a 1 in 1,000,000 cancer risk concentration of 0.7 ng/L (ppt) in drinking water
– Source: USEPA Integrated Risk Information System (IRIS) Database
NDMA

NDMA REMOVAL - FULL SCALE - ORANGE COUNTY, CA
0
10
20
30
40
50
60
70
80
1 2 3 4 5 6 7Run #
[ND
MA
], pp
t
[NDMA], Inf[NDMA], Eff
6 Reactors On
Flow: >8.5 MGD
4 Reactors On

0
20
40
60
80
100
120
140
Influent NDMA Effluent NDMA
ND
MA
Con
cent
ratio
n (n
g/L)
NDMA REMOVAL - FULL SCALE – WEST BASIN, CA

POTABLE REUSE SYSTEMS GLOBALLY
Name of Project Location Start-UpDate
Orange County Water District Factory 21 Fountain Valley, CA 1975
Orange County Water District GroundwaterReplenishment System Fountain Valley, CA 2004
Leo J. Vander Lans Advanced Treatment Facility Long Beach, CA 2003
West Basin Water Recycling Facility Los Angeles, CA 2006
Bundamba Advanced Water Purification Facility Brisbane, AUS 2007
Luggage Point Advanced Water Purification Facility Brisbane, AUS 2008
Gibson Island Advanced Water Purification Facility Brisbane, AUS 2008
Joint Water Purification Project Cottonwood, CO 2010
San Diego Water Purification Demonstration Project San Diego, CA 2011
Big Spring Water Reclamation Facility Big Spring, TX 2012
Oxnard Advanced Water Purification Facility Oxnard, CA 2012

CONCLUSIONS
• RWPF construction is completed and site became active in April 2013
• Potable reuse was heavily favored over non-potable reuse– Year-round drinking water supply– Sustainable supply– Various economic and cost advantages over alternatives
• Advanced treatment of wastewater included MF-RO-UV-oxidation treatment train– Multi-barrier strategy– UV-Oxidation treats contaminants of concern not removed by RO (E.g..
NDMA)– Design based on extensive precedents in California, elsewhere

Acknowledgements
Trojan Technologies- Adam Festger- Scott Bindner
Freese and Nichols, Inc.- David Sloan