Incorporating mortality into habitat selection to identify ... · Incorporating mortality into...
9
Incorporating mortality into habitat selection to identify secure and risky habitats for savannah elephants C.L. Roever a,⇑ , R.J. van Aarde a,⇑ , M.J. Chase a,b,c a Conservation Ecology Research Unit, Department of Zoology and Entomology, University of Pretoria, Hatfield 0083, South Africa b Elephants Without Borders, PO Box 682, Kasane, Botswana c San Diego Zoo Institute for Conservation Research, San Diego Zoo Global, 15600 San Pasqual Valley Road, Escondido, CA 92027, United States article info Article history: Received 8 November 2012 Received in revised form 30 January 2013 Accepted 8 April 2013 Keywords: African savannah elephant Anthropogenic features Habitat quality Habitat selection Mortality Source and sink abstract Empirical models of habitat selection are increasingly used to guide and inform habitat-based manage- ment plans for wildlife species. However, habitat selection does not necessarily equate to habitat quality particularly if selection is maladaptive, so incorporating measures of fitness into estimations of occur- rence is necessary to increase model robustness. Here, we incorporated spatially explicit mortality events with the habitat selection of elephants to predict secure and risky habitats in northern Botswana. Follow- ing a two-step approach, we first predict the relative probability of use and the relative probability of mortality based on landscape features using logistic regression models. Combining these two indices, we then identified low mortality and high use (primary habitat) and areas of high mortality and high use (primary risk). We found that mortalities of adult elephants were closely associated with anthropo- genic features, with 80% of mortalities occurring within 25 km of people. Conversely, elephant habitat selection was highest at distances of 30–50 km from people. Primary habitat for elephants occurred in the central portion of the study area and within the Okavango Delta; whereas risky areas occurred along the periphery near humans. The protected designation of an area had less influence on the proportion of prime habitat therein than did the locations of the area in relation to human development. Elephant man- agement in southern Africa is moving towards a more self-sustaining, habitat-based approach, and infor- mation on selection and mortality could serve as a baseline to help identify demographic sources and sinks to stabilize elephant demography. Ó 2013 Elsevier Ltd. All rights reserved. 1. Introduction Using telemetry data to predict habitat utilization is a common practice in ecology, and the results are often used as a guide to pro- tect and preserve habitats important to wildlife species (e.g. John- son et al., 2004; Meyer et al., 1998). However, habitat utilization is only one aspect within a complex set of factors that ultimately re- late to individual fitness. Selection, for example, could be maladap- tive, whereby individuals select areas that ultimately increase their mortality risk or decrease their reproductive success (Battin, 2004; Delibes et al., 2001). To avoid the misclassification of highly used habitats as high-quality habitats, it is necessary to temper estima- tions of habitat selection with some indication of fitness or risk, particularly when habitat selection appraisals are to be used as an impetus for conservation action. vThe main limitation of incorporating indices of fitness into animal occurrence models is that spatially-explicit fitness data is often difficult to obtain (Nielsen et al., 2006). Studies that incorporate offspring survival are most common for avian species, where fledging success at the nest site can readily be established (Aldridge and Boyce, 2007; Donovan and Thompson, 2001). How- ever, with mammalian species the estimation of recruitment and survival are generally less straightforward. Changes in the demo- graphic parameters of large mammals in particular occur over relatively long timescales because of their multi-year or multi- decade life spans and their low reproductive and mortality rates. Most large mammals are also highly mobile with large ranging patterns, making it difficult to relocate individuals to monitor sur- vival and fecundity. Studies linking reproductive success to habi- tats have been most successful in ungulates on islands and other closed systems (McLoughlin et al., 2007, 2008). Given limitations in time, resources, study species, and study area, researchers re- sort to data that are more readily available, such as mortality location data (Dzialak et al., 2011; Falcucci et al., 2009; Nielsen et al., 2006). Just as live animals inform habitat selection estimations, carcass locations provide spatially explicit information on where animals die and can be used to inform the riskiness of habitats (Nielsen et al., 2006). However, mortality location data is often underuti- lized in the literature. African elephants, for example, have 0006-3207/$ - see front matter Ó 2013 Elsevier Ltd. All rights reserved. http://dx.doi.org/10.1016/j.biocon.2013.04.006 ⇑ Corresponding author. Tel.: +27 12 420 2753; fax: +27 12 420 4523. E-mail addresses: [email protected] (C.L. Roever), [email protected]. za (R.J. van Aarde). Biological Conservation 164 (2013) 98–106 Contents lists available at SciVerse ScienceDirect Biological Conservation journal homepage: www.elsevier.com/locate/biocon
Transcript of Incorporating mortality into habitat selection to identify ... · Incorporating mortality into...
Biological Conservation 164 (2013) 98–106
Contents lists available at SciVerse ScienceDirect
Biological Conservation
journal homepage: www.elsevier .com/locate /b iocon
Incorporating mortality into habitat selection to identify secureand risky habitats for savannah elephants
0006-3207/$ - see front matter � 2013 Elsevier Ltd. All rights reserved.http://dx.doi.org/10.1016/j.biocon.2013.04.006
⇑ Corresponding author. Tel.: +27 12 420 2753; fax: +27 12 420 4523.E-mail addresses: [email protected] (C.L. Roever), [email protected].
za (R.J. van Aarde).
C.L. Roever a,⇑, R.J. van Aarde a,⇑, M.J. Chase a,b,c
a Conservation Ecology Research Unit, Department of Zoology and Entomology, University of Pretoria, Hatfield 0083, South Africab Elephants Without Borders, PO Box 682, Kasane, Botswanac San Diego Zoo Institute for Conservation Research, San Diego Zoo Global, 15600 San Pasqual Valley Road, Escondido, CA 92027, United States
a r t i c l e i n f o
Article history:Received 8 November 2012Received in revised form 30 January 2013Accepted 8 April 2013
Keywords:African savannah elephantAnthropogenic featuresHabitat qualityHabitat selectionMortalitySource and sink
a b s t r a c t
Empirical models of habitat selection are increasingly used to guide and inform habitat-based manage-ment plans for wildlife species. However, habitat selection does not necessarily equate to habitat qualityparticularly if selection is maladaptive, so incorporating measures of fitness into estimations of occur-rence is necessary to increase model robustness. Here, we incorporated spatially explicit mortality eventswith the habitat selection of elephants to predict secure and risky habitats in northern Botswana. Follow-ing a two-step approach, we first predict the relative probability of use and the relative probability ofmortality based on landscape features using logistic regression models. Combining these two indices,we then identified low mortality and high use (primary habitat) and areas of high mortality and highuse (primary risk). We found that mortalities of adult elephants were closely associated with anthropo-genic features, with 80% of mortalities occurring within 25 km of people. Conversely, elephant habitatselection was highest at distances of 30–50 km from people. Primary habitat for elephants occurred inthe central portion of the study area and within the Okavango Delta; whereas risky areas occurred alongthe periphery near humans. The protected designation of an area had less influence on the proportion ofprime habitat therein than did the locations of the area in relation to human development. Elephant man-agement in southern Africa is moving towards a more self-sustaining, habitat-based approach, and infor-mation on selection and mortality could serve as a baseline to help identify demographic sources andsinks to stabilize elephant demography.
� 2013 Elsevier Ltd. All rights reserved.
1. Introduction incorporate offspring survival are most common for avian species,
Using telemetry data to predict habitat utilization is a commonpractice in ecology, and the results are often used as a guide to pro-tect and preserve habitats important to wildlife species (e.g. John-son et al., 2004; Meyer et al., 1998). However, habitat utilization isonly one aspect within a complex set of factors that ultimately re-late to individual fitness. Selection, for example, could be maladap-tive, whereby individuals select areas that ultimately increase theirmortality risk or decrease their reproductive success (Battin, 2004;Delibes et al., 2001). To avoid the misclassification of highly usedhabitats as high-quality habitats, it is necessary to temper estima-tions of habitat selection with some indication of fitness or risk,particularly when habitat selection appraisals are to be used asan impetus for conservation action.
vThe main limitation of incorporating indices of fitness intoanimal occurrence models is that spatially-explicit fitness datais often difficult to obtain (Nielsen et al., 2006). Studies that
where fledging success at the nest site can readily be established(Aldridge and Boyce, 2007; Donovan and Thompson, 2001). How-ever, with mammalian species the estimation of recruitment andsurvival are generally less straightforward. Changes in the demo-graphic parameters of large mammals in particular occur overrelatively long timescales because of their multi-year or multi-decade life spans and their low reproductive and mortality rates.Most large mammals are also highly mobile with large rangingpatterns, making it difficult to relocate individuals to monitor sur-vival and fecundity. Studies linking reproductive success to habi-tats have been most successful in ungulates on islands and otherclosed systems (McLoughlin et al., 2007, 2008). Given limitationsin time, resources, study species, and study area, researchers re-sort to data that are more readily available, such as mortalitylocation data (Dzialak et al., 2011; Falcucci et al., 2009; Nielsenet al., 2006).
Just as live animals inform habitat selection estimations, carcasslocations provide spatially explicit information on where animalsdie and can be used to inform the riskiness of habitats (Nielsenet al., 2006). However, mortality location data is often underuti-lized in the literature. African elephants, for example, have
C.L. Roever et al. / Biological Conservation 164 (2013) 98–106 99
carcasses that are easily visible from the air for several years afterdeath (Douglas-Hamilton and Hillman, 1981), and while carcasseshave been used to inform local mortality rates (e.g. Dudley et al.,2001; Dunham, 2008) and CITES status (e.g. Wittemyer et al.,2013), we found no peer-reviewed study exploiting the spatiallocation of carcasses. Knowing where animals die can provide valu-able insight into risky landscapes, which is helpful information toguide conservation and management plans. Grizzly bears mortali-ties in Alberta, for example, were concentrated around roads orhiking trails (Benn and Herrero, 2002), prompting calls to regulatehuman access in grizzly bear habitats (Alberta Sustainable Re-source Development and Alberta Conservation Association, 2010).Relating mortality locations to habitat selection models has alsobeen used to better inform habitat-based management plans (i.e.Nielsen et al., 2006).
Habitat heterogeneity contributes to the spatial pattern of useand mortalities of elephants, and describing those patterns is par-ticularly important in Africa, where the management of savannahelephants is a continuing concern (van Aarde and Jackson, 2007).Hunting and poaching in the late 19th and early to mid 20th cen-tury reduced some populations to near extinction (Roth andDouglas-Hamilton, 1991; Whyte et al., 2003), but actions takento decrease poaching in the mid to late-20th century were largelysuccessful in southern Africa (Whyte et al., 2003). The decline andsubsequent recovery of elephant populations also may explainchanges in woodland habitat (Guldemond and van Aarde, 2008;Nasseri et al., 2011), prompting concern for elephant-related treedamage (van Aarde et al., 2008). Their role as ecosystem engi-neers and the susceptibility to population decline from legaland illegal hunting makes it particularly important to quantifyhow habitats contribute to elephant habitat selection and mortal-ity risk.
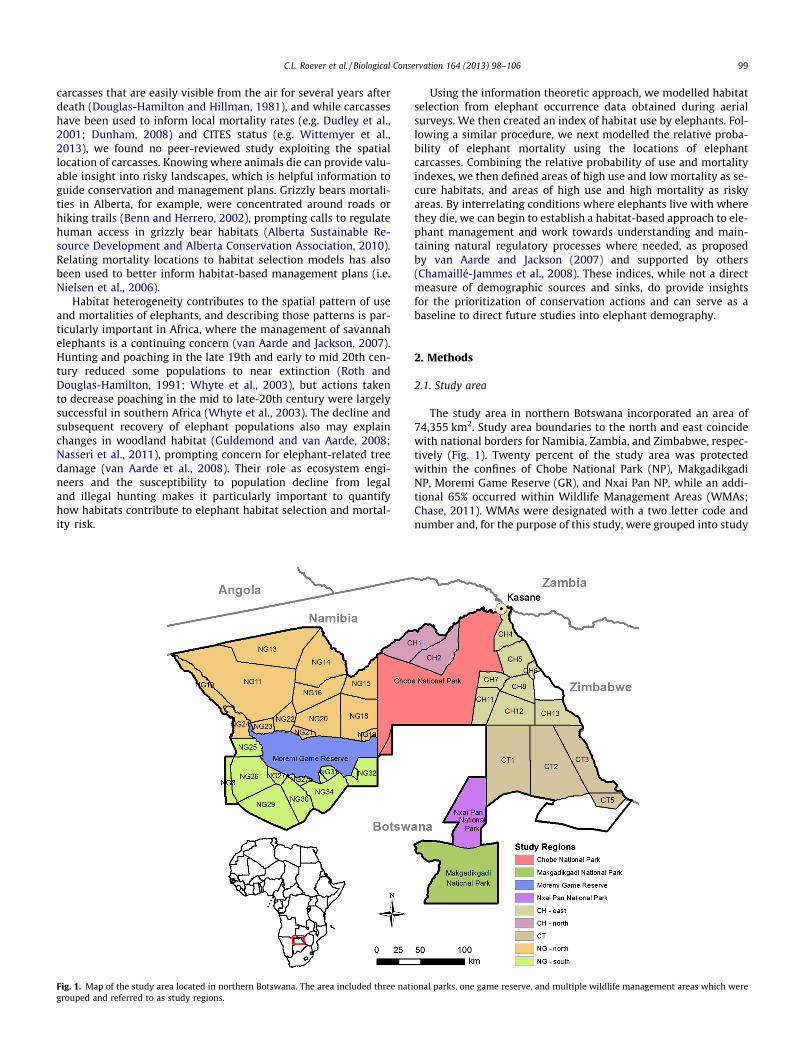
Fig. 1. Map of the study area located in northern Botswana. The area included three natigrouped and referred to as study regions.
Using the information theoretic approach, we modelled habitatselection from elephant occurrence data obtained during aerialsurveys. We then created an index of habitat use by elephants. Fol-lowing a similar procedure, we next modelled the relative proba-bility of elephant mortality using the locations of elephantcarcasses. Combining the relative probability of use and mortalityindexes, we then defined areas of high use and low mortality as se-cure habitats, and areas of high use and high mortality as riskyareas. By interrelating conditions where elephants live with wherethey die, we can begin to establish a habitat-based approach to ele-phant management and work towards understanding and main-taining natural regulatory processes where needed, as proposedby van Aarde and Jackson (2007) and supported by others(Chamaillé-Jammes et al., 2008). These indices, while not a directmeasure of demographic sources and sinks, do provide insightsfor the prioritization of conservation actions and can serve as abaseline to direct future studies into elephant demography.
2. Methods
2.1. Study area
The study area in northern Botswana incorporated an area of74,355 km2. Study area boundaries to the north and east coincidewith national borders for Namibia, Zambia, and Zimbabwe, respec-tively (Fig. 1). Twenty percent of the study area was protectedwithin the confines of Chobe National Park (NP), MakgadikgadiNP, Moremi Game Reserve (GR), and Nxai Pan NP, while an addi-tional 65% occurred within Wildlife Management Areas (WMAs;Chase, 2011). WMAs were designated with a two letter code andnumber and, for the purpose of this study, were grouped into study
onal parks, one game reserve, and multiple wildlife management areas which were
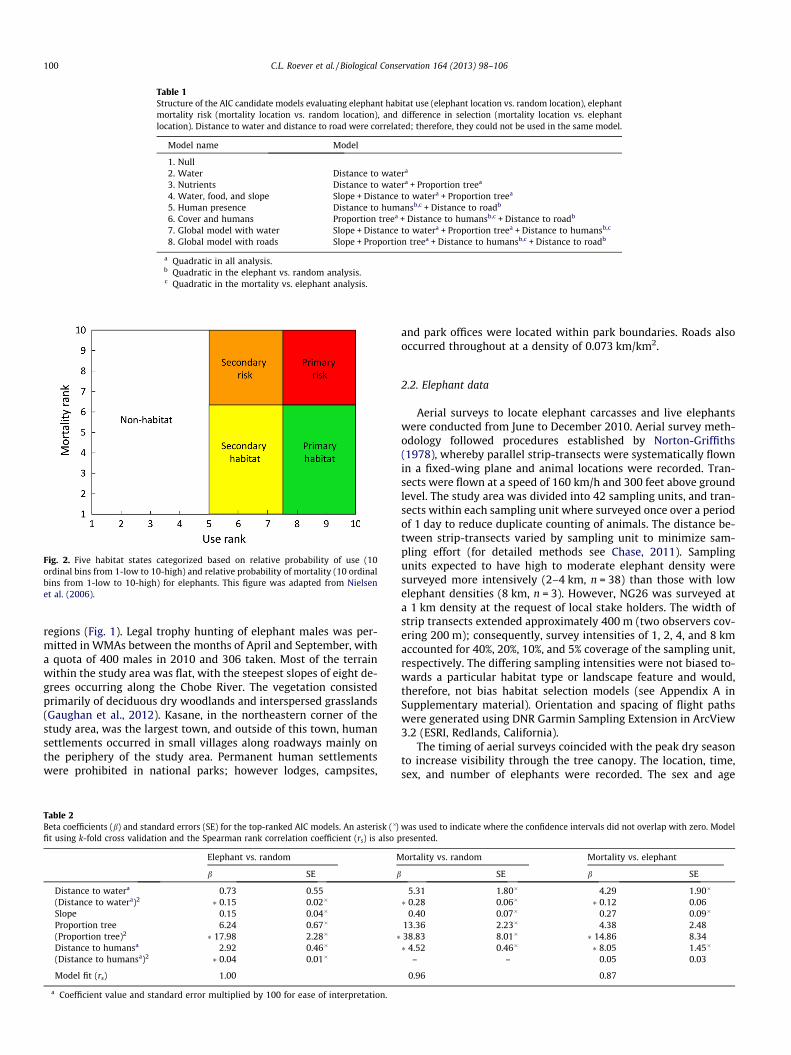
Table 1Structure of the AIC candidate models evaluating elephant habitat use (elephant location vs. random location), elephantmortality risk (mortality location vs. random location), and difference in selection (mortality location vs. elephantlocation). Distance to water and distance to road were correlated; therefore, they could not be used in the same model.
Model name Model
1. Null2. Water Distance to watera
3. Nutrients Distance to watera + Proportion treea
4. Water, food, and slope Slope + Distance to watera + Proportion treea
5. Human presence Distance to humansb,c + Distance to roadb
6. Cover and humans Proportion treea + Distance to humansb,c + Distance to roadb
7. Global model with water Slope + Distance to watera + Proportion treea + Distance to humansb,c
8. Global model with roads Slope + Proportion treea + Distance to humansb,c + Distance to roadb
a Quadratic in all analysis.b Quadratic in the elephant vs. random analysis.c Quadratic in the mortality vs. elephant analysis.
Fig. 2. Five habitat states categorized based on relative probability of use (10ordinal bins from 1-low to 10-high) and relative probability of mortality (10 ordinalbins from 1-low to 10-high) for elephants. This figure was adapted from Nielsenet al. (2006).
100 C.L. Roever et al. / Biological Conservation 164 (2013) 98–106
regions (Fig. 1). Legal trophy hunting of elephant males was per-mitted in WMAs between the months of April and September, witha quota of 400 males in 2010 and 306 taken. Most of the terrainwithin the study area was flat, with the steepest slopes of eight de-grees occurring along the Chobe River. The vegetation consistedprimarily of deciduous dry woodlands and interspersed grasslands(Gaughan et al., 2012). Kasane, in the northeastern corner of thestudy area, was the largest town, and outside of this town, humansettlements occurred in small villages along roadways mainly onthe periphery of the study area. Permanent human settlementswere prohibited in national parks; however lodges, campsites,
Table 2Beta coefficients (b) and standard errors (SE) for the top-ranked AIC models. An asterisk (�)fit using k-fold cross validation and the Spearman rank correlation coefficient (rs) is also p
Elephant vs. random M
b SE b
Distance to watera 0.73 0.55(Distance to watera)2 �0.15 0.02�
Slope 0.15 0.04�
Proportion tree 6.24 0.67�
(Proportion tree)2 �17.98 2.28� �Distance to humansa 2.92 0.46�
(Distance to humansa)2 �0.04 0.01�
Model fit (rs) 1.00
a Coefficient value and standard error multiplied by 100 for ease of interpretation.
and park offices were located within park boundaries. Roads alsooccurred throughout at a density of 0.073 km/km2.
2.2. Elephant data
Aerial surveys to locate elephant carcasses and live elephantswere conducted from June to December 2010. Aerial survey meth-odology followed procedures established by Norton-Griffiths(1978), whereby parallel strip-transects were systematically flownin a fixed-wing plane and animal locations were recorded. Tran-sects were flown at a speed of 160 km/h and 300 feet above groundlevel. The study area was divided into 42 sampling units, and tran-sects within each sampling unit where surveyed once over a periodof 1 day to reduce duplicate counting of animals. The distance be-tween strip-transects varied by sampling unit to minimize sam-pling effort (for detailed methods see Chase, 2011). Samplingunits expected to have high to moderate elephant density weresurveyed more intensively (2–4 km, n = 38) than those with lowelephant densities (8 km, n = 3). However, NG26 was surveyed ata 1 km density at the request of local stake holders. The width ofstrip transects extended approximately 400 m (two observers cov-ering 200 m); consequently, survey intensities of 1, 2, 4, and 8 kmaccounted for 40%, 20%, 10%, and 5% coverage of the sampling unit,respectively. The differing sampling intensities were not biased to-wards a particular habitat type or landscape feature and would,therefore, not bias habitat selection models (see Appendix A inSupplementary material). Orientation and spacing of flight pathswere generated using DNR Garmin Sampling Extension in ArcView3.2 (ESRI, Redlands, California).
The timing of aerial surveys coincided with the peak dry seasonto increase visibility through the tree canopy. The location, time,sex, and number of elephants were recorded. The sex and age
was used to indicate where the confidence intervals did not overlap with zero. Modelresented.
ortality vs. random Mortality vs. elephant
SE b SE
5.31 1.80� 4.29 1.90�
�0.28 0.06� �0.12 0.060.40 0.07� 0.27 0.09�
13.36 2.23� 4.38 2.4838.83 8.01� �14.86 8.34�4.52 0.46� �8.05 1.45�
– – 0.05 0.03
0.96 0.87
C.L. Roever et al. / Biological Conservation 164 (2013) 98–106 101
composition of individuals in groups were used to distinguishbreeding herds from male herds which contained no females orjuveniles. For elephant remains, the age of the carcass was catego-rized as either a recent carcass (i.e. flesh still present and theground still moist indicating that the animal died less than a yearago) or an old carcass (i.e. clean bones, dry ground, and vegetationreestablishing in the rot patch) (Douglas-Hamilton and Hillman,1981). From the air, observers also recorded whether multiple car-casses were observed in the same location to indicate illegal hunt-ing. While observers also recorded whether tusks had beenchopped or removed, park officials also removed tusks from anycarcass they find, as did legal hunters. However, natural mortality
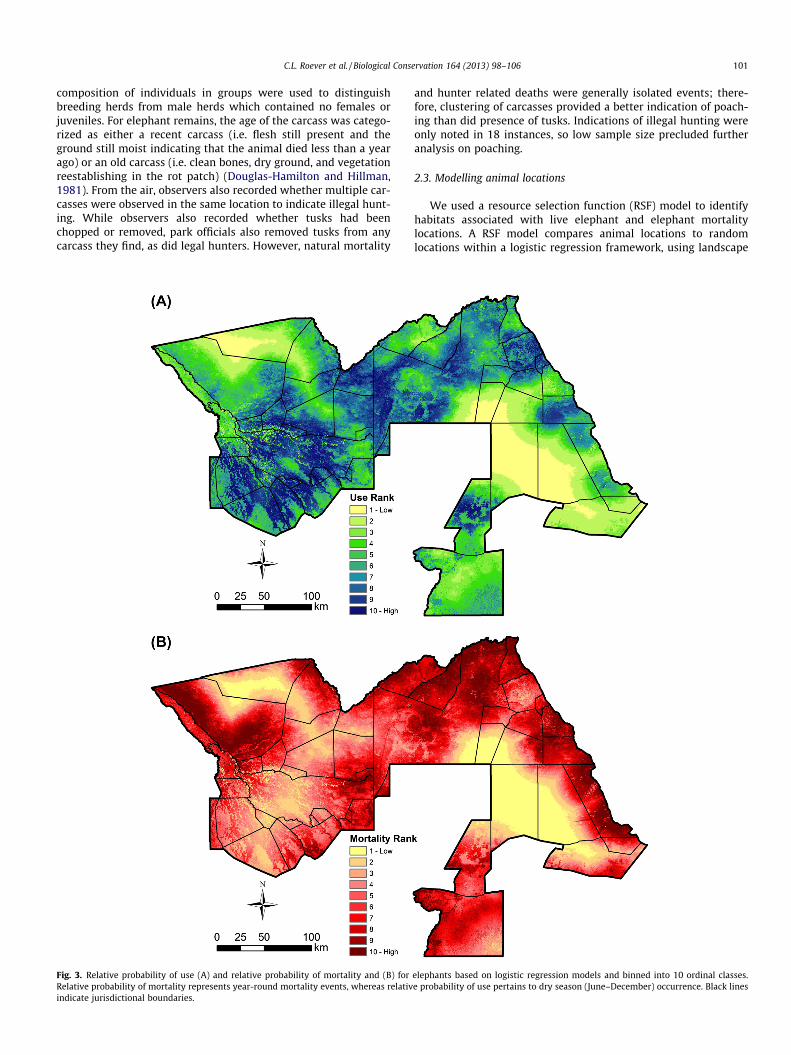
Fig. 3. Relative probability of use (A) and relative probability of mortality and (B) forRelative probability of mortality represents year-round mortality events, whereas relativindicate jurisdictional boundaries.
and hunter related deaths were generally isolated events; there-fore, clustering of carcasses provided a better indication of poach-ing than did presence of tusks. Indications of illegal hunting wereonly noted in 18 instances, so low sample size precluded furtheranalysis on poaching.
2.3. Modelling animal locations
We used a resource selection function (RSF) model to identifyhabitats associated with live elephant and elephant mortalitylocations. A RSF model compares animal locations to randomlocations within a logistic regression framework, using landscape
elephants based on logistic regression models and binned into 10 ordinal classes.e probability of use pertains to dry season (June–December) occurrence. Black lines

Fig. 4. Relative probability of occurrence for live elephant (solid black) and elephant carcass (dashed gray) locations as a function of distance to water, slope, and distance tohumans.
Fig. 5. Habitat states for elephants in northern Botswana. Non-critical habitats represent areas of low use by elephants. Primary and secondary habitats represent areas withlow mortality and high to moderate use, respectively. Primary and secondary risk areas represent regions with high mortality and high to moderate use, respectively.
Table 3Percent composition of habitat states occurring within each study region.
Non-habitat Secondary habitat Secondary risk Primary habitat Primary risk Total area (km2)
Chobe NP 14.6 14.5 26.1 14.8 30.0 10,751Makgadikgadi NP 66.4 20.1 10.6 1.0 2.0 5018Moremi GR 13.6 18.1 7.1 51.1 10.2 4889Nxai Pan NP 35.8 27.9 8.1 9.5 18.7 2518CH – east 42.1 9.8 19.3 9.0 19.7 6977CH – north 39.1 0.5 43.2 0.1 17.2 2884CT 84.1 3.0 11.2 0.4 1.3 10,002NG – north 42.6 14.7 18.7 15.3 8.7 19,683NG – south 10.4 33.1 7.0 36.5 13.0 8375
Total area 42.0 14.6 16.2 15.0 12.3 74,354
102 C.L. Roever et al. / Biological Conservation 164 (2013) 98–106
factors as independent variables. We used a design I approach be-cause individual animals were not uniquely identified and wereonly sampled once (Manly et al., 2002). A design I approach ismade at the population level, where used resources units aresampled for the entire study area (Manly et al., 2002). We thendeveloped three habitat-based models. First, using the live ele-phant observations, we estimated habitat selection by elephants.Each elephant herd accounted for one observation, resulting in3040 live elephant observations. We compared these to random
points generated at a density of 1 point per 3 km2 across thestudy area, for a total of 24,785 random locations. Next, we esti-mated the habitat-specific probability of elephant mortality usingthe 341 elephant carcass observations. The same set of randompoints was used for the mortality model as in the elephant habitatselection model. Finally, we compared elephant carcass locationsto live elephant locations. This model accounts for the reality thatelephants can only die in areas where they occur (Nielsen et al.,2004).

C.L. Roever et al. / Biological Conservation 164 (2013) 98–106 103
Covariates used in the estimation of the three habitat selectionmodels pertained to water, slope, tree cover, human presence, androads (based on Roever et al., 2012). Surface water was locatedusing data from Tracks4Africa (2010) and was visually validatedagainst Landsat imagery. Missing water bodies were manually dig-itized into the water layer. Distance to water (km) was then calcu-lated for each location. While surface water can vary substantiallyacross the seasons, the time of death for mortality events was un-known; therefore, we used all water bodies in our estimation(analysis using dry season water availability is in Appendix B inSupplementary material). Because elephant locomotion is limitedby steep slopes (Wall et al., 2006), slope was calculated in degreesusing a 90 � 90 m digital elevation model (Jarvis et al., 2006). Pro-portion of tree cover was estimated using MODIS Vegetation Con-tinuous Fields (Hansen et al., 2006), which assessed the proportionof tree cover at a 500 � 500 m resolution. To quantify permanenthuman use across the landscape, we used Landscan (2008) humanpopulation data. Landscan data estimates human use over a 24 hperiod, and includes permanent settlements as well as roads, rec-reation areas, and other areas where people occur but not neces-sarily sleep (Landscan, 2008). Areas with >16 people/km2 wereconsidered relevant for elephant space use (Hoare and Du Toit,1999); therefore, these areas were identified and distance to thesehigh human-use areas was calculated. Finally, road infrastructuredata (Tracks4Africa, 2010) was used to determine the distance(km) of locations from roads. As most roads in the study area weresecondary dirt roads, road type was not further differentiated. Allgeospatial analysis was completed using the Spatial Analyst exten-sion of ArcGIS 10.0 (ESRI, Redlands, California) and GeospatialModelling Environment (Beyer, 2011).
To determine which habitat variables influenced elephant useand death locations, Akaike’s information criterion (AIC) was usedto choose a top-model among eight a priori candidate models (Ta-ble 1; Burnham and Anderson, 2002). Prior to model selection, allvariables were tested for correlations and for non-linearity. UsingPearson’s correlation coefficient, variables with an r > 0.60 werenot included in the same model. Correlations occurred betweendistance to roads and distance to water (Pearson’s r = 0.632). Allcontinuous variables were examined for nonlinearities using histo-grams and by examining changes in model fit when including aquadratic term. Model fit of the top-ranked model was evaluatedusing k-fold cross validation (k = 5) and the Spearman rank corre-lation coefficient (Boyce et al., 2002). Analyses were conducted inR software (R Core Team, 2012).
Using the resultant models for where elephants lived and whereelephants died, we predicted the relative probability of use and therelative probability of mortality across the study area. The relativeprobabilities were then classified into 10 ordinal categories usingthe quantile (equal-area) method in ArcGIS 10.0, with the lowestand highest probability equal to 1 and 10, respectively (Nielsenet al., 2006).
2.4. Identifying habitat states
We followed the methods of Nielsen et al. (2006) to define fivehabitat states based on elephant use and mortality. Habitat statesincluded non-habitat (low use), secondary habitat (moderate use,low mortality), primary habitat (high use, low mortality), second-ary risk areas (moderate use, high mortality), and primary riskareas (high use, high mortality) (Fig. 2). We used the elephant datato define the boundaries between habitat states, using an a prioridefined 80% cutoff. Consequently, where 80% of the live elephantsoccurred was categorized as habitat (use classes 5–10, inclusive)and where 80% of mortalities occurred was classified as high risk
(mortality classes 7–10, inclusive). We then calculated the percent-age of each state that occurred within each study region, to ascer-tain the proportion of effective habitats present within each.
3. Results
The top-ranked model for all three habitat selection analyses(elephant vs. random, mortality vs. random, and mortality vs. ele-phant) was model 7 (the global model with water; see Appendix Cin Supplementary material for full model results). This model hadstrong support in the elephant vs. random (weight = 1.00) andmortality vs. random (weight = 1.00) analyses. Conversely, in theanalysis comparing carcass locations to live elephant locations,the global model with water (Model 7) had a weight of 0.74 andthe global model with roads (Model 8) was the second rankedmodel with a weight of 0.23. These two models were similar inform except that they interchanged the correlated variables, dis-tance to water and distance to road. In all three analysis, the topmodel provided good fit to the data using k-fold cross validationtested using the Spearman rank correlation coefficient (rs > 0.86;Table 2).
For the elephant use model, selection was associated with inter-mediate distance from water, steep slopes, moderate tree cover,and further from humans (Table 2). These features were most pre-valent in Moremi GR in the western portion of the study area andthe WMAs surrounding the Okavango Delta (Fig. 3A). High ele-phant use was also prevalent in the central portion of the studyarea in NG 15, NG 18, and western Chobe NP. Selection patternsof elephant mortalities were similar to live elephant habitat usefor most variables. Elephant mortalities were associated with areasof intermediate distance from water, steep slopes, and intermedi-ate tree cover; however the magnitude of these selection coeffi-cients varied from the elephant use model (Table 2). Counter tothe elephant use model, mortalities were more closely associatedwith humans. Across the study area, high mortality areas were lo-cated along the periphery of the study area, near areas with higherlevels of human occupation (Fig. 3B).
Results comparing elephant carcass locations to elephant uselocations reveal that water, slope, and distance to humans differedsignificantly between the two. Compared to where they lived, ele-phants were more likely to die in areas slightly further from waterand on steeper slopes (Fig 4); however, the most striking differencebetween use and mortality locations was proximity to humans.Live elephants selected areas which were at intermediate distancesfrom humans, whereas the highest relative probability of mortalityoccurred in areas near humans. Overall, the predictions of modelscomparing mortality locations to either elephant locations or ran-dom locations were similar (Table 2), indicating that mortality wasnot closely associated with patterns of habitat selection but wereinstead more closely associated with some other factor, such as hu-man presence.
Based on our classification of habitat states, 15.0% of the studyarea comprised primary habitat for elephants, while 12.3% wereprimary risk areas (Table 3). Secondary habitat, which had lowmortality and moderate use by elephants, comprised 14.6% of thestudy area, whereas secondary risk areas, with high mortalityand moderate use, composed 16.2%. Overall, 42.0% was classifiedas non-habitat. The study area contained three national parksand one game reserve. Of these, Chobe NP contained the highestproportion of primary (30.0%) and secondary (26.1%) risk areas ofany study region, and Makgadikgadi NP had the second highestproportion of non-habitat of any study region and had little(1.0%) primary habitat for elephants. Conversely, Moremi GR hadthe highest percentage of primary habitat of any study region

104 C.L. Roever et al. / Biological Conservation 164 (2013) 98–106
(51.1%). WMAs also provide substantial amounts of primary andsecondary habitat for elephants. The WMAs labelled NG northand south comprise 28,058 km2 of land and they consist of5666 km2 (20%) of primary habitat (Fig. 5).
4. Discussion
Our results indicate that elephant use and mortality locationswere spatially separated. Elephant mortality locations were concen-trated in areas close to human settlements, with 80% of all elephantmortalities occurring within 25 km of high human use areas, an areathat accounts for 52% of the study area. Conversely, 50% of live ele-phants were observed in that same area, and live elephants selectedareas of intermediate distance from people (Fig. 4). Elephant mor-talities were, therefore, not proportional to elephant distribution.This is positive for elephant conservation as it shows that elephantswere not exhibiting maladaptive selection, whereby individualsselect areas that ultimately increase their mortality risk. However,it also suggests that humans contribute to elephant mortalities inthe study area. Nielsen et al. (2004) found a similar pattern withgrizzly bears, whereby human-induced mortalities reflected pat-terns of human use rather than of grizzly bear use. However, causeof death for elephants can be difficult to ascertain (Moss et al., 2011).Tusk removal is not a reliable sign of human-caused mortality be-cause game wardens also remove tusks on any carcass observedto discourage the trade of ivory. In this study only 18 of the 341 ele-phant carcasses showed obvious signs of poaching, and most ofthese (17 of 18) were within 25 km of high human use areas.
The use of carcass location data is particularly informativewhen the death of the individual is directly related to the habitatcomponent in which it was found. For example, with predatorsor human hunters, the carcass of the animal will generally remainin close proximity to the source of risk. However, when the animalsuccumbs to starvation or a disease, the behaviour of the individualmay change in response to the weakened state. Elephants, forexample, are dependent on surface water for survival in northernBotswana (Metcalfe and Kepe, 2008), and it has been anecdotallynoted, although not statistically verified, that a sick elephant mayremain within close proximity to a water source (Haynes, 1988).Here, we found that elephant mortalities were closely associatedwith water, but at a similar rate as live elephant locations(Fig. 4). Yet, our study period was not a particularly stressful year;therefore, years of drought may produce very different patterns ofmortality. In such instances of nutrition stress and disease, the car-cass location may prove to be less informative at a fine spatial scaleas examined here. Across a larger spatial scale, however, carcasslocations may still provide valuable information on the ability ofthe region to support elephant populations at the home range orlandscape scale.
Most of our carcass observations were of adult elephants, possi-bly an artifact of their increased visibility from an airplane. Conse-quently, the relative probability of mortality described in thisstudy is biased towards adults. Other studies examining juvenilemortality among elephants found in 89% of cases the cause ofdeath was natural (i.e. from drought, starvation, disease, predation,etc.; Moss et al., 2011). Once an elephant reaches adulthood, thelikelihood of natural mortality declines until the animal reachesthe age of 40 years, when age-related factors again increase therisk of natural mortality (Moss et al., 2011). Because our observedcarcass locations were of adults, it stands to reason that mortalitywas heavily biased towards human-dominated landscapes. A fur-ther bias in the data could exist as a consequence of the OkavangoDelta. No study to date has examined elephant carcass longevity ina marshy environment like the delta, where water could aid indecay and dispersal or obscure carcass visibility from the air.
However, if the mortality events observed in this study are largelyhuman-induced, then the low rate of mortality could simply be aconsequence of decreased human presence in the delta. Nonethe-less, more research needs to be done to verify the cause of deathin adult elephants to better distinguish landscape factors associ-ated with natural vs. human-induced mortality events.
Our study area in northern Botswana included three nationalparks, one game reserve, and many wildlife management areas.Because national parks have greater restrictions on animal andland-use practices, it is often assumed that these areas will providelower mortality and more secure habitat for animals than wouldareas with fewer restrictions. However, this is not always the casein Africa where high human densities near park boundaries(Wittemyer et al., 2008) may increase incidences of poaching(Metzger et al., 2010; Milner-Gulland and Bennett, 2003) and hu-man–wildlife conflicts (Newmark et al., 1994). Our results supportthis, as we found that areas designated as national parks and gamereserves did not decrease mortality for elephants. The highest pro-portions of primary risk areas (high use and high mortality) oc-curred in Chobe NP, where 27% of our observed mortalitiesoccurred; whereas the highest concentrations of primary habitatoccurred in Moremi GP and NG-south (Table 3). Consequently, theprotected designation of an area had less influence on elephantmortality than did the location of the protected area in relation tohuman occupation; therefore, increased human development inthe study area will likely result in a greater abundance of risky areasfor elephants.
We opted to use aerial survey data rather than telemetry data tomake direct comparisons between elephant abundance and ele-phant mortality locations. However, the disadvantage of aerial sur-vey data was that data were restricted to the dry season whendecreased foliage on trees increased elephant visibility. Therefore,our conclusions of habitat states relate to dry season elephant use.The dry season is the limiting season for this mega-herbivore (Il-lius, 2006; Trimble et al., 2009), so we consider the dry season asit best reflects limitations in habitat suitability and ultimately bestrelates to fitness. Habitat selection patterns are likely to vary in thecore wet season (Young et al., 2009), when elephants shift theirdiet to consume more grasses (Cerling et al., 2006; Codron et al.,2011) and are less dependent on permanent water sources (Harriset al., 2008; Young et al., 2009). Based on our knowledge of ele-phant use patterns in the area from GPS collar data, we suspectthat areas designated as ‘‘non-habitat’’ will be most influenced,particularly in NG-north. This area has a high proportion of grassesand was used readily by elephants in the wet season. We also ex-pect that elephants will be more closely associated with peopleduring the dry season, as human settlements are also concentratedaround permanent water, possibly increasing human–wildlifeinteractions and conflict. For patterns of elephant mortalities, re-sults are less likely to vary with season because the longevity ofelephant carcasses means that mortality events could have oc-curred during any season.
Habitat selection models are often used in the management andconservation of wildlife; however, maladaptive selection by wild-life can result in the conservation of habitats that do little to con-tribute to the local persistence of the species. By including anindication of risk, we can begin to temper habitat selection estima-tions to better define habitat suitability. Here we used mortalitylocation data because the large body size and slow decay rate ofelephant carcasses makes this data relatively straightforward toobtain (Douglas-Hamilton and Hillman, 1981); however otherindicators which directly relate to individual fitness have also beenused, such as the habitat selection of a predator (Hebblewhiteet al., 2005), and the availability of a limiting resource (Bleichet al., 2010; Nielsen et al., 2010). The next step is to determine ifthese habitat selection and mortality models relate to demographic

C.L. Roever et al. / Biological Conservation 164 (2013) 98–106 105
responses by the population to determine if these areas of risk alsoact as attractive sinks (Battin, 2004; Delibes et al., 2001).
This study is the first to examine habitat-associations of adultelephant mortalities and provide spatially explicit predictions ofsecure and risky habitats. Understanding the possible habitatvariables which could contribute to mortality is the first step to-wards developing a habitat-based management plan. Balancingfactors that contribute to elephant fitness and mortality to stabi-lize growth is a management option that could help alleviate con-cerns of elephant overpopulation (van Aarde and Jackson, 2007).Past elephant management entailed fencing populations into pro-tected parks and supplementing water, which often resulted inlocalized overpopulation (van Aarde and Jackson, 2007). To reduceelephant numbers, managers then resorted to regular but contro-versial culls (van Aarde et al., 2006). Conversely, the elephantpopulation in northern Botswana has largely escaped this morehands-on management approach, and now provides a model fora self-sustaining population. The areas of primary habitat in theOkavango Delta and central portion of the study area wereisolated from human development and could provide a sourcepopulation to supplement potential risky areas closer to humandevelopment on the periphery if our proposed habitat statesresult in demographic response.
Because elephants have such large roaming areas, habitat-basedmanagement requires vast tracks of land to accommodate the hab-itat heterogeneity for secure and risky areas. To put the area in per-spective, the study area is roughly the same size as the combinedarea of New Hampshire, Massachusetts, and Vermont in the UnitedStates. Yet our study area is just a portion of the larger Kavango–Zambezi Transfrontier Conservation Area, which stretches across320,000 km2 and five countries, and is home to some 220,000 ele-phants (Blanc et al., 2007). Across Africa, initiatives to create corri-dors, link protected areas, and establish transfrontier conservationareas may increase the amount of land available to elephants,while also increasing the heterogeneity of secure and risky habi-tats. This habitat heterogeneity, along with other factors such aslong distance migrations, are natural regulatory processes whichmay have helped to limit elephant populations in the past and con-tribute to regional population stability (Owen-Smith, 2004; vanAarde and Jackson, 2007).
Acknowledgements
We would like to thank Elephants Without Borders, the Interna-tional Fund for Animal Welfare, and the University of Pretoria forresearch funding. The aerial survey was sanctioned and supportedby the Botswana Department of Wildlife and National Parks,through a grant administered by the Conservation Trust Fund(CTF/2010/56). Additional funding was received from the Zoologi-cal Society of San Diego, Madeleine and Jerry Delman Cohen, Mr.Brett Warren, Nathan Jamieson Memorial Fund, Abu Camp, andMutual and Federal Insurance Botswana. Anna Songhurst isacknowledged for her support of the aerial survey over the Okav-ango Panhandle, and for making data available to complement thisanalysis. We thank Mr. Mike Holding of Afriscreen Films and FelixGosher for flying the aerial survey. We appreciate the assistance ofour aerial observers, Ms. Kelly Landen, Anna Songhurst and AllenBekker. GIS support was provided by Tracks4Africa.
Supplementary. data
Supplementary data associated with this article can be found, inthe online version, at http://dx.doi.org/10.1016/j.biocon.2013.04.006.
References
Alberta Sustainable Resource Development and Alberta Conservation Association,2010. Status of the Grizzly Bear (Ursus arctos) in Alberta: update 2010.Edmonton.
Aldridge, C.L., Boyce, M.S., 2007. Linking occurrence and fitness to persistence:habitat-based approach for endangered greater sage-grouse. Ecol. Appl. 17,508–526.
Battin, J., 2004. When good animals love bad habitats: ecological traps and theconservation of animal populations. Conserv. Biol. 18, 1482–1491.
Benn, B., Herrero, S., 2002. Grizzly bear mortality and human access in Banff andYoho National Parks, 1971–1998. Ursus 13, 213–221.
Beyer, H.L., 2011. Geospatial Modelling Environment. Spatial Ecology, LLC. <http://www.spatialecology.com/gme/>.
Blanc, J.J., Barnes, R.F., Craig, G., Dublin, H., Thouless, C., Douglas-Hamilton, I., Hart,J., 2007. African Elephant Status Report 2007: An Update from the AfricanElephant Database. International Union for Conservation of Nature, Gland.
Bleich, V.C., Marshal, J.P., Andrew, N.G., 2010. Habitat use by a desert ungulate:predicting effects of water availability on mountain sheep. J. Arid Environ. 74,638–645.
Boyce, M.S., Vernier, P.R., Nielsen, S.E., Schmiegelow, F.K.A., 2002. Evaluatingresource selection functions. Ecol. Model. 157, 281–300.
Burnham, K.P., Anderson, D.R., 2002. Model Selection and Multimodel Inference: APractical Information-theoretic Approach, second ed. Springer-Verlag, NewYork.
Cerling, T.E., Wittemyer, G., Rasmussen, H.B., Vollrath, F., Cerling, C.E., Robinson, T.J.,Douglas-Hamilton, I., 2006. Stable isotopes in elephant hair documentmigration patterns and diet changes. Proc. Natl. Acad. Sci. USA 103, 371–373.
Chamaillé-Jammes, S., Fritz, H., Valeix, M., Murindagomo, F., Clobert, J., 2008.Resource variability, aggregation and direct density dependence in an opencontext: the local regulation of an African elephant population. J. Anim. Ecol. 77,135–144.
Chase, M.J., 2011. Dry Season Fixed-wing Aerial Survey of Elephants and Wildlife inNorthern Botswana, September–November 2010. Tech. Rep. Elephants withoutBorders, Kasane.
Codron, J., Codron, D., Lee-Thorp, J.A., Sponheimer, M., Kirkman, K., Duffy, K.J., Sealy,J., 2011. Landscape-scale feeding patterns of African elephant inferred fromcarbon isotope analysis of feces. Oecologia 165, 89–99.
Delibes, M., Gaona, P., Ferreras, P., 2001. Effects of an attractive sink leading intomaladaptive habitat selection. Am. Nat. 158, 277–285.
Donovan, T.M., Thompson, F.R., 2001. Modeling the ecological trap hypothesis: ahabitat and demographic analysis for migrant songbirds. Ecol. Appl. 11, 871–882.
Douglas-Hamilton, I., Hillman, A.K.K., 1981. Elephant carcass and skeletons asindicators of population trends. In: Low-level Aerial Survey Techniques.Monograph 4. International Livestock Centre for Africa, Addis Ababa.
Dudley, J., Criag, G., Gibson, D.S.C., Haynes, G., Klimowicz, J., 2001. Droughtmortality of bush elephants in Hwange National Park, Zimbabwe. Afr. J. Ecol. 39,187–194.
Dunham, K.M., 2008. Detection of anthropogenic mortality in elephant Loxodontaafricana populations: a long-term case study from the Sebungwe region ofZimbabwe. Oryx 42, 36–48.
Dzialak, M.R., Webb, S.L., Harju, S.M., Winstead, J.B., Wondzell, J.J., Mudd, J.P.,Hayden-Wing, L.D., 2011. The spatial pattern of demographic performance as acomponent of sustainable landscape management and planning. LandscapeEcol. 26, 775–790.
Falcucci, A., Ciucci, P., Maiorano, L., Gentile, L., Boitani, L., 2009. Assessing habitatquality for conservation using an integrated occurrence-mortality model. J.Appl. Ecol. 46, 600–609.
Gaughan, A.E., Stevens, F.R., Gibbes, C., Southworth, J., Binford, M.W., 2012. Linkingvegetation response to seasonal precipitation in the Okavango–Kwando–Zambezi catchment of southern Africa. Int. J. Remote Sens. 33, 6783–6804.
Guldemond, R.A.R., van Aarde, R.J., 2008. A meta-analysis of the impact of Africanelephants on savanna vegetation. J. Wildlife Manage. 72, 892–899.
Hansen, M., DeFries, R., Townshend, J.R., Carroll, M., Dimiceli, C., Sohlberg, R., 2006.Vegetation Continuous Fields MOD44B, 2001 Percent Tree Cover, Collection 4.University of Maryland, College Park, Maryland.
Harris, G.M., Russell, G.J., van Aarde, R.J., Pimm, S.L., 2008. Rules of habitat use byelephants Loxodonta africana in southern Africa: insights for regionalmanagement. Oryx 42, 66–75.
Haynes, G., 1988. Longitudinal studies of African elephant death and bone deposits.J. Archaeol. Sci. 15, 131–157.
Hebblewhite, M., Merrill, E.H., Mcdonald, T.L., 2005. Spatial decomposition ofpredation risk using resource selection functions: an example in a wolf–elkpredator–prey system. Oikos 111, 101–111.
Hoare, R.E., Du Toit, J.T., 1999. Coexistence between people and elephants in Africansavannas. Conserv. Biol. 13, 633–639.
Illius, A.W., 2006. Linking functional responses and foraging behavior to populationdynamics. In: Danell, K., Duncan, P., Bergstrom, R., Pastor, J. (Eds.), LargeHerbivore Ecology, Ecosystem Dynamics, and Conservation. CambridgeUniversity Press, Cambridge, pp. 71–96.
Jarvis, A., Reuter, H.I., Nelson, A., Guevara, E., 2006. Hole-Filled Seamless SRTM DataV3. International Centre for Tropical Agriculture (CIAT). <http://srtm.csi.cgiar.org>.
106 C.L. Roever et al. / Biological Conservation 164 (2013) 98–106
Johnson, C.J., Seip, D.R., Boyce, M.S., 2004. A quantitative approach to conservationplanning: using resource selection functions to map the distribution ofmountain caribou at multiple spatial scales. J. Appl. Ecol. 41, 238–251.
Landscan, 2008. High Resolution Global Population Data Set. Copyrighted by UT-Battelle, LLC, operator of Oak Ridge National Laboratory under Contract No. DE-AC05-00OR22725 with the United States Department of Energy.
Manly, B.F.J., Mcdonald, L.L., Thomas, D.L., Mcdonald, T.L., Erickson, W.P., 2002.Resource Selection by Animals, Statistical Design and Analysis for Field, seconded. Kluwer Academic Publishers, Dordrecht.
McLoughlin, P.D., Gaillard, J.M., Boyce, M.S., Bonenfant, C., Messier, F., Duncan, P.,Delorme, D., van Moorter, B., Saïd, S., Klein, F., 2007. Lifetime reproductivesuccess and composition of the home range in a large herbivore. Ecology 88,3192–3201.
McLoughlin, P.D., Coulson, T., Clutton-brock, T., 2008. Cross-generational effects ofhabitat and density on life history in red deer. Ecology 89, 3317–3326.
Metcalfe, S., Kepe, T., 2008. ‘‘Your elephant on our land’’: the struggle to managewildlife mobility on Zambian communal land in the Kavango–Zambezitransfrontier conservation area. J. Environ. Dev. 17, 99–117.
Metzger, K.L., Sinclair, A.R.E., Hilborn, R., Hopcraft, J.G.C., Mduma, S.A.R., 2010.Evaluating the protection of wildlife in parks: the case of African buffalo inSerengeti. Biodivers. Conserv. 19, 3431–3444.
Meyer, J.S., Irwin, L.L., Boyce, M.S., 1998. Influence of habitat abundance andfragmentation on northern spotted owls in western Oregon. Wildlife Monogr.139, 3–51.
Milner-Gulland, E.J., Bennett, E.L., 2003. Wild meat: the bigger picture. Trends Ecol.Evol. 18, 351–357.
Moss, C.J., Croze, H., Lee, P.C., 2011. The Amboseli Elephants: A Long-termPerspective on a Long-lived Mammal. University of Chicago Press, Chicago.
Nasseri, N.A., McBrayer, L.D., Schulte, B.A., 2011. The impact of tree modification byAfrican elephant (Loxodonta africana) on herpetofaunal species richness innorthern Tanzania. Afr. J. Ecol. 49, 133–140.
Newmark, W.D., Manyanza, D.N., Gamassa, D.M., Sariko, H.I., 1994. The conflictbetween wildlife and local people living adjacent to protected areas inTanzania: human density as a predictor. Conserv. Biol. 8, 249–255.
Nielsen, S.E., Herrero, S., Boyce, M.S., Mace, R.D., Benn, B., Gibeau, M.L., Jevons, S.,2004. Modelling the spatial distribution of human-caused grizzly bearmortalities in the Central Rockies ecosystem of Canada. Biol. Conserv. 120,101–113.
Nielsen, S.E., Stenhouse, G.B., Boyce, M.S., 2006. A habitat-based framework forgrizzly bear conservation in Alberta. Biol. Conserv. 130, 217–229.
Nielsen, S.E., McDermid, G., Stenhouse, G.B., Boyce, M.S., 2010. Dynamic wildlifehabitat models: seasonal foods and mortality risk predict occupancy-
abundance and habitat selection in grizzly bears. Biol. Conserv. 143, 1623–1634.
Norton-Griffiths, M., 1978. Counting Animals. African Wildlife LeadershipFoundation, Nairobi.
Owen-Smith, N., 2004. Functional heterogeneity in resources within landscapes andherbivore population dynamics. Landscape Ecol. 19, 761–771.
R Core Team, 2012. R: A Language and Environment for Statistical Computing. RFoundation for Statistical Computing, Vienna, Austria. ISBN 3-900051-07-0.<http://www.R-project.org>.
Roever, C., van Aarde, R.J., Leggett, K., 2012. Functional responses in the habitatselection of a generalist mega-herbivore, the African savannah elephant.Ecography 35, 972–982.
Roth, H.H., Douglas-Hamilton, I., 1991. Distribution and status of elephants in WestAfrica. Mammalia 55, 489–528.
Tracks4Africa, 2010. Tracks4Africa Enterprises (Pty) Ltd. Unit 8 Innovation Center,Electron Street, Techno Park, Stellenbosch, 7599, Western Cape, South Africa.<http://tracks4africa.co.za/>.
Trimble, M.J., Ferreira, S.M., van Aarde, R.J., 2009. Drivers of megaherbivoredemographic fluctuations: inference from elephants. J. Zool. 279, 18–26.
van Aarde, R.J., Jackson, T.P., 2007. Megaparks for metapopulations: addressing thecauses of locally high elephant numbers in southern Africa. Biol. Conserv. 134,289–297.
van Aarde, R.J., Jackson, T.P., Ferreira, S.M., 2006. Conservation science and elephantmanagement in southern Africa. S. Afr. J. Sci. 102, 1–4.
van Aarde, R.J., Ferreira, S., Jackson, T., Page, B., De Beer, Y., Gough, K., Guldemond, R.,Junker, J., Olivier, P., Ott, T., Trimble, M., 2008. Elephant population biology andecology. In: Scholes, R.J., Mennell, K.G. (Eds.), Elephant Management: AScientific Assessment for South Africa. Wits University Press, Johannesburg,pp. 84–145.
Wall, J., Douglas-Hamilton, I., Vollrath, F., 2006. Elephants avoid costlymountaineering. Curr. Biol. 16, 527–529.
Whyte, I., van Aarde, R.J., Pimm, S.L., 2003. Kruger’s elephant population: it’s sizeand consequences for ecosystem heterogeneity. In: Du Toit, J.T., Rodgers, W.A.,Biggs, H.C. (Eds.), The Kruger Experience: Ecology and Management of SavannaHeterogeneity. Island Press, Washington, DC, pp. 332–348.
Wittemyer, G., Elsen, P., Bean, W.T., Burton, A.C.O., Brashares, J.S., 2008. Acceleratedhuman population growth at protected area edges. Science 321, 123–126.
Wittemyer, G., Daballen, D., Douglas-Hamilton, I., 2013. Comparative demographyof an at-risk african elephant population. PLoS One 8, e53726.
Young, K.D., Ferreira, S.M., van Aarde, R.J., 2009. Elephant spatial use in wet and drysavannas of southern Africa. J. Zool. 278, 189–205.