57B · 2019. 11. 5. · 57B . Created Date: 3/19/2014 4:53:21 PM
Upload
nguyenthienCategory
view
215download
1
1
COSTING OF IMMUNIZATION PROGRAMS
INCORPORATING COSTING STUDY RESULTS INTO DISTRICT AND SERVICE PLANNING TO ENHANCE
PROGRAM PERFORMANCE
A ZAMBIAN CASE STUDY
For discussion
14 May 2016
EPIC2 Supported by
The Bill and Melinda Gates Foundation
1
CONTENTS
Executive Summary ..................................................................................................................................... 2
Background .................................................................................................................................................. 3
1 EPIC study findings -‐ immunization costs and determinants of efficiency .......................................... 4
1.1 Key findings .................................................................................................................................. 4
1.2 Reasons for differences in unit costs ........................................................................................... 6
2 Organizational Context: EPI management and planning – National to Facility level ........................... 7
2.1 EPI Management structures ........................................................................................................ 7
2.2 Planning, budgeting and management decision making for EPI functions .................................. 9
2.2.1 Policy and strategic level ...................................................................................................... 9 2.2.2 Operational Planning Systems ............................................................................................. 9
2.3 Performance Management and Information sources on EPI resource use, outputs and efficiency ................................................................................................................................................ 11
3 Improving EPI cost effectiveness and sustainability – opportunities and constraints ....................... 12
3.1 Opportunities and Constraints .................................................................................................. 12
3.1.1 General opportunities and constraints .............................................................................. 12 3.1.2 Style and site of leadership and authority ......................................................................... 13 3.1.3 Systems and system tools .................................................................................................. 14 3.1.4 Strategies, plans and policies ............................................................................................. 16 3.1.5 Staff capacity and skills to enhance EPI performance ....................................................... 17 3.1.6 Shared values, teamwork and support .............................................................................. 17 3.1.7 Summary ............................................................................................................................ 18
3.2 New initiatives affecting the EPI ................................................................................................ 18
4 Conclusions and Recommendations – enhancing use of cost and efficiency information to improve EPI and PHC service performance in Zambia ............................................................................................. 19
4.1 Potential to Enhance Information and Management for more efficient Performance ............. 20
4.2 Processes to feed back costing results and identify and build potential to respond ................ 20
4.3 Recommendations ..................................................................................................................... 21
Acknowledgements ................................................................................................................................... 24
Acronyms ................................................................................................................................................... 24
References ................................................................................................................................................. 24
Annex 1: Action Planning Cycle for District Health Teams (MoH 2009) ................................................... 26
Annex 2: Frameworks for assessing opportunities and constraints for increasing EPI efficiency ............. 27
2
EXECUTIVE SUMMARY
Zambia participated in the EPIC 1 study which undertook comprehensive costings of its routine immunization program and new vaccine introduction. After the results were reported to national level stakeholders, Zambia requested that the results of the study be disseminated to district level managers. The process of dissemination to districts and development of this case study had three main objectives: 1) validation of the interpretation of EPIC I costing results, and contextual and other underlying influences on EPI efficiency; 2) understanding of the planning, financing and management context which will influence efforts to enhance EPI efficiency; and 3) exploring how districts can use costing information to enhance planning and management to increase outputs and coverage with limited available resources.
This report highlights key aspects of the Zambian context as well as the costing study results which are relevant to EPI performance management at district and service levels. The report then identifies a number of systems in the areas of planning of health services and the EPI; financial, HR and procurement and supply management; and performance reporting and management.
Despite an established “bottom-‐up” decentralized planning system, decisions over key resources that affect performance of the EPI, such as vaccines and staff costs, are not under the direct control of managers at decentralized levels. However, investigation using a “complex systems” framework revealed a number of other factors that can both constrain and facilitate action to improve the performance of the EPI system with available resources. Constraints that have major overall effects include unpredictability of disbursement of budgets, which undermines ability and motivation for active planning and management, and limited availability of experienced managers along with declining resources for supportive supervision, mentorship and training.
Importantly, the case study found that experienced managers, using insights from the costing study, can identify reasons for inefficient resources and ways to address them, and act to improve performance, despite the various constraints and limited information. Further dissemination of results through mechanisms that cultivate peer learning and ongoing support is recommended. Other recommendations aim as much as possible to build on existing systems and initiatives to strengthen EPI in ways that do not overburden available capacity and also enhance overall PHC system performance. Further exploration of certain EPI policies and incentive systems is recommended. Other issues for consideration include where more central initiatives in areas such as procurement, stock management or reliable budget disbursement, may have larger yields than district or facility level interventions. Support for better use of existing if imperfect information may also prove more efficient than developing more complex information systems and indicators.
3
BACKGROUND
Zambia is a lower-‐middle income country with a population of just over 15 million in 2014. Of this, 60 % are urbanized with the balance often living in areas with very low population density and challenging logistics, particularly in the rainy season. In 2010, 60% of the population lived below the poverty line (CSO LCMS 2010). Despite substantial progress, Zambia’s health system still has major challenges such as relatively high maternal mortality of 398/ 100 000 and Under-‐5 mortality rate of 75/1000 live births (CSO 2014). Zambia has a severe HIV epidemic and will be maintaining around 800 000 people on antiretroviral treatment by the end of 2016.
Between 2006 and 2014, Zambia had rapid economic growth, generally above 6% per annum, and achieved a GNI per capita of US$ 1,760 (World Bank). But since 2014, Zambia has experienced macroeconomic shocks due to the collapse of commodity prices and sharp depreciation of the Kwacha against the US$.
Even before this, Zambia depended quite significantly on development partner funding. For health, government provided around 55% of all finance by 2012 (WHO 2012), and by 2014 provided just 8% (US$158 million) of the funding for the national HIV response (Zambia CCM 2014).
Since the economic downturn, the health sector has faced challenges of increasingly limited and uncertain budget allocations. The health system also has persistent operational challenges to service delivery. Critical underlying factors include: inadequate numbers and skills of managers and health workers; poor morale, motivation and retention; unreliable provision of essential medicines and supplies; limited autonomy in decision-‐making at decentralized levels; and weak monitoring and evaluation (Friedman et al 2016).
In this context, refining planning, budgeting and management of resources will be increasingly important for Zambia to use resources as efficiently as possible to achieve adequate immunization coverage. The Zambian EPI has already been concerned by recent declines in immunization coverage rates in many districts. At the same time financial sustainability of immunization is an increasing challenge. Zambia has recently introduced several new, costly vaccines (PCV, rotavirus, measles second dose) but also achieved middle-‐income country status. This will require it to transition from GAVI Phase 1 (intermediate) support to Phase 2 (graduating) where government must take over vaccine financing from GAVI, typically over a five-‐year transition period.
The EPIC study
Zambia was one of six countries that participated in the EPIC I study.1 This aimed to provide updated information on routine immunization (RI) costs, determinants of costs and new vaccine introduction (NUVI) costs, using standardized methodologies to enhance comparison and interpretation of results.
When results of Zambia’s costing were disseminated to national level stakeholders, the Ministry of Health requested further dissemination to district level managers to assist them to improve EPI 1 The EPIC I multi-‐country study of immunization costs and the EPIC II project, which explores further analyses and use of the data such as this case study, were funded by the Bill and Melinda Gates Foundation, in collaboration with GAVI, WHO and participating countries. The views expressed in this case study are those of the authors and do not necessarily reflect those of the Foundation, its partners or specific informants.
4
performance. The process of dissemination to districts and of developing this case study had several objectives:
1. Validation of the interpretation of EPIC I costing results with planners and managers, and elaboration of contextual and other underlying influences on EPI efficiency.
2. Understanding of the planning, financing and management context and systems which will influence initiatives to enhance EPI efficiency
3. Exploration of how districts can use costing information to enhance planning and management to increase outputs and coverage with limited available resources.
The methodology used to produce this case study was anchored by discussion of study results with a sample of nine district and three provincial management teams. Further discussions of results, planning systems, opportunities and challenges for enhancing immunization performance were held with national managers and planners. Discussions used semi-‐structured interview schedules. A one-‐day workshop piloted a methodology for reporting and discussing implications of costing results with larger groups of managers and planners rather than individual districts. Underlying opportunities and constraints for enhanced planning and management were analyzed using an approach based on Waterman & Peters’ 7S’s framework (1980) and the Results-‐Oriented Approach to Capacity Change (Boesen & Therkildsen 2005).
1 EPIC STUDY FINDINGS -‐ IMMUNIZATION COSTS AND DETERMINANTS OF EFFICIENCY
1.1 KEY FINDINGS
The Epic study in Zambia undertook a comprehensive costing of routine immunization (RI) services in a representative sample of 15 Urban Health Centres (UHCs) and 36 Rural Health Centres (RHCs) across nine districts (Schutte et al 2016).2 The estimated total routine EPI cost in 2011, before introduction of new vaccines, comprised about 5.4% of total expenditure and 10% of government expenditure on health. Around 84% of total EPI costs were funded by the Government of Zambia. A number of results had particular relevance to district and facility level management of scarce resources.
• Most routine immunization program resources were used at facility level (82%) and district level (14%). Province and national levels each accounted for only 2% of costs.
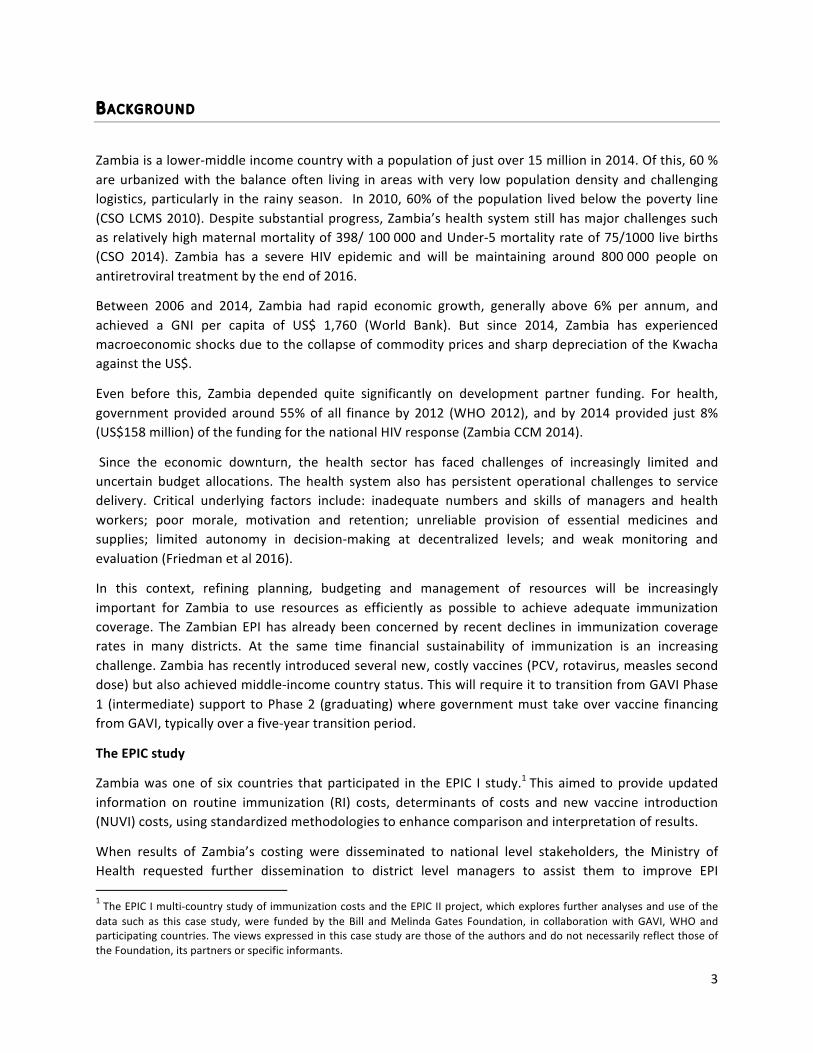
• The largest, most important cost drivers to manage in UHC were vaccines, followed by human resources (HR) and then per dia and travel allowances (Figure 1). Transport and fuel were 6% of EPI costs. In RHC, by contrast, HR was the biggest cost driver. Travel allowances and per dia were higher, but vaccines were a lower proportion, as much lower client numbers receive vaccines.
• Introduction of the new PCV vaccine alone would add an estimated 27% to total RI costs, emphasising the importance of efficient vaccine stock management systems.
• Capital items were relatively small although they can be major budget and operational 2 Full details can be found in Schutte et al (2014)
5
challenges: vehicles were only 5% of costs nationally, and cold chain costs were less than vehicles or buildings.
Figure 1: Cost drivers by line item in Urban and Rural Health Centres
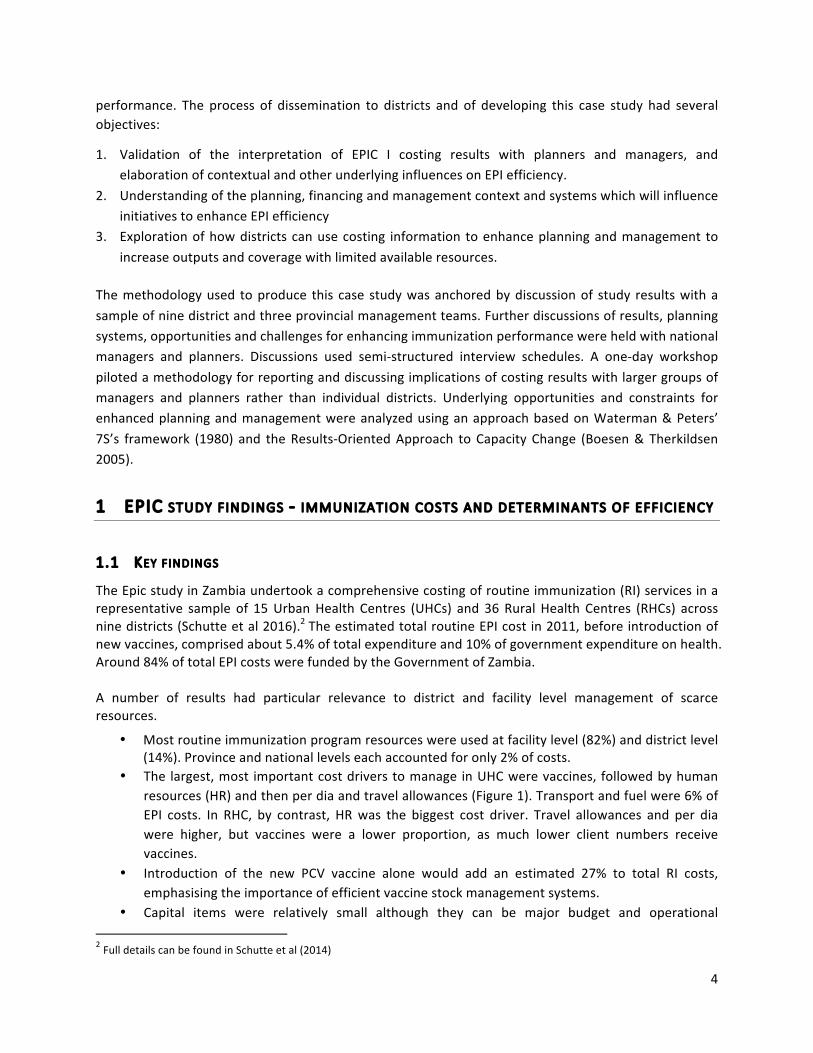
• Costs of various immunization functions were also compared. In UHCs, facility-‐based and outreach service provision use almost 80% of resources, mainly salaries, vaccines and allowances (Figure 2). For RHCs, outreach consumed more resources than facility-‐based services, and social mobilization, vaccine logistics and management were large cost drivers.
Figure 2: Contribution of specific functions to immunization costs
• For Zambia overall, total outreach costs (28% of national program costs) are higher than costs of facility-‐based services (24%). Supervision and management costs also add a substantial 18.6%.
• Total staff time used for immunization was higher than expected, at 20 minutes per dose in UHC and 54 minutes in RHC, excluding Community Health Worker (CHW) time. Different staff mixes are used in urban and rural services. Managers felt that cost data under-‐represent CHW’s importance for immunization, especially as staff and transport funding constraints are increasing.
The results therefore suggest that efficiency improvements should prioritize facility and district level management of the largest cost items, particularly staff productivity and efficiency, vaccines, travel and outreach. Weak stock management, at all levels, is a concern particularly when expensive new vaccines are in use.
When unit costs per dose or per child fully immunized with DPT were compared, UHCs ($3.73/dose and 33.38/DPT3) had much lower unit costs than RHCs ($9.43 and $87.14). However, there was wide
6
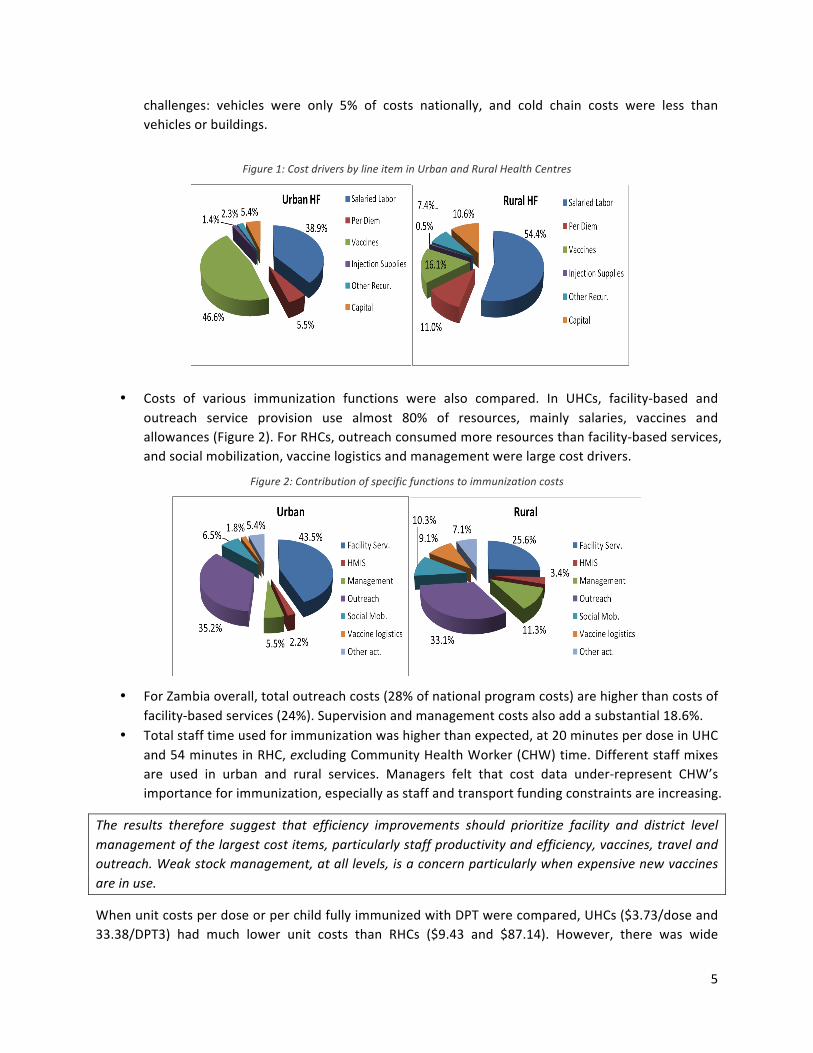
variation in facility size, total costs and unit costs among UHCs and, to an even greater extent, among RHCs (Figure 3). As illustrated, the variation mainly reflects differences in costs of staff, followed by per dia and travel allowances, and then transport, fuel and vehicles. Variation in vaccine wastage may have been under-‐estimated due to poor records.
Figure 3: Rural Health Centre unit cost per dose by line item – Central Province sites (2011 $)
1.2 REASONS FOR DIFFERENCES IN UNIT COSTS
Analyses of the UHC and RHC strata indicated a number of reasons for differences in unit costs and efficiency of services. Explanations were validated in discussions with managers.
• Facility workloads (number of doses or patients) were the main determinant of the differences. There were lower unit costs in busy HCs, and high unit costs in HCs with low number of doses.3
• RHCs had higher average unit costs than UHCs at the same level of output, independent of other identifiable factors.
• Factors that affect large cost items tended to explain unusually high (or low) unit cost sites with similar patient volumes. They included: o Levels of staffing that did not match patient load. Some HCs had much more staff than
others with similar loads. In others, particularly small RHC, core staff had to be provided even when they could not be fully utilised.
o Higher proportions of immunization delivered through outreach activity, time consuming delivery models, and/or high numbers of staff participating in outreach. These tended to increase unit costs.
o Transport and travel requirements (including allowances) to reach remote locations. • Other potentially important causes of marked deviation from UHC or RHC averages included
opening new facilities that duplicated services to a catchment area resulting in lower patient loads, or upgrading of facilities to provide more services (e.g. maternity) with higher staff allocations to the same population.
3 Average workloads were about four times higher in UHCs than RHCs (13 325 vs 2974 doses per annum). The annual costs of immunization varied widely across facilities in both strata, averaging $28 286, but ranging from $6 260 to $115 938.
7
Discussions confirmed that experienced managers with knowledge of the facilities and context, after a scan of basic facility cost profiles, inputs and outputs (total; facility-‐based and outreach), could frequently identify likely reasons that some facilities were outliers with markedly low or high performance.4 Explanations often required assessment of the combined effects of several factors, and relatively complex indicators (e.g. number of doses per immunization staff FTE; outreach doses as % of total doses). Reasons for less extreme variations in performance were also more difficult to diagnose and evaluate. Scatter plots were very useful to identify outlier sites and adjust for factors such as service workloads, but some important patterns were clear only if log values were used.
Identifying outliers frequently posed a new set of questions about their efficiency rather than giving final answers. Until managers could provide in-‐depth information on specific services it was often difficult to explain and evaluate the reasons for factors such as high or low staffing levels, or high reliance on outreach. For example:
• Differences in efficiency that were due to unavoidable “structural” rigidities like remoteness needed to be distinguished from factors that could be changed.
• Low unit costs could represent “efficiency” but they could also result from under-‐resourcing with lower quality and sustainability.
• In some cases immunization efficiency could not be understood in isolation from other PHC: high unit costs of underutilised staff might, for example, be best addressed by using spare capacity to strengthen other PHC services rather than changing immunization itself.
2 ORGANIZATIONAL CONTEXT: EPI MANAGEMENT AND PLANNING – NATIONAL TO
FACILITY LEVEL
2.1 EPI MANAGEMENT STRUCTURES
Efforts to enhance efficiency of immunization resource use have to be operationalized within the organizational context of the Zambia EPI. From 2012 to 2015, responsibilities for the health function in Zambia were divided between two Ministries. The roles of the Ministry of Health (MoH) included: policymaking, strategic planning, resource mobilization, and provision of second and tertiary hospital care. The Ministry of Community Development Mother and Child Health (MCDMCH) was responsible for delivering PHC, including EPI, through district structures, hospitals, health centres and health posts, as well as maintaining the national EPI management, planning and supply functions.
From 2016, all health functions have been re-‐integrated into the MoH, which will be responsible for all health planning processes, budgets and management including MCH. While details were still being refined at the time of this work, managers expected that this would result in limited changes to the management structures and systems for EPI.
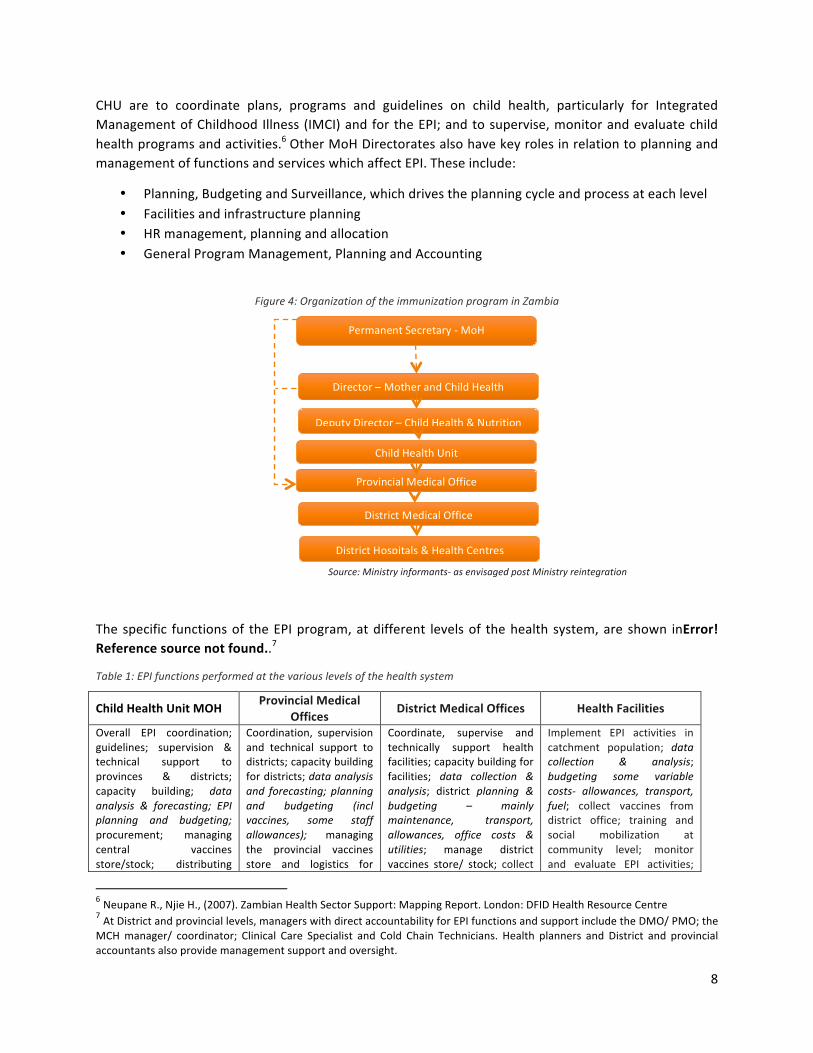
MCH and EPI management structures are shown in Figure 4. The national Child Health Unit (CHU) responsible for the EPI falls under the Child Health and Nutrition Section.5 The main functions of the
4 Multiple regression analysis confirmed that the reasons above capture the main influences on costs and efficiency between HC. 5 The MCDMCH CHU structure has been: Deputy Director-‐ Child Health and Nutrition, to head the Section; 1 Child Health Specialist (Head: Child Health Unit); 1 Chief EPI Officer; 1 Chief Logistician; 2 Chief Cold Chain Officers; 1 Principal EPI Officer.
8
CHU are to coordinate plans, programs and guidelines on child health, particularly for Integrated Management of Childhood Illness (IMCI) and for the EPI; and to supervise, monitor and evaluate child health programs and activities.6 Other MoH Directorates also have key roles in relation to planning and management of functions and services which affect EPI. These include:
• Planning, Budgeting and Surveillance, which drives the planning cycle and process at each level • Facilities and infrastructure planning • HR management, planning and allocation • General Program Management, Planning and Accounting
Figure 4: Organization of the immunization program in Zambia
Source: Ministry informants-‐ as envisaged post Ministry reintegration
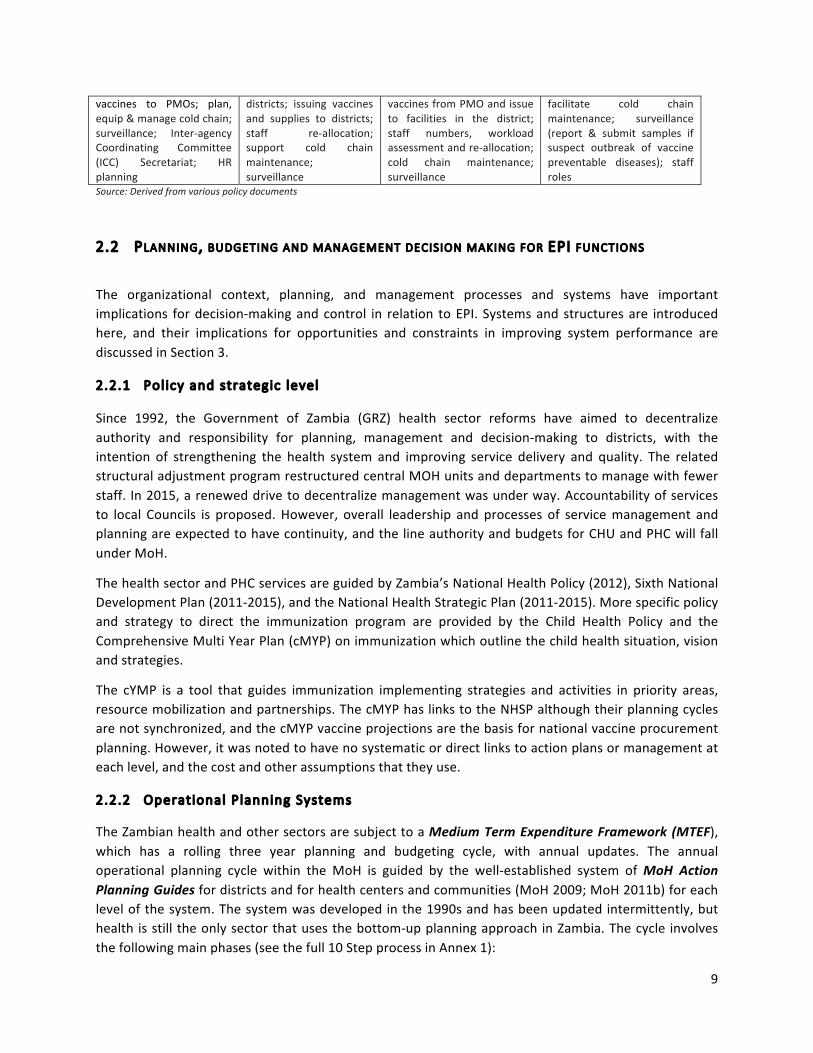
The specific functions of the EPI program, at different levels of the health system, are shown inError! Reference source not found..7
Table 1: EPI functions performed at the various levels of the health system
Child Health Unit MOH Provincial Medical Offices
District Medical Offices Health Facilities
Overall EPI coordination; guidelines; supervision & technical support to provinces & districts; capacity building; data analysis & forecasting; EPI planning and budgeting; procurement; managing central vaccines store/stock; distributing
Coordination, supervision and technical support to districts; capacity building for districts; data analysis and forecasting; planning and budgeting (incl vaccines, some staff allowances); managing the provincial vaccines store and logistics for
Coordinate, supervise and technically support health facilities; capacity building for facilities; data collection & analysis; district planning & budgeting – mainly maintenance, transport, allowances, office costs & utilities; manage district vaccines store/ stock; collect
Implement EPI activities in catchment population; data collection & analysis; budgeting some variable costs-‐ allowances, transport, fuel; collect vaccines from district office; training and social mobilization at community level; monitor and evaluate EPI activities;
6 Neupane R., Njie H., (2007). Zambian Health Sector Support: Mapping Report. London: DFID Health Resource Centre 7 At District and provincial levels, managers with direct accountability for EPI functions and support include the DMO/ PMO; the MCH manager/ coordinator; Clinical Care Specialist and Cold Chain Technicians. Health planners and District and provincial accountants also provide management support and oversight.
Permanent Secretary -‐ MoH
Director – Mother and Child Health
Deputy Director – Child Health & Nutrition
Child Health Unit
Provincial Medical Office
District Medical Office
District Hospitals & Health Centres
9
vaccines to PMOs; plan, equip & manage cold chain; surveillance; Inter-‐agency Coordinating Committee (ICC) Secretariat; HR planning
districts; issuing vaccines and supplies to districts; staff re-‐allocation; support cold chain maintenance; surveillance
vaccines from PMO and issue to facilities in the district; staff numbers, workload assessment and re-‐allocation; cold chain maintenance; surveillance
facilitate cold chain maintenance; surveillance (report & submit samples if suspect outbreak of vaccine preventable diseases); staff roles
Source: Derived from various policy documents
2.2 PLANNING, BUDGETING AND MANAGEMENT DECISION MAKING FOR EPI FUNCTIONS
The organizational context, planning, and management processes and systems have important implications for decision-‐making and control in relation to EPI. Systems and structures are introduced here, and their implications for opportunities and constraints in improving system performance are discussed in Section 3.
2.2.1 Policy and strategic level
Since 1992, the Government of Zambia (GRZ) health sector reforms have aimed to decentralize authority and responsibility for planning, management and decision-‐making to districts, with the intention of strengthening the health system and improving service delivery and quality. The related structural adjustment program restructured central MOH units and departments to manage with fewer staff. In 2015, a renewed drive to decentralize management was under way. Accountability of services to local Councils is proposed. However, overall leadership and processes of service management and planning are expected to have continuity, and the line authority and budgets for CHU and PHC will fall under MoH.
The health sector and PHC services are guided by Zambia’s National Health Policy (2012), Sixth National Development Plan (2011-‐2015), and the National Health Strategic Plan (2011-‐2015). More specific policy and strategy to direct the immunization program are provided by the Child Health Policy and the Comprehensive Multi Year Plan (cMYP) on immunization which outline the child health situation, vision and strategies.
The cYMP is a tool that guides immunization implementing strategies and activities in priority areas, resource mobilization and partnerships. The cMYP has links to the NHSP although their planning cycles are not synchronized, and the cMYP vaccine projections are the basis for national vaccine procurement planning. However, it was noted to have no systematic or direct links to action plans or management at each level, and the cost and other assumptions that they use.
2.2.2 Operational P lanning Systems
The Zambian health and other sectors are subject to a Medium Term Expenditure Framework (MTEF), which has a rolling three year planning and budgeting cycle, with annual updates. The annual operational planning cycle within the MoH is guided by the well-‐established system of MoH Action Planning Guides for districts and for health centers and communities (MoH 2009; MoH 2011b) for each level of the system. The system was developed in the 1990s and has been updated intermittently, but health is still the only sector that uses the bottom-‐up planning approach in Zambia. The cycle involves the following main phases (see the full 10 Step process in Annex 1):
10
a) Definition of budget envelopes, planning guides, HMIS analyses and targets for each level of the system
b) A sequence of planning launches at each level c) Bottom-‐up planning from service level, with community involvement and support for facilities
and districts to develop plans d) Collation of plans at the district and provincial levels e) Finalisation of budgets and plans by MoH and communication to Ministry of Finance f) Communication of final budgets to districts and facilities
The MoH Planning Guides at district and service levels have a Marginal Budgeting for Bottlenecks approach focused on three main programs and their budgets:
1) family and community based interventions; 2) population based, schedulable, outreach and prevention programmes including immunization; 3) individual clinical care at health centres and hospitals.
There are tools for activity, input and budget planning. Immunization is mentioned in the list of high impact interventions that should be considered and prioritized in planning. The guides include specific reference to immunization targets, performance and key inputs (including cold chain and vaccine quantities), as well as budget requirements for inputs such as transport and allowances. The district level also includes planning and budgeting for purchase of equipment, maintenance of key inputs for immunization functions such as vehicles and facility motor bikes, and supervision. Final budget amounts and budget priorities that are approved by MoH often do not match those which facilities and districts submitted to higher levels. The types and numbers of staff on the establishment, actual filled posts and turnover are considered in Provincial, District and hospital plans, but budgets for their salaries are not. District plans also report overall numbers of health center patient contacts per professional staff member per day, but with no explicit guidance for further analysis. Indications of vaccine volumes and costs are considered in district and province plans although they do not directly manage budgets for them. Immunization was noted to be an exceptional program because it has specific planning and management systems that are to a significant extent separate to those for general PHC, although they interface with the general MoH planning system. The RED8 Health Facility Action Plan Guides provide detailed planning and budgeting guidance and tools specific to immunization and each of its main sub-‐activities. They address barriers to immunization coverage in each community served with specific strategies around: planning and management of resources including staffing; revitalising quality and accessibility of static and outreach services; mobilizing communities; and supportive supervision and monitoring. The RED micro-‐planning tool considers items such as outreach and staffing in each community in some detail.
Vaccines requirements are addressed in facility and district level planning tools. However only volumes, not vaccine costs and budgets, are considered. The main vaccine procurement and supply plans are collated and driven at national level. Although the supply chain is intended to work as a responsive “pull” system, limitations of stock management and other factors mean that it is largely a “push” system from central level, based mainly on quantities identified in routine plans. Vaccine supply and stock control
8 Reaching Every District in Zambia with High Quality Routine Immunization Services (RED)
11
systems are a further important information and cost management system covering a large contributor to EPI costs, especially since the introduction of PCV and rotavirus. They are generally based on standard WHO supply and stock management tools and approaches.
Human Resources (HR) planning and management for professional, technical and administrative staff is largely driven from central level. District and facility levels have limited direct control of post structures, actual staffing levels, salaries, appointments and performance management. HR budgets are largely determined by central processes. Districts and facilities have most direct financial authority in the area of allowances used to compensate Community Health Workers.
Facilities and infrastructure planning is controlled centrally in the MoH. Requests for new facilities are submitted from districts and are judged against standard population and distance norms for placement of each type of hospital, health centre and health posts. These, and capital budget constraints, can exert quite tight control over proliferation of services in locations which do not efficiently match needs and resources. Procurement requests for vehicles, another key determinant of both immunization costs and coverage, are submitted by districts and facilities to higher levels which then prioritise requests and provide them when budgets are available. In reality, the EPI has often relied on donor funding to provide vehicles, including most of the current fleet of motorcycles used for outreach and collecting vaccine supplies at service level.
2.3 PERFORMANCE MANAGEMENT AND INFORMATION SOURCES ON EPI RESOURCE USE, OUTPUTS AND EFFICIENCY
Zambia has an established performance management system for each level of the health system. The MoH Performance Assessment Tools for Health Centre and district levels include several immunization indicators: achievement of 80% full immunization by one year of age, availability of protocols and certain aspects of cold chain inputs, and implementation of processes such as immunization record checking and community based immunization strategy. After initial performance assessment, a stage of more in depth diagnosis of problems is undertaken with underperforming districts, before defining remedial actions.
Zambia EPI uses established routine EPI programmatic reporting tools to track activities, outputs and coverage. Each facility’s data are consolidated at the facility and then district level, allowing for analysis to inform management and also for performance benchmarking. Data are entered into the electronic HIS at district level. Reports are then consolidated for national level monitoring and evaluation, but EPI reports can be generated for each facility from the HIS . Financial management information available to district and Facility managers has important limitations for ensuring efficient use of resources. Planning tools at facility and district level include activity budgets that specify costs of outreach and other aspects of immunization. These give relatively reliable budget and cost estimates for various resources although they exclude major cost items such as staff and vaccines. However, actual expenditures and costs are difficult to track. Budget data in district plans are not compiled in a format that easily integrates into the accounting system. Expenditures data is often delayed or not available in a form that tracks spending against Action Plans or specific programs. Vaccines are the only EPI-‐specific item. The public sector Integrated Financial Management System (IFMIS) chart of accounts do not allow any detailed differentiation on health specific activities and
12
programs and expenditure data is generally available only at national and provincial level. The Financial and Administrative Management System (FAMS), developed by the Central Board of Health in the 1990s to work in parallel to IFMIS, allows budgeting and tracking of expenditures against specific activities and programs such as Child Health (see section 4.1. for further detail).
3 IMPROVING EPI COST EFFECTIVENESS AND SUSTAINABILITY – OPPORTUNITIES AND CONSTRAINTS
The EPIC studies revealed substantial differences in facility unit costs, and also complexities in interpreting them. This raised questions about the extent to which sufficient data (costs, staffing, transport, outputs etc) can be routinely produced and analysed so that managers, especially at higher levels, can assess the inputs, costs and performance of RI-‐specific services or other PHC services.
The previous sections have noted some features of planning, management and information tools and systems. Consultations with managers and planners at national, district and provincial level and rapid review of tools and documentation, explored further the questions of whether: a) it is, in practice, possible to generate the required information to assess efficiency and enhance it; and b) if inefficiencies can be identified, do managers have opportunities and the ability to manage them? The following sections explore factors that both support and limit ability to enhance immunization coverage with available resources. These are important to consider when assessing the potential to use improved information or other strategies to enhance system efficiency.
3.1 OPPORTUNITIES AND CONSTRAINTS
3.1.1 General opportunit ies and constraints
Managers noted that dissemination of study insights and other pressures for innovation had significant potential for performance improvement, even before improved routine cost and efficiency information becomes available. In a number of districts and facilities, effort had already been made to enhance efficiency of resource use in response to low and unpredictable funding for items such as transport, fuel, allowances, and maintenance of motorbikes and other vehicles. Responses had included reducing outreach expenses by coordinating teams’ trips and sessions better, making less frequent visits or including more sites on outreach routes. This had in some cases been combined with increasing community mobilization to ensure more children could be reached reliably on each visit. Potential to reduced outreach to urban communities that already have high immunization coverage was also being considered.
In response to staffing limitations, tasks such as recording statistics were being shifted to CHWs to use scarce staff more strategically. Some managers also reported increasing reliance on telephonic supportive supervision to replace visits to services, or reduced frequency of visits. Others were managing limited available per diem funding to ensure that they were targeted at maintaining incentives to undertake priority activities.
13
A number of stakeholders did however raise some concern about possible impacts of the above strategies on quality, equity and sustainability of services and functions such as EPI reporting.
Several managers also pointed to potential to improve efficiency by increasing outputs with available resources. Examples included intensified initiatives to reduce missed immunization opportunities and drop out of children before completing immunization, and limiting allocation of staff time to low workload sessions.
However, several over-‐arching constraints on efficiency were identified. The overall economic and public sector fiscal context were highlighted as being an obstacle to improving service performance and efficiency. Increasingly unpredictable disbursement of budgeted funds (with some being delayed and some never being paid) was cited as a fundamental constraint on ability to implement plans and manage services more efficiently, strategically and sustainably. Other efforts to improve staff morale and performance, and functioning of financial and other management systems were seen as having limited impact in this context.9 Cancellation of outreach due to lack of funds for fuel or transport also inherently pushes up immunization unit costs. Nevertheless, as illustrated above, increasingly stretched resources were leading to some innovative changes in service delivery in ways that might not otherwise be accepted.
Several other practical and structural constraints on ability to improve use of available resources were also noted by managers. Unavoidable constraints apply to efficiency of many services in remote areas or small communities, where a minimum staffing complement was required even with few clients, and travel inevitably increased staff time, transport and allowance costs. Most managers said there were major constraints on ability to reduce dependence on outreach to achieve immunization targets. While several districts had identified opportunities to limit dependence on outreach, one had specifically assessed the proportion of immunization coverage dependent on outreach against allowance and fuel costs and concluded that outreach routes and schedules could not be reduced. Integration of immunization with other services can also affect its efficiency. For example, need to provide monthly antenatal services limits ability to reduce numbers of high cost outreach visits, unless antenatal patients are expected to pay for costs of travel to other services for their scheduled check ups.
3.1.2 Style and s ite of leadership and authority
Decentralization and delegation of decision making power and enforcement of accountability can have significant influence on ability to manage immunization efficiency. Ability to boost system performance within Districts and facilities was noted to depend heavily on the quality of leadership provided by DMO’s, as well as their teams, which was variable, especially given turnover of strong managers.
Limited authority of District and Service managers over key budget items and functions was considered to be a significant obstacle to efficiency, despite historical promotion of decentralization and emphasis on “bottom-‐up” planning. Various district and facility managers reported that they cannot or do not actively manage items outside of their direct budgetary authority, such as human resources and
9 Similar challenges were noted by the recent review of Results Based Financing in Zambia (see section 3.2 below) indicating that more reliable disbursement can probably increase performance without other interventions, and that other mechanisms may have limited impact without it. Boesen & Therkildsen (2005) have recognized that unreliable disbursement of funding has been a particular constraint on performance in other contexts too.
14
vaccines. Some initially questioned why these costs were being discussed with them at all. A central MoH planner further noted that “in theory there are bottom up decisions in management but particularly for immunization big decisions affecting resource use are made centrally”.
Nevertheless, the costing study dissemination process also showed that greater awareness can be created of inefficient staffing allocation and utilization, and of ability to manage staff. Although district and facility level managers have limited influence over the overall staff establishment planning or budgeting of their staff resources, they can reallocate staff within and between services depending on needs. Available data can also produce staff workload ratios that allow managers at district and provincial levels to identify and investigate outlier services with gross over-‐ or under-‐staffing. Some provincial managers did report that they do review staff workload ratios and reallocate staff between districts and services, when feasible.
3.1.3 Systems and system tools Sections 2.2 and 2.3 identified a number of key planning and management systems. Several have features that support ability to identify inefficiency or reduce it. Other features impose constraints in information or responses, but some of these can potentially be addressed.
Bottom-‐up planning systems and tools clearly encourage managers and planners to consider methods and budget requirements to achieve targets. However, District and Facility Planning Guides have several aspects that may limit explicit focus on efficient use of resources, and immunization resources specifically:
1) The Planning Guides focus on availability of inputs, and on outputs and coverage. Efficiency is considered in the Situation Analysis narrative. However, there are no indicators of operational or allocative efficiency which link inputs and outputs or coverage.
2) The MoH Planning Guides (and general policy) encourage focus on integrated PHC and service delivery platforms, rather than specific diseases or vertical programs such as immunization.
3) The budgeting for immunization is largely focused on allowances for staff and CHWs, transport and items such as maintenance. There is minimal consideration of human resources, vaccines and other large immunization-‐related costs, particularly at facility level.
Similarly, the RED Micro-‐planning guide has potential to focus local service planning on issues highlighted in the EPIC costing study (outreach planning; staff utilization; higher cost functions such as supervision). However, the tool focuses on inputs, problems, target populations and outputs/ coverage. There is no explicit consideration of, or guidance on, ways to use available resources and strategies most efficiently, such as altering plans for staffing or outreach. The tools are also relatively complex: managers commented that it would not be feasible to apply similar, detailed planning to other aspects of services.
Financial planning and management systems do allow district and facility managers to plan and reallocate some budgets to achieve immunization objectives. The FAMS has been essential to track expenditures and budget execution. However, until updates that are currently under way, the Excel based system has faced challenges such as limited ability to interface with IFMIS, manual budget templates and other features, omission of key resources not budgeted at district level (such as staff and vaccines), and limited availability of experienced accounts staff. So it has not been very reliably used to produce financial management information for districts which can assist them in assessing efficiency.
15
Furthermore the FAMS and IFMIS accounting systems cover all PHC services rather than specific programs, making it difficult to assess immunization resource use (Schutte et al 2014; Guthrie et al 2014 a and 2014b.). Overall, managers’ ability to identify actual expenditures on specific programs and immunization activities has remained limited. At no level are routine comparisons made between financial or other resource use, and EPI programmatic output or coverage data. The current updating process can potentially allow for more efficient and detailed consideration of EPI budgets and expenditure within the Child Health program. The EPI reporting system is a well-‐established system to provide key statistics required to assess performance and efficiency. Estimation and management of efficiency cannot be confidently done without adequate reporting of outputs to develop accurate unit cost estimates. Arguably, accurate immunization coverage and output data alone can also provide a good indication of more or less efficient allocation and use of resources within districts and facilities, even if they cannot be easily combined with specific cost data. Unfortunately, informants and other studies (Friedman et al 2016) had concerns about the completeness and accuracy of EPI reporting and analysis, as well as limited use of basic EPI data at service level, a challenge noted elsewhere (Castañeda-‐Orjuela et al 2013; O’Connell et al 2012). Such concerns have led to introduction of the Better Immunization Data (BID) project and initiatives to increase use of electronic reporting. During fieldwork, district managers expressed uncertainty that CHWs, who increasingly take responsibility for recording immunization data, are adequately trained and supported for this. A further issue is that the routine system does not readily produce EPI management indicators which the costing study has indicated may be useful, such as the proportion of doses provided through outreach vs facility based services. In addition, Central Statistics Office (CSO) data are used to estimate district and facility catchment populations for coverage estimates. Both review of routine facility immunization coverage statistics, which often exceeds 100% by large margins at facility and district level, and managers and planners comments, indicated that limited accuracy of CSO catchment population estimates makes performance difficult to assess, and undermines credibility and motivation to manage performance. Most managers indicate that the performance review system works well to identify problems and remedial actions. However, it tends to focus on inputs and outputs separately, with no attempt in immunization or any health service component to assess efficiency of resource use by comparing financial or other inputs with outputs. In addition, budget constraints have made it increasingly difficult to feed results back to districts and to help them to assess and remedy performance problems. When responses do occur, they tend to focus on very poorly performing districts. They may not prioritize districts that are average or good performers overall, even if their EPI performance is relatively weak.
Weaknesses in vaccines supply and stock management systems and practices at all levels have been reported by the EPIC study and other reviews, and they affect ability to manage this key cost item. The centralized procurement and budgeting systems, and focus on quantities rather than cost in planning tools, mean that managers and service providers have limited knowledge of the relative costs of vaccines. This affects incentive to manage them and creates risks that decisions may be affected by incorrect knowledge about costs of vaccines. Limited wastage information and control at facility and higher levels, also make it difficult to assess vaccine wastage and creates risk of inefficiencies due to stock-‐outs. The standard WHO stock management tools are considered to be complex by most health workers, and it has been proposed that pharmacists should thus take over the function for districts and
16
facilities. System limitations, particularly at facility level, are however being tackled by a specific vaccine supply and stock management component of the Better Immunization Data project.
Routine HR information systems have limited ability to provide managers and planners with up-‐to-‐date data to compare staffing and staffing costs to workloads for specific services. Staffing data may not reliably reflect actual current distribution of staff who move, which affects the ability of planners and managers, particularly at more central levels where decisions are made, to assess and optimize staffing in terms of staff costs or numbers against workloads. Routine reporting in annual plan formats has very limited utility. Overall, system and other constraints mean that staffing allocations are seldom managed pro-‐actively to enhance efficiency.
Facilities and infrastructure planning systems and norms have been relatively successful in ensuring some consistency in service resource allocation and thus efficiency.10 However, the costing study illustrated how duplication or modification of services can still occur, resulting in extra staff allocation, vehicle or other costs, and negative impacts on immunization unit costs. Setting up of new Health Posts by NGO, political or other interests is more difficult to control. Once they are in place there is demand to allocate staff and other resources to them even if they are sited inefficiently. Systems for planning and procurement of capital equipment such as vehicles and motor cycles were noted to have limited responsiveness. Requests are submitted by districts to provincial and national levels, but are not reliably or timeously met, even when there are serious bottlenecks to performance of services including immunization. Adequacy of maintenance budgets and arrangements were noted to be an increasing challenge, as the fleet of motorcycles procured by MCDMCH with donor funds was now old and unreliable. There appeared to be no firm capital equipment plan or budget space to replace them.
3.1.4 Strategies, p lans and pol ic ies National strategies, plans and policies can potentially enable or hinder attempts to improve EPI performance. Zambia has consistently prioritised immunization in health and development strategies. Immunization coverage is one of three key performance indicators for the health sector overall, and there is emphasis on accountability for EPI at all levels. Interviews with DHMTs confirmed that district and facility leadership also prioritise EPI, as do various service models, management tools and guidelines. This creates potential to ensure that services will be supported to optimise EPI information and performance with whatever resources are available. Zambia has also established precedents of changing policies and structures in health and immunization specifically in order to enhance coverage and sustainability, for example the recent change in Child Health Week policy. Two specific policies were identified for further research to ensure that they are in fact enhancing EPI performance and efficiency. Child Health Weeks now exclude immunization drives in Zambia, in order to reinforce the importance of more routine availability of immunization. However, informants were concerned that the abolition may be having significant negative effects on EPI coverage in certain contexts and that continuing to provide immunization through them in some places might be cost effective. The policy of immunizing children without delay at every opportunity was also identified as being in need of study to resolve cost and cost effectiveness issues. Wastage of vaccine doses was seen
10 There was, for example, considerably less diversity in performance among Zambian RHCs and UHCs than within Uganda’s four categories of health centre, where norms seem to be less consistently applied (Guthrie et al 2014).
17
as a major issue by many managers and staff. They noted that application of policy is undermined by non-‐availability of alternatives to large multi-‐dose vials for vaccines. This leads to under-‐budgeting of the number of vials needed for low utilisation days and service sites. Service providers’ fear of vaccine stock-‐outs, and perceptions of high costs of multi-‐dose vaccines, appear to influence practice more strongly than concerns about negative effects for coverage when immunization is delayed.11
3.1.5 Staff capacity and ski l ls to enhance EPI performance
District managers showed encouraging levels of interest and skills in engaging with costing, input and output data to identify ways to achieve more with available resources despite some despondency due to declining and unpredictable funding. Experienced managers also showed capability for interpreting and possibly generating cost and efficiency indicators, and for acting on likely inefficiencies even in the absence of quality data.
However, many less experienced and skilled managers have limited abilities in budgeting, planning and expenditure tracking. High turnover and poor morale of skilled managers and health workers was noted to contribute to these skills deficits, particularly in districts further away from main centres (“away from the railway lines”). These factors contribute to high variability in the quality of plans, budgets and expenditure tracking at facility and district level.12 They also limit the capacity to meet the demands of more effective data collection, analysis and resource management, which affects immunization and decentralized decision making more generally.
Capacity building for planning and management was noted to be a strong feature of the Zambian system, with extensive orientation, mentoring and supportive supervision of lower levels and less experienced managers during the annual Action Planning and budgeting process. However, supportive supervision and mentoring have become more scarce due to limited finances. In addition, no training on the RED immunization planning tools for had occurred for four years, leaving substantial skills gaps.
Other specific capacity gaps that were noted included: • MCH Coordinators at provincial and district level. Demands of responsibilities of in addition to
EPI was reported to often limit their ability to tackle immunization needs. • Accountants. Too few have skills for using FAMS tools to improve budget execution.
Accountants seconded from Ministry of Finance also have limited understanding of links between various health expenditures, functions and priority outputs.
• Community Health Workers and others to whom certain immunization tasks may be shifted. Despite widespread task shifting, skills to take on new tasks, including recording of EPI activities, have not been built systematically.
• Cold chain management expertise. At each level this had been diminished by staff attrition. • Pharmacists. If suggestions are adopted for pharmacists capacity to manage vaccines and
supplies. Alternatively, limited skills of nursing staff for this role will need to be developed further.
3.1.6 Shared values, teamwork and support
11 “ Medical staff have a psychology of rationing and avoid waste” -‐ PMO 12 Wide variability in quality of plans and data was previously noted in the EPIC study and other reviews.
18
Shared values of commitment to service performance, efficiency, teamwork and mutual support can be important facilitators of performance improvement. Staff commitment to EPI services was noted to be an important asset facilitating changes in use of resources. Most districts noted that service staff and CHWs were continuing outreach for immunization, and ensuring that they were on time at service points, even when they could not be assured of receiving their allowances under current financial constraints. The tradition of mentorship and supportive supervision in both the planning process and implementation was identified as an important asset for helping managers to improve system performance. However, the RBF pilot (see below) also indicated that even with explicit incentives and audit, data quality was likely to remain problematic unless there was repeated outreach to facility management combined with experiential learning. Informants noted that diminished finance, particularly for vehicles and transport, were putting supportive supervision and mentorship at risk. The system of incentives created by per dia and travel allowances was noted to play an important role in incentivising staff who undertake outreach and supervisory activities. Informant opinion was divided over whether incentive to do more outreach and travel made the system more expensive and inefficient, or mainly helped to maintain morale, and thus system coverage and performance. Of note, the recent RBF pilot (Freidman et al 2016) suggested that RBF staff incentives of around 10% of guaranteed individual staff salaries were insufficient to enhance provider effort.
3.1.7 Summary Zambia has established planning, budgeting and performance management systems that can facilitate more effective and decentralized decision making, and which have potential to improve efficiency of immunization resource allocation. However, there is limited authority and “decision space” to allow district and facility managers to manage numbers and costs of staff, and other key items such as vaccines and vehicles, which have major influence on costs and performance. Financial, program and performance management systems are in place but do not provide very accessible, reliable and timely data on key aspects of both immunization program performance and the resources allocated to them. In particular, the existing systems place very little emphasis on comparing financial, human and other resources to the output and performance. Overall, the “decision space” is determined not only by formal authority and availability of information. A range of opportunities and constraints also need to be considered in assessing the optimal strategy to enable managers to enhance health system performance. These affect predictability, availability of resources, perceptions of what is feasible, and capacity to collect information, analyze it and act in response to performance issues.
3.2 NEW INITIATIVES AFFECTING THE EPI
Several new, planned and ongoing initiatives may lead to system changes and development which could enhance or, in some cases, disrupt ability to manage the efficiency of immunization programming and delivery.
i) Health Ministry restructuring and Decentralization policy. Integration of MoH and MCDMCH creates potential for more performance management through streamlined planning and
19
information flows, systems and capacity, as well as direct budgetary accountability of districts to MoH planners and managers. Renewed emphasis on decentralization and accountability to Local Councils, if maintained, may create potential for more active management of resources by district managers, however, it is uncertain how much more de-‐concentration and devolution can be anticipated within MoH structures.
ii) Better Immunization Data (BID). The BID project aims to enhance basic EPI data quality and use in Zambia, through technical support and capacity development. Improved facility level management of vaccines stocks and supply is also targeted to complement implementation of an electronic stock management system. Availability and quality of information on EPI outputs, catchment populations and coverage, stocks of vaccines, as well as how many doses are provided through outreach vs facility based services is essential to measure and monitor EPI efficiency. Even without extra cost and finance data, use of such information could improve allocation of available resources and program coverage.
iii) Improving the Financial and Administrative Management System (FAMS). Managers and planners expect that changing routine accounting systems purely to serve immunization program needs would be very difficult. However, the MoH/CHAI initiative to refine the overall FAMS and related tools could allow for more timely and specific budgeting and reporting on expenditure on immunization and other specific programs and activities at district and facility level.
iv) Integration of vaccines supply chain into general medicines supply chain. This creates both potential for improvement in supply chain and stock management at each level, and potential vulnerabilities if the related management, planning and information systems cannot be integrated smoothly.
Results Based Financing (RBF). Zambia has just completed an evaluation of a pilot of RBF in health (Friedman et al 2016). If RBF is rolled out further, there is potential to incorporate enhanced EPI data collection and performance management, and informants. The pilot itself had several findings of relevance to enhancing immunization efficiency. Firstly, RBF appeared to be a cost effective way of improving system performance in a number of areas but results, particularly in MNCH interventions, were mixed. Secondly, the RBF program appeared to be protective of immunization performance, as vaccination coverage declined in control districts but remained constant or slightly higher in RBF districts. However, less reliable budget disbursements (only 56% of budgets) in non-‐RBF districts, rather than the results based incentives themselves, may have explained differences, as suggested by informants in this case study. Thus other, simpler mechanisms of supplementary, earmarked funding to relieve bottlenecks for priority MNCH interventions may be as effective. Thirdly, simpler target-‐based incentives may be more appropriate in high coverage countries like Zambia rather than more onerous fee-‐for-‐service incentives. These systems may enhance performance better than complex systems of financial or efficiency indicators for specific programs such as immunization. Several informants noted that RBF had improved standards of planning at facility and district levels.
4 CONCLUSIONS AND RECOMMENDATIONS – ENHANCING USE OF COST AND
EFFICIENCY INFORMATION TO IMPROVE EPI AND PHC SERVICE PERFORMANCE IN
ZAMBIA
20
4.1 POTENTIAL TO ENHANCE INFORMATION AND MANAGEMENT FOR MORE EFFICIENT
PERFORMANCE
The process to feed back the EPIC comprehensive costing study results showed that it could have a substantial impact on planners’ and managers’ awareness and ability to identify priority costs and efficiency issues, and to identify options for responding. There was also clear potential to use results to support initiatives to maintain or improve performance under the intensified financial constraints facing Zambia. In particular, feedback of costing information, and sharing of ideas by managers and planners, helped them to consider active management of key resources in ways that they had not previously known about. This included management of resources that many may neglect because they feel they are outside of their direct budgetary control (e.gl. staff, vaccines).
Furthermore, managers and planners indicated that while improved routine information on costs and efficiency could enhance resource management, this could take time, effort and resources. In the interim, there was considerable potential to act simply on insights provided by discussion of study results. Importantly, managers at various levels highlighted opportunities and constraints on action which are critical context when considering how to generate and use better information, and the likelihood of impacting on system performance.
4.2 PROCESSES TO FEED BACK COSTING RESULTS AND IDENTIFY AND BUILD POTENTIAL TO RESPOND
The project also resulted in learning about processes for feedback of costing study findings to health managers, and to identify opportunities for action. The experience illustrated the value of a feedback process that engaged with national, provincial and district managers to confirm conclusions and to identify implications. Feedback should aim to develop fit-‐for-‐purpose approaches that translate costing results into actionable information in the context of planning and management arrangements, and district and facility level realities. These observations reinforce findings of previous initiatives of the importance of ensuring that research evidence communication and products are closely related to the “real problems” faced in implementing different policies and programs, and different policymaking and planning cycles (Langlois et al 2016). The experience also suggested that ongoing participatory engagement of managers is desirable to translate information, develop practical management responses and fine tune capacity building tools and exercises to local needs. This was needed especially in view of the limitations on data, systems and skills of managers. Learning from peers was noted to be a key advantage of multi-‐district workshop format for feedback, echoing further findings of Langlois from several countries. These point to benefits of structured processes for peer interaction, particularly for sub-‐national decision makers, to exchange learning-‐by-‐doing experiences and to share “tacit knowledge” across settings and programmatic areas. They also promote iterative approaches to achieve impact: traditional knowledge dissemination activities are mostly conceived as stand-‐alone events, while those addressing complex and changing policymaking environments are more tailored to numerous interactions between research and policy stakeholders.
The framework used to unpack opportunities and constraints, was based on frameworks for analyzing complex systems such as the “ 7Ss” (Waterman and Peters 1980) and “Results-‐Oriented Approach to Capacity Building and Change” (Boesen and Therkildsen 2005) which has more orientation to public sector an development contexts. This has provided greater understanding of potential to enhance
21
service and program performance. Previous analyses in Zambia have tried to assess local ability to manage service efficiency and effectiveness in terms of the concepts of “decentralization” and “decision space”. The former gives limited definition of the specific dimensions of deconcentration of administrative decision making, and mainly considers formal authority to make decisions. The decision space analysis by Bossert (2003) reported that district level managers in the late 1990s had minimal formal authority and space to make decisions about revenue generation, or key costs such as salaries and allowances. They had moderate ability to make decisions overall allowance budgets, fuel and capital items, and service norms and programs. Both analyses gave limited indication of whether decentralized decision making had resulted in more appropriate resource allocation or improved (or worse) performance.
This case study suggests more flexibility than indicated by Bossert to influence performance of specific programs such as immunization, despite limitations on authority over key inputs and systems. However, it also revealed a need for more subtle understanding of constraints on managing immunization performance including limitations on capacity and skills, systems, quality or availability of data, and unpredictability of funding disbursements. This is consistent with previous investigations that highlighted that success in enhancing use of costing and other evidence requires attention to the complex systems involved in organizational settings and procedures, in addition to attending to incentives, governance and enabling environments (OECD 2006). In the Zambian context, costing study results seem to give managers new information and perspectives which can influence practice, despite limitations on their decision space and availability of routine information.
4.3 RECOMMENDATIONS
Recommendations for further action to improve EPI performance with available resources are listed below. They highlight firstly the benefits of leveraging awareness of costing study results and existing opportunities to improve resource use. Secondly, they identify potential actions that can enable Zambia to act more fully on the opportunities to respond to identified inefficiencies. Thirdly they suggest ways in which availability of information can be further improved to refine identification and management of inefficiencies.
In general initiatives should try to address priority system components that have the largest implications for costs, coverage and efficiency. These include: more efficient use and management of outreach; vaccine stock management; allocation of staff and tasks across and within services; and limiting duplication and inefficient placement of service points.
The recommendations also intend to build on and strengthen the use of existing assets and initiatives, to harness synergies that may improve outcomes for immunization and other PHC services too. This is important as district and other stakeholders highlighted the limited capacity and resources available to address a range of pressing health system priorities in Zambia, and that immunization is only one of these.
1. Ensure that costing study results and insights reach managers in more Provinces and Districts. Build on experience and methods initiated in this project to enhance managers’ capacity to identify and respond to inefficiencies and their causes.
22
• Include participatory processes with multi-‐district and peer–driven sharing of innovation and learning, with follow-‐up supportive supervision
• Exercises based on study results can be further developed as inputs into aspects of pre-‐service training, short courses and trainings in use of various financial and other information systems.
2. Learn from and use responses to current budget and financing challenges. Many managers are devising creative ways to maintain immunization service delivery with more limited resources. Some of these may be important new ways to manage efficiency, while others may prove problematic with negative effects for program performance. Both should be documented, monitored and disseminated.
3. Adapt key planning and management systems and tools and strengthen their use.
3.1. Continue emphasis on improving EPI reporting systems and data and increase focus on cost and efficiency related issues. Until quality of EPI output data is considered to be good, measuring and improving program efficiency is difficult. Reliable output and coverage data may often be the most feasible indicators of efficient use of available resources and missed opportunities. Specific consideration should be given to strengthening catchment population estimates to enhance usefulness and credibility of coverage indicators for performance management. Other efficiency-‐related indicators that could become routine include the proportion of doses delivered through outreach activities, and ratios of staff to total doses or DPT3.
3.2. The RED micro-‐planning tool is reported to be overdue for updating and no training has been conducted for four years. Revisions and training can potentially orientate service planners to costing study insights and ways to use resources more efficiently. They can consider indicators that allow for comparison and decision making around resource use, such as: staffing against population size or outputs; the proportions of doses provided through outreach or facility services; and proportions of total coverage provided by outreach sites compared to the resources used to service them. Tools may help managers to apply similar principles to managing other PHC components. However, revisions will have to make realistic extra demands on capacity and resources to support detailed planning of the immunization sub-‐program.
3.3. The FAMS update and roll out should consider EPI functions (and EPI costing study methods and findings) more explicitly in the revision of FAMS charts of accounts and tracing factors for allocating shared costs. Training and supportive supervision should cover EPI cost and efficiency management issues and examples.
3.4. Strengthen stock management systems and information. Stock management and related information systems were highlighted as a challenge to cost management. Include consideration of re-‐defining responsibilities and capacity to enable more active management of wastage and efficiency at each level.
3.5. Promote revitalization of the Performance Assessment system with more resources to facilitate prioritized and targeted reinforcement and follow-‐up, and more active use of immunization indicators. Consider development of an updated dashboard tool for performance management at each level and incorporation of efficiency indicators that consider both inputs and outputs.
23
4. Support use of costing study information in updating of the cMYP. Well-‐developed cMYPs using robust data and integrated into the new National Health Strategic Plan can start to increase efficiency of national level planning, available budget envelopes, and appropriate planning and budgeting information and practices at lower levels.
5. Consider studies to explore potential efficiency implications in different settings of current policies and practices in relation to:
a) Child Health Weeks b) Immunizing children immediately at any opportunity, and its interaction with procurement and
stock management practices. c) Management strategies to reduce costs and cope with funding constraints on outreach and
supervision. Periodic activity based costings in samples of facilities may be useful to explore trends, costs of expanding immunization coverage, and responses to various policy changes.
6. Consider strategies to limit potential for perverse incentives created by travel allowances and per dia. The current lack of funding for allowances may create opportunities for more systematic revision of the system.
Finally, further work should explore which different strategic approaches to efficiency improvement may yield the largest, quickest benefits. For example, focusing on facility and even district level management, can clearly have benefits particularly as part of longer term system strengthening. But given the complexities of responding at those levels, it may not be the optimal short term strategy. Also, even if managers can find and tackle readily identifiable outlier facilities, the limited number and size of outlier facilities, and structural reasons for higher costs in some facilities, may mean that this could have limited impact on overall system costs, efficiency and coverage. There may thus be greater benefit from system wide interventions to, for example, streamline stock management, funding flows or access to transport for supervision and service delivery.
Similarly, routine generation and use of an ambitious, detailed set of cost and output data and indicators may be a difficult way of managing efficiency in the reality of many Zambian districts. The system may itself be inefficient, especially if conceptualized as a stand-‐alone system for immunization rather than part of a general PHC system. So action to improve program performance should not be delayed while such systems are developed and tested. Cruder approaches such as improving reliability of routine EPI indicators, drawing on general insights from periodic costing studies, and focusing on maximizing immunization coverage with available resources, may be more feasible and useful in the short term at least.
24
ACKNOWLEDGEMENTS
Feedback of results to Zambian managers and development of this case study would not have been possible without the support of the Bill and Melinda Gates Foundation, as well as the following colleagues: MCDMCH and MOH programme and service planners and managers, particularly Dr Francis Mwansa, Mrs Josephine Simwinga, Dr Caroline Phiri, Mr Guissimon Phiri; Provincial health management teams from Copperbelt, Central and Lusaka; District management teams from Chokwe, Kafue, Kabwe, Lusaka, Lufwanyama, Masaiti, Mkushi, Ndola and Serenje; Collins Chansa (World Bank) and Dr Penelope Kalesha-‐Musumbu (WHO); Stephen Resch (Harvard School of Public Health) and Logan Brenzel.
ACRONYMS
BID Better Immunization Data project
CSO Central Statistics Office
EPI Expanded Program on Immunization
FAMS Financial and Administrative Management System
FTE Full time equivalent
GAVI Global Vaccines Alliance
IFMIS Integrated Financial Management System
MCDMCH Ministry of Community Development Mother and Child Health
MoH Ministry of Health
WHO World Health Organization
REFERENCES
Boesen N, Therkildsen O. Feb 2005. A Results-‐Oriented Approach to Capacity Change. Ministry of Foreign Affairs Danida www.evaluation.dk Bossert TJ Beauvais JC (2002) Decentralization of health systems in Ghana, Zambia, Uganda and Philippines: a comparative analysis of decision space. Health Pol Plan 17(1) 14-‐41 2002.
Bossert T Chitah MB Bowser D. (2203) Decentralization in Zambia: resource allocation and district performance. Health, Policy and Planning 18(4); 357–369 2003
Castañeda-‐Orjuela C, Romero M, Arce P, Resch S, Janusz CB, Toscano CM, et al. (2013) Using standardized tools to improve immunization costing data for program planning: The cost of the Colombian Expanded Program on Immunization. Vaccine 31:C72-‐C9.
Central Statistical Office (CSO), Ministry of Health et al (2014). Zambia Demographic and Health Survey 2013-‐14. Lusaka: CSO
Friedman J Qamruddin J Chansa C Das AK Nguyen H. (2016) Draft: Impact Evaluation of Zambia’s Health Results-‐Based Financing Pilot Project
25
Griffiths UK Bozzani FM Chansa C Kinghorn A Kalesha-‐ Masumbu P Rudd C Chilengi R Brenzel L Schutte C (2016). Costs of introducing pneumococcal, rotavirus and a second dose of measles vaccine into the Zambian immunisation programme: Are expansions sustainable? Submitted to Vaccine.
Guthrie T Zikusooka CM Kwesigwa B Abewe C Lagony S Brenzel L Humphreys K Motlogelwa K Nombewu ZC Kinghorn AWA. Mapping of Financial Flows for Immunisation in Uganda 2009/10-‐2010/11: New Insights for Methodologies and Policy. Vaccine 33S (2015) A79–A84
Guthrie T Zikusooka CM O’Connell T Kwesiga B Abewe C Lagony S Schutte C Marinda E Humphreys K Nombewu Z Motlogelwa K Kinghorn A. (2014 a -‐ November). Costing and Financing Analyses of Routine Immunization in Uganda. Technical Report to the Bill and Melinda Gates Foundation EPIC I Project.
Guthrie T Zikusooka CM O’Connell T Kwesiga B Abewe C Lagony S Kanoowe S Mayanja R. (2014 b -‐ September). Assessing sub-‐national financial bottlenecks for immunization services: piloting a rapid assessment approach. Maternal, Newborn and Child Health Working Paper. Health Section, Program Division. UNICEF.
Kinghorn A, Schutte C, Marinda E Chansa C. What drives Productivity and Costs of Routine Immunization Services in Zambia? Oral Presentation. International Health Economics Association Congress, Milan July 2015
Langlois EV Montekio VB Young T Song K Alcalde-‐Rabanal J Tran N. (2016) Enhancing evidence informed policymaking in complex health systems: lessons from multi-‐site collaborative approaches. Health Research Policy and Systems (2016) 14:20 DOI 10.1186/s12961-‐016-‐0089-‐0
Ministry of Health (2009) Action Planning Handbook for District Health Teams (5th Edition April 2009). Republic of Zambia, Lusaka.
Ministry of Health (2011). Zambia Comprehensive Multi Year Plan (2011-‐2015): Immunization Vision & Strategy. Lusaka
Ministry of Health (2011b). Action Planning Handbook for Health Centres, Health Posts and Communities (6th Edition). May 2011 Republic of Zambia, Lusaka
Ministry of Health &CHAI (2015) Minutes and Presentation: Strengthening District Systems for Monitoring Financial and Programmatic Performance: Integrated Budgeting and Accounting Tool. FAMS Enhancement Workshop 1st – 2nd March 2016, Gonde Lodge Kabwe,
Ministry of Health (Undated) Reaching Every District in Zambia with High Quality Routine Immunization Services: Health Facility Action Plan.
O'Connell TS, Sharkey A (2013) Reaching universal health coverage: using a modified Tanahashi model sub-‐nationally to attain equitable and effective coverage. New York: UNICEF.
OECD. The Challenge of Capacity Development: Working Towards Good Practice. Paris: OECD; 2006.
Schütte K Kinghorn A Chansa C Marinda E Guthrie T Banda S Humphreys K Nombewu Z Motlogelwa K. (Nov 2014). Costing and Financing Analyses of Routine Immunization in Zambia. Technical Report to the Bill and Melinda Gates Foundation EPIC I Project.
Schutte C Chansa C Marinda E Guthrie T Banda S Nombewu ZC Motlogelwa K Lervik M Kinghorn AWA. Cost Analysis of Routine immunisation in Zambia. Vaccine 33S (2015) A47–A52
Waterman RH Peters TJ Phillips J. Structure is not Organization. Business Horizons. June 1980
WHO. Country statistics 2012, http://apps.who.int/gho/data/node.country.country-‐ZMB
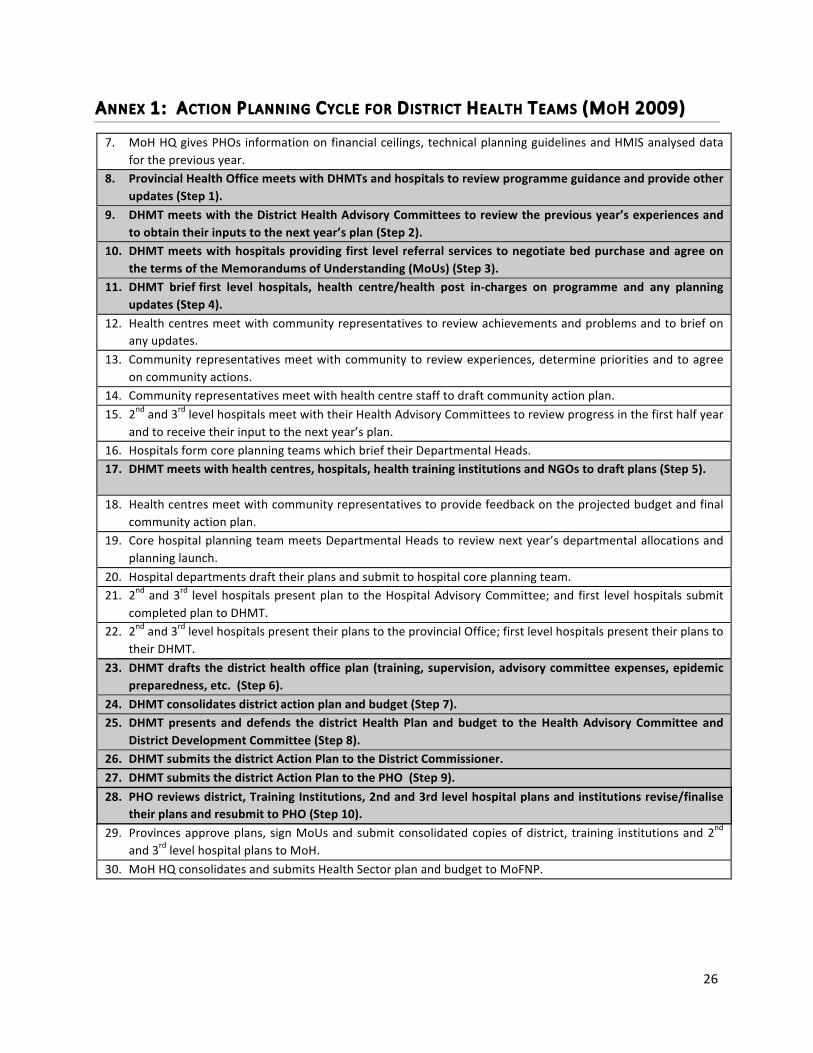
26
ANNEX 1: ACTION PLANNING CYCLE FOR DISTRICT HEALTH TEAMS (MOH 2009)
7. MoH HQ gives PHOs information on financial ceilings, technical planning guidelines and HMIS analysed data for the previous year.
8. Provincial Health Office meets with DHMTs and hospitals to review programme guidance and provide other updates (Step 1).
9. DHMT meets with the District Health Advisory Committees to review the previous year’s experiences and to obtain their inputs to the next year’s plan (Step 2).
10. DHMT meets with hospitals providing first level referral services to negotiate bed purchase and agree on the terms of the Memorandums of Understanding (MoUs) (Step 3).
11. DHMT brief first level hospitals, health centre/health post in-‐charges on programme and any planning updates (Step 4).
12. Health centres meet with community representatives to review achievements and problems and to brief on any updates.
13. Community representatives meet with community to review experiences, determine priorities and to agree on community actions.
14. Community representatives meet with health centre staff to draft community action plan. 15. 2nd and 3rd level hospitals meet with their Health Advisory Committees to review progress in the first half year
and to receive their input to the next year’s plan. 16. Hospitals form core planning teams which brief their Departmental Heads. 17. DHMT meets with health centres, hospitals, health training institutions and NGOs to draft plans (Step 5).
18. Health centres meet with community representatives to provide feedback on the projected budget and final community action plan.
19. Core hospital planning team meets Departmental Heads to review next year’s departmental allocations and planning launch.
20. Hospital departments draft their plans and submit to hospital core planning team. 21. 2nd and 3rd level hospitals present plan to the Hospital Advisory Committee; and first level hospitals submit
completed plan to DHMT. 22. 2nd and 3rd level hospitals present their plans to the provincial Office; first level hospitals present their plans to
their DHMT. 23. DHMT drafts the district health office plan (training, supervision, advisory committee expenses, epidemic
preparedness, etc. (Step 6). 24. DHMT consolidates district action plan and budget (Step 7). 25. DHMT presents and defends the district Health Plan and budget to the Health Advisory Committee and
District Development Committee (Step 8). 26. DHMT submits the district Action Plan to the District Commissioner. 27. DHMT submits the district Action Plan to the PHO (Step 9). 28. PHO reviews district, Training Institutions, 2nd and 3rd level hospital plans and institutions revise/finalise
their plans and resubmit to PHO (Step 10). 29. Provinces approve plans, sign MoUs and submit consolidated copies of district, training institutions and 2nd
and 3rd level hospital plans to MoH. 30. MoH HQ consolidates and submits Health Sector plan and budget to MoFNP.
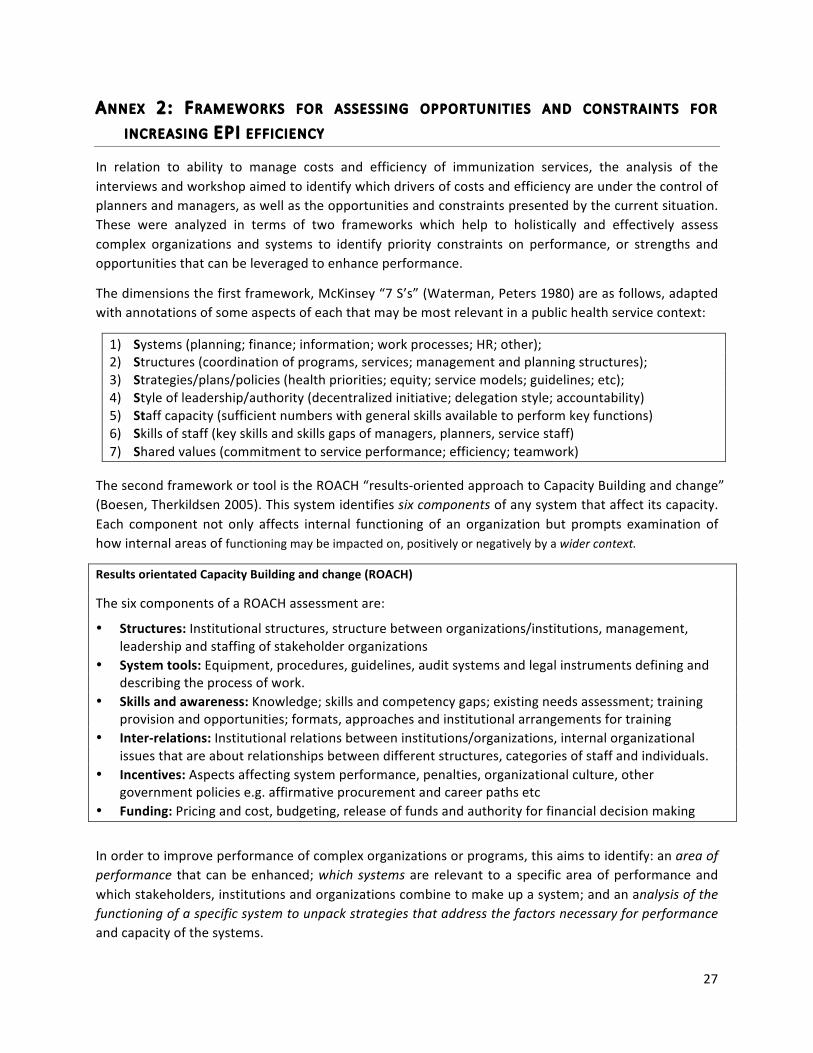
27
ANNEX 2: FRAMEWORKS FOR ASSESSING OPPORTUNITIES AND CONSTRAINTS FOR
INCREASING EPI EFFICIENCY
In relation to ability to manage costs and efficiency of immunization services, the analysis of the interviews and workshop aimed to identify which drivers of costs and efficiency are under the control of planners and managers, as well as the opportunities and constraints presented by the current situation. These were analyzed in terms of two frameworks which help to holistically and effectively assess complex organizations and systems to identify priority constraints on performance, or strengths and opportunities that can be leveraged to enhance performance.
The dimensions the first framework, McKinsey “7 S’s” (Waterman, Peters 1980) are as follows, adapted with annotations of some aspects of each that may be most relevant in a public health service context:
1) Systems (planning; finance; information; work processes; HR; other); 2) Structures (coordination of programs, services; management and planning structures); 3) Strategies/plans/policies (health priorities; equity; service models; guidelines; etc); 4) Style of leadership/authority (decentralized initiative; delegation style; accountability) 5) Staff capacity (sufficient numbers with general skills available to perform key functions) 6) Skills of staff (key skills and skills gaps of managers, planners, service staff) 7) Shared values (commitment to service performance; efficiency; teamwork)
The second framework or tool is the ROACH “results-‐oriented approach to Capacity Building and change” (Boesen, Therkildsen 2005). This system identifies six components of any system that affect its capacity. Each component not only affects internal functioning of an organization but prompts examination of how internal areas of functioning may be impacted on, positively or negatively by a wider context.
Results orientated Capacity Building and change (ROACH)
The six components of a ROACH assessment are:
• Structures: Institutional structures, structure between organizations/institutions, management, leadership and staffing of stakeholder organizations
• System tools: Equipment, procedures, guidelines, audit systems and legal instruments defining and describing the process of work.
• Skills and awareness: Knowledge; skills and competency gaps; existing needs assessment; training provision and opportunities; formats, approaches and institutional arrangements for training
• Inter-‐relations: Institutional relations between institutions/organizations, internal organizational issues that are about relationships between different structures, categories of staff and individuals.
• Incentives: Aspects affecting system performance, penalties, organizational culture, other government policies e.g. affirmative procurement and career paths etc
• Funding: Pricing and cost, budgeting, release of funds and authority for financial decision making
In order to improve performance of complex organizations or programs, this aims to identify: an area of performance that can be enhanced; which systems are relevant to a specific area of performance and which stakeholders, institutions and organizations combine to make up a system; and an analysis of the functioning of a specific system to unpack strategies that address the factors necessary for performance and capacity of the systems.