Inconvenient Truth? Do Collective Bargaining Fall$ WP 2015-1 (Inconvenient Truth).p… ·...
67
The Center for Education Data & Research University of Washington Bothell 3876 Bridge Way N. Ste. 201 Seattle, WA 98103 (206) 5475585 [email protected] www.cedr.us CEDR Working Paper WP 20151 Inconvenient Truth? Do Collective Bargaining Agreements Help Explain the Mobility of Teachers Within School Districts? Dan Goldhaber Center for Education Data & Research, University of Washington Bothell American Institutes of Research Lesley Lavery Macalester College Roddy Theobald Center for Education Data & Research, University of Washington Bothell
Transcript of Inconvenient Truth? Do Collective Bargaining Fall$ WP 2015-1 (Inconvenient Truth).p… ·...

T h e C e n t e r f o r E d u c a t i o n D a t a & R e s e a r c h
U n i v e r s i t y o f W a s h i n g t o n B o t h e l l 3 8 7 6 B r i d g e W a y N . S t e . 2 0 1 S e a t t l e , W A 9 8 1 0 3 ( 2 0 6 ) 5 4 7 -‐ 5 5 8 5 c e d r @ u . w a s h i n g t o n . e d u w w w . c e d r . u s
CEDR Working Paper
WP 2015-‐1
08 Fall
Inconvenient Truth? Do Collective Bargaining Agreements Help Explain the Mobility of Teachers Within School Districts? Dan Goldhaber Center for Education Data & Research, University of Washington Bothell American Institutes of Research Lesley Lavery Macalester College Roddy Theobald Center for Education Data & Research, University of Washington Bothell

Abstract: We investigate patterns of teacher mobility in districts with different collective bargaining agreement (CBA) transfer provisions. We use detailed teacher-level longitudinal data from Washington State to estimate the probability that teachers of varying experience and effectiveness levels transfer out of their schools to another school in the district, to another district, or out of Washington K-12 public schools. We find consistent evidence that within-district transfer probabilities increase with the proportion of disadvantaged students in a school for veteran teachers but decrease with the proportion of disadvantaged students for novice teachers, and that the strength of these relationships is associated with the strength of seniority transfer provisions in CBAs. Specifically, the pattern of veteran teachers leaving disadvantaged schools and novice teachers staying in disadvantaged schools is more pronounced in districts with strong CBA seniority transfer protections. CBA transfer provisions do not, however, appear to be an important factor in teacher transfers out of school districts or the K-12 public school workforce in Washington. Finally, we find some evidence that more effective teachers are more likely to stay in advantaged schools when seniority is not a factor in transfer decisions.
This research was made possible in part by generous support from the Bill and Melinda Gates Foundation, the National Center for the Analysis of Longitudinal Data in Education Research (CALDER), and an anonymous foundation. We thank Josh Cowen, Jason Grissom, Katharine Strunk, and participants in the Causal Inference Working Group at the University of Michigan, the Center for Education Policy Analysis Seminar at Stanford University, and the 2014 Association for Public Policy Analysis and Management Fall Research Conference for helpful comments. We also thank Dylan D’Entremont, Angela Kim, and Christopher Tien for excellent research assistance, as well as the CBA coders without whom this project would not be possible: Rahn Amitai, Shijia Bian, Scott Bohmke, Stephanie Burns, Jonathan Humphrey, Gregory Johnsen, Eric Lei, Hanqiao Li, Yi Li, Wanyu Liu, Xijia Lu, Alex McKay, Courtney Polich, Leah Staub, Annie Saurwein, Bifei Xie, Nancy Xu, Youngzee Yi, and Wenjun Yu. The statements made and views expressed in this paper do not necessarily reflect those of the study’s sponsors, data providers, or the institutions with which the authors are affiliated. Any and all errors are solely the responsibility of the authorr
Suggested citation: Goldhaber, D. Lavery, L., and Theobald, R. (2015). Inconvenient Truth? Do Collective Bargaining Agreements Help Explain the Mobility of Teachers Within School Districts?. CEDR Working Paper 2015-1. University of Washington, Seattle, WA. © 2015 by Dan Goldhaber, Lesley Lavery, and Roddy Theobald. All rights reserved. Short sections of text, not to exceed two paragraphs, may be quoted without explicit permission, provided that full credit, including © notice, is given to the source You can access other CEDR publications at http://www.CEDR.us/publications.html

1
I. Introduction
Over the past decade, federal, state and district policymakers have experimented with a
variety of interventions aimed at addressing concerns about the inequitable distribution of
teacher talent in U.S. public schools.1 Considerable evidence suggests that despite such efforts,
teachers throughout the United States remain inequitably distributed across student subgroups
(racial, income and achievement categorizations) by experience, qualifications, and value-added
measures of performance.2 Washington State, the setting of this study, is no exception.
Disadvantaged (eligible for free/reduced lunch, underrepresented minority, or low-performing)
students are far more likely to be taught by novice and less-qualified teachers than other students
in the state.3
There is a good deal of speculation (e.g., Snell 2014) and some empirical evidence
(discussed below) that transfer protections in teacher collective bargaining agreements (CBAs)
contribute to inequities in the distribution of teachers by influencing patterns in within-district
teacher transfers.4 Many districts—including about 70% of the largest districts in the country
(NCTQ, 2014)5—have teacher CBAs with provisions that protect senior teachers from
involuntary transfers and grant senior teachers advantages over junior teachers when it comes to
1 For instance, the federal government helps college students planning to teach in high need fields in low income areas to finance their educations (Federal Student Aid, June 11, 2014: https://studentaid.ed.gov/types/grants-scholarships/teach) and various states and localities have offered pay differentials for teachers wiling to serve in disadvantaged schools (Clotfelter et al., 2004; Guarino et al., 2006). 2 See, for instance, Clotfelter et al. (2005, 2006), Kalogrides and Loeb (2013), Kalogrides et al. (2013), Lankford et al. (2002, 2003) on the distribution of teacher experience and qualifications and Isenberg et al. (2013) and Sass et al. (2010) on the distribution of value added. 3 In a related paper (Goldhaber et al., 2014), we demonstrate that in Washington State, teacher quality (measured in a variety of ways) is inequitably distributed across a variety of indicators of student disadvantage. 4 Collective bargaining provisions have recently been under the policy microscope. The issues over which districts in several Midwestern states are allowed to bargain was recently limited (Greenhouse, 2011), and in Washington State, the setting for this study, seniority transfer provisions became a key point of contention in a teachers’ strike in the Tacoma School District (Murphy, 2011). Seniority layoff provisions were also a major factor in a recent high-profile court case in Los Angeles (Vergara v. California, 2014). 5 About 25% of districts in the NCTQ database use seniority as the only factor in these decisions (NCTQ, 2014).

2
obtaining a job in another school in the district that has an opening. To the extent that more
senior teachers choose to teach more advantaged students, these seniority transfer protections
may help these teachers move out of less desirable schools (as proxied by student poverty or
minority composition) and stay in more choice placements, and may therefore contribute to the
inequitable distribution of teacher experience within school districts.
Policy debates have spurred and been spurred by a flurry of recent research about
collective bargaining and the distribution of teacher quality. Some empirical evidence in Moe
(2005) and Anzia and Moe (2014a) suggests that teacher transfer provisions in CBAs influence
the inequitable sorting of teachers. But these findings are far from conclusive as other recent
studies (Cohen-Vogel et al., 2013; Koski and Horng, 2007) find little relationship between
seniority transfer protections and the extent of the teacher experience gap between more and less
disadvantaged schools.6 One reason that it is so difficult to know what to make of these
conflicting findings is that while these authors carefully investigate the potential consequences of
a mechanism (within-district teacher transfers), none of them scrutinize the mechanism itself.
That is, the static school-level distributions of teacher experience modeled in the existing
empirical literature may partially be a function of within-district transfers, but may also be
influenced by patterns of teacher hiring, attrition, layoffs, and transfers into and out of the district.
As such, it is not clear whether the findings in the existing literature—significant or otherwise—
are capturing the influence of CBA transfer provisions or other confounding factors.
6 One argument for this non-finding, supported by anecdotal evidence in California, is that “the text of the transfer rules in CBAs does not matter—all school districts may simply honor the assignment preferences of teachers with seniority because the professional culture and practice in California rewards senior teachers with the teaching assignment of their choice” (Koski and Horng, 2007). Stated another way, school district administrators fail to exercise the discretion that they may have (Hess and Kelly, 2006).

3
With this in mind, we use longitudinal data on all teachers from Washington State to
investigate the only outcome that CBA transfer provisions would be expected to influence
directly: within-district teacher transfers. Specifically, we estimate teacher-level logistic
regression models predicting within-district teacher transfer decisions as a function of teacher,
school, and district characteristics. We observe very different mobility patterns for teachers of
different experience levels. All else equal, the probability that a novice teacher transfers from
one school to another school in a district decreases as the percent of economically disadvantaged
and/or underrepresented minority (URM)7 students in the school increases while the same
probability increases for a veteran teacher.
To determine whether these patterns of teacher mobility vary in districts with different
CBA teacher transfer protections, we estimate models that allow the relationship between the
percent of economically disadvantaged or URM students in a teacher’s school and the
probability that a teacher transfers to another school in the district to vary between districts with
different CBA transfer protections. We find consistent evidence that differences in mobility
patterns by teacher experience vary depending on the CBA transfer provisions that govern such
moves. In particular, the interaction between teacher experience and school disadvantage in
teacher transfer decisions is more extreme in districts with strong seniority transfer protections:
novice teachers are even more likely to stay in disadvantaged schools, and veteran teachers are
even more likely to leave disadvantaged schools. These findings are robust to the measure of
student disadvantage we use (URM or free/reduced priced lunch) and to different specifications
of our teacher transfer model,8 and thus provide preliminary but compelling evidence that
7 We define underrepresented minority as black, Hispanic, or American Indian. 8 We describe all specifications in greater details in Section V.

4
seniority transfer provisions in CBAs matter in terms of the movement of teachers within
districts.
This paper proceeds as follows. Section II includes a review and critique of prior work on
CBA seniority transfer protections and teacher mobility. In Section III we outline our theoretical
framework and hypotheses. We describe our data in Section IV, present empirical models and
primary results in Sections V and VI, and discuss a simulation study in Section VII. We then
explore patterns in teacher mobility by estimated effectiveness rather than experience in Section
VIII, investigate a number of extensions and falsification tests in Section IX, and offer some
policy implications and conclusions in Section X.
II. Background
Teacher collective bargaining agreements (CBAs) regulate school district policies on
issues from teacher hiring and transfers, Association rights, and workload to evaluation,
grievance, benefits and leave, and layoffs and recall.9 There is a large literature that documents
the considerable variation in the language of CBAs and describes the potential consequences of
collective bargaining for school and district finances, staffing, and operations.10
Four recent papers (Anzia and Moe, 2014a; Cohen-Vogel et al., 2013; Koski and Horng,
2007; Moe, 2005) have investigated the potential influence of these seniority transfer protections
on the distribution of teacher experience within school districts. We discuss these papers as a
group because their analytic approaches are quite similar. In each paper, the authors estimate
some variant of a model that predicts the percent of experienced teachers in a school (e.g., the
9 In many states CBAs also regulate teacher salaries, but almost all districts in Washington use the state’s salary schedule. 10 For a review of these issues see Goldhaber (2006), Hannaway and Rotherham (2006), Hess and Kelly (2006), Riley et al. (2002), Strunk (2011), and Strunk and Grissom (2010).
5
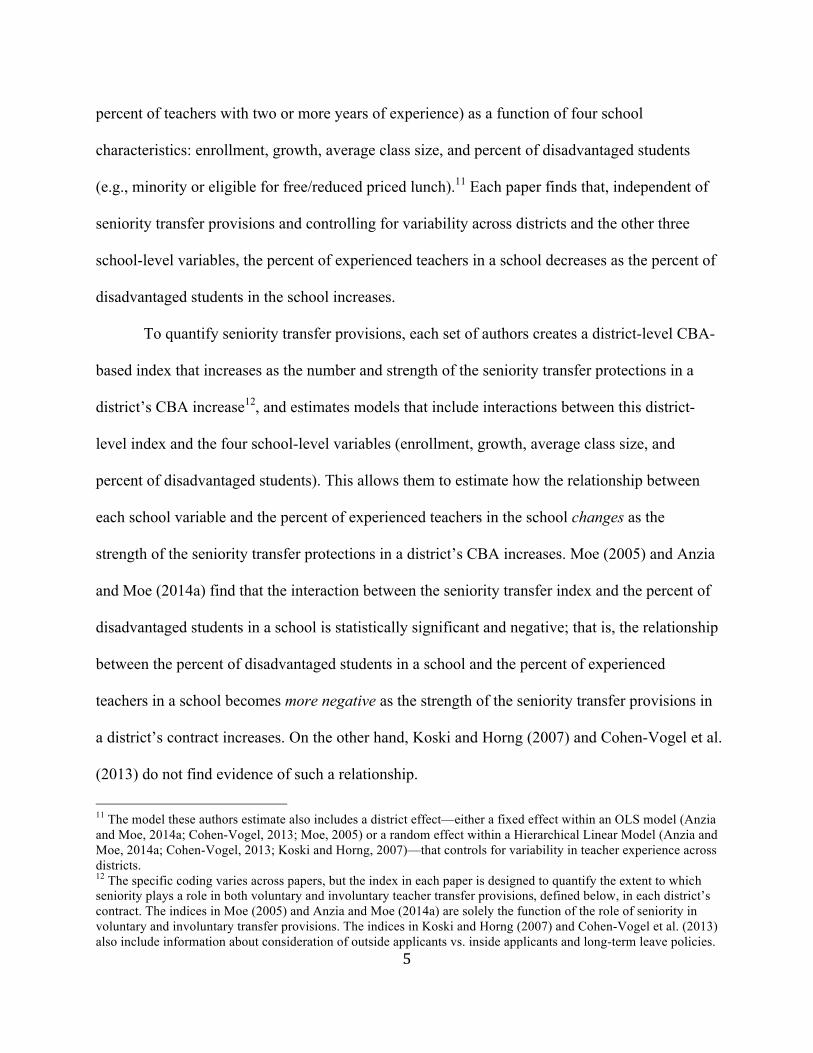
percent of teachers with two or more years of experience) as a function of four school
characteristics: enrollment, growth, average class size, and percent of disadvantaged students
(e.g., minority or eligible for free/reduced priced lunch).11 Each paper finds that, independent of
seniority transfer provisions and controlling for variability across districts and the other three
school-level variables, the percent of experienced teachers in a school decreases as the percent of
disadvantaged students in the school increases.
To quantify seniority transfer provisions, each set of authors creates a district-level CBA-
based index that increases as the number and strength of the seniority transfer protections in a
district’s CBA increase12, and estimates models that include interactions between this district-
level index and the four school-level variables (enrollment, growth, average class size, and
percent of disadvantaged students). This allows them to estimate how the relationship between
each school variable and the percent of experienced teachers in the school changes as the
strength of the seniority transfer protections in a district’s CBA increases. Moe (2005) and Anzia
and Moe (2014a) find that the interaction between the seniority transfer index and the percent of
disadvantaged students in a school is statistically significant and negative; that is, the relationship
between the percent of disadvantaged students in a school and the percent of experienced
teachers in a school becomes more negative as the strength of the seniority transfer provisions in
a district’s contract increases. On the other hand, Koski and Horng (2007) and Cohen-Vogel et al.
(2013) do not find evidence of such a relationship.
11 The model these authors estimate also includes a district effect—either a fixed effect within an OLS model (Anzia and Moe, 2014a; Cohen-Vogel, 2013; Moe, 2005) or a random effect within a Hierarchical Linear Model (Anzia and Moe, 2014a; Cohen-Vogel, 2013; Koski and Horng, 2007)—that controls for variability in teacher experience across districts. 12 The specific coding varies across papers, but the index in each paper is designed to quantify the extent to which seniority plays a role in both voluntary and involuntary teacher transfer provisions, defined below, in each district’s contract. The indices in Moe (2005) and Anzia and Moe (2014a) are solely the function of the role of seniority in voluntary and involuntary transfer provisions. The indices in Koski and Horng (2007) and Cohen-Vogel et al. (2013) also include information about consideration of outside applicants vs. inside applicants and long-term leave policies.

6
These mixed findings could be the result of different study settings (California or Florida),
different estimation strategies (discussed extensively in Anzia and Moe, 2014a), different CBA
coding indices (see footnote 12), or just sampling error. However, each set of authors interpret
their findings (or lack thereof) quite broadly. For example, Anzia and Moe (2014a) conclude that
“seniority-based transfer rules do have consequences for the distribution of teachers and for the
plight of disadvantaged schools”, while Koski and Horng (2007) reach a very different
conclusion: “merely changing the language of the rules of teacher assignment in CBAs will do
little to close the teacher quality gap.”13
Our view is that the evidence from this emerging literature does not yet justify such broad
conclusions. The implied assumption underlying these conclusions is that, if the relationship
between the percent of disadvantaged students in a school and the percent of experienced
teachers in a school is more extreme in districts with CBA seniority transfer protections, then
seniority transfer protections must be causing this inequity (or alternatively, that seniority
transfer protections have no effect if this relationship does not exist). This assumption is
problematic for several reasons. First, the distribution of teacher experience in a district is a
function of many factors—patterns of teacher hiring, attrition, layoffs, transfers into and out of
the district, etc.—that are not accounted for in any of the models described above.14 Second,
while it is true that seniority transfer protections in CBAs may have an indirect effect on the
distribution of teacher experience in a district, this indirect effect should operate primarily
13 This debate recently continued in a published response to Anzia and Moe (2014a) by Koski and Horng (2014), and a response to Koski and Horng’s response by Anzia and Moe (2014b) 14 For example, if districts with strong seniority transfer provisions are also more likely to hire novice teachers into disadvantaged schools than districts that do not use seniority in transfer decisions, then the distribution of teacher experience will be more inequitable in districts with strong seniority transfer provisions even if these provisions have no effect on teacher transfer decisions.

7
through the influence of seniority transfer protections on within-district teacher transfers.15 In the
absence of evidence connecting seniority transfer protections to the only process they are
designed to influence—within-district teacher transfers—it is a leap to conclude that these
protections do or do not have an effect on the overall distribution of teacher experience in a
district.
With these considerations in mind, we ground our analysis in the literature on teacher
mobility (e.g., Goldhaber et al., 2010; Hanushek et al., 2004; Scafidi et al., 2007), which has
demonstrated that teachers are far more likely to leave disadvantaged schools, particularly
schools with a high percent of minority students. Our contribution to this literature is to
investigate the role that seniority transfer protections in CBAs play in this process. Specifically,
we ask whether teachers (and particularly experienced teachers) are even more likely to transfer
from disadvantaged schools in districts with CBAs containing strong seniority transfer
protections than comparable teachers in districts without such strong protections. There is
currently no empirical evidence on this topic, which is surprising given the prominent battles
over these provisions in districts across the country (see Moe, 2011) and concern in policy circles
that seniority transfer provisions undermine the ability of disadvantaged schools to retain highly-
qualified teachers (Levin et al, 2005). Moreover, recent evidence (Barnes et al., 2014; Hanushek
and Rivkin, 2013; Ronfeldt et al., 2013) suggests the “churn” of teachers within and across
school districts creates “disruption costs” to student learning that are independent of the quality
of the incoming and outgoing teachers. This implies that seniority transfer provisions could have
ramifications beyond the distribution of teacher experience within districts.
15 As we discuss in Section VII, there are also reasons to believe that CBA transfer provisions could have an indirect effect on teacher attrition from the district or teaching profession, if (for example) teachers view transfer provisions as restricting their in-district job options.

8
III. Theoretical Framework and Hypotheses
Before discussing our data and analytic models, we first present our theoretical
expectations of the relationships between CBA transfer provisions and within-district teacher
mobility. These relationships can be captured by interactions between three variables: the level
of disadvantage in a teacher’s school; the teacher’s experience level; and the transfer provisions
in the district’s CBA.16 Because the nature of the relationships between these variables is
complex, we have set up a conceptual model to clarify our expectations about how seniority
transfer provisions might differentially influence the mobility of teachers with different levels of
seniority at schools serving different types of students.
Before introducing the specifics of our conceptual model, we draw attention to another
important factor that distinguishes our study from existing empirical work on CBA transfer
provisions (Anzia and Moe, 2014a; Cohen-Vogel et al., 2013; Koski and Horng, 2007; Moe,
2005). Here and throughout the paper, we separately consider the CBA provisions that govern
voluntary and involuntary transfers. We view this distinction as essential because voluntary and
involuntary provisions inform different personnel decisions. Voluntary transfer provisions are
important when there is an open teaching position and more than one teacher from the district
wants to voluntarily transfer into the position. In districts with CBAs that identify seniority as the
only factor in voluntary teacher transfer decisions, for example, the teacher with the most
seniority who wants to voluntarily transfer into a position gets priority.17 Involuntary transfer
16 In this section we ignore other variables that influence teacher transfer decisions, but introduce these when describing our empirical strategy. 17 Voluntary transfer provisions often read like the following example from Clover Park School District: “An employee interested in a transfer of assignment will submit a written request to the Human Resources Office as early as practicable, stating as specifically as possible the desired transfer, including preferred subject(s), building(s), and

9
protections, on the other hand, are important when a position must be moved to another school.18
In districts with CBAs that identify seniority as the only factor in involuntary teacher transfer
decisions, the teacher with the least seniority is selected to be involuntarily transferred if more
senior teachers elect not to move. Below we describe a conceptual model of voluntary transfers
in terms of teacher preferences.19
We define pijkt as the probability that teacher i in school j, district k, and year t transfers to
another school in the district the following year (relative to staying in the same school). We will
use the log odds of this probability,
€
lnpijkt
1− pijkt
#
$ % %
&
' ( ( , as our outcome variable in all of our primary
models. We further define DVGjt as the percent of “disadvantaged” students in school j and year t.
In what follows, we can think about DVGjt being standardized to have mean 0 and standard
deviation 1, meaning that DVGjt = 0 for an “average” school and that a one unit change in DVGjt
represents a one standard deviation change in the percent of disadvantaged students in the school.
As a starting point, consider the following conceptual model of the relationship between DVGjt
and pijkt:
grade level(s). Requests for transfer will be kept on file for consideration until the beginning of the next school year, (Clover Park, 2002-2004). Most then go on to specify how experience factors into voluntary transfer decisions. 18 Though a majority of contracts with involuntary transfer provisions stipulate that such transfers will occur when changes in enrollment necessitate movement, a significant minority of contracts also specify that teachers may be involuntarily relocated in the case of irresolvable conflicts between coworkers. The Puyallup bargaining agreement provides a typical example of contract language stipulating the necessity for involuntary transfer due to changing enrollments: “An involuntary transfer shall mean a transfer necessitated by an elimination or reduction in program, declining student enrollment, closure of schools, changes in school boundaries or reduction in staffing ratio,” (Puyallup, 2008-2010). The University Place collective bargaining agreement illustrates contract language designed to address conflict: “The exception to the least senior employee being involuntarily transferred is in the case of an irresolvable conflict between co-workers which has a substantial negative impact on the learning or work environment of the site. In such a case, a more senior employee may be involuntarily transferred provided that the employee is accorded a process including interest based problem solving, mediation assistance, and formal direction by the district in a timely manner,” (University Place 2007-2008). 19 See Boyd et al. (2013) for a more detailed discussion about disentangling teacher and administrator preferences in the context of a two-sided matching model for teacher hiring.

10
€
lnpijkt
1− pijkt
#
$ % %
&
' ( ( = α0
* +α1*DVG jt +εα*ijkt (1)
Figure 1 illustrates the interpretation of the coefficients in equation 1 and our hypothesized
results. The intercept
€
α0* is the expected log odds that a teacher in an “average” school transfers
to another school in the district, while the coefficient
€
α1* is the expected change in this outcome
for each standard deviation increase in the percent of disadvantaged students in the school. As
noted above, the existing literature on teacher mobility (e.g., Goldhaber et al., 2010; Hanushek et
al., 2004; Scafidi et al., 2007) has shown that teachers are more likely to transfer from
disadvantaged schools (shown on the right of Figure 1) than advantaged schools (shown on the
left of Figure 1). We therefore expect that
€
α1* > 0.
But the relationship between the level of disadvantage in a school and the probability of
teacher transfer is likely to be different for novice and veteran teachers (Koski and Horng, 2007;
Hess and Kelly, 2006). So, for the purposes of our theoretical model, we introduce VETit as a
binary indicator for whether teacher i in year t is a “veteran” teacher.20 Now consider the
following two-way interaction model with DVGjt and VETit:
€
lnpijkt
1− pijkt
#
$ % %
&
' ( ( = β0
* + β1*DVG jt + β2
*VETjt + β3*DVG jt ×VETjt +ε β *ijkt (2)
Figure 2 illustrates the interpretation of the coefficients in equation 2 and our hypothesized
results. The coefficient
€
β1* represents the relationship between the percent of disadvantaged
students in the school and the log odds of teacher transfer for novice (non-veteran) teachers,
while
€
β2* is the expected difference in the log odds of teacher transfer between veteran teachers
and novice teachers in an average school (DVGjt = 0). Finally, the coefficient on the two-way
20 We will allow teacher experience to be continuous in the next section.

11
interaction,
€
β3* , is the expected change in the relationship between the percent of disadvantaged
students in the school and the log odds of teacher transfer for veteran teachers relative to novice
teachers.
We expect that teachers of all experience levels (including novice teachers) seek to move
out of disadvantaged schools, so our expectation is that
€
β1* > 0 . The existing literature on teacher
mobility (discussed in Section II) has also shown that novice teachers tend to transfer more often
than veteran teachers, so we expect that
€
β2* < 0 . Finally, existing evidence on district policies and
culture suggests that, regardless of specific CBA transfer provisions, veteran teachers have
considerably more ability to pursue “desirable” teaching positions—by remaining in advantaged
schools or transferring out of disadvantaged schools—than novice teachers (see Koski and Horng,
2007). The consequence is that the relationship between the percent of disadvantaged students in
a school and probability of transfer should be more positive for veteran teachers than novice
teachers. We therefore hypothesize that
€
β3* > 0 (the resulting relationships are shown in Figure 2).
The goal of our analysis is to examine the role of CBA transfer provisions in this process.
Therefore in our final conceptual model we introduce a binary variable SENkt that indicates
whether the CBA provisions regulating teacher transfers in district k and year t specify that more
senior teachers have a contractual advantage in transferring to a school in the case of a job
opening for which they are qualified. Again, here we are focused on voluntary transfer
provisions. The reference category is CBAs that do not address seniority in voluntary transfer
decisions.21 We present a three-way interaction model with DVGjt, VETit, and SENkt:
21 We will elaborate on the more specific ways that CBAs might advantage teacher seniority in the next section.

12
€
lnpijkt
1− pijkt
#
$ % %
&
' ( ( = γ 0
* +γ1*DVG jt +γ 2
*VETjt +γ 3*DVG jt ×VETjt
+γ 4*SENkt +γ 5
*DVG jt × SENkt +γ 6*VETjt × SENkt
+γ 7*DVG jt ×VETjt × SENkt +εγ*ijkt
(3)
Figure 3 provides the graphical interpretation of the coefficients of interest in equation 3. We
focus specifically on the coefficients
€
γ 5* and
€
γ 7* . The coefficient
€
γ 5* describes how the
relationship between the percent of disadvantaged students in a school and probability of transfer
changes for novice teachers between districts that either consider or do not use seniority in
transfer decisions. In districts with CBAs that use seniority in voluntary transfer decisions, we
hypothesize that novice teachers should have less “leverage” to leave undesirable teaching
positions (i.e., disadvantaged schools). We therefore hypothesize that
€
γ 5* < 0.
Finally, the three-way interaction coefficient
€
γ 7* describes how the interaction between
teacher experience and percent of disadvantaged students (i.e.,
€
β3* in equation 2) changes
between districts that do and do not use seniority in teacher transfer decisions. We have already
hypothesized that, across all districts, this interaction is positive; that is, the relationship between
the percent of disadvantaged students in a school and probability of transfer will be more
positive for more veteran teachers than novice teachers. But we further hypothesize that this
relationship will be even more positive in districts that use seniority in teacher transfer provisions
than in districts that do not. In other words, in districts with CBAs that use seniority in voluntary
transfer decisions, we hypothesize that veteran teachers should have more “leverage” to transfer
out of disadvantaged schools,
€
γ 7* > 0.
Our discussion to this point has focused solely on voluntary transfers, but we argue that
the relationships in Figures 1-3 should hold for involuntary transfers as well. Involuntary

13
transfers are not initiated by teacher preference—instead, they occur for administrative reasons
like position reductions—but in districts that use seniority in involuntary transfer decisions,
teacher preferences still play an important role. That is, when a position must be eliminated,
teachers with the least seniority are selected to be transferred only if more senior teachers opt not
to move. Because of the well-documented teacher preferences discussed above, we hypothesize
that this is more likely to happen in advantaged schools than in disadvantaged schools. Therefore,
we argue that in districts with CBAs that use seniority in involuntary transfer decisions, novice
teachers should have less “leverage” to stay in advantaged schools (i.e., the left side of Figure 3),
while veteran teachers should have more leverage.
Teacher effectiveness
Transfer provisions in CBAs are designed to operate through teacher experience, so the
conceptual models above focus on experience as the teacher characteristic of interest. The
distribution of teacher effectiveness, however, may be just as important. We might expect the
relationships between teacher effectiveness, CBA transfer provisions, and the patterns of within-
district teacher transfers to reflect the findings on teacher experience given the well-documented
correlation between teacher experience and effectiveness, particularly early in a teaching career
(e.g., Rice, 2013; Rivkin et al., 2005; Rockoff, 2004). On the other hand, while correlated,
teacher experience and effectiveness are certainly not synonymous (Atteberry et al., 2013), and
effective teachers in districts that do not use seniority in teacher transfer decisions may have
more leverage to pursue “desirable” teaching positions than effective teachers in districts in
which all transfer decisions must defer to seniority.22 If true, this would suggest a relationship
between effectiveness, transfer decisions, and seniority transfer provisions that differs from what 22 Similarly, administrators may have more ability to protect effective teachers from involuntary transfers when seniority is not used in transfer decisions.

14
we see when experience is the teacher characteristic of interest. Given our unclear expectations
about the interaction between effectiveness and transfer provisions in teacher mobility decisions,
in the first extension to our main analyses – Section VIII - we investigate these relationships.
We discuss potential policy implications of these results in our concluding remarks.
IV. Data
To test the theoretical expectations set forth in Section III, we utilize data on teachers and
contracts in Washington State, compiled from two sources: administrative data on individual
teachers, schools, and districts maintained by the Washington State Office of the Superintendent
of Public Instruction (OSPI); and contract data from the teacher CBAs from all 270 school
districts in Washington that have collective bargaining agreements.23 Our combined dataset
includes information on all public schools and teachers in Washington State from the 2005-06
school year through the 2012-13 school year, linked to the CBA transfer provisions that
regulated teacher transfers in that district and school year. We discuss each source of data below,
and then provide some descriptive statistics for our data before proceeding to our primary
analysis.
Longitudinal teacher and school data
Washington State’s S-275 database provides annual demographic information such as the
gender, race, experience, and degree level of each teacher for every public school employee in
the state, linked to the school(s) and district(s) where each employee worked. These data are
linked to teacher certification and endorsements data that include every endorsement that each
23 Only 270 of the states 295 school districts have CBAs. The remaining 25 districts in the state are generally extremely small (the average enrollment of the 25 districts is 100 students).

15
teacher has on his or her credential (i.e., the subjects that each teacher is endorsed to teach).24 We
limit this dataset to one observation per public school teacher per year, keeping only individuals
with a teaching assignment of greater than 50% (and the location of that teaching assignment).
For our teacher-level analysis, we create indicators for whether each teacher in the state stayed in
the same school, transferred to a different school within the same district, transferred to a
different school outside the district, or left the Washington State teaching workforce the
following year.25 Unfortunately, it is not possible to determine from our data whether a within-
district transfer is voluntary or involuntary. We address this shortcoming in our data in the next
section.
We link the above teacher information from the S-275 to data on a number of variables
about each teacher’s school, reported in Washington State’s School Report Card. We collect data
on the total enrollment, annual growth, and percent of disadvantaged students—eligible for
free/reduced priced lunch (FRL) or underrepresented minorities (URM)—in the teacher’s school,
as these variables have been shown to influence the likelihood of a teacher transferring out of
schools (Goldhaber et al., 2010; Hanushek et al., 2004; Scafidi et al., 2007).26 We also consider
the level of the teacher’s school (elementary, middle, or high) since research suggests that
teacher mobility patterns differ across different types of schools (Goldhaber et al., 2011).
Finally, we calculate three district-level variables intended to measure school
disadvantage: the district log enrollment; the percent of disadvantaged (URM or FRL) students
24 The state’s Professional Educator Standards Board (PESB) also supplied comprehensive data on individual teacher layoff notices that allow us to include an indicator of whether each teacher received a layoff notice during the school year, which is clearly an important variable that can influence teacher transfer decisions. For more background on teacher layoffs in Washington State, see Goldhaber and Theobald (2013). 25 A small percentage (less than 1%) of teachers move into non-teaching positions the following year, so we drop these teachers from the analysis. 26 We stress that these variables are only proxies for workplace conditions, as many disadvantaged schools may have strong administrators, school cultures, and district support that make them desirable workplaces, and many advantaged schools may present other undesirable working conditions.
16
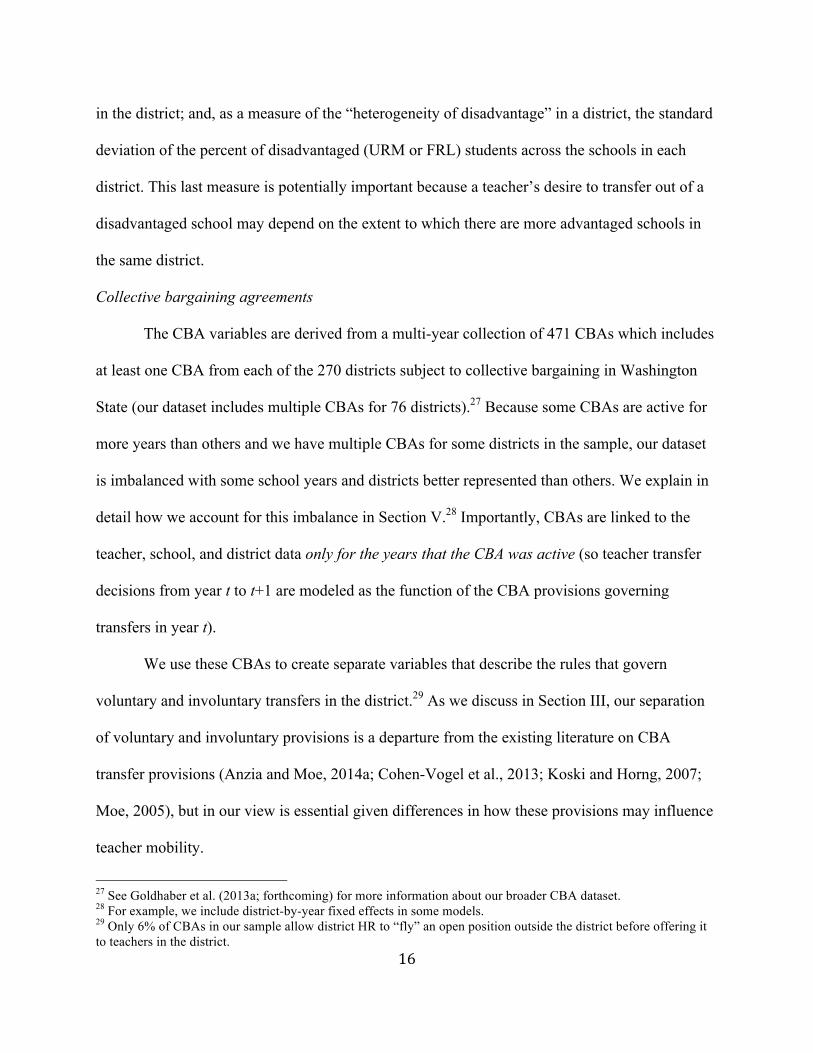
in the district; and, as a measure of the “heterogeneity of disadvantage” in a district, the standard
deviation of the percent of disadvantaged (URM or FRL) students across the schools in each
district. This last measure is potentially important because a teacher’s desire to transfer out of a
disadvantaged school may depend on the extent to which there are more advantaged schools in
the same district.
Collective bargaining agreements
The CBA variables are derived from a multi-year collection of 471 CBAs which includes
at least one CBA from each of the 270 districts subject to collective bargaining in Washington
State (our dataset includes multiple CBAs for 76 districts).27 Because some CBAs are active for
more years than others and we have multiple CBAs for some districts in the sample, our dataset
is imbalanced with some school years and districts better represented than others. We explain in
detail how we account for this imbalance in Section V.28 Importantly, CBAs are linked to the
teacher, school, and district data only for the years that the CBA was active (so teacher transfer
decisions from year t to t+1 are modeled as the function of the CBA provisions governing
transfers in year t).
We use these CBAs to create separate variables that describe the rules that govern
voluntary and involuntary transfers in the district.29 As we discuss in Section III, our separation
of voluntary and involuntary provisions is a departure from the existing literature on CBA
transfer provisions (Anzia and Moe, 2014a; Cohen-Vogel et al., 2013; Koski and Horng, 2007;
Moe, 2005), but in our view is essential given differences in how these provisions may influence
teacher mobility.
27 See Goldhaber et al. (2013a; forthcoming) for more information about our broader CBA dataset. 28 For example, we include district-by-year fixed effects in some models. 29 Only 6% of CBAs in our sample allow district HR to “fly” an open position outside the district before offering it to teachers in the district.

17
Slightly fewer than half of the 471 CBAs in our collection address seniority as a factor in
voluntary transfer decisions, and slightly more than half address seniority as a factor in
involuntary transfer decisions (see Table 1).30 For CBAs that address seniority as a factor in
teacher transfer decisions, we organize seniority language into one of four categories.31 First,
some districts explicitly state that seniority is prohibited from use in transfer decisions. Second,
some districts identify seniority as one of several factors in transfer decisions. Third, some
districts state that seniority will be a tiebreaker in transfer decisions; that is, if all else is equal
between two teachers, then seniority becomes the deciding factor. Finally, some districts identify
seniority as the only factor in teacher transfer decisions.32 In another departure from the
published literature on CBA transfer protections (Anzia and Moe, 2014a; Cohen-Vogel et al.,
2013; Koski and Horng, 2007; Moe, 2005), we do not attempt to aggregate these categories into
a single index for each district.33
Descriptive picture of dataset
Our teacher-level dataset (used in all of our primary analyses) consists of 190,469
teacher/year observations, and 61,102 unique teachers.34 The first three columns of Table 1
contain summary statistics for the variables in this dataset (which will serve as control variables
in the teacher transfer models described in Section IV), calculated at the teacher, school, and 30 Most CBAs in Washington State define seniority as in-state teaching experience (as used in the state salary schedule). However, some districts define seniority (for the purposes of teacher transfer protections) as within-district teaching experience. Since state and district teaching experience are highly collinear (r = 0.71), we only include state experience in our analyses, but see little difference in our results when we use district experience. 31 Unlike in Koski and Horng (2007), we do not observe any CBAs in Washington State that grant “bumping” privileges that allow senior teachers to bump a less-senior from a position without administrative need. 32 There are gray areas in this coding scheme, so two individuals coded each CBA independently, and then the coders worked together with the authors to reconcile their coding decisions. The average inter-rater reliability in the first round of coding was 0.62, which is generally considered “good” agreement (Altman, 1991). For more information about the coding process, see Goldhaber et al. (2013a) 33 Although these categories are ordinal, and thus represent increasing roles of seniority in transfer decisions, there is no theoretical reason to believe that they have a linear relationship to transfers. 34 4.80% of the teachers in our dataset transfer to another school in the same district the following year, which is considerably lower than the figure reported for North Carolina (11.88%) in Goldhaber et al. (2010).

18
district levels. The distribution of seniority transfer provisions across CBAs is summarized in the
final column of Table 1. It is relatively rare for seniority to be the only factor in voluntary
transfer decisions (4.9% of CBAs), but more common for seniority to be the only factor in
involuntary transfer decisions (12.3% of CBAs). Table 2 summarizes the percent of CBAs with
each combination of voluntary and involuntary transfer protections. Perhaps surprisingly, 38% of
the CBAs in our collection do not address the role of seniority for either voluntary or involuntary
transfer decisions. On the other end of the spectrum, 1.3% of CBAs address seniority as the only
factor for both voluntary and involuntary transfers.35
Descriptive picture of teacher moves by CBA transfer protections
Before describing our analytic models, we take a closer look at patterns in teacher
transfers across two categorical variables: teacher experience levels (0-2 years, 2-5 years, 5-10
years, and 10+ years); and our coding of CBA transfer provisions (described in the previous sub-
section).36 Table 3 presents rates of teacher transfers for each combination of these variables.
Across all districts, the probability that a teacher stays in the same school the following year
increases with teacher experience. In fact, regardless of the text of the district’s seniority transfer
provisions, novice teachers are more likely to transfer to another school in the same district,
transfer to a school in a different district, and leave the in-state teaching workforce than teachers
with greater experience.
The characteristics of the “sending” and “receiving” schools for within-district transfers
may also influence the relationship between within-district teacher transfers and the distribution
35 There are also other combinations of protections that are relatively rare (for example, no CBA in our collection specifies seniority as the only factor in voluntary transfer decisions but prohibits the use of seniority in involuntary transfer decisions). 36 We use categories of experience in Tables 3 and 4 to provide a descriptive look at transfers, but transition to a continuous measure of teacher experience in the next section.

19
of teacher experience within a district. That is, the pattern of teacher transfers that we
hypothesize in Section III will only influence the distribution of teacher experience within a
district if, on average, teachers who choose to transfer tend to go to more advantaged schools.
Table 4 gives the average standardized percent URM (standardized across all schools in the state
each year) of the sending and receiving schools of teachers who transfer to another school within
the district (our findings are qualitatively similar if we use FRL instead of URM). The first panel
shows these averages by experience level across all districts. The first point to note is that the
average standardized percent URM of the sending schools is positive for each experience level;
teachers who transfer within districts tend to transfer from schools with higher percentages of
URM students than the average school in the state. Second, the difference in standardized
percent URM between the receiving and sending schools is negative and significant for each
experience level indicating that teachers who transfer to another school in the same district tend
to transfer to a school with a lower percent of URM students; this is consistent with the existing
empirical literature on flow of teachers and the distribution of teacher credentials (e.g., Hanushek
et al., 2004; Lankford et al., 2002; Scafidi et al., 2007).
The remaining two panels of Table 4 break down the average standardized percent URM
of the sending and receiving schools for within-district transfers by CBA seniority transfer
protection categories, for voluntary and involuntary transfers. Consistent with the above findings,
the differential in standardized URM is generally negative across different types of protections.
However, just as our theoretical framework does not consider the characteristics of receiving
schools, the analytic models we describe in the next section only consider the characteristics of
sending schools as predictors of teacher mobility. Modeling the characteristics of both sending
and receiving schools would require a two-sided matching model (e.g., Boyd et al., 2013) that is

20
beyond the scope of this paper. Therefore, the patterns in Table 4 simply help us quantify the
extent to which teacher transfers might influence the distribution of teacher experience (see
Section VII).
V. Analytic Models
We now extend the theoretical models described in Section III to take advantage of the
detailed, longitudinal data we describe in Section IV.37 For our primary teacher transfer models,
we limit the teacher-level dataset to teachers who return to the same school district the following
school year.38 We also introduce a vector of control variables CONijkt that includes the other
variables summarized in Table 1, as well as indicators for the contract year of the district’s CBA
(i.e., the first year the contract was in place, the second year the CBA was active, etc.) and each
individual school year. There are good reasons to believe that each of these variables may
influence teacher transfer decisions (and may be correlated with our variables of interest), so we
include them in all models to reduce confounding.
Because transfer rates vary so widely for teachers of different experience levels (shown
in Table 3), we also control for teacher experience in all of our models. We consider a number of
parameterizations of teacher experience, including a linear term and indicators for teacher
experience levels (i.e., the four experience levels used in Table 3).39 However, we find that the
best logistic regression model fit results from using the natural log of teacher experience at the
37 Ideally, we would like to exploit changes in CBA seniority transfer provisions within a district to estimate the impact of these provisions. However, not enough districts modified the transfer language in their CBA during the years of our study to justify this approach. 38 This drops teachers who transfer to another district or who leave the in-state teaching workforce, but we also estimate separate models for these outcomes, and report these results in section VI. 39 Results that use other these these parameterizations of teacher experience are qualitiatively similar and available from the authors upon request.

21
end of the year (so first-year teachers have a value of zero). We therefore include the natural log
of the experience of teacher i at the end of year t, ln(EXPit), in all models.
Our first teacher transfer model, then, is analogous to the theoretical model described in
equation 1, but with a number of additional control variables:
€
lnpijkt
1− pijkt
#
$ % %
&
' ( ( = α0 +α1DVG jt +α2 ln(EXPij ) +α3CONijkt +α t +εα ijkt (4)
The coefficient of interest in equation 4,
€
α1, describes the expected change in the log odds of a
within district transfer for each standard deviation increase in the percent of disadvantaged
students in the teacher’s school, controlling for variation by year and observable teacher, school,
and district characteristics.40
When we allow this relationship to vary for teachers of different experience levels by
including a two-way interaction, as in the theoretical model described in equation 2, we also
allow the relationships for all the other variables in the model to vary by experience level:
€
lnpijkt
1− pijkt
#
$ % %
&
' ( ( = β0 + β1DVG jt + β2 ln(EXPij ) + β3DVGjt × ln(EXPij )
+β4CONijkt + β5CONijkt × ln(EXPij ) + βt +ε β ijkt
(5)
The coefficients of interest in equation 5 are
€
β1, which describes the relationship between the
percent of disadvantaged students in a teacher’s school and the log odds of within-district
transfer for first-year teachers, and
€
β3 , which describes how this relationship changes as teacher
experience increases, controlling for interactions with other variables in the model.
40 There are good reasons to believe that the relationship between school disadvantage and probability of transfer is non-linear. For example, this relationship may be more extreme for more disadvantaged schools (i.e., beyond a “tipping point”: see Clotfelter (1976).) We test this possibility by estimating a model that includes quintiles of the Percent URM distribution and interactions between these quintiles and the continuous measure of Percent URM. None of the quintiles or interactions is statistically significant, meaning that there is little evidence of discontinuities or non-linearities in the relationship between school disadvantage and probability of transfer.

22
Finally, when we incorporate CBA transfer provisions into this model—as in the
theoretical model described in equation 3—we now consider all five categories of CBA transfer
provisions discussed in Section IV. We define CBAkt as a vector of indicators for the category of
CBA transfer provision in district k and year t, leaving “seniority not addressed” as the reference
category. The resulting three-way interaction model is as follows:41
€
lnpijkt
1− pijkt
#
$ % %
&
' ( ( = γ 0 +γ1DVG jt +γ 2 ln(EXPij ) +γ 3DVGjt × ln(EXPij )
+γ 4CBAkt +γ 5DVG jt × CBAkt +γ 6 ln(EXPij ) × CBAkt+γ 7DVG jt × ln(EXPij ) × CBAkt
+γ 8CONijkt +γ 9CONijkt × ln(EXPij ) +γ10CONijkt × CBAkt +γ t +εγ ijkt
(6)
In equation 6,
€
γ 5 and
€
γ 7, are now vectors of coefficients (since CBAkt is a vector), but they are
still analogous to the corresponding coefficients in the theoretical model described in equation 3.
The coefficients in
€
γ 5 describe how the coefficient
�
β1 in equation 5—the relationship between
the percent of disadvantaged students in a school and probability of transfer changes for novice
teachers (i.e., teachers with one year of experience at the end of the year)—changes between
districts with different CBA transfer provisions. Likewise, the coefficients in
€
γ 7 describe how the
interaction between teacher experience and percent of disadvantaged students (i.e.,
€
β3 in
equation 5) changes between districts with different CBA transfer provisions. Importantly, we
estimate and present results from the model in equation 6 separately for voluntary and
involuntary CBA transfer provisions (i.e., one specification with CBAkt containing indicators for
CBA voluntary transfer provisions and another specification with CBAkt containing indicators for
CBA involuntary transfer provisions).
41 Following the existing literature on CBA transfer provisions (Anzia and Moe, 2014a; Cohen-Vogel et al., 2013; Koski and Horng, 2007; Moe, 2005), we also allow the coefficients on the school-level variables in CONijkt to vary by CBA transfer provision (see the footnote of Table 5).

23
The estimates of the coefficients in
€
γ 5 and
€
γ 7 in equation 6 are identified by differences
in the probability of within-district transfers for teachers of the same experience level in schools
and districts that are similar in every way except for their CBA transfer provisions. However, it
is possible that the district-level controls in CONijkt fail to adequately account for district level
factors that influence the likelihood that teachers transfer between schools. Given this, we also
estimate specifications in which the district control variables (including the CBA provisions
themselves) and year fixed effects in equations 4-6 are replaced by district-by-year fixed
effects.42 In these specifications, CBA provisions enter the model only in the interactions terms,
and the effect of CBA seniority provisions is identified by within-district and within-year
differences in the probability of within-district transfers. The district-by-year fixed effects in this
model account for the fact that our dataset is unbalanced and more representative of some school
years and districts than others. However, this model also makes the strong assumption that—in
the absence of CBA transfer provisions—the within-district relationships between teacher
experience, school disadvantage, and relative probability of transfer would be the same across
different districts. As a robustness check, then, we present estimates from both specifications
throughout Section VI.
VI. Primary Results
Table 5 presents estimated coefficients from our primary models: columns 1 and 2 are
estimated from the model in equation 4; columns 3 and 4 are estimated from the model in
equation 5; columns 5 and 6 are estimated from the model in equation 6 using the CBA
42 It is well-known that the MLEs of parameters in a fixed-effects logistic regression model are biased when sample sizes within each level of the fixed effect are small (e.g., Chamberlain, 1980). However, the average school district and year combination has over 130 teachers in our dataset, so we do not view this as a substantial problem in our application.

24
provisions governing voluntary teacher transfers; and columns 7 and 8 are estimated from the
model in equation 6 using the CBA provisions governing involuntary teacher transfers. Within
each set of results, the first column presents estimates from a model that includes a vector of
district control variables and year/contract year effects, while the second column presents
estimates from a model that substitutes a district-by-year fixed effect for these control variables.
Columns 1 and 2 of Table 5 demonstrate that, as we hypothesized in Section III and
consistent with prior empirical evidence, the probability that a teacher transfers to another school
in the district decreases as teacher experience increases and increases as the percent of URM
students in the school increases, all else equal.43 Figure 4 shows the estimated relationship
between standardized school percent URM students and probability of within-district transfer
from the model with district control variables (that are similar to the estimates from the model
with district-by-year fixed effects) for an average teacher.44 The point estimate for standardized
percent URM students from this model suggests, for example, that an increase in the school
percent of URM students from the state average to one standard deviation above the state
average is correlated with a .006 increase in the probability that an average teacher transfers to
another school in the district. This represents more than a 10 percent increase in the probability
given that it is relative to a baseline probability of within-district transfer of .053.
The estimates in columns 3 and 4 of Table 5 are from the two-way interaction model
(equation 5 in Section V) that allows the relationship between the percent of URM students in a
school and the probability of within-district transfer to vary for teachers of different experience
levels. Most of the results are very consistent with the hypotheses developed in Section III. The
43 These findings are quite consistent with findings from the existing teacher mobility literature (Goldhaber et al., 2010; Hanushek et al., 2004; Scafidi et al., 2007). 44 In Figures 4-7, we transform the log odds of within-district transfer to the probability scale (shown on the y-axis) to make the estimates easier to interpret.

25
relationship between the percent of URM students in a school and the probability of within-
district transfer becomes increasingly positive as teacher experience increases (
€
ˆ β 3 from equation
5), suggesting that district policies and culture give veteran teachers more leverage than novice
teachers to move out of undesirable teaching positions or stay in desirable teaching positions.
Figure 5 illustrates how the estimated relationship between the percent of URM students in a
school and the predicted probability of within-district transfer varies for teachers of different
experience levels (holding other variables in the model constant).
One relationship that does deviate from the hypotheses described in Section III is the
relationship between school disadvantage and the probability of within-district transfer for
novice teachers (
€
ˆ β 1 from equation 5). We find the relationship is negative so, for instance, the
probability that a first-year teacher serving in a very disadvantaged school (two SDs above the
mean percent URM students) transfers to another school in the district is actually .105 lower than
in an average school, all else equal. One possible explanation for this finding is that novice
teachers have different preferences than veteran teachers in terms of teaching in disadvantaged
schools. Idealistic younger teachers, for instance, may seek out disadvantaged schools early in
their careers but learn over time that these schools are difficult places in which to teach (Chester
and Beaudin, 1996).
Another possible explanation is that district rules (including CBA transfer protections)
serve to “trap” novice teachers in disadvantaged schools. We explore this possibility in columns
5-8 of Table 5, which include estimates from the three-way interaction model (equation 6 in
Section V) that allows the relationships between teacher experience and the percent of URM
students in the school to vary across districts with different CBA transfer provisions. Before
turning our attention to the coefficients of interest, it is worth noting that we do not find evidence

26
(from the main effects of CBA provisions in models with district controls) that the overall rates
of teacher transfers vary across districts with different CBA transfer provisions. This is important
for two reasons. First, this justifies the district-by-year fixed effects models reported in columns
6 and 8. Specifically, since there is no evidence that teachers are any more or less likely to
transfer to another school in the district (all else equal) in districts with different CBA transfer
provisions, it is reasonable to drop these main effects and include district-by-year effects that
capture all variation in within-district transfer rates between districts.
This finding is also important given the research (Barnes et al., 2014; Hanushek and
Rivkin, 2013; Ronfeldt et al., 2013) showing that the “churn” of teachers impacts student
achievement. The fact that we do not find evidence that provisions affect teacher churn (i.e.
within-district mobility) suggests that they do not have impacts on achievement that are
associated solely with teacher turnover. Of course that does not mean that provisions do not
affect the distribution of teachers. As we describe below, there is in fact evidence that they do.
The other reported estimates in columns 5-8 of Table 5 are for the primary coefficients of
interest,
€
ˆ γ 5 and
€
ˆ γ 7, from equation 6. Recall that the coefficients in
€
ˆ γ 5 describe how the
relationship between the percent of disadvantaged students in a school and probability of transfer
changes for novice teachers between districts with different CBA transfer provisions (the
reference category is districts with CBAs that do not address seniority in transfer decisions), and
the coefficients in
€
ˆ γ 7 describe how the interaction between teacher experience and percent of
disadvantaged students changes between districts with different CBA transfer provisions.
When we consider CBA voluntary transfer provisions (columns 5 and 6 of Table 5), the
coefficients on two interaction terms are statistically significant under both parameterizations of
the three-way interaction model (i.e., with district controls and with district-by-year fixed

27
effects).45 The negative two-way interaction “School %URM * Seniority is a tiebreaker” (one of
the coefficients in
€
ˆ γ 5) means that, relative to districts with CBAs that do not address seniority in
voluntary transfer decisions, the relationship between percent URM and the probability that a
novice teacher transfers to another school in the district is more negative in districts with CBAs
that specify that seniority is a tiebreaker in voluntary transfer decisions. This is consistent with
the hypothesis, described in Section III, that novice teachers in these districts have less leverage
to transfer out of disadvantaged schools. This is illustrated in Figure 6, as novice teachers in
disadvantaged schools (i.e., high values of standardized school %URM) are more likely to
transfer in districts with CBAs that do not address seniority in voluntary transfer decisions than
in districts with CBAs that specify that seniority is a tiebreaker in voluntary transfer decisions. In
particularly disadvantaged schools (2 SDs above the mean of %URM), novice teachers are 50
percent more likely to transfer, all else equal, if they teach in districts with CBAs that do not
address seniority in voluntary transfer decisions than if they teach in districts with CBAs that
specify that seniority is a tiebreaker in voluntary transfer decisions.
Further, the positive three-way interaction “School %URM * log experience * Seniority
is tiebreaker” (one of the coefficients in
€
ˆ γ 7) means that, relative to districts with CBAs that do
not address seniority in voluntary transfer decisions, the interaction between percent URM and
teacher experience is more positive in districts with CBAs that specify that seniority is a
tiebreaker in voluntary transfer decisions. While this is directionally consistent with the
hypothesis we described in Section III, there is little difference between the predicted
probabilities of within-district-transfer for veteran teachers (20 years of experience) in the two
different types of districts in Figure 7; that is, in both types of districts, the probability that a 45 One explanation for the non-findings for districts in which seniority is the only factor in voluntary transfer decisions is that there are relatively few of these districts (fewer than 5% of our sample).

28
veteran teacher transfers to another school in the district increases with the percent of URM
students in the school, and at about the same rate. This, combined with the findings for novice
teachers, suggests that that seniority voluntary transfer protections may be more important for
more junior teachers than veteran teachers.
When we consider CBA involuntary transfer provisions in columns 7 and 8 of Table 5,
we see consistent relationships for districts with CBAs that specify seniority as a tiebreaker or
the only factor in involuntary transfer decisions. In these districts, the relationship between
percent URM and the probability that a novice teacher transfers to another school in the district
is more negative than in districts with CBAs that do not address seniority in involuntary transfer
decisions. This is also consistent with the hypotheses described in Section III: novice teachers in
these districts have less leverage to keep their positions in advantaged schools when there is a
reduction in staffing at a school and a position needs to be moved. This is illustrated in Figure 7,
as novice teachers in advantaged schools (i.e., low values of school %URM) are more likely to
transfer (about 60% more likely in particularly advantaged schools, all else equal) in districts
with CBAs that specify seniority as the only factor in involuntary transfer decisions than in
districts with CBAs that do not address seniority in involuntary transfer decisions.
Finally, the three-way interactions between school percent URM, teacher experience, and
the indicators for seniority being a tiebreaker or the only factor in involuntary transfer decisions
are also positive and statistically significant. This means that, relative to districts with CBAs that
do not address seniority in involuntary transfer decisions, the interaction between percent URM
and teacher experience is more positive in districts with CBAs that specify that seniority is a
tiebreaker or the only factor in involuntary transfer decisions. Figure 7 illustrates that this is quite
consistent with the hypothesis we described in Section III: veteran teachers in districts with

29
CBAs that specify seniority as the only factor in involuntary transfer decisions are less likely to
transfer out of advantaged schools than veteran teachers in districts with CBAs that do not
address seniority in involuntary transfer decisions. The relationships in Figure 7 are extremely
consistent with our hypotheses about how seniority transfer protections in CBAs might influence
teacher transfer decisions (see Figure 3), and we therefore conclude that seniority involuntary
transfer protections are an important factor in within-district teacher transfer decisions.46
In sum, the above findings paint a consistent picture of how within-district teacher
mobility patterns vary depending on the CBA transfer provisions that govern such moves; the
interaction between teacher experience and school disadvantage in teacher transfer decisions is
consistently more extreme (i.e., veteran teachers are even more likely to leave disadvantaged
schools, and novice teachers are even more likely to stay in disadvantaged schools) in districts
with strong seniority transfer protections.47
46 There is still reason to worry that—despite the district controls or district-by-year fixed effects in each of our models—we do not adequately control for differences between teachers in districts with different contract provisions. There are some teachers who switch districts during our years of data, and there are some districts that negotiate different transfer provisions during these years. This allows us to estimate teacher fixed-effects models and produce estimates identified by within-teacher variation in school composition and CBA contract provisions. The estimates from these models are directionally consistent with our primary results—teachers are more likely to transfer to another school in years when they are in a disadvantaged school, and this relationship is stronger in years when they teach in a district with a CBA specifying seniority as the only factor in involuntary transfer protections—but are not statistically significant, presumably because there is far less variation to inform these estimates. Thus we view these results as supporting our primary results (full results available from authors upon request). 47 These findings are robust to a number of additional checks. We estimate our models separately by school year (e.g., 2009-10 only, 2010-11 only, etc.) to ensure that our findings are robust across different school years, and see few differences over time. We also estimate our models separately for each contract year (e.g., the first year the contract was in effect and the last year the contract is in effect) in case teachers are more likely to respond to CBA provisions in a contract’s first or last year. Again, we see few differences in our results. Finally, we estimate our primary models using different measures of teacher experience (e.g., experience in the district, experience relative to other teachers with the same endorsement in the district, etc.), and once again, our results change very little.

30
VII. Simulation study
The patterns that we describe in Section VI matter because they may contribute to the
inequitable distribution of teacher experience across advantaged and disadvantaged schools. But
these results address only one variable (CBA transfer provisions) that influences one factor
(within-district teacher transfers) in a dynamic process that ultimately determines the distribution
of teacher experience. So, how important are these results in the grand scheme of things?
To provide a more concrete context for the relative importance of our primary findings,
we perform a speculative simulation that considers just one measure of the inequitable
distribution of teacher experience: the distribution of novice teachers (i.e., with less than two
years of experience) across schools in the bottom and top quartile of the statewide distribution
of %URM students (i.e., advantaged and disadvantaged schools, respectively).48 It is well-
documented (e.g., Goldhaber et al., in press) that disadvantaged schools are much more likely to
have novice teachers and less likely to have veteran teachers than advantaged schools, but as we
discuss in Section II, patterns in within-district transfer, cross-district transfer, attrition, and
hiring can all influence this distribution. Therefore, our simulation has two goals: (1) assess the
relative importance of patterns in within-district transfers, cross-district transfers, attrition, and
hiring in determining the distribution of novice teachers across advantaged and disadvantaged
schools; and (2) quantify the relative importance of CBA transfer provisions in this process.
We make a number of simplifications and simplifying assumptions to make our
calculations tractable. The first simplification is to assume that the initial distribution of first-year
teachers in the first year of our simulation is equitable between advantaged and disadvantaged
schools; that is, that students are equally likely to be initially assigned to a novice teacher in each 48 For the purposes of the simulation, we define a “veteran” teacher to be any teacher with more than two years of experience.

31
type of school. This assumption is far from realistic—from 2006 through 2013, the percent of
first-year teachers in disadvantaged schools (7.4%) is much higher than in advantaged schools
(5.1%)—but this simplification allows us to isolate the impact of the four factors described
above from the impact of the many factors that have contributed to the existing inequitable
distribution of teacher experience.
Our simulation makes three additional simplifying assumptions: 1) rates of within-district
transfer, cross-district transfer, and attrition for teachers of different experience levels are
independent of each other and the existing distribution of teacher experience; 2) rates of hiring of
novice teachers are independent of the existing distribution of teacher experience and the
experience level of departing teachers; and 3) students do not transfer between schools because
of the teacher to whom they are assigned. These assumptions are not particularly realistic—for
example, we might expect a principal’s hiring decisions to depend, in part, on the experience
level of departing teachers and the existing experience level in the school—so we stress that our
simulation results do not permit a causal interpretation.
In our simulation, we assign students to teachers in school s and year t via the following
two-step process: students are first assigned to a teacher who was already in school s in year t-1,
and then students are assigned to that teacher’s replacement if the teacher transfers from the
school. In this process, there are two ways a student could get a novice teacher in year t: (a) the
student is initially assigned to a first-year teacher who then stays in the school for her second
year; or (b) the student is initially assigned to a teacher who leaves and is then replaced by a
novice teacher. In turn, the probability of each of these events depends on patterns of within-
district transfer and teacher hiring (e.g., the probability that a veteran teacher transfers to another
school in the district and is then replaced by a novice). These probabilities vary across different

32
school settings, so we can estimate the probability that a student is assigned to a novice teacher
in different types of schools (i.e., advantaged and disadvantaged) by imputing rates of within-
district transfers, cross-district transfers, attrition, and hiring that are either calculated from our
observed data or, in the case of within-district transfers, fitted probabilities from our teacher
transfer models.
Our simulation proceeds in two parts. In the first part, we ignore CBA transfer provisions
and simply quantify how much each factor—within-district transfers, cross-district transfers,
attrition, and hiring—contributes to inequitable distributions of novice teachers across
advantaged and disadvantaged schools. For each factor, we impute the observed rates for
advantaged and disadvantaged schools, but then hold rates of all other factors at their observed
rates across all schools (i.e., assuming that patterns are equitable in advantaged and
disadvantaged schools). For example, to isolate the impact of within-district transfers, we assume
that rates of cross-district transfer, attrition, and hiring are the same in advantaged and
disadvantaged schools, but allow rates of within-district transfer to vary in the two types of
schools (using observed rates of within-district transfer in the two types of schools from our data
from 2006-2013). Overall, we estimate that within-district transfers are responsible for about
20% of the inequitable distribution of novice teachers across advantaged and disadvantaged
schools. This makes within-district transfers the second most important source of inequity; we
estimate that patterns of cross-district transfer are responsible for about 7%, attrition is
responsible for about 18%, and hiring is responsible for about 55% of the “novice teacher gap”
in year t. This is a lower-bound estimate of the importance of within-district transfers, because
one could argue that the inequities in within-district transfers that we document (e.g., veteran
teachers leaving disadvantaged schools at higher rates) are problematic precisely because

33
disadvantaged schools have a harder time recruiting experienced teachers (and thus hire novice
teachers at much higher rates).
For the second part of our simulation, we manipulate the rates of within-district transfer
based on the fitted values from our within-district teacher transfer models to provide intuition
about the magnitudes of our results about different CBA transfer provisions. Table 6 summarizes
simulation results that address our most consistent finding: patterns of within-district transfer are
more inequitable in districts with CBAs that specify seniority as the only factor in involuntary
transfer decisions than in districts with CBAs that do not address seniority at all. Under different
assumptions (summarized in column 1 of Table 6), we run our simulation using fitted
probabilities of within-district transfer in districts with CBAs that do not address seniority in
involuntary transfer decisions, and again in districts with CBAs that specify seniority as the only
factor in involuntary transfer decisions. The third column shows the percent of students in
disadvantaged schools who are assigned to a novice teacher in year t, while the fourth column
shows the same percent for students in advantaged schools. Finally, the fifth column shows the
resulting “novice teacher gap” between disadvantaged schools and advantaged schools. Under
each set of assumptions, the difference in this gap between districts with different CBA
provisions is about 0.35 percentage points, or a little less than 20% of the overall gap between
advantaged and disadvantaged schools in the average district.
We believe there are three main takeaways from this exercise. The first is that within-
district transfers are important but only explain a fraction (about one-fifth) of the inequitable
distribution of novice teachers across advantaged and disadvantaged schools. We view this as
additional motivation for our analysis—that isolates the impact of CBA transfer provisions on

34
within-district teacher mobility—relative to prior analyses that conflate the impacts of all four
factors that can contribute to the inequitable distribution of teacher experience.
The second takeaway, shown in Table 6, is that patterns in teacher transfers can result in
an inequitable distribution of teacher experience in districts regardless of their CBA transfer
provisions. This is an important point: our findings about CBA involuntary transfer provisions do
not imply that the distribution of teacher experience will be “equitable” in districts with CBAs
that do not address the role of seniority in involuntary transfer decisions. That said, our third
takeaway is that there is evidence that the distribution of seniority will be more inequitable
(almost 20% more) in districts with CBAs that specify seniority as the only factor in involuntary
transfer decisions. Our broad conclusion from this simulation, therefore, is that the impact of
CBA transfer provisions on the distribution of teacher experience is likely to be small but
meaningful.
VIII. Mobility by Teacher Effectiveness
Before considering a number of important extensions and robustness checks to the
models and results discussed in Sections V and VI, we take a short but important detour to
examine the relationship between teacher effectiveness and seniority transfer protections. We
again stress the importance of this analysis given findings showing the connection between
teacher effectiveness and later student outcomes (e.g. Chetty et al., 2011).
For the focus on teacher effectiveness, we rely on a subset of teachers in our sample—
elementary school teachers in grades 4-6 and middle school math and reading teachers—who can
be linked to demographic information and both prior and current state test scores of students in

35
their classes.49 For this subset of teachers, we estimate value-added models (VAMs) to identify
the contribution of these teachers toward student learning gains. The value-added estimate for
teacher j in subject s in year t is calculated from the following VAM:
Error! Objects cannot be created from editing field codes. (7)
In equation 7, Yijst is the state test score for each student i with teacher j in subject s (math or
reading) and year t, normalized within grade and year; Yi(t-1) is a vector of the student’s scores the
previous year in both math and reading, also normalized within grade and year; Xit is a vector of
student attributes in year t (gender, race, eligibility for free/reduced price lunch, English
language learner status, gifted status, special education status, learning disability status); and τjst
is a fixed effect that captures the contribution of teacher j to student test scores in subject s and
year t. We adjust all teacher effect estimates using empirical Bayes (EB) methods.50 For
elementary teachers, we use the mean of the teacher’s estimates in math and reading as our
measure of effectiveness, while for secondary teachers we use the estimate for the subject the
teacher teaches (math or reading).51
49 These data come from Washington State’s Core Student Record System (CSRS, prior to 2009-10) and Comprehensive Education Data and Research System (CEDARS, since 2009-10). The proctor of the state assessment was used as the teacher-student link in the CSRS data system. The 'proctor’ variable was not intended to be a link between students and their classroom teachers so this link may not accurately identify those classroom teachers. However, for the 2009-10 school year, we are able to check the accuracy of these proctor matches using CEDARS data system. Our proctor match agrees with the student’s teacher in the CEDARS system for about 95% of students in math and 94% of students in reading. See Goldhaber et al. (2013b) for more information about these data. This generates value-added estimates for 19,224 different teachers from 2006-2013, estimated from about 1.9 million student/year/subject observations. 50 The standard empirical Bayes method shrinks estimates back to the grand mean of the population. Note, however, that standard empirical Bayes adjustment does not properly account for the uncertainty in the grand mean, suggesting the estimates are shrunk too much (McCaffrey et al., 2009). But recent evidence (Herrmann et al., 2013) also suggests that shrinkage improves the estimates for teachers of “hard-to-predict” students. We use the standard approach estimated in the literature (an appendix on empirical Bayes shrinkage is available from the authors by request). 51 We are not able to account for student tracking at the middle school level (e.g., Jackson, 2012) because we do not have reliable section IDs that distinguish between students with the same teacher but in different sections.

36
We use these value-added estimates to investigate the patterns of teacher mobility for
teachers of different levels of estimated effectiveness across districts with different CBA transfer
provisions. Specifically, we estimate variants of the models in equations 4-6 in which we replace
log teacher experience, ln(EXPit), with an estimate of the teacher’s value-added performance
VAMit52 (we include ln(EXPit) in the vector of control variables CONijkt).53 Columns 1 and 2 of
Table 7 demonstrate that, all else equal, the probability that a teacher transfers to another school
in the district decreases as estimated teacher effectiveness increases. This is directionally
consistent with findings from Goldhaber et al. (2011) and Feng and Sass (2012).54 In columns 3-
4 of Table 7, when we allow the relationship between teacher value-added and probability of
transfer to vary by school percent URM students, we do not find significant differences in this
relationship by school percent URM. Similarly, we see few consistent patterns when we allow
these relationships to vary by CBA voluntary transfer provisions (columns 5 and 6).
However, very clear patterns emerge when we allow these relationships to vary by CBA
involuntary transfer provisions (columns 7 and 8 of Table 7). The positive coefficient on the
interaction “School %URM * teacher VAM” shows that, in districts with CBAs that do not
address seniority in involuntary teacher transfers, the relative likelihood that a teacher leaves a
disadvantaged school actually increases with teacher effectiveness. Further, the two sets of
significant three-way interactions imply that, relative to districts with CBAs that do not address
seniority in involuntary transfer decisions, the interaction between school %URM and teacher
value-added is less positive in districts with CBAs that specify seniority as a tiebreaker or the
only factor in involuntary transfer decisions than those that do not.
52 We standardize our value-added estimates across all teachers, so VAMit = 0 represents a teacher of average effectiveness. 53 We also estimate models that do not control for teacher experience, and the results are qualitatively similar. 54 The magnitude of this coefficient is larger than the estimates in Feng and Sass (2012).

37
To help interpret these coefficients, we replace the continuous measure of effectiveness
with indicators for whether each teacher is in the top quartile or bottom quartile of the
distribution of estimated effectiveness.55 The results from this model suggest that the mobility
patterns of effective teachers are driving this result; that is, effective teachers are relatively
speaking much less likely to leave disadvantaged schools in districts that do use seniority in
involuntary transfer decisions. This provides an interesting corollary to our primary results, as it
suggests that—despite the early-career correlation between experience and effectiveness (e.g.,
Boyd et al., 2006; Rivkin et al., 2005; Rockoff, 2004)56—seniority protections for involuntary
transfers in CBAs could actually decrease the inequitable distribution of teacher quality, since
they may give effective, early career teachers less leverage when a position in a school has to be
moved. In other words, effective teachers may have more leverage to stay in advantaged schools
in districts where seniority is not used in transfer decisions (or alternatively, administrators are
more able to protect their effective teachers from involuntary transfer when seniority transfer
rules are in place).57
IX. Extensions and Falsification Tests
To further bolster the results reported in Section VI, we now return to our main models
and present several important modifications. We first estimate the models in equations 4-6 using
the percent of students in the school eligible for free/reduced priced lunch (FRL) as the measure
of school disadvantage, DVGjt. We then consider other types of teacher transfers—out of the
district and out of the state workforce—to see if patterns in within-district transfers hold for other
55 Results available from authors upon request. 56 Recent research (e.g. Ladd and Sorenson, 2014) suggests that the returns to experience may extend out to as much as year 12 of a teacher’s career. 57 See Jacob and Lefgren (2008) for evidence that principals can identify high value-added teachers.

38
types of transfers, and conclude the section by discussing a number of falsification tests of our
primary results.
Teacher mobility by school poverty level
Table 8 presents estimates from the models in equations 4-6 in which the measure of
school disadvantage, DVGjt, is the percent of students in the school eligible for free/reduced
priced lunch (FRL). The estimates in columns 1-4 of Table 8 are very similar to our primary
results in columns 1-4 of Table 5 (i.e., when the measure of school disadvantage is the percent of
URM students in the school); in particular, the relationship between the percent of FRL students
in a school and the probability of within-district transfer is negative for novice teachers, but
becomes increasingly positive as teacher experience increases.
When we allow the relationships between school percent of FRL students, teacher
experience, and log-odds of within district transfer to vary across districts with different CBA
voluntary (columns 5-6) and involuntary (columns 7-8) transfer provisions, we also see similar
patterns to those in Table 5. The results for voluntary transfer provisions are directionally
consistent with the results in Table 5 but not statistically significant, suggesting perhaps that
teachers are more attuned to the racial composition of a school than the level of poverty in terms
of their mobility decisions (Scafidi et al., 2007). The findings for involuntary transfer provisions
in columns 7-8 of Table 8 are perfectly consistent with the results from Table 5, from which we
conclude that our estimates of the impact of involuntary transfer provisions are robust to the
measure of school disadvantage that we consider.
Other types of teacher moves (out of district and workforce)
In Table 5, the outcome variable is the log odds of pijkt, the probability that teacher i in
school j, district k, and year t transfers to another school in the district the following year

39
(relative to staying in the same school). In Tables 9 and 10, we consider two other outcome
variables: in Table 9, the outcome variable is the log odds that a teacher transfers to a school in
another district (relative to staying in the same school); and in Table 10, the outcome variable is
the log odds that a teacher leaves the in-state teaching workforce (relative to staying in the same
school).58 As we discussed in Section II, the only outcome that CBA transfer provisions should
be expected to influence directly is within-district transfer decisions. But transfer provisions
might also indirectly affect the decisions of teachers to stay in their districts given the role they
play in influencing teachers’ within-district job options. For example, junior teachers who may
be frustrated by an inability to transfer out of less desirable schools, in part because of strong
CBA seniority transfer provisions, might be more inclined to leave their districts for other job
opportunities in or outside of public schools. For this reason we also consider other types of
teacher moves.
The results in columns 1-4 of Tables 9 and 10 are consistent with results from the
existing literature on teacher mobility (Goldhaber et al., 2010; Hanushek et al., 2004; Scafidi et
al., 2007): the probability that a teacher leaves the district or workforce increases with the
percent of URM students in the school, and this relationship is stronger for veteran teachers than
novice teachers. However, when we allow these relationships to vary across districts with
different CBA transfer provisions (columns 5-8 of Tables 9 and 10), no consistent patterns
emerge. In fact, in the models with district control variables (columns 5 and 7 of Tables 9 and
10), only 3 of the 36 interaction terms are statistically significant at the .05 significance level,
which is only slightly more than we would expect by random chance. Our conclusion is that
58 This category includes teachers who retired, switched professions, or left for a teaching job in another state.

40
CBA transfer provisions are not an important factor in teacher transfers out of the school district
or profession.
Falsification Tests
A significant shortcoming of our analysis is that we cannot distinguish between teachers
making voluntary and involuntary transfers; we only observe whether a teacher switches schools.
But as we discuss in Section III, involuntary and voluntary transfers are more likely in some
situations than others. Specifically, involuntary transfers should be more likely when a school
experiences a sharp decrease in enrollment and staffing, while voluntary transfers should be
more likely in districts with expanding enrollments and staffs (and therefore more jobs to transfer
into). As falsification tests, therefore, we estimate our models separately for teachers in different
types of schools: (a) teachers in schools that experience a sharp drop in enrollment or staffing the
following year; and (b) teachers in districts that experience a sharp increase in enrollment or
staffing the next year. We hypothesize that involuntary transfer provisions should be more
important for teachers in group (a), while voluntary transfer provisions should be more important
for teachers in group (b).
Our findings largely support this conclusion. Namely, when we limit the dataset to the
subset of teachers in schools that we know experience sharp decreases in enrollment the
following year (we use two cutoffs: at least a 10% decrease, and at least a 25% decrease), the
results are directionally consistent with the results in Section VI for involuntary transfer
provisions (and the coefficients on involuntary transfer provisions are larger than the coefficients
on voluntary transfer provisions). This is also true when we consider changes in staffing; the
coefficients on involuntary transfer provisions are larger in schools that experience a decrease in

41
teaching positions the following year, but not statistically significant in schools with staffing
levels that stay the same or increase the following year.
Our findings for districts that expanded are also consistent with our hypothesis that
voluntary transfer provisions should be more important in these districts. For example, the
estimated coefficient on the interaction between percent URM and seniority being the only factor
in voluntary transfer decisions is 0.433 (SE=0.157) for all teachers, 0.519 (SE=0.190) for
teachers in districts that grew at all, and 0.646 (SE=0.168) for teachers in districts that grew by at
least 2%. Taken together, these falsification tests give little reason to question our primary results.
X. Conclusions
This paper represents the first attempt to connect CBA transfer provisions to patterns of
teacher mobility within school districts. Our empirical findings are remarkably consistent with
the hypothesized ways in which transfer provisions in CBAs might affect the mobility of
teachers of varying seniority: the pattern of veteran teachers leaving disadvantaged schools and
novice teachers staying in disadvantaged schools is more pronounced in districts with strong
CBA seniority transfer protections. In short, seniority transfer protections appear to matter in
terms of the movement of teachers within school districts. Coupled with evidence that teachers
tend to transfer to more advantaged schools, this suggests that CBA transfer provisions could be
one of the factors that contribute to the inequitable distribution of teacher experience within
districts in Washington State (see Goldhaber et al. (2014)). Further, our simulation study
(described in Section VII) suggests that the contribution of CBA transfer provisions to this
inequity is likely to be small but meaningful.

42
A legitimate question, however, is whether we should consider these patterns to be a
“problem.” From a teacher’s perspective, the provisions in teacher CBAs should be a reflection
of teacher preferences, and empirical evidence suggests that many teachers prefer to have the
option to leave disadvantaged schools as they advance in their careers. From a policy perspective,
however, the resulting inequities in the distribution of teacher experience only exacerbate well-
documented achievement gaps between advantaged and disadvantaged students. These two
perspectives are likely brought to the table by teacher’s unions and districts, respectively.
Therefore this paper provides some empirical evidence to inform negotiations between these
groups, as well as legislation by state and federal policymakers with greater power to determine
the scope of bargaining (Cohen et al., 2008).
Moreover, the findings from our models that include estimates of teacher effectiveness
suggest one way that CBA seniority transfer protections could actually mitigate the inequitable
distribution of teacher quality. If a position in an advantaged school must be moved to a
disadvantaged school, a principal in a district where seniority plays no role in transfer decisions
may be able to protect her effective, less-experienced teachers from involuntary transfer.
However, our results suggest that this is not the case in a district where seniority is the only
factor in this decision.59
It is also important to acknowledge the drawbacks of this analysis and suggest directions
for future study. A significant shortcoming of our analysis (discussed in Section IX) is our
inability to distinguish between voluntary and involuntary teacher transfers. However, two recent
papers suggest future directions for research on CBA transfer provisions; Boyd et al. (2011)
collect data from New York City on teachers’ transfer applications (allowing them to distinguish 59 We caution that only about 25% of our sample taught in a school with at least a 3% drop in enrollment the following year, so this likely only explains part of this result.

43
between transfers initiated by teacher and administrator preference), while Grissom et al. (2014)
collect data on involuntary transfers within one district (Miami-Dade County) with a CBA that
gives administrators the ability to transfer teachers to another school “when deemed in the best
interest of the school system.” If similar data were collected across multiple districts with
different CBA transfer provisions, they could be used to further explore the relationship between
these provisions and teacher mobility, potentially strengthening the conclusions from this
analysis.
Both litigation (e.g., Vergara v. California, 2014) and policy changes (e.g., Greenhouse,
2011) are altering the extent to which seniority is being used to drive teacher personnel decisions.
This should allow for better inferences about the role such provisions play in influencing the
distribution of teachers and, through this, student outcomes. In particular, time will tell whether
districts continue to operate by preferencing seniority even when no longer contractually
required to do so (as suggested by Koski and Horng, 2007 and Cohen-Vogel et al. 2013), or
whether elimination of CBA seniority transfer protections contributes to a more equitable
distribution of teacher talent (as suggested by Moe, 2005 and Anzia and Moe, 2014a). Until these
natural experiments have run their course, we view our results as the most convincing evidence
that CBA seniority transfer provisions represent an important policy lever with the potential to
influence the distribution of teachers.

44
Bibliography Aaronson, D., Barrow, L., & Sander, W. (2007). Teachers and student achievement in the
Chicago public high schools. Journal of Labor Economics, 25(1). Altman, D. G. (1991). Practical Statistics for Medical Research. London England: Chapman and
Hall. Anzia, S.F. & Moe, T.M. (2014a). Collective bargaining, transfer rights, and disadvantaged
schools. Educational Evaluation and Policy Analysis 36(1), pp. 83-111. Anzia, S.F. & Moe, T.M. (2014b). Focusing on fundamentals: A reply to Koski and Horng.
Educational Evaluation and Policy Analysis 36(1), pp. 120-123. Atteberry, A., Loeb, S., & Wyckoff, J. (2013). Do first impressions matter? Improvement in
early career teacher effectiveness (No. w19096). National Bureau of Economic Research. Barnes, G., Crowe, E., and Schaefer, B. (2014). The cost of teacher turnover in five school
districts: A pilot study. National Commission on Teaching and America’s Future. Boyd, D., Grossman, P., Lankford, H., Loeb, S., & Wyckoff, J. (2006). How changes in entry
requirements alter the teacher workforce and affect student achievement. Education Finance and Policy, 1(2), 176-216.
Boyd, D., Lankford, H., Loeb, S., Ronfeldt, M., & Wyckoff, J. (2011). The role of teacher quality in retention and hiring: Using applications to transfer to uncover preferences of teachers and schools. Journal of Policy Analysis and Management, 30(1), 88-110.
Boyd, D., Lankford, H., Loeb, S., & Wyckoff, J. (2013). Analyzing the determinants of the matching of public school teachers to jobs: Disentangling the preferences of teachers and employers. Journal of Labor Economics, 31(1), 83-117.
Chamberlain, G. (1980). Analysis of covariance with qualitative data. Review of Economic Studies, 60, 585-612.
Chester, M. D., & Beaudin, B. Q. (1996). Efficacy beliefs of newly hired teachers in urban schools. American Educational Research Journal, 33(1), 233-257.
Chetty, R., Friedman, J. N., & Rockoff, J. E. (2011). The long-term impacts of teachers: Teacher value-added and student outcomes in adulthood (No. w17699). National Bureau of Economic Research.
Clotfelter, C. T. (1976). School desegregation," tipping," and private school enrollment. Journal of Human Resources, 28-50.
Clotfelter, C., Ladd, H., Vigdor, J., & Diaz, R. (2004). Do school accountability systems make it more difficult for low-performing schools to attract and retain high-quality teachers? Journal of Policy Analysis and Management, 23(2), 251-271.
Clotfelter, C. T., Ladd, H. F., & Vigdor, J.L. (2005). Who teaches whom? Race and the distribution of novice teachers. Economics of Education review, 24(4), 377-392.
Clotfelter, C., Ladd, H. F., Vigdor, J., & Wheeler, J. (2006). High-poverty schools and the distribution of teachers and principals. NCL Rev., 85, 1345.
45
Cohen, E., Walsh, K., & Biddle, R. (2008). Invisible Ink in Collective Bargaining: Why Key Issues Are Not Addressed. National Council on Teacher Quality.
Cohen-Vogel L., Feng L., and Osborne-Lampkin L. 2013. "Seniority Provisions in Collective Bargaining Agreements and the "Teacher Quality Gap". Educational Evaluation and Policy Analysis. 35 (3): 324-343.
Federal Student Aid. (2014). Teacher Education Assistance for College and Higher Education. Available at: https://studentaid.ed.gov/types/grants-scholarships/teach.
Feng, L., & Sass, T. (2012). Teacher quality and teacher mobility. Andrew Young School of Policy Studies Research Paper Series, (12-08).
Glazerman, S., & Max, J. (2011). Do low-income students have equal access to the Highest-performing teachers? (No. 6955). Mathematica Policy Research.
Goldhaber, D. (2006). Are teachers unions good for students?” In Collective Bargaining in Education: Negotiating Change in Today's Schools, edited by Jane Hannaway and Andrew Rotherham. Cambridge, MA: Harvard Education Press, pp. 141-157.
Goldhaber, D., Gross, B., and Player, D. (2010). Teacher career paths, teacher quality, and persistence in the classroom: Are public schools keeping their best? Journal of Policy Analysis and Management 30(1), 57-87.
Goldhaber, D. & Hansen, M. (2010). Using performance on the job to inform teacher tenure decisions. (Brief 10). National Center for Analysis of Longitudinal Data in Education Research.
Goldhaber, D., Lavery, L., Theobald, R., D’Entremont, D., and Fang, Y. (2013a). Teacher collective bargaining in Washington State: Assessing the internal validity of partial independence item response measures of contract restrictiveness. SAGE Open, April-June 2013, 1-16.
Goldhaber, D., Lavery, L., and Theobald, R.. Uneven playing field? Assessing the teacher quality gap between advantaged and disadvantaged students. Educational Researcher, in press.
Goldhaber, D., Lavery, L., and Theobald, R. (2014). My end of the bargain: Are there cross-district effects in teacher contract provisions? Industrial and Labor Relations Review 67(4), pp. 1274-1305.
Goldhaber, D., Liddle, S., and Theobald, R. (2013b). The gateway to the profession: Evaluating teacher preparation programs based on student achievement. Economics of Education Review 34, 29-44.
Goldhaber, D. and Theobald, R. (2013). Managing the teacher workforce in austere times: The determinants and implications of teacher layoffs. Education Finance and Policy 8(4), 494–527.
Greenhouse, S. (2011). Ohio’s anti-union law is tougher than Wisconsin’s. The New York Times, March 31, 2011.

46
Grissom, J. A., Loeb, S., & Nakashima, N. A. (2014). Strategic involuntary teacher transfers and teacher performance: Examining equity and efficiency. Journal of Policy Analysis and Management, 33(1), 112-140.
Guarino, C. M., Santibanez, L., and Daley, G. A. (2006). Teacher Recruitment and Retention: A Review of the Recent Empirical Literature. Review of Educational Research, 76 (2), 173-173.
Hannaway, J. and Rotherham, A. (2006). Collective Bargaining in Education: Negotiating Change in Today's Schools. Cambridge, MA: Harvard Education Press.
Hanushek, E. (1997) Assessing the effects of school resources on student performance: An update. Educational Evaluation and Policy Analysis, 19(2), 141-164.
Hanushek, E., Kain, J. & Rivkin, S. (2004). Why public schools lose teachers. Journal of Human Resources 39(2), 326-254.
Hanushek, E. & Rivkin, S. (2013). Teacher turnover and the quality of instruction in urban schools. NBER working paper.
Herrmann, M., Walsh, E., Isenberg, E., and Resch, A. (2013). Shrinkage of value-added estimates and characteristics of students with hard-to-predict achievement levels. Mathematica Policy Research.
Hess, F.M. and Kelly, A. (2006). Scapegoat, albatross, or what? The status quo in teacher collective bargaining. In Collective bargaining in education: Negotiating change in today’s schools (ed. J. Hannaway and A. Rotherham), 53-87.
Isenberg, E., Max, J., Gleason, P., Potamites, L., Santillano, R., & Hock, H. (2013). Access to effective teaching for disadvantaged students. National Center for Education Evaluation and Regional Assistance, U.S. Department of Education.
Jackson, C. K. (2012). Teacher quality at the high-school level: The importance of accounting for tracks (No. w17722). National Bureau of Economic Research
Jacob, B. A., & Lefgren, L. (2008). Can principals identify effective teachers? Evidence on subjective performance evaluation in education. Journal of Labor Economics, 26(1), 101-136.
Kalogrides, D., & Loeb, S. (2013). Different teachers, different peers: The magnitude and effects of student sorting within schools. Educational Researcher, 42(6), 304-316.
Kalogrides, D., Loeb, S., & Beteille, T. (2013). Systematic sorting: Teacher characteristics and class assignments. Sociology of Education, 86(2), 103-123.
Kane, T. J., Rockoff, J. E., & Staiger, D. O. (2008). What does certification tell us about teacher effectiveness? Evidence from New York City. Economics of Education Review, 27(6), 615-631.
Koski, W.S. & Horng, E. (2007) Facilitating the teacher quality gap? Collective bargaining agreements, teacher hiring and transfer rules, and teacher assignment among schools in California, Education Finance and Policy, 262.
47
Koski, W.S. & Horng, E. (2014). Keeping sight of the forest through the trees: Response to “Collective bargaining, transfer rights, and disadvantaged schools”. Educational Evaluation and Policy Analysis 36(1), pp. 112-119.
Ladd, H. and Sorensen, L. (2014). Return to teacher experience: Student achievement and motivation in middle school. CALDER working paper 112.
Lankford, H., Loeb, S., & Wyckoff, J. (2002). Teacher sorting and the plight of urban schools: A descriptive analysis. Educational Evaluation and Policy Analysis, 24(1), 37-62.
Levin, J., Mulhern, J., and Schunck, J. (2005). Unintended consequences: The case for reforming the staffing rules in urban teachers union contracts. Report by the New Teacher Project.
McCaffrey, D.F., Lockwood, D., Louis, T.A., & Hamilton, L. (2004). Models for value-added modeling of teacher effects. Journal of Educational and Behavioral Statistics, 29(1), 67-101.
McCaffrey, D. F., Sass, T. R., Lockwood, J. R., & Mihaly, K. (2009). The intertemporal variability of teacher effect estimates. Education Finance and Policy, 4(4), 572-606.
Medina, J. (2014). Judge rejects teacher tenure for California. New York Times, June 10, 2014. Moe, T.M. (2005). Bottom-up structure: Collective bargaining, transfer rights, and the plight of
disadvantaged schools. Stanford University working paper. Moe, T.M. (2011). Special interest: Teachers unions and America’s public schools. Washington
D.C.: Brookings Institution. Murphy, K. (2011). Schools shut down in Tacoma as teachers strike. Los Angeles Times,
September 13, 2011. NCTQ (2014). Teacher Contract Database. National Council on Teacher Quality, accessed from
http://www.nctq.org/districtPolicy/contractDatabaseLanding.do. Rice, J.K. (2013). Learning from experience: Evidence on the impact and distribution of teacher
experience and the implications for teacher policy. Education Finance and Policy, 8(3), 332-348.
Riley, P., Fusano, R., Munk, L., and Peterson, R. (2002). Contract for failure: The impact of teacher union contracts on the quality of California schools. Pacific Research.
Rivkin, S. G., Hanushek, E. A., & Kain, J. F. (2005). Teachers, schools, and academic achievement. Econometrica, 73(2), 417-458.
Rockoff, J. E. (2004). The impact of individual teachers on student achievement: Evidence from panel data. American Economic Review, 247-252.
Ronfeldt, M., Loeb, S., & Wyckoff, J. (2013). How teacher turnover harms student achievement. American Educational Research Journal, 50(1), 4-36.
Sass, T. R., Hannaway, J., Xu, Z., Figlio, D. N., & Feng, L. (2010). Value added of teachers in high-poverty schools and lower poverty schools. Journal of Urban Economics, 72(2), 104-122.

48
Scafidi, B., Sjoquist, D., and Stinebricker, T. (2007). Race, poverty, and teacher mobility. Economics of Education Review 26, 145-159.
Snell, L. (2014). Education funding for disadvantaged kids. Orange County Register, April 4, 2014.
Strunk, K. (2011). "Are Teachers' Unions Really to Blame? Collective Bargaining Agreements and Their Relationships with District Resource Allocation and Student Performance in California." Education Finance and Policy, 6(3), pp. 354-398.
Strunk, K. and Grissom, J. (2010). Do strong unions shape district policies? Collective bargaining, teacher contract restrictiveness, and the political power of teachers’ unions.” Educational Evaluation and Policy Analysis, 32(3), 389-40.
Figure 1. Conceptual figure of relationship between school disadvantage and within-district transfers (equation 1)
Coefficients of Interest in Figure 1 α0
* = expected log odds of switching schools for teacher in “average” school α1
* = expected change in log odds of switching schools for each standard deviation increase in % disadvantaged students

50
Figure 2. Conceptual figure of two-way interaction teacher transfer model (equation 2)
Coefficients of Interest in Figure 2 β1
* = expected change in log odds of switching schools for each standard deviation increase in % disadvantaged students for novice teachers β2
* = expected difference in the log odds of teacher transfer between veteran teachers and novice teachers in an average school β3
* = expected change in the relationship between % disadvantaged students in the school and the log odds of teacher transfer for veteran teachers relative to novice teachers

51
Figure 3. Conceptual figure of three-way interaction teacher transfer model (equation 3)
Coefficients of Interest in Figure 3
€
γ 5* = expected change in the relationship between % disadvantaged students in a school and
probability of transfer for novice teachers between districts that either consider or do not use seniority in transfer decisions.
€
γ 7* = expected change in interaction between teacher experience and % disadvantaged students
between districts that do and do not use seniority in teacher transfer decisions.

Figure 4. Estimated relationship between %URM in school and probability of within-district transfer
*NOTE: Predicted probabilities of within-district transfer (relative to staying in the same school) are from the model reported in Column 1 of Table 5 with all other covariates set to zero (i.e., average values for continuous variables and reference category for categorical variables).

53
Figure 5. Estimated relationship between %URM in school and probability of within-district transfer for teachers of different experience levels
*NOTE: Predicted probabilities of within-district transfer (relative to staying in the same school) are from the model reported in Column 3 of Table 5 with all other covariates set to zero (i.e., average values for continuous variables and reference category for categorical variables).

54
Figure 6. Estimated relationship between %URM in school and probability of within-district transfer for teachers of different experience levels in districts with different CBA voluntary transfer provisions
*NOTE: Predicted probabilities of within-district transfer (relative to staying in the same school) are from the model reported in Column 5 of Table 5 with all other covariates set to zero (i.e., average values for continuous variables and reference category for categorical variables).

55
Figure 7. Estimated relationship between %URM in school and probability of within-district transfer for teachers of different experience levels in districts with different CBA involuntary transfer provisions
*NOTE: Predicted probabilities of within-district transfer (relative to staying in the same school) are from the model reported in Column 7 of Table 5 with all other covariates set to zero (i.e., average values for continuous variables and reference category for categorical variables).

56
Table 1. Summary statistics (2005-06 through 2011-12 school years)
Level Teacher
years School years
District years CBAs
Sample size N = 190469 N = 7159 N = 944 N = 471 Teacher variables
Experience 13.274 (9.282)
Male 27.4% Nonwhite teacher 8.0% Masters degree 66.0% STEM endorsement 17.9% SPED endorsement 17.8% Elem endorsement 57.7% ELL endorsement 4.8% RIF Notice 1.1% School variables Elementary school 53.6% 61.8% Middle school 19.6% 16.8% High school 26.8% 21.4%
School enrollment (standardized) 0.583 0.110 (0.926) (0.974)
School growth (standardized) -0.025 0.015 (0.726) (1.116)
School %URM (standardized) 0.001 -0.004 (0.943) (0.974)
District variables
District log enrollment (standardized) 1.234 1.059 0.220 (0.604) (0.750) (0.882)
District %URM (standardized) 0.045 0.040 0.016 (0.773) (0.801) (0.973)
District SD %URM (standardized) 0.389 0.346 0.004 (0.961) (0.979) (0.981)
CBA variables Seniority prohibited from use (voluntary) 12.4% 11.9% 9.3% 8.1% Seniority not addressed (voluntary) 31.5% 35.7% 52.0% 51.2% Seniority one of several factors (voluntary) 24.1% 22.6% 18.0% 18.5% Seniority is tiebreaker (voluntary) 25.8% 23.5% 16.1% 17.4% Seniority only factor (voluntary) 6.3% 6.3% 4.6% 4.9% Seniority prohibited from use (involuntary) 6.9% 6.7% 6.4% 6.2% Seniority not addressed (involuntary) 25.6% 29.7% 49.4% 48.5% Seniority one of several factors (involuntary) 15.3% 15.0% 15.4% 15.1% Seniority is tiebreaker (involuntary) 27.4% 25.6% 18.2% 17.9% Seniority only factor (involuntary) 24.7% 23.1% 10.6% 12.3%

57
Table 2. Percent of CBAs with combinations of seniority transfer provisions (voluntary and involuntary)
CBA variables Seniority
prohibited from use (involuntary)
Seniority not addressed
(involuntary)
Seniority one of several factors (involuntary)
Seniority is tiebreaker
(involuntary)
Seniority only factor
(involuntary) Seniority prohibited from use (voluntary) 4.5% 1.7% 1.1% 0.4% 0.4%
Seniority not addressed (voluntary) 0.2% 37.8% 5.1% 4.0% 4.0%
Seniority one of several factors (voluntary) 1.1% 3.4% 8.3% 3.8% 1.9%
Seniority is tiebreaker (voluntary) 0.4% 4.0% 0.2% 8.1% 4.7%
Seniority only factor (voluntary) 0.0% 1.7% 0.4% 1.5% 1.3%

58
Table 3. Transfer rates by experience level and CBA transfer provision
Experience level
Same school
Different school, same district
Different district
Leaves teaching workforce
All Districts
0-2 years 75.7% 8.8% 4.6% 10.9% 2-5 years 84.4% 5.7% 2.0% 7.9%
5-10 years 87.2% 4.9% 1.2% 6.6% 10+ years 88.8% 3.8% 0.6% 6.9%
BY CBA VOLUNTARY transfer provision
Experience level
Same school
Different school, same district
Different district
Leaves teaching workforce
Seniority prohibited from use (8.1% of CBAs)
0-2 years 75.3% 8.2% 4.5% 12.0% 2-5 years 83.4% 5.8% 1.6% 9.2%
5-10 years 85.5% 5.6% 1.2% 7.8% 10+ years 88.1% 3.9% 0.7% 7.3%
Seniority not addressed (47.4% of CBAs)
0-2 years 74.0% 9.2% 5.6% 11.3% 2-5 years 83.9% 5.7% 2.4% 8.1%
5-10 years 86.9% 5.2% 1.5% 6.5% 10+ years 88.3% 4.1% 0.7% 6.9%
Seniority one of several factors (19.3% of CBAs)
0-2 years 78.1% 7.9% 3.6% 10.4% 2-5 years 85.7% 5.3% 1.7% 7.3%
5-10 years 87.9% 4.2% 1.2% 6.7% 10+ years 88.9% 3.6% 0.7% 6.8%
Seniority is tiebreaker (19.3% of CBAs)
0-2 years 76.0% 9.4% 4.4% 10.2% 2-5 years 84.3% 6.1% 1.9% 7.8%
5-10 years 87.7% 5.1% 1.2% 6.0% 10+ years 89.3% 3.5% 0.4% 6.7%
Seniority only factor (5.6% of CBAs)
0-2 years 72.9% 10.8% 4.7% 11.6% 2-5 years 83.7% 6.4% 2.4% 7.5%
5-10 years 87.6% 4.2% 0.8% 7.3% 10+ years 89.4% 3.5% 0.6% 6.5%
BY CBA INVOLUNTARY transfer provision
Experience level
Same school
Different school, same district
Different district
Leaves teaching workforce
Seniority prohibited from use (6.1% of CBAs)
0-2 years 77.2% 6.5% 4.8% 11.4% 2-5 years 87.0% 3.6% 1.8% 7.6%
5-10 years 87.9% 3.8% 1.4% 7.0% 10+ years 88.1% 3.8% 0.8% 7.3%
Seniority not addressed (44.4% of CBAs)
0-2 years 74.8% 8.8% 5.1% 11.3% 2-5 years 84.7% 5.2% 2.2% 8.0%
5-10 years 86.8% 5.4% 1.4% 6.5% 10+ years 88.4% 3.9% 0.8% 6.9%
Seniority one of several factors (15.4% of CBAs)
0-2 years 75.2% 8.1% 5.6% 11.2% 2-5 years 83.9% 6.0% 2.1% 8.0%
5-10 years 87.3% 4.7% 1.5% 6.5% 10+ years 88.9% 3.9% 0.7% 6.5%
Seniority is tiebreaker (20.1% of CBAs)
0-2 years 76.2% 8.9% 3.9% 11.0% 2-5 years 84.3% 5.9% 1.9% 7.9%
5-10 years 87.7% 4.5% 1.1% 6.6% 10+ years 88.9% 3.7% 0.5% 6.9%
Seniority only factor (13.9% of CBAs)
0-2 years 75.9% 9.9% 4.0% 10.1% 2-5 years 83.7% 6.5% 1.8% 8.0%
5-10 years 86.9% 5.3% 1.1% 6.8% 10+ years 89.1% 3.6% 0.5% 6.9%
Table 4. Average standardized %URM at sending and receiving schools for within-district transfers

59
Experience level
Receiving school
Sending school Difference
All Districts
0-2 years 0.054 0.070 -0.016* 2-5 years 0.103 0.125 -0.022*
5-10 years 0.093 0.116 -0.023* 10+ years 0.078 0.089 -0.011*
BY CBA VOLUNTARY transfer provision
Experience level
Receiving school
Sending school Difference
Seniority prohibited from use
0-2 years 0.001 0.044 -0.043* 2-5 years 0.042 0.078 -0.036*
5-10 years -0.013 0.026 -0.039* 10+ years -0.102 -0.061 -0.040*
Seniority not addressed
0-2 years -0.030 0.015 -0.045* 2-5 years -0.030 0.018 -0.049*
5-10 years -0.015 0.031 -0.045* 10+ years -0.066 -0.038 -0.028*
Seniority one of several factors
0-2 years 0.235 0.245 -0.010 2-5 years 0.213 0.238 -0.025*
5-10 years 0.306 0.332 -0.026* 10+ years 0.242 0.264 -0.021*
Seniority is tiebreaker
0-2 years 0.028 -0.007 0.035* 2-5 years 0.185 0.169 0.016
5-10 years 0.115 0.098 0.017* 10+ years 0.286 0.246 0.040*
Seniority only factor
0-2 years -0.005 0.024 -0.029* 2-5 years 0.109 0.123 -0.013
5-10 years 0.099 0.138 -0.040* 10+ years -0.196 -0.172 -0.024*
BY CBA INVOLUNTARY transfer provision
Experience level
Receiving school
Sending school Difference
Seniority prohibited from use
0-2 years 0.094 0.100 -0.006 2-5 years -0.081 -0.098 0.017
5-10 years 0.104 0.109 -0.005 10+ years 0.099 0.135 -0.036
Seniority not addressed
0-2 years 0.155 0.156 -0.001 2-5 years 0.149 0.159 -0.010
5-10 years 0.067 0.093 -0.026* 10+ years -0.039 -0.028 -0.010*
Seniority one of several factors
0-2 years -0.027 -0.021 -0.005 2-5 years -0.107 -0.075 -0.032*
5-10 years -0.021 -0.021 0.000 10+ years -0.082 -0.080 -0.002
Seniority is tiebreaker
0-2 years 0.102 0.091 0.011 2-5 years 0.310 0.308 0.002
5-10 years 0.290 0.299 -0.009 10+ years 0.307 0.282 0.024*
Seniority only factor
0-2 years -0.060 0.007 -0.067* 2-5 years 0.005 0.062 -0.058*
5-10 years -0.007 0.044 -0.050* 10+ years 0.048 0.098 -0.050*
NOTE: Significance levels from two-sided t-test: *p<.05.
Table 5. Relationships between teacher experience, school percent URM, CBA transfer provisions, and probability of within-district transfer Logistic regression outcome: Teacher transfers to another school in district (relative to stays in school) 1 2 3 4 5 6 7 8 Type of CBA transfer provisions NONE VOLUNTARY INVOLUNTARY
Log experience -0.397*** -0.428*** -0.357*** -0.503*** -0.353*** -0.505*** -0.372*** -0.529*** (0.019) (0.014) (0.078) (0.051) (0.082) (0.053) (0.084) (0.053)
School %URM (standardized) 0.157*** 0.140*** -0.195** -0.092* -0.137 -0.235 -0.063 -0.250 (0.034) (0.025) (0.070) (0.037) (0.149) (0.139) (0.155) (0.138)
School %URM * log experience 0.168*** 0.112*** 0.142* 0.068 0.130* 0.056 (0.030) (0.013) (0.059) (0.043) (0.062) (0.044)
Seniority prohibited from use -0.106 -0.331 (0.136) (0.172)
Seniority one of several factors -0.106 0.024 (0.115) (0.123)
Seniority is tiebreaker -0.015 -0.054 (0.128) (0.119)
Seniority only factor 0.132 -0.045 (0.191) (0.133)
School %URM * Seniority prohibited from use
0.117 0.124 -0.338* -0.231 (0.108) (0.130) (0.146) (0.187)
School %URM * Seniority one of several factors
-0.081 -0.099 -0.067 -0.013 (0.100) (0.104) (0.149) (0.151)
School %URM * Seniority is tiebreaker
-0.207* -0.303** -0.266* -0.365*** (0.099) (0.104) (0.105) (0.106)
School %URM * Seniority only factor
0.443** 0.153 -0.289* -0.356** (0.157) (0.165) (0.141) (0.118)
School %URM * log experience * Seniority prohibited from use
-0.117* -0.091 0.124** 0.109 (0.047) (0.049) (0.048) (0.058)
School %URM * log experience * Seniority one of several factors
-0.028 -0.004 -0.043 0.001 (0.035) (0.036) (0.060) (0.056)
School %URM * log experience * Seniority is tiebreaker
0.074* 0.079* 0.109** 0.078* (0.037) (0.036) (0.038) (0.037)
School %URM * log experience * Seniority only factor
-0.021 0.034 0.167*** 0.140** (0.043) (0.056) (0.046) (0.045)
District controls YES NO YES NO YES NO YES NO Year/contract year fixed effects YES NO YES NO YES NO YES NO District-by-year fixed effect NO YES NO YES NO YES NO YES Teacher/year observations 172535 172535 172535 172535 172535 172535 172535 172535 NOTES: Significance levels from two-sided t-test: *p<.05; **p<.01; ***p<.001. All coefficients are on the log odds scale. All models control for teacher gender, teacher race, teacher degree level, teacher endorsement area, teacher RIF notice receipt, school level, school enrollment, school growth, and interactions between district controls and school-level variables (enrollment and growth). District controls include district enrollment, percent URM, school-level heterogeneity of percent URM, and (in models that include CBA transfer provisions) CBA provision indicators. In models with teacher experience interactions, all control variables are interacted with teacher experience levels. Standard errors are clustered at the district/year level.

61
Table 6. Novice Teacher Gaps from Simulation
Assumption CBA Provision Governing Involuntary Transfers
%Novice in Disadvantaged Schools
%Novice in Advantaged Schools Gap
Within-district transfers are the only source of inequity
Seniority not addressed 9.68% 9.11% 0.58% Seniority only factor 9.92% 9.00% 0.93%
Within-district transfers and hiring are both sources of inequity
Seniority not addressed 10.12% 8.64% 1.48% Seniority only factor 10.38% 8.53% 1.84%
All types of transfers and hiring are sources of inequity
Seniority not addressed 10.34% 8.42% 1.92% Seniority only factor 10.60% 8.32% 2.28%
*NOTE: See Section V for full description of simulation.

62
Table 7. Relationships between teacher value-added, school percent URM, CBA transfer provisions, and probability of within-district transfer Logistic regression outcome: Teacher transfers to another school in district (relative to stays in school) 1 2 3 4 5 6 7 8 Type of CBA transfer provisions NONE VOLUNTARY INVOLUNTARY
Teacher VAM -0.151*** -0.137*** -0.201 -0.248* -0.115 -0.137 -0.152 -0.148 (0.031) (0.031) (0.135) (0.105) (0.168) (0.110) (0.176) (0.110)
School %URM (standardized) 0.203** 0.196** 0.203** 0.202** 0.241 0.121 0.313 0.214 (0.077) (0.063) (0.077) (0.063) (0.176) (0.331) (0.173) (0.328)
School %URM * teacher VAM 0.000 0.017 0.180 0.311* 0.167 0.315* (0.061) (0.028) (0.121) (0.130) (0.131) (0.131)
Seniority prohibited from use 0.097 -0.514 (0.165) (0.285)
Seniority one of several factors -0.120 0.019 (0.137) (0.154)
Seniority is tiebreaker 0.076 0.027 (0.142) (0.142)
Seniority only factor 0.251 0.131 (0.198) (0.150)
School %URM * Seniority prohibited from use
0.040 -0.248 -0.096 0.727 (0.150) (0.234) (0.223) (0.674)
School %URM * Seniority one of several factors
0.014 -0.284 -0.203 -0.175 (0.118) (0.212) (0.146) (0.274)
School %URM * Seniority is tiebreaker
0.102 -0.096 0.146 -0.023 (0.104) (0.179) (0.114) (0.201)
School %URM * Seniority only factor
0.403 -0.175 0.177 0.156 (0.211) (0.339) (0.133) (0.192)
School %URM * teacher VAM * Seniority prohibited from use
-0.060 -0.101 -0.223 -0.225 (0.092) (0.129) (0.190) (0.330)
School %URM * teacher VAM * Seniority one of several factors
-0.160 -0.176 -0.066 -0.118 (0.093) (0.090) (0.117) (0.136)
School %URM * teacher VAM * Seniority is tiebreaker
-0.100 -0.117 -0.272*** -0.270** (0.061) (0.073) (0.081) (0.090)
School %URM * teacher VAM * Seniority only factor
0.256 0.131 -0.231** -0.207* (0.131) (0.141) (0.086) (0.100)
District controls YES NO YES NO YES NO YES NO Year/contract year fixed effects YES NO YES NO YES NO YES NO District-by-year fixed effect NO YES NO YES NO YES NO YES Teacher/year observations 27329 27329 27329 27329 27329 27329 27329 27329 NOTES: Significance levels from two-sided t-test: *p<.05; **p<.01; ***p<.001. All coefficients are on the log odds scale. All models control for teacher log experience, teacher gender, teacher race, teacher degree level, teacher endorsement area, teacher RIF notice receipt, school level, school enrollment, school growth, and interactions between district controls and school-level variables (enrollment and growth). District controls include district enrollment, percent URM, school-level heterogeneity of percent URM, and (in models that include CBA transfer provisions) CBA provision indicators. In models with teacher experience interactions, all control variables are interacted with teacher experience levels. Standard errors are clustered at the district/year level.

63
Table 8. Relationships between teacher experience, school percent FRL, CBA transfer provisions, and probability of within-district transfer Logistic regression outcome: Teacher transfers to another school in district (relative to stays in school) 1 2 3 4 5 6 7 8 Type of CBA transfer provisions NONE VOLUNTARY INVOLUNTARY
Log experience -0.400*** -0.428*** -0.304** -0.486*** -0.345** -0.549*** -0.383** -0.557*** (0.019) (0.014) (0.107) (0.051) (0.122) (0.053) (0.122) (0.053)
School %FRL (standardized) 0.084** 0.080*** -0.141* -0.134*** 0.316 0.316 0.450* 0.328* (0.027) (0.019) (0.057) (0.034) (0.185) (0.165) (0.185) (0.162)
School %FRL * log experience 0.106*** 0.102*** -0.113 -0.167** -0.160* -0.171** (0.023) (0.014) (0.068) (0.063) (0.070) (0.063)
Seniority prohibited from use -0.111 -0.342* (0.135) (0.166)
Seniority one of several factors -0.099 -0.057 (0.114) (0.124)
Seniority is tiebreaker -0.011 -0.076 (0.133) (0.121)
Seniority only factor 0.360 0.007 (0.243) (0.138)
School %FRL * Seniority prohibited from use
0.048 0.134 -0.468** -0.212 (0.112) (0.118) (0.154) (0.179)
School %FRL * Seniority one of several factors
-0.205 -0.148 -0.134 -0.008 (0.111) (0.099) (0.143) (0.132)
School %FRL * Seniority is tiebreaker
-0.135 -0.117 -0.224* -0.218* (0.113) (0.096) (0.097) (0.097)
School %FRL * Seniority only factor
0.283 0.024 -0.194 -0.147 (0.151) (0.141) (0.117) (0.104)
School %FRL * log experience * Seniority prohibited from use
-0.087 -0.078 0.159** 0.146* (0.045) (0.048) (0.054) (0.067)
School %FRL * log experience * Seniority one of several factors
0.042 0.047 0.056 0.066 (0.040) (0.039) (0.061) (0.053)
School %FRL * log experience * Seniority is tiebreaker
0.049 0.038 0.112** 0.098* (0.043) (0.038) (0.040) (0.039)
School %FRL * log experience * Seniority only factor
-0.065 -0.001 0.138** 0.121** (0.056) (0.056) (0.048) (0.042)
District controls YES NO YES NO YES NO YES NO Year/contract year fixed effects YES NO YES NO YES NO YES NO District-by-year fixed effect NO YES NO YES NO YES NO YES Teacher/year observations 172535 172535 172535 172535 172535 172535 172535 172535 NOTES: Significance levels from two-sided t-test: *p<.05; **p<.01; ***p<.001. All coefficients are on the log odds scale. All models control for teacher gender, teacher race, teacher degree level, teacher endorsement area, teacher RIF notice receipt, school level, school enrollment, school growth, and interactions between district controls and school-level variables (enrollment and growth). District controls include district enrollment, percent FRL, school-level heterogeneity of percent FRL, and (in models that include CBA transfer provisions) CBA provision indicators. In models with teacher experience interactions, all control variables are interacted with teacher experience levels. Standard errors are clustered at the district/year level.

64
Table 9. Relationships between teacher experience, school percent URM, CBA transfer provisions, and probability of cross-district transfer Logistic regression outcome: Teacher transfers to a school in another district (relative to stays in school) 1 2 3 4 5 6 7 8 Type of CBA transfer provisions NONE VOLUNTARY INVOLUNTARY
Log experience -0.917*** -0.910*** -1.068*** -0.981*** -1.104*** -0.952*** -0.991*** -0.951*** (0.028) (0.023) (0.105) (0.097) (0.109) (0.101) (0.106) (0.101)
School %URM (standardized) 0.160*** 0.191*** -0.076 0.013 -0.126 -0.141 -0.015 -0.232 (0.048) (0.053) (0.087) (0.062) (0.170) (0.228) (0.178) (0.235)
School %URM * log experience 0.140** 0.106*** 0.094 0.144* 0.031 0.122 (0.050) (0.020) (0.087) (0.065) (0.091) (0.068)
Seniority prohibited from use -0.093 0.090 (0.186) (0.204)
Seniority one of several factors -0.341* 0.286 (0.160) (0.160)
Seniority is tiebreaker -0.059 0.161 (0.153) (0.166)
Seniority only factor 0.203 0.064 (0.177) (0.164)
School %URM * Seniority prohibited from use
0.104 0.213 0.144 0.430 (0.122) (0.216) (0.113) (0.273)
School %URM * Seniority one of several factors
0.115 -0.009 0.050 0.248 (0.096) (0.173) (0.153) (0.229)
School %URM * Seniority is tiebreaker
-0.126 -0.186 -0.180 -0.069 (0.093) (0.184) (0.096) (0.180)
School %URM * Seniority only factor
0.023 -0.115 -0.277 -0.372 (0.142) (0.306) (0.147) (0.203)
School %URM * log experience * Seniority prohibited from use
-0.053 -0.066 -0.167* -0.125 (0.061) (0.071) (0.080) (0.074)
School %URM * log experience * Seniority one of several factors
-0.092 -0.038 -0.055 -0.013 (0.054) (0.055) (0.082) (0.085)
School %URM * log experience * Seniority is tiebreaker
0.031 0.041 0.018 0.027 (0.049) (0.059) (0.053) (0.055)
School %URM * log experience * Seniority only factor
0.094 0.068 0.058 0.110 (0.057) (0.092) (0.074) (0.079)
District controls YES NO YES NO YES NO YES NO Year/contract year fixed effects YES NO YES NO YES NO YES NO District-by-year fixed effect NO YES NO YES NO YES NO YES Teacher/year observations 165923 165923 165923 165923 165923 165923 165923 165923 NOTES: Significance levels from two-sided t-test: *p<.05; **p<.01; ***p<.001. All coefficients are on the log odds scale. All models control for teacher gender, teacher race, teacher degree level, teacher endorsement area, teacher RIF notice receipt, school level, school enrollment, school growth, and interactions between district controls and school-level variables (enrollment and growth). District controls include district enrollment, percent URM, school-level heterogeneity of percent URM, and (in models that include CBA transfer provisions) CBA provision indicators. In models with teacher experience interactions, all control variables are interacted with teacher experience levels. Standard errors are clustered at the district/year level.

65
Table 10. Relationships between teacher experience, school percent URM, CBA transfer provisions, and probability of exiting the state workforce Logistic regression outcome: Teacher leaves the in-state teaching workforce (relative to stays in school) 1 2 3 4 5 6 7 8 Type of CBA transfer provisions NONE VOLUNTARY INVOLUNTARY
Log experience -0.114*** -0.092*** -0.352*** -0.340*** -0.358*** -0.334*** -0.312*** -0.317*** (0.018) (0.011) (0.062) (0.040) (0.068) (0.042) (0.070) (0.042)
School %URM (standardized) 0.124** 0.133*** -0.003 -0.022 0.270 0.049 0.235 -0.073 (0.039) (0.021) (0.099) (0.033) (0.224) (0.117) (0.217) (0.118)
School %URM * log experience 0.056 0.069*** -0.044 0.021 -0.021 0.049 (0.031) (0.011) (0.069) (0.034) (0.068) (0.036)
Seniority prohibited from use 0.148 -0.039 (0.156) (0.215)
Seniority one of several factors -0.063 0.067 (0.121) (0.126)
Seniority is tiebreaker -0.289 -0.040 (0.156) (0.130)
Seniority only factor 0.043 0.042 (0.160) (0.149)
School %URM * Seniority prohibited from use
0.111 0.221 0.021 0.191 (0.116) (0.118) (0.151) (0.146)
School %URM * Seniority one of several factors
0.124 0.195* 0.266* 0.317* (0.100) (0.094) (0.130) (0.134)
School %URM * Seniority is tiebreaker
0.041 0.232* -0.011 0.047 (0.128) (0.095) (0.094) (0.094)
School %URM * Seniority only factor
0.058 0.010 0.092 0.185 (0.149) (0.157) (0.161) (0.107)
School %URM * log experience * Seniority prohibited from use
-0.007 -0.025 -0.018 0.007 (0.048) (0.041) (0.051) (0.045)
School %URM * log experience * Seniority one of several factors
-0.063 -0.065* -0.119* -0.110* (0.039) (0.032) (0.050) (0.047)
School %URM * log experience * Seniority is tiebreaker
-0.022 -0.014 0.015 0.021 (0.046) (0.032) (0.035) (0.031)
School %URM * log experience * Seniority only factor
0.037 0.061 -0.026 0.001 (0.054) (0.056) (0.052) (0.040)
District controls YES NO YES NO YES NO YES NO Year/contract year fixed effects YES NO YES NO YES NO YES NO District-by-year fixed effect NO YES NO YES NO YES NO YES Teacher/year observations 177532 177532 177532 177532 177532 177532 177532 177532 NOTES: Significance levels from two-sided t-test: *p<.05; **p<.01; ***p<.001. All coefficients are on the log odds scale. All models control for teacher gender, teacher race, teacher degree level, teacher endorsement area, teacher RIF notice receipt, school level, school enrollment, school growth, and interactions between district controls and school-level variables (enrollment and growth). District controls include district enrollment, percent URM, school-level heterogeneity of percent URM, and (in models that include CBA transfer provisions) CBA provision indicators. In models with teacher experience interactions, all control variables are interacted with teacher experience levels. Standard errors are clustered at the district/year level.