
Income, Poverty, and Health Insurance Coverage in … S C E N S U S B U R E A U Helping You Make...
76
U S C E N S U S B U R E A U Helping You Make Informed Decisions P60-235 Current Population Reports Consumer Income Income, Poverty, and Health Insurance Coverage in the United States: 2007 U.S. Department of Commerce Economics and Statistics Administration U.S. CENSUS BUREAU 6 1.1 9 1.4 13.2 1.6 17.1 1.9 * 0.6 12.6 0.7 * 1.1 9.2 1.2 0.9 1.0 7.5 1.1 1.0 7.6 1.3 * 1.1 16.7 1.9 * 1.5 11.9 0.9 0.7 1.5 1.2 1.4 1.2 1.6 * 1.2 0.9 0.7 0.9 0.9 1.1 1.2 14.3 11.8 1.2 9.2 0.7 9.0 10.0 1.0 10.1 1.2 12.7 1.2 11.4 1.3 1 9.0 1.0 9.2 1.1 13.2 1.3 12.7 1.4 1 15.2 0.8 15.4 0.9 1 8.0 1.0 6.7 1.0 9.8 1.1 9.8 1.2 8.0 1.0 8.1 1.1 10.4 1.1 10.2 1.2 1 15.6 1.3 15.2 1.4 1 1.2 1.0 1.7 1.3 1.9 * 1.4 0.7 * 0.6 1.2 0.9 1.1 1.0 1.3 * 1.1 1.9 * 1.5 0.9 0.7 1.5 1.2 1.2 18.8 1.7 14.1 0.7 14.0 12.9 1.0 13.1 12.4 1.2 11.7 10.8 0.8 11.0 14.3 1.3 13.9 1.4 11.8 1.2 11.7 1.3 9.2 0.7 9.0 0.7 10.0 1.0 10.1 1.2 12.7 1.2 11.4 1.3 13.1 9.0 1.0 9.2 1.1 9.6 13.2 1.3 12.7 1.4 13.8 0.8 15.4 0.9 15.2 1.0 6.7 1.0 9.1 1.3 1.2 9.9 1.3 8.1 1.2 1.4 1.6 59,149 59,925 18,979 57,555 34,421 19,890 57,783 35,316 20,538 58,155 37,335 21,977 58,865 37,773 22,425 59,369 37,913 22,561 59,506 39,923 23,100 57,861 41,195 23,330 56,633 39,750 23,355 58,754 39,479 23,221 25,572 63,65 26,160 64,57 41,530 26,691 41,259 26,891 40,898 27,013 40,207 27,612 38,789 27,779 39,792 39,843 39,143 59,506 57,861 56,633 58,754 23,221 58,818 23,702 60,193 23,708 58,922 24,661 59,441 41,021 24,474 59,663 40,412 24,312 40,213 23,820 39,498 38,789 27,779 71,61 39,792 27,798 69,85 39,843 28,203 70,78 39,143 27,995 71,52 38,900 27,995 71,96 38,768 27,691 71,42 38,531 28,421 73,76 39,521 29,309 74,16 40,906 29,931 73,17 41,249 29,829 40,861 40,843 By Carmen DeNavas-Walt Bernadette D. Proctor Jessica C. Smith Issued August 2008
Transcript of Income, Poverty, and Health Insurance Coverage in … S C E N S U S B U R E A U Helping You Make...

U S C E N S U S B U R E A UHelping You Make Informed Decisions
P60-235
Current Population Reports
Consumer Income
Income, Poverty, andHealth Insurance Coverage inthe United States: 2007
U.S. Department of CommerceEconomics and Statistics Administration
U.S. CENSUS BUREAU
14.3
7.6 1.1
11.9 1.4 13.2
1.6 17.1 1.9 *
0.6 12.6 0.7 *
1.1 9.2 1.2 0.9
1.0 7.5 1.1 1.0
7.6 1.3 * 1.1
16.7 1.9 * 1.5
11.9 0.9 0.7
1.5 1.2
1.4 1.2
1.6 * 1.2
0.9 0.7
0.9
0.9
1.1
1.2
14.3
11.8 1.2
9.2 0.7 9.0
10.0 1.0 10.1 1.2
12.7 1.2 11.4 1.3 13.1
9.0 1.0 9.2 1.1 9.6
13.2 1.3 12.7 1.4 13.8
15.2 0.8 15.4 0.9 15.2
8.0 1.0 6.7 1.0 9.1
9.8 1.1 9.8 1.2 9.9
8.0 1.0 8.1 1.1 8.1
10.4 1.1 10.2 1.2 10.8
15.6 1.3 15.2 1.4 15.6
8.6 0.9 8.9 1.1 8.6
1.2 1.0
1.7 1.3
1.9 * 1.4
0.7 * 0.6
1.2 0.9
1.1 1.0
1.3 * 1.1
1.9 * 1.5
0.9 0.7
1.5 1.2
1.2
18.8 1.7
14.1 0.7 14.0
12.9 1.0 13.1
12.4 1.2 11.7
10.8 0.8 11.0
14.3 1.3 13.9 1.4
11.8 1.2 11.7 1.3
9.2 0.7 9.0 0.7
10.0 1.0 10.1 1.2
12.7 1.2 11.4 1.3 13.1
9.0 1.0 9.2 1.1 9.6
13.2 1.3 12.7 1.4 13.8
0.8 15.4 0.9 15.2 1.0
6.7 1.0 9.1 1.3
1.2 9.9 1.3
8.1 1.2
1.4 1.1
1.6 1.3
0.9
59,149
59,925
18,979 57,555
34,421 19,890 57,783
35,316 20,538 58,155
37,335 21,977 58,865
37,773 22,425 59,369
37,913 22,561 59,506
39,923 23,100 57,861
41,195 23,330 56,633
39,750 23,355 58,754
39,479 23,221
63,594
25,572 63,658
26,160 64,575
41,530 26,691
41,259 26,891
40,898 27,013
40,207 27,612
38,789 27,779
39,792
39,843
39,143
59,506
57,861
56,633
58,754
23,221 58,818
23,702 60,193
23,708 58,922
24,661 59,441
41,021 24,474 59,663
40,412 24,312
40,213 23,820
39,498
38,789 27,779 71,616
39,792 27,798 69,858
39,843 28,203 70,785
39,143 27,995 71,520
38,900 27,995 71,968
38,768 27,691 71,428
38,531 28,421 73,762
39,521 29,309 74,161
40,906 29,931 73,170
41,249 29,829
40,861
40,843
ByCarmen DeNavas-WaltBernadette D. ProctorJessica C. Smith
Issued August 2008

Acknowledgments Carmen DeNavas-Walt prepared the income section of this reportunder the direction of Edward J. Welniak Jr., Chief of the IncomeSurveys Branch. Bernadette D. Proctor prepared the poverty sectionand Jessica C. Smith prepared the health insurance coverage section,both under the direction of Sharon Stern, Chief of the Poverty andHealth Statistics Branch. Charles T. Nelson, Assistant Division Chieffor Income, Poverty, and Health Statistics, Housing and HouseholdEconomic Statistics Division, provided overall direction.
Adelle D. Berlinger, George M. Mitcham, Tim J. Marshall, andGregory D. Weyland, Demographic Surveys Division, processed theCurrent Population Survey 2008 Annual Social and EconomicSupplement file. Caroline S. Carbaugh, Chief of the SurveyProcessing Branch, Donna K. Benton, Kirk E. Davis, Vlad Etlin,Stephen Heacock, Hung Pham, and Chandararith R. Phe pro-grammed and produced the detailed and publication tables.
Rebecca A. Hoop, Jana S. Hatch, and Michael E. White, under thesupervision of David V. Hornick and John M. Finamore, all of theDemographic Statistical Methods Division, conducted sample review.
Shannon M. Burnett, Lisa Clement, Tim J. Marshall, andCatherine M. Walker, Demographic Surveys Division, and LeslieFleet and Yogeeta R. Purohit, Technologies Management Office, pre-pared and programmed the computer-assisted interviewing instrumentused to conduct the Annual Social and Economic Supplement.
Additional people within the U.S. Census Bureau also made signifi-cant contributions to the preparation of this report. Victoria Ellison,Krista L. Gray, Marjorie Hanson, John Hisnanick, Cheryl H.Lee, Len Norry, Ashley Provencher, Tracy Roberts, and AmySteinweg reviewed the contents.
Census Bureau field representatives and telephone interviewers col-lected the data. Without their dedication, the preparation of thisreport or any report from the Current Population Survey would beimpossible.
Janet S. Sweeney, Jamie A. Stark, Theodora S. Forgione, andDiane Oliff-Michael, of the Administrative and Customer ServicesDivision, Francis Grailand Hall, Chief, provided publications andprinting management, graphics design and composition, and editorialreview for print and electronic media. General direction and pro-duction management were provided by Claudette E. Bennett,Assistant Division Chief, and Wanda Cevis, Chief, PublicationsServices Branch.
Income, Poverty, and HealthInsurance Coverage in the
United States: 2007P60-235
Issued August 2008
U.S. Department of CommerceCarlos M. Gutierrez,
Secretary
John J. Sullivan,Deputy Secretary
Economics and Statistics AdministrationCynthia A. Glassman,
Under Secretary for Economic Affairs
U.S. CENSUS BUREAU
Steve H. Murdock,
Director
Suggested Citation
DeNavas-Walt, Carmen, Bernadette D.Proctor, and Jessica C. Smith,
U.S. Census Bureau, Current Population Reports, P60-235,
Income, Poverty, and Health InsuranceCoverage in the United States: 2007,
U.S. Government Printing Office,Washington, DC,
2008. ECONOMICS
AND STATISTICS
ADMINISTRATION
Economics and StatisticsAdministration
Cynthia A. Glassman,Under Secretary for Economic Affairs
U.S. CENSUS BUREAU
Steve H. Murdock,Director
Thomas L. Mesenbourg,Acting Deputy Director and Chief Operating Officer
Howard R. Hogan,Associate Director for Demographic Programs
David S. Johnson,Chief, Housing and Household Economic Statistics Division
For sale by the Superintendent of Documents, U.S. Government Printing Office
Internet: bookstore.gpo.gov Phone: toll-free 866-512-1800; DC area 202-512-1800
Fax: 202-512-2250 Mail: Stop SSOP, Washington, DC 20402-0001
U.S. Census Bureau Income, Poverty, and Health Insurance Coverage in the United States: 2007 iii
Contents
TEXT
Income, Poverty, and Health Insurance Coverage in the United States: 2007 . . . . . . . . . . . . . . . . . . . . . . . . . . . . . . . 1
Introduction . . . . . . . . . . . . . . . . . . . . . . . . . . . . . . . . . . . . . . . . . . 1Source of Estimates and Statistical Accuracy . . . . . . . . . . . . . . . . . 1State and Local Estimates of Income, Poverty,
and Health Insurance . . . . . . . . . . . . . . . . . . . . . . . . . . . . . . . . . . 2Dynamics of Economic Well-Being . . . . . . . . . . . . . . . . . . . . . . . . . 4
Income in the United States . . . . . . . . . . . . . . . . . . . . . . . . . . . . . . 5Highlights . . . . . . . . . . . . . . . . . . . . . . . . . . . . . . . . . . . . . . . . . . . 5Household Income . . . . . . . . . . . . . . . . . . . . . . . . . . . . . . . . . . . . . 6Race and Hispanic Origin . . . . . . . . . . . . . . . . . . . . . . . . . . . . . . . . 6Nativity . . . . . . . . . . . . . . . . . . . . . . . . . . . . . . . . . . . . . . . . . . . . . 6Region . . . . . . . . . . . . . . . . . . . . . . . . . . . . . . . . . . . . . . . . . . . . . . 6Metropolitan Status . . . . . . . . . . . . . . . . . . . . . . . . . . . . . . . . . . . . 6Income Inequality . . . . . . . . . . . . . . . . . . . . . . . . . . . . . . . . . . . . . 8Equivalence-Adjusted Income Inequality . . . . . . . . . . . . . . . . . . . . . 9Work Experience and Earnings . . . . . . . . . . . . . . . . . . . . . . . . . . . . 10Per Capita Income . . . . . . . . . . . . . . . . . . . . . . . . . . . . . . . . . . . . . 11
Poverty in the United States . . . . . . . . . . . . . . . . . . . . . . . . . . . . . 12Highlights . . . . . . . . . . . . . . . . . . . . . . . . . . . . . . . . . . . . . . . . . . . 12Race and Hispanic Origin . . . . . . . . . . . . . . . . . . . . . . . . . . . . . . . . 12Age . . . . . . . . . . . . . . . . . . . . . . . . . . . . . . . . . . . . . . . . . . . . . . . . 12Nativity . . . . . . . . . . . . . . . . . . . . . . . . . . . . . . . . . . . . . . . . . . . . . 14Region . . . . . . . . . . . . . . . . . . . . . . . . . . . . . . . . . . . . . . . . . . . . . . 14Metropolitan Status . . . . . . . . . . . . . . . . . . . . . . . . . . . . . . . . . . . . 15Work Experience . . . . . . . . . . . . . . . . . . . . . . . . . . . . . . . . . . . . . . 15Families . . . . . . . . . . . . . . . . . . . . . . . . . . . . . . . . . . . . . . . . . . . . . 15Depth of Poverty . . . . . . . . . . . . . . . . . . . . . . . . . . . . . . . . . . . . . . 15
Ratio of Income to Poverty . . . . . . . . . . . . . . . . . . . . . . . . . . . . 15Income Deficit . . . . . . . . . . . . . . . . . . . . . . . . . . . . . . . . . . . . . 17
Health Insurance Coverage in the United States . . . . . . . . . . . . 19Highlights . . . . . . . . . . . . . . . . . . . . . . . . . . . . . . . . . . . . . . . . . . . 19What Is Health Insurance Coverage? . . . . . . . . . . . . . . . . . . . . . . . . 19Type of Coverage . . . . . . . . . . . . . . . . . . . . . . . . . . . . . . . . . . . . . . 20Race and Hispanic Origin . . . . . . . . . . . . . . . . . . . . . . . . . . . . . . . . 21Nativity . . . . . . . . . . . . . . . . . . . . . . . . . . . . . . . . . . . . . . . . . . . . . 23Economic Status . . . . . . . . . . . . . . . . . . . . . . . . . . . . . . . . . . . . . . . 23Children’s Health Insurance Coverage . . . . . . . . . . . . . . . . . . . . . . 24Region . . . . . . . . . . . . . . . . . . . . . . . . . . . . . . . . . . . . . . . . . . . . . . 24Metropolitan Status . . . . . . . . . . . . . . . . . . . . . . . . . . . . . . . . . . . . 24State-Level Data . . . . . . . . . . . . . . . . . . . . . . . . . . . . . . . . . . . . . . . 26
CPS Data Collection . . . . . . . . . . . . . . . . . . . . . . . . . . . . . . . . . . . . . 27Additional Data and Contacts . . . . . . . . . . . . . . . . . . . . . . . . . . . . . 27
Comments . . . . . . . . . . . . . . . . . . . . . . . . . . . . . . . . . . . . . . . . . . . . . 27
iv Income, Poverty, and Health Insurance Coverage in the United States: 2007 U.S. Census Bureau
TEXT TABLES
1. Income and Earnings Summary Measures by Selected Characteristics: 2006 and 2007 . . . . . . . . . . . . . . 7
2. Income Distribution Measures Using Money Income and Equivalence-Adjusted Income: 2006 and 2007 . . . . . . . . . . . . . . . . . . . . . . . . . . . . . . . . . . . . . . . . . . . . . . . . . . . . . . . . . . . . . . . . . . . 9
3. People and Families in Poverty by Selected Characteristics: 2006 and 2007 . . . . . . . . . . . . . . . . . . . . . . 13
4. People With Income Below Specified Ratios of Their Poverty Thresholds bySelected Characteristics: 2007 . . . . . . . . . . . . . . . . . . . . . . . . . . . . . . . . . . . . . . . . . . . . . . . . . . . . . . . 16
5. Income Deficit or Surplus of Families and Unrelated Individuals by Poverty Status: 2007 . . . . . . . . . . . . 18
6. People Without Health Insurance Coverage by Selected Characteristics: 2006 and 2007 . . . . . . . . . . . . . 22
7. People Without Health Insurance Coverage by Race and Hispanic Origin Using 2- and 3-Year Averages: 2004–2005 and 2006–2007 . . . . . . . . . . . . . . . . . . . . . . . . . . . . . . . . . . . . . . . . . . . . 23
8. Number and Percentage of People Without Health Insurance Coverage by State Using 2- and 3-Year Averages: 2004–2005 and 2006–2007 . . . . . . . . . . . . . . . . . . . . . . . . . . . . . . . . . . . . . . . . . . . . 25
FIGURES
1. Real Median Household Income: 1967 to 2007 . . . . . . . . . . . . . . . . . . . . . . . . . . . . . . . . . . . . . . . . . . . . 5
2. Female-to-Male Earnings Ratio and Median Earnings of Full-Time, Year-Round Workers 15 Years and Older by Sex: 1960 to 2007 . . . . . . . . . . . . . . . . . . . . . . . . . . . . . . . . . . . . . . . . . . . . . . . 11
3. Number in Poverty and Poverty Rate: 1959 to 2007 . . . . . . . . . . . . . . . . . . . . . . . . . . . . . . . . . . . . . . . . 12
4. Poverty Rates by Age: 1959 to 2007 . . . . . . . . . . . . . . . . . . . . . . . . . . . . . . . . . . . . . . . . . . . . . . . . . . . . 14
5. Distribution of Income-to-Poverty Ratios: 2007 . . . . . . . . . . . . . . . . . . . . . . . . . . . . . . . . . . . . . . . . . . . . 17
6. Number Uninsured and Uninsured Rate: 1987 to 2007 . . . . . . . . . . . . . . . . . . . . . . . . . . . . . . . . . . . . . . 20
7. Coverage by Type of Health Insurance: 2006 and 2007 . . . . . . . . . . . . . . . . . . . . . . . . . . . . . . . . . . . . . 21
8. Uninsured Children by Poverty Status, Age, and Race and Hispanic Origin: 2007 . . . . . . . . . . . . . . . . . . 24
9. Differences in 2-Year-Average Uninsured Rates by State: 2006–2007 Less 2004–2005 . . . . . . . . . . . . . . 26
APPENDIXES
Appendix A. Estimates of Income . . . . . . . . . . . . . . . . . . . . . . . . . . . . . . . . . . . . . . . . . . . . . . . . . . . . . . . . 29How Income Is Measured . . . . . . . . . . . . . . . . . . . . . . . . . . . . . . . . . . . . . . . . . . . . . . . . . . . . . . . . . . . 29Recessions . . . . . . . . . . . . . . . . . . . . . . . . . . . . . . . . . . . . . . . . . . . . . . . . . . . . . . . . . . . . . . . . . . . . . . 29Cost of Living Adjustment . . . . . . . . . . . . . . . . . . . . . . . . . . . . . . . . . . . . . . . . . . . . . . . . . . . . . . . . . . . 30
Appendix B. Estimates of Poverty . . . . . . . . . . . . . . . . . . . . . . . . . . . . . . . . . . . . . . . . . . . . . . . . . . . . . . . . 45How Poverty Is Calculated . . . . . . . . . . . . . . . . . . . . . . . . . . . . . . . . . . . . . . . . . . . . . . . . . . . . . . . . . . . 45
Appendix C. Estimates of Health Insurance Coverage . . . . . . . . . . . . . . . . . . . . . . . . . . . . . . . . . . . . . . 59Quality of Health Insurance Coverage Estimates . . . . . . . . . . . . . . . . . . . . . . . . . . . . . . . . . . . . . . . . . . 59
Appendix D. Comparison of State Health Insurance Coverage Estimates . . . . . . . . . . . . . . . . . . . . . . 71
U.S. Census Bureau Income, Poverty, and Health Insurance Coverage in the United States: 2007 v
APPENDIX TABLES AND FIGURES
A-1. Households by Total Money Income, Race, and Hispanic Origin of Householder: 1967 to 2007 . . . . . . . 31
A-2. Real Median Earnings of Full-Time, Year-Round Workers by Sex and Female-to-MaleEarnings Ratio: 1960 to 2007 . . . . . . . . . . . . . . . . . . . . . . . . . . . . . . . . . . . . . . . . . . . . . . . . . . . . . . . . 38
A-3. Selected Measures of Household Income Dispersion: 1967 to 2007 . . . . . . . . . . . . . . . . . . . . . . . . . . . . 40
B-1. Poverty Status of People by Family Relationship, Race, and Hispanic Origin: 1959 to 2007 . . . . . . . . . . 46
B-2. Poverty Status of People by Age, Race, and Hispanic Origin: 1959 to 2007 . . . . . . . . . . . . . . . . . . . . . . 52
B-3. Poverty Status of Families by Type of Family: 1959 to 2007 . . . . . . . . . . . . . . . . . . . . . . . . . . . . . . . . . . 58
C-1. Health Insurance Coverage: 1987 to 2007 . . . . . . . . . . . . . . . . . . . . . . . . . . . . . . . . . . . . . . . . . . . . . . . 61
C-2. Health Insurance Coverage by Race and Hispanic Origin: 1999 to 2007 . . . . . . . . . . . . . . . . . . . . . . . . . 62
C-3. Health Insurance Coverage by Age: 1999 to 2007 . . . . . . . . . . . . . . . . . . . . . . . . . . . . . . . . . . . . . . . . . 66
D-1. Three-Year-Average Percentage of People Without Health Insurance Coverage by State: 2005 to 2007 . . . . . . . . . . . . . . . . . . . . . . . . . . . . . . . . . . . . . . . . . . . . . . . . . . . . . . . . . . . . . 71
U.S. Census Bureau Income, Poverty, and Health Insurance Coverage in the United States: 2007 1
Income, Poverty, and Health Insurance Coverage in the United States: 2007
Introduction
This report presents data on income,poverty, and health insurance cover-age in the United States based oninformation collected in the 2008 andearlier Annual Social and EconomicSupplements (ASEC) to the CurrentPopulation Survey (CPS) conducted bythe U.S. Census Bureau.
Data presented in this report indicatethe following:
• Real median household incomeincreased between 2006 and2007—the third annual increase.1
• The poverty rate was not statisti-cally different between 2006 and2007.
• Both the number and the percent-age of people without health
1 All income values are adjusted to reflect2007 dollars. “Real” refers to income afteradjusting for inflation. The adjustment is basedon percentage changes in prices between earlieryears and 2007 and is computed by dividing theannual average Consumer Price Index ResearchSeries (CPI-U-RS) for 2007 by the annual averagefor earlier years. The CPI-U-RS values for 1947 to2007 are available in Appendix A and on theInternet at <www.census.gov/hhes/www/income/income07/AA-CPI-U-RS.pdf>. Inflation between2006 and 2007 was 2.8 percent.
insurance coverage decreased unchanged for Asians and Hispanics;between 2006 and 2007. the poverty rate increased for children
under 18 years old but remained sta-These results were not uniform across tistically unchanged for people 18 togroups. For example, between 2006 64 years old and people 65 and over;and 2007, real median household and the percentage of people withoutincome rose for non-Hispanic Whites health insurance decreased for theand Blacks but remained statistically native-born population, while the
The data in this report are from the Annual Social and Economic Supplement(ASEC) to the 2008 Current Population Survey (CPS). The population repre-sented (the population universe) is the civilian noninstitutionalized popula-tion living in the United States. Members of the Armed Forces living off postor with their families on post are included if at least one civilian adult livesin the household. Most of the data from the CPS ASEC were collected inMarch (with some data collected in February and April), and the data werecontrolled to independent population estimates for March 2008. The esti-mates in this report (which may be shown in text, figures, and tables) arebased on responses from a sample of the population and may differ fromactual values because of sampling variability or other factors. As a result,apparent differences between the estimates for two or more groups may notbe statistically significant. All comparative statements have undergone sta-tistical testing and are significant at the 90-percent confidence level unlessotherwise noted. Further information about the source and accuracy of theestimates is available at <www.census.gov/hhes/www/p60_235sa.pdf>.
Source of Estimates and Statistical Accuracy
foreign-born population remained sta-tistically unchanged.2, 3
These results are discussed in moredetail in the three main sections of thisreport—income, poverty, and health
2 Income, Poverty, and Health Insurance Coverage in the United States: 2007 U.S. Census Bureau
2 Federal surveys now give respondents theoption of reporting more than one race.Therefore, two basic ways of defining a racegroup are possible. A group such as Asian maybe defined as those who reported Asian and noother race (the race-alone or single-race concept)or as those who reported Asian regardless ofwhether they also reported another race (therace-alone-or-in-combination concept). The bodyof this report (text, figures, and text tables)shows data using the first approach (race alone).The appendix tables show data using bothapproaches. Use of the single-race populationdoes not imply that it is the preferred method ofpresenting or analyzing data. The Census Bureauuses a variety of approaches.
insurance coverage. Each sectionpresents estimates by characteristicssuch as race, Hispanic origin, nativity,and region. Other topics include earn-ings of year-round, full-time workers;families in poverty; and health
In this report, the term “non-Hispanic White”refers to people who are not Hispanic and whoreported White and no other race. The CensusBureau uses non-Hispanic Whites as the compari-son group for other race groups and Hispanics.
Because Hispanics may be any race, data inthis report for Hispanics overlap with data forracial groups. Being Hispanic was reported by13.0 percent of White householders who reportedonly one race, 3.0 percent of Black householderswho reported only one race, and 1.9 percent ofAsian householders who reported only one race.
Data users should exercise caution wheninterpreting aggregate results for the Hispanicpopulation or for race groups because these pop-ulations consist of many distinct groups that dif-fer in socioeconomic characteristics, culture, andrecency of immigration. In addition, the CPS does
insurance coverage of children. Thisreport concludes with a section dis-cussing health insurance coverage bystate using 2- and 3-year averages.
not use separate population controls for weight-ing the Asian sample to national totals. Data werefirst collected for Hispanics in 1972 and forAsians and Pacific Islanders in 1987. For furtherinformation, see <www.bls.census.gov/cps/ads/adsmain.htm>.
3 The householder is the person (or one of thepeople) in whose name the home is owned orrented and the person to whom the relationshipof other household members is recorded. If amarried couple owns the home jointly, either thehusband or the wife may be listed as the house-holder. Since only one person in each householdis designated as the householder, the number ofhouseholders is equal to the number of house-holds. This report uses the characteristics of thehouseholder to describe the household.
With the full implementation of the AmericanCommunity Survey (ACS) to approximately 3 millionaddresses in 2005 and the lower standard errors thatresulted from that sample size and design, the CensusBureau presents annual state estimates of medianhousehold income and poverty from the ACS, includingcomparisons of change from 2006 to 2007, in thereport Income, Earnings, and Poverty Data From the2007 American Community Survey. For trend analysisover a longer time period, state-level estimates ofmedian household income and poverty rates from theCPS ASEC are available on the Internet.
While the ACS produces annual single-year estimates ofincome and poverty for counties and places with popu-lation of 65,000 or more, the Census Bureau’s SmallArea Income and Poverty Estimates (SAIPE) program alsoproduces single-year estimates of median householdincome and poverty for states and all counties, as wellas population and poverty estimates for school districts.These estimates are based on models using data from avariety of sources, including current surveys, adminis-trative records, and personal income data published bythe Bureau of Economic Analysis. In general, SAIPE esti-mates have lower variance than ACS estimates but are
released later because they incorporate ACS data in themodels. Estimates for 2005 are available on the Internetat <www.census.gov/hhes/www/saipe/index.html>.Estimates for 2006 and 2007 will be available later this year.
In 2008, the ACS added a question on health insurancecoverage to the survey. Data from the new health insur-ance item will be available in fall 2009. Since healthinsurance estimates are not currently available from theACS, this report includes the state uninsured rates using2- and 3-year averages from the CPS ASEC. The CensusBureau’s Small Area Health Insurance Estimates (SAHIE)program produces estimates of health insurance cover-age rates for states and all counties. In July 2005, theSAHIE program released the first nationwide set ofcounty-level estimates on the number of people withouthealth insurance coverage for all ages and those under18 years old. Estimates for 2000 are available on theInternet at <www.census.gov/hhes/www/sahie/index.html>. Later this year, the SAHIE programwill release 2005 estimates of health insurance cover-age by age, sex, race, Hispanic origin, and income cate-gories at the state level and by age, sex, and incomecategories at the county level.
State and Local Estimates of Income, Poverty, and Health Insurance

The Census Bureau recognizes thatmeasuring money income may notcompletely capture the economic well-being of individuals and families.4
Families and individuals also deriveeconomic well-being from noncashbenefits, such as food stamps andhousing subsidies, and they havereductions in disposable income dueto taxes. While the income andpoverty estimates shown in this reportare based solely on money incomebefore taxes and do not include thevalue of noncash benefits, the Census
U.S. Census Bureau Income, Poverty, and Health Insurance Coverage in the United States: 2007 3
4 For the purpose of the official poverty cal-culations in this report, families are defined asincluding all people residing together andrelated by birth, marriage, or adoption. As aresult, families in which two unmarried parentsreside with their child (or children) are treatedas two units—a single-parent family and anunrelated individual. The 2007 ASEC included anew direct question to capture the relationshipof couples that do not include the householder,in addition to those who are already identifiedas the unmarried partner of the householder.The addition of a second-parent pointer to chil-dren’s records adds accuracy to the measure-ment of coresidence of children and their par-ents and increases the number of children livingwith two parents by 2.2 million. As part ofresearch into alternative measurements ofpoverty, one research project examined theeffect of including the second parent as part ofthe family. The official rate for 2006 was 12.3percent, or 36.5 million people. Preliminary esti-mates taking account of new relationships yielda 2006 poverty rate of approximately 11.2 per-cent. This result suggests that about 3.4 millionindividuals classified as poor under the officialmeasure may be sharing resources with othersthat allow them to adequately meet their basicneeds. For more details, see Short, Kathleen andJason Fields, Poverty Measures That TakeAccount of New Data on Relationship WithinHouseholds in the ASEC 2007, PovertyMeasurement Working Paper, forthcoming andKreider, Rose, Improvements to DemographicHousehold Data in the Current PopulationSurvey: 2007, Housing and Household EconomicStatistics Division Working Paper.
Bureau computes a number of alterna- ASEC is to provide timely and detailedtive measures of income and poverty estimates of income, poverty, andthat do attempt to account for those health insurance coverage and tofactors. These alternatives fall into two measure change in those estimates atcategories: poverty measures based on the national level. The CPS ASEC isthe recommendations of the National the official source of the nationalAcademy of Sciences (called NAS- poverty estimates calculated in accor-based measures on the Census dance with the Office of ManagementBureau’s Web site) and income and and Budget’s (OMB) Statistical Policypoverty estimates that use various Directive 14 (Appendix B). formulas to add or subtract from
The Census Bureau also reportsresources and examine the incremen-
income and poverty estimates basedtal impact of these changes (called
on data from the American Community“Effects of Taxes and Transfers” on the
Survey (ACS). The ACS is part of theCensus Bureau’s Web site).
2010 Decennial Census Program andAlternative measures for 2006 are has eliminated the need for a long-available in detailed tables and in form sample questionnaire. The ACSmicrodata form. The tables based on offers broad, comprehensive informa-NAS recommendations are available on tion on social, economic, and housingthe Internet at <www.census.gov data and is designed to provide this/hhes/www/povmeas/tables.html>, information at many levels of geogra-and the “Effects of Taxes and phy, particularly for local communities.Transfers” tables are available on the
Since the CPS ASEC produces moreInternet at <pubdb3.census.govcomplete and thorough estimates of/macro/032007/alttoc/toc.htm>. The
Census Bureau also has a Web-based income and poverty, the Census Bureau
tool for researchers to explore alterna- recommends that people use it as the
tive income and poverty measures. data source for national estimates.
The tool is available in a link from the Estimates for income and poverty at“Microdata Access” page on the the state level and for smaller geo-poverty Web site <www.census.gov graphic entities can be found in the/hhes/www/poverty/microdata.html>. ACS report Income, Earnings, andThe Census Bureau will release the Poverty Data From the 2007 American2007 data on alternative measures of Community Survey. This CPS ASECincome and poverty later this year. report includes state-level estimates for
health insurance coverage. For moreThe CPS is the longest-running surveyinformation on state and local esti-conducted by the Census Bureau. Themates, see the text box “State andCPS ASEC asks detailed questions cat-Local Estimates of Income, Poverty, andegorizing income into over 50Health Insurance.”sources. The key purpose of the CPS
The CPS ASEC provides reliableestimates of the net change, from oneyear to the next, in the overalldistribution of economic characteris-tics of the population, such as incomeand earnings, but it does not showhow those characteristics change forthe same person, family, or house-hold. Longitudinal measures ofincome, poverty, and health insurancecoverage that are based on followingthe same people over time are avail-able from the Survey of Income andProgram Participation (SIPP). Estimatesderived from SIPP data answer ques-tions such as:
• What percentage of householdsmove up or down the income dis-tribution over time?
• How many people remain inpoverty over time?
• How long do people without healthinsurance tend to remain unin-sured?
The text box “Dynamics of EconomicWell-Being” provides more information.
4 Income, Poverty, and Health Insurance Coverage in the United States: 2007 U.S. Census Bureau
The Survey of Income and Program Participation (SIPP) provides monthlydata about the labor force participation, income sources and amounts, andhealth insurance coverage of individuals, families, and households duringthe time span covered by each of its panels. The data yield insights into thedynamic nature of these experiences and the economic mobility of U.S. resi-dents.* For example, the data demonstrate that using a longer time frame tomeasure poverty (e.g., 2 years) yields, on average, a lower poverty rate thanthe annual measures presented in this report, while using a shorter timeframe (e.g., 1 month) yields higher poverty rates. Some specific findingsfrom the 2001 Panel include:
• Of households in the lowest income quintile in 2001, 28.6 percent werein a higher quintile in 2003; of those originally in the highest incomequintile, 32.1 percent were in a lower quintile 2 years later.
• Households with householders who had lower levels of education weremore likely to remain in or move into a lower quintile than householdswhose householders had higher levels of education.
• Nearly one-third of the population had at least one spell of poverty last-ing 2 or more months during the 3-year period from 2001 to 2003.
• Chronic poverty was relatively uncommon, with 2.4 percent of the pop-ulation living in poverty all 36 months of the period.
More information based on these data is available in a series of reports titledthe Dynamics of Economic Well-Being, as well as in table packages and work-ing papers.
The Census Bureau is in the process of reengineering the SIPP for 2013.The reconstructed survey is expected to reduce respondent burden andattrition and deliver data on a timely basis, while addressing the sametopic areas of the earlier SIPP panels. For more information, see<www.sipp.census.gov/sipp>.
Dynamics of Economic Well-Being
* The 2001 SIPP Panel collected data from February 2001 through January 2004; the microdataare currently available to download. The 2004 SIPP Panel collected data from February 2004through January 2008. The data are being released on a flow basis, with a complete datasetscheduled to be released in 2009. See the SIPP Web site for details <www.sipp.census.gov/sipp>.
INCOME IN THE UNITED STATES
Highlights
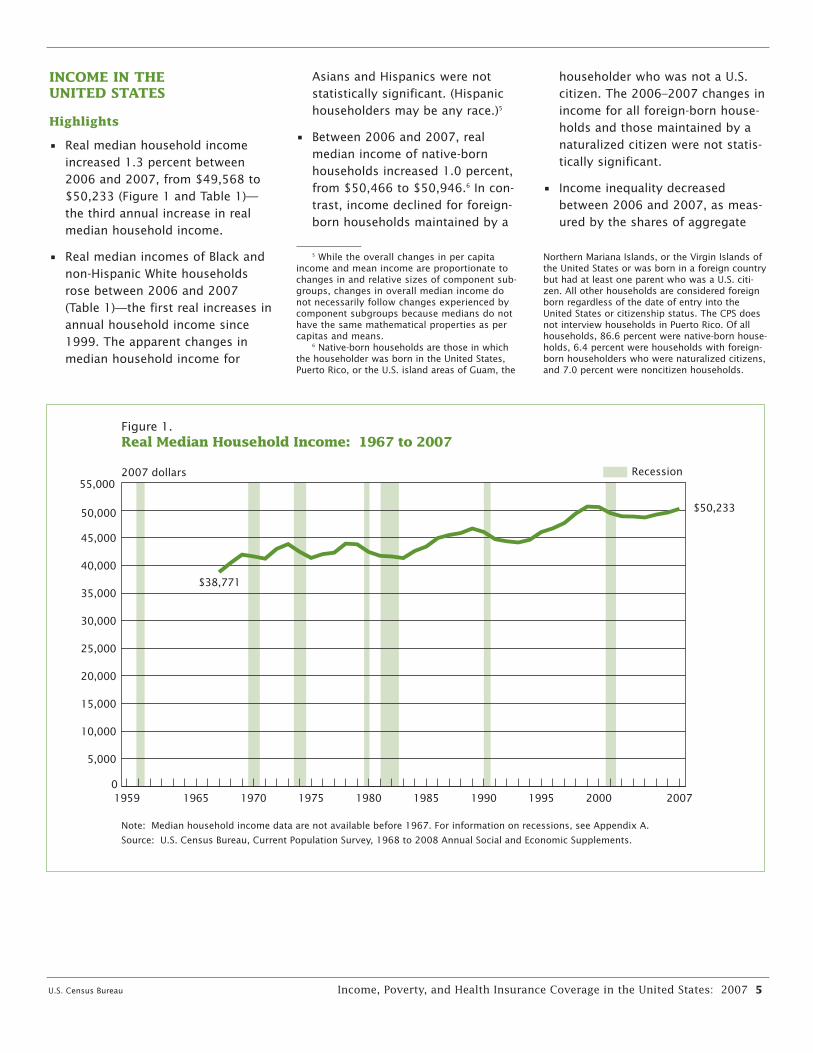
• Real median household incomeincreased 1.3 percent between2006 and 2007, from $49,568 to$50,233 (Figure 1 and Table 1)—the third annual increase in realmedian household income.
• Real median incomes of Black andnon-Hispanic White householdsrose between 2006 and 2007(Table 1)—the first real increases inannual household income since1999. The apparent changes inmedian household income for
Asians and Hispanics were notstatistically significant. (Hispanichouseholders may be any race.)5
• Between 2006 and 2007, realmedian income of native-bornhouseholds increased 1.0 percent,from $50,466 to $50,946.6 In con-trast, income declined for foreign-born households maintained by a
U.S. Census Bureau Income, Poverty, and Health Insurance Coverage in the United States: 2007 5
5 While the overall changes in per capitaincome and mean income are proportionate tochanges in and relative sizes of component sub-groups, changes in overall median income donot necessarily follow changes experienced bycomponent subgroups because medians do nothave the same mathematical properties as percapitas and means.
6 Native-born households are those in whichthe householder was born in the United States,Puerto Rico, or the U.S. island areas of Guam, the
householder who was not a U.S.citizen. The 2006–2007 changes inincome for all foreign-born house-holds and those maintained by anaturalized citizen were not statis-tically significant.
• Income inequality decreasedbetween 2006 and 2007, as meas-ured by the shares of aggregate
Northern Mariana Islands, or the Virgin Islands ofthe United States or was born in a foreign countrybut had at least one parent who was a U.S. citi-zen. All other households are considered foreignborn regardless of the date of entry into theUnited States or citizenship status. The CPS doesnot interview households in Puerto Rico. Of allhouseholds, 86.6 percent were native-born house-holds, 6.4 percent were households with foreign-born householders who were naturalized citizens,and 7.0 percent were noncitizen households.
Figure 1.Real Median Household Income: 1967 to 2007
Note: Median household income data are not available before 1967. For information on recessions, see Appendix A.
Source: U.S. Census Bureau, Current Population Survey, 1968 to 2008 Annual Social and Economic Supplements.
2007 dollars Recession
0
5,000
10,000
15,000
20,000
25,000
30,000
35,000
40,000
45,000
50,000
55,000
20072000 19951990198519801975197019651959
$50,233
$38,771

household income by quintiles andthe Gini index (Table 1).7
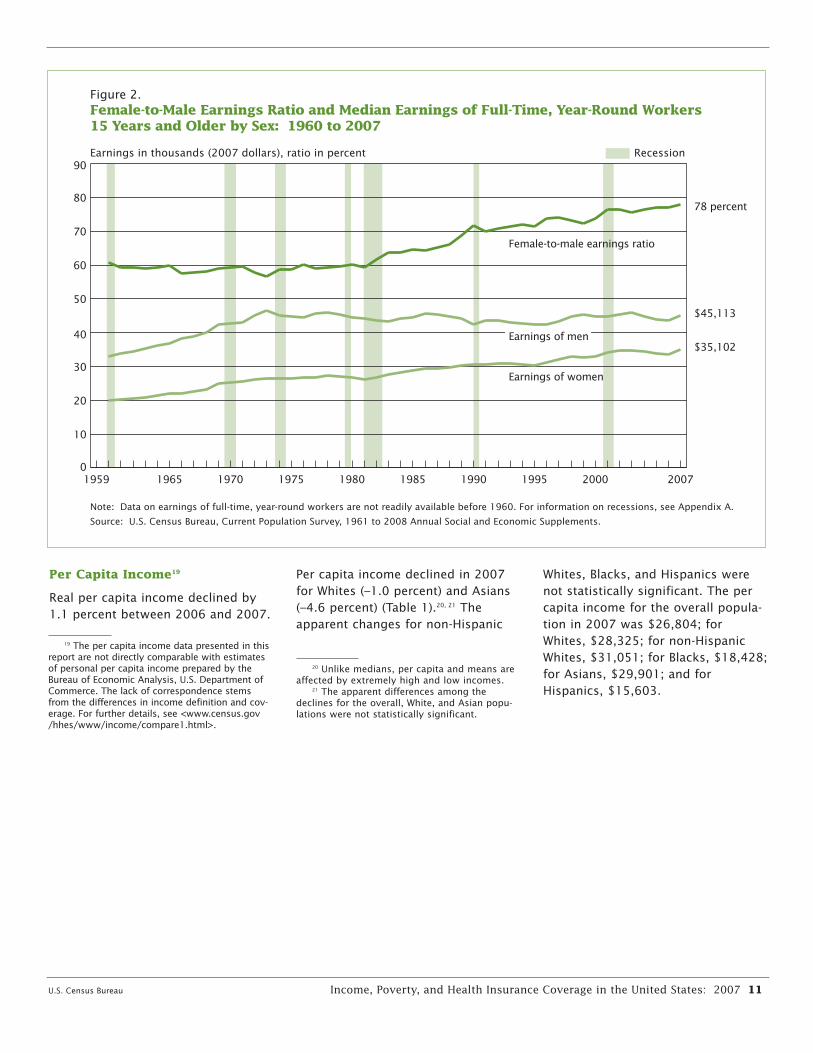
• Real median earnings of both menand women who worked full-time,year-round rose between 2006 and2007, following 3 years of annualdeclines. Men’s earnings increasedby 3.8 percent to $45,113,women’s by 5.0 percent to$35,102. The 2007 female-to-maleearnings ratio, 0.78, is an all-timehigh (Table 1 and Figure 2).
• Real per capita income declined by1.1 percent between 2006 and2007. Per capita income alsodeclined in 2007 for Whites (-1.0percent) and Asians (-4.6 percent)(Table 1).8 The apparent changesfor non-Hispanic Whites, Blacks,and Hispanics were not statisticallysignificant.
Household Income
Between 2006 and 2007, real medianhousehold income rose 1.3 percent,from $49,568 to $50,233 (Figure 1and Table 1)—a level not statisticallydifferent from the 1999 prerecessionincome peak. This was the thirdannual increase in real median house-hold income. Compared with 1967,the first year for which householdincome statistics are available, realmedian household income hasincreased 29.6 percent.9
6 Income, Poverty, and Health Insurance Coverage in the United States: 2007 U.S. Census Bureau
7 See “What Are Shares of AggregateHousehold Income and a Gini Index?,” Income,Earnings, and Poverty Data From the 2007American Community Survey, AmericanCommunity Survey Reports, ACS-09, August2008, <www.census.gov/prod/2008pubs/acs-09.pdf>.
8 The apparent differences among the per-cent changes for the overall, White, and Asianpopulations were not statistically significant.
9 Using the CPI-U, instead of the CPI-U-RS,real median household income increased 13.3percent since 1967. For a further discussionabout the Census Bureau’s use of the ConsumerPrice Index, see Appendixes C and D, MoneyIncome in the United States: 1998, U.S. CensusBureau, Current Population Reports, P60-206,September 1999, <www.census.gov/prod/99pubs/p60-206.pdf>.
Race and Hispanic Origin
The real median incomes of Blackhouseholds and non-Hispanic Whitehouseholds rose between 2006 and2007 (Table 1)—the first realincreases in annual income for thesehouseholds since 1999. The apparentincrease between 2006 and 2007 inmedian household income for Asiansand the apparent decline forHispanics were not statistically signif-icant. Annual increases in real house-hold income last occurred in 2000 forthese households.
Among the race groups and Hispanics,Black households had the lowestmedian income in 2007, $33,916,which was 62 percent of the medianfor non-Hispanic White households,$54,920.10 Asian households had thehighest median income, $66,103,about 120 percent of the median fornon-Hispanic White households. Themedian income for Hispanic house-holds was $38,679 in 2007, whichwas 70 percent of the median for non-Hispanic White households.
Nativity
Between 2006 and 2007, the realmedian income of native-born house-holds rose by 1.0 percent to $50,946.This was the second annual increasein real median household income fornative-born households. The incomeof foreign-born households whosehouseholder was not a U.S. citizendropped by 7.3 percent to $37,637after increasing 4.1 percent in 2006(Table 1). The apparent declines forall foreign-born households and thosemaintained by a naturalized citizenwere not statistically significant. Themedian income of foreign-bornhouseholds in 2007 was $44,230. Forhouseholds maintained by a natural-ized citizen, the median income was
10 The distribution of household income isinfluenced by many factors, such as the numberof earners and household size.
$52,092, higher than the income ofnative-born households.
Region
Real median household incomes rosein the Midwest (by 2.2 percent) andthe South (by 2.3 percent), declinedin the Northeast (by 2.4 percent), andremained statistically unchanged inthe West between 2006 and 2007.11,12
Before 2007, the Midwest and Southregions had not experienced annualincreases in income since 1999; theNortheast and West regions last expe-rienced annual increases in 2005. In2007, households in the West had thehighest median household income($54,138), followed by households inthe Northeast ($52,274), the Midwest($50,277), and the South ($46,186).
Metropolitan Status
The real median income for house-holds outside metropolitan statisticalareas rose by 3.1 percent to $40,615between 2006 and 2007 and contin-ued to have a lower income thanhouseholds inside metropolitan statis-tical areas ($51,831, not statisticallydifferent from their 2006 level).Within metropolitan statistical areas,households outside principal citieshad the highest 2007 median income,$57,444, compared with $44,205 forhouseholds inside principal cities—neither was statistically different fromits 2006 level.
11 The Northeast region includes the states ofConnecticut, Maine, Massachusetts, NewHampshire, New Jersey, New York, Pennsylvania,Rhode Island, and Vermont. The Midwest regionincludes the states of Illinois, Indiana, Iowa,Kansas, Michigan, Minnesota, Missouri, Nebraska,North Dakota, Ohio, South Dakota, andWisconsin. The South region includes the statesof Alabama, Arkansas, Delaware, Florida, Georgia,Kentucky, Louisiana, Maryland, Mississippi, NorthCarolina, Oklahoma, South Carolina, Tennessee,Texas, Virginia, West Virginia, and the District ofColumbia, a state equivalent. The West regionincludes the states of Alaska, Arizona, California,Colorado, Hawaii, Idaho, Montana, Nevada, NewMexico, Oregon, Utah, Washington, and Wyoming.
12 The apparent difference between theincreases in median household income in theMidwest and the South was not statistically sig-nificant.
U.S. Census Bureau Income, Poverty, and Health Insurance Coverage in the United States: 2007 7
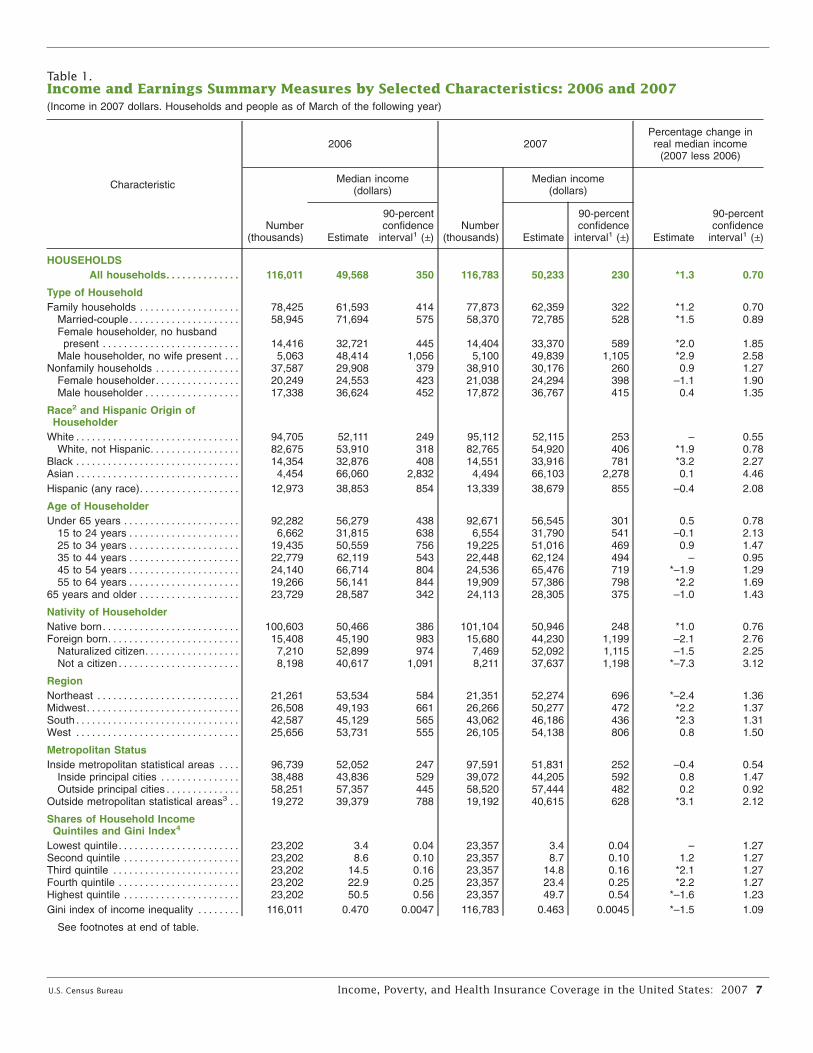
Table 1.Income and Earnings Summary Measures by Selected Characteristics: 2006 and 2007(Income in 2007 dollars. Households and people as of March of the following year)
Characteristic
2006 2007Percentage change inreal median income
(2007 less 2006)
Number(thousands)
Median income(dollars)
Number(thousands)
Median income(dollars)
Estimate
90-percentconfidence
interval1 (±)Estimate
90-percentconfidence
interval1 (±) Estimate
90-percentconfidence
interval1 (±)
HOUSEHOLDSAll households. . . . . . . . . . . . . .
Type of Household
116,011 49,568 350 116,783 50,233 230 *1.3 0.70
Family households . . . . . . . . . . . . . . . . . . . 78,425 61,593 414 77,873 62,359 322 *1.2 0.70Married-couple. . . . . . . . . . . . . . . . . . . . .Female householder, no husband
58,945 71,694 575 58,370 72,785 528 *1.5 0.89
present . . . . . . . . . . . . . . . . . . . . . . . . . . 14,416 32,721 445 14,404 33,370 589 *2.0 1.85Male householder, no wife present . . . 5,063 48,414 1,056 5,100 49,839 1,105 *2.9 2.58
Nonfamily households . . . . . . . . . . . . . . . . 37,587 29,908 379 38,910 30,176 260 0.9 1.27Female householder. . . . . . . . . . . . . . . . 20,249 24,553 423 21,038 24,294 398 –1.1 1.90Male householder . . . . . . . . . . . . . . . . . .
Race2 and Hispanic Origin ofHouseholder
17,338 36,624 452 17,872 36,767 415 0.4 1.35
White . . . . . . . . . . . . . . . . . . . . . . . . . . . . . . . 94,705 52,111 249 95,112 52,115 253 – 0.55White, not Hispanic. . . . . . . . . . . . . . . . . 82,675 53,910 318 82,765 54,920 406 *1.9 0.78
Black . . . . . . . . . . . . . . . . . . . . . . . . . . . . . . . 14,354 32,876 408 14,551 33,916 781 *3.2 2.27Asian . . . . . . . . . . . . . . . . . . . . . . . . . . . . . . . 4,454 66,060 2,832 4,494 66,103 2,278 0.1 4.46Hispanic (any race). . . . . . . . . . . . . . . . . . .
Age of Householder
12,973 38,853 854 13,339 38,679 855 –0.4 2.08
Under 65 years . . . . . . . . . . . . . . . . . . . . . . 92,282 56,279 438 92,671 56,545 301 0.5 0.7815 to 24 years . . . . . . . . . . . . . . . . . . . . . 6,662 31,815 638 6,554 31,790 541 –0.1 2.1325 to 34 years . . . . . . . . . . . . . . . . . . . . . 19,435 50,559 756 19,225 51,016 469 0.9 1.4735 to 44 years . . . . . . . . . . . . . . . . . . . . . 22,779 62,119 543 22,448 62,124 494 – 0.9545 to 54 years . . . . . . . . . . . . . . . . . . . . . 24,140 66,714 804 24,536 65,476 719 *–1.9 1.2955 to 64 years . . . . . . . . . . . . . . . . . . . . . 19,266 56,141 844 19,909 57,386 798 *2.2 1.69
65 years and older . . . . . . . . . . . . . . . . . . .
Nativity of Householder
23,729 28,587 342 24,113 28,305 375 –1.0 1.43
Native born. . . . . . . . . . . . . . . . . . . . . . . . . . 100,603 50,466 386 101,104 50,946 248 *1.0 0.76Foreign born. . . . . . . . . . . . . . . . . . . . . . . . . 15,408 45,190 983 15,680 44,230 1,199 –2.1 2.76
Naturalized citizen. . . . . . . . . . . . . . . . . . 7,210 52,899 974 7,469 52,092 1,115 –1.5 2.25Not a citizen . . . . . . . . . . . . . . . . . . . . . . .
Region
8,198 40,617 1,091 8,211 37,637 1,198 *–7.3 3.12
Northeast . . . . . . . . . . . . . . . . . . . . . . . . . . . 21,261 53,534 584 21,351 52,274 696 *–2.4 1.36Midwest. . . . . . . . . . . . . . . . . . . . . . . . . . . . . 26,508 49,193 661 26,266 50,277 472 *2.2 1.37South . . . . . . . . . . . . . . . . . . . . . . . . . . . . . . . 42,587 45,129 565 43,062 46,186 436 *2.3 1.31West . . . . . . . . . . . . . . . . . . . . . . . . . . . . . . .
Metropolitan Status
25,656 53,731 555 26,105 54,138 806 0.8 1.50
Inside metropolitan statistical areas . . . . 96,739 52,052 247 97,591 51,831 252 –0.4 0.54Inside principal cities . . . . . . . . . . . . . . . 38,488 43,836 529 39,072 44,205 592 0.8 1.47Outside principal cities . . . . . . . . . . . . . . 58,251 57,357 445 58,520 57,444 482 0.2 0.92
3Outside metropolitan statistical areas . .
Shares of Household IncomeQuintiles and Gini Index4
19,272 39,379 788 19,192 40,615 628 *3.1 2.12
Lowest quintile. . . . . . . . . . . . . . . . . . . . . . . 23,202 3.4 0.04 23,357 3.4 0.04 – 1.27Second quintile . . . . . . . . . . . . . . . . . . . . . . 23,202 8.6 0.10 23,357 8.7 0.10 1.2 1.27Third quintile . . . . . . . . . . . . . . . . . . . . . . . . 23,202 14.5 0.16 23,357 14.8 0.16 *2.1 1.27Fourth quintile . . . . . . . . . . . . . . . . . . . . . . . 23,202 22.9 0.25 23,357 23.4 0.25 *2.2 1.27Highest quintile . . . . . . . . . . . . . . . . . . . . . . 23,202 50.5 0.56 23,357 49.7 0.54 *–1.6 1.23Gini index of income inequality . . . . . . . . 116,011 0.470 0.0047 116,783 0.463 0.0045 *–1.5 1.09
See footnotes at end of table.

Income Inequality indicating perfect equality (whereeveryone receives an equal share), toThe Census Bureau has traditionally1, perfect inequality (where all theused two methods to measure incomeincome is received by only one personinequality—the shares of aggregateor group of people). household income received by quin-
tiles and the Gini index. The shares The changes in the shares of aggre-method ranks households from lowest gate household income received byto highest on the basis of income and quintiles indicated a decrease inthen divides them into groups of equal income inequality between 2006 andpopulation size, typically quintiles. The 2007 (Table 1 and Appendix Table aggregate income of each group is A-3). Specifically, the share of the high-then divided by the overall aggregate est quintile dropped from 50.5 percentincome to derive shares. The Gini to 49.7 percent, and the shares ofindex incorporates detailed shares aggregate income of the third anddata into a single measure, which fourth quintiles increased from 14.5summarizes the dispersion of income percent to 14.8 percent and from 22.9across the entire income distribution. percent to 23.4 percent, respectively.The Gini index ranges from 0, For the lowest and the second
quintiles, the shares remained statisti-cally unchanged (3.4 percent and 8.7percent, respectively). Along with thechanges in the shares of aggregateincome were changes in the meanincomes of quintiles between 2006and 2007. Declines were evident forthe lowest, second, and highest quin-tiles (–1.1 percent, –0.5 percent, and–2.9 percent, respectively), while themean incomes of the third and fourthquintiles each experienced increasesof 0.8 percent.13
8 Income, Poverty, and Health Insurance Coverage in the United States: 2007 U.S. Census Bureau
13 The apparent difference between the per-cent changes in the mean incomes of the lowestand second quintiles was not statistically signifi-cant.
Table 1.Income and Earnings Summary Measures by Selected Characteristics: 2006 and 2007—Con.(Income in 2007 dollars. Households and people as of March of the following year)
Characteristic
2006 2007Percentage change inreal median income
(2007 less 2006)
Number(thousands)
Median income(dollars)
Number(thousands)
Median income(dollars)
Estimate
90-percentconfidence
interval1 (±)Estimate
90-percentconfidence
interval1 (±) Estimate
90-percentconfidence
interval1 (±)
EARNINGS OF FULL-TIME,YEAR-ROUND WORKERS
Men with earnings. . . . . . . . . . . . . . . . . . . . 63,055 43,460 149 62,984 45,113 247 *3.8 0.57Women with earnings. . . . . . . . . . . . . . . . .
PER CAPITA INCOME5
44,663 33,437 313 45,613 35,102 168 *5.0 0.96
Total2 . . . . . . . . . . . . . . . . . . . . . . 296,824 27,100 173 299,106 26,804 158 *–1.1 0.72White . . . . . . . . . . . . . . . . . . . . . . . . . . . . . . 237,892 28,610 198 239,399 28,325 183 *–1.0 0.78
White, not Hispanic. . . . . . . . . . . . . . . . . 196,252 31,294 230 196,768 31,051 212 –0.8 0.80Black . . . . . . . . . . . . . . . . . . . . . . . . . . . . . . . 37,369 18,410 367 37,775 18,428 349 0.1 2.30Asian . . . . . . . . . . . . . . . . . . . . . . . . . . . . . . . 13,194 31,339 1,174 13,268 29,901 901 *–4.6 3.86Hispanic (any race). . . . . . . . . . . . . . . . . . . 44,854 15,858 308 46,026 15,603 271 –1.6 1.91
* Statistically different from zero at the 90-percent confidence level.– Represents or rounds to zero.1 A 90-percent confidence interval is a measure of an estimate’s variability. The larger the confidence interval in relation to the size of the estimate, the less reliable the
estimate. For more information, see ‘‘Standard Errors and Their Use’’ at <www.census.gov/hhes/www/p60_235sa.pdf>.2 Federal surveys now give respondents the option of reporting more than one race. Therefore, two basic ways of defining a race group are possible. A group such as
Asian may be defined as those who reported Asian and no other race (the race-alone or single-race concept) or as those who reported Asian regardless of whether theyalso reported another race (the race-alone-or-in-combination concept). This table shows data using the first approach (race alone). The use of the single-race populationdoes not imply that it is the preferred method of presenting or analyzing data. The Census Bureau uses a variety of approaches. Information on people who reported morethan one race, such as White and American Indian and Alaska Native or Asian and Black or African American, is available from Census 2000 through American FactFinder.About 2.6 percent of people reported more than one race in Census 2000. Data for American Indians and Alaska Natives, Native Hawaiians and Other Pacific Islanders,and those reporting two or more races are not shown separately in this table.
3 The ‘‘Outside metropolitan statistical areas’’ category includes both micropolitan statistical areas and territory outside of metropolitan and micropolitan statistical areas.For more information, see ‘‘About Metropolitan and Micropolitan Statistical Areas’’ at <www.census.gov/population/www/estimates/aboutmetro.html>.
4 The data shown in this section are shares of aggregate household income, the Gini index, and their respective confidence intervals. See the article by Paul Alison,‘‘Measures of Inequality,’’ American Sociological Review, 43, December 1977, pp. 865–880, for an explanation of inequality measures.
5 The data shown in this section are per capita incomes and their respective confidence intervals. Per capita income is the mean income computed for every man,woman, and child in a particular group. It is derived by dividing the total income of a particular group by the total population in that group (excluding patients or inmates ininstitutional quarters).
Source: U.S. Census Bureau, Current Population Survey, 2007 and 2008 Annual Social and Economic Supplements.
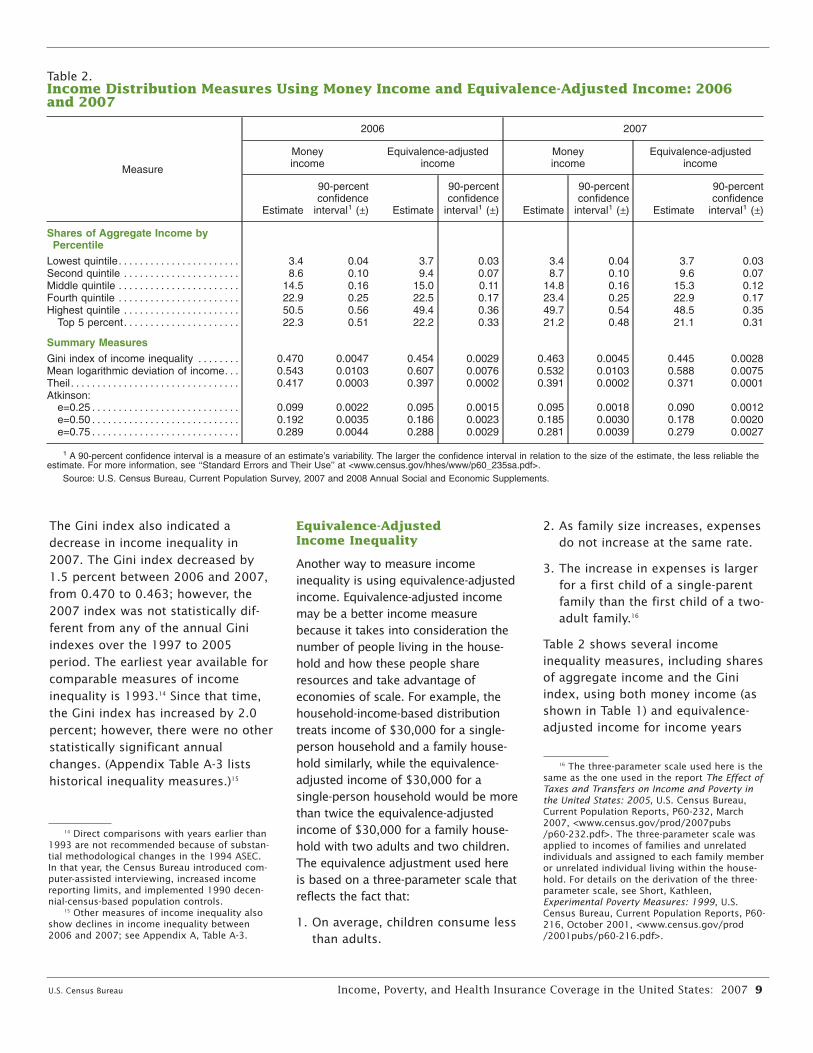
The Gini index also indicated adecrease in income inequality in2007. The Gini index decreased by1.5 percent between 2006 and 2007,from 0.470 to 0.463; however, the2007 index was not statistically dif-ferent from any of the annual Giniindexes over the 1997 to 2005period. The earliest year available forcomparable measures of incomeinequality is 1993.14 Since that time,the Gini index has increased by 2.0percent; however, there were no otherstatistically significant annualchanges. (Appendix Table A-3 listshistorical inequality measures.)15
U.S. Census Bureau Income, Poverty, and Health Insurance Coverage in the United States: 2007 9
14 Direct comparisons with years earlier than1993 are not recommended because of substan-tial methodological changes in the 1994 ASEC.In that year, the Census Bureau introduced com-puter-assisted interviewing, increased incomereporting limits, and implemented 1990 decen-nial-census-based population controls.
15 Other measures of income inequality alsoshow declines in income inequality between2006 and 2007; see Appendix A, Table A-3.
Equivalence-Adjusted Income Inequality
Another way to measure incomeinequality is using equivalence-adjustedincome. Equivalence-adjusted incomemay be a better income measurebecause it takes into consideration thenumber of people living in the house-hold and how these people shareresources and take advantage ofeconomies of scale. For example, thehousehold-income-based distributiontreats income of $30,000 for a single-person household and a family house-hold similarly, while the equivalence-adjusted income of $30,000 for asingle-person household would be morethan twice the equivalence-adjustedincome of $30,000 for a family house-hold with two adults and two children.The equivalence adjustment used hereis based on a three-parameter scale thatreflects the fact that:
1. On average, children consume lessthan adults.
2. As family size increases, expensesdo not increase at the same rate.
3. The increase in expenses is largerfor a first child of a single-parentfamily than the first child of a two-adult family.16
Table 2 shows several incomeinequality measures, including sharesof aggregate income and the Giniindex, using both money income (asshown in Table 1) and equivalence-adjusted income for income years
16 The three-parameter scale used here is thesame as the one used in the report The Effect ofTaxes and Transfers on Income and Poverty inthe United States: 2005, U.S. Census Bureau,Current Population Reports, P60-232, March2007, <www.census.gov/prod/2007pubs/p60-232.pdf>. The three-parameter scale wasapplied to incomes of families and unrelatedindividuals and assigned to each family memberor unrelated individual living within the house-hold. For details on the derivation of the three-parameter scale, see Short, Kathleen,Experimental Poverty Measures: 1999, U.S.Census Bureau, Current Population Reports, P60-216, October 2001, <www.census.gov/prod/2001pubs/p60-216.pdf>.
Table 2.Income Distribution Measures Using Money Income and Equivalence-Adjusted Income: 2006and 2007
Measure
2006 2007
Moneyincome
Equivalence-adjustedincome
Moneyincome
Equivalence-adjustedincome
Estimate
90-percentconfidence
interval1 (±) Estimate
90-percentconfidence
interval1 (±) Estimate
90-percentconfidence
interval1 (±) Estimate
90-percentconfidence
interval1 (±)
Shares of Aggregate Income byPercentile
Lowest quintile. . . . . . . . . . . . . . . . . . . . . . . 3.4 0.04 3.7 0.03 3.4 0.04 3.7 0.03Second quintile . . . . . . . . . . . . . . . . . . . . . . 8.6 0.10 9.4 0.07 8.7 0.10 9.6 0.07Middle quintile . . . . . . . . . . . . . . . . . . . . . . . 14.5 0.16 15.0 0.11 14.8 0.16 15.3 0.12Fourth quintile . . . . . . . . . . . . . . . . . . . . . . . 22.9 0.25 22.5 0.17 23.4 0.25 22.9 0.17Highest quintile . . . . . . . . . . . . . . . . . . . . . . 50.5 0.56 49.4 0.36 49.7 0.54 48.5 0.35
Top 5 percent. . . . . . . . . . . . . . . . . . . . . . 22.3 0.51 22.2 0.33 21.2 0.48 21.1 0.31
Summary Measures
Gini index of income inequality . . . . . . . . 0.470 0.0047 0.454 0.0029 0.463 0.0045 0.445 0.0028Mean logarithmic deviation of income. . . 0.543 0.0103 0.607 0.0076 0.532 0.0103 0.588 0.0075Theil . . . . . . . . . . . . . . . . . . . . . . . . . . . . . . . . 0.417 0.0003 0.397 0.0002 0.391 0.0002 0.371 0.0001Atkinson:
e=0.25 . . . . . . . . . . . . . . . . . . . . . . . . . . . . 0.099 0.0022 0.095 0.0015 0.095 0.0018 0.090 0.0012e=0.50 . . . . . . . . . . . . . . . . . . . . . . . . . . . . 0.192 0.0035 0.186 0.0023 0.185 0.0030 0.178 0.0020e=0.75 . . . . . . . . . . . . . . . . . . . . . . . . . . . . 0.289 0.0044 0.288 0.0029 0.281 0.0039 0.279 0.0027
1 A 90-percent confidence interval is a measure of an estimate’s variability. The larger the confidence interval in relation to the size of the estimate, the less reliable theestimate. For more information, see ‘‘Standard Errors and Their Use’’ at <www.census.gov/hhes/www/p60_235sa.pdf>.
Source: U.S. Census Bureau, Current Population Survey, 2007 and 2008 Annual Social and Economic Supplements.
2006 and 2007. For both 2006 and2007, the Gini index is lower underthe equivalence-adjusted income con-cept than under the traditional moneyincome concept, indicating a moreequal distribution of income.Comparing the shares of aggregatehousehold income received by quin-tile, higher shares of income appearin the lower quintiles, and lowershares appear in the higher quintilesfor equivalence-adjusted income thanfor money income. This redistributionwould be expected given that:
1. The lower end of the income distri-bution is made up of a higherconcentration of single-personhouseholds.
2. The lower end of the income distri-bution is made up of smaller fami-lies than the upper end.
Equivalence adjusting increases therelative incomes of people living inlower-income groups.
As with money income, there was adecline between 2006 and 2007 inthe Gini index and a redistribution ofshares of aggregate householdincome within quintiles forequivalence-adjusted income.
Work Experience and Earnings
The number of working men aged 15and older increased by 0.6 millionbetween 2006 and 2007 to 84.5 mil-lion. An estimated 74.5 percentworked full-time, year-round, a lowerpercentage than in 2006 (75.1 per-cent).17 The number of workingwomen aged 15 and older was 74.4million, an increase of 0.6 million from2006. About 61.4 percent of thesewomen worked full-time, year-round in2007, an all-time high—up from 60.6percent in 2006. Over the past 10years, the proportion of workingwomen who reported being year-round, full-time workers increased 5.8percentage points (from 55.6 percentto 61.4 percent), compared with a 2.9percentage-point increase for men(from 71.6 percent to 74.5 percent).
While earnings represent the largestcomponent of income, earnings
10 Income, Poverty, and Health Insurance Coverage in the United States: 2007 U.S. Census Bureau
17 A full-time, year-round worker is a personwho worked 35 or more hours per week (full-time) and 50 or more weeks during the previouscalendar year (year-round). For school personnel,the summer vacation is counted as weeksworked if they are scheduled to return to theirjob in the fall. For detailed information on workexperience, see Table PINC-05, “Work Experiencein 2007—People 15 Years Old and Over by TotalMoney Earnings in 2007, Age, Race, HispanicOrigin, and Sex” at <www.census.gov/hhes/www/income/dinctabs.html>.
trends and household income trendsare not perfectly correlated. Theinclusion of nonearned income alongwith earned income in combinationwith the labor force characteristics ofhousehold members affects house-hold income. While overall medianhousehold income in 2007 rose by1.3 percent, the real median incomeof households with a householderthat worked full-time, year-round rose1.7 percent, and the income of house-holds with no earners declined 4.8percent.18 This occurred while theearnings of men and women whoworked full-time, year-round rose by3.8 percent and 5.0 percent, respec-tively (Table 1 and Figure 2). Themedian earnings of men rose from$43,460 to $45,113 and those ofwomen rose from $33,437 to$35,102. Prior to 2007, both menand women experienced 3 years ofannual declines in real earnings. In2007, the female-to-male earningsratio was 0.78—higher than the previ-ous all-time-high of 0.76, firstrecorded in 2001.
18 The apparent difference between theincreases in median household income of allhouseholds and that of households with house-holders who worked full-time, year-round wasnot statistically significant.
Per Capita Income19
Real per capita income declined by1.1 percent between 2006 and 2007.
U.S. Census Bureau Income, Poverty, and Health Insurance Coverage in the United States: 2007 11
19 The per capita income data presented in thisreport are not directly comparable with estimatesof personal per capita income prepared by theBureau of Economic Analysis, U.S. Department ofCommerce. The lack of correspondence stemsfrom the differences in income definition and cov-erage. For further details, see <www.census.gov/hhes/www/income/compare1.html>.
Per capita income declined in 2007for Whites (–1.0 percent) and Asians(–4.6 percent) (Table 1).20, 21 Theapparent changes for non-Hispanic
20 Unlike medians, per capita and means areaffected by extremely high and low incomes.
21 The apparent differences among thedeclines for the overall, White, and Asian popu-lations were not statistically significant.
Whites, Blacks, and Hispanics werenot statistically significant. The percapita income for the overall popula-tion in 2007 was $26,804; forWhites, $28,325; for non-HispanicWhites, $31,051; for Blacks, $18,428;for Asians, $29,901; and forHispanics, $15,603.
Figure 2.Female-to-Male Earnings Ratio and Median Earnings of Full-Time, Year-Round Workers 15 Years and Older by Sex: 1960 to 2007
Note: Data on earnings of full-time, year-round workers are not readily available before 1960. For information on recessions, see Appendix A.
Source: U.S. Census Bureau, Current Population Survey, 1961 to 2008 Annual Social and Economic Supplements.
Earnings in thousands (2007 dollars), ratio in percent Recession
0
10
20
30
40
50
60
70
80
90
20072000 19951990198519801975197019651959
Earnings of women
Female-to-male earnings ratio
78 percent
$45,113
$35,102Earnings of men

POVERTY IN THE UNITED STATES22
Highlights
• The official poverty rate in 2007was 12.5 percent, not statisticallydifferent from 2006 (Table 3).
• In 2007, 37.3 million people werein poverty, up from 36.5 million in2006.
• Poverty rates in 2007 were statisti-cally unchanged for non-HispanicWhites (8.2 percent), Blacks (24.5percent), and Asians (10.2 percent)from 2006. The poverty rateincreased for Hispanics (21.5 per-cent in 2007, up from 20.6 percentin 2006).
• The poverty rate in 2007 waslower than in 1959, the first yearfor which poverty estimates are
12 Income, Poverty, and Health Insurance Coverage in the United States: 2007 U.S. Census Bureau
22 OMB determined the official definition ofpoverty in Statistical Policy Directive 14.Appendix B describes how the Census Bureaucalculates poverty.
23 Unrelated individuals under 15 areexcluded from the poverty universe; therefore,407,000 fewer children are in the poverty uni-verse than in the total population.
available (Figure 3), while statisti-cally higher than the most recenttrough in 2000 (11.3 percent).
• The poverty rate increased for chil-dren under 18 years old (18.0 per-cent in 2007, up from 17.4 percentin 2006), while it remained statisti-cally unchanged for people 18 to64 years old (10.9 percent) andpeople 65 and over (9.7 percent).23
Race and Hispanic Origin
At 8.2 percent, the 2007 poverty ratefor non-Hispanic Whites was lowerthan the rate for Blacks and Asians—24.5 percent and 10.2 percent,respectively (Table 3). For all three ofthese groups, the number and thepercentage in poverty were statisti-cally unchanged between 2006 and2007. In 2007, non-Hispanic Whitesaccounted for 43.0 percent of people
in poverty while representing 65.8percent of the total population.Among Hispanics, 21.5 percent (9.9million) were in poverty in 2007,higher than the 20.6 percent (9.2 mil-lion) in 2006.
Age
Both the poverty rate and the numberin poverty for people aged 18 to 64were not statistically different in2007 than in 2006, at 10.9 percentand 20.4 million in 2007. The povertyrate for people 65 and older remainedstatistically unchanged at 9.7 percent,while the number in povertyincreased to 3.6 million in 2007 from3.4 million in 2006 (Table 3 andFigure 4).
In 2007, both the poverty rate andthe number in poverty increased forchildren under 18 years old (18.0 per-cent and 13.3 million in 2007, upfrom 17.4 percent and 12.8 million in2006). The poverty rate for childrenwas higher than the rates for people
Figure 3.Number in Poverty and Poverty Rate: 1959 to 2007
Note: For information on recessions, see Appendix A.
Source: U.S. Census Bureau, Current Population Survey, 1960 to 2008 Annual Social and Economic Supplements.
Numbers in millions, rates in percent
0
5
10
15
20
25
30
35
40
45
50
20072000 19951990198519801975197019651959
Recession
37.3 million
12.5 percent
Number in poverty
Poverty rate
U.S. Census Bureau Income, Poverty, and Health Insurance Coverage in the United States: 2007 13
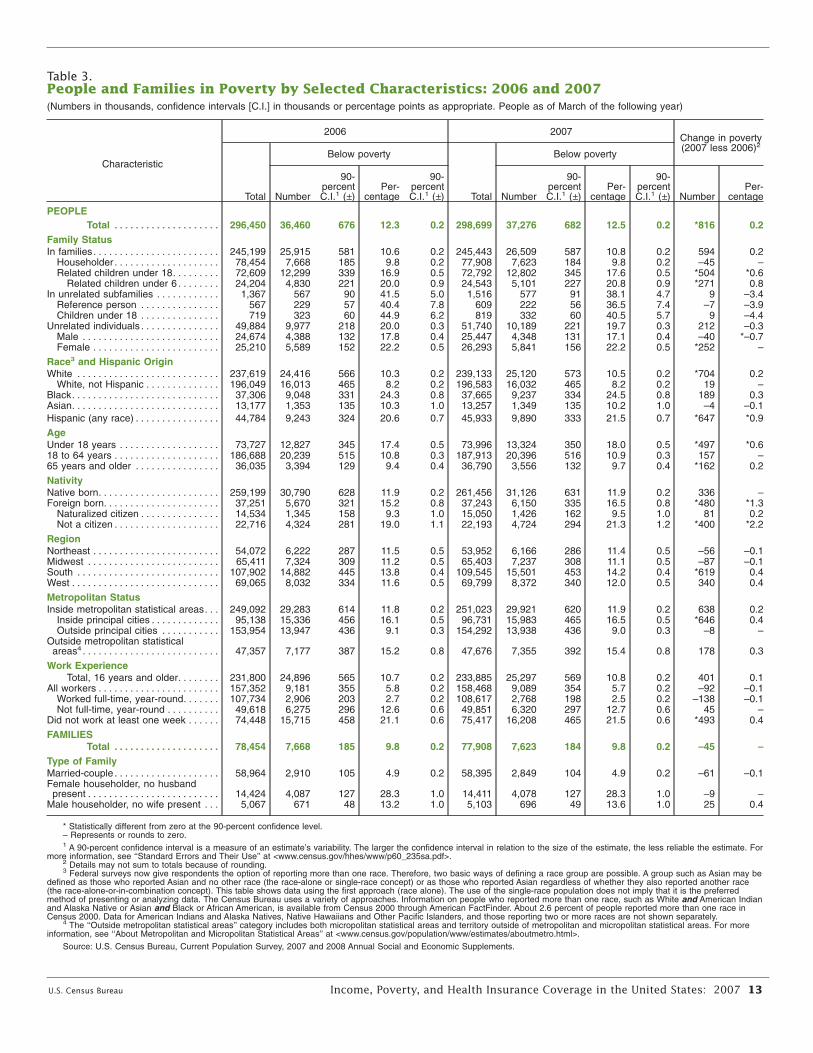
Table 3.People and Families in Poverty by Selected Characteristics: 2006 and 2007(Numbers in thousands, confidence intervals [C.I.] in thousands or percentage points as appropriate. People as of March of the following year)
2006 2007Change in poverty(2007 less 2006)2
Below poverty Below povertyCharacteristic
90- 90- 90- 90-percent Per- percent percent Per- percent Per-
Total Number C.I.1 (±) centage C.I.1 (±) Total Number C.I.1 (±) centage C.I.1 (±) Number centage
PEOPLETotal . . . . . . . . . . . . . . . . . . . . 296,450 36,460 676 12.3 0.2 298,699 37,276 682 12.5 0.2 *816 0.2
Family StatusIn families. . . . . . . . . . . . . . . . . . . . . . . . 245,199 25,915 581 10.6 0.2 245,443 26,509 587 10.8 0.2 594 0.2
Householder . . . . . . . . . . . . . . . . . . . . 78,454 7,668 185 9.8 0.2 77,908 7,623 184 9.8 0.2 –45 –Related children under 18. . . . . . . . . 72,609 12,299 339 16.9 0.5 72,792 12,802 345 17.6 0.5 *504 *0.6
Related children under 6 . . . . . . . . 24,204 4,830 221 20.0 0.9 24,543 5,101 227 20.8 0.9 *271 0.8In unrelated subfamilies . . . . . . . . . . . . 1,367 567 90 41.5 5.0 1,516 577 91 38.1 4.7 9 –3.4
Reference person . . . . . . . . . . . . . . . 567 229 57 40.4 7.8 609 222 56 36.5 7.4 –7 –3.9Children under 18 . . . . . . . . . . . . . . . 719 323 60 44.9 6.2 819 332 60 40.5 5.7 9 –4.4
Unrelated individuals . . . . . . . . . . . . . . . 49,884 9,977 218 20.0 0.3 51,740 10,189 221 19.7 0.3 212 –0.3Male . . . . . . . . . . . . . . . . . . . . . . . . . . 24,674 4,388 132 17.8 0.4 25,447 4,348 131 17.1 0.4 –40 *–0.7Female . . . . . . . . . . . . . . . . . . . . . . . . 25,210 5,589 152 22.2 0.5 26,293 5,841 156 22.2 0.5 *252 –
Race3 and Hispanic OriginWhite . . . . . . . . . . . . . . . . . . . . . . . . . . . 237,619 24,416 566 10.3 0.2 239,133 25,120 573 10.5 0.2 *704 0.2
White, not Hispanic . . . . . . . . . . . . . . 196,049 16,013 465 8.2 0.2 196,583 16,032 465 8.2 0.2 19 –Black. . . . . . . . . . . . . . . . . . . . . . . . . . . . 37,306 9,048 331 24.3 0.8 37,665 9,237 334 24.5 0.8 189 0.3Asian. . . . . . . . . . . . . . . . . . . . . . . . . . . . 13,177 1,353 135 10.3 1.0 13,257 1,349 135 10.2 1.0 –4 –0.1Hispanic (any race) . . . . . . . . . . . . . . . . 44,784 9,243 324 20.6 0.7 45,933 9,890 333 21.5 0.7 *647 *0.9
AgeUnder 18 years . . . . . . . . . . . . . . . . . . . 73,727 12,827 345 17.4 0.5 73,996 13,324 350 18.0 0.5 *497 *0.618 to 64 years . . . . . . . . . . . . . . . . . . . . 186,688 20,239 515 10.8 0.3 187,913 20,396 516 10.9 0.3 157 –65 years and older . . . . . . . . . . . . . . . . 36,035 3,394 129 9.4 0.4 36,790 3,556 132 9.7 0.4 *162 0.2
NativityNative born. . . . . . . . . . . . . . . . . . . . . . . 259,199 30,790 628 11.9 0.2 261,456 31,126 631 11.9 0.2 336 –Foreign born. . . . . . . . . . . . . . . . . . . . . . 37,251 5,670 321 15.2 0.8 37,243 6,150 335 16.5 0.8 *480 *1.3
Naturalized citizen . . . . . . . . . . . . . . . 14,534 1,345 158 9.3 1.0 15,050 1,426 162 9.5 1.0 81 0.2Not a citizen . . . . . . . . . . . . . . . . . . . . 22,716 4,324 281 19.0 1.1 22,193 4,724 294 21.3 1.2 *400 *2.2
RegionNortheast . . . . . . . . . . . . . . . . . . . . . . . . 54,072 6,222 287 11.5 0.5 53,952 6,166 286 11.4 0.5 –56 –0.1Midwest . . . . . . . . . . . . . . . . . . . . . . . . . 65,411 7,324 309 11.2 0.5 65,403 7,237 308 11.1 0.5 –87 –0.1South . . . . . . . . . . . . . . . . . . . . . . . . . . . 107,902 14,882 445 13.8 0.4 109,545 15,501 453 14.2 0.4 *619 0.4West . . . . . . . . . . . . . . . . . . . . . . . . . . . . 69,065 8,032 334 11.6 0.5 69,799 8,372 340 12.0 0.5 340 0.4
Metropolitan StatusInside metropolitan statistical areas. . . 249,092 29,283 614 11.8 0.2 251,023 29,921 620 11.9 0.2 638 0.2
Inside principal cities . . . . . . . . . . . . . 95,138 15,336 456 16.1 0.5 96,731 15,983 465 16.5 0.5 *646 0.4Outside principal cities . . . . . . . . . . . 153,954 13,947 436 9.1 0.3 154,292 13,938 436 9.0 0.3 –8 –
Outside metropolitan statistical4areas . . . . . . . . . . . . . . . . . . . . . . . . . . 47,357 7,177 387 15.2 0.8 47,676 7,355 392 15.4 0.8 178 0.3
Work ExperienceTotal, 16 years and older. . . . . . . . 231,800 24,896 565 10.7 0.2 233,885 25,297 569 10.8 0.2 401 0.1
All workers . . . . . . . . . . . . . . . . . . . . . . . 157,352 9,181 355 5.8 0.2 158,468 9,089 354 5.7 0.2 –92 –0.1Worked full-time, year-round. . . . . . . 107,734 2,906 203 2.7 0.2 108,617 2,768 198 2.5 0.2 –138 –0.1Not full-time, year-round . . . . . . . . . . 49,618 6,275 296 12.6 0.6 49,851 6,320 297 12.7 0.6 45 –
Did not work at least one week . . . . . . 74,448 15,715 458 21.1 0.6 75,417 16,208 465 21.5 0.6 *493 0.4
FAMILIESTotal . . . . . . . . . . . . . . . . . . . . 78,454 7,668 185 9.8 0.2 77,908 7,623 184 9.8 0.2 –45 –
Type of FamilyMarried-couple . . . . . . . . . . . . . . . . . . . . 58,964 2,910 105 4.9 0.2 58,395 2,849 104 4.9 0.2 –61 –0.1Female householder, no husbandpresent . . . . . . . . . . . . . . . . . . . . . . . . . 14,424 4,087 127 28.3 1.0 14,411 4,078 127 28.3 1.0 –9 –
Male householder, no wife present . . . 5,067 671 48 13.2 1.0 5,103 696 49 13.6 1.0 25 0.4
* Statistically different from zero at the 90-percent confidence level.– Represents or rounds to zero.1 A 90-percent confidence interval is a measure of an estimate’s variability. The larger the confidence interval in relation to the size of the estimate, the less reliable the estimate. For
more information, see ‘‘Standard Errors and Their Use’’ at <www.census.gov/hhes/www/p60_235sa.pdf>.2 Details may not sum to totals because of rounding.3 Federal surveys now give respondents the option of reporting more than one race. Therefore, two basic ways of defining a race group are possible. A group such as Asian may be
defined as those who reported Asian and no other race (the race-alone or single-race concept) or as those who reported Asian regardless of whether they also reported another race(the race-alone-or-in-combination concept). This table shows data using the first approach (race alone). The use of the single-race population does not imply that it is the preferredmethod of presenting or analyzing data. The Census Bureau uses a variety of approaches. Information on people who reported more than one race, such as White and American Indianand Alaska Native or Asian and Black or African American, is available from Census 2000 through American FactFinder. About 2.6 percent of people reported more than one race inCensus 2000. Data for American Indians and Alaska Natives, Native Hawaiians and Other Pacific Islanders, and those reporting two or more races are not shown separately.
4 The ‘‘Outside metropolitan statistical areas’’ category includes both micropolitan statistical areas and territory outside of metropolitan and micropolitan statistical areas. For moreinformation, see ‘‘About Metropolitan and Micropolitan Statistical Areas’’ at <www.census.gov/population/www/estimates/aboutmetro.html>.
Source: U.S. Census Bureau, Current Population Survey, 2007 and 2008 Annual Social and Economic Supplements.

18 to 64 years old and those 65 and statistically unchanged from 2006,older (Table 3). Children represented while the number in poverty35.7 percent of the people in poverty increased to 5.1 million in 2007, upand 24.8 percent of the total from 4.8 million in 2006. Of relatedpopulation. children under 6 with female house-
holders with no husband present,Estimates for related children under 18
54.0 percent were in poverty, overinclude children related to the house-
five times the rate of their counter-holder (or the reference person of an
parts in married-couple families unrelated subfamily) who are not
(9.5 percent). themselves a householder or spouseof the householder (or the family refer- Nativityence person). Both the poverty rate
Of all people, 87.5 percent wereand the number in poverty increasednative born and 12.5 percent werefor related children under 18 living inforeign born. The poverty rate andfamilies (17.6 percent and 12.8 millionthe number in poverty for the native-in 2007, up from 16.9 percent andborn population, 11.9 percent and12.3 million in 2006). For related chil-31.1 million in 2007, were not statis-dren under 18 living in families with atically different from any of the threefemale householder with no husbandprevious years—2004 to 2006. Thepresent, 43.0 percent were in poverty,poverty rate and the number incompared with 8.5 percent for chil-poverty for the foreign-born popula-dren in married-couple families. tion increased to 16.5 percent and
The poverty rate for related children 6.2 million in 2007 from 15.2 percentunder 6 was 20.8 percent in 2007, and 5.7 million in 2006 (Table 3).
Of the foreign-born population, 40.4percent were naturalized citizens; theremaining were noncitizens. Thepoverty rate in 2007 was 9.5 percentfor foreign-born naturalized citizens,statistically unchanged from 2006. Thepoverty rate in 2007 was 21.3 percentfor those who were not U.S. citizens,up from 19.0 percent in 2006.
Region
The number in poverty in the Southincreased to 15.5 million in 2007, upfrom 14.9 million in 2006, while thepoverty rate remained statisticallyunchanged at 14.2 percent in 2007.In 2007, the poverty rate for theNortheast (11.4 percent), the Midwest(11.1 percent), and the West (12.0percent) were all statisticallyunchanged from 2006.24
14 Income, Poverty, and Health Insurance Coverage in the United States: 2007 U.S. Census Bureau
24 The poverty rate for the Northeast was notstatistically different from that of the Midwest orthe West.
Figure 4.Poverty Rates by Age: 1959 to 2007
Note: Data for people aged 18 to 64 and 65 and older are not available from 1960 to 1965. For information on recessions, see Appendix A.
Source: U.S. Census Bureau, Current Population Survey, 1960 to 2008 Annual Social and Economic Supplements.
Percent
0
5
10
15
20
25
30
35
40
45
50
20072000 19951990198519801975197019651959
Recession
10.9 percent9.7 percent
18.0 percent
65 years and older
Under 18 years
18 to 64 years

Metropolitan Status Families
Inside metropolitan statistical areas, In 2007, the poverty rate and the num-the poverty rate and the number of ber of families in poverty were 9.8people in poverty were 11.9 percent percent and 7.6 million, both statisti-and 29.9 million in 2007, both statis- cally unchanged from 2006 (Table 3). tically unchanged from 2006. Of all
Furthermore, the poverty rate and thepeople in metropolitan statistical
number in poverty showed no statisti-areas in 2007, 38.5 percent lived in
cal change between 2006 and 2007 forprincipal cities, and 53.4 percent of
the different types of families. In 2007,people in poverty in those metropoli-
the poverty rates for married-coupletan areas lived in principal cities.
families (4.9 percent and 2.8 million),The number in poverty increased for female-householder-with-no-husband-people in principal cities to 16.0 mil- present families (28.3 percent and 4.1lion in 2007, from 15.3 million in million), and male-householder-with-2006, while their poverty rate no-wife-present families (13.6 percentremained statistically unchanged at and 696,000) were all statistically16.5 percent in 2007. The poverty unchanged from 2006.rate and the number in poverty forthose not in principal cities were 9.0 Depth of Poverty
percent and 13.9 million in 2007, sta- Categorizing people as “in poverty” ortistically unchanged from 2006. “not in poverty” is one way to
describe their economic situation.Among those living outside metropol-The income-to-poverty ratio and theitan statistical areas, the poverty rateincome deficit (surplus) describeand the number in poverty were 15.4other aspects of economic well-being.percent and 7.4 million in 2007, sta-Where the poverty rate provides atistically unchanged from 2006.measure of the proportion of people
Work Experience with a family income that is belowthe established poverty thresholds,
People 16 and older who workedthe income-to-poverty ratio provides
some or all of 2007 had a lowera measure to gauge the depth of
poverty rate than those who did notpoverty and to calculate the size of
work at any time, 5.7 percent com-the population who may be eligible
pared with 21.5 percent (Table 3).for government-sponsored assistance
The poverty rate among full-time,programs, such as Temporary
year-round workers (2.5 percent) wasAssistance for Needy Families (TANF),
lower than the rate for those whoMedicare, food stamps, and the Low-
worked part-time or part-year (12.7Income Home Energy Assistance
percent) in 2007. In addition, amongProgram (LIHEAP). The income-to-
people 16 and older, those who didpoverty ratio is reported as a percent-
not work in 2007 represented 43.5age that compares a family’s or an
percent of people in poverty and 25.2unrelated individual’s (people who do
percent of all people. not live with relatives) income with
their poverty threshold. For example,a family or individual with an income-to-poverty ratio of 110 percent hasincome that is 10 percent above theirpoverty threshold.
The income deficit (surplus) tells howmany dollars a family’s or an unre-lated individual’s income is below(above) their poverty threshold. Thesemeasures illustrate how the low-income population varies in relationto the poverty thresholds.
Ratio of Income to Poverty
Table 4 presents the number and thepercentage of people within threeranges of income-to-poverty ratios—those below 50 percent of poverty(“Under 0.50”), those below 100 per-cent of poverty (“Under 1.00,” alsocalled “in poverty”), and those below125 percent of poverty (“Under 1.25”).
Figure 5 illustrates the distribution ofpeople according to their income-to-poverty ratios. The curve (based on adensity function) graphically depictsthe proportion of people with givenincome-to-poverty ratios.25 Hence, thischart presents the number of peoplein poverty as the area under thecurve to the left of the vertical line at1.0, approximately 37.3 million peo-ple in 2007.
U.S. Census Bureau Income, Poverty, and Health Insurance Coverage in the United States: 2007 15
25 To plot the distribution on the income-to-poverty ratio using all people in the poverty uni-verse, a smoothing function in SAS is employedto determine the probability that a particularratio value occurs. To display all probabilities,the density of each ratio value is plotted, form-ing the distribution. The vertical axis is labeled“Density” since this continuous distribution isdetermined by a statistical function.
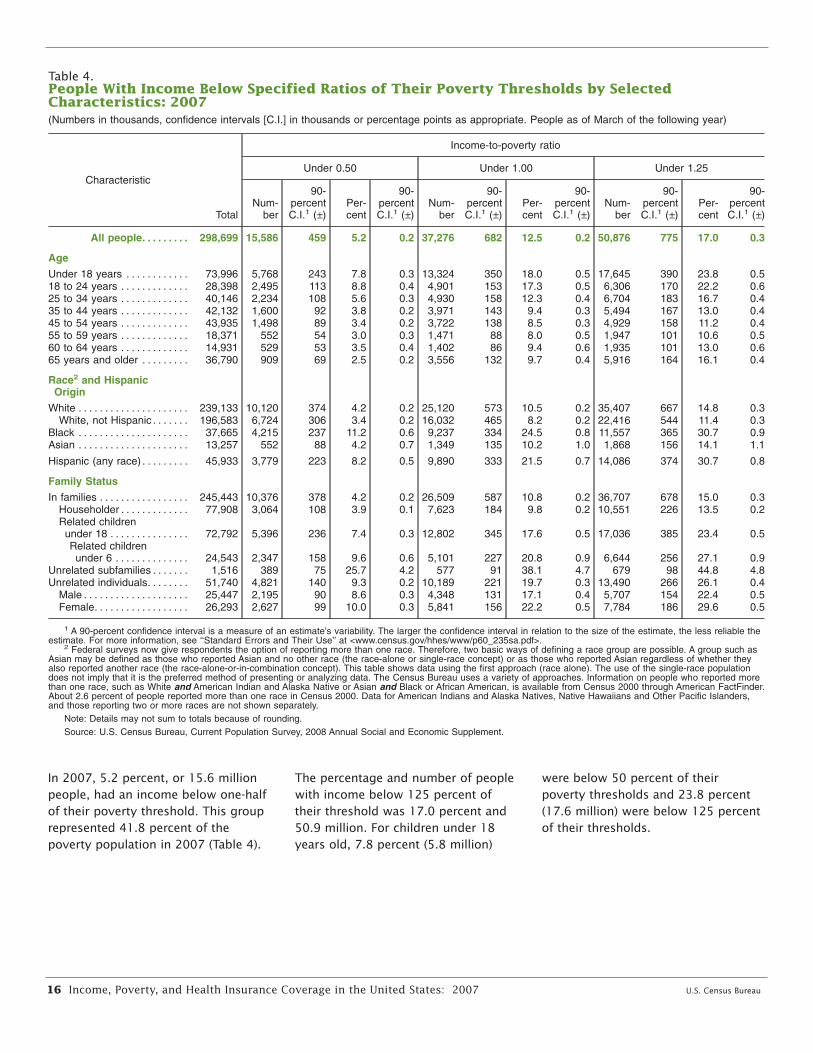
In 2007, 5.2 percent, or 15.6 million The percentage and number of people were below 50 percent of theirpeople, had an income below one-half with income below 125 percent of poverty thresholds and 23.8 percentof their poverty threshold. This group their threshold was 17.0 percent and (17.6 million) were below 125 percentrepresented 41.8 percent of the 50.9 million. For children under 18 of their thresholds.poverty population in 2007 (Table 4). years old, 7.8 percent (5.8 million)
16 Income, Poverty, and Health Insurance Coverage in the United States: 2007 U.S. Census Bureau
Table 4.People With Income Below Specified Ratios of Their Poverty Thresholds by SelectedCharacteristics: 2007(Numbers in thousands, confidence intervals [C.I.] in thousands or percentage points as appropriate. People as of March of the following year)
Characteristic
Total
Income-to-poverty ratio
Under 0.50 Under 1.00 Under 1.25
Num-ber
90-percentC.I.1 (±)
Per-cent
90-percentC.I.1 (±)
Num-ber
90-percentC.I.1 (±)
Per-cent
90-percentC.I.1 (±)
Num-ber
90-percentC.I.1 (±)
Per-cent
90-percentC.I.1 (±)
All people. . . . . . . . .
Age
298,699 15,586 459 5.2 0.2 37,276 682 12.5 0.2 50,876 775 17.0 0.3
Under 18 years . . . . . . . . . . . . 73,996 5,768 243 7.8 0.3 13,324 350 18.0 0.5 17,645 390 23.8 0.518 to 24 years . . . . . . . . . . . . . 28,398 2,495 113 8.8 0.4 4,901 153 17.3 0.5 6,306 170 22.2 0.625 to 34 years . . . . . . . . . . . . . 40,146 2,234 108 5.6 0.3 4,930 158 12.3 0.4 6,704 183 16.7 0.435 to 44 years . . . . . . . . . . . . . 42,132 1,600 92 3.8 0.2 3,971 143 9.4 0.3 5,494 167 13.0 0.445 to 54 years . . . . . . . . . . . . . 43,935 1,498 89 3.4 0.2 3,722 138 8.5 0.3 4,929 158 11.2 0.455 to 59 years . . . . . . . . . . . . . 18,371 552 54 3.0 0.3 1,471 88 8.0 0.5 1,947 101 10.6 0.560 to 64 years . . . . . . . . . . . . . 14,931 529 53 3.5 0.4 1,402 86 9.4 0.6 1,935 101 13.0 0.665 years and older . . . . . . . . .
Race2 and HispanicOrigin
36,790 909 69 2.5 0.2 3,556 132 9.7 0.4 5,916 164 16.1 0.4
White . . . . . . . . . . . . . . . . . . . . . 239,133 10,120 374 4.2 0.2 25,120 573 10.5 0.2 35,407 667 14.8 0.3White, not Hispanic . . . . . . . 196,583 6,724 306 3.4 0.2 16,032 465 8.2 0.2 22,416 544 11.4 0.3
Black . . . . . . . . . . . . . . . . . . . . . 37,665 4,215 237 11.2 0.6 9,237 334 24.5 0.8 11,557 365 30.7 0.9Asian . . . . . . . . . . . . . . . . . . . . . 13,257 552 88 4.2 0.7 1,349 135 10.2 1.0 1,868 156 14.1 1.1
Hispanic (any race) . . . . . . . . .
Family Status
45,933 3,779 223 8.2 0.5 9,890 333 21.5 0.7 14,086 374 30.7 0.8
In families . . . . . . . . . . . . . . . . . 245,443 10,376 378 4.2 0.2 26,509 587 10.8 0.2 36,707 678 15.0 0.3Householder . . . . . . . . . . . . .Related children
77,908 3,064 108 3.9 0.1 7,623 184 9.8 0.2 10,551 226 13.5 0.2
under 18 . . . . . . . . . . . . . . .Related children
72,792 5,396 236 7.4 0.3 12,802 345 17.6 0.5 17,036 385 23.4 0.5
under 6 . . . . . . . . . . . . . . 24,543 2,347 158 9.6 0.6 5,101 227 20.8 0.9 6,644 256 27.1 0.9Unrelated subfamilies . . . . . . . 1,516 389 75 25.7 4.2 577 91 38.1 4.7 679 98 44.8 4.8Unrelated individuals. . . . . . . . 51,740 4,821 140 9.3 0.2 10,189 221 19.7 0.3 13,490 266 26.1 0.4
Male . . . . . . . . . . . . . . . . . . . . 25,447 2,195 90 8.6 0.3 4,348 131 17.1 0.4 5,707 154 22.4 0.5Female. . . . . . . . . . . . . . . . . . 26,293 2,627 99 10.0 0.3 5,841 156 22.2 0.5 7,784 186 29.6 0.5
1 A 90-percent confidence interval is a measure of an estimate’s variability. The larger the confidence interval in relation to the size of the estimate, the less reliable theestimate. For more information, see ‘‘Standard Errors and Their Use’’ at <www.census.gov/hhes/www/p60_235sa.pdf>.
2 Federal surveys now give respondents the option of reporting more than one race. Therefore, two basic ways of defining a race group are possible. A group such asAsian may be defined as those who reported Asian and no other race (the race-alone or single-race concept) or as those who reported Asian regardless of whether theyalso reported another race (the race-alone-or-in-combination concept). This table shows data using the first approach (race alone). The use of the single-race populationdoes not imply that it is the preferred method of presenting or analyzing data. The Census Bureau uses a variety of approaches. Information on people who reported morethan one race, such as White and American Indian and Alaska Native or Asian and Black or African American, is available from Census 2000 through American FactFinder.About 2.6 percent of people reported more than one race in Census 2000. Data for American Indians and Alaska Natives, Native Hawaiians and Other Pacific Islanders,and those reporting two or more races are not shown separately.
Note: Details may not sum to totals because of rounding.Source: U.S. Census Bureau, Current Population Survey, 2008 Annual Social and Economic Supplement.
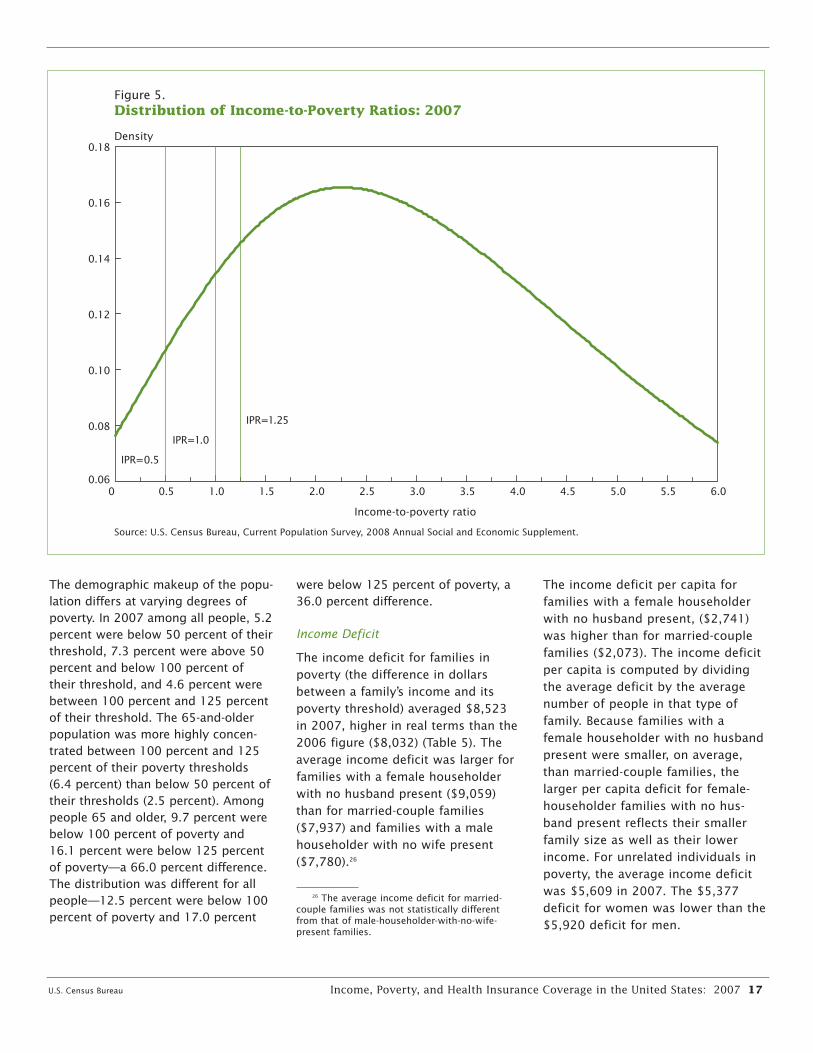
The demographic makeup of the popu-lation differs at varying degrees ofpoverty. In 2007 among all people, 5.2percent were below 50 percent of theirthreshold, 7.3 percent were above 50percent and below 100 percent oftheir threshold, and 4.6 percent werebetween 100 percent and 125 percentof their threshold. The 65-and-olderpopulation was more highly concen-trated between 100 percent and 125percent of their poverty thresholds(6.4 percent) than below 50 percent oftheir thresholds (2.5 percent). Amongpeople 65 and older, 9.7 percent werebelow 100 percent of poverty and16.1 percent were below 125 percentof poverty—a 66.0 percent difference.The distribution was different for allpeople—12.5 percent were below 100percent of poverty and 17.0 percent
were below 125 percent of poverty, a36.0 percent difference.
Income Deficit
The income deficit for families inpoverty (the difference in dollarsbetween a family’s income and itspoverty threshold) averaged $8,523in 2007, higher in real terms than the2006 figure ($8,032) (Table 5). Theaverage income deficit was larger forfamilies with a female householderwith no husband present ($9,059)than for married-couple families($7,937) and families with a malehouseholder with no wife present($7,780).26
U.S. Census Bureau Income, Poverty, and Health Insurance Coverage in the United States: 2007 17
26 The average income deficit for married-couple families was not statistically differentfrom that of male-householder-with-no-wife-present families.
The income deficit per capita forfamilies with a female householderwith no husband present, ($2,741)was higher than for married-couplefamilies ($2,073). The income deficitper capita is computed by dividingthe average deficit by the averagenumber of people in that type offamily. Because families with afemale householder with no husbandpresent were smaller, on average,than married-couple families, thelarger per capita deficit for female-householder families with no hus-band present reflects their smallerfamily size as well as their lowerincome. For unrelated individuals inpoverty, the average income deficitwas $5,609 in 2007. The $5,377deficit for women was lower than the$5,920 deficit for men.
Figure 5.Distribution of Income-to-Poverty Ratios: 2007
Density
Income-to-poverty ratio
Source: U.S. Census Bureau, Current Population Survey, 2008 Annual Social and Economic Supplement.
0.06
0.08
0.10
0.12
0.14
0.16
0.18
0 0.5 1.0 1.5 2.0 2.5 3.0 3.5 4.0 4.5 5.0 5.5 6.0
IPR=0.5
IPR=1.0
IPR=1.25
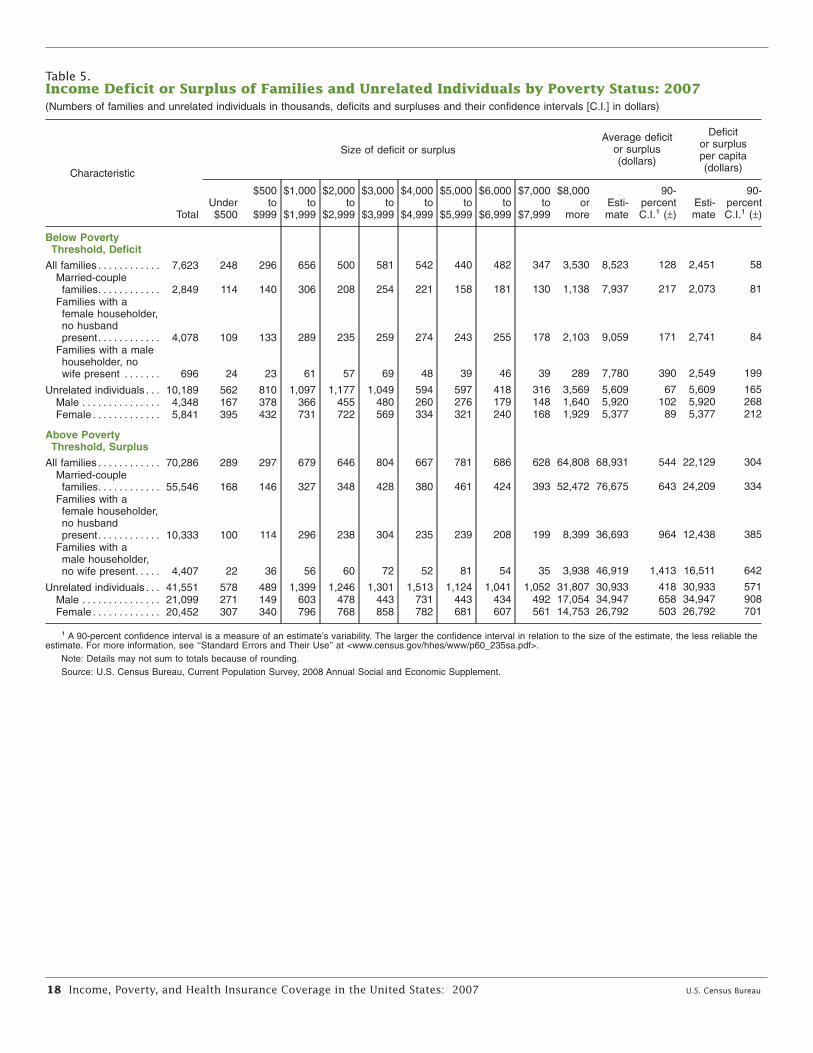
18 Income, Poverty, and Health Insurance Coverage in the United States: 2007 U.S. Census Bureau
Table 5.Income Deficit or Surplus of Families and Unrelated Individuals by Poverty Status: 2007(Numbers of families and unrelated individuals in thousands, deficits and surpluses and their confidence intervals [C.I.] in dollars)
Characteristic
Total
Size of deficit or surplusAverage deficit
or surplus(dollars)
Deficitor surplusper capita(dollars)
Under$500
$500to
$999
$1,000to
$1,999
$2,000to
$2,999
$3,000to
$3,999
$4,000to
$4,999
$5,000to
$5,999
$6,000to
$6,999
$7,000to
$7,999
$8,000or
moreEsti-mate
90-percentC.I.1 (±)
Esti-mate
90-percentC.I.1 (±)
Below PovertyThreshold, Deficit
All families . . . . . . . . . . . .Married-couple
families. . . . . . . . . . . .Families with a
female householder,no husbandpresent. . . . . . . . . . . .
Families with a malehouseholder, nowife present . . . . . . .
Unrelated individuals . . .Male . . . . . . . . . . . . . . .Female . . . . . . . . . . . . .
Above PovertyThreshold, Surplus
All families . . . . . . . . . . . .Married-couple
families. . . . . . . . . . . .Families with a
female householder,no husbandpresent. . . . . . . . . . . .
Families with amale householder,no wife present. . . . .
Unrelated individuals . . .Male . . . . . . . . . . . . . . .Female . . . . . . . . . . . . .
7,623
2,849
4,078
696
10,1894,3485,841
70,286
55,546
10,333
4,407
41,55121,09920,452
248
114
109
24
562167395
289
168
100
22
578271307
296
140
133
23
810378432
297
146
114
36
489149340
656
306
289
61
1,097366731
679
327
296
56
1,399603796
500
208
235
57
1,177455722
646
348
238
60
1,246478768
581
254
259
69
1,049480569
804
428
304
72
1,301443858
542
221
274
48
594260334
667
380
235
52
1,513731782
440
158
243
39
597276321
781
461
239
81
1,124443681
482
181
255
46
418179240
686
424
208
54
1,041434607
347
130
178
39
316148168
628
393
199
35
1,052492561
3,530
1,138
2,103
289
3,5691,6401,929
64,808
52,472
8,399
3,938
31,80717,05414,753
8,523
7,937
9,059
7,780
5,6095,9205,377
68,931
76,675
36,693
46,919
30,93334,94726,792
128
217
171
390
67102
89
544
643
964
1,413
418658503
2,451
2,073
2,741
2,549
5,6095,9205,377
22,129
24,209
12,438
16,511
30,93334,94726,792
58
81
84
199
165268212
304
334
385
642
571908701
1 A 90-percent confidence interval is a measure of an estimate’s variability. The larger the confidence interval in relation to the size of the estimate, the less reliable theestimate. For more information, see ‘‘Standard Errors and Their Use’’ at <www.census.gov/hhes/www/p60_235sa.pdf>.
Note: Details may not sum to totals because of rounding.Source: U.S. Census Bureau, Current Population Survey, 2008 Annual Social and Economic Supplement.

HEALTH INSURANCECOVERAGE IN THE UNITED STATES
Highlights
• Both the percentage and number ofpeople without health insurancedecreased in 2007. The percentagewithout health insurance was 15.3percent in 2007, down from 15.8percent in 2006, and the numberof uninsured was 45.7 million,down from 47.0 million (Table 6).27
• The number of people with healthinsurance increased to 253.4 mil-lion in 2007 (up from 249.8 millionin 2006). The number of peoplecovered by private health insur-ance (202.0 million) in 2007 wasnot statistically different from2006, while the number of peoplecovered by government healthinsurance increased to 83.0 mil-lion, up from 80.3 million in 2006.
• The percentage of people coveredby private health insurance was67.5 percent, down from 67.9 per-cent in 2006 (Figure 7). The per-centage of people covered byemployment-based health insur-ance decreased to 59.3 in 2007from 59.7 percent in 2006. Thenumber of people covered byemployment-based health insur-ance, 177.4 million, was not statis-tically different from 2006.
U.S. Census Bureau Income, Poverty, and Health Insurance Coverage in the United States: 2007 19
27 For a brief description of how the CensusBureau collects and reports on health insurance,see the text box “What Is Health InsuranceCoverage?” For a discussion of the quality ofASEC health insurance coverage estimates, seeAppendix C.
The Annual Social and Economic Supplement (ASEC) to the CurrentPopulation Survey (CPS) asks about health insurance coverage in the pre-vious calendar year. The survey asks separate questions about the majortypes of health insurance, and people who answer “no” to each of thecoverage questions are then asked to verify that they were, in fact, notcovered by any type of health insurance. For reporting purposes, theCensus Bureau broadly classifies health insurance coverage as privatecoverage or government coverage. Private health insurance is a plan pro-vided through an employer or a union or purchased by an individual froma private company. Government health insurance includes the federal pro-grams Medicare, Medicaid, and military health care; the State Children’sHealth Insurance Program (SCHIP); and individual state health plans.*People were considered “insured” if they were covered by any type ofhealth insurance for part or all of the previous calendar year. They wereconsidered “uninsured” if they were not covered by any type of healthinsurance at any time in that year.
Research shows health insurance coverage is underreported in the CPS ASECfor a variety of reasons. Annual retrospective questions appear to cause fewproblems when collecting income data (possibly because the interviewperiod is close to when people pay their taxes). However, because healthinsurance coverage status can change over the course of a year, answeringquestions about this long reference period may lead to response errors. Forexample, some people may report their insurance coverage status at thetime of their interview rather than their coverage status during the previouscalendar year. Compared with other national surveys, the CPS ASEC’s esti-mate of the number of people without health insurance more closely approx-imates the number of people who were uninsured at a specific point in timeduring the year than the number of people uninsured for the entire year.
For more information on the quality of CPS ASEC health insurance esti-mates, see Appendix C, “Estimates of Health Insurance Coverage.” For acomparison of health insurance coverage rates from the major federal sur-veys, see How Many People Lack Health Insurance and for How Long?(Congressional Budget Office, May 2003) and People With HealthInsurance: A Comparison of Estimates From Two Surveys (Survey of Incomeand Program Participation Working Paper 243, June 2004).
What Is Health Insurance Coverage?
* Types of insurance are not mutually exclusive; people may be covered by more than oneduring the year.
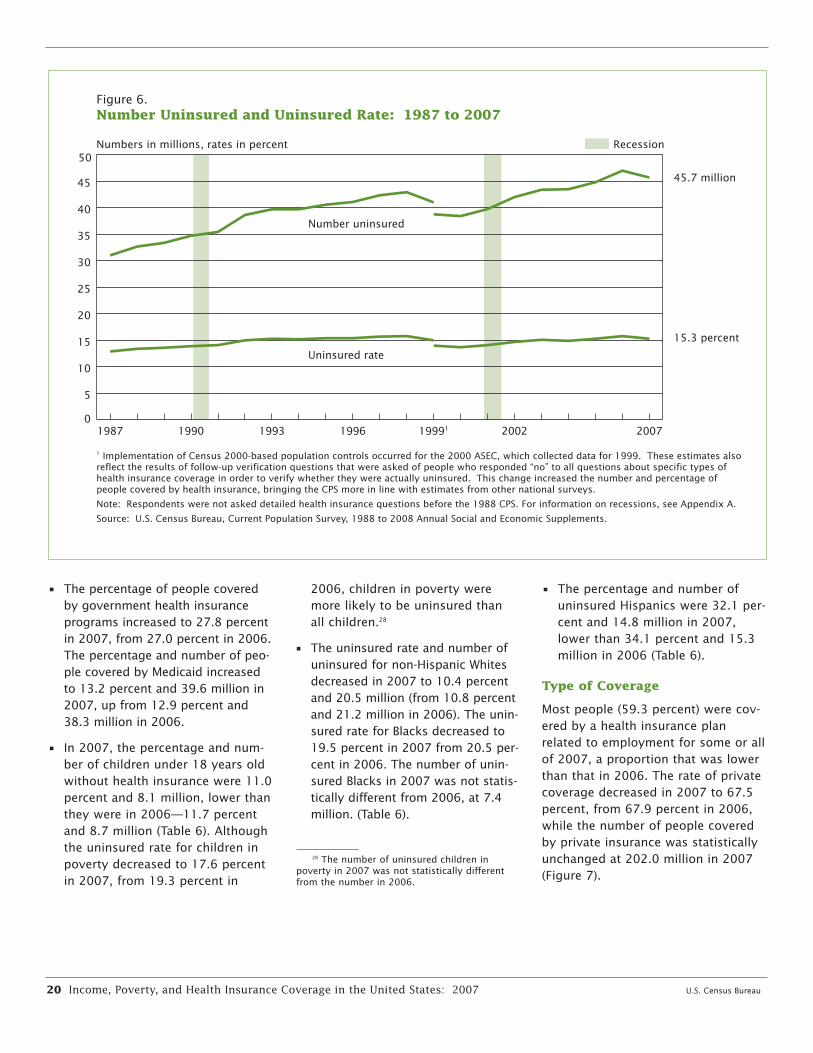
• The percentage of people coveredby government health insuranceprograms increased to 27.8 percentin 2007, from 27.0 percent in 2006.The percentage and number of peo-ple covered by Medicaid increasedto 13.2 percent and 39.6 million in2007, up from 12.9 percent and38.3 million in 2006.
• In 2007, the percentage and num-ber of children under 18 years oldwithout health insurance were 11.0percent and 8.1 million, lower thanthey were in 2006—11.7 percentand 8.7 million (Table 6). Althoughthe uninsured rate for children inpoverty decreased to 17.6 percentin 2007, from 19.3 percent in
20 Income, Poverty, and Health Insurance Coverage in the United States: 2007 U.S. Census Bureau
2006, children in poverty weremore likely to be uninsured thanall children.28
• The uninsured rate and number ofuninsured for non-Hispanic Whitesdecreased in 2007 to 10.4 percentand 20.5 million (from 10.8 percentand 21.2 million in 2006). The unin-sured rate for Blacks decreased to19.5 percent in 2007 from 20.5 per-cent in 2006. The number of unin-sured Blacks in 2007 was not statis-tically different from 2006, at 7.4million. (Table 6).
28 The number of uninsured children inpoverty in 2007 was not statistically differentfrom the number in 2006.
• The percentage and number ofuninsured Hispanics were 32.1 per-cent and 14.8 million in 2007,lower than 34.1 percent and 15.3million in 2006 (Table 6).
Type of Coverage
Most people (59.3 percent) were cov-ered by a health insurance planrelated to employment for some or allof 2007, a proportion that was lowerthan that in 2006. The rate of privatecoverage decreased in 2007 to 67.5percent, from 67.9 percent in 2006,while the number of people coveredby private insurance was statisticallyunchanged at 202.0 million in 2007(Figure 7).
Figure 6.Number Uninsured and Uninsured Rate: 1987 to 2007
1 Implementation of Census 2000-based population controls occurred for the 2000 ASEC, which collected data for 1999. These estimates also reflect the results of follow-up verification questions that were asked of people who responded “no” to all questions about specific types of health insurance coverage in order to verify whether they were actually uninsured. This change increased the number and percentage of people covered by health insurance, bringing the CPS more in line with estimates from other national surveys.
Note: Respondents were not asked detailed health insurance questions before the 1988 CPS. For information on recessions, see Appendix A.
Source: U.S. Census Bureau, Current Population Survey, 1988 to 2008 Annual Social and Economic Supplements.
Numbers in millions, rates in percent
0
5
10
15
20
25
30
35
40
45
50
20072002199911996199319901987
45.7 million
15.3 percent
Number uninsured
Uninsured rate
Recession
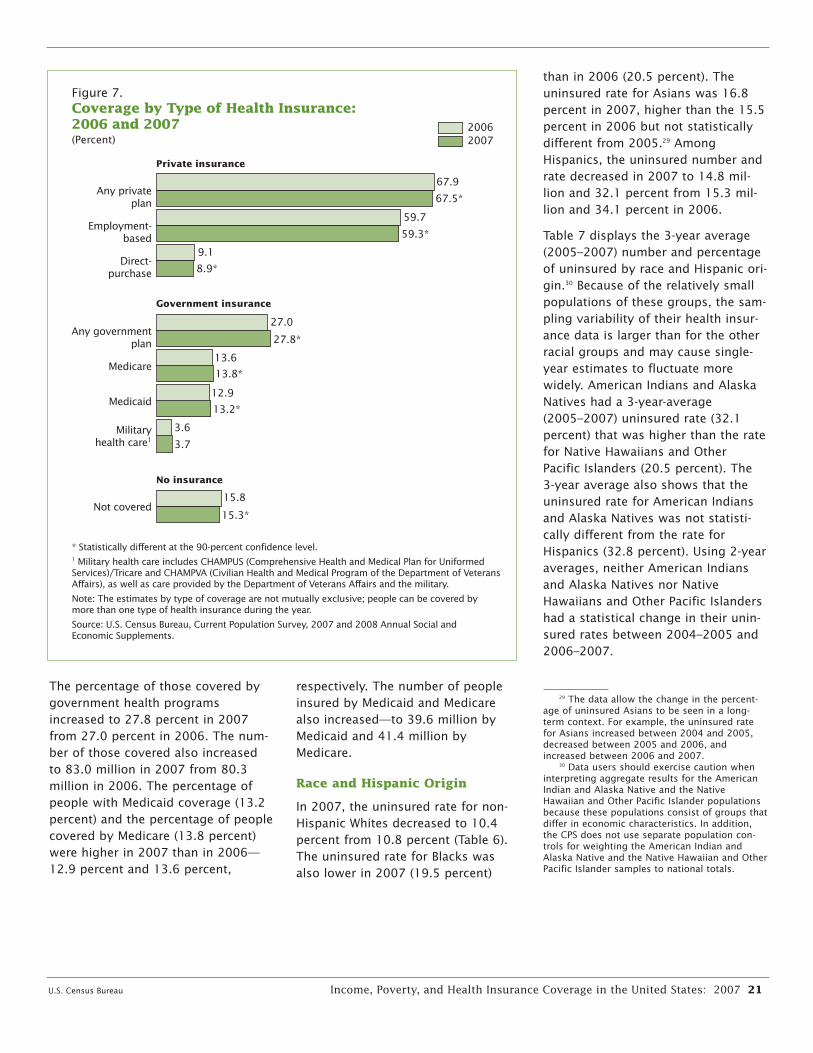
The percentage of those covered by respectively. The number of peoplegovernment health programs insured by Medicaid and Medicareincreased to 27.8 percent in 2007 also increased—to 39.6 million byfrom 27.0 percent in 2006. The num- Medicaid and 41.4 million byber of those covered also increased Medicare. to 83.0 million in 2007 from 80.3million in 2006. The percentage of Race and Hispanic Origin
people with Medicaid coverage (13.2 In 2007, the uninsured rate for non-percent) and the percentage of people Hispanic Whites decreased to 10.4covered by Medicare (13.8 percent) percent from 10.8 percent (Table 6).were higher in 2007 than in 2006— The uninsured rate for Blacks was12.9 percent and 13.6 percent, also lower in 2007 (19.5 percent)
than in 2006 (20.5 percent). Theuninsured rate for Asians was 16.8percent in 2007, higher than the 15.5percent in 2006 but not statisticallydifferent from 2005.29 AmongHispanics, the uninsured number andrate decreased in 2007 to 14.8 mil-lion and 32.1 percent from 15.3 mil-lion and 34.1 percent in 2006.
Table 7 displays the 3-year average(2005–2007) number and percentageof uninsured by race and Hispanic ori-gin.30 Because of the relatively smallpopulations of these groups, the sam-pling variability of their health insur-ance data is larger than for the otherracial groups and may cause single-year estimates to fluctuate morewidely. American Indians and AlaskaNatives had a 3-year-average(2005–2007) uninsured rate (32.1percent) that was higher than the ratefor Native Hawaiians and OtherPacific Islanders (20.5 percent). The3-year average also shows that theuninsured rate for American Indiansand Alaska Natives was not statisti-cally different from the rate forHispanics (32.8 percent). Using 2-yearaverages, neither American Indiansand Alaska Natives nor NativeHawaiians and Other Pacific Islandershad a statistical change in their unin-sured rates between 2004–2005 and2006–2007.
U.S. Census Bureau Income, Poverty, and Health Insurance Coverage in the United States: 2007 21
29 The data allow the change in the percent-age of uninsured Asians to be seen in a long-term context. For example, the uninsured ratefor Asians increased between 2004 and 2005,decreased between 2005 and 2006, andincreased between 2006 and 2007.
30 Data users should exercise caution wheninterpreting aggregate results for the AmericanIndian and Alaska Native and the NativeHawaiian and Other Pacific Islander populationsbecause these populations consist of groups thatdiffer in economic characteristics. In addition,the CPS does not use separate population con-trols for weighting the American Indian andAlaska Native and the Native Hawaiian and OtherPacific Islander samples to national totals.
Figure 7.Coverage by Type of Health Insurance: 2006 and 2007
* Statistically different at the 90-percent confidence level.1 Military health care includes CHAMPUS (Comprehensive Health and Medical Plan for Uniformed Services)/Tricare and CHAMPVA (Civilian Health and Medical Program of the Department of Veterans Affairs), as well as care provided by the Department of Veterans Affairs and the military.
Note: The estimates by type of coverage are not mutually exclusive; people can be covered by more than one type of health insurance during the year.
Source: U.S. Census Bureau, Current Population Survey, 2007 and 2008 Annual Social and Economic Supplements.
Private insurance
Government insurance
No insurance
20062007(Percent)
Not covered
Militaryhealth care1
Medicaid
Medicare
Any governmentplan
Direct-purchase
Employment-based
Any privateplan
15.3*
67.9
59.7
9.1
27.0
13.6
12.9
3.6
15.8
67.5*
59.3*
8.9*
27.8*
13.8*
13.2*
3.7
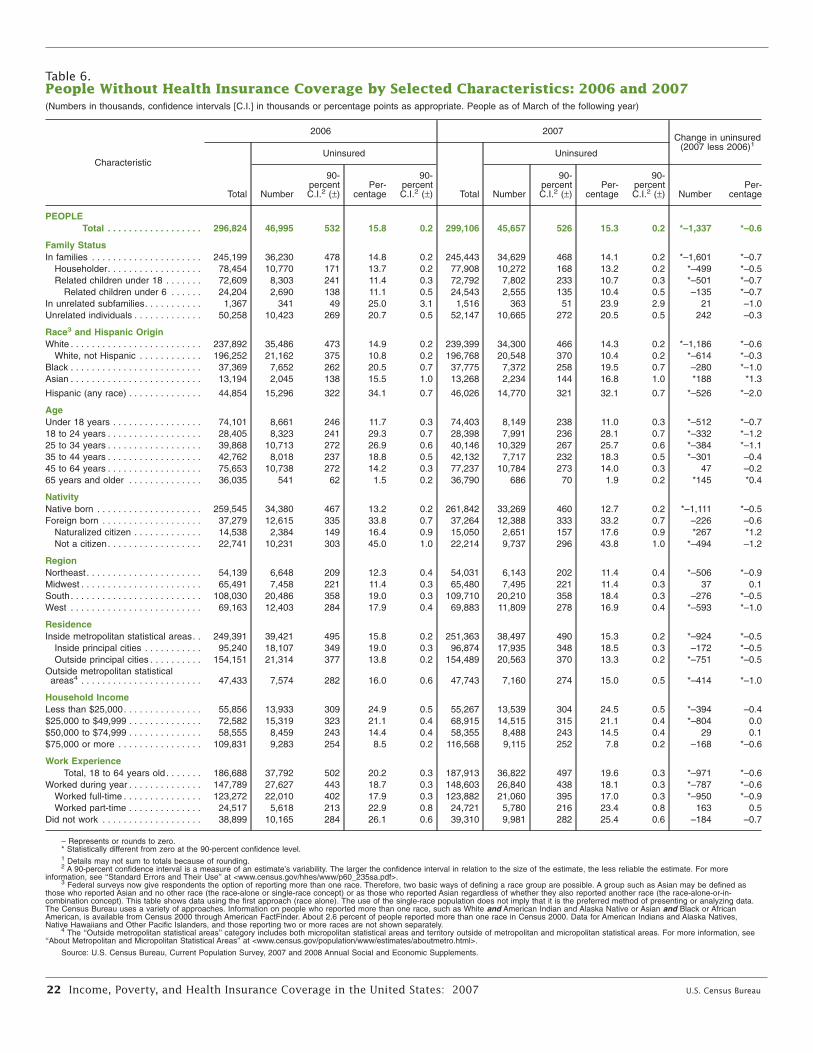
22 Income, Poverty, and Health Insurance Coverage in the United States: 2007 U.S. Census Bureau
Table 6.People Without Health Insurance Coverage by Selected Characteristics: 2006 and 2007(Numbers in thousands, confidence intervals [C.I.] in thousands or percentage points as appropriate. People as of March of the following year)
2006 2007Change in uninsured
(2007 less 2006)1Uninsured Uninsured
Characteristic90- 90- 90- 90-
percent Per- percent percent Per- percent Per-Total Number C.I.2 (±) centage C.I.2 (±) Total Number C.I.2 (±) centage C.I.2 (±) Number centage
PEOPLETotal . . . . . . . . . . . . . . . . . . 296,824 46,995 532 15.8 0.2 299,106 45,657 526 15.3 0.2 *–1,337 *–0.6
Family StatusIn families . . . . . . . . . . . . . . . . . . . . . 245,199 36,230 478 14.8 0.2 245,443 34,629 468 14.1 0.2 *–1,601 *–0.7
Householder. . . . . . . . . . . . . . . . . . 78,454 10,770 171 13.7 0.2 77,908 10,272 168 13.2 0.2 *–499 *–0.5Related children under 18 . . . . . . . 72,609 8,303 241 11.4 0.3 72,792 7,802 233 10.7 0.3 *–501 *–0.7
Related children under 6 . . . . . . 24,204 2,690 138 11.1 0.5 24,543 2,555 135 10.4 0.5 –135 *–0.7In unrelated subfamilies. . . . . . . . . . . 1,367 341 49 25.0 3.1 1,516 363 51 23.9 2.9 21 –1.0Unrelated individuals . . . . . . . . . . . . . 50,258 10,423 269 20.7 0.5 52,147 10,665 272 20.5 0.5 242 –0.3
Race3 and Hispanic OriginWhite . . . . . . . . . . . . . . . . . . . . . . . . . 237,892 35,486 473 14.9 0.2 239,399 34,300 466 14.3 0.2 *–1,186 *–0.6
White, not Hispanic . . . . . . . . . . . . 196,252 21,162 375 10.8 0.2 196,768 20,548 370 10.4 0.2 *–614 *–0.3Black . . . . . . . . . . . . . . . . . . . . . . . . . 37,369 7,652 262 20.5 0.7 37,775 7,372 258 19.5 0.7 –280 *–1.0Asian . . . . . . . . . . . . . . . . . . . . . . . . . 13,194 2,045 138 15.5 1.0 13,268 2,234 144 16.8 1.0 *188 *1.3
Hispanic (any race) . . . . . . . . . . . . . . 44,854 15,296 322 34.1 0.7 46,026 14,770 321 32.1 0.7 *–526 *–2.0
AgeUnder 18 years . . . . . . . . . . . . . . . . . 74,101 8,661 246 11.7 0.3 74,403 8,149 238 11.0 0.3 *–512 *–0.718 to 24 years . . . . . . . . . . . . . . . . . . 28,405 8,323 241 29.3 0.7 28,398 7,991 236 28.1 0.7 *–332 *–1.225 to 34 years . . . . . . . . . . . . . . . . . . 39,868 10,713 272 26.9 0.6 40,146 10,329 267 25.7 0.6 *–384 *–1.135 to 44 years . . . . . . . . . . . . . . . . . . 42,762 8,018 237 18.8 0.5 42,132 7,717 232 18.3 0.5 *–301 –0.445 to 64 years . . . . . . . . . . . . . . . . . . 75,653 10,738 272 14.2 0.3 77,237 10,784 273 14.0 0.3 47 –0.265 years and older . . . . . . . . . . . . . . 36,035 541 62 1.5 0.2 36,790 686 70 1.9 0.2 *145 *0.4
NativityNative born . . . . . . . . . . . . . . . . . . . . 259,545 34,380 467 13.2 0.2 261,842 33,269 460 12.7 0.2 *–1,111 *–0.5Foreign born . . . . . . . . . . . . . . . . . . . 37,279 12,615 335 33.8 0.7 37,264 12,388 333 33.2 0.7 –226 –0.6
Naturalized citizen . . . . . . . . . . . . . 14,538 2,384 149 16.4 0.9 15,050 2,651 157 17.6 0.9 *267 *1.2Not a citizen. . . . . . . . . . . . . . . . . . 22,741 10,231 303 45.0 1.0 22,214 9,737 296 43.8 1.0 *–494 –1.2
RegionNortheast . . . . . . . . . . . . . . . . . . . . . . 54,139 6,648 209 12.3 0.4 54,031 6,143 202 11.4 0.4 *–506 *–0.9Midwest . . . . . . . . . . . . . . . . . . . . . . . 65,491 7,458 221 11.4 0.3 65,480 7,495 221 11.4 0.3 37 0.1South. . . . . . . . . . . . . . . . . . . . . . . . . 108,030 20,486 358 19.0 0.3 109,710 20,210 358 18.4 0.3 –276 *–0.5West . . . . . . . . . . . . . . . . . . . . . . . . . 69,163 12,403 284 17.9 0.4 69,883 11,809 278 16.9 0.4 *–593 *–1.0
ResidenceInside metropolitan statistical areas. . 249,391 39,421 495 15.8 0.2 251,363 38,497 490 15.3 0.2 *–924 *–0.5
Inside principal cities . . . . . . . . . . . 95,240 18,107 349 19.0 0.3 96,874 17,935 348 18.5 0.3 –172 *–0.5Outside principal cities . . . . . . . . . . 154,151 21,314 377 13.8 0.2 154,489 20,563 370 13.3 0.2 *–751 *–0.5
Outside metropolitan statistical4areas . . . . . . . . . . . . . . . . . . . . . . . 47,433 7,574 282 16.0 0.6 47,743 7,160 274 15.0 0.5 *–414 *–1.0
Household IncomeLess than $25,000. . . . . . . . . . . . . . . 55,856 13,933 309 24.9 0.5 55,267 13,539 304 24.5 0.5 *–394 –0.4$25,000 to $49,999 . . . . . . . . . . . . . . 72,582 15,319 323 21.1 0.4 68,915 14,515 315 21.1 0.4 *–804 0.0$50,000 to $74,999 . . . . . . . . . . . . . . 58,555 8,459 243 14.4 0.4 58,355 8,488 243 14.5 0.4 29 0.1$75,000 or more . . . . . . . . . . . . . . . . 109,831 9,283 254 8.5 0.2 116,568 9,115 252 7.8 0.2 –168 *–0.6
Work ExperienceTotal, 18 to 64 years old . . . . . . . 186,688 37,792 502 20.2 0.3 187,913 36,822 497 19.6 0.3 *–971 *–0.6
Worked during year . . . . . . . . . . . . . . 147,789 27,627 443 18.7 0.3 148,603 26,840 438 18.1 0.3 *–787 *–0.6Worked full-time . . . . . . . . . . . . . . . 123,272 22,010 402 17.9 0.3 123,882 21,060 395 17.0 0.3 *–950 *–0.9Worked part-time . . . . . . . . . . . . . . 24,517 5,618 213 22.9 0.8 24,721 5,780 216 23.4 0.8 163 0.5
Did not work . . . . . . . . . . . . . . . . . . . 38,899 10,165 284 26.1 0.6 39,310 9,981 282 25.4 0.6 –184 –0.7
– Represents or rounds to zero.* Statistically different from zero at the 90-percent confidence level.1 Details may not sum to totals because of rounding.2 A 90-percent confidence interval is a measure of an estimate’s variability. The larger the confidence interval in relation to the size of the estimate, the less reliable the estimate. For more
information, see ‘‘Standard Errors and Their Use’’ at <www.census.gov/hhes/www/p60_235sa.pdf>.3 Federal surveys now give respondents the option of reporting more than one race. Therefore, two basic ways of defining a race group are possible. A group such as Asian may be defined as
those who reported Asian and no other race (the race-alone or single-race concept) or as those who reported Asian regardless of whether they also reported another race (the race-alone-or-in-combination concept). This table shows data using the first approach (race alone). The use of the single-race population does not imply that it is the preferred method of presenting or analyzing data.The Census Bureau uses a variety of approaches. Information on people who reported more than one race, such as White and American Indian and Alaska Native or Asian and Black or AfricanAmerican, is available from Census 2000 through American FactFinder. About 2.6 percent of people reported more than one race in Census 2000. Data for American Indians and Alaska Natives,Native Hawaiians and Other Pacific Islanders, and those reporting two or more races are not shown separately.
4 The ‘‘Outside metropolitan statistical areas’’ category includes both micropolitan statistical areas and territory outside of metropolitan and micropolitan statistical areas. For more information, see‘‘About Metropolitan and Micropolitan Statistical Areas’’ at <www.census.gov/population/www/estimates/aboutmetro.html>.
Source: U.S. Census Bureau, Current Population Survey, 2007 and 2008 Annual Social and Economic Supplements.

Nativity
The uninsured rate for the native-born population declined to 12.7 per-cent in 2007, from 13.2 percent in2006, while the uninsured rate forthe foreign-born population was sta-tistically unchanged at 33.2 percentin 2007 (Table 6). Among the foreign-born population, the uninsured ratefor naturalized citizens increased to17.6 percent in 2007 (from 16.4 per-cent in 2006), while the uninsuredrate for noncitizens declined to 43.8percent in 2007 (from 45.0 percent in
2006).31 The proportion of theforeign-born population withouthealth insurance in 2007 was abouttwo and one-half times that of thenative-born population in 2007.
Economic Status
The proportion of people not coveredby health insurance is lower amongpeople with higher income. In 2007,24.5 percent of people in households
U.S. Census Bureau Income, Poverty, and Health Insurance Coverage in the United States: 2007 23
31 The number of uninsured foreign-born citi-zens in 2007 was not statistically different fromthe number in 2006.
with annual incomes of less than$25,000 had no health insurance cov-erage. Uninsured rates decreased foreach consecutive household incomegroup to 21.1 percent for householdswith incomes of $25,000 to $49,999,14.5 percent for households withincomes of $50,000 to $74,999, and7.8 percent for households withincomes of $75,000 or more. Amongthe four household income groups inTable 6, the uninsured rate was notstatistically different in 2007 from2006 in the lower three groups. The
Table 7.People Without Health Insurance Coverage by Race and Hispanic Origin Using 2- and 3-YearAverages: 2004–2005 and 2006–2007(Numbers in thousands. People as of March of the following year)
Race1 and Hispanic origin
3-year average2005–20072
2-year average Change (2006–2007 averageless 2004–20052 average)2004–20052 2006–2007
Estimate
90-percentconfidence
interval3 (±) Estimate
90-percentconfidence
interval3 (±) Estimate
90-percentconfidence
interval3 (±) Estimate
90-percentconfidence
interval3 (±)
Number Uninsured
All races. . . . . . . . . . . . . . . . . . . . 45,822 360 44,156 418 46,326 427 *2,170 562White . . . . . . . . . . . . . . . . . . . . . . . . . . . . . . . 34,578 320 33,484 372 34,893 379 *1,409 499
White, not Hispanic. . . . . . . . . . . . . . . . . 20,873 255 20,732 300 20,855 301 123 399Black . . . . . . . . . . . . . . . . . . . . . . . . . . . . . . . 7,343 176 6,935 202 7,512 210 *577 274American Indian and Alaska Native. . . . . 809 61 693 67 869 75 *176 95Asian . . . . . . . . . . . . . . . . . . . . . . . . . . . . . . . 2,147 96 2,031 111 2,139 114 109 149Native Hawaiian and Other Pacific
Islander . . . . . . . . . . . . . . . . . . . . . . . . . . . . 140 26 139 30 141 31 2 41
Hispanic (any race). . . . . . . . . . . . . . . . . . . 14,673 233 13,633 263 15,033 274 *1,400 349
Percentage Uninsured
All races. . . . . . . . . . . . . . . . . . . . 15.4 0.1 15.1 0.1 15.5 0.1 *0.5 0.2White . . . . . . . . . . . . . . . . . . . . . . . . . . . . . . . 14.5 0.1 14.2 0.2 14.6 0.2 *0.4 0.2
White, not Hispanic. . . . . . . . . . . . . . . . . 10.6 0.1 10.6 0.2 10.6 0.2 – 0.2Black . . . . . . . . . . . . . . . . . . . . . . . . . . . . . . . 19.6 0.5 18.9 0.5 20.0 0.5 *1.1 0.7American Indian and Alaska Native. . . . . 32.1 2.0 30.3 2.5 32.9 2.4 2.6 3.2Asian . . . . . . . . . . . . . . . . . . . . . . . . . . . . . . . 16.5 0.7 16.3 0.9 16.2 0.8 –0.2 1.1Native Hawaiian and Other Pacific
Islander . . . . . . . . . . . . . . . . . . . . . . . . . . . . 20.5 3.4 22.8 4.4 19.5 3.8 –3.2 5.5
Hispanic (any race). . . . . . . . . . . . . . . . . . . 32.8 0.5 32.1 0.6 33.1 0.6 *1.0 0.8
* Statistically different from zero at the 90-percent confidence level.– Represents or rounds to zero.1 Federal surveys now give respondents the option of reporting more than one race. Therefore, two basic ways of defining a race group are possible. A group such as
Asian may be defined as those who reported Asian and no other race (the race-alone or single-race concept) or as those who reported Asian regardless of whether theyalso reported another race (the race-alone-or-in-combination concept). This table shows data using the first approach (race alone). The use of the single-race populationdoes not imply that it is the preferred method of presenting or analyzing data. The Census Bureau uses a variety of approaches. Information on people who reported morethan one race, such as White and American Indian and Alaska Native or Asian and Black or African American, is available from Census 2000 through American FactFinder.About 2.6 percent of people reported more than one race in Census 2000.
2 The 2004 and 2005 data were revised in March 2007. See <www.census.gov/hhes/www/hlthins/usernote/schedule.html>.3 A 90-percent confidence interval is a measure of an estimate’s variability. The larger the confidence interval in relation to the size of the estimate, the less reliable the
estimate. For more information, see ‘‘Standard Errors and Their Use’’ at <www.census.gov/hhes/www/p60_235sa.pdf>.Source: U.S. Census Bureau, Current Population Survey, 2005 to 2008 Annual Social and Economic Supplements.
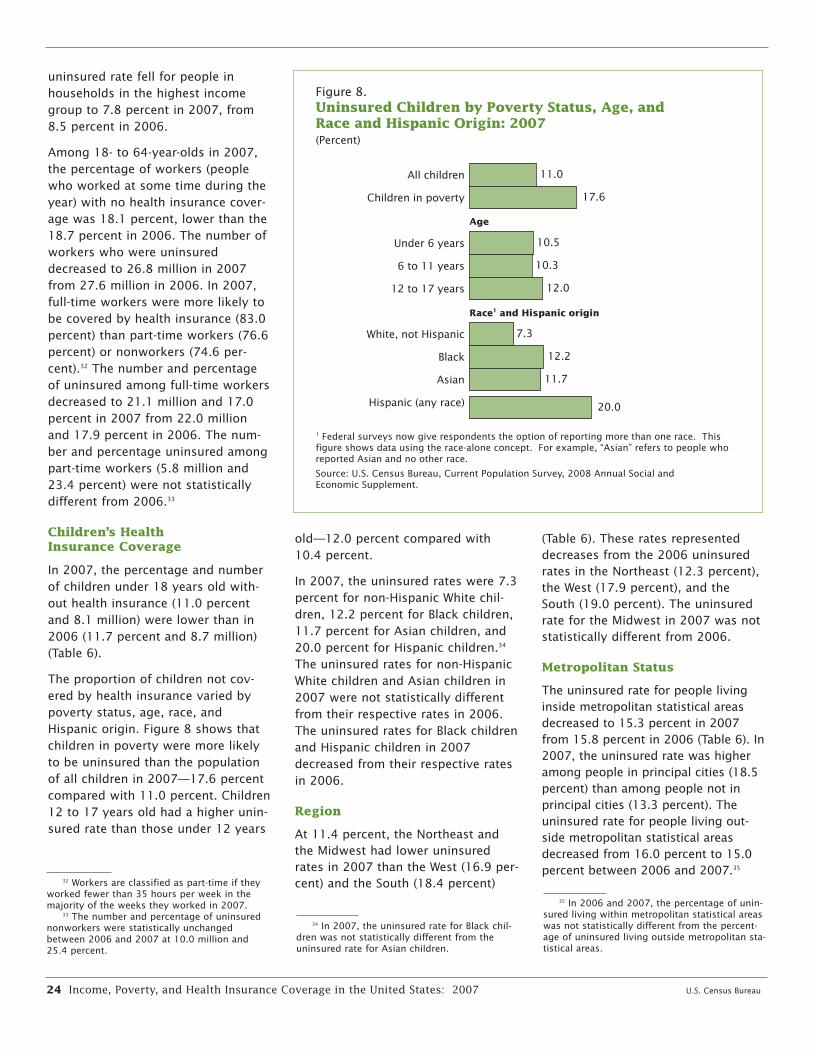
uninsured rate fell for people inhouseholds in the highest incomegroup to 7.8 percent in 2007, from8.5 percent in 2006.
Among 18- to 64-year-olds in 2007,the percentage of workers (peoplewho worked at some time during theyear) with no health insurance cover-age was 18.1 percent, lower than the18.7 percent in 2006. The number ofworkers who were uninsureddecreased to 26.8 million in 2007from 27.6 million in 2006. In 2007,full-time workers were more likely tobe covered by health insurance (83.0percent) than part-time workers (76.6percent) or nonworkers (74.6 per-cent).32 The number and percentageof uninsured among full-time workersdecreased to 21.1 million and 17.0percent in 2007 from 22.0 millionand 17.9 percent in 2006. The num-ber and percentage uninsured amongpart-time workers (5.8 million and23.4 percent) were not statisticallydifferent from 2006.33
Children’s Health Insurance Coverage
In 2007, the percentage and numberof children under 18 years old with-out health insurance (11.0 percentand 8.1 million) were lower than in2006 (11.7 percent and 8.7 million)(Table 6).
The proportion of children not cov-ered by health insurance varied bypoverty status, age, race, andHispanic origin. Figure 8 shows thatchildren in poverty were more likelyto be uninsured than the populationof all children in 2007—17.6 percentcompared with 11.0 percent. Children12 to 17 years old had a higher unin-sured rate than those under 12 years
n
24 Income, Poverty, and Health Insurance Coverage in the United States: 2007 U.S. Census Bureau
32 Workers are classified as part-time if theyworked fewer than 35 hours per week in themajority of the weeks they worked in 2007.
33 The number and percentage of uninsurednonworkers were statistically unchangedbetween 2006 and 2007 at 10.0 million and25.4 percent.
old—12.0 percent compared with10.4 percent.
In 2007, the uninsured rates were 7.3percent for non-Hispanic White chil-dren, 12.2 percent for Black children,11.7 percent for Asian children, and20.0 percent for Hispanic children.34
The uninsured rates for non-HispanicWhite children and Asian children in2007 were not statistically differentfrom their respective rates in 2006.The uninsured rates for Black childrenand Hispanic children in 2007decreased from their respective ratesin 2006.
Region
At 11.4 percent, the Northeast andthe Midwest had lower uninsuredrates in 2007 than the West (16.9 per-cent) and the South (18.4 percent)
34 In 2007, the uninsured rate for Black chil-dren was not statistically different from theuninsured rate for Asian children.
(Table 6). These rates representeddecreases from the 2006 uninsuredrates in the Northeast (12.3 percent),the West (17.9 percent), and theSouth (19.0 percent). The uninsuredrate for the Midwest in 2007 was notstatistically different from 2006.
Metropolitan Status
The uninsured rate for people livinginside metropolitan statistical areasdecreased to 15.3 percent in 2007from 15.8 percent in 2006 (Table 6). I2007, the uninsured rate was higheramong people in principal cities (18.5percent) than among people not inprincipal cities (13.3 percent). Theuninsured rate for people living out-side metropolitan statistical areasdecreased from 16.0 percent to 15.0percent between 2006 and 2007.35
35 In 2006 and 2007, the percentage of unin-sured living within metropolitan statistical areaswas not statistically different from the percent-age of uninsured living outside metropolitan sta-tistical areas.
Figure 8.Uninsured Children by Poverty Status, Age, and Race and Hispanic Origin: 2007 (Percent)
11.0
17.6
10.5
10.3
12.0
7.3
12.2
11.7
20.0Hispanic (any race)
Asian
Black
White, not Hispanic
12 to 17 years
6 to 11 years
Under 6 years
Children in poverty
All children
Race1 and Hispanic origin
Age
1 Federal surveys now give respondents the option of reporting more than one race. This figure shows data using the race-alone concept. For example, “Asian” refers to people who reported Asian and no other race.
Source: U.S. Census Bureau, Current Population Survey, 2008 Annual Social and Economic Supplement.

U.S. Census Bureau Income, Poverty, and Health Insurance Coverage in the United States: 2007 25
Table 8.Number and Percentage of People Without Health Insurance Coverage by State Using 2- and3-Year Averages: 2004–2005 and 2006–2007(Numbers in thousands. People as of March of the following year)
3-year average (2005–2007)1 2-year average, percentage uninsured
1Uninsured 2004–2005 2006–2007 ChangeState (2006–2007
90-percent 90-percent 90-percent 90-percent average lessconfidence Per- confidence Per- confidence Per- confidence 2004–20051
Total Number interval2 (±) centage interval2 (±) centage interval2 (±) centage interval2 (±) average)3
United States. . . . 296,588 45,822 360 15.4 0.1 15.1 0.1 15.5 0.1 *0.5
Alabama . . . . . . . . . . . . . . . . 4,542 632 44 13.9 1.0 13.5 1.1 13.6 1.1 0.1Alaska. . . . . . . . . . . . . . . . . . 664 115 8 17.3 1.1 16.9 1.3 17.4 1.3 0.5Arizona . . . . . . . . . . . . . . . . . 6,228 1,219 64 19.6 1.0 18.1 1.2 19.6 1.2 1.5Arkansas . . . . . . . . . . . . . . . 2,774 485 30 17.5 1.1 16.8 1.3 17.5 1.3 0.7California . . . . . . . . . . . . . . . 36,148 6,720 151 18.6 0.4 18.4 0.5 18.5 0.5 0.1Colorado. . . . . . . . . . . . . . . . 4,773 799 52 16.7 1.1 16.3 1.3 16.8 1.3 0.5Connecticut . . . . . . . . . . . . . 3,475 344 30 9.9 0.9 10.9 1.1 9.4 1.0 *–1.5Delaware . . . . . . . . . . . . . . . 856 101 8 11.8 0.9 12.7 1.2 11.7 1.1 –1.0District of Columbia . . . . . . . 564 64 6 11.4 1.0 12.8 1.3 10.6 1.2 *–2.2Florida. . . . . . . . . . . . . . . . . . 18,007 3,698 105 20.5 0.6 19.8 0.7 20.7 0.7 0.9
Georgia. . . . . . . . . . . . . . . . . 9,295 1,658 70 17.8 0.8 17.6 0.9 17.6 0.9 –Hawaii. . . . . . . . . . . . . . . . . . 1,267 105 10 8.3 0.8 8.5 0.9 8.2 0.9 –0.3Idaho. . . . . . . . . . . . . . . . . . . 1,473 216 15 14.7 1.0 14.7 1.2 14.6 1.2 –Illinois . . . . . . . . . . . . . . . . . . 12,647 1,735 75 13.7 0.6 13.4 0.7 13.7 0.7 0.3Indiana . . . . . . . . . . . . . . . . . 6,247 766 49 12.3 0.8 13.7 1.0 11.6 0.9 *–2.1Iowa . . . . . . . . . . . . . . . . . . . 2,933 274 25 9.4 0.9 8.7 1.0 9.9 1.0 1.2Kansas . . . . . . . . . . . . . . . . . 2,713 320 26 11.8 1.0 10.5 1.1 12.5 1.2 *2.0Kentucky. . . . . . . . . . . . . . . . 4,122 569 42 13.8 1.0 13.0 1.2 14.6 1.2 *1.6Louisiana . . . . . . . . . . . . . . . 4,166 807 48 19.4 1.1 16.9 1.3 20.2 1.4 *3.3Maine . . . . . . . . . . . . . . . . . . 1,316 125 12 9.5 0.9 9.6 1.1 9.1 1.1 –0.5
Maryland. . . . . . . . . . . . . . . . 5,582 761 50 13.6 0.9 13.4 1.0 13.8 1.1 0.4Massachusetts . . . . . . . . . . . 6,334 527 41 8.3 0.7 10.3 0.8 7.9 0.7 *–2.4Michigan . . . . . . . . . . . . . . . . 9,960 1,075 59 10.8 0.6 10.7 0.7 11.0 0.7 0.3Minnesota. . . . . . . . . . . . . . . 5,156 438 38 8.5 0.7 8.2 0.9 8.8 0.9 0.6Mississippi . . . . . . . . . . . . . . 2,883 543 32 18.8 1.1 16.8 1.3 19.8 1.3 *3.0Missouri . . . . . . . . . . . . . . . . 5,767 723 49 12.5 0.8 11.8 1.0 12.9 1.0 1.1Montana . . . . . . . . . . . . . . . . 933 150 10 16.1 1.1 16.9 1.3 16.4 1.3 –0.5Nebraska . . . . . . . . . . . . . . . 1,762 212 17 12.0 1.0 10.5 1.1 12.8 1.2 *2.3Nevada . . . . . . . . . . . . . . . . . 2,517 452 29 17.9 1.1 17.7 1.4 18.4 1.4 0.7New Hampshire . . . . . . . . . . 1,308 138 12 10.5 0.9 9.9 1.0 11.0 1.1 1.1
New Jersey . . . . . . . . . . . . . 8,647 1,318 65 15.2 0.7 14.2 0.9 15.6 0.9 *1.4New Mexico . . . . . . . . . . . . . 1,943 425 25 21.9 1.3 20.1 1.5 22.7 1.6 *2.6New York . . . . . . . . . . . . . . . 19,041 2,551 93 13.4 0.5 12.8 0.6 13.6 0.6 *0.8North Carolina . . . . . . . . . . . 8,865 1,469 68 16.6 0.8 15.1 0.9 17.2 0.9 *2.1North Dakota . . . . . . . . . . . . 619 68 6 11.1 0.9 10.5 1.1 11.1 1.1 0.6Ohio . . . . . . . . . . . . . . . . . . . 11,318 1,249 63 11.0 0.6 11.0 0.7 10.9 0.7 –0.1Oklahoma. . . . . . . . . . . . . . . 3,516 640 40 18.2 1.1 18.5 1.4 18.4 1.3 –0.2Oregon . . . . . . . . . . . . . . . . . 3,702 621 42 16.8 1.1 15.9 1.3 17.3 1.3 1.4Pennsylvania . . . . . . . . . . . . 12,313 1,203 63 9.8 0.5 10.3 0.6 9.8 0.6 –0.6Rhode Island . . . . . . . . . . . . 1,051 108 10 10.3 0.9 10.9 1.1 9.7 1.1 –1.2
South Carolina . . . . . . . . . . . 4,264 705 46 16.5 1.1 16.0 1.3 16.2 1.2 0.2South Dakota . . . . . . . . . . . . 776 87 7 11.2 0.9 11.4 1.0 11.0 1.0 –0.4Tennessee . . . . . . . . . . . . . . 5,979 830 51 13.9 0.8 13.3 1.0 14.0 1.0 0.7Texas . . . . . . . . . . . . . . . . . . 23,253 5,687 136 24.4 0.6 23.9 0.7 24.8 0.7 *0.9Utah . . . . . . . . . . . . . . . . . . . 2,573 399 25 15.6 1.0 14.9 1.1 15.1 1.1 0.3Vermont . . . . . . . . . . . . . . . . 619 68 6 11.0 1.0 11.0 1.2 10.7 1.1 –0.3Virginia . . . . . . . . . . . . . . . . . 7,559 1,031 57 13.6 0.7 13.1 0.9 14.1 0.9 1.0Washington . . . . . . . . . . . . . 6,359 770 51 12.1 0.8 12.8 1.0 11.6 0.9 –1.3West Virginia . . . . . . . . . . . . 1,803 268 17 14.9 1.0 16.5 1.2 13.8 1.1 *–2.7Wisconsin. . . . . . . . . . . . . . . 5,465 480 40 8.8 0.7 9.7 0.9 8.5 0.9 *–1.2Wyoming . . . . . . . . . . . . . . . 515 73 6 14.3 1.1 13.7 1.3 14.1 1.3 0.4
* Statistically different from zero at the 90-percent confidence level.– Represents or rounds to zero.1 The 2004 and 2005 data were revised in March 2007. See <www.census.gov/hhes/www/hlthins/usernote/schedule.html>.2 A 90-percent confidence interval is a measure of an estimate’s variability. The larger the confidence interval in relation to the size of the estimate, the less reliable the
estimate. For more information, see ‘‘Standard Errors and Their Use’’ at <www.census.gov/hhes/www/p60_235sa.pdf>.3 Details may not sum to totals because of rounding.Source: U.S. Census Bureau, Current Population Survey, 2005 to 2008 Annual Social and Economic Supplements.

State-Level Data
The Census Bureau recommendsusing 3-year averages to compareestimates across states. Appendix Ddisplays 3-year averages and theassociated 90-percent confidenceintervals for the United States, eachof the 50 states, and the District ofColumbia. This ordered list shouldnot be regarded as a ranking.36
26 Income, Poverty, and Health Insurance Coverage in the United States: 2007 U.S. Census Bureau
36 The CPS ASEC is designed to collect statisti-cally reliable estimates primarily at the nationallevel and secondarily at the regional level. Stateestimates are considerably less reliable—that is,the sampling variability for state estimates ishigher, and state estimates fluctuate more widelyyear-to-year than national estimates.
Comparing 3-year-average uninsuredrates for 2005–2007 across statesshows that Texas (24.4 percent) hadthe highest percentage of uninsured.No one state had the “lowest” unin-sured rate. At 8.3 percent,Massachusetts and Hawaii had thelowest point estimates for uninsuredrates, but they were not statisticallydifferent from Minnesota (8.5 per-cent), Wisconsin (8.8 percent), andIowa (9.4 percent). In addition, Hawaiiwas not statistically different fromMaine (9.5 percent) (Table 8).37
37 The uninsured rates for Minnesota,Wisconsin, Iowa, and Maine are not statisticallydifferent from each other.
Figure 9 is a map highlightingwhether the 2-year-average uninsuredrate for 2006–2007 for each state andthe District of Columbia is statisticallyhigher, lower, or not different fromthe 2-year-average uninsured rate for2004–2005. Five states (Connecticut,Indiana, Massachusetts, West Virginia,and Wisconsin) and the District ofColumbia had lower 2-year-averageuninsured rates for 2006–2007 thantheir 2-year-average uninsured ratesfor 2004–2005. Ten states (Kansas,Kentucky, Louisiana, Mississippi,Nebraska, New Jersey, New Mexico,New York, North Carolina, and Texas)had higher 2-year-average uninsured
TX+0.9
NM+2.6
WA
NV
MI
IL
MO
MT
WY
ID
UTCO
HI
NE+2.3
AK
KS+2.0
OK
WI–1.2
IA
LA+3.3
MEVT
IN–2.1
KY+1.6
TN
AL GA
OH
WV–2.7
NC+2.1
SC
NJ+1.4
MD
CT–1.5
RI
MA–2.4
DE
SD
VA
AR
CA
AZ
NY+0.8
DC–2.2
OR
PA
ND
MN
MS+3.0
FL
NH
IncreaseNot statistically differentDecrease
Percentage-point difference
Figure 9. Differences in 2-Year-Average Uninsured Rates by State: 2006–2007 Less 2004–20051
1 The 2004 and 2005 data were revised in March 2007. See <www.census.gov/hhes/www/hlthins/usernote/schedule.html>.Source: U.S. Census Bureau, Current Population Survey, 2005 to 2008 Annual Social and Economic Supplements.
rates for 2006–2007 than their 2-year-average uninsured rates for2004–2005.
CPS DATA COLLECTION
The information in this report wascollected in the 50 states and theDistrict of Columbia and does notrepresent residents of Puerto Rico andU.S. island areas.38 It is based on a
U.S. Census Bureau Income, Poverty, and Health Insurance Coverage in the United States: 2007 27
38 U.S. island areas include American Samoa,Guam, the Northern Mariana Islands, and theVirgin Islands of the United States.
sample of about 100,000 addresses.The estimates in this report are con-trolled to national population esti-mates by age, sex, race, and Hispanicorigin. The population controls usedto prepare estimates for 1999 to2007 were based on the results fromCensus 2000 and are updated annu-ally using administrative records forsuch things as births, deaths, emigra-tion, and immigration.
The CPS is a household survey prima-rily used to collect employment data.The sample universe for the basic CPS
consists of the resident civilian nonin-stitutionalized population of theUnited States. People in institutions,such as prisons, long-term care hospi-tals, and nursing homes, are not eligi-ble to be interviewed in the CPS.Students living in dormitories are onlyincluded in the estimates if informa-tion about them is reported in an inter-view at their parents’ homes. The sam-ple universe for the CPS ASEC isslightly larger than that of the basicCPS since it includes military personnelwho live in a household with at leastone other civilian adult, regardless ofwhether they live off post or on post.All other Armed Forces are excluded.For further documentation about theCPS ASEC, see <www.census.gov/apsd/techdoc/cps/cpsmar08.pdf>.
COMMENTS
The Census Bureau welcomes thecomments and advice of data andreport users. If you have suggestionsor comments, please write to:
Charles NelsonAssistant Division Chief for Income, Poverty, and Health Statistics
Housing and Household Economic Statistics Division
U.S. Census BureauWashington, DC 20233-8500
or send e-mail to<[email protected]>.
Additional Data and Contacts
Detailed tables, historical tables, press releases and briefings, and unpub-lished data are available electronically on the Census Bureau’s income,poverty, and health insurance Web sites. The Web sites may be accessedthrough the Census Bureau’s home page at <www.census.gov> or directlyat <www.census.gov/hhes/www/income/income.html> for income data,<www.census.gov/hhes/www/poverty/poverty.html> for poverty data,and <www.census.gov/hhes/www/hlthins/hlthins.html> for health insur-ance data.
Microdata are available for download by clicking on “Data Tools” on theCensus Bureau’s home page and then clicking the “DataFerrett” link.Technical methods have been applied to CPS microdata to avoid disclosingthe identities of individuals from whom data were collected.
For assistance with income, poverty, or health insurance data or questionsabout them, contact the Data Integration Division’s Information Resourcesand Dissemination Branch at 301-763-3242, or search your topic of inter-est using the Census Bureau’s “Question and Answer Center” found at<ask.census.gov>.

U.S. Census Bureau Income, Poverty, and Health Insurance Coverage in the United States: 2007 29
APPENDIX A.ESTIMATES OF INCOME
How Income Is Measured
For each person 15 years and older inthe sample, the Annual Social andEconomic Supplement (ASEC) asksquestions on the amount of moneyincome received in the preceding cal-endar year from each of the followingsources:
1. Earnings 2. Unemployment compensation 3. Workers’ compensation 4. Social security 5. Supplemental security income 6. Public assistance 7. Veterans’ payments 8. Survivor benefits 9. Disability benefits 10. Pension or retirement income 11. Interest 12. Dividends 13. Rents, royalties, and estates and
trusts 14. Educational assistance 15. Alimony 16. Child support 17. Financial assistance from outside
of the household
18. Other income
It should be noted that although theincome statistics refer to receipts dur-ing the preceding calendar year, thedemographic characteristics, such asage, labor force status, and house-hold composition, are as of the sur-vey date. The income of the house-hold does not include amountsreceived by people who were mem-bers during all or part of the previousyear if these people no longer residedin the household at the time of inter-view. The Current Population Survey(CPS) collects income data for people
who are current residents but did not when comparing income levels.reside in the household during the Moreover, readers should be awareprevious year. that for many different reasons there
is a tendency in household surveys forData on income collected in the ASEC
respondents to underreport theirby the U.S. Census Bureau cover
income. Based on an analysis of money income received (exclusive of
independently derived income esti-certain money receipts such as capital
mates, the Census Bureau determinedgains) before payments for personal
that respondents report income earnedincome taxes, social security, union
from wages or salaries more accu-dues, Medicare deductions, etc.
rately than other sources of income,Therefore, money income does not
and that the reported wage and salaryreflect the fact that some families
income is nearly equal to independentreceive noncash benefits, such as food
estimates of aggregate income.stamps, health benefits, subsidizedhousing, and goods produced and Recessionsconsumed on the farm. In addition,
Recessions are defined by themoney income does not reflect theNational Bureau of Economicfact that noncash benefits are alsoResearch, Inc. Peak and troughreceived by some nonfarm residents,months of recent recessions arewhich often take the form of the useshown in the text box above. Theof business transportation and facili-data points in the time series chartsties, full or partial payments by busi-in this report use July as a referenceness for retirement programs, medicalfor recessions.and educational expenses, etc. Data
users should consider these elements
Recessions
Peak month Year Trough month Year
November 1948 October 1949July 1953 May 1954August 1957 April 1958April 1960 February 1961December 1969 November 1970November 1973 March 1975January 1980 July 1980July 1981 November 1982July 1990 March 1991March 2001 November 2001
Source: National Bureau of Economic Research, Inc. Cambridge, MA 02138<www.nber.org>
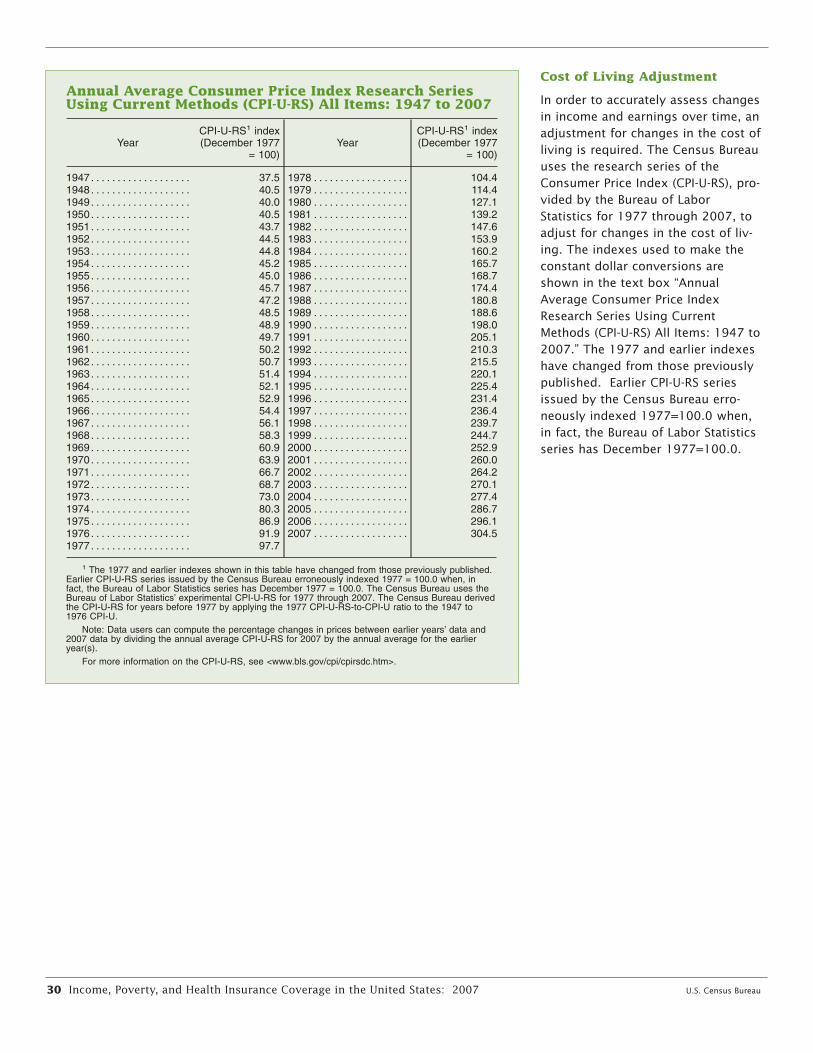
30 Income, Poverty, and Health Insurance Coverage in the United States: 2007 U.S. Census Bureau
Annual Average Consumer Price Index Research SeriesUsing Current Methods (CPI-U-RS) All Items: 1947 to 2007
CPI-U-RS1 index CPI-U-RS1 indexYear (December 1977 Year (December 1977
= 100) = 100)
1947. . . . . . . . . . . . . . . . . . . 37.5 1978 . . . . . . . . . . . . . . . . . . 104.41948. . . . . . . . . . . . . . . . . . . 40.5 1979 . . . . . . . . . . . . . . . . . . 114.41949. . . . . . . . . . . . . . . . . . . 40.0 1980 . . . . . . . . . . . . . . . . . . 127.11950. . . . . . . . . . . . . . . . . . . 40.5 1981 . . . . . . . . . . . . . . . . . . 139.21951. . . . . . . . . . . . . . . . . . . 43.7 1982 . . . . . . . . . . . . . . . . . . 147.61952. . . . . . . . . . . . . . . . . . . 44.5 1983 . . . . . . . . . . . . . . . . . . 153.91953. . . . . . . . . . . . . . . . . . . 44.8 1984 . . . . . . . . . . . . . . . . . . 160.21954. . . . . . . . . . . . . . . . . . . 45.2 1985 . . . . . . . . . . . . . . . . . . 165.71955. . . . . . . . . . . . . . . . . . . 45.0 1986 . . . . . . . . . . . . . . . . . . 168.71956. . . . . . . . . . . . . . . . . . . 45.7 1987 . . . . . . . . . . . . . . . . . . 174.41957. . . . . . . . . . . . . . . . . . . 47.2 1988 . . . . . . . . . . . . . . . . . . 180.81958. . . . . . . . . . . . . . . . . . . 48.5 1989 . . . . . . . . . . . . . . . . . . 188.61959. . . . . . . . . . . . . . . . . . . 48.9 1990 . . . . . . . . . . . . . . . . . . 198.01960. . . . . . . . . . . . . . . . . . . 49.7 1991 . . . . . . . . . . . . . . . . . . 205.11961. . . . . . . . . . . . . . . . . . . 50.2 1992 . . . . . . . . . . . . . . . . . . 210.31962. . . . . . . . . . . . . . . . . . . 50.7 1993 . . . . . . . . . . . . . . . . . . 215.51963. . . . . . . . . . . . . . . . . . . 51.4 1994 . . . . . . . . . . . . . . . . . . 220.11964. . . . . . . . . . . . . . . . . . . 52.1 1995 . . . . . . . . . . . . . . . . . . 225.41965. . . . . . . . . . . . . . . . . . . 52.9 1996 . . . . . . . . . . . . . . . . . . 231.41966. . . . . . . . . . . . . . . . . . . 54.4 1997 . . . . . . . . . . . . . . . . . . 236.41967. . . . . . . . . . . . . . . . . . . 56.1 1998 . . . . . . . . . . . . . . . . . . 239.71968. . . . . . . . . . . . . . . . . . . 58.3 1999 . . . . . . . . . . . . . . . . . . 244.71969. . . . . . . . . . . . . . . . . . . 60.9 2000 . . . . . . . . . . . . . . . . . . 252.91970. . . . . . . . . . . . . . . . . . . 63.9 2001 . . . . . . . . . . . . . . . . . . 260.01971. . . . . . . . . . . . . . . . . . . 66.7 2002 . . . . . . . . . . . . . . . . . . 264.21972. . . . . . . . . . . . . . . . . . . 68.7 2003 . . . . . . . . . . . . . . . . . . 270.11973. . . . . . . . . . . . . . . . . . . 73.0 2004 . . . . . . . . . . . . . . . . . . 277.41974. . . . . . . . . . . . . . . . . . . 80.3 2005 . . . . . . . . . . . . . . . . . . 286.71975. . . . . . . . . . . . . . . . . . . 86.9 2006 . . . . . . . . . . . . . . . . . . 296.11976. . . . . . . . . . . . . . . . . . . 91.9 2007 . . . . . . . . . . . . . . . . . . 304.51977. . . . . . . . . . . . . . . . . . . 97.7
1 The 1977 and earlier indexes shown in this table have changed from those previously published.Earlier CPI-U-RS series issued by the Census Bureau erroneously indexed 1977 = 100.0 when, infact, the Bureau of Labor Statistics series has December 1977 = 100.0. The Census Bureau uses theBureau of Labor Statistics’ experimental CPI-U-RS for 1977 through 2007. The Census Bureau derivedthe CPI-U-RS for years before 1977 by applying the 1977 CPI-U-RS-to-CPI-U ratio to the 1947 to1976 CPI-U.
Note: Data users can compute the percentage changes in prices between earlier years’ data and2007 data by dividing the annual average CPI-U-RS for 2007 by the annual average for the earlieryear(s).
For more information on the CPI-U-RS, see <www.bls.gov/cpi/cpirsdc.htm>.
Cost of Living Adjustment
In order to accurately assess changesin income and earnings over time, anadjustment for changes in the cost ofliving is required. The Census Bureauuses the research series of theConsumer Price Index (CPI-U-RS), pro-vided by the Bureau of LaborStatistics for 1977 through 2007, toadjust for changes in the cost of liv-ing. The indexes used to make theconstant dollar conversions areshown in the text box “AnnualAverage Consumer Price IndexResearch Series Using CurrentMethods (CPI-U-RS) All Items: 1947 to2007.” The 1977 and earlier indexeshave changed from those previouslypublished. Earlier CPI-U-RS seriesissued by the Census Bureau erro-neously indexed 1977=100.0 when,in fact, the Bureau of Labor Statisticsseries has December 1977=100.0.

U.S. C
ensu
s Bureau
Inco
me, Po
verty, an
d H
ealth In
suran
ce Coverag
e in th
e Un
ited States: 2
00
7 3
1
Table A-1.Households by Total Money Income, Race, and Hispanic Origin of Householder: 1967 to 2007(Income in 2007 CPI-U-RS adjusted dollars. Households as of March of the following year. For information on confidentiality protection, sampling error, nonsampling error, and definitions, seewww.census.gov/apsd/techdoc/cps/cpsmar08.pdf)
Race and Hispanic originof householder and year
Number(thousands)
Percent distribution Median income(dollars)
Mean income(dollars)
TotalUnder
$5,000
$5,000to
$9,999
$10,000to
$14,999
$15,000to
$24,999
$25,000to
$34,999
$35,000to
$49,999
$50,000to
$74,999
$75,000to
$99,999$100,000and over Value
Standarderror Value
Standarderror
ALL RACES2007 . . . . . . . . . . . . . . . . . . . . . . . . . . . . 116,783 100.0 2.9 4.3 6.0 11.6 10.7 14.1 18.2 11.9 20.2 50,233 140 67,609 2362006 . . . . . . . . . . . . . . . . . . . . . . . . . . . . 116,011 100.0 3.0 4.2 5.9 11.6 11.4 14.3 18.1 11.5 19.9 49,568 213 68,459 2642005 . . . . . . . . . . . . . . . . . . . . . . . . . . . . 114,384 100.0 3.1 4.5 6.1 11.8 11.1 14.4 18.3 11.7 19.1 49,202 165 67,277 25420041. . . . . . . . . . . . . . . . . . . . . . . . . . . . 113,343 100.0 3.3 4.3 6.1 11.9 11.4 14.4 18.1 11.8 18.7 48,665 215 66,373 2502003 . . . . . . . . . . . . . . . . . . . . . . . . . . . . 112,000 100.0 3.1 4.5 6.3 11.9 11.2 14.1 17.9 11.8 19.3 48,835 212 66,590 2442002 . . . . . . . . . . . . . . . . . . . . . . . . . . . . 111,278 100.0 2.9 4.6 6.2 11.6 11.4 14.2 18.1 12.2 18.8 48,878 160 66,677 2502001 . . . . . . . . . . . . . . . . . . . . . . . . . . . . 109,297 100.0 2.7 4.4 5.9 11.7 10.6 15.2 18.0 12.4 19.1 49,455 151 68,171 27220002. . . . . . . . . . . . . . . . . . . . . . . . . . . . 108,209 100.0 2.5 4.4 5.7 11.4 10.9 14.7 18.5 12.5 19.3 50,557 159 68,792 27119993. . . . . . . . . . . . . . . . . . . . . . . . . . . . 106,434 100.0 2.4 4.4 5.8 11.7 10.9 14.6 18.4 12.4 19.4 50,641 236 68,114 3531998 . . . . . . . . . . . . . . . . . . . . . . . . . . . . 103,874 100.0 2.7 4.8 5.7 11.7 11.2 14.5 18.8 12.4 18.2 49,397 292 65,873 3561997 . . . . . . . . . . . . . . . . . . . . . . . . . . . . 102,528 100.0 2.6 5.1 6.1 12.2 11.4 14.6 18.9 12.0 17.0 47,665 220 64,007 3581996 . . . . . . . . . . . . . . . . . . . . . . . . . . . . 101,018 100.0 2.5 5.3 6.4 12.5 11.7 14.7 19.0 12.1 15.8 46,704 236 62,009 34719954. . . . . . . . . . . . . . . . . . . . . . . . . . . . 99,627 100.0 2.6 5.2 6.7 12.6 11.4 15.6 19.1 11.6 15.2 46,034 266 60,708 33219945. . . . . . . . . . . . . . . . . . . . . . . . . . . . 98,990 100.0 2.8 5.6 6.7 13.0 11.9 15.2 18.4 11.4 14.8 44,636 203 59,673 32119936. . . . . . . . . . . . . . . . . . . . . . . . . . . . 97,107 100.0 2.9 5.9 7.0 12.7 11.7 15.8 18.6 11.2 14.2 44,143 206 58,537 31719927. . . . . . . . . . . . . . . . . . . . . . . . . . . . 96,426 100.0 2.7 6.0 6.9 12.9 11.5 15.6 19.3 11.7 13.4 44,359 210 56,238 2361991 . . . . . . . . . . . . . . . . . . . . . . . . . . . . 95,669 100.0 2.6 6.0 6.8 12.4 11.7 15.9 19.6 11.5 13.6 44,726 215 56,301 2321990 . . . . . . . . . . . . . . . . . . . . . . . . . . . . 94,312 100.0 2.5 5.9 6.1 12.4 11.6 15.9 19.9 11.7 13.9 46,049 235 57,521 2431989 . . . . . . . . . . . . . . . . . . . . . . . . . . . . 93,347 100.0 2.4 5.5 6.5 12.0 11.4 15.5 20.0 12.1 14.6 46,670 257 58,963 2571988 . . . . . . . . . . . . . . . . . . . . . . . . . . . . 92,830 100.0 2.4 5.9 6.7 12.0 11.7 15.3 20.3 11.9 13.8 45,852 224 57,291 25619878. . . . . . . . . . . . . . . . . . . . . . . . . . . . 91,124 100.0 2.6 6.0 6.7 12.2 11.6 15.3 20.2 12.0 13.4 45,502 215 56,587 2321986 . . . . . . . . . . . . . . . . . . . . . . . . . . . . 89,479 100.0 2.8 6.1 6.6 12.2 11.8 15.6 20.4 11.7 12.7 44,939 233 55,519 22619859. . . . . . . . . . . . . . . . . . . . . . . . . . . . 88,458 100.0 2.7 6.2 7.2 12.6 12.1 16.3 20.0 11.4 11.5 43,402 235 53,413 2111984 . . . . . . . . . . . . . . . . . . . . . . . . . . . . 86,789 100.0 2.6 6.1 7.3 13.1 12.3 16.5 19.8 11.2 11.0 42,605 194 52,202 192198310 . . . . . . . . . . . . . . . . . . . . . . . . . . . 85,407 100.0 2.9 6.5 7.1 13.6 12.5 16.9 19.7 10.8 10.0 41,322 188 50,257 1881982 . . . . . . . . . . . . . . . . . . . . . . . . . . . . 83,918 100.0 2.8 6.3 7.7 13.4 12.2 17.2 20.3 10.4 9.7 41,613 188 50,150 1861981 . . . . . . . . . . . . . . . . . . . . . . . . . . . . 83,527 100.0 2.6 6.4 7.3 13.7 12.5 16.7 20.8 10.7 9.3 41,724 219 49,847 1821980 . . . . . . . . . . . . . . . . . . . . . . . . . . . . 82,368 100.0 2.4 6.4 7.3 13.2 12.2 16.8 21.4 10.8 9.4 42,429 218 50,462 184197911 . . . . . . . . . . . . . . . . . . . . . . . . . . . 80,776 100.0 2.3 6.1 7.1 12.5 12.5 16.1 22.0 11.4 10.0 43,814 208 52,047 1971978 . . . . . . . . . . . . . . . . . . . . . . . . . . . . 77,330 100.0 2.1 6.0 7.3 13.0 11.7 17.0 21.8 11.4 9.7 43,937 178 51,713 1981977 . . . . . . . . . . . . . . . . . . . . . . . . . . . . 76,030 100.0 2.2 6.4 7.2 13.7 12.2 17.1 21.4 11.1 8.7 42,300 159 50,179 153197612 . . . . . . . . . . . . . . . . . . . . . . . . . . . 74,142 100.0 2.3 6.4 7.3 13.4 12.6 17.2 22.1 10.7 8.1 42,034 156 49,442 152197513 . . . . . . . . . . . . . . . . . . . . . . . . . . . 72,867 100.0 2.4 6.4 7.8 13.5 12.3 18.0 21.9 10.4 7.4 41,348 168 48,282 151197413, 14 . . . . . . . . . . . . . . . . . . . . . . . . 71,163 100.0 2.3 6.1 7.1 13.0 12.4 18.6 21.5 10.8 8.2 42,459 163 49,653 1551973 . . . . . . . . . . . . . . . . . . . . . . . . . . . . 69,859 100.0 2.5 6.0 7.1 12.3 11.8 17.2 22.7 11.2 9.2 43,848 167 50,710 154197215 . . . . . . . . . . . . . . . . . . . . . . . . . . . 68,251 100.0 2.8 6.5 6.9 12.5 11.9 18.3 22.2 10.7 8.3 42,980 164 50,023 155197116 . . . . . . . . . . . . . . . . . . . . . . . . . . . 66,676 100.0 3.2 7.1 6.8 12.6 12.5 19.1 22.2 9.4 6.9 41,215 160 47,401 1511970 . . . . . . . . . . . . . . . . . . . . . . . . . . . . 64,778 100.0 3.3 7.2 6.4 12.3 12.4 19.5 22.3 9.7 6.8 41,620 152 47,657 1521969 . . . . . . . . . . . . . . . . . . . . . . . . . . . . 63,401 100.0 3.2 6.9 6.3 11.9 12.3 19.7 23.0 9.8 6.8 41,945 155 47,720 1501968 . . . . . . . . . . . . . . . . . . . . . . . . . . . . 62,214 100.0 3.4 7.1 6.3 12.5 13.5 20.5 22.6 8.6 5.6 40,442 146 45,753 146196717 . . . . . . . . . . . . . . . . . . . . . . . . . . . 60,813 100.0 4.0 7.5 6.8 12.7 13.9 21.4 20.6 7.7 5.4 38,771 141 43,363 141
See footnotes at end of table.
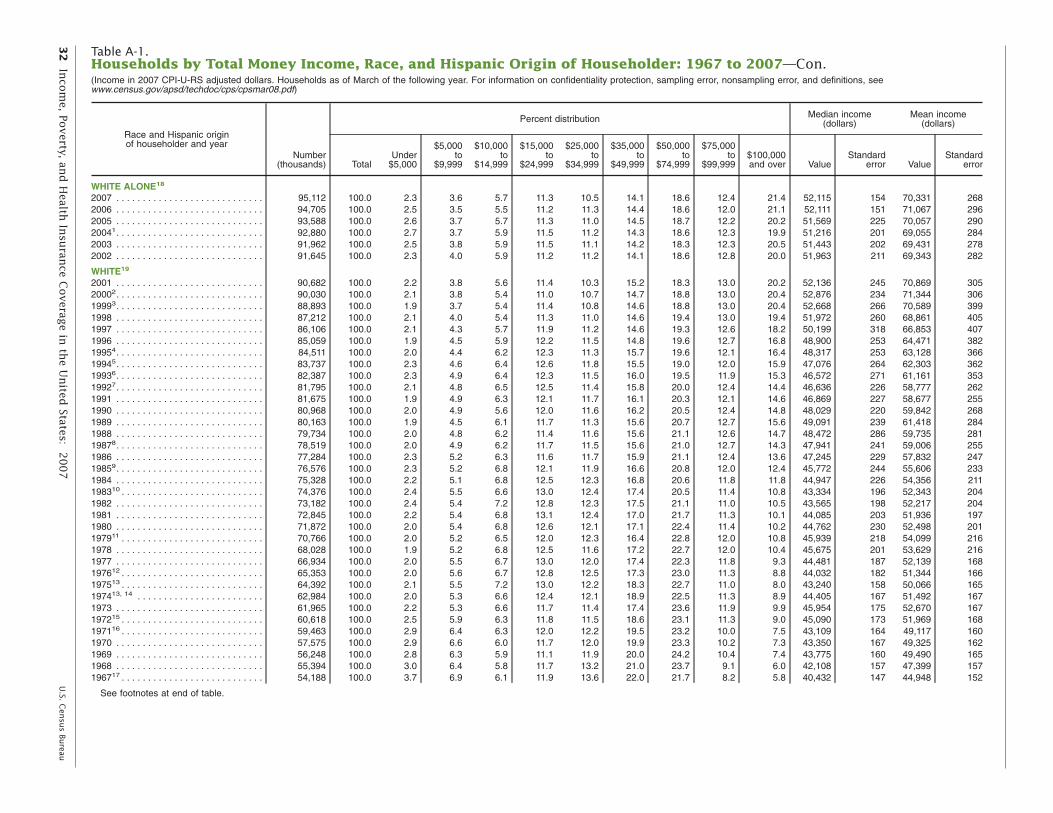
32
Inco
me, Po
verty, an
d H
ealth In
suran
ce Coverag
e in th
e Un
ited States: 2
00
7U
.S. Cen
sus Bu
reau
Table A-1.Households by Total Money Income, Race, and Hispanic Origin of Householder: 1967 to 2007—Con.(Income in 2007 CPI-U-RS adjusted dollars. Households as of March of the following year. For information on confidentiality protection, sampling error, nonsampling error, and definitions, seewww.census.gov/apsd/techdoc/cps/cpsmar08.pdf)
Race and Hispanic originof householder and year
Number(thousands)
Percent distribution Median income(dollars)
Mean income(dollars)
TotalUnder
$5,000
$5,000to
$9,999
$10,000to
$14,999
$15,000to
$24,999
$25,000to
$34,999
$35,000to
$49,999
$50,000to
$74,999
$75,000to
$99,999$100,000and over Value
Standarderror Value
Standarderror
WHITE ALONE18
2007 . . . . . . . . . . . . . . . . . . . . . . . . . . . . 95,112 100.0 2.3 3.6 5.7 11.3 10.5 14.1 18.6 12.4 21.4 52,115 154 70,331 2682006 . . . . . . . . . . . . . . . . . . . . . . . . . . . . 94,705 100.0 2.5 3.5 5.5 11.2 11.3 14.4 18.6 12.0 21.1 52,111 151 71,067 2962005 . . . . . . . . . . . . . . . . . . . . . . . . . . . . 93,588 100.0 2.6 3.7 5.7 11.3 11.0 14.5 18.7 12.2 20.2 51,569 225 70,057 29020041. . . . . . . . . . . . . . . . . . . . . . . . . . . . 92,880 100.0 2.7 3.7 5.9 11.5 11.2 14.3 18.6 12.3 19.9 51,216 201 69,055 2842003 . . . . . . . . . . . . . . . . . . . . . . . . . . . . 91,962 100.0 2.5 3.8 5.9 11.5 11.1 14.2 18.3 12.3 20.5 51,443 202 69,431 2782002 . . . . . . . . . . . . . . . . . . . . . . . . . . . . 91,645 100.0 2.3 4.0 5.9 11.2 11.2 14.1 18.6 12.8 20.0 51,963 211 69,343 282
WHITE19
2001 . . . . . . . . . . . . . . . . . . . . . . . . . . . . 90,682 100.0 2.2 3.8 5.6 11.4 10.3 15.2 18.3 13.0 20.2 52,136 245 70,869 30520002. . . . . . . . . . . . . . . . . . . . . . . . . . . . 90,030 100.0 2.1 3.8 5.4 11.0 10.7 14.7 18.8 13.0 20.4 52,876 234 71,344 30619993. . . . . . . . . . . . . . . . . . . . . . . . . . . . 88,893 100.0 1.9 3.7 5.4 11.4 10.8 14.6 18.8 13.0 20.4 52,668 266 70,589 3991998 . . . . . . . . . . . . . . . . . . . . . . . . . . . . 87,212 100.0 2.1 4.0 5.4 11.3 11.0 14.6 19.4 13.0 19.4 51,972 260 68,861 4051997 . . . . . . . . . . . . . . . . . . . . . . . . . . . . 86,106 100.0 2.1 4.3 5.7 11.9 11.2 14.6 19.3 12.6 18.2 50,199 318 66,853 4071996 . . . . . . . . . . . . . . . . . . . . . . . . . . . . 85,059 100.0 1.9 4.5 5.9 12.2 11.5 14.8 19.6 12.7 16.8 48,900 253 64,471 38219954. . . . . . . . . . . . . . . . . . . . . . . . . . . . 84,511 100.0 2.0 4.4 6.2 12.3 11.3 15.7 19.6 12.1 16.4 48,317 253 63,128 36619945. . . . . . . . . . . . . . . . . . . . . . . . . . . . 83,737 100.0 2.3 4.6 6.4 12.6 11.8 15.5 19.0 12.0 15.9 47,076 264 62,303 36219936. . . . . . . . . . . . . . . . . . . . . . . . . . . . 82,387 100.0 2.3 4.9 6.4 12.3 11.5 16.0 19.5 11.9 15.3 46,572 271 61,161 35319927. . . . . . . . . . . . . . . . . . . . . . . . . . . . 81,795 100.0 2.1 4.8 6.5 12.5 11.4 15.8 20.0 12.4 14.4 46,636 226 58,777 2621991 . . . . . . . . . . . . . . . . . . . . . . . . . . . . 81,675 100.0 1.9 4.9 6.3 12.1 11.7 16.1 20.3 12.1 14.6 46,869 227 58,677 2551990 . . . . . . . . . . . . . . . . . . . . . . . . . . . . 80,968 100.0 2.0 4.9 5.6 12.0 11.6 16.2 20.5 12.4 14.8 48,029 220 59,842 2681989 . . . . . . . . . . . . . . . . . . . . . . . . . . . . 80,163 100.0 1.9 4.5 6.1 11.7 11.3 15.6 20.7 12.7 15.6 49,091 239 61,418 2841988 . . . . . . . . . . . . . . . . . . . . . . . . . . . . 79,734 100.0 2.0 4.8 6.2 11.4 11.6 15.6 21.1 12.6 14.7 48,472 286 59,735 28119878. . . . . . . . . . . . . . . . . . . . . . . . . . . . 78,519 100.0 2.0 4.9 6.2 11.7 11.5 15.6 21.0 12.7 14.3 47,941 241 59,006 2551986 . . . . . . . . . . . . . . . . . . . . . . . . . . . . 77,284 100.0 2.3 5.2 6.3 11.6 11.7 15.9 21.1 12.4 13.6 47,245 229 57,832 24719859. . . . . . . . . . . . . . . . . . . . . . . . . . . . 76,576 100.0 2.3 5.2 6.8 12.1 11.9 16.6 20.8 12.0 12.4 45,772 244 55,606 2331984 . . . . . . . . . . . . . . . . . . . . . . . . . . . . 75,328 100.0 2.2 5.1 6.8 12.5 12.3 16.8 20.6 11.8 11.8 44,947 226 54,356 211198310 . . . . . . . . . . . . . . . . . . . . . . . . . . . 74,376 100.0 2.4 5.5 6.6 13.0 12.4 17.4 20.5 11.4 10.8 43,334 196 52,343 2041982 . . . . . . . . . . . . . . . . . . . . . . . . . . . . 73,182 100.0 2.4 5.4 7.2 12.8 12.3 17.5 21.1 11.0 10.5 43,565 198 52,217 2041981 . . . . . . . . . . . . . . . . . . . . . . . . . . . . 72,845 100.0 2.2 5.4 6.8 13.1 12.4 17.0 21.7 11.3 10.1 44,085 203 51,936 1971980 . . . . . . . . . . . . . . . . . . . . . . . . . . . . 71,872 100.0 2.0 5.4 6.8 12.6 12.1 17.1 22.4 11.4 10.2 44,762 230 52,498 201197911 . . . . . . . . . . . . . . . . . . . . . . . . . . . 70,766 100.0 2.0 5.2 6.5 12.0 12.3 16.4 22.8 12.0 10.8 45,939 218 54,099 2161978 . . . . . . . . . . . . . . . . . . . . . . . . . . . . 68,028 100.0 1.9 5.2 6.8 12.5 11.6 17.2 22.7 12.0 10.4 45,675 201 53,629 2161977 . . . . . . . . . . . . . . . . . . . . . . . . . . . . 66,934 100.0 2.0 5.5 6.7 13.0 12.0 17.4 22.3 11.8 9.3 44,481 187 52,139 168197612 . . . . . . . . . . . . . . . . . . . . . . . . . . . 65,353 100.0 2.0 5.6 6.7 12.8 12.5 17.3 23.0 11.3 8.8 44,032 182 51,344 166197513 . . . . . . . . . . . . . . . . . . . . . . . . . . . 64,392 100.0 2.1 5.5 7.2 13.0 12.2 18.3 22.7 11.0 8.0 43,240 158 50,066 165197413, 14 . . . . . . . . . . . . . . . . . . . . . . . . 62,984 100.0 2.0 5.3 6.6 12.4 12.1 18.9 22.5 11.3 8.9 44,405 167 51,492 1671973 . . . . . . . . . . . . . . . . . . . . . . . . . . . . 61,965 100.0 2.2 5.3 6.6 11.7 11.4 17.4 23.6 11.9 9.9 45,954 175 52,670 167197215 . . . . . . . . . . . . . . . . . . . . . . . . . . . 60,618 100.0 2.5 5.9 6.3 11.8 11.5 18.6 23.1 11.3 9.0 45,090 173 51,969 168197116 . . . . . . . . . . . . . . . . . . . . . . . . . . . 59,463 100.0 2.9 6.4 6.3 12.0 12.2 19.5 23.2 10.0 7.5 43,109 164 49,117 1601970 . . . . . . . . . . . . . . . . . . . . . . . . . . . . 57,575 100.0 2.9 6.6 6.0 11.7 12.0 19.9 23.3 10.2 7.3 43,350 167 49,325 1621969 . . . . . . . . . . . . . . . . . . . . . . . . . . . . 56,248 100.0 2.8 6.3 5.9 11.1 11.9 20.0 24.2 10.4 7.4 43,775 160 49,490 1651968 . . . . . . . . . . . . . . . . . . . . . . . . . . . . 55,394 100.0 3.0 6.4 5.8 11.7 13.2 21.0 23.7 9.1 6.0 42,108 157 47,399 157196717 . . . . . . . . . . . . . . . . . . . . . . . . . . . 54,188 100.0 3.7 6.9 6.1 11.9 13.6 22.0 21.7 8.2 5.8 40,432 147 44,948 152
See footnotes at end of table.
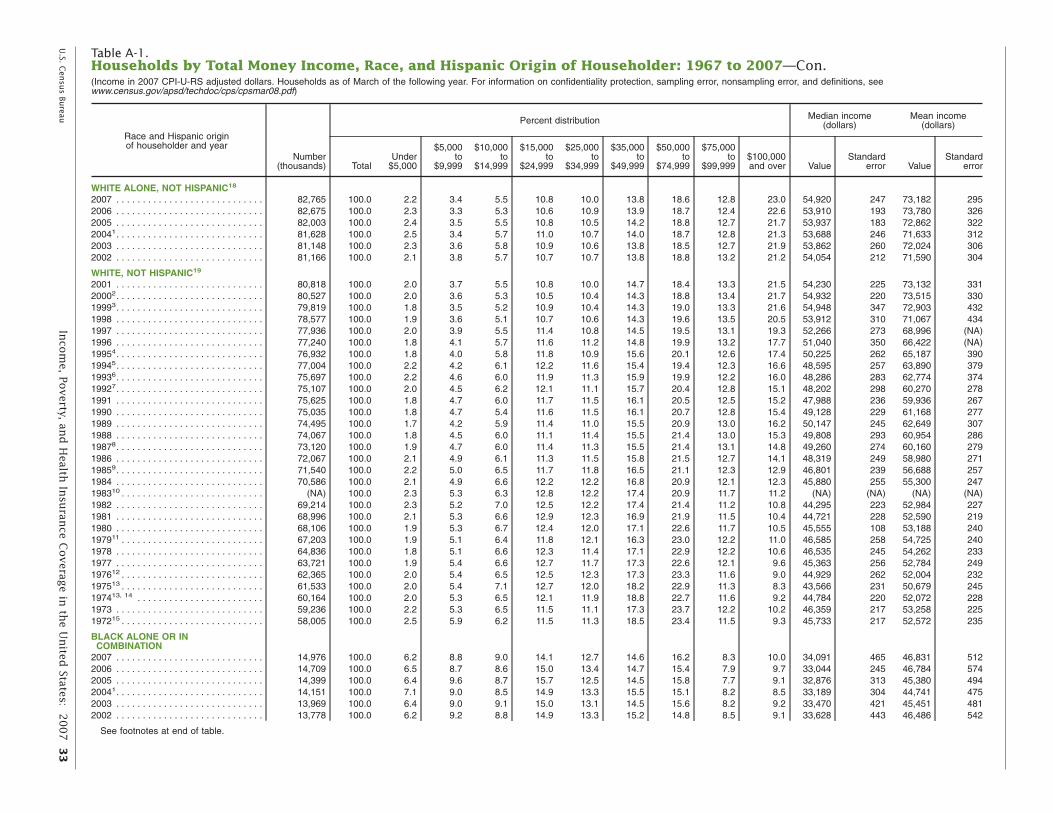
U.S. C
ensu
s Bureau
Inco
me, Po
verty, an
d H
ealth In
suran
ce Coverag
e in th
e Un
ited States: 2
00
7 3
3
Table A-1.Households by Total Money Income, Race, and Hispanic Origin of Householder: 1967 to 2007—Con.(Income in 2007 CPI-U-RS adjusted dollars. Households as of March of the following year. For information on confidentiality protection, sampling error, nonsampling error, and definitions, seewww.census.gov/apsd/techdoc/cps/cpsmar08.pdf)
Race and Hispanic originof householder and year
Number(thousands)
Percent distribution Median income(dollars)
Mean income(dollars)
TotalUnder
$5,000
$5,000to
$9,999
$10,000to
$14,999
$15,000to
$24,999
$25,000to
$34,999
$35,000to
$49,999
$50,000to
$74,999
$75,000to
$99,999$100,000and over Value
Standarderror Value
Standarderror
WHITE ALONE, NOT HISPANIC18
2007 . . . . . . . . . . . . . . . . . . . . . . . . . . . . 82,765 100.0 2.2 3.4 5.5 10.8 10.0 13.8 18.6 12.8 23.0 54,920 247 73,182 2952006 . . . . . . . . . . . . . . . . . . . . . . . . . . . . 82,675 100.0 2.3 3.3 5.3 10.6 10.9 13.9 18.7 12.4 22.6 53,910 193 73,780 3262005 . . . . . . . . . . . . . . . . . . . . . . . . . . . . 82,003 100.0 2.4 3.5 5.5 10.8 10.5 14.2 18.8 12.7 21.7 53,937 183 72,862 32220041. . . . . . . . . . . . . . . . . . . . . . . . . . . . 81,628 100.0 2.5 3.4 5.7 11.0 10.7 14.0 18.7 12.8 21.3 53,688 246 71,633 3122003 . . . . . . . . . . . . . . . . . . . . . . . . . . . . 81,148 100.0 2.3 3.6 5.8 10.9 10.6 13.8 18.5 12.7 21.9 53,862 260 72,024 3062002 . . . . . . . . . . . . . . . . . . . . . . . . . . . .
WHITE, NOT HISPANIC19
81,166 100.0 2.1 3.8 5.7 10.7 10.7 13.8 18.8 13.2 21.2 54,054 212 71,590 304
2001 . . . . . . . . . . . . . . . . . . . . . . . . . . . . 80,818 100.0 2.0 3.7 5.5 10.8 10.0 14.7 18.4 13.3 21.5 54,230 225 73,132 33120002. . . . . . . . . . . . . . . . . . . . . . . . . . . . 80,527 100.0 2.0 3.6 5.3 10.5 10.4 14.3 18.8 13.4 21.7 54,932 220 73,515 33019993. . . . . . . . . . . . . . . . . . . . . . . . . . . . 79,819 100.0 1.8 3.5 5.2 10.9 10.4 14.3 19.0 13.3 21.6 54,948 347 72,903 4321998 . . . . . . . . . . . . . . . . . . . . . . . . . . . . 78,577 100.0 1.9 3.6 5.1 10.7 10.6 14.3 19.6 13.5 20.5 53,912 310 71,067 4341997 . . . . . . . . . . . . . . . . . . . . . . . . . . . . 77,936 100.0 2.0 3.9 5.5 11.4 10.8 14.5 19.5 13.1 19.3 52,266 273 68,996 (NA)1996 . . . . . . . . . . . . . . . . . . . . . . . . . . . . 77,240 100.0 1.8 4.1 5.7 11.6 11.2 14.8 19.9 13.2 17.7 51,040 350 66,422 (NA)19954. . . . . . . . . . . . . . . . . . . . . . . . . . . . 76,932 100.0 1.8 4.0 5.8 11.8 10.9 15.6 20.1 12.6 17.4 50,225 262 65,187 39019945. . . . . . . . . . . . . . . . . . . . . . . . . . . . 77,004 100.0 2.2 4.2 6.1 12.2 11.6 15.4 19.4 12.3 16.6 48,595 257 63,890 37919936. . . . . . . . . . . . . . . . . . . . . . . . . . . . 75,697 100.0 2.2 4.6 6.0 11.9 11.3 15.9 19.9 12.2 16.0 48,286 283 62,774 37419927. . . . . . . . . . . . . . . . . . . . . . . . . . . . 75,107 100.0 2.0 4.5 6.2 12.1 11.1 15.7 20.4 12.8 15.1 48,202 298 60,270 2781991 . . . . . . . . . . . . . . . . . . . . . . . . . . . . 75,625 100.0 1.8 4.7 6.0 11.7 11.5 16.1 20.5 12.5 15.2 47,988 236 59,936 2671990 . . . . . . . . . . . . . . . . . . . . . . . . . . . . 75,035 100.0 1.8 4.7 5.4 11.6 11.5 16.1 20.7 12.8 15.4 49,128 229 61,168 2771989 . . . . . . . . . . . . . . . . . . . . . . . . . . . . 74,495 100.0 1.7 4.2 5.9 11.4 11.0 15.5 20.9 13.0 16.2 50,147 245 62,649 3071988 . . . . . . . . . . . . . . . . . . . . . . . . . . . . 74,067 100.0 1.8 4.5 6.0 11.1 11.4 15.5 21.4 13.0 15.3 49,808 293 60,954 28619878. . . . . . . . . . . . . . . . . . . . . . . . . . . . 73,120 100.0 1.9 4.7 6.0 11.4 11.3 15.5 21.4 13.1 14.8 49,260 274 60,160 2791986 . . . . . . . . . . . . . . . . . . . . . . . . . . . . 72,067 100.0 2.1 4.9 6.1 11.3 11.5 15.8 21.5 12.7 14.1 48,319 249 58,980 27119859. . . . . . . . . . . . . . . . . . . . . . . . . . . . 71,540 100.0 2.2 5.0 6.5 11.7 11.8 16.5 21.1 12.3 12.9 46,801 239 56,688 2571984 . . . . . . . . . . . . . . . . . . . . . . . . . . . . 70,586 100.0 2.1 4.9 6.6 12.2 12.2 16.8 20.9 12.1 12.3 45,880 255 55,300 247198310 . . . . . . . . . . . . . . . . . . . . . . . . . . . (NA) 100.0 2.3 5.3 6.3 12.8 12.2 17.4 20.9 11.7 11.2 (NA) (NA) (NA) (NA)1982 . . . . . . . . . . . . . . . . . . . . . . . . . . . . 69,214 100.0 2.3 5.2 7.0 12.5 12.2 17.4 21.4 11.2 10.8 44,295 223 52,984 2271981 . . . . . . . . . . . . . . . . . . . . . . . . . . . . 68,996 100.0 2.1 5.3 6.6 12.9 12.3 16.9 21.9 11.5 10.4 44,721 228 52,590 2191980 . . . . . . . . . . . . . . . . . . . . . . . . . . . . 68,106 100.0 1.9 5.3 6.7 12.4 12.0 17.1 22.6 11.7 10.5 45,555 108 53,188 240197911 . . . . . . . . . . . . . . . . . . . . . . . . . . . 67,203 100.0 1.9 5.1 6.4 11.8 12.1 16.3 23.0 12.2 11.0 46,585 258 54,725 2401978 . . . . . . . . . . . . . . . . . . . . . . . . . . . . 64,836 100.0 1.8 5.1 6.6 12.3 11.4 17.1 22.9 12.2 10.6 46,535 245 54,262 2331977 . . . . . . . . . . . . . . . . . . . . . . . . . . . . 63,721 100.0 1.9 5.4 6.6 12.7 11.7 17.3 22.6 12.1 9.6 45,363 256 52,784 249197612 . . . . . . . . . . . . . . . . . . . . . . . . . . . 62,365 100.0 2.0 5.4 6.5 12.5 12.3 17.3 23.3 11.6 9.0 44,929 262 52,004 232197513 . . . . . . . . . . . . . . . . . . . . . . . . . . . 61,533 100.0 2.0 5.4 7.1 12.7 12.0 18.2 22.9 11.3 8.3 43,566 231 50,679 245197413, 14 . . . . . . . . . . . . . . . . . . . . . . . . 60,164 100.0 2.0 5.3 6.5 12.1 11.9 18.8 22.7 11.6 9.2 44,784 220 52,072 2281973 . . . . . . . . . . . . . . . . . . . . . . . . . . . . 59,236 100.0 2.2 5.3 6.5 11.5 11.1 17.3 23.7 12.2 10.2 46,359 217 53,258 225197215 . . . . . . . . . . . . . . . . . . . . . . . . . . .
BLACK ALONE OR INCOMBINATION
58,005 100.0 2.5 5.9 6.2 11.5 11.3 18.5 23.4 11.5 9.3 45,733 217 52,572 235
2007 . . . . . . . . . . . . . . . . . . . . . . . . . . . . 14,976 100.0 6.2 8.8 9.0 14.1 12.7 14.6 16.2 8.3 10.0 34,091 465 46,831 5122006 . . . . . . . . . . . . . . . . . . . . . . . . . . . . 14,709 100.0 6.5 8.7 8.6 15.0 13.4 14.7 15.4 7.9 9.7 33,044 245 46,784 5742005 . . . . . . . . . . . . . . . . . . . . . . . . . . . . 14,399 100.0 6.4 9.6 8.7 15.7 12.5 14.5 15.8 7.7 9.1 32,876 313 45,380 49420041. . . . . . . . . . . . . . . . . . . . . . . . . . . . 14,151 100.0 7.1 9.0 8.5 14.9 13.3 15.5 15.1 8.2 8.5 33,189 304 44,741 4752003 . . . . . . . . . . . . . . . . . . . . . . . . . . . . 13,969 100.0 6.4 9.0 9.1 15.0 13.1 14.5 15.6 8.2 9.2 33,470 421 45,451 4812002 . . . . . . . . . . . . . . . . . . . . . . . . . . . .
See footnotes at end of table.
13,778 100.0 6.2 9.2 8.8 14.9 13.3 15.2 14.8 8.5 9.1 33,628 443 46,486 542

34
Inco
me, Po
verty, an
d H
ealth In
suran
ce Coverag
e in th
e Un
ited States: 2
00
7U
.S. Cen
sus Bu
reau
Table A-1.Households by Total Money Income, Race, and Hispanic Origin of Householder: 1967 to 2007—Con.(Income in 2007 CPI-U-RS adjusted dollars. Households as of March of the following year. For information on confidentiality protection, sampling error, nonsampling error, and definitions, seewww.census.gov/apsd/techdoc/cps/cpsmar08.pdf)
Race and Hispanic originof householder and year
Number(thousands)
Percent distribution Median income(dollars)
Mean income(dollars)
TotalUnder
$5,000
$5,000to
$9,999
$10,000to
$14,999
$15,000to
$24,999
$25,000to
$34,999
$35,000to
$49,999
$50,000to
$74,999
$75,000to
$99,999$100,000and over Value
Standarderror Value
Standarderror
BLACK ALONE20
2007 . . . . . . . . . . . . . . . . . . . . . . . . . . . . 14,551 100.0 6.2 8.9 8.9 14.2 12.8 14.5 16.2 8.3 9.8 33,916 475 46,631 5202006 . . . . . . . . . . . . . . . . . . . . . . . . . . . . 14,354 100.0 6.6 8.8 8.6 15.1 13.4 14.7 15.3 7.9 9.5 32,876 248 46,407 5742005 . . . . . . . . . . . . . . . . . . . . . . . . . . . . 14,002 100.0 6.5 9.7 8.6 15.7 12.5 14.7 15.7 7.6 9.0 32,774 320 45,090 49020041. . . . . . . . . . . . . . . . . . . . . . . . . . . . 13,809 100.0 7.2 9.0 8.6 15.0 13.4 15.4 15.0 8.1 8.5 33,035 344 44,603 4832003 . . . . . . . . . . . . . . . . . . . . . . . . . . . . 13,629 100.0 6.4 9.1 9.0 15.1 13.0 14.6 15.5 8.1 9.1 33,421 435 45,242 4852002 . . . . . . . . . . . . . . . . . . . . . . . . . . . . 13,465 100.0 6.2 9.2 8.9 14.9 13.4 15.1 14.8 8.5 9.0 33,454 451 46,114 532
BLACK19
2001 . . . . . . . . . . . . . . . . . . . . . . . . . . . . 13,315 100.0 5.9 8.8 8.3 14.8 13.0 15.5 16.0 8.8 9.0 34,514 406 45,965 48520002. . . . . . . . . . . . . . . . . . . . . . . . . . . . 13,174 100.0 5.2 8.7 7.8 14.6 13.0 15.9 16.9 8.4 9.5 35,720 473 47,172 47819993. . . . . . . . . . . . . . . . . . . . . . . . . . . . 12,838 100.0 5.0 9.6 8.5 14.9 12.6 14.4 15.9 8.5 10.6 34,731 647 47,861 6871998 . . . . . . . . . . . . . . . . . . . . . . . . . . . . 12,579 100.0 6.0 10.8 8.1 15.7 13.2 14.1 15.3 8.0 8.7 32,204 504 43,368 5791997 . . . . . . . . . . . . . . . . . . . . . . . . . . . . 12,474 100.0 5.6 10.7 9.0 15.3 13.2 14.8 16.2 7.9 7.3 32,266 555 42,459 6091996 . . . . . . . . . . . . . . . . . . . . . . . . . . . . 12,109 100.0 5.9 10.9 9.7 15.9 13.1 14.2 15.4 7.7 7.2 30,900 608 42,714 83419954. . . . . . . . . . . . . . . . . . . . . . . . . . . . 11,577 100.0 5.9 11.2 10.0 15.7 13.0 15.2 15.2 7.3 6.4 30,251 516 41,068 70219945. . . . . . . . . . . . . . . . . . . . . . . . . . . . 11,655 100.0 6.1 13.0 9.5 16.5 12.6 13.4 14.2 7.6 6.9 29,090 541 40,479 58119936. . . . . . . . . . . . . . . . . . . . . . . . . . . . 11,281 100.0 7.0 12.6 11.5 15.5 12.8 14.8 13.3 6.6 5.9 27,600 545 38,474 63919927. . . . . . . . . . . . . . . . . . . . . . . . . . . . 11,269 100.0 6.9 14.3 10.3 16.0 12.4 14.0 14.1 6.8 5.3 27,156 555 36,850 5001991 . . . . . . . . . . . . . . . . . . . . . . . . . . . . 11,083 100.0 6.8 13.8 11.0 14.9 12.1 14.5 15.2 6.5 5.2 27,922 586 37,180 4851990 . . . . . . . . . . . . . . . . . . . . . . . . . . . . 10,671 100.0 6.5 13.7 9.9 15.5 12.4 14.2 15.1 6.6 6.1 28,721 655 38,161 5151989 . . . . . . . . . . . . . . . . . . . . . . . . . . . . 10,486 100.0 6.2 13.4 9.8 15.3 12.7 14.5 14.9 7.2 6.0 29,196 594 38,741 5261988 . . . . . . . . . . . . . . . . . . . . . . . . . . . . 10,561 100.0 5.5 14.5 10.9 15.8 12.6 13.9 13.9 7.2 5.9 27,632 576 37,855 55219878. . . . . . . . . . . . . . . . . . . . . . . . . . . . 10,192 100.0 6.2 14.3 10.9 15.9 12.9 14.2 13.8 6.5 5.2 27,363 524 36,947 5081986 . . . . . . . . . . . . . . . . . . . . . . . . . . . . 9,922 100.0 7.0 14.1 9.7 16.3 12.7 14.2 14.8 6.2 4.9 27,219 534 36,518 49619859. . . . . . . . . . . . . . . . . . . . . . . . . . . . 9,797 100.0 5.9 14.0 10.8 16.3 14.6 13.7 14.1 6.6 4.0 27,232 529 35,531 4611984 . . . . . . . . . . . . . . . . . . . . . . . . . . . . 9,480 100.0 5.8 14.4 11.3 18.4 13.0 14.2 12.7 6.2 4.0 25,605 492 34,149 420198310 . . . . . . . . . . . . . . . . . . . . . . . . . . . 9,236 100.0 6.6 15.0 11.6 17.5 13.4 13.7 13.3 6.0 2.9 24,591 461 32,708 4041982 . . . . . . . . . . . . . . . . . . . . . . . . . . . . 8,916 100.0 6.3 14.6 12.0 18.0 12.4 15.0 13.9 5.2 2.4 24,690 396 32,486 4061981 . . . . . . . . . . . . . . . . . . . . . . . . . . . . 8,961 100.0 5.8 14.8 11.9 18.1 13.3 14.1 13.5 5.5 2.9 24,738 416 32,498 3941980 . . . . . . . . . . . . . . . . . . . . . . . . . . . . 8,847 100.0 5.5 14.4 11.6 18.2 13.1 14.6 14.1 5.6 2.9 25,788 486 33,469 412197911 . . . . . . . . . . . . . . . . . . . . . . . . . . . 8,586 100.0 4.9 13.4 11.5 17.6 14.1 13.9 15.2 6.1 3.1 26,971 492 34,608 4261978 . . . . . . . . . . . . . . . . . . . . . . . . . . . . 8,066 100.0 4.1 13.6 12.4 16.9 12.8 15.9 14.5 6.5 3.3 27,449 580 35,079 4581977 . . . . . . . . . . . . . . . . . . . . . . . . . . . . 7,977 100.0 4.1 13.5 11.1 19.9 14.4 15.1 13.7 5.2 2.9 26,249 352 33,632 299197612 . . . . . . . . . . . . . . . . . . . . . . . . . . . 7,776 100.0 4.3 12.9 12.5 18.9 13.5 15.9 14.4 5.2 2.5 26,182 325 33,452 298197513 . . . . . . . . . . . . . . . . . . . . . . . . . . . 7,489 100.0 4.7 13.5 13.0 17.6 13.5 16.1 14.7 4.7 2.1 25,958 382 32,402 287197413, 14 . . . . . . . . . . . . . . . . . . . . . . . . 7,263 100.0 4.6 13.1 11.4 18.6 15.5 15.8 13.5 5.5 2.0 26,408 319 32,843 2921973 . . . . . . . . . . . . . . . . . . . . . . . . . . . . 7,040 100.0 5.0 11.7 11.8 17.7 15.3 15.3 15.4 4.8 2.9 27,050 421 33,591 334197215 . . . . . . . . . . . . . . . . . . . . . . . . . . . 6,809 100.0 5.5 12.6 12.2 18.3 14.4 15.6 14.1 5.3 2.1 26,319 394 33,247 355197116 . . . . . . . . . . . . . . . . . . . . . . . . . . . 6,578 100.0 6.3 12.9 11.8 18.4 15.2 15.7 13.3 4.4 1.9 25,465 379 31,555 3241970 . . . . . . . . . . . . . . . . . . . . . . . . . . . . 6,180 100.0 6.7 12.8 10.5 18.0 15.5 16.2 13.5 4.7 2.0 26,385 362 32,218 3481969 . . . . . . . . . . . . . . . . . . . . . . . . . . . . 6,053 100.0 6.3 12.7 9.8 19.1 16.0 17.3 12.7 4.3 1.7 26,460 390 31,500 3351968 . . . . . . . . . . . . . . . . . . . . . . . . . . . . 5,870 100.0 6.5 12.9 10.8 20.5 15.6 16.1 12.5 3.5 1.5 24,830 360 30,241 319196717 . . . . . . . . . . . . . . . . . . . . . . . . . . . 5,728 100.0 7.4 13.5 12.5 19.7 16.6 14.9 10.8 2.7 1.8 23,475 391 28,208 315
See footnotes at end of table.
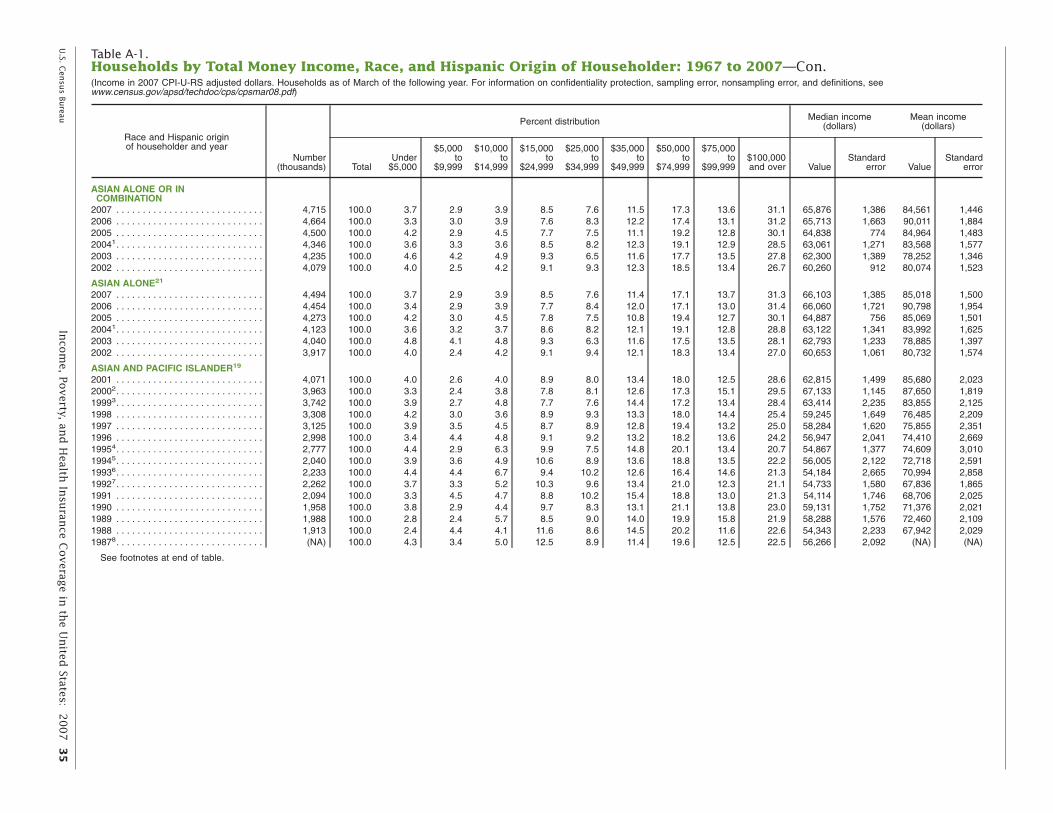
U.S. C
ensu
s Bureau
Inco
me, Po
verty, an
d H
ealth In
suran
ce Coverag
e in th
e Un
ited States: 2
00
7 3
5
Table A-1.Households by Total Money Income, Race, and Hispanic Origin of Householder: 1967 to 2007—Con.(Income in 2007 CPI-U-RS adjusted dollars. Households as of March of the following year. For information on confidentiality protection, sampling error, nonsampling error, and definitions, seewww.census.gov/apsd/techdoc/cps/cpsmar08.pdf)
Race and Hispanic originof householder and year
Number(thousands)
Percent distribution Median income(dollars)
Mean income(dollars)
TotalUnder
$5,000
$5,000to
$9,999
$10,000to
$14,999
$15,000to
$24,999
$25,000to
$34,999
$35,000to
$49,999
$50,000to
$74,999
$75,000to
$99,999$100,000and over Value
Standarderror Value
Standarderror
ASIAN ALONE OR INCOMBINATION
2007 . . . . . . . . . . . . . . . . . . . . . . . . . . . . 4,715 100.0 3.7 2.9 3.9 8.5 7.6 11.5 17.3 13.6 31.1 65,876 1,386 84,561 1,4462006 . . . . . . . . . . . . . . . . . . . . . . . . . . . . 4,664 100.0 3.3 3.0 3.9 7.6 8.3 12.2 17.4 13.1 31.2 65,713 1,663 90,011 1,8842005 . . . . . . . . . . . . . . . . . . . . . . . . . . . . 4,500 100.0 4.2 2.9 4.5 7.7 7.5 11.1 19.2 12.8 30.1 64,838 774 84,964 1,48320041. . . . . . . . . . . . . . . . . . . . . . . . . . . . 4,346 100.0 3.6 3.3 3.6 8.5 8.2 12.3 19.1 12.9 28.5 63,061 1,271 83,568 1,5772003 . . . . . . . . . . . . . . . . . . . . . . . . . . . . 4,235 100.0 4.6 4.2 4.9 9.3 6.5 11.6 17.7 13.5 27.8 62,300 1,389 78,252 1,3462002 . . . . . . . . . . . . . . . . . . . . . . . . . . . .
ASIAN ALONE21
4,079 100.0 4.0 2.5 4.2 9.1 9.3 12.3 18.5 13.4 26.7 60,260 912 80,074 1,523
2007 . . . . . . . . . . . . . . . . . . . . . . . . . . . . 4,494 100.0 3.7 2.9 3.9 8.5 7.6 11.4 17.1 13.7 31.3 66,103 1,385 85,018 1,5002006 . . . . . . . . . . . . . . . . . . . . . . . . . . . . 4,454 100.0 3.4 2.9 3.9 7.7 8.4 12.0 17.1 13.0 31.4 66,060 1,721 90,798 1,9542005 . . . . . . . . . . . . . . . . . . . . . . . . . . . . 4,273 100.0 4.2 3.0 4.5 7.8 7.5 10.8 19.4 12.7 30.1 64,887 756 85,069 1,50120041. . . . . . . . . . . . . . . . . . . . . . . . . . . . 4,123 100.0 3.6 3.2 3.7 8.6 8.2 12.1 19.1 12.8 28.8 63,122 1,341 83,992 1,6252003 . . . . . . . . . . . . . . . . . . . . . . . . . . . . 4,040 100.0 4.8 4.1 4.8 9.3 6.3 11.6 17.5 13.5 28.1 62,793 1,233 78,885 1,3972002 . . . . . . . . . . . . . . . . . . . . . . . . . . . .
ASIAN AND PACIFIC ISLANDER19
3,917 100.0 4.0 2.4 4.2 9.1 9.4 12.1 18.3 13.4 27.0 60,653 1,061 80,732 1,574
2001 . . . . . . . . . . . . . . . . . . . . . . . . . . . . 4,071 100.0 4.0 2.6 4.0 8.9 8.0 13.4 18.0 12.5 28.6 62,815 1,499 85,680 2,02320002. . . . . . . . . . . . . . . . . . . . . . . . . . . . 3,963 100.0 3.3 2.4 3.8 7.8 8.1 12.6 17.3 15.1 29.5 67,133 1,145 87,650 1,81919993. . . . . . . . . . . . . . . . . . . . . . . . . . . . 3,742 100.0 3.9 2.7 4.8 7.7 7.6 14.4 17.2 13.4 28.4 63,414 2,235 83,855 2,1251998 . . . . . . . . . . . . . . . . . . . . . . . . . . . . 3,308 100.0 4.2 3.0 3.6 8.9 9.3 13.3 18.0 14.4 25.4 59,245 1,649 76,485 2,2091997 . . . . . . . . . . . . . . . . . . . . . . . . . . . . 3,125 100.0 3.9 3.5 4.5 8.7 8.9 12.8 19.4 13.2 25.0 58,284 1,620 75,855 2,3511996 . . . . . . . . . . . . . . . . . . . . . . . . . . . . 2,998 100.0 3.4 4.4 4.8 9.1 9.2 13.2 18.2 13.6 24.2 56,947 2,041 74,410 2,66919954. . . . . . . . . . . . . . . . . . . . . . . . . . . . 2,777 100.0 4.4 2.9 6.3 9.9 7.5 14.8 20.1 13.4 20.7 54,867 1,377 74,609 3,01019945. . . . . . . . . . . . . . . . . . . . . . . . . . . . 2,040 100.0 3.9 3.6 4.9 10.6 8.9 13.6 18.8 13.5 22.2 56,005 2,122 72,718 2,59119936. . . . . . . . . . . . . . . . . . . . . . . . . . . . 2,233 100.0 4.4 4.4 6.7 9.4 10.2 12.6 16.4 14.6 21.3 54,184 2,665 70,994 2,85819927. . . . . . . . . . . . . . . . . . . . . . . . . . . . 2,262 100.0 3.7 3.3 5.2 10.3 9.6 13.4 21.0 12.3 21.1 54,733 1,580 67,836 1,8651991 . . . . . . . . . . . . . . . . . . . . . . . . . . . . 2,094 100.0 3.3 4.5 4.7 8.8 10.2 15.4 18.8 13.0 21.3 54,114 1,746 68,706 2,0251990 . . . . . . . . . . . . . . . . . . . . . . . . . . . . 1,958 100.0 3.8 2.9 4.4 9.7 8.3 13.1 21.1 13.8 23.0 59,131 1,752 71,376 2,0211989 . . . . . . . . . . . . . . . . . . . . . . . . . . . . 1,988 100.0 2.8 2.4 5.7 8.5 9.0 14.0 19.9 15.8 21.9 58,288 1,576 72,460 2,1091988 . . . . . . . . . . . . . . . . . . . . . . . . . . . . 1,913 100.0 2.4 4.4 4.1 11.6 8.6 14.5 20.2 11.6 22.6 54,343 2,233 67,942 2,02919878. . . . . . . . . . . . . . . . . . . . . . . . . . . .
See footnotes at end of table.
(NA) 100.0 4.3 3.4 5.0 12.5 8.9 11.4 19.6 12.5 22.5 56,266 2,092 (NA) (NA)

36
Inco
me, Po
verty, an
d H
ealth In
suran
ce Coverag
e in th
e Un
ited States: 2
00
7U
.S. Cen
sus Bu
reau
Table A-1.Households by Total Money Income, Race, and Hispanic Origin of Householder: 1967 to 2007—Con.(Income in 2007 CPI-U-RS adjusted dollars. Households as of March of the following year. For information on confidentiality protection, sampling error, nonsampling error, and definitions, seewww.census.gov/apsd/techdoc/cps/cpsmar08.pdf)
Median incomePercent distribution (dollars)Race and Hispanic originof householder and year $5,000 $10,000 $15,000 $25,000 $35,000 $50,000 $75,000
Number Under to to to to to to to $100,000 Standard(thousands) Total $5,000 $9,999 $14,999 $24,999 $34,999 $49,999 $74,999 $99,999 and over Value error
HISPANIC (ANY RACE)22
Mean income(dollars)
StandardValue error
2007 . . . . . . . . . . . . . . . . . . . . . . . . . . . . 13,339 100.0 3.5 5.4 7.1 14.8 14.3 16.6 18.3 9.7 10.4 38,679 520 50,828 5352006 . . . . . . . . . . . . . . . . . . . . . . . . . . . . 12,973 100.0 3.5 5.4 7.1 15.3 13.7 17.4 17.3 9.1 11.1 38,853 519 52,010 5962005 . . . . . . . . . . . . . . . . . . . . . . . . . . . . 12,519 100.0 3.8 5.5 7.3 15.4 14.5 17.1 17.5 8.9 10.0 38,200 379 50,065 50320041. . . . . . . . . . . . . . . . . . . . . . . . . . . . 12,178 100.0 4.1 5.5 6.8 15.7 14.8 16.8 17.4 8.7 10.1 37,619 527 50,359 6162003 . . . . . . . . . . . . . . . . . . . . . . . . . . . . 11,693 100.0 4.2 5.1 7.2 15.9 15.0 16.9 16.6 8.9 10.2 37,200 517 50,131 5552002 . . . . . . . . . . . . . . . . . . . . . . . . . . . . 11,339 100.0 3.9 5.4 6.8 15.2 15.1 16.5 17.6 9.3 10.2 38,152 556 51,734 6922001 . . . . . . . . . . . . . . . . . . . . . . . . . . . . 10,499 100.0 3.6 5.1 6.8 15.7 12.8 18.3 17.4 10.1 10.2 39,310 499 51,979 65720002. . . . . . . . . . . . . . . . . . . . . . . . . . . . 10,034 100.0 3.1 5.4 6.6 15.1 13.6 17.5 18.8 10.2 9.8 39,935 576 52,951 76219993. . . . . . . . . . . . . . . . . . . . . . . . . . . . 9,579 100.0 3.2 5.7 7.4 15.7 14.1 17.3 17.1 9.7 9.8 38,260 556 50,261 8921998 . . . . . . . . . . . . . . . . . . . . . . . . . . . . 9,060 100.0 4.1 7.2 7.6 15.6 14.3 16.8 17.0 8.3 9.0 35,989 694 48,629 1,0341997 . . . . . . . . . . . . . . . . . . . . . . . . . . . . 8,590 100.0 3.9 8.5 8.3 15.9 14.7 15.9 17.1 7.7 8.0 34,299 612 46,220 9331996 . . . . . . . . . . . . . . . . . . . . . . . . . . . . 8,225 100.0 3.7 8.5 8.5 17.7 14.9 15.3 16.3 7.9 7.3 32,774 636 44,747 1,03619954. . . . . . . . . . . . . . . . . . . . . . . . . . . . 7,939 100.0 4.3 8.9 10.1 17.4 14.9 16.0 14.7 7.4 6.2 30,882 673 42,150 94619945. . . . . . . . . . . . . . . . . . . . . . . . . . . . 7,735 100.0 3.9 9.1 10.0 16.9 14.2 15.8 15.4 7.5 7.2 32,402 602 43,692 1,09019936. . . . . . . . . . . . . . . . . . . . . . . . . . . . 7,362 100.0 3.6 8.6 10.3 16.7 14.4 17.5 14.8 7.9 6.3 32,338 650 42,801 90019927. . . . . . . . . . . . . . . . . . . . . . . . . . . . 7,153 100.0 3.8 8.4 9.7 17.1 14.2 16.8 16.1 7.8 6.1 32,719 676 41,732 6561991 . . . . . . . . . . . . . . . . . . . . . . . . . . . . 6,379 100.0 3.7 8.1 9.7 16.4 13.9 16.7 17.1 7.5 6.9 33,688 701 42,865 6861990 . . . . . . . . . . . . . . . . . . . . . . . . . . . . 6,220 100.0 3.5 8.3 8.7 16.9 13.5 17.4 17.8 7.1 6.9 34,341 704 43,018 7091989 . . . . . . . . . . . . . . . . . . . . . . . . . . . . 5,933 100.0 4.2 7.8 7.9 15.3 14.6 16.5 17.3 8.8 7.5 35,392 686 45,194 7771988 . . . . . . . . . . . . . . . . . . . . . . . . . . . . 5,910 100.0 3.9 9.0 8.4 15.7 14.2 16.6 17.5 7.9 6.8 34,288 869 43,777 92819878. . . . . . . . . . . . . . . . . . . . . . . . . . . . 5,642 100.0 4.1 9.0 9.0 16.6 13.7 16.1 16.9 8.0 6.6 33,760 733 43,276 8011986 . . . . . . . . . . . . . . . . . . . . . . . . . . . . 5,418 100.0 4.2 8.5 9.0 16.6 14.1 16.6 16.7 7.8 6.4 33,125 863 41,827 68819859. . . . . . . . . . . . . . . . . . . . . . . . . . . . 5,213 100.0 3.7 8.7 10.5 17.3 13.7 16.8 16.6 7.1 5.5 32,095 750 40,103 6521984 . . . . . . . . . . . . . . . . . . . . . . . . . . . . 4,883 100.0 4.1 9.0 9.6 16.9 14.1 16.9 16.9 7.4 5.1 32,298 810 40,161 783198310 . . . . . . . . . . . . . . . . . . . . . . . . . . . 4,326 100.0 4.2 9.1 11.0 16.3 15.3 17.7 15.5 6.5 4.4 31,471 797 38,323 7361982 . . . . . . . . . . . . . . . . . . . . . . . . . . . . 4,085 100.0 4.1 8.0 11.5 17.7 14.0 17.7 15.9 7.2 3.9 31,312 827 38,644 7841981 . . . . . . . . . . . . . . . . . . . . . . . . . . . . 3,980 100.0 3.4 7.3 9.5 17.4 14.3 18.5 17.3 7.8 4.4 33,469 917 40,191 7681980 . . . . . . . . . . . . . . . . . . . . . . . . . . . . 3,906 100.0 3.7 8.1 9.1 17.8 15.1 17.4 17.4 6.9 4.5 32,704 886 39,947 795197911 . . . . . . . . . . . . . . . . . . . . . . . . . . . 3,684 100.0 2.9 7.1 8.4 15.9 16.3 18.0 18.7 7.4 5.3 34,714 1,001 42,002 8441978 . . . . . . . . . . . . . . . . . . . . . . . . . . . . 3,291 100.0 3.0 6.6 9.2 16.7 15.4 19.2 18.9 6.8 4.2 34,425 834 40,664 8231977 . . . . . . . . . . . . . . . . . . . . . . . . . . . . 3,304 100.0 3.0 7.0 9.2 18.0 16.6 18.6 17.7 6.1 3.7 33,183 583 39,161 605197612 . . . . . . . . . . . . . . . . . . . . . . . . . . . 3,081 100.0 2.9 8.8 10.4 17.6 16.3 17.7 17.5 6.0 2.9 31,706 676 37,468 610197513 . . . . . . . . . . . . . . . . . . . . . . . . . . . 2,948 100.0 3.2 8.5 9.8 18.9 15.4 19.3 17.2 5.1 2.6 31,063 687 36,876 655197413, 14 . . . . . . . . . . . . . . . . . . . . . . . . 2,897 100.0 2.4 6.7 8.8 19.3 14.8 20.7 17.8 6.1 3.4 33,772 739 39,122 6371973 . . . . . . . . . . . . . . . . . . . . . . . . . . . . 2,722 100.0 3.0 5.8 8.4 16.8 18.3 18.6 19.9 6.1 3.1 33,971 772 39,468 642197215 . . . . . . . . . . . . . . . . . . . . . . . . . . . 2,655 100.0 2.6 5.9 9.4 18.2 16.5 21.8 17.0 5.5 3.1 34,027 665
(NA) Not available.1 Data have been revised to reflect a correction to the weights in the 2005 ASEC.2 Implementation of a 28,000 household sample expansion.3 Implementation of Census 2000-based population controls.4 Full implementation of 1990 census-based sample design and metropolitan definitions, 7,000 household sample reduction, and revised editing of responses on race.5 Introduction of 1990 census sample design.6 Data collection method changed from paper and pencil to computer-assisted interviewing. In addition, the 1994 ASEC was revised to allow for the coding of different income amounts on selected questionnaire items. Lim
decreased in the following categories: earnings limits increased to $999,999; social security limits increased to $49,999; supplemental security income and public assistance limits increased to $24,999; veterans’ benefits limitschild support and alimony limits decreased to $49,999.
7 Implementation of 1990 census population controls.8 Implementation of a new CPS ASEC processing system.9 Recording of amounts for earnings from longest job increased to $299,999. Full implementation of 1980 census-based sample design.10 Implementation of Hispanic population weighting controls and introduction of 1980 census-based sample design.11 Implementation of 1980 census population controls. Questionnaire expanded to show 27 possible values from 51 possible sources of income.12 First year medians were derived using both Pareto and linear interpolation. Before this year, all medians were derived using linear interpolation.13 Some of these estimates were derived using Pareto interpolation and may differ from published data, which were derived using linear interpolation.14 Implementation of a new CPS ASEC processing system. Questionnaire expanded to ask 11 income questions.
39,111 665
its either increased orincreased to $99,999;

U.S. C
ensu
s Bureau
Inco
me, Po
verty, an
d H
ealth In
suran
ce Coverag
e in th
e Un
ited States: 2
00
7 3
7
15 Full implementation of 1970 census-based sample design.16 Introduction of 1970 census sample design and population controls.17 Implementation of new CPS ASEC processing system.18 Beginning with the 2003 CPS, respondents were allowed to choose one or more races. White alone refers to people who reported White and did not report any other race category. The use of this single-race population does not imply that it
is the preferred method of presenting or analyzing the data. The Census Bureau uses a variety of approaches. Information on people who reported more than one race, such as White and American Indian and Alaska Native or Asian and Black orAfrican American, is available from Census 2000 through American FactFinder. About 2.6 percent of people reported more than one race in Census 2000.
19 For the years 2001 and earlier, the CPS allowed respondents to report only one race group.20 Black alone refers to people who reported Black and did not report any other race category.21 Asian alone refers to people who reported Asian and did not report any other race category.22 Because Hispanics may be any race, data in this report for Hispanics overlap with data for racial groups. Being Hispanic was reported by 13.0 percent of White householders who reported only one race, 3.0 percent of Black householders who
reported only one race, and 1.9 percent of Asian householders who reported only one race. Data users should exercise caution when interpreting aggregate results for the Hispanic population and for race groups because these populations consist ofmany distinct groups that differ in socioeconomic characteristics, culture, and recency of immigration. Data were first collected for Hispanics in 1972.
Source: U.S. Census Bureau, Current Population Survey, 1968 through 2008 Annual Social and Economic Supplements.
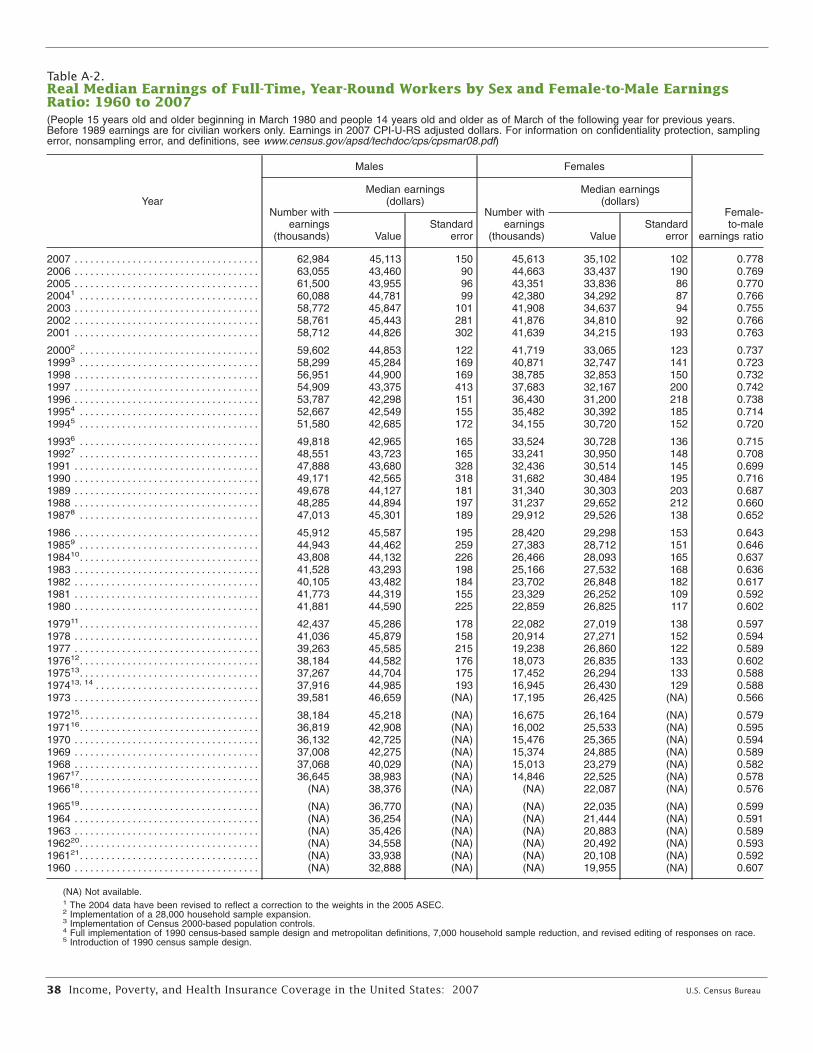
38 Income, Poverty, and Health Insurance Coverage in the United States: 2007 U.S. Census Bureau
Table A-2.Real Median Earnings of Full-Time, Year-Round Workers by Sex and Female-to-Male EarningsRatio: 1960 to 2007(People 15 years old and older beginning in March 1980 and people 14 years old and older as of March of the following year for previous years.Before 1989 earnings are for civilian workers only. Earnings in 2007 CPI-U-RS adjusted dollars. For information on confidentiality protection, samplingerror, nonsampling error, and definitions, see www.census.gov/apsd/techdoc/cps/cpsmar08.pdf)
Year
Males Females
Female-to-male
earnings ratio
Number withearnings
(thousands)
Median earnings(dollars)
Number withearnings
(thousands)
Median earnings(dollars)
ValueStandard
error ValueStandard
error
2007 . . . . . . . . . . . . . . . . . . . . . . . . . . . . . . . . . . . 62,984 45,113 150 45,613 35,102 102 0.7782006 . . . . . . . . . . . . . . . . . . . . . . . . . . . . . . . . . . . 63,055 43,460 90 44,663 33,437 190 0.7692005 . . . . . . . . . . . . . . . . . . . . . . . . . . . . . . . . . . . 61,500 43,955 96 43,351 33,836 86 0.77020041 . . . . . . . . . . . . . . . . . . . . . . . . . . . . . . . . . . 60,088 44,781 99 42,380 34,292 87 0.7662003 . . . . . . . . . . . . . . . . . . . . . . . . . . . . . . . . . . . 58,772 45,847 101 41,908 34,637 94 0.7552002 . . . . . . . . . . . . . . . . . . . . . . . . . . . . . . . . . . . 58,761 45,443 281 41,876 34,810 92 0.7662001 . . . . . . . . . . . . . . . . . . . . . . . . . . . . . . . . . . . 58,712 44,826 302 41,639 34,215 193 0.763
20002 . . . . . . . . . . . . . . . . . . . . . . . . . . . . . . . . . . 59,602 44,853 122 41,719 33,065 123 0.73719993 . . . . . . . . . . . . . . . . . . . . . . . . . . . . . . . . . . 58,299 45,284 169 40,871 32,747 141 0.7231998 . . . . . . . . . . . . . . . . . . . . . . . . . . . . . . . . . . . 56,951 44,900 169 38,785 32,853 150 0.7321997 . . . . . . . . . . . . . . . . . . . . . . . . . . . . . . . . . . . 54,909 43,375 413 37,683 32,167 200 0.7421996 . . . . . . . . . . . . . . . . . . . . . . . . . . . . . . . . . . . 53,787 42,298 151 36,430 31,200 218 0.73819954 . . . . . . . . . . . . . . . . . . . . . . . . . . . . . . . . . . 52,667 42,549 155 35,482 30,392 185 0.71419945 . . . . . . . . . . . . . . . . . . . . . . . . . . . . . . . . . . 51,580 42,685 172 34,155 30,720 152 0.720
19936 . . . . . . . . . . . . . . . . . . . . . . . . . . . . . . . . . . 49,818 42,965 165 33,524 30,728 136 0.71519927 . . . . . . . . . . . . . . . . . . . . . . . . . . . . . . . . . . 48,551 43,723 165 33,241 30,950 148 0.7081991 . . . . . . . . . . . . . . . . . . . . . . . . . . . . . . . . . . . 47,888 43,680 328 32,436 30,514 145 0.6991990 . . . . . . . . . . . . . . . . . . . . . . . . . . . . . . . . . . . 49,171 42,565 318 31,682 30,484 195 0.7161989 . . . . . . . . . . . . . . . . . . . . . . . . . . . . . . . . . . . 49,678 44,127 181 31,340 30,303 203 0.6871988 . . . . . . . . . . . . . . . . . . . . . . . . . . . . . . . . . . . 48,285 44,894 197 31,237 29,652 212 0.66019878 . . . . . . . . . . . . . . . . . . . . . . . . . . . . . . . . . . 47,013 45,301 189 29,912 29,526 138 0.652
1986 . . . . . . . . . . . . . . . . . . . . . . . . . . . . . . . . . . . 45,912 45,587 195 28,420 29,298 153 0.64319859 . . . . . . . . . . . . . . . . . . . . . . . . . . . . . . . . . . 44,943 44,462 259 27,383 28,712 151 0.646198410. . . . . . . . . . . . . . . . . . . . . . . . . . . . . . . . . . 43,808 44,132 226 26,466 28,093 165 0.6371983 . . . . . . . . . . . . . . . . . . . . . . . . . . . . . . . . . . . 41,528 43,293 198 25,166 27,532 168 0.6361982 . . . . . . . . . . . . . . . . . . . . . . . . . . . . . . . . . . . 40,105 43,482 184 23,702 26,848 182 0.6171981 . . . . . . . . . . . . . . . . . . . . . . . . . . . . . . . . . . . 41,773 44,319 155 23,329 26,252 109 0.5921980 . . . . . . . . . . . . . . . . . . . . . . . . . . . . . . . . . . . 41,881 44,590 225 22,859 26,825 117 0.602
197911. . . . . . . . . . . . . . . . . . . . . . . . . . . . . . . . . . 42,437 45,286 178 22,082 27,019 138 0.5971978 . . . . . . . . . . . . . . . . . . . . . . . . . . . . . . . . . . . 41,036 45,879 158 20,914 27,271 152 0.5941977 . . . . . . . . . . . . . . . . . . . . . . . . . . . . . . . . . . . 39,263 45,585 215 19,238 26,860 122 0.589197612. . . . . . . . . . . . . . . . . . . . . . . . . . . . . . . . . . 38,184 44,582 176 18,073 26,835 133 0.602197513. . . . . . . . . . . . . . . . . . . . . . . . . . . . . . . . . . 37,267 44,704 175 17,452 26,294 133 0.588197413, 14 . . . . . . . . . . . . . . . . . . . . . . . . . . . . . . . 37,916 44,985 193 16,945 26,430 129 0.5881973 . . . . . . . . . . . . . . . . . . . . . . . . . . . . . . . . . . . 39,581 46,659 (NA) 17,195 26,425 (NA) 0.566
197215. . . . . . . . . . . . . . . . . . . . . . . . . . . . . . . . . . 38,184 45,218 (NA) 16,675 26,164 (NA) 0.579197116. . . . . . . . . . . . . . . . . . . . . . . . . . . . . . . . . . 36,819 42,908 (NA) 16,002 25,533 (NA) 0.5951970 . . . . . . . . . . . . . . . . . . . . . . . . . . . . . . . . . . . 36,132 42,725 (NA) 15,476 25,365 (NA) 0.5941969 . . . . . . . . . . . . . . . . . . . . . . . . . . . . . . . . . . . 37,008 42,275 (NA) 15,374 24,885 (NA) 0.5891968 . . . . . . . . . . . . . . . . . . . . . . . . . . . . . . . . . . . 37,068 40,029 (NA) 15,013 23,279 (NA) 0.582196717. . . . . . . . . . . . . . . . . . . . . . . . . . . . . . . . . . 36,645 38,983 (NA) 14,846 22,525 (NA) 0.578196618. . . . . . . . . . . . . . . . . . . . . . . . . . . . . . . . . . (NA) 38,376 (NA) (NA) 22,087 (NA) 0.576
196519. . . . . . . . . . . . . . . . . . . . . . . . . . . . . . . . . . (NA) 36,770 (NA) (NA) 22,035 (NA) 0.5991964 . . . . . . . . . . . . . . . . . . . . . . . . . . . . . . . . . . . (NA) 36,254 (NA) (NA) 21,444 (NA) 0.5911963 . . . . . . . . . . . . . . . . . . . . . . . . . . . . . . . . . . . (NA) 35,426 (NA) (NA) 20,883 (NA) 0.589196220. . . . . . . . . . . . . . . . . . . . . . . . . . . . . . . . . . (NA) 34,558 (NA) (NA) 20,492 (NA) 0.593196121. . . . . . . . . . . . . . . . . . . . . . . . . . . . . . . . . . (NA) 33,938 (NA) (NA) 20,108 (NA) 0.5921960 . . . . . . . . . . . . . . . . . . . . . . . . . . . . . . . . . . . (NA) 32,888 (NA) (NA) 19,955 (NA) 0.607
(NA) Not available.1 The 2004 data have been revised to reflect a correction to the weights in the 2005 ASEC.2 Implementation of a 28,000 household sample expansion.3 Implementation of Census 2000-based population controls.4 Full implementation of 1990 census-based sample design and metropolitan definitions, 7,000 household sample reduction, and revised editing of responses on race.5 Introduction of 1990 census sample design.

U.S. Census Bureau Income, Poverty, and Health Insurance Coverage in the United States: 2007 39
6 Data collection method changed from paper and pencil to computer-assisted interviewing. In addition, the 1994 ASEC was revised to allow for the coding of differentincome amounts on selected questionnaire items. Limits either increased or decreased in the following categories: earnings limits increased to $999,999; social securitylimits increased to $49,999; supplemental security income and public assistance limits increased to $24,999; veterans’ benefits limits increased to $99,999; child supportand alimony limits decreased to $49,999.
7 Implementation of 1990 census population controls.8 Implementation of a new CPS ASEC processing system.9 Recording of amounts for earnings from longest job increased to $299,999. Full implementation of 1980 census-based sample design.10 Implementation of Hispanic population weighting controls and introduction of 1980 census-based sample design.11 Implementation of 1980 census population controls. Questionnaire expanded to allow the recording of up to 27 possible values from a list of 51 possible sources of
income.12 First year medians were derived using both Pareto and linear interpolation. Before this year, all medians were derived using linear interpolation.13 Some of these estimates were derived using Pareto interpolation and may differ from published data, which were derived using linear interpolation.14 Implementation of a new CPS ASEC processing system. Questionnaire expanded to ask 11 income questions.15 Full implementation of 1970 census-based sample design.16 Introduction of 1970 census sample design and population controls.17 Implementation of a new CPS ASEC processing system.18 Questionnaire expanded to ask eight income questions.19 Implementation of new procedures to impute missing data only.20 Full implementation of 1960 census-based sample design and population controls.21 Introduction of 1960 census-based sample design. Implementation of first hotdeck procedure to impute missing income entries.Source: U.S. Census Bureau, Current Population Survey, 1961 through 2008 Annual Social and Economic Supplements.
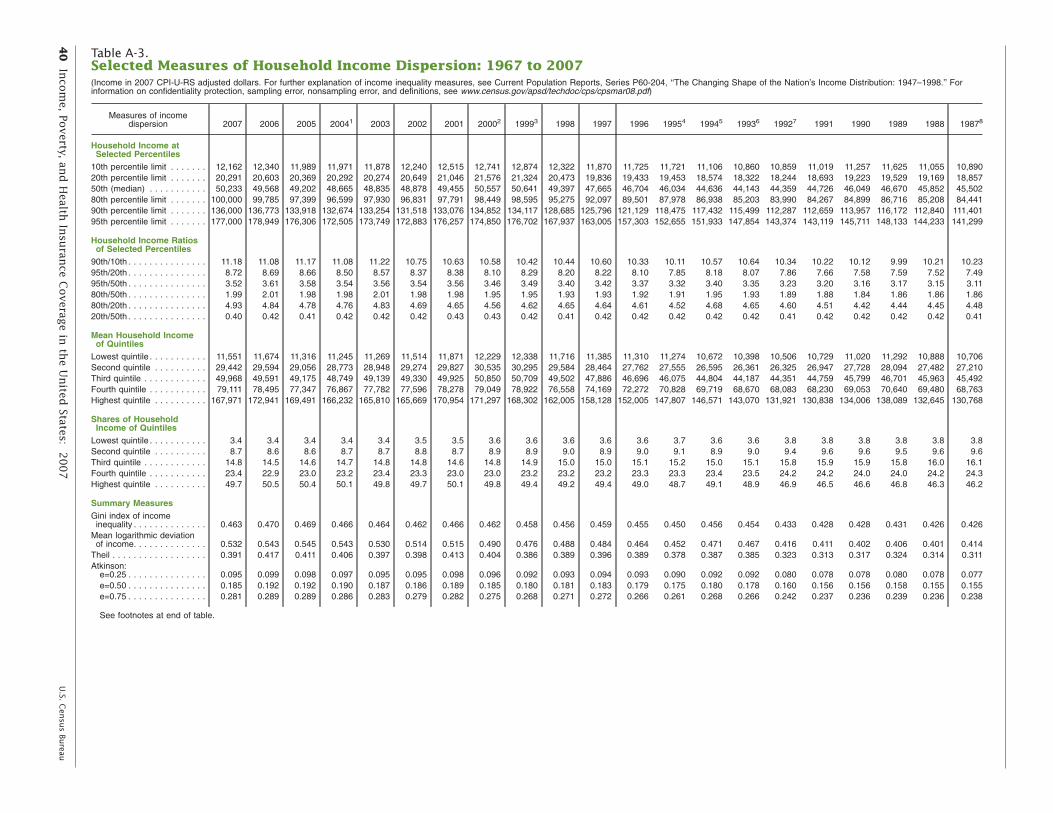
40
Inco
me, Po
verty, an
d H
ealth In
suran
ce Coverag
e in th
e Un
ited States: 2
00
7U
.S. Cen
sus Bu
reau
Table A-3.Selected Measures of Household Income Dispersion: 1967 to 2007(Income in 2007 CPI-U-RS adjusted dollars. For further explanation of income inequality measures, see Current Population Reports, Series P60-204, ‘‘The Changing Shape of the Nation’s Income Distribution: 1947–1998.’’ Forinformation on confidentiality protection, sampling error, nonsampling error, and definitions, see www.census.gov/apsd/techdoc/cps/cpsmar08.pdf)
Measures of incomedispersion 2007 2006 2005 20041 2003 2002 2001 20002 19993 1998 1997 1996 19954 19945 19936 19927 1991 1990 1989 1988 19878
Household Income atSelected Percentiles
10th percentile limit . . . . . . . 12,162 12,340 11,989 11,971 11,878 12,240 12,515 12,741 12,874 12,322 11,870 11,725 11,721 11,106 10,860 10,859 11,019 11,257 11,625 11,055 10,89020th percentile limit . . . . . . . 20,291 20,603 20,369 20,292 20,274 20,649 21,046 21,576 21,324 20,473 19,836 19,433 19,453 18,574 18,322 18,244 18,693 19,223 19,529 19,169 18,85750th (median) . . . . . . . . . . . 50,233 49,568 49,202 48,665 48,835 48,878 49,455 50,557 50,641 49,397 47,665 46,704 46,034 44,636 44,143 44,359 44,726 46,049 46,670 45,852 45,50280th percentile limit . . . . . . . 100,000 99,785 97,399 96,599 97,930 96,831 97,791 98,449 98,595 95,275 92,097 89,501 87,978 86,938 85,203 83,990 84,267 84,899 86,716 85,208 84,44190th percentile limit . . . . . . . 136,000 136,773 133,918 132,674 133,254 131,518 133,076 134,852 134,117 128,685 125,796 121,129 118,475 117,432 115,499 112,287 112,659 113,957 116,172 112,840 111,40195th percentile limit . . . . . . .
Household Income Ratiosof Selected Percentiles
177,000 178,949 176,306 172,505 173,749 172,883 176,257 174,850 176,702 167,937 163,005 157,303 152,655 151,933 147,854 143,374 143,119 145,711 148,133 144,233 141,299
90th/10th . . . . . . . . . . . . . . . 11.18 11.08 11.17 11.08 11.22 10.75 10.63 10.58 10.42 10.44 10.60 10.33 10.11 10.57 10.64 10.34 10.22 10.12 9.99 10.21 10.2395th/20th . . . . . . . . . . . . . . . 8.72 8.69 8.66 8.50 8.57 8.37 8.38 8.10 8.29 8.20 8.22 8.10 7.85 8.18 8.07 7.86 7.66 7.58 7.59 7.52 7.4995th/50th . . . . . . . . . . . . . . . 3.52 3.61 3.58 3.54 3.56 3.54 3.56 3.46 3.49 3.40 3.42 3.37 3.32 3.40 3.35 3.23 3.20 3.16 3.17 3.15 3.1180th/50th . . . . . . . . . . . . . . . 1.99 2.01 1.98 1.98 2.01 1.98 1.98 1.95 1.95 1.93 1.93 1.92 1.91 1.95 1.93 1.89 1.88 1.84 1.86 1.86 1.8680th/20th . . . . . . . . . . . . . . . 4.93 4.84 4.78 4.76 4.83 4.69 4.65 4.56 4.62 4.65 4.64 4.61 4.52 4.68 4.65 4.60 4.51 4.42 4.44 4.45 4.4820th/50th . . . . . . . . . . . . . . .
Mean Household Incomeof Quintiles
0.40 0.42 0.41 0.42 0.42 0.42 0.43 0.43 0.42 0.41 0.42 0.42 0.42 0.42 0.42 0.41 0.42 0.42 0.42 0.42 0.41
Lowest quintile . . . . . . . . . . . 11,551 11,674 11,316 11,245 11,269 11,514 11,871 12,229 12,338 11,716 11,385 11,310 11,274 10,672 10,398 10,506 10,729 11,020 11,292 10,888 10,706Second quintile . . . . . . . . . . 29,442 29,594 29,056 28,773 28,948 29,274 29,827 30,535 30,295 29,584 28,464 27,762 27,555 26,595 26,361 26,325 26,947 27,728 28,094 27,482 27,210Third quintile . . . . . . . . . . . . 49,968 49,591 49,175 48,749 49,139 49,330 49,925 50,850 50,709 49,502 47,886 46,696 46,075 44,804 44,187 44,351 44,759 45,799 46,701 45,963 45,492Fourth quintile . . . . . . . . . . . 79,111 78,495 77,347 76,867 77,782 77,596 78,278 79,049 78,922 76,558 74,169 72,272 70,828 69,719 68,670 68,083 68,230 69,053 70,640 69,480 68,763Highest quintile . . . . . . . . . .
Shares of HouseholdIncome of Quintiles
167,971 172,941 169,491 166,232 165,810 165,669 170,954 171,297 168,302 162,005 158,128 152,005 147,807 146,571 143,070 131,921 130,838 134,006 138,089 132,645 130,768
Lowest quintile . . . . . . . . . . . 3.4 3.4 3.4 3.4 3.4 3.5 3.5 3.6 3.6 3.6 3.6 3.6 3.7 3.6 3.6 3.8 3.8 3.8 3.8 3.8 3.8Second quintile . . . . . . . . . . 8.7 8.6 8.6 8.7 8.7 8.8 8.7 8.9 8.9 9.0 8.9 9.0 9.1 8.9 9.0 9.4 9.6 9.6 9.5 9.6 9.6Third quintile . . . . . . . . . . . . 14.8 14.5 14.6 14.7 14.8 14.8 14.6 14.8 14.9 15.0 15.0 15.1 15.2 15.0 15.1 15.8 15.9 15.9 15.8 16.0 16.1Fourth quintile . . . . . . . . . . . 23.4 22.9 23.0 23.2 23.4 23.3 23.0 23.0 23.2 23.2 23.2 23.3 23.3 23.4 23.5 24.2 24.2 24.0 24.0 24.2 24.3Highest quintile . . . . . . . . . .
Summary MeasuresGini index of income
49.7 50.5 50.4 50.1 49.8 49.7 50.1 49.8 49.4 49.2 49.4 49.0 48.7 49.1 48.9 46.9 46.5 46.6 46.8 46.3 46.2
inequality . . . . . . . . . . . . . .Mean logarithmic deviation
0.463 0.470 0.469 0.466 0.464 0.462 0.466 0.462 0.458 0.456 0.459 0.455 0.450 0.456 0.454 0.433 0.428 0.428 0.431 0.426 0.426
of income. . . . . . . . . . . . . . 0.532 0.543 0.545 0.543 0.530 0.514 0.515 0.490 0.476 0.488 0.484 0.464 0.452 0.471 0.467 0.416 0.411 0.402 0.406 0.401 0.414Theil . . . . . . . . . . . . . . . . . .Atkinson:
0.391 0.417 0.411 0.406 0.397 0.398 0.413 0.404 0.386 0.389 0.396 0.389 0.378 0.387 0.385 0.323 0.313 0.317 0.324 0.314 0.311
e=0.25 . . . . . . . . . . . . . . . 0.095 0.099 0.098 0.097 0.095 0.095 0.098 0.096 0.092 0.093 0.094 0.093 0.090 0.092 0.092 0.080 0.078 0.078 0.080 0.078 0.077e=0.50 . . . . . . . . . . . . . . . 0.185 0.192 0.192 0.190 0.187 0.186 0.189 0.185 0.180 0.181 0.183 0.179 0.175 0.180 0.178 0.160 0.156 0.156 0.158 0.155 0.155e=0.75 . . . . . . . . . . . . . . .
See footnotes at end of tabl
0.281
e.
0.289 0.289 0.286 0.283 0.279 0.282 0.275 0.268 0.271 0.272 0.266 0.261 0.268 0.266 0.242 0.237 0.236 0.239 0.236 0.238
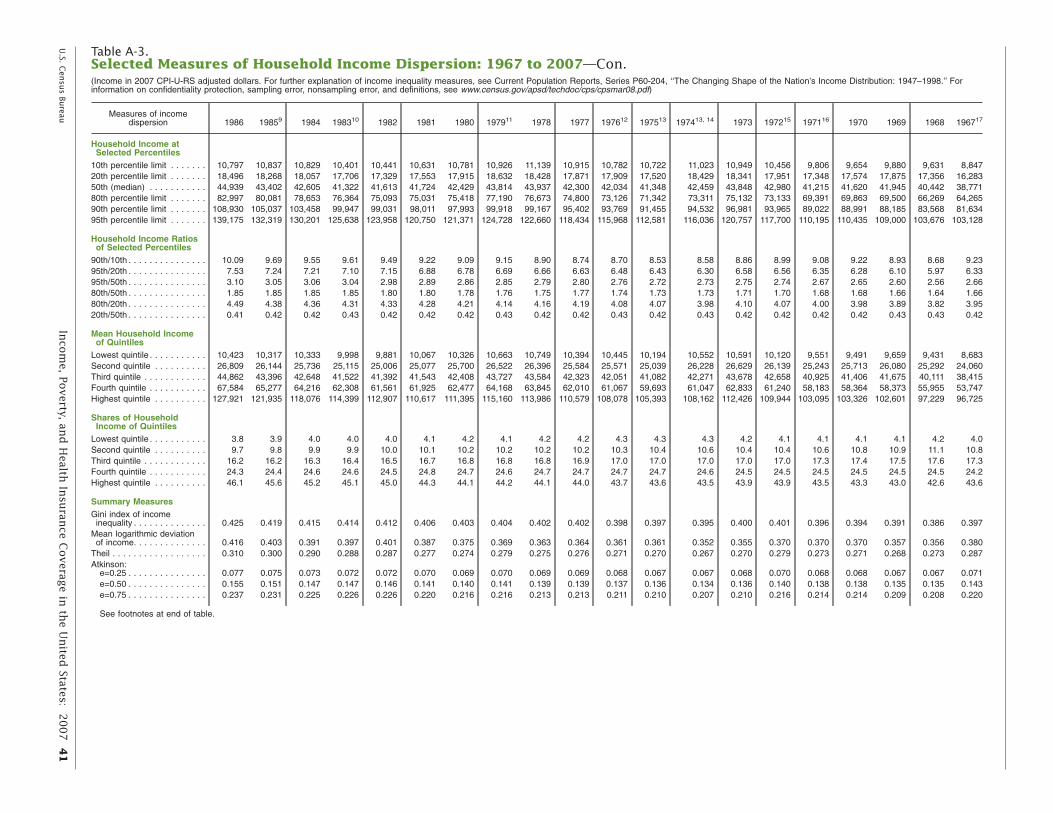
U.S. C
ensu
s Bureau
Inco
me, Po
verty, an
d H
ealth In
suran
ce Coverag
e in th
e Un
ited States: 2
00
7 4
1
Table A-3.Selected Measures of Household Income Dispersion: 1967 to 2007—Con.(Income in 2007 CPI-U-RS adjusted dollars. For further explanation of income inequality measures, see Current Population Reports, Series P60-204, ‘‘The Changing Shape of the Nation’s Income Distribution: 1947–1998.’’ Forinformation on confidentiality protection, sampling error, nonsampling error, and definitions, see www.census.gov/apsd/techdoc/cps/cpsmar08.pdf)
Measures of incomedispersion 1986 19859 1984 198310 1982 1981 1980 197911 1978 1977 197612 197513 197413, 14 1973 197215 197116 1970 1969 1968 196717
Household Income atSelected Percentiles
10th percentile limit . . . . . . . 10,797 10,837 10,829 10,401 10,441 10,631 10,781 10,926 11,139 10,915 10,782 10,722 11,023 10,949 10,456 9,806 9,654 9,880 9,631 8,84720th percentile limit . . . . . . . 18,496 18,268 18,057 17,706 17,329 17,553 17,915 18,632 18,428 17,871 17,909 17,520 18,429 18,341 17,951 17,348 17,574 17,875 17,356 16,28350th (median) . . . . . . . . . . . 44,939 43,402 42,605 41,322 41,613 41,724 42,429 43,814 43,937 42,300 42,034 41,348 42,459 43,848 42,980 41,215 41,620 41,945 40,442 38,77180th percentile limit . . . . . . . 82,997 80,081 78,653 76,364 75,093 75,031 75,418 77,190 76,673 74,800 73,126 71,342 73,311 75,132 73,133 69,391 69,863 69,500 66,269 64,26590th percentile limit . . . . . . . 108,930 105,037 103,458 99,947 99,031 98,011 97,993 99,918 99,167 95,402 93,769 91,455 94,532 96,981 93,965 89,022 88,991 88,185 83,568 81,63495th percentile limit . . . . . . .
Household Income Ratiosof Selected Percentiles
139,175 132,319 130,201 125,638 123,958 120,750 121,371 124,728 122,660 118,434 115,968 112,581 116,036 120,757 117,700 110,195 110,435 109,000 103,676 103,128
90th/10th . . . . . . . . . . . . . . . 10.09 9.69 9.55 9.61 9.49 9.22 9.09 9.15 8.90 8.74 8.70 8.53 8.58 8.86 8.99 9.08 9.22 8.93 8.68 9.2395th/20th . . . . . . . . . . . . . . . 7.53 7.24 7.21 7.10 7.15 6.88 6.78 6.69 6.66 6.63 6.48 6.43 6.30 6.58 6.56 6.35 6.28 6.10 5.97 6.3395th/50th . . . . . . . . . . . . . . . 3.10 3.05 3.06 3.04 2.98 2.89 2.86 2.85 2.79 2.80 2.76 2.72 2.73 2.75 2.74 2.67 2.65 2.60 2.56 2.6680th/50th . . . . . . . . . . . . . . . 1.85 1.85 1.85 1.85 1.80 1.80 1.78 1.76 1.75 1.77 1.74 1.73 1.73 1.71 1.70 1.68 1.68 1.66 1.64 1.6680th/20th . . . . . . . . . . . . . . . 4.49 4.38 4.36 4.31 4.33 4.28 4.21 4.14 4.16 4.19 4.08 4.07 3.98 4.10 4.07 4.00 3.98 3.89 3.82 3.9520th/50th . . . . . . . . . . . . . . .
Mean Household Incomeof Quintiles
0.41 0.42 0.42 0.43 0.42 0.42 0.42 0.43 0.42 0.42 0.43 0.42 0.43 0.42 0.42 0.42 0.42 0.43 0.43 0.42
Lowest quintile . . . . . . . . . . . 10,423 10,317 10,333 9,998 9,881 10,067 10,326 10,663 10,749 10,394 10,445 10,194 10,552 10,591 10,120 9,551 9,491 9,659 9,431 8,683Second quintile . . . . . . . . . . 26,809 26,144 25,736 25,115 25,006 25,077 25,700 26,522 26,396 25,584 25,571 25,039 26,228 26,629 26,139 25,243 25,713 26,080 25,292 24,060Third quintile . . . . . . . . . . . . 44,862 43,396 42,648 41,522 41,392 41,543 42,408 43,727 43,584 42,323 42,051 41,082 42,271 43,678 42,658 40,925 41,406 41,675 40,111 38,415Fourth quintile . . . . . . . . . . . 67,584 65,277 64,216 62,308 61,561 61,925 62,477 64,168 63,845 62,010 61,067 59,693 61,047 62,833 61,240 58,183 58,364 58,373 55,955 53,747Highest quintile . . . . . . . . . .
Shares of HouseholdIncome of Quintiles
127,921 121,935 118,076 114,399 112,907 110,617 111,395 115,160 113,986 110,579 108,078 105,393 108,162 112,426 109,944 103,095 103,326 102,601 97,229 96,725
Lowest quintile . . . . . . . . . . . 3.8 3.9 4.0 4.0 4.0 4.1 4.2 4.1 4.2 4.2 4.3 4.3 4.3 4.2 4.1 4.1 4.1 4.1 4.2 4.0Second quintile . . . . . . . . . . 9.7 9.8 9.9 9.9 10.0 10.1 10.2 10.2 10.2 10.2 10.3 10.4 10.6 10.4 10.4 10.6 10.8 10.9 11.1 10.8Third quintile . . . . . . . . . . . . 16.2 16.2 16.3 16.4 16.5 16.7 16.8 16.8 16.8 16.9 17.0 17.0 17.0 17.0 17.0 17.3 17.4 17.5 17.6 17.3Fourth quintile . . . . . . . . . . . 24.3 24.4 24.6 24.6 24.5 24.8 24.7 24.6 24.7 24.7 24.7 24.7 24.6 24.5 24.5 24.5 24.5 24.5 24.5 24.2Highest quintile . . . . . . . . . .
Summary MeasuresGini index of income
46.1 45.6 45.2 45.1 45.0 44.3 44.1 44.2 44.1 44.0 43.7 43.6 43.5 43.9 43.9 43.5 43.3 43.0 42.6 43.6
inequality . . . . . . . . . . . . . .Mean logarithmic deviation
0.425 0.419 0.415 0.414 0.412 0.406 0.403 0.404 0.402 0.402 0.398 0.397 0.395 0.400 0.401 0.396 0.394 0.391 0.386 0.397
of income. . . . . . . . . . . . . . 0.416 0.403 0.391 0.397 0.401 0.387 0.375 0.369 0.363 0.364 0.361 0.361 0.352 0.355 0.370 0.370 0.370 0.357 0.356 0.380Theil . . . . . . . . . . . . . . . . . .Atkinson:
0.310 0.300 0.290 0.288 0.287 0.277 0.274 0.279 0.275 0.276 0.271 0.270 0.267 0.270 0.279 0.273 0.271 0.268 0.273 0.287
e=0.25 . . . . . . . . . . . . . . . 0.077 0.075 0.073 0.072 0.072 0.070 0.069 0.070 0.069 0.069 0.068 0.067 0.067 0.068 0.070 0.068 0.068 0.067 0.067 0.071e=0.50 . . . . . . . . . . . . . . . 0.155 0.151 0.147 0.147 0.146 0.141 0.140 0.141 0.139 0.139 0.137 0.136 0.134 0.136 0.140 0.138 0.138 0.135 0.135 0.143e=0.75 . . . . . . . . . . . . . . .
See footnotes at end of tabl
0.237
e.
0.231 0.225 0.226 0.226 0.220 0.216 0.216 0.213 0.213 0.211 0.210 0.207 0.210 0.216 0.214 0.214 0.209 0.208 0.220
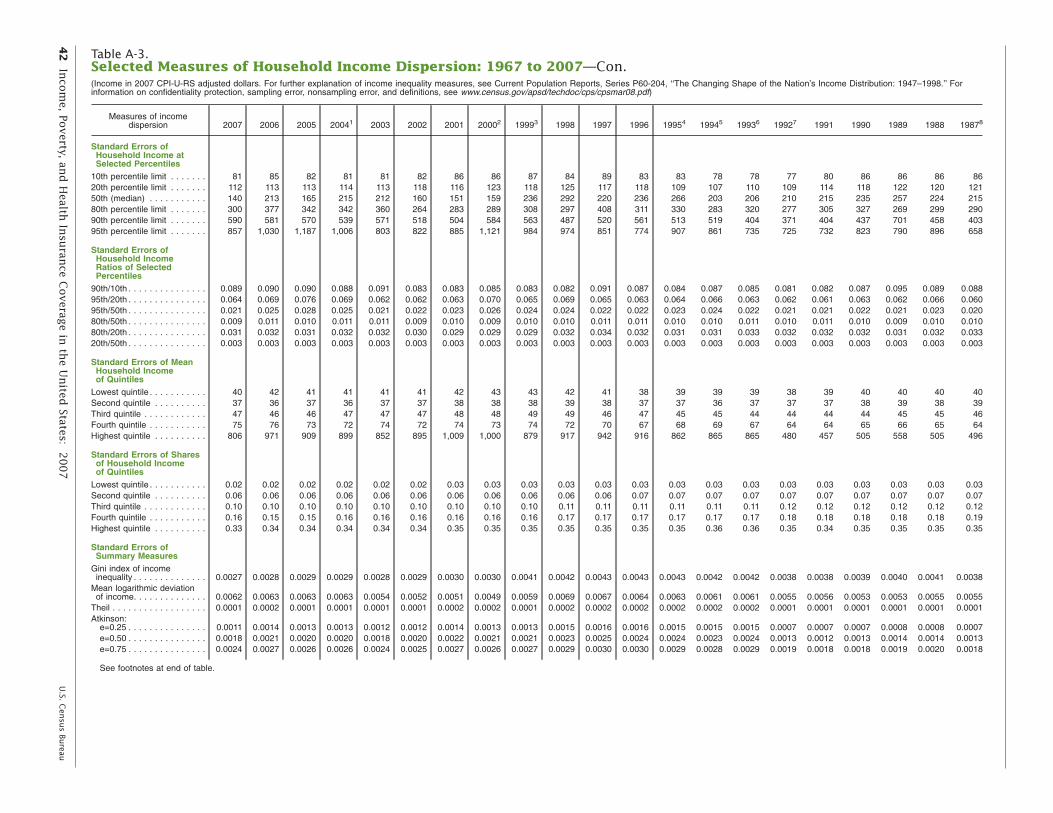
42
Inco
me, Po
verty, an
d H
ealth In
suran
ce Coverag
e in th
e Un
ited States: 2
00
7U
.S. Cen
sus Bu
reau
Table A-3.Selected Measures of Household Income Dispersion: 1967 to 2007—Con.(Income in 2007 CPI-U-RS adjusted dollars. For further explanation of income inequality measures, see Current Population Reports, Series P60-204, ‘‘The Changing Shape of the Nation’s Income Distribution: 1947–1998.’’ Forinformation on confidentiality protection, sampling error, nonsampling error, and definitions, see www.census.gov/apsd/techdoc/cps/cpsmar08.pdf)
Measures of incomedispersion 2007 2006 2005 20041 2003 2002 2001 20002 19993 1998 1997 1996 19954 19945 19936 19927 1991 1990 1989 1988 19878
Standard Errors ofHousehold Income atSelected Percentiles
10th percentile limit . . . . . . . 81 85 82 81 81 82 86 86 87 84 89 83 83 78 78 77 80 86 86 86 8620th percentile limit . . . . . . . 112 113 113 114 113 118 116 123 118 125 117 118 109 107 110 109 114 118 122 120 12150th (median) . . . . . . . . . . . 140 213 165 215 212 160 151 159 236 292 220 236 266 203 206 210 215 235 257 224 21580th percentile limit . . . . . . . 300 377 342 342 360 264 283 289 308 297 408 311 330 283 320 277 305 327 269 299 29090th percentile limit . . . . . . . 590 581 570 539 571 518 504 584 563 487 520 561 513 519 404 371 404 437 701 458 40395th percentile limit . . . . . . .
Standard Errors ofHousehold IncomeRatios of SelectedPercentiles
857 1,030 1,187 1,006 803 822 885 1,121 984 974 851 774 907 861 735 725 732 823 790 896 658
90th/10th . . . . . . . . . . . . . . . 0.089 0.090 0.090 0.088 0.091 0.083 0.083 0.085 0.083 0.082 0.091 0.087 0.084 0.087 0.085 0.081 0.082 0.087 0.095 0.089 0.08895th/20th . . . . . . . . . . . . . . . 0.064 0.069 0.076 0.069 0.062 0.062 0.063 0.070 0.065 0.069 0.065 0.063 0.064 0.066 0.063 0.062 0.061 0.063 0.062 0.066 0.06095th/50th . . . . . . . . . . . . . . . 0.021 0.025 0.028 0.025 0.021 0.022 0.023 0.026 0.024 0.024 0.022 0.022 0.023 0.024 0.022 0.021 0.021 0.022 0.021 0.023 0.02080th/50th . . . . . . . . . . . . . . . 0.009 0.011 0.010 0.011 0.011 0.009 0.010 0.009 0.010 0.010 0.011 0.011 0.010 0.010 0.011 0.010 0.011 0.010 0.009 0.010 0.01080th/20th . . . . . . . . . . . . . . . 0.031 0.032 0.031 0.032 0.032 0.030 0.029 0.029 0.029 0.032 0.034 0.032 0.031 0.031 0.033 0.032 0.032 0.032 0.031 0.032 0.03320th/50th . . . . . . . . . . . . . . .
Standard Errors of MeanHousehold Incomeof Quintiles
0.003 0.003 0.003 0.003 0.003 0.003 0.003 0.003 0.003 0.003 0.003 0.003 0.003 0.003 0.003 0.003 0.003 0.003 0.003 0.003 0.003
Lowest quintile . . . . . . . . . . . 40 42 41 41 41 41 42 43 43 42 41 38 39 39 39 38 39 40 40 40 40Second quintile . . . . . . . . . . 37 36 37 36 37 37 38 38 38 39 38 37 37 36 37 37 37 38 39 38 39Third quintile . . . . . . . . . . . . 47 46 46 47 47 47 48 48 49 49 46 47 45 45 44 44 44 44 45 45Fourth quintile . . . . . . . . . . . 75 76 73 72 74 72 74 73 74 72 70 67 68 69 67 64 64 65 66 65 64Highest quintile . . . . . . . . . .
Standard Errors of Sharesof Household Incomeof Quintiles
806 971 909 899 852 895 1,009 1,000 879 917 942 916 862 865 865 480 457 505 558 505 496
Lowest quintile . . . . . . . . . . . 0.02 0.02 0.02 0.02 0.02 0.02 0.03 0.03 0.03 0.03 0.03 0.03 0.03 0.03 0.03 0.03 0.03 0.03 0.03 0.03 0.03Second quintile . . . . . . . . . . 0.06 0.06 0.06 0.06 0.06 0.06 0.06 0.06 0.06 0.06 0.06 0.07 0.07 0.07 0.07 0.07 0.07 0.07 0.07 0.07 0.07Third quintile . . . . . . . . . . . . 0.10 0.10 0.10 0.10 0.10 0.10 0.10 0.10 0.10 0.11 0.11 0.11 0.11 0.11 0.11 0.12 0.12 0.12 0.12 0.12 0.12Fourth quintile . . . . . . . . . . . 0.16 0.15 0.15 0.16 0.16 0.16 0.16 0.16 0.16 0.17 0.17 0.17 0.17 0.17 0.17 0.18 0.18 0.18 0.18 0.18 0.19Highest quintile . . . . . . . . . .
Standard Errors ofSummary Measures
Gini index of income
0.33 0.34 0.34 0.34 0.34 0.34 0.35 0.35 0.35 0.35 0.35 0.35 0.35 0.36 0.36 0.35 0.34 0.35 0.35 0.35 0.35
inequality . . . . . . . . . . . . . .Mean logarithmic deviation
0.0027 0.0028 0.0029 0.0029 0.0028 0.0029 0.0030 0.0030 0.0041 0.0042 0.0043 0.0043 0.0043 0.0042 0.0042 0.0038 0.0038 0.0039 0.0040 0.0041 0.0038
of income. . . . . . . . . . . . . . 0.0062 0.0063 0.0063 0.0063 0.0054 0.0052 0.0051 0.0049 0.0059 0.0069 0.0067 0.0064 0.0063 0.0061 0.0061 0.0055 0.0056 0.0053 0.0053 0.0055 0.0055Theil . . . . . . . . . . . . . . . . . .Atkinson:
0.0001 0.0002 0.0001 0.0001 0.0001 0.0001 0.0002 0.0002 0.0001 0.0002 0.0002 0.0002 0.0002 0.0002 0.0002 0.0001 0.0001 0.0001 0.0001 0.0001 0.0001
e=0.25 . . . . . . . . . . . . . . . 0.0011 0.0014 0.0013 0.0013 0.0012 0.0012 0.0014 0.0013 0.0013 0.0015 0.0016 0.0016 0.0015 0.0015 0.0015 0.0007 0.0007 0.0007 0.0008 0.0008 0.0007e=0.50 . . . . . . . . . . . . . . . 0.0018 0.0021 0.0020 0.0020 0.0018 0.0020 0.0022 0.0021 0.0021 0.0023 0.0025 0.0024 0.0024 0.0023 0.0024 0.0013 0.0012 0.0013 0.0014 0.0014 0.0013e=0.75 . . . . . . . . . . . . . . .
See footnotes at end of table.
0.0024 0.0027 0.0026 0.0026 0.0024 0.0025 0.0027 0.0026 0.0027 0.0029 0.0030 0.0030 0.0029 0.0028 0.0029 0.0019 0.0018 0.0018 0.0019 0.0020 0.0018
46

U.S. C
ensu
s Bureau
Inco
me, Po
verty, an
d H
ealth In
suran
ce Coverag
e in th
e Un
ited States: 2
00
7 4
3
Table A-3.Selected Measures of Household Income Dispersion: 1967 to 2007—Con.(Income in 2007 CPI-U-RS adjusted dollars. For further explanation of income inequality measures, see Current Population Reports, Series P60-204, ‘‘The Changing Shape of the Nation’s Income Distribution: 1947–1998.’’ Forinformation on confidentiality protection, sampling error, nonsampling error, and definitions, see www.census.gov/apsd/techdoc/cps/cpsmar08.pdf)
Measures of incomedispersion 1986 19859 1984 198310 1982 1981 1980 197911 1978 1977 197612 197513 197413, 14 1973 197215 197116 1970 1969 1968 196717
Standard Errors ofHousehold Income atSelected Percentiles
10th percentile limit . . . . . . . 86 83 82 83 83 125 123 121 122 117 116 111 117 116 116 112 117 119 117 11320th percentile limit . . . . . . . 122 120 109 111 111 113 118 127 127 125 127 129 157 155 154 150 156 159 156 15150th (median) . . . . . . . . . . . 233 235 194 188 188 219 218 208 178 159 156 168 163 167 164 160 152 155 146 14180th percentile limit . . . . . . . 323 263 279 253 279 223 263 223 284 219 253 302 207 241 286 338 180 192 216 25490th percentile limit . . . . . . . 497 447 356 441 380 367 416 401 328 452 329 414 341 351 472 253 287 339 448 60395th percentile limit . . . . . . .
Standard Errors ofHousehold IncomeRatios of SelectedPercentiles
581 1,104 651 601 715 672 644 689 670 580 668 607 766 549 742 443 548 675 466 438
90th/10th . . . . . . . . . . . . . . . 0.093 0.085 0.079 0.088 0.084 0.114 0.110 0.108 0.102 0.102 0.099 0.097 0.096 0.100 0.109 0.107 0.115 0.113 0.115 0.13695th/20th . . . . . . . . . . . . . . . 0.059 0.077 0.056 0.056 0.062 0.059 0.057 0.059 0.059 0.056 0.059 0.059 0.068 0.063 0.070 0.060 0.064 0.066 0.060 0.06595th/50th . . . . . . . . . . . . . . . 0.018 0.028 0.020 0.019 0.021 0.020 0.019 0.020 0.020 0.018 0.020 0.019 0.022 0.018 0.021 0.016 0.017 0.020 0.016 0.01680th/50th . . . . . . . . . . . . . . . 0.011 0.010 0.010 0.010 0.010 0.009 0.010 0.009 0.010 0.009 0.010 0.010 0.009 0.010 0.010 0.011 0.008 0.008 0.009 0.01080th/20th . . . . . . . . . . . . . . . 0.034 0.032 0.030 0.031 0.032 0.030 0.031 0.031 0.033 0.032 0.032 0.035 0.036 0.037 0.038 0.040 0.037 0.036 0.036 0.04020th/50th . . . . . . . . . . . . . . .
Standard Errors of MeanHousehold Incomeof Quintiles
0.003 0.003 0.003 0.003 0.003 0.003 0.003 0.003 0.003 0.003 0.004 0.004 0.004 0.004 0.004 0.004 0.004 0.004 0.004 0.004
Lowest quintile . . . . . . . . . . . 40 40 40 40 40 41 41 42 43 44 43 43 46 44 45 45 47 47 47 45Second quintile . . . . . . . . . . 38 38 37 36 36 35 37 39 40 39 40 39 41 45 43 42 44 45 43 43Third quintile . . . . . . . . . . . . 46 43 43 42 41 43 43 45 45 44 45 43 41 44 44 42 41 41 39 38Fourth quintile . . . . . . . . . . . 63 62 62 60 59 57 57 58 58 58 56 55 58 59 58 55 55 54 52 51Highest quintile . . . . . . . . . .
Standard Errors of Sharesof Household Incomeof Quintiles
468 426 375 362 364 341 369 411 409 419 416 416 420 455 477 452 465 475 445 483
Lowest quintile . . . . . . . . . . . 0.03 0.03 0.03 0.03 0.03 0.03 0.03 0.04 0.04 0.04 0.04 0.04 0.04 0.04 0.04 0.04 0.04 0.04 0.04 0.04Second quintile . . . . . . . . . . 0.08 0.08 0.08 0.08 0.08 0.08 0.08 0.08 0.09 0.09 0.09 0.09 0.09 0.09 0.09 0.10 0.10 0.10 0.11 0.10Third quintile . . . . . . . . . . . . 0.13 0.13 0.13 0.13 0.13 0.13 0.14 0.14 0.14 0.14 0.15 0.15 0.15 0.15 0.15 0.16 0.16 0.16 0.17 0.17Fourth quintile . . . . . . . . . . . 0.19 0.19 0.19 0.19 0.20 0.20 0.20 0.20 0.21 0.21 0.21 0.21 0.21 0.22 0.22 0.22 0.23 0.23 0.23 0.23Highest quintile . . . . . . . . . .
Standard Errors ofSummary Measures
Gini index of income
0.35 0.35 0.35 0.36 0.36 0.35 0.36 0.36 0.37 0.37 0.37 0.38 0.38 0.39 0.39 0.39 0.40 0.40 0.40 0.41
inequality . . . . . . . . . . . . . .Mean logarithmic deviation
0.0038 0.0037 0.0037 0.0037 0.0038 0.0038 0.0036 0.0038 0.0039 0.0039 0.0041 0.0056 0.0066 0.0040 0.0069 0.0063 0.0078 0.0066 0.0042 0.0044
of income. . . . . . . . . . . . . . 0.0057 0.0056 0.0055 0.0056 0.0057 0.0056 0.0051 0.0050 0.0054 0.0054 0.0054 0.0059 0.0058 0.0057 0.0060 0.0061 0.0060 0.0058 0.0057 0.0060Theil . . . . . . . . . . . . . . . . . .Atkinson:
0.0001 0.0001 0.0001 0.0001 0.0001 0.0001 0.0001 0.0001 0.0001 0.0001 0.0001 0.0001 0.0001 0.0001 0.0001 0.0001 0.0001 0.0001 0.0001 0.0001
e=0.25 . . . . . . . . . . . . . . . 0.0007 0.0006 0.0006 0.0006 0.0006 0.0006 0.0006 0.0006 0.0006 0.0006 0.0006 0.0007 0.0006 0.0007 0.0007 0.0007 0.0007 0.0008 0.0007 0.0008e=0.50 . . . . . . . . . . . . . . . 0.0012 0.0011 0.0011 0.0011 0.0011 0.0011 0.0010 0.0011 0.0011 0.0011 0.0011 0.0012 0.0011 0.0012 0.0013 0.0013 0.0013 0.0014 0.0012 0.0014e=0.75 . . . . . . . . . . . . . . . 0.0018 0.0017 0.0016 0.0016 0.0017 0.0017 0.0016 0.0017 0.0016 0.0017 0.0017 0.0018 0.0017 0.0017 0.0018 0.0019 0.0019 0.0020 0.0018 0.0020
See footnotes on next page.
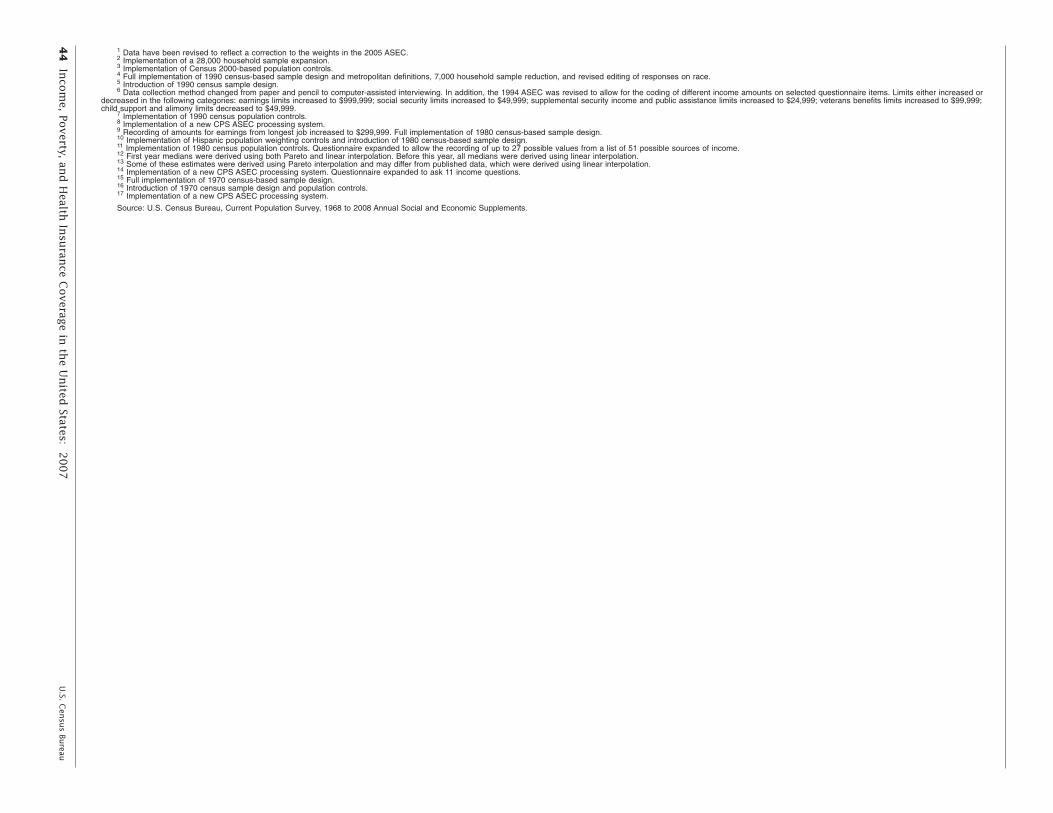
44
Inco
me, Po
verty, an
d H
ealth In
suran
ce Coverag
e in th
e Un
ited States: 2
00
7U
.S. Cen
sus Bu
reau
1 Data have been revised to reflect a correction to the weights in the 2005 ASEC.2 Implementation of a 28,000 household sample expansion.3 Implementation of Census 2000-based population controls.4 Full implementation of 1990 census-based sample design and metropolitan definitions, 7,000 household sample reduction, and revised editing of responses on race.5 Introduction of 1990 census sample design.6 Data collection method changed from paper and pencil to computer-assisted interviewing. In addition, the 1994 ASEC was revised to allow for the coding of different income amounts on selected questionnaire items. Limits either increased or
decreased in the following categories: earnings limits increased to $999,999; social security limits increased to $49,999; supplemental security income and public assistance limits increased to $24,999; veterans benefits limits increased to $99,999;child support and alimony limits decreased to $49,999.
7 Implementation of 1990 census population controls.8 Implementation of a new CPS ASEC processing system.9 Recording of amounts for earnings from longest job increased to $299,999. Full implementation of 1980 census-based sample design.10 Implementation of Hispanic population weighting controls and introduction of 1980 census-based sample design.11 Implementation of 1980 census population controls. Questionnaire expanded to allow the recording of up to 27 possible values from a list of 51 possible sources of income.12 First year medians were derived using both Pareto and linear interpolation. Before this year, all medians were derived using linear interpolation.13 Some of these estimates were derived using Pareto interpolation and may differ from published data, which were derived using linear interpolation.14 Implementation of a new CPS ASEC processing system. Questionnaire expanded to ask 11 income questions.15 Full implementation of 1970 census-based sample design.16 Introduction of 1970 census sample design and population controls.17 Implementation of a new CPS ASEC processing system.
Source: U.S. Census Bureau, Current Population Survey, 1968 to 2008 Annual Social and Economic Supplements.
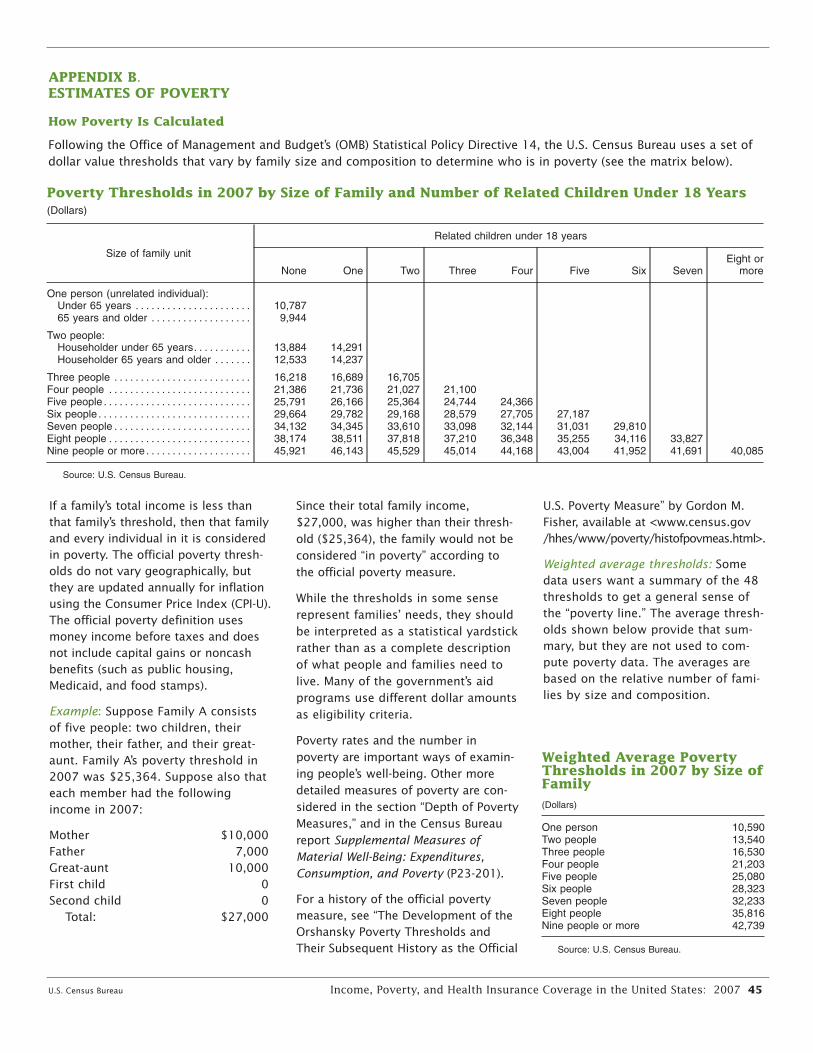
U.S. Census Bureau Income, Poverty, and Health Insurance Coverage in the United States: 2007 45
APPENDIX B. ESTIMATES OF POVERTY
How Poverty Is Calculated
Following the Office of Management and Budget’s (OMB) Statistical Policy Directive 14, the U.S. Census Bureau uses a set ofdollar value thresholds that vary by family size and composition to determine who is in poverty (see the matrix below).
Poverty Thresholds in 2007 by Size of Family and Number of Related Children Under 18 Years(Dollars)
Size of family unit
Related children under 18 years
None One Two Three Four Five Six SevenEight or
more
One person (unrelated individual):Under 65 years . . . . . . . . . . . . . . . . . . . . . . 10,78765 years and older . . . . . . . . . . . . . . . . . . . 9,944
Two people:Householder under 65 years. . . . . . . . . . . 13,884 14,291Householder 65 years and older . . . . . . . 12,533 14,237
Three people . . . . . . . . . . . . . . . . . . . . . . . . . . 16,218 16,689 16,705Four people . . . . . . . . . . . . . . . . . . . . . . . . . . . 21,386 21,736 21,027 21,100Five people . . . . . . . . . . . . . . . . . . . . . . . . . . . . 25,791 26,166 25,364 24,744 24,366Six people . . . . . . . . . . . . . . . . . . . . . . . . . . . . . 29,664 29,782 29,168 28,579 27,705 27,187Seven people . . . . . . . . . . . . . . . . . . . . . . . . . . 34,132 34,345 33,610 33,098 32,144 31,031 29,810Eight people . . . . . . . . . . . . . . . . . . . . . . . . . . . 38,174 38,511 37,818 37,210 36,348 35,255 34,116 33,827Nine people or more . . . . . . . . . . . . . . . . . . . . 45,921 46,143 45,529 45,014 44,168 43,004 41,952 41,691 40,085
Source: U.S. Census Bureau.
If a family’s total income is less than Since their total family income,that family’s threshold, then that family $27,000, was higher than their thresh-and every individual in it is considered old ($25,364), the family would not bein poverty. The official poverty thresh- considered “in poverty” according toolds do not vary geographically, but the official poverty measure. they are updated annually for inflation
While the thresholds in some senseusing the Consumer Price Index (CPI-U).represent families’ needs, they shouldThe official poverty definition usesbe interpreted as a statistical yardstickmoney income before taxes and doesrather than as a complete descriptionnot include capital gains or noncashof what people and families need tobenefits (such as public housing,live. Many of the government’s aidMedicaid, and food stamps).programs use different dollar amounts
Example: Suppose Family A consists as eligibility criteria.of five people: two children, their
Poverty rates and the number inmother, their father, and their great-aunt. Family A’s poverty threshold in poverty are important ways of examin-
2007 was $25,364. Suppose also that ing people’s well-being. Other more
each member had the following detailed measures of poverty are con-
income in 2007: sidered in the section “Depth of PovertyMeasures,” and in the Census Bureau
Mother $10,000 report Supplemental Measures ofFather 7,000 Material Well-Being: Expenditures,Great-aunt 10,000 Consumption, and Poverty (P23-201).First child 0Second child 0 For a history of the official poverty
Total: $27,000 measure, see “The Development of theOrshansky Poverty Thresholds andTheir Subsequent History as the Official
U.S. Poverty Measure” by Gordon M.Fisher, available at <www.census.gov/hhes/www/poverty/histofpovmeas.html>.
Weighted average thresholds: Somedata users want a summary of the 48thresholds to get a general sense ofthe “poverty line.” The average thresh-olds shown below provide that sum-mary, but they are not used to com-pute poverty data. The averages arebased on the relative number of fami-lies by size and composition.
Weighted Average PovertyThresholds in 2007 by Size ofFamily
(Dollars)
One person 10,590Two people 13,540Three people 16,530Four people 21,203Five people 25,080Six people 28,323Seven people 32,233Eight people 35,816Nine people or more
Source: U.S. Census Bureau.
42,739
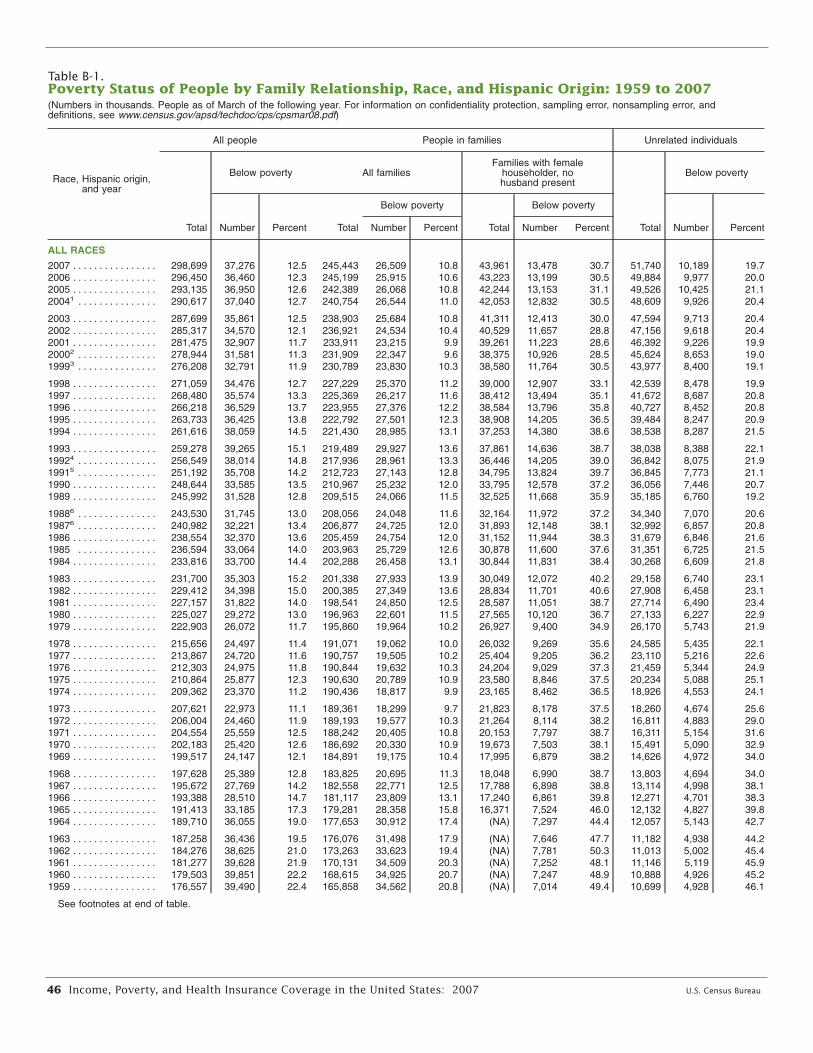
46 Income, Poverty, and Health Insurance Coverage in the United States: 2007 U.S. Census Bureau
Table B-1.Poverty Status of People by Family Relationship, Race, and Hispanic Origin: 1959 to 2007(Numbers in thousands. People as of March of the following year. For information on confidentiality protection, sampling error, nonsampling error, anddefinitions, see www.census.gov/apsd/techdoc/cps/cpsmar08.pdf)
Race, Hispanic origin,and year
All people People in families Unrelated individuals
Total
Below poverty All familiesFamilies with female
householder, nohusband present
Total
Below poverty
Number Percent Total
Below poverty
Total
Below poverty
Number PercentNumber Percent Number Percent
ALL RACES
2007 . . . . . . . . . . . . . . . . 298,699 37,276 12.5 245,443 26,509 10.8 43,961 13,478 30.7 51,740 10,189 19.72006 . . . . . . . . . . . . . . . . 296,450 36,460 12.3 245,199 25,915 10.6 43,223 13,199 30.5 49,884 9,977 20.02005 . . . . . . . . . . . . . . . . 293,135 36,950 12.6 242,389 26,068 10.8 42,244 13,153 31.1 49,526 10,425 21.120041 . . . . . . . . . . . . . . . 290,617 37,040 12.7 240,754 26,544 11.0 42,053 12,832 30.5 48,609 9,926 20.4
2003 . . . . . . . . . . . . . . . . 287,699 35,861 12.5 238,903 25,684 10.8 41,311 12,413 30.0 47,594 9,713 20.42002 . . . . . . . . . . . . . . . . 285,317 34,570 12.1 236,921 24,534 10.4 40,529 11,657 28.8 47,156 9,618 20.42001 . . . . . . . . . . . . . . . . 281,475 32,907 11.7 233,911 23,215 9.9 39,261 11,223 28.6 46,392 9,226 19.920002 . . . . . . . . . . . . . . . 278,944 31,581 11.3 231,909 22,347 9.6 38,375 10,926 28.5 45,624 8,653 19.019993 . . . . . . . . . . . . . . . 276,208 32,791 11.9 230,789 23,830 10.3 38,580 11,764 30.5 43,977 8,400 19.1
1998 . . . . . . . . . . . . . . . . 271,059 34,476 12.7 227,229 25,370 11.2 39,000 12,907 33.1 42,539 8,478 19.91997 . . . . . . . . . . . . . . . . 268,480 35,574 13.3 225,369 26,217 11.6 38,412 13,494 35.1 41,672 8,687 20.81996 . . . . . . . . . . . . . . . . 266,218 36,529 13.7 223,955 27,376 12.2 38,584 13,796 35.8 40,727 8,452 20.81995 . . . . . . . . . . . . . . . . 263,733 36,425 13.8 222,792 27,501 12.3 38,908 14,205 36.5 39,484 8,247 20.91994 . . . . . . . . . . . . . . . . 261,616 38,059 14.5 221,430 28,985 13.1 37,253 14,380 38.6 38,538 8,287 21.5
1993 . . . . . . . . . . . . . . . . 259,278 39,265 15.1 219,489 29,927 13.6 37,861 14,636 38.7 38,038 8,388 22.119924 . . . . . . . . . . . . . . . 256,549 38,014 14.8 217,936 28,961 13.3 36,446 14,205 39.0 36,842 8,075 21.919915 . . . . . . . . . . . . . . . 251,192 35,708 14.2 212,723 27,143 12.8 34,795 13,824 39.7 36,845 7,773 21.11990 . . . . . . . . . . . . . . . . 248,644 33,585 13.5 210,967 25,232 12.0 33,795 12,578 37.2 36,056 7,446 20.71989 . . . . . . . . . . . . . . . . 245,992 31,528 12.8 209,515 24,066 11.5 32,525 11,668 35.9 35,185 6,760 19.2
19886 . . . . . . . . . . . . . . . 243,530 31,745 13.0 208,056 24,048 11.6 32,164 11,972 37.2 34,340 7,070 20.619876 . . . . . . . . . . . . . . . 240,982 32,221 13.4 206,877 24,725 12.0 31,893 12,148 38.1 32,992 6,857 20.81986 . . . . . . . . . . . . . . . . 238,554 32,370 13.6 205,459 24,754 12.0 31,152 11,944 38.3 31,679 6,846 21.61985 . . . . . . . . . . . . . . . 236,594 33,064 14.0 203,963 25,729 12.6 30,878 11,600 37.6 31,351 6,725 21.51984 . . . . . . . . . . . . . . . . 233,816 33,700 14.4 202,288 26,458 13.1 30,844 11,831 38.4 30,268 6,609 21.8
1983 . . . . . . . . . . . . . . . . 231,700 35,303 15.2 201,338 27,933 13.9 30,049 12,072 40.2 29,158 6,740 23.11982 . . . . . . . . . . . . . . . . 229,412 34,398 15.0 200,385 27,349 13.6 28,834 11,701 40.6 27,908 6,458 23.11981 . . . . . . . . . . . . . . . . 227,157 31,822 14.0 198,541 24,850 12.5 28,587 11,051 38.7 27,714 6,490 23.41980 . . . . . . . . . . . . . . . . 225,027 29,272 13.0 196,963 22,601 11.5 27,565 10,120 36.7 27,133 6,227 22.91979 . . . . . . . . . . . . . . . . 222,903 26,072 11.7 195,860 19,964 10.2 26,927 9,400 34.9 26,170 5,743 21.9
1978 . . . . . . . . . . . . . . . . 215,656 24,497 11.4 191,071 19,062 10.0 26,032 9,269 35.6 24,585 5,435 22.11977 . . . . . . . . . . . . . . . . 213,867 24,720 11.6 190,757 19,505 10.2 25,404 9,205 36.2 23,110 5,216 22.61976 . . . . . . . . . . . . . . . . 212,303 24,975 11.8 190,844 19,632 10.3 24,204 9,029 37.3 21,459 5,344 24.91975 . . . . . . . . . . . . . . . . 210,864 25,877 12.3 190,630 20,789 10.9 23,580 8,846 37.5 20,234 5,088 25.11974 . . . . . . . . . . . . . . . . 209,362 23,370 11.2 190,436 18,817 9.9 23,165 8,462 36.5 18,926 4,553 24.1
1973 . . . . . . . . . . . . . . . . 207,621 22,973 11.1 189,361 18,299 9.7 21,823 8,178 37.5 18,260 4,674 25.61972 . . . . . . . . . . . . . . . . 206,004 24,460 11.9 189,193 19,577 10.3 21,264 8,114 38.2 16,811 4,883 29.01971 . . . . . . . . . . . . . . . . 204,554 25,559 12.5 188,242 20,405 10.8 20,153 7,797 38.7 16,311 5,154 31.61970 . . . . . . . . . . . . . . . . 202,183 25,420 12.6 186,692 20,330 10.9 19,673 7,503 38.1 15,491 5,090 32.91969 . . . . . . . . . . . . . . . . 199,517 24,147 12.1 184,891 19,175 10.4 17,995 6,879 38.2 14,626 4,972 34.0
1968 . . . . . . . . . . . . . . . . 197,628 25,389 12.8 183,825 20,695 11.3 18,048 6,990 38.7 13,803 4,694 34.01967 . . . . . . . . . . . . . . . . 195,672 27,769 14.2 182,558 22,771 12.5 17,788 6,898 38.8 13,114 4,998 38.11966 . . . . . . . . . . . . . . . . 193,388 28,510 14.7 181,117 23,809 13.1 17,240 6,861 39.8 12,271 4,701 38.31965 . . . . . . . . . . . . . . . . 191,413 33,185 17.3 179,281 28,358 15.8 16,371 7,524 46.0 12,132 4,827 39.81964 . . . . . . . . . . . . . . . . 189,710 36,055 19.0 177,653 30,912 17.4 (NA) 7,297 44.4 12,057 5,143 42.7
1963 . . . . . . . . . . . . . . . . 187,258 36,436 19.5 176,076 31,498 17.9 (NA) 7,646 47.7 11,182 4,938 44.21962 . . . . . . . . . . . . . . . . 184,276 38,625 21.0 173,263 33,623 19.4 (NA) 7,781 50.3 11,013 5,002 45.41961 . . . . . . . . . . . . . . . . 181,277 39,628 21.9 170,131 34,509 20.3 (NA) 7,252 48.1 11,146 5,119 45.91960 . . . . . . . . . . . . . . . . 179,503 39,851 22.2 168,615 34,925 20.7 (NA) 7,247 48.9 10,888 4,926 45.21959 . . . . . . . . . . . . . . . . 176,557 39,490 22.4 165,858 34,562 20.8 (NA) 7,014 49.4 10,699 4,928 46.1
See footnotes at end of table.
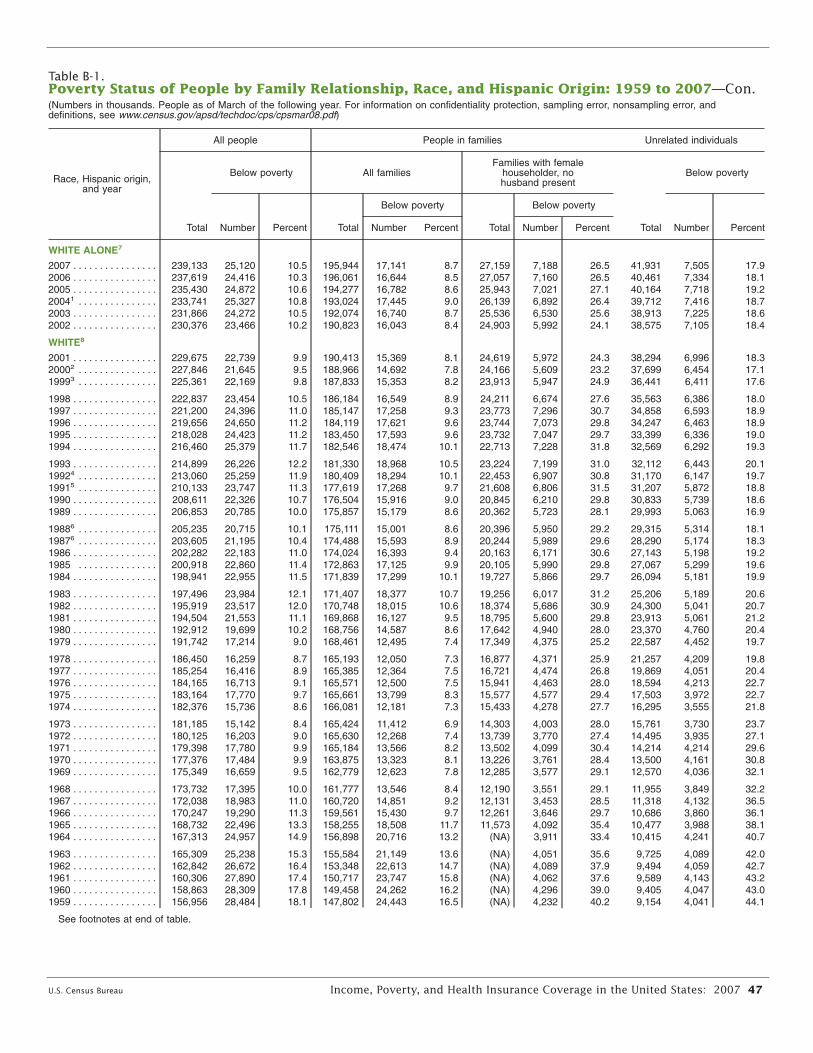
U.S. Census Bureau Income, Poverty, and Health Insurance Coverage in the United States: 2007 47
Table B-1.Poverty Status of People by Family Relationship, Race, and Hispanic Origin: 1959 to 2007—Con.(Numbers in thousands. People as of March of the following year. For information on confidentiality protection, sampling error, nonsampling error, anddefinitions, see www.census.gov/apsd/techdoc/cps/cpsmar08.pdf)
Race, Hispanic origin,and year
All people People in families Unrelated individuals
Total
Below poverty All familiesFamilies with female
householder, nohusband present
Total
Below poverty
Number Percent Total
Below poverty
Total
Below poverty
Number PercentNumber Percent Number Percent
WHITE ALONE7
2007 . . . . . . . . . . . . . . . . 239,133 25,120 10.5 195,944 17,141 8.7 27,159 7,188 26.5 41,931 7,505 17.92006 . . . . . . . . . . . . . . . . 237,619 24,416 10.3 196,061 16,644 8.5 27,057 7,160 26.5 40,461 7,334 18.12005 . . . . . . . . . . . . . . . . 235,430 24,872 10.6 194,277 16,782 8.6 25,943 7,021 27.1 40,164 7,718 19.220041 . . . . . . . . . . . . . . . 233,741 25,327 10.8 193,024 17,445 9.0 26,139 6,892 26.4 39,712 7,416 18.72003 . . . . . . . . . . . . . . . . 231,866 24,272 10.5 192,074 16,740 8.7 25,536 6,530 25.6 38,913 7,225 18.62002 . . . . . . . . . . . . . . . . 230,376 23,466 10.2 190,823 16,043 8.4 24,903 5,992 24.1 38,575 7,105 18.4
WHITE8
2001 . . . . . . . . . . . . . . . . 229,675 22,739 9.9 190,413 15,369 8.1 24,619 5,972 24.3 38,294 6,996 18.320002 . . . . . . . . . . . . . . . 227,846 21,645 9.5 188,966 14,692 7.8 24,166 5,609 23.2 37,699 6,454 17.119993 . . . . . . . . . . . . . . . 225,361 22,169 9.8 187,833 15,353 8.2 23,913 5,947 24.9 36,441 6,411 17.6
1998 . . . . . . . . . . . . . . . . 222,837 23,454 10.5 186,184 16,549 8.9 24,211 6,674 27.6 35,563 6,386 18.01997 . . . . . . . . . . . . . . . . 221,200 24,396 11.0 185,147 17,258 9.3 23,773 7,296 30.7 34,858 6,593 18.91996 . . . . . . . . . . . . . . . . 219,656 24,650 11.2 184,119 17,621 9.6 23,744 7,073 29.8 34,247 6,463 18.91995 . . . . . . . . . . . . . . . . 218,028 24,423 11.2 183,450 17,593 9.6 23,732 7,047 29.7 33,399 6,336 19.01994 . . . . . . . . . . . . . . . . 216,460 25,379 11.7 182,546 18,474 10.1 22,713 7,228 31.8 32,569 6,292 19.3
1993 . . . . . . . . . . . . . . . . 214,899 26,226 12.2 181,330 18,968 10.5 23,224 7,199 31.0 32,112 6,443 20.119924 . . . . . . . . . . . . . . . 213,060 25,259 11.9 180,409 18,294 10.1 22,453 6,907 30.8 31,170 6,147 19.719915 . . . . . . . . . . . . . . . 210,133 23,747 11.3 177,619 17,268 9.7 21,608 6,806 31.5 31,207 5,872 18.81990 . . . . . . . . . . . . . . . . 208,611 22,326 10.7 176,504 15,916 9.0 20,845 6,210 29.8 30,833 5,739 18.61989 . . . . . . . . . . . . . . . . 206,853 20,785 10.0 175,857 15,179 8.6 20,362 5,723 28.1 29,993 5,063 16.9
19886 . . . . . . . . . . . . . . . 205,235 20,715 10.1 175,111 15,001 8.6 20,396 5,950 29.2 29,315 5,314 18.119876 . . . . . . . . . . . . . . . 203,605 21,195 10.4 174,488 15,593 8.9 20,244 5,989 29.6 28,290 5,174 18.31986 . . . . . . . . . . . . . . . . 202,282 22,183 11.0 174,024 16,393 9.4 20,163 6,171 30.6 27,143 5,198 19.21985 . . . . . . . . . . . . . . . 200,918 22,860 11.4 172,863 17,125 9.9 20,105 5,990 29.8 27,067 5,299 19.61984 . . . . . . . . . . . . . . . . 198,941 22,955 11.5 171,839 17,299 10.1 19,727 5,866 29.7 26,094 5,181 19.9
1983 . . . . . . . . . . . . . . . . 197,496 23,984 12.1 171,407 18,377 10.7 19,256 6,017 31.2 25,206 5,189 20.61982 . . . . . . . . . . . . . . . . 195,919 23,517 12.0 170,748 18,015 10.6 18,374 5,686 30.9 24,300 5,041 20.71981 . . . . . . . . . . . . . . . . 194,504 21,553 11.1 169,868 16,127 9.5 18,795 5,600 29.8 23,913 5,061 21.21980 . . . . . . . . . . . . . . . . 192,912 19,699 10.2 168,756 14,587 8.6 17,642 4,940 28.0 23,370 4,760 20.41979 . . . . . . . . . . . . . . . . 191,742 17,214 9.0 168,461 12,495 7.4 17,349 4,375 25.2 22,587 4,452 19.7
1978 . . . . . . . . . . . . . . . . 186,450 16,259 8.7 165,193 12,050 7.3 16,877 4,371 25.9 21,257 4,209 19.81977 . . . . . . . . . . . . . . . . 185,254 16,416 8.9 165,385 12,364 7.5 16,721 4,474 26.8 19,869 4,051 20.41976 . . . . . . . . . . . . . . . . 184,165 16,713 9.1 165,571 12,500 7.5 15,941 4,463 28.0 18,594 4,213 22.71975 . . . . . . . . . . . . . . . . 183,164 17,770 9.7 165,661 13,799 8.3 15,577 4,577 29.4 17,503 3,972 22.71974 . . . . . . . . . . . . . . . . 182,376 15,736 8.6 166,081 12,181 7.3 15,433 4,278 27.7 16,295 3,555 21.8
1973 . . . . . . . . . . . . . . . . 181,185 15,142 8.4 165,424 11,412 6.9 14,303 4,003 28.0 15,761 3,730 23.71972 . . . . . . . . . . . . . . . . 180,125 16,203 9.0 165,630 12,268 7.4 13,739 3,770 27.4 14,495 3,935 27.11971 . . . . . . . . . . . . . . . . 179,398 17,780 9.9 165,184 13,566 8.2 13,502 4,099 30.4 14,214 4,214 29.61970 . . . . . . . . . . . . . . . . 177,376 17,484 9.9 163,875 13,323 8.1 13,226 3,761 28.4 13,500 4,161 30.81969 . . . . . . . . . . . . . . . . 175,349 16,659 9.5 162,779 12,623 7.8 12,285 3,577 29.1 12,570 4,036 32.1
1968 . . . . . . . . . . . . . . . . 173,732 17,395 10.0 161,777 13,546 8.4 12,190 3,551 29.1 11,955 3,849 32.21967 . . . . . . . . . . . . . . . . 172,038 18,983 11.0 160,720 14,851 9.2 12,131 3,453 28.5 11,318 4,132 36.51966 . . . . . . . . . . . . . . . . 170,247 19,290 11.3 159,561 15,430 9.7 12,261 3,646 29.7 10,686 3,860 36.11965 . . . . . . . . . . . . . . . . 168,732 22,496 13.3 158,255 18,508 11.7 11,573 4,092 35.4 10,477 3,988 38.11964 . . . . . . . . . . . . . . . . 167,313 24,957 14.9 156,898 20,716 13.2 (NA) 3,911 33.4 10,415 4,241 40.7
1963 . . . . . . . . . . . . . . . . 165,309 25,238 15.3 155,584 21,149 13.6 (NA) 4,051 35.6 9,725 4,089 42.01962 . . . . . . . . . . . . . . . . 162,842 26,672 16.4 153,348 22,613 14.7 (NA) 4,089 37.9 9,494 4,059 42.71961 . . . . . . . . . . . . . . . . 160,306 27,890 17.4 150,717 23,747 15.8 (NA) 4,062 37.6 9,589 4,143 43.21960 . . . . . . . . . . . . . . . . 158,863 28,309 17.8 149,458 24,262 16.2 (NA) 4,296 39.0 9,405 4,047 43.01959 . . . . . . . . . . . . . . . . 156,956 28,484 18.1 147,802 24,443 16.5 (NA) 4,232 40.2 9,154 4,041 44.1
See footnotes at end of table.

48 Income, Poverty, and Health Insurance Coverage in the United States: 2007 U.S. Census Bureau
Table B-1.Poverty Status of People by Family Relationship, Race, and Hispanic Origin: 1959 to 2007—Con.(Numbers in thousands. People as of March of the following year. For information on confidentiality protection, sampling error, nonsampling error, anddefinitions, see www.census.gov/apsd/techdoc/cps/cpsmar08.pdf)
Race, Hispanic origin,and year
All people People in families Unrelated individuals
Total
Below poverty All familiesFamilies with female
householder, nohusband present
Total
Below poverty
Number Percent Total
Below poverty
Total
Below poverty
Number PercentNumber Percent Number Percent
WHITE ALONE, NOTHISPANIC7
2007 . . . . . . . . . . . . . . . . 196,583 16,032 8.2 158,703 9,553 6.0 19,179 4,099 21.4 36,909 6,155 16.72006 . . . . . . . . . . . . . . . . 196,049 16,013 8.2 159,572 9,676 6.1 19,349 4,353 22.5 35,642 6,021 16.92005 . . . . . . . . . . . . . . . . 195,553 16,227 8.3 159,204 9,604 6.0 18,899 4,278 22.6 35,626 6,393 17.920041 . . . . . . . . . . . . . . . 195,098 16,908 8.7 159,221 10,323 6.5 19,009 4,116 21.7 35,141 6,237 17.72003 . . . . . . . . . . . . . . . . 194,595 15,902 8.2 159,215 9,658 6.1 18,792 3,959 21.1 34,683 6,015 17.32002 . . . . . . . . . . . . . . . .
WHITE, NOTHISPANIC8
194,144 15,567 8.0 158,764 9,389 5.9 18,664 3,733 20.0 34,614 5,947 17.2
2001 . . . . . . . . . . . . . . . . 194,538 15,271 7.8 159,178 9,122 5.7 18,365 3,661 19.9 34,603 5,882 17.020002 . . . . . . . . . . . . . . . 193,691 14,366 7.4 158,838 8,664 5.5 18,196 3,412 18.8 33,943 5,356 15.819993 . . . . . . . . . . . . . . . 192,565 14,735 7.7 158,550 9,013 5.7 17,892 3,545 19.8 33,189 5,412 16.31998 . . . . . . . . . . . . . . . . 192,754 15,799 8.2 159,301 10,061 6.3 18,547 4,074 22.0 32,573 5,352 16.4
1997 . . . . . . . . . . . . . . . . 191,859 16,491 8.6 158,796 10,401 6.5 18,474 4,604 24.9 32,049 5,632 17.61996 . . . . . . . . . . . . . . . . 191,459 16,462 8.6 159,044 10,553 6.6 18,597 4,339 23.3 31,410 5,455 17.41995 . . . . . . . . . . . . . . . . 190,951 16,267 8.5 159,402 10,599 6.6 18,340 4,183 22.8 30,586 5,303 17.31994 . . . . . . . . . . . . . . . . 192,543 18,110 9.4 161,254 12,118 7.5 18,186 4,743 26.1 30,157 5,500 18.21993 . . . . . . . . . . . . . . . . 190,843 18,882 9.9 160,062 12,756 8.0 18,508 4,724 25.5 29,681 5,570 18.8
19924 . . . . . . . . . . . . . . . 189,001 18,202 9.6 159,102 12,277 7.7 18,016 4,640 25.8 28,775 5,350 18.619915 . . . . . . . . . . . . . . . 189,116 17,741 9.4 158,850 11,998 7.6 17,609 4,710 26.7 29,215 5,261 18.01990 . . . . . . . . . . . . . . . . 188,129 16,622 8.8 158,394 11,086 7.0 17,160 4,284 25.0 28,688 5,002 17.41989 . . . . . . . . . . . . . . . . 186,979 15,599 8.3 158,127 10,723 6.8 16,827 3,922 23.3 28,055 4,466 15.919886 . . . . . . . . . . . . . . . 185,961 15,565 8.4 157,687 10,467 6.6 16,828 3,988 23.7 27,552 4,746 17.2
19876 . . . . . . . . . . . . . . . 184,936 16,029 8.7 157,785 11,051 7.0 16,787 4,075 24.3 26,439 4,613 17.41986 . . . . . . . . . . . . . . . . 184,119 17,244 9.4 157,665 12,078 7.7 16,739 4,350 26.0 25,525 4,668 18.31985 . . . . . . . . . . . . . . . 183,455 17,839 9.7 157,106 12,706 8.1 16,749 4,136 24.7 25,544 4,789 18.71984 . . . . . . . . . . . . . . . . 182,469 18,300 10.0 156,930 13,234 8.4 16,742 4,193 25.0 24,671 4,659 18.91983 . . . . . . . . . . . . . . . . 181,393 19,538 10.8 156,719 14,437 9.2 16,369 4,448 27.2 23,894 4,746 19.9
1982 . . . . . . . . . . . . . . . . 181,903 19,362 10.6 157,818 14,271 9.0 15,830 4,161 26.3 23,329 4,701 20.21981 . . . . . . . . . . . . . . . . 180,909 17,987 9.9 157,330 12,903 8.2 16,323 4,222 25.9 22,950 4,769 20.81980 . . . . . . . . . . . . . . . . 179,798 16,365 9.1 156,633 11,568 7.4 15,358 3,699 24.1 22,455 4,474 19.91979 . . . . . . . . . . . . . . . . 178,814 14,419 8.1 156,567 10,009 6.4 15,410 3,371 21.9 21,638 4,179 19.31978 . . . . . . . . . . . . . . . . 174,731 13,755 7.9 154,321 9,798 6.3 15,132 3,390 22.4 20,410 3,957 19.4
1977 . . . . . . . . . . . . . . . . 173,563 13,802 8.0 154,449 9,977 6.5 14,888 3,429 23.0 19,114 3,825 20.01976 . . . . . . . . . . . . . . . . 173,235 14,025 8.1 155,324 10,066 6.5 14,261 3,516 24.7 17,912 3,959 22.11975 . . . . . . . . . . . . . . . . 172,417 14,883 8.6 155,539 11,137 7.2 13,809 3,570 25.9 16,879 3,746 22.21974 . . . . . . . . . . . . . . . . 171,463 13,217 7.7 155,764 9,854 6.3 13,763 3,379 24.6 15,699 3,364 21.41973 . . . . . . . . . . . . . . . . 170,488 12,864 7.5 155,330 9,262 6.0 12,731 3,185 25.0 15,158 3,602 23.8
See footnotes at end of table.
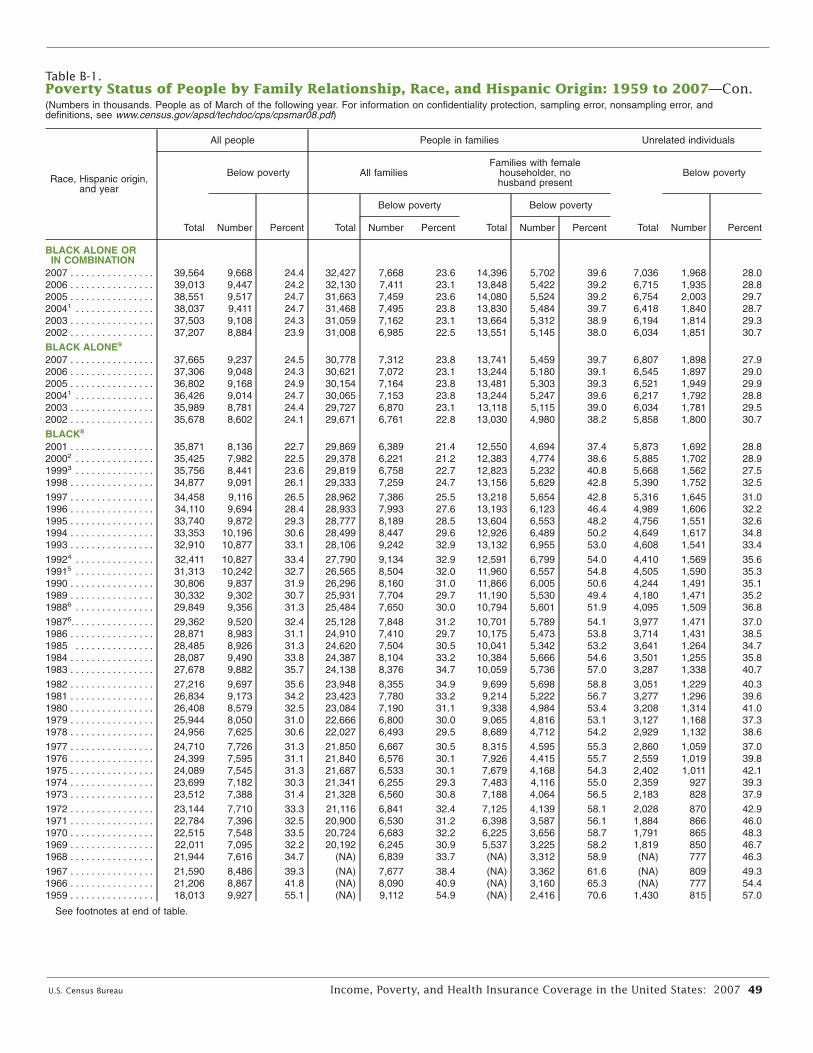
U.S. Census Bureau Income, Poverty, and Health Insurance Coverage in the United States: 2007 49
Table B-1.Poverty Status of People by Family Relationship, Race, and Hispanic Origin: 1959 to 2007—Con.(Numbers in thousands. People as of March of the following year. For information on confidentiality protection, sampling error, nonsampling error, anddefinitions, see www.census.gov/apsd/techdoc/cps/cpsmar08.pdf)
Race, Hispanic origin,and year
All people People in families Unrelated individuals
Total
Below poverty All familiesFamilies with female
householder, nohusband present
Total
Below poverty
Number Percent Total
Below poverty
Total
Below poverty
Number PercentNumber Percent Number Percent
BLACK ALONE ORIN COMBINATION
2007 . . . . . . . . . . . . . . . . 39,564 9,668 24.4 32,427 7,668 23.6 14,396 5,702 39.6 7,036 1,968 28.02006 . . . . . . . . . . . . . . . . 39,013 9,447 24.2 32,130 7,411 23.1 13,848 5,422 39.2 6,715 1,935 28.82005 . . . . . . . . . . . . . . . . 38,551 9,517 24.7 31,663 7,459 23.6 14,080 5,524 39.2 6,754 2,003 29.720041 . . . . . . . . . . . . . . . 38,037 9,411 24.7 31,468 7,495 23.8 13,830 5,484 39.7 6,418 1,840 28.72003 . . . . . . . . . . . . . . . . 37,503 9,108 24.3 31,059 7,162 23.1 13,664 5,312 38.9 6,194 1,814 29.32002 . . . . . . . . . . . . . . . .
BLACK ALONE9
37,207 8,884 23.9 31,008 6,985 22.5 13,551 5,145 38.0 6,034 1,851 30.7
2007 . . . . . . . . . . . . . . . . 37,665 9,237 24.5 30,778 7,312 23.8 13,741 5,459 39.7 6,807 1,898 27.92006 . . . . . . . . . . . . . . . . 37,306 9,048 24.3 30,621 7,072 23.1 13,244 5,180 39.1 6,545 1,897 29.02005 . . . . . . . . . . . . . . . . 36,802 9,168 24.9 30,154 7,164 23.8 13,481 5,303 39.3 6,521 1,949 29.920041 . . . . . . . . . . . . . . . 36,426 9,014 24.7 30,065 7,153 23.8 13,244 5,247 39.6 6,217 1,792 28.82003 . . . . . . . . . . . . . . . . 35,989 8,781 24.4 29,727 6,870 23.1 13,118 5,115 39.0 6,034 1,781 29.52002 . . . . . . . . . . . . . . . .
BLACK8
35,678 8,602 24.1 29,671 6,761 22.8 13,030 4,980 38.2 5,858 1,800 30.7
2001 . . . . . . . . . . . . . . . . 35,871 8,136 22.7 29,869 6,389 21.4 12,550 4,694 37.4 5,873 1,692 28.820002 . . . . . . . . . . . . . . . 35,425 7,982 22.5 29,378 6,221 21.2 12,383 4,774 38.6 5,885 1,702 28.919993 . . . . . . . . . . . . . . . 35,756 8,441 23.6 29,819 6,758 22.7 12,823 5,232 40.8 5,668 1,562 27.51998 . . . . . . . . . . . . . . . . 34,877 9,091 26.1 29,333 7,259 24.7 13,156 5,629 42.8 5,390 1,752 32.5
1997 . . . . . . . . . . . . . . . . 34,458 9,116 26.5 28,962 7,386 25.5 13,218 5,654 42.8 5,316 1,645 31.01996 . . . . . . . . . . . . . . . . 34,110 9,694 28.4 28,933 7,993 27.6 13,193 6,123 46.4 4,989 1,606 32.21995 . . . . . . . . . . . . . . . . 33,740 9,872 29.3 28,777 8,189 28.5 13,604 6,553 48.2 4,756 1,551 32.61994 . . . . . . . . . . . . . . . . 33,353 10,196 30.6 28,499 8,447 29.6 12,926 6,489 50.2 4,649 1,617 34.81993 . . . . . . . . . . . . . . . . 32,910 10,877 33.1 28,106 9,242 32.9 13,132 6,955 53.0 4,608 1,541 33.4
19924 . . . . . . . . . . . . . . . 32,411 10,827 33.4 27,790 9,134 32.9 12,591 6,799 54.0 4,410 1,569 35.619915 . . . . . . . . . . . . . . . 31,313 10,242 32.7 26,565 8,504 32.0 11,960 6,557 54.8 4,505 1,590 35.31990 . . . . . . . . . . . . . . . . 30,806 9,837 31.9 26,296 8,160 31.0 11,866 6,005 50.6 4,244 1,491 35.11989 . . . . . . . . . . . . . . . . 30,332 9,302 30.7 25,931 7,704 29.7 11,190 5,530 49.4 4,180 1,471 35.219886 . . . . . . . . . . . . . . . 29,849 9,356 31.3 25,484 7,650 30.0 10,794 5,601 51.9 4,095 1,509 36.8
19876. . . . . . . . . . . . . . . . 29,362 9,520 32.4 25,128 7,848 31.2 10,701 5,789 54.1 3,977 1,471 37.01986 . . . . . . . . . . . . . . . . 28,871 8,983 31.1 24,910 7,410 29.7 10,175 5,473 53.8 3,714 1,431 38.51985 . . . . . . . . . . . . . . . 28,485 8,926 31.3 24,620 7,504 30.5 10,041 5,342 53.2 3,641 1,264 34.71984 . . . . . . . . . . . . . . . . 28,087 9,490 33.8 24,387 8,104 33.2 10,384 5,666 54.6 3,501 1,255 35.81983 . . . . . . . . . . . . . . . . 27,678 9,882 35.7 24,138 8,376 34.7 10,059 5,736 57.0 3,287 1,338 40.7
1982 . . . . . . . . . . . . . . . . 27,216 9,697 35.6 23,948 8,355 34.9 9,699 5,698 58.8 3,051 1,229 40.31981 . . . . . . . . . . . . . . . . 26,834 9,173 34.2 23,423 7,780 33.2 9,214 5,222 56.7 3,277 1,296 39.61980 . . . . . . . . . . . . . . . . 26,408 8,579 32.5 23,084 7,190 31.1 9,338 4,984 53.4 3,208 1,314 41.01979 . . . . . . . . . . . . . . . . 25,944 8,050 31.0 22,666 6,800 30.0 9,065 4,816 53.1 3,127 1,168 37.31978 . . . . . . . . . . . . . . . . 24,956 7,625 30.6 22,027 6,493 29.5 8,689 4,712 54.2 2,929 1,132 38.6
1977 . . . . . . . . . . . . . . . . 24,710 7,726 31.3 21,850 6,667 30.5 8,315 4,595 55.3 2,860 1,059 37.01976 . . . . . . . . . . . . . . . . 24,399 7,595 31.1 21,840 6,576 30.1 7,926 4,415 55.7 2,559 1,019 39.81975 . . . . . . . . . . . . . . . . 24,089 7,545 31.3 21,687 6,533 30.1 7,679 4,168 54.3 2,402 1,011 42.11974 . . . . . . . . . . . . . . . . 23,699 7,182 30.3 21,341 6,255 29.3 7,483 4,116 55.0 2,359 927 39.31973 . . . . . . . . . . . . . . . . 23,512 7,388 31.4 21,328 6,560 30.8 7,188 4,064 56.5 2,183 828 37.9
1972 . . . . . . . . . . . . . . . . 23,144 7,710 33.3 21,116 6,841 32.4 7,125 4,139 58.1 2,028 870 42.91971 . . . . . . . . . . . . . . . . 22,784 7,396 32.5 20,900 6,530 31.2 6,398 3,587 56.1 1,884 866 46.01970 . . . . . . . . . . . . . . . . 22,515 7,548 33.5 20,724 6,683 32.2 6,225 3,656 58.7 1,791 865 48.31969 . . . . . . . . . . . . . . . . 22,011 7,095 32.2 20,192 6,245 30.9 5,537 3,225 58.2 1,819 850 46.71968 . . . . . . . . . . . . . . . . 21,944 7,616 34.7 (NA) 6,839 33.7 (NA) 3,312 58.9 (NA) 777 46.3
1967 . . . . . . . . . . . . . . . . 21,590 8,486 39.3 (NA) 7,677 38.4 (NA) 3,362 61.6 (NA) 809 49.31966 . . . . . . . . . . . . . . . . 21,206 8,867 41.8 (NA) 8,090 40.9 (NA) 3,160 65.3 (NA) 777 54.41959 . . . . . . . . . . . . . . . . 18,013 9,927 55.1 (NA) 9,112 54.9 (NA) 2,416 70.6 1,430 815 57.0
See footnotes at end of table.
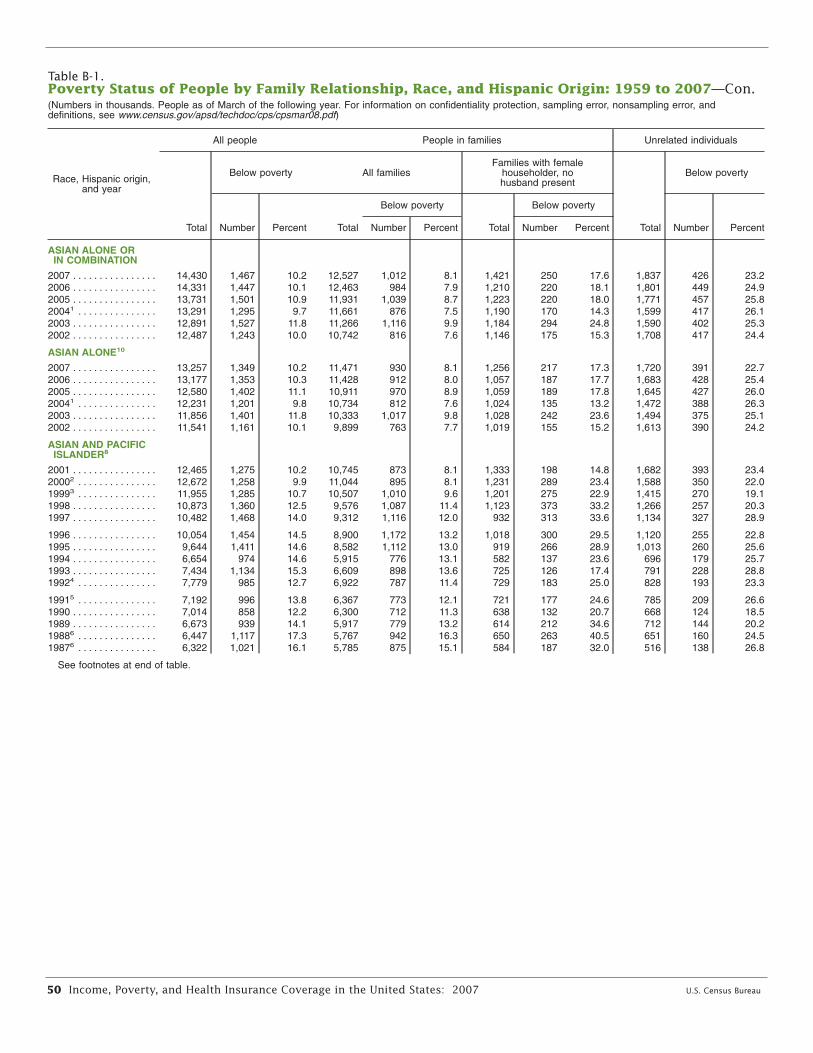
50 Income, Poverty, and Health Insurance Coverage in the United States: 2007 U.S. Census Bureau
Table B-1.Poverty Status of People by Family Relationship, Race, and Hispanic Origin: 1959 to 2007—Con.(Numbers in thousands. People as of March of the following year. For information on confidentiality protection, sampling error, nonsampling error, anddefinitions, see www.census.gov/apsd/techdoc/cps/cpsmar08.pdf)
Race, Hispanic origin,and year
All people People in families Unrelated individuals
Total
Below poverty All familiesFamilies with female
householder, nohusband present
Total
Below poverty
Number Percent Total
Below poverty
Total
Below poverty
Number PercentNumber Percent Number Percent
ASIAN ALONE ORIN COMBINATION
2007 . . . . . . . . . . . . . . . . 14,430 1,467 10.2 12,527 1,012 8.1 1,421 250 17.6 1,837 426 23.22006 . . . . . . . . . . . . . . . . 14,331 1,447 10.1 12,463 984 7.9 1,210 220 18.1 1,801 449 24.92005 . . . . . . . . . . . . . . . . 13,731 1,501 10.9 11,931 1,039 8.7 1,223 220 18.0 1,771 457 25.820041 . . . . . . . . . . . . . . . 13,291 1,295 9.7 11,661 876 7.5 1,190 170 14.3 1,599 417 26.12003 . . . . . . . . . . . . . . . . 12,891 1,527 11.8 11,266 1,116 9.9 1,184 294 24.8 1,590 402 25.32002 . . . . . . . . . . . . . . . .
ASIAN ALONE10
12,487 1,243 10.0 10,742 816 7.6 1,146 175 15.3 1,708 417 24.4
2007 . . . . . . . . . . . . . . . . 13,257 1,349 10.2 11,471 930 8.1 1,256 217 17.3 1,720 391 22.72006 . . . . . . . . . . . . . . . . 13,177 1,353 10.3 11,428 912 8.0 1,057 187 17.7 1,683 428 25.42005 . . . . . . . . . . . . . . . . 12,580 1,402 11.1 10,911 970 8.9 1,059 189 17.8 1,645 427 26.020041 . . . . . . . . . . . . . . . 12,231 1,201 9.8 10,734 812 7.6 1,024 135 13.2 1,472 388 26.32003 . . . . . . . . . . . . . . . . 11,856 1,401 11.8 10,333 1,017 9.8 1,028 242 23.6 1,494 375 25.12002 . . . . . . . . . . . . . . . .
ASIAN AND PACIFICISLANDER8
11,541 1,161 10.1 9,899 763 7.7 1,019 155 15.2 1,613 390 24.2
2001 . . . . . . . . . . . . . . . . 12,465 1,275 10.2 10,745 873 8.1 1,333 198 14.8 1,682 393 23.420002 . . . . . . . . . . . . . . . 12,672 1,258 9.9 11,044 895 8.1 1,231 289 23.4 1,588 350 22.019993 . . . . . . . . . . . . . . . 11,955 1,285 10.7 10,507 1,010 9.6 1,201 275 22.9 1,415 270 19.11998 . . . . . . . . . . . . . . . . 10,873 1,360 12.5 9,576 1,087 11.4 1,123 373 33.2 1,266 257 20.31997 . . . . . . . . . . . . . . . . 10,482 1,468 14.0 9,312 1,116 12.0 932 313 33.6 1,134 327 28.9
1996 . . . . . . . . . . . . . . . . 10,054 1,454 14.5 8,900 1,172 13.2 1,018 300 29.5 1,120 255 22.81995 . . . . . . . . . . . . . . . . 9,644 1,411 14.6 8,582 1,112 13.0 919 266 28.9 1,013 260 25.61994 . . . . . . . . . . . . . . . . 6,654 974 14.6 5,915 776 13.1 582 137 23.6 696 179 25.71993 . . . . . . . . . . . . . . . . 7,434 1,134 15.3 6,609 898 13.6 725 126 17.4 791 228 28.819924 . . . . . . . . . . . . . . . 7,779 985 12.7 6,922 787 11.4 729 183 25.0 828 193 23.3
19915 . . . . . . . . . . . . . . . 7,192 996 13.8 6,367 773 12.1 721 177 24.6 785 209 26.61990 . . . . . . . . . . . . . . . . 7,014 858 12.2 6,300 712 11.3 638 132 20.7 668 124 18.51989 . . . . . . . . . . . . . . . . 6,673 939 14.1 5,917 779 13.2 614 212 34.6 712 144 20.219886 . . . . . . . . . . . . . . . 6,447 1,117 17.3 5,767 942 16.3 650 263 40.5 651 160 24.519876 . . . . . . . . . . . . . . . 6,322 1,021 16.1 5,785 875 15.1 584 187 32.0 516 138 26.8
See footnotes at end of table.
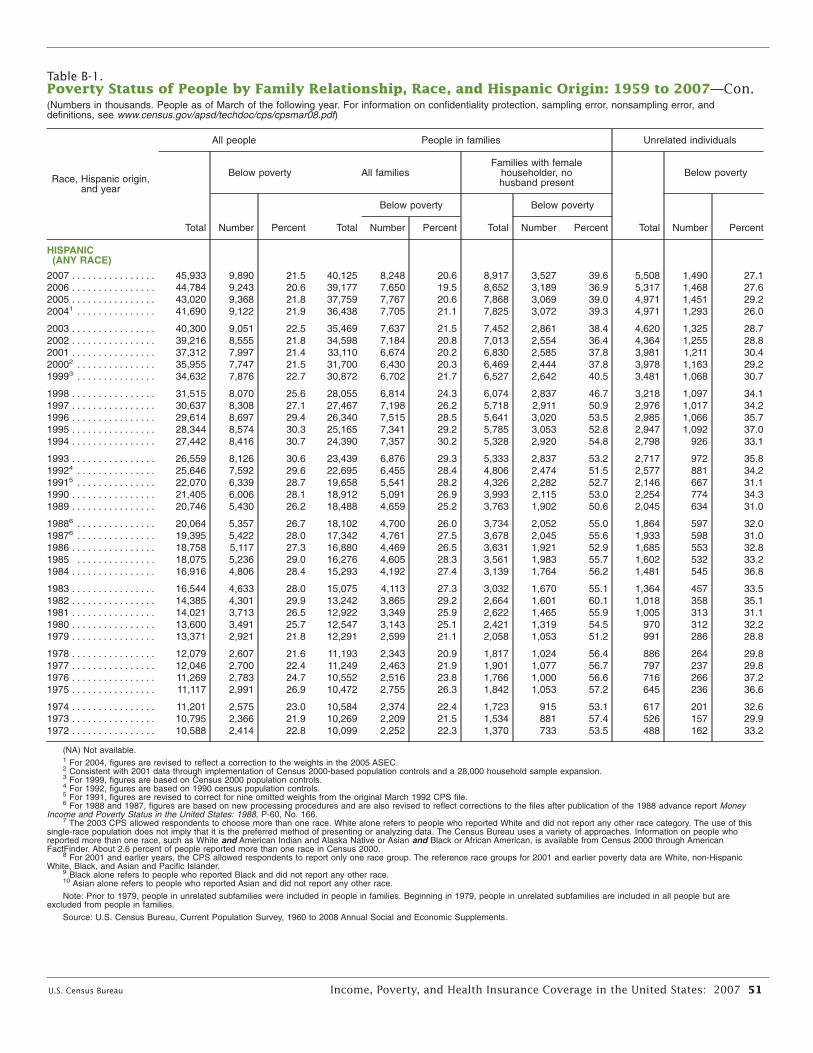
U.S. Census Bureau Income, Poverty, and Health Insurance Coverage in the United States: 2007 51
Table B-1.Poverty Status of People by Family Relationship, Race, and Hispanic Origin: 1959 to 2007—Con.(Numbers in thousands. People as of March of the following year. For information on confidentiality protection, sampling error, nonsampling error, anddefinitions, see www.census.gov/apsd/techdoc/cps/cpsmar08.pdf)
Race, Hispanic origin,and year
All people People in families Unrelated individuals
Total
Below poverty All familiesFamilies with female
householder, nohusband present
Total
Below poverty
Number Percent Total
Below poverty
Total
Below poverty
Number PercentNumber Percent Number Percent
HISPANIC(ANY RACE)
2007 . . . . . . . . . . . . . . . . 45,933 9,890 21.5 40,125 8,248 20.6 8,917 3,527 39.6 5,508 1,490 27.12006 . . . . . . . . . . . . . . . . 44,784 9,243 20.6 39,177 7,650 19.5 8,652 3,189 36.9 5,317 1,468 27.62005 . . . . . . . . . . . . . . . . 43,020 9,368 21.8 37,759 7,767 20.6 7,868 3,069 39.0 4,971 1,451 29.220041 . . . . . . . . . . . . . . . 41,690 9,122 21.9 36,438 7,705 21.1 7,825 3,072 39.3 4,971 1,293 26.0
2003 . . . . . . . . . . . . . . . . 40,300 9,051 22.5 35,469 7,637 21.5 7,452 2,861 38.4 4,620 1,325 28.72002 . . . . . . . . . . . . . . . . 39,216 8,555 21.8 34,598 7,184 20.8 7,013 2,554 36.4 4,364 1,255 28.82001 . . . . . . . . . . . . . . . . 37,312 7,997 21.4 33,110 6,674 20.2 6,830 2,585 37.8 3,981 1,211 30.420002 . . . . . . . . . . . . . . . 35,955 7,747 21.5 31,700 6,430 20.3 6,469 2,444 37.8 3,978 1,163 29.219993 . . . . . . . . . . . . . . . 34,632 7,876 22.7 30,872 6,702 21.7 6,527 2,642 40.5 3,481 1,068 30.7
1998 . . . . . . . . . . . . . . . . 31,515 8,070 25.6 28,055 6,814 24.3 6,074 2,837 46.7 3,218 1,097 34.11997 . . . . . . . . . . . . . . . . 30,637 8,308 27.1 27,467 7,198 26.2 5,718 2,911 50.9 2,976 1,017 34.21996 . . . . . . . . . . . . . . . . 29,614 8,697 29.4 26,340 7,515 28.5 5,641 3,020 53.5 2,985 1,066 35.71995 . . . . . . . . . . . . . . . . 28,344 8,574 30.3 25,165 7,341 29.2 5,785 3,053 52.8 2,947 1,092 37.01994 . . . . . . . . . . . . . . . . 27,442 8,416 30.7 24,390 7,357 30.2 5,328 2,920 54.8 2,798 926 33.1
1993 . . . . . . . . . . . . . . . . 26,559 8,126 30.6 23,439 6,876 29.3 5,333 2,837 53.2 2,717 972 35.819924 . . . . . . . . . . . . . . . 25,646 7,592 29.6 22,695 6,455 28.4 4,806 2,474 51.5 2,577 881 34.219915 . . . . . . . . . . . . . . . 22,070 6,339 28.7 19,658 5,541 28.2 4,326 2,282 52.7 2,146 667 31.11990 . . . . . . . . . . . . . . . . 21,405 6,006 28.1 18,912 5,091 26.9 3,993 2,115 53.0 2,254 774 34.31989 . . . . . . . . . . . . . . . . 20,746 5,430 26.2 18,488 4,659 25.2 3,763 1,902 50.6 2,045 634 31.0
19886 . . . . . . . . . . . . . . . 20,064 5,357 26.7 18,102 4,700 26.0 3,734 2,052 55.0 1,864 597 32.019876 . . . . . . . . . . . . . . . 19,395 5,422 28.0 17,342 4,761 27.5 3,678 2,045 55.6 1,933 598 31.01986 . . . . . . . . . . . . . . . . 18,758 5,117 27.3 16,880 4,469 26.5 3,631 1,921 52.9 1,685 553 32.81985 . . . . . . . . . . . . . . . 18,075 5,236 29.0 16,276 4,605 28.3 3,561 1,983 55.7 1,602 532 33.21984 . . . . . . . . . . . . . . . . 16,916 4,806 28.4 15,293 4,192 27.4 3,139 1,764 56.2 1,481 545 36.8
1983 . . . . . . . . . . . . . . . . 16,544 4,633 28.0 15,075 4,113 27.3 3,032 1,670 55.1 1,364 457 33.51982 . . . . . . . . . . . . . . . . 14,385 4,301 29.9 13,242 3,865 29.2 2,664 1,601 60.1 1,018 358 35.11981 . . . . . . . . . . . . . . . . 14,021 3,713 26.5 12,922 3,349 25.9 2,622 1,465 55.9 1,005 313 31.11980 . . . . . . . . . . . . . . . . 13,600 3,491 25.7 12,547 3,143 25.1 2,421 1,319 54.5 970 312 32.21979 . . . . . . . . . . . . . . . . 13,371 2,921 21.8 12,291 2,599 21.1 2,058 1,053 51.2 991 286 28.8
1978 . . . . . . . . . . . . . . . . 12,079 2,607 21.6 11,193 2,343 20.9 1,817 1,024 56.4 886 264 29.81977 . . . . . . . . . . . . . . . . 12,046 2,700 22.4 11,249 2,463 21.9 1,901 1,077 56.7 797 237 29.81976 . . . . . . . . . . . . . . . . 11,269 2,783 24.7 10,552 2,516 23.8 1,766 1,000 56.6 716 266 37.21975 . . . . . . . . . . . . . . . . 11,117 2,991 26.9 10,472 2,755 26.3 1,842 1,053 57.2 645 236 36.6
1974 . . . . . . . . . . . . . . . . 11,201 2,575 23.0 10,584 2,374 22.4 1,723 915 53.1 617 201 32.61973 . . . . . . . . . . . . . . . . 10,795 2,366 21.9 10,269 2,209 21.5 1,534 881 57.4 526 157 29.91972 . . . . . . . . . . . . . . . . 10,588 2,414 22.8 10,099 2,252 22.3 1,370 733 53.5 488 162 33.2
(NA) Not available.1 For 2004, figures are revised to reflect a correction to the weights in the 2005 ASEC.2 Consistent with 2001 data through implementation of Census 2000-based population controls and a 28,000 household sample expansion.3 For 1999, figures are based on Census 2000 population controls.4 For 1992, figures are based on 1990 census population controls.5 For 1991, figures are revised to correct for nine omitted weights from the original March 1992 CPS file.6 For 1988 and 1987, figures are based on new processing procedures and are also revised to reflect corrections to the files after publication of the 1988 advance report Money
Income and Poverty Status in the United States: 1988, P-60, No. 166.7 The 2003 CPS allowed respondents to choose more than one race. White alone refers to people who reported White and did not report any other race category. The use of this
single-race population does not imply that it is the preferred method of presenting or analyzing data. The Census Bureau uses a variety of approaches. Information on people whoreported more than one race, such as White and American Indian and Alaska Native or Asian and Black or African American, is available from Census 2000 through AmericanFactFinder. About 2.6 percent of people reported more than one race in Census 2000.
8 For 2001 and earlier years, the CPS allowed respondents to report only one race group. The reference race groups for 2001 and earlier poverty data are White, non-HispanicWhite, Black, and Asian and Pacific Islander.
9 Black alone refers to people who reported Black and did not report any other race.10 Asian alone refers to people who reported Asian and did not report any other race.
Note: Prior to 1979, people in unrelated subfamilies were included in people in families. Beginning in 1979, people in unrelated subfamilies are included in all people but areexcluded from people in families.
Source: U.S. Census Bureau, Current Population Survey, 1960 to 2008 Annual Social and Economic Supplements.
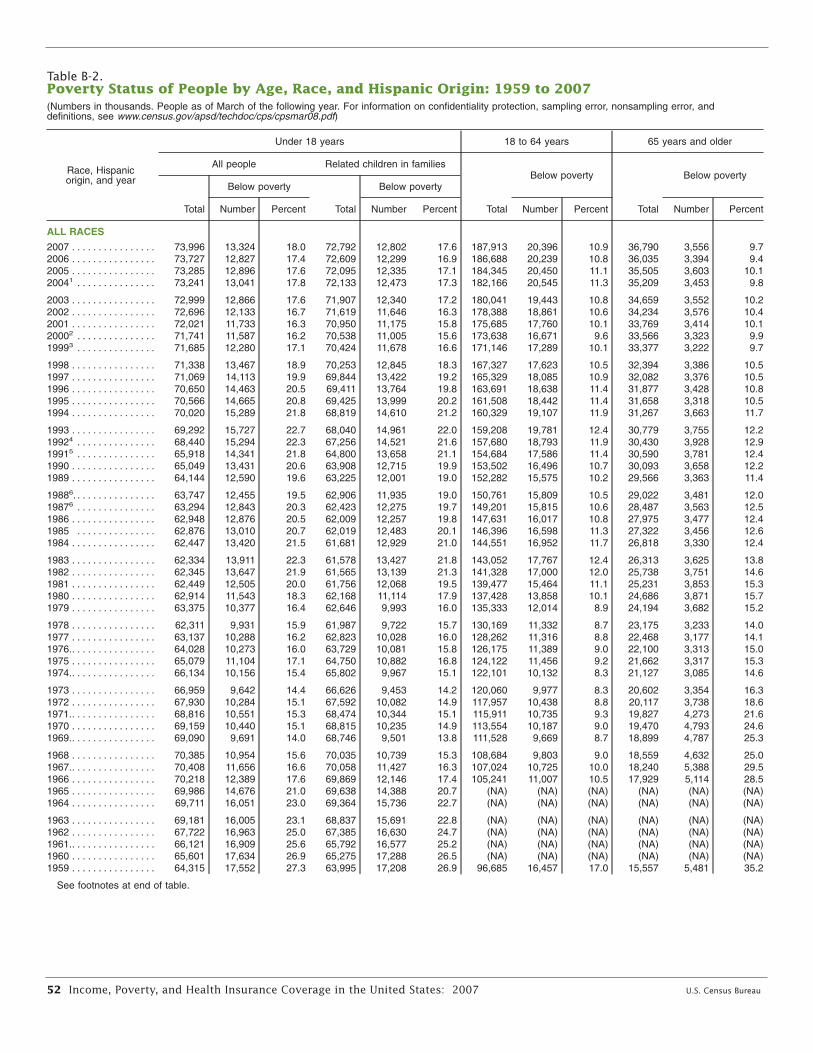
52 Income, Poverty, and Health Insurance Coverage in the United States: 2007 U.S. Census Bureau
Table B-2.Poverty Status of People by Age, Race, and Hispanic Origin: 1959 to 2007(Numbers in thousands. People as of March of the following year. For information on confidentiality protection, sampling error, nonsampling error, anddefinitions, see www.census.gov/apsd/techdoc/cps/cpsmar08.pdf)
Race, Hispanicorigin, and year
Under 18 years 18 to 64 years 65 years and older
All people Related children in families
Total
Below poverty
Total
Below poverty
Total
Below poverty
Total
Below poverty
Number Percent Number Percent Number Percent Number Percent
ALL RACES
2007 . . . . . . . . . . . . . . . . 73,996 13,324 18.0 72,792 12,802 17.6 187,913 20,396 10.9 36,790 3,556 9.72006 . . . . . . . . . . . . . . . . 73,727 12,827 17.4 72,609 12,299 16.9 186,688 20,239 10.8 36,035 3,394 9.42005 . . . . . . . . . . . . . . . . 73,285 12,896 17.6 72,095 12,335 17.1 184,345 20,450 11.1 35,505 3,603 10.120041 . . . . . . . . . . . . . . . 73,241 13,041 17.8 72,133 12,473 17.3 182,166 20,545 11.3 35,209 3,453 9.8
2003 . . . . . . . . . . . . . . . . 72,999 12,866 17.6 71,907 12,340 17.2 180,041 19,443 10.8 34,659 3,552 10.22002 . . . . . . . . . . . . . . . . 72,696 12,133 16.7 71,619 11,646 16.3 178,388 18,861 10.6 34,234 3,576 10.42001 . . . . . . . . . . . . . . . . 72,021 11,733 16.3 70,950 11,175 15.8 175,685 17,760 10.1 33,769 3,414 10.120002 . . . . . . . . . . . . . . . 71,741 11,587 16.2 70,538 11,005 15.6 173,638 16,671 9.6 33,566 3,323 9.919993 . . . . . . . . . . . . . . . 71,685 12,280 17.1 70,424 11,678 16.6 171,146 17,289 10.1 33,377 3,222 9.7
1998 . . . . . . . . . . . . . . . . 71,338 13,467 18.9 70,253 12,845 18.3 167,327 17,623 10.5 32,394 3,386 10.51997 . . . . . . . . . . . . . . . . 71,069 14,113 19.9 69,844 13,422 19.2 165,329 18,085 10.9 32,082 3,376 10.51996 . . . . . . . . . . . . . . . . 70,650 14,463 20.5 69,411 13,764 19.8 163,691 18,638 11.4 31,877 3,428 10.81995 . . . . . . . . . . . . . . . . 70,566 14,665 20.8 69,425 13,999 20.2 161,508 18,442 11.4 31,658 3,318 10.51994 . . . . . . . . . . . . . . . . 70,020 15,289 21.8 68,819 14,610 21.2 160,329 19,107 11.9 31,267 3,663 11.7
1993 . . . . . . . . . . . . . . . . 69,292 15,727 22.7 68,040 14,961 22.0 159,208 19,781 12.4 30,779 3,755 12.219924 . . . . . . . . . . . . . . . 68,440 15,294 22.3 67,256 14,521 21.6 157,680 18,793 11.9 30,430 3,928 12.919915 . . . . . . . . . . . . . . . 65,918 14,341 21.8 64,800 13,658 21.1 154,684 17,586 11.4 30,590 3,781 12.41990 . . . . . . . . . . . . . . . . 65,049 13,431 20.6 63,908 12,715 19.9 153,502 16,496 10.7 30,093 3,658 12.21989 . . . . . . . . . . . . . . . . 64,144 12,590 19.6 63,225 12,001 19.0 152,282 15,575 10.2 29,566 3,363 11.4
19886. . . . . . . . . . . . . . . . 63,747 12,455 19.5 62,906 11,935 19.0 150,761 15,809 10.5 29,022 3,481 12.019876 . . . . . . . . . . . . . . . 63,294 12,843 20.3 62,423 12,275 19.7 149,201 15,815 10.6 28,487 3,563 12.51986 . . . . . . . . . . . . . . . . 62,948 12,876 20.5 62,009 12,257 19.8 147,631 16,017 10.8 27,975 3,477 12.41985 . . . . . . . . . . . . . . . 62,876 13,010 20.7 62,019 12,483 20.1 146,396 16,598 11.3 27,322 3,456 12.61984 . . . . . . . . . . . . . . . . 62,447 13,420 21.5 61,681 12,929 21.0 144,551 16,952 11.7 26,818 3,330 12.4
1983 . . . . . . . . . . . . . . . . 62,334 13,911 22.3 61,578 13,427 21.8 143,052 17,767 12.4 26,313 3,625 13.81982 . . . . . . . . . . . . . . . . 62,345 13,647 21.9 61,565 13,139 21.3 141,328 17,000 12.0 25,738 3,751 14.61981 . . . . . . . . . . . . . . . . 62,449 12,505 20.0 61,756 12,068 19.5 139,477 15,464 11.1 25,231 3,853 15.31980 . . . . . . . . . . . . . . . . 62,914 11,543 18.3 62,168 11,114 17.9 137,428 13,858 10.1 24,686 3,871 15.71979 . . . . . . . . . . . . . . . . 63,375 10,377 16.4 62,646 9,993 16.0 135,333 12,014 8.9 24,194 3,682 15.2
1978 . . . . . . . . . . . . . . . . 62,311 9,931 15.9 61,987 9,722 15.7 130,169 11,332 8.7 23,175 3,233 14.01977 . . . . . . . . . . . . . . . . 63,137 10,288 16.2 62,823 10,028 16.0 128,262 11,316 8.8 22,468 3,177 14.11976.. . . . . . . . . . . . . . . . 64,028 10,273 16.0 63,729 10,081 15.8 126,175 11,389 9.0 22,100 3,313 15.01975 . . . . . . . . . . . . . . . . 65,079 11,104 17.1 64,750 10,882 16.8 124,122 11,456 9.2 21,662 3,317 15.31974.. . . . . . . . . . . . . . . . 66,134 10,156 15.4 65,802 9,967 15.1 122,101 10,132 8.3 21,127 3,085 14.6
1973 . . . . . . . . . . . . . . . . 66,959 9,642 14.4 66,626 9,453 14.2 120,060 9,977 8.3 20,602 3,354 16.31972 . . . . . . . . . . . . . . . . 67,930 10,284 15.1 67,592 10,082 14.9 117,957 10,438 8.8 20,117 3,738 18.61971.. . . . . . . . . . . . . . . . 68,816 10,551 15.3 68,474 10,344 15.1 115,911 10,735 9.3 19,827 4,273 21.61970 . . . . . . . . . . . . . . . . 69,159 10,440 15.1 68,815 10,235 14.9 113,554 10,187 9.0 19,470 4,793 24.61969.. . . . . . . . . . . . . . . . 69,090 9,691 14.0 68,746 9,501 13.8 111,528 9,669 8.7 18,899 4,787 25.3
1968 . . . . . . . . . . . . . . . . 70,385 10,954 15.6 70,035 10,739 15.3 108,684 9,803 9.0 18,559 4,632 25.01967.. . . . . . . . . . . . . . . . 70,408 11,656 16.6 70,058 11,427 16.3 107,024 10,725 10.0 18,240 5,388 29.51966 . . . . . . . . . . . . . . . . 70,218 12,389 17.6 69,869 12,146 17.4 105,241 11,007 10.5 17,929 5,114 28.51965 . . . . . . . . . . . . . . . . 69,986 14,676 21.0 69,638 14,388 20.7 (NA) (NA) (NA) (NA) (NA) (NA)1964 . . . . . . . . . . . . . . . . 69,711 16,051 23.0 69,364 15,736 22.7 (NA) (NA) (NA) (NA) (NA) (NA)
1963 . . . . . . . . . . . . . . . . 69,181 16,005 23.1 68,837 15,691 22.8 (NA) (NA) (NA) (NA) (NA) (NA)1962 . . . . . . . . . . . . . . . . 67,722 16,963 25.0 67,385 16,630 24.7 (NA) (NA) (NA) (NA) (NA) (NA)1961.. . . . . . . . . . . . . . . . 66,121 16,909 25.6 65,792 16,577 25.2 (NA) (NA) (NA) (NA) (NA) (NA)1960 . . . . . . . . . . . . . . . . 65,601 17,634 26.9 65,275 17,288 26.5 (NA) (NA) (NA) (NA) (NA) (NA)1959 . . . . . . . . . . . . . . . . 64,315 17,552 27.3 63,995 17,208 26.9 96,685 16,457 17.0 15,557 5,481 35.2
See footnotes at end of table.
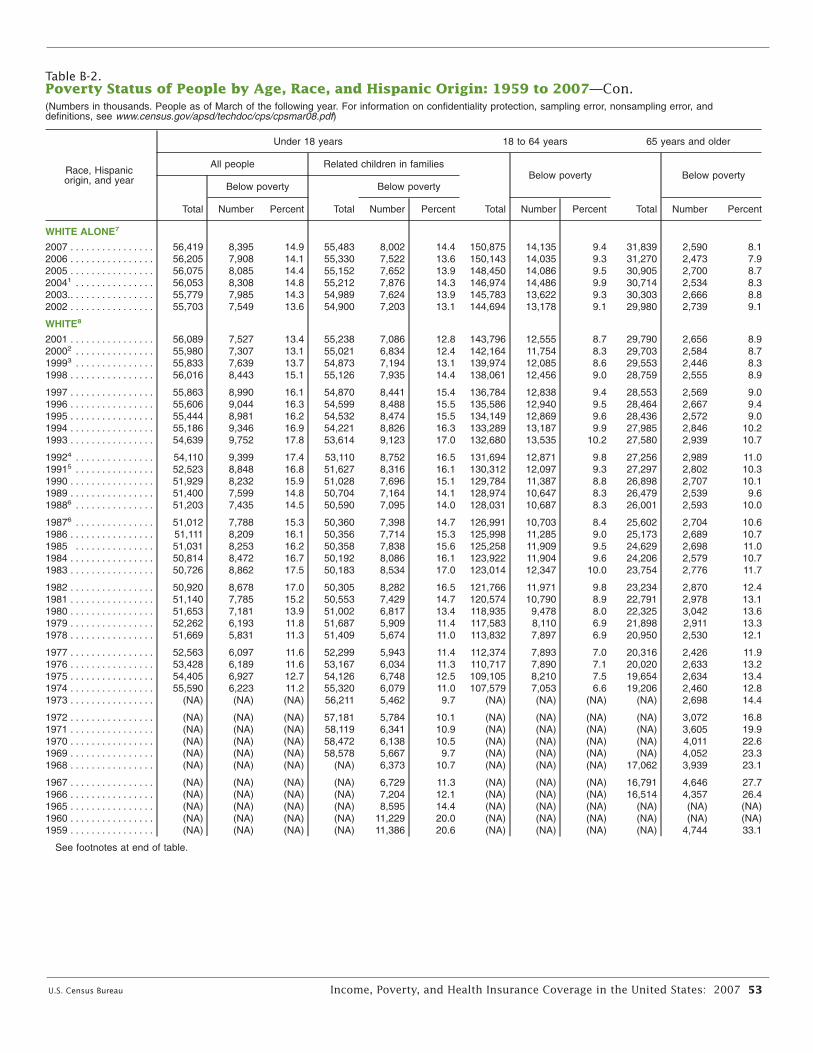
U.S. Census Bureau Income, Poverty, and Health Insurance Coverage in the United States: 2007 53
Table B-2.Poverty Status of People by Age, Race, and Hispanic Origin: 1959 to 2007—Con.(Numbers in thousands. People as of March of the following year. For information on confidentiality protection, sampling error, nonsampling error, anddefinitions, see www.census.gov/apsd/techdoc/cps/cpsmar08.pdf)
Race, Hispanicorigin, and year
Under 18 years 18 to 64 years 65 years and older
All people Related children in families
Total
Below poverty
Total
Below poverty
Total
Below poverty
Total
Below poverty
Number Percent Number Percent Number Percent Number Percent
WHITE ALONE7
2007 . . . . . . . . . . . . . . . . 56,419 8,395 14.9 55,483 8,002 14.4 150,875 14,135 9.4 31,839 2,590 8.12006 . . . . . . . . . . . . . . . . 56,205 7,908 14.1 55,330 7,522 13.6 150,143 14,035 9.3 31,270 2,473 7.92005 . . . . . . . . . . . . . . . . 56,075 8,085 14.4 55,152 7,652 13.9 148,450 14,086 9.5 30,905 2,700 8.720041 . . . . . . . . . . . . . . . 56,053 8,308 14.8 55,212 7,876 14.3 146,974 14,486 9.9 30,714 2,534 8.32003.. . . . . . . . . . . . . . . . 55,779 7,985 14.3 54,989 7,624 13.9 145,783 13,622 9.3 30,303 2,666 8.82002 . . . . . . . . . . . . . . . . 55,703 7,549 13.6 54,900 7,203 13.1 144,694 13,178 9.1 29,980 2,739 9.1
WHITE8
2001 . . . . . . . . . . . . . . . . 56,089 7,527 13.4 55,238 7,086 12.8 143,796 12,555 8.7 29,790 2,656 8.920002 . . . . . . . . . . . . . . . 55,980 7,307 13.1 55,021 6,834 12.4 142,164 11,754 8.3 29,703 2,584 8.719993 . . . . . . . . . . . . . . . 55,833 7,639 13.7 54,873 7,194 13.1 139,974 12,085 8.6 29,553 2,446 8.31998 . . . . . . . . . . . . . . . . 56,016 8,443 15.1 55,126 7,935 14.4 138,061 12,456 9.0 28,759 2,555 8.9
1997 . . . . . . . . . . . . . . . . 55,863 8,990 16.1 54,870 8,441 15.4 136,784 12,838 9.4 28,553 2,569 9.01996 . . . . . . . . . . . . . . . . 55,606 9,044 16.3 54,599 8,488 15.5 135,586 12,940 9.5 28,464 2,667 9.41995 . . . . . . . . . . . . . . . . 55,444 8,981 16.2 54,532 8,474 15.5 134,149 12,869 9.6 28,436 2,572 9.01994 . . . . . . . . . . . . . . . . 55,186 9,346 16.9 54,221 8,826 16.3 133,289 13,187 9.9 27,985 2,846 10.21993 . . . . . . . . . . . . . . . . 54,639 9,752 17.8 53,614 9,123 17.0 132,680 13,535 10.2 27,580 2,939 10.7
19924 . . . . . . . . . . . . . . . 54,110 9,399 17.4 53,110 8,752 16.5 131,694 12,871 9.8 27,256 2,989 11.019915 . . . . . . . . . . . . . . . 52,523 8,848 16.8 51,627 8,316 16.1 130,312 12,097 9.3 27,297 2,802 10.31990 . . . . . . . . . . . . . . . . 51,929 8,232 15.9 51,028 7,696 15.1 129,784 11,387 8.8 26,898 2,707 10.11989 . . . . . . . . . . . . . . . . 51,400 7,599 14.8 50,704 7,164 14.1 128,974 10,647 8.3 26,479 2,539 9.619886 . . . . . . . . . . . . . . . 51,203 7,435 14.5 50,590 7,095 14.0 128,031 10,687 8.3 26,001 2,593 10.0
19876 . . . . . . . . . . . . . . . 51,012 7,788 15.3 50,360 7,398 14.7 126,991 10,703 8.4 25,602 2,704 10.61986 . . . . . . . . . . . . . . . . 51,111 8,209 16.1 50,356 7,714 15.3 125,998 11,285 9.0 25,173 2,689 10.71985 . . . . . . . . . . . . . . . 51,031 8,253 16.2 50,358 7,838 15.6 125,258 11,909 9.5 24,629 2,698 11.01984 . . . . . . . . . . . . . . . . 50,814 8,472 16.7 50,192 8,086 16.1 123,922 11,904 9.6 24,206 2,579 10.71983 . . . . . . . . . . . . . . . . 50,726 8,862 17.5 50,183 8,534 17.0 123,014 12,347 10.0 23,754 2,776 11.7
1982 . . . . . . . . . . . . . . . . 50,920 8,678 17.0 50,305 8,282 16.5 121,766 11,971 9.8 23,234 2,870 12.41981 . . . . . . . . . . . . . . . . 51,140 7,785 15.2 50,553 7,429 14.7 120,574 10,790 8.9 22,791 2,978 13.11980 . . . . . . . . . . . . . . . . 51,653 7,181 13.9 51,002 6,817 13.4 118,935 9,478 8.0 22,325 3,042 13.61979 . . . . . . . . . . . . . . . . 52,262 6,193 11.8 51,687 5,909 11.4 117,583 8,110 6.9 21,898 2,911 13.31978 . . . . . . . . . . . . . . . . 51,669 5,831 11.3 51,409 5,674 11.0 113,832 7,897 6.9 20,950 2,530 12.1
1977 . . . . . . . . . . . . . . . . 52,563 6,097 11.6 52,299 5,943 11.4 112,374 7,893 7.0 20,316 2,426 11.91976 . . . . . . . . . . . . . . . . 53,428 6,189 11.6 53,167 6,034 11.3 110,717 7,890 7.1 20,020 2,633 13.21975 . . . . . . . . . . . . . . . . 54,405 6,927 12.7 54,126 6,748 12.5 109,105 8,210 7.5 19,654 2,634 13.41974 . . . . . . . . . . . . . . . . 55,590 6,223 11.2 55,320 6,079 11.0 107,579 7,053 6.6 19,206 2,460 12.81973 . . . . . . . . . . . . . . . . (NA) (NA) (NA) 56,211 5,462 9.7 (NA) (NA) (NA) (NA) 2,698 14.4
1972 . . . . . . . . . . . . . . . . (NA) (NA) (NA) 57,181 5,784 10.1 (NA) (NA) (NA) (NA) 3,072 16.81971 . . . . . . . . . . . . . . . . (NA) (NA) (NA) 58,119 6,341 10.9 (NA) (NA) (NA) (NA) 3,605 19.91970 . . . . . . . . . . . . . . . . (NA) (NA) (NA) 58,472 6,138 10.5 (NA) (NA) (NA) (NA) 4,011 22.61969 . . . . . . . . . . . . . . . . (NA) (NA) (NA) 58,578 5,667 9.7 (NA) (NA) (NA) (NA) 4,052 23.31968 . . . . . . . . . . . . . . . . (NA) (NA) (NA) (NA) 6,373 10.7 (NA) (NA) (NA) 17,062 3,939 23.1
1967 . . . . . . . . . . . . . . . . (NA) (NA) (NA) (NA) 6,729 11.3 (NA) (NA) (NA) 16,791 4,646 27.71966 . . . . . . . . . . . . . . . . (NA) (NA) (NA) (NA) 7,204 12.1 (NA) (NA) (NA) 16,514 4,357 26.41965 . . . . . . . . . . . . . . . . (NA) (NA) (NA) (NA) 8,595 14.4 (NA) (NA) (NA) (NA) (NA) (NA)1960 . . . . . . . . . . . . . . . . (NA) (NA) (NA) (NA) 11,229 20.0 (NA) (NA) (NA) (NA) (NA) (NA)1959 . . . . . . . . . . . . . . . . (NA) (NA) (NA) (NA) 11,386 20.6 (NA) (NA) (NA) (NA) 4,744 33.1
See footnotes at end of table.
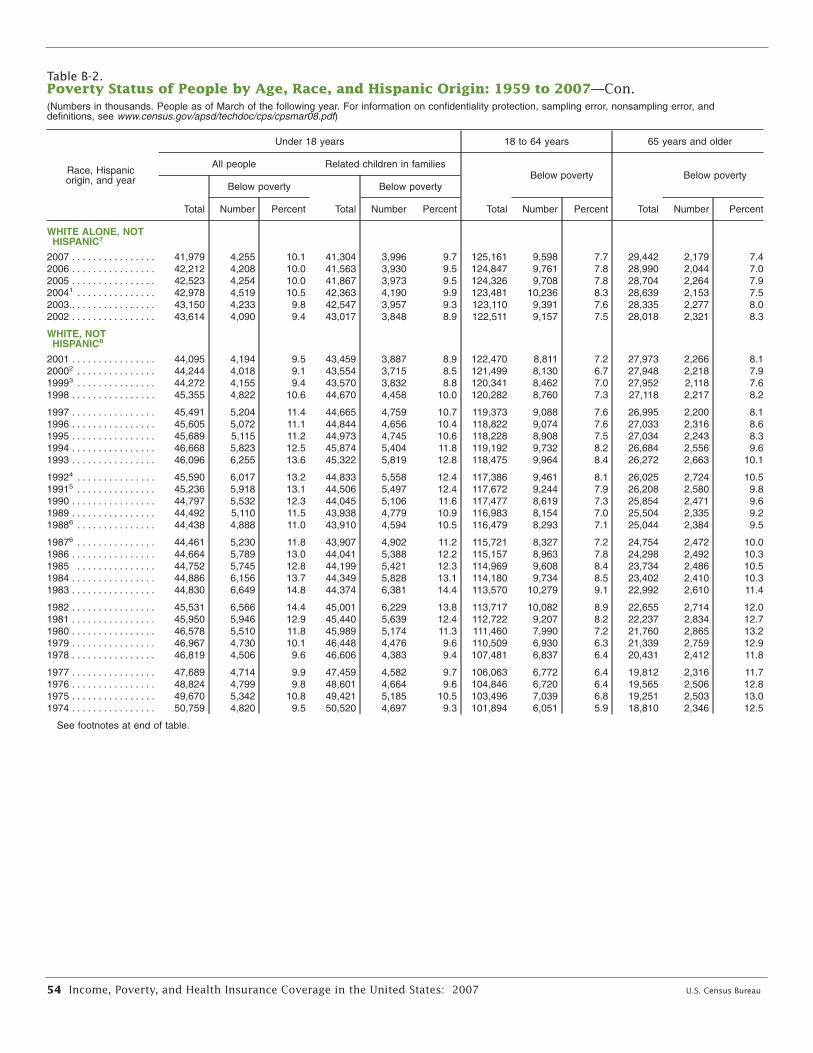
54 Income, Poverty, and Health Insurance Coverage in the United States: 2007 U.S. Census Bureau
Table B-2.Poverty Status of People by Age, Race, and Hispanic Origin: 1959 to 2007—Con.(Numbers in thousands. People as of March of the following year. For information on confidentiality protection, sampling error, nonsampling error, anddefinitions, see www.census.gov/apsd/techdoc/cps/cpsmar08.pdf)
Race, Hispanicorigin, and year
Under 18 years 18 to 64 years 65 years and older
All people Related children in families
Total
Below poverty
Total
Below poverty
Total
Below poverty
Total
Below poverty
Number Percent Number Percent Number Percent Number Percent
WHITE ALONE, NOTHISPANIC7
2007 . . . . . . . . . . . . . . . . 41,979 4,255 10.1 41,304 3,996 9.7 125,161 9,598 7.7 29,442 2,179 7.42006 . . . . . . . . . . . . . . . . 42,212 4,208 10.0 41,563 3,930 9.5 124,847 9,761 7.8 28,990 2,044 7.02005 . . . . . . . . . . . . . . . . 42,523 4,254 10.0 41,867 3,973 9.5 124,326 9,708 7.8 28,704 2,264 7.920041 . . . . . . . . . . . . . . . 42,978 4,519 10.5 42,363 4,190 9.9 123,481 10,236 8.3 28,639 2,153 7.52003.. . . . . . . . . . . . . . . . 43,150 4,233 9.8 42,547 3,957 9.3 123,110 9,391 7.6 28,335 2,277 8.02002 . . . . . . . . . . . . . . . .
WHITE, NOTHISPANIC8
43,614 4,090 9.4 43,017 3,848 8.9 122,511 9,157 7.5 28,018 2,321 8.3
2001 . . . . . . . . . . . . . . . . 44,095 4,194 9.5 43,459 3,887 8.9 122,470 8,811 7.2 27,973 2,266 8.120002 . . . . . . . . . . . . . . . 44,244 4,018 9.1 43,554 3,715 8.5 121,499 8,130 6.7 27,948 2,218 7.919993 . . . . . . . . . . . . . . . 44,272 4,155 9.4 43,570 3,832 8.8 120,341 8,462 7.0 27,952 2,118 7.61998 . . . . . . . . . . . . . . . . 45,355 4,822 10.6 44,670 4,458 10.0 120,282 8,760 7.3 27,118 2,217 8.2
1997 . . . . . . . . . . . . . . . . 45,491 5,204 11.4 44,665 4,759 10.7 119,373 9,088 7.6 26,995 2,200 8.11996 . . . . . . . . . . . . . . . . 45,605 5,072 11.1 44,844 4,656 10.4 118,822 9,074 7.6 27,033 2,316 8.61995 . . . . . . . . . . . . . . . . 45,689 5,115 11.2 44,973 4,745 10.6 118,228 8,908 7.5 27,034 2,243 8.31994 . . . . . . . . . . . . . . . . 46,668 5,823 12.5 45,874 5,404 11.8 119,192 9,732 8.2 26,684 2,556 9.61993 . . . . . . . . . . . . . . . . 46,096 6,255 13.6 45,322 5,819 12.8 118,475 9,964 8.4 26,272 2,663 10.1
19924 . . . . . . . . . . . . . . . 45,590 6,017 13.2 44,833 5,558 12.4 117,386 9,461 8.1 26,025 2,724 10.519915 . . . . . . . . . . . . . . . 45,236 5,918 13.1 44,506 5,497 12.4 117,672 9,244 7.9 26,208 2,580 9.81990 . . . . . . . . . . . . . . . . 44,797 5,532 12.3 44,045 5,106 11.6 117,477 8,619 7.3 25,854 2,471 9.61989 . . . . . . . . . . . . . . . . 44,492 5,110 11.5 43,938 4,779 10.9 116,983 8,154 7.0 25,504 2,335 9.219886 . . . . . . . . . . . . . . . 44,438 4,888 11.0 43,910 4,594 10.5 116,479 8,293 7.1 25,044 2,384 9.5
19876 . . . . . . . . . . . . . . . 44,461 5,230 11.8 43,907 4,902 11.2 115,721 8,327 7.2 24,754 2,472 10.01986 . . . . . . . . . . . . . . . . 44,664 5,789 13.0 44,041 5,388 12.2 115,157 8,963 7.8 24,298 2,492 10.31985 . . . . . . . . . . . . . . . 44,752 5,745 12.8 44,199 5,421 12.3 114,969 9,608 8.4 23,734 2,486 10.51984 . . . . . . . . . . . . . . . . 44,886 6,156 13.7 44,349 5,828 13.1 114,180 9,734 8.5 23,402 2,410 10.31983 . . . . . . . . . . . . . . . . 44,830 6,649 14.8 44,374 6,381 14.4 113,570 10,279 9.1 22,992 2,610 11.4
1982 . . . . . . . . . . . . . . . . 45,531 6,566 14.4 45,001 6,229 13.8 113,717 10,082 8.9 22,655 2,714 12.01981 . . . . . . . . . . . . . . . . 45,950 5,946 12.9 45,440 5,639 12.4 112,722 9,207 8.2 22,237 2,834 12.71980 . . . . . . . . . . . . . . . . 46,578 5,510 11.8 45,989 5,174 11.3 111,460 7,990 7.2 21,760 2,865 13.21979 . . . . . . . . . . . . . . . . 46,967 4,730 10.1 46,448 4,476 9.6 110,509 6,930 6.3 21,339 2,759 12.91978 . . . . . . . . . . . . . . . . 46,819 4,506 9.6 46,606 4,383 9.4 107,481 6,837 6.4 20,431 2,412 11.8
1977 . . . . . . . . . . . . . . . . 47,689 4,714 9.9 47,459 4,582 9.7 106,063 6,772 6.4 19,812 2,316 11.71976 . . . . . . . . . . . . . . . . 48,824 4,799 9.8 48,601 4,664 9.6 104,846 6,720 6.4 19,565 2,506 12.81975 . . . . . . . . . . . . . . . . 49,670 5,342 10.8 49,421 5,185 10.5 103,496 7,039 6.8 19,251 2,503 13.01974 . . . . . . . . . . . . . . . . 50,759 4,820 9.5 50,520 4,697 9.3 101,894 6,051 5.9 18,810 2,346 12.5
See footnotes at end of table.
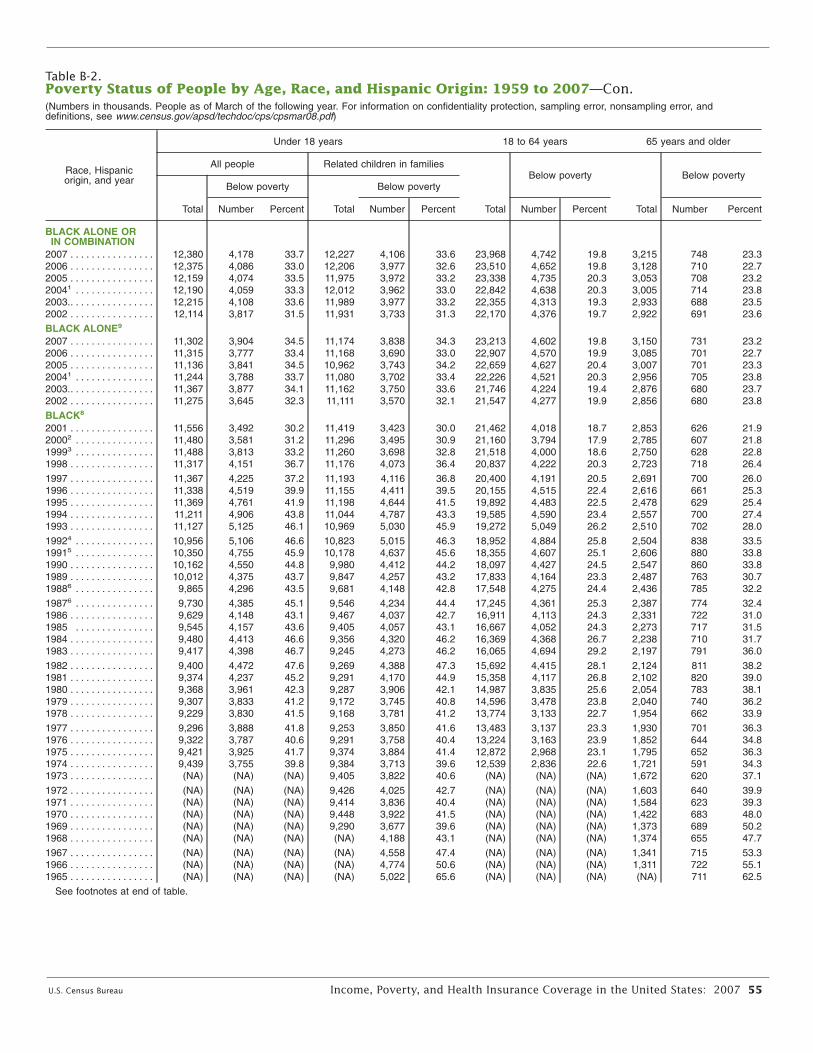
U.S. Census Bureau Income, Poverty, and Health Insurance Coverage in the United States: 2007 55
Table B-2.Poverty Status of People by Age, Race, and Hispanic Origin: 1959 to 2007—Con.(Numbers in thousands. People as of March of the following year. For information on confidentiality protection, sampling error, nonsampling error, anddefinitions, see www.census.gov/apsd/techdoc/cps/cpsmar08.pdf)
Race, Hispanicorigin, and year
Under 18 years 18 to 64 years 65 years and older
All people Related children in families
Total
Below poverty
Total
Below poverty
Total
Below poverty
Total
Below poverty
Number Percent Number Percent Number Percent Number Percent
BLACK ALONE ORIN COMBINATION
2007 . . . . . . . . . . . . . . . . 12,380 4,178 33.7 12,227 4,106 33.6 23,968 4,742 19.8 3,215 748 23.32006 . . . . . . . . . . . . . . . . 12,375 4,086 33.0 12,206 3,977 32.6 23,510 4,652 19.8 3,128 710 22.72005 . . . . . . . . . . . . . . . . 12,159 4,074 33.5 11,975 3,972 33.2 23,338 4,735 20.3 3,053 708 23.220041 . . . . . . . . . . . . . . . 12,190 4,059 33.3 12,012 3,962 33.0 22,842 4,638 20.3 3,005 714 23.82003.. . . . . . . . . . . . . . . . 12,215 4,108 33.6 11,989 3,977 33.2 22,355 4,313 19.3 2,933 688 23.52002 . . . . . . . . . . . . . . . .
BLACK ALONE9
12,114 3,817 31.5 11,931 3,733 31.3 22,170 4,376 19.7 2,922 691 23.6
2007 . . . . . . . . . . . . . . . . 11,302 3,904 34.5 11,174 3,838 34.3 23,213 4,602 19.8 3,150 731 23.22006 . . . . . . . . . . . . . . . . 11,315 3,777 33.4 11,168 3,690 33.0 22,907 4,570 19.9 3,085 701 22.72005 . . . . . . . . . . . . . . . . 11,136 3,841 34.5 10,962 3,743 34.2 22,659 4,627 20.4 3,007 701 23.320041 . . . . . . . . . . . . . . . 11,244 3,788 33.7 11,080 3,702 33.4 22,226 4,521 20.3 2,956 705 23.82003.. . . . . . . . . . . . . . . . 11,367 3,877 34.1 11,162 3,750 33.6 21,746 4,224 19.4 2,876 680 23.72002 . . . . . . . . . . . . . . . .
BLACK8
11,275 3,645 32.3 11,111 3,570 32.1 21,547 4,277 19.9 2,856 680 23.8
2001 . . . . . . . . . . . . . . . . 11,556 3,492 30.2 11,419 3,423 30.0 21,462 4,018 18.7 2,853 626 21.920002 . . . . . . . . . . . . . . . 11,480 3,581 31.2 11,296 3,495 30.9 21,160 3,794 17.9 2,785 607 21.819993 . . . . . . . . . . . . . . . 11,488 3,813 33.2 11,260 3,698 32.8 21,518 4,000 18.6 2,750 628 22.81998 . . . . . . . . . . . . . . . . 11,317 4,151 36.7 11,176 4,073 36.4 20,837 4,222 20.3 2,723 718 26.4
1997 . . . . . . . . . . . . . . . . 11,367 4,225 37.2 11,193 4,116 36.8 20,400 4,191 20.5 2,691 700 26.01996 . . . . . . . . . . . . . . . . 11,338 4,519 39.9 11,155 4,411 39.5 20,155 4,515 22.4 2,616 661 25.31995 . . . . . . . . . . . . . . . . 11,369 4,761 41.9 11,198 4,644 41.5 19,892 4,483 22.5 2,478 629 25.41994 . . . . . . . . . . . . . . . . 11,211 4,906 43.8 11,044 4,787 43.3 19,585 4,590 23.4 2,557 700 27.41993 . . . . . . . . . . . . . . . . 11,127 5,125 46.1 10,969 5,030 45.9 19,272 5,049 26.2 2,510 702 28.0
19924 . . . . . . . . . . . . . . . 10,956 5,106 46.6 10,823 5,015 46.3 18,952 4,884 25.8 2,504 838 33.519915 . . . . . . . . . . . . . . . 10,350 4,755 45.9 10,178 4,637 45.6 18,355 4,607 25.1 2,606 880 33.81990 . . . . . . . . . . . . . . . . 10,162 4,550 44.8 9,980 4,412 44.2 18,097 4,427 24.5 2,547 860 33.81989 . . . . . . . . . . . . . . . . 10,012 4,375 43.7 9,847 4,257 43.2 17,833 4,164 23.3 2,487 763 30.719886 . . . . . . . . . . . . . . . 9,865 4,296 43.5 9,681 4,148 42.8 17,548 4,275 24.4 2,436 785 32.2
19876 . . . . . . . . . . . . . . . 9,730 4,385 45.1 9,546 4,234 44.4 17,245 4,361 25.3 2,387 774 32.41986 . . . . . . . . . . . . . . . . 9,629 4,148 43.1 9,467 4,037 42.7 16,911 4,113 24.3 2,331 722 31.01985 . . . . . . . . . . . . . . . 9,545 4,157 43.6 9,405 4,057 43.1 16,667 4,052 24.3 2,273 717 31.51984 . . . . . . . . . . . . . . . . 9,480 4,413 46.6 9,356 4,320 46.2 16,369 4,368 26.7 2,238 710 31.71983 . . . . . . . . . . . . . . . . 9,417 4,398 46.7 9,245 4,273 46.2 16,065 4,694 29.2 2,197 791 36.0
1982 . . . . . . . . . . . . . . . . 9,400 4,472 47.6 9,269 4,388 47.3 15,692 4,415 28.1 2,124 811 38.21981 . . . . . . . . . . . . . . . . 9,374 4,237 45.2 9,291 4,170 44.9 15,358 4,117 26.8 2,102 820 39.01980 . . . . . . . . . . . . . . . . 9,368 3,961 42.3 9,287 3,906 42.1 14,987 3,835 25.6 2,054 783 38.11979 . . . . . . . . . . . . . . . . 9,307 3,833 41.2 9,172 3,745 40.8 14,596 3,478 23.8 2,040 740 36.21978 . . . . . . . . . . . . . . . . 9,229 3,830 41.5 9,168 3,781 41.2 13,774 3,133 22.7 1,954 662 33.9
1977 . . . . . . . . . . . . . . . . 9,296 3,888 41.8 9,253 3,850 41.6 13,483 3,137 23.3 1,930 701 36.31976 . . . . . . . . . . . . . . . . 9,322 3,787 40.6 9,291 3,758 40.4 13,224 3,163 23.9 1,852 644 34.81975 . . . . . . . . . . . . . . . . 9,421 3,925 41.7 9,374 3,884 41.4 12,872 2,968 23.1 1,795 652 36.31974 . . . . . . . . . . . . . . . . 9,439 3,755 39.8 9,384 3,713 39.6 12,539 2,836 22.6 1,721 591 34.31973 . . . . . . . . . . . . . . . . (NA) (NA) (NA) 9,405 3,822 40.6 (NA) (NA) (NA) 1,672 620 37.1
1972 . . . . . . . . . . . . . . . . (NA) (NA) (NA) 9,426 4,025 42.7 (NA) (NA) (NA) 1,603 640 39.91971 . . . . . . . . . . . . . . . . (NA) (NA) (NA) 9,414 3,836 40.4 (NA) (NA) (NA) 1,584 623 39.31970 . . . . . . . . . . . . . . . . (NA) (NA) (NA) 9,448 3,922 41.5 (NA) (NA) (NA) 1,422 683 48.01969 . . . . . . . . . . . . . . . . (NA) (NA) (NA) 9,290 3,677 39.6 (NA) (NA) (NA) 1,373 689 50.21968 . . . . . . . . . . . . . . . . (NA) (NA) (NA) (NA) 4,188 43.1 (NA) (NA) (NA) 1,374 655 47.7
1967 . . . . . . . . . . . . . . . . (NA) (NA) (NA) (NA) 4,558 47.4 (NA) (NA) (NA) 1,341 715 53.31966 . . . . . . . . . . . . . . . . (NA) (NA) (NA) (NA) 4,774 50.6 (NA) (NA) (NA) 1,311 722 55.11965 . . . . . . . . . . . . . . . .
See footnotes at end o
(NA)
f table.
(NA) (NA) (NA) 5,022 65.6 (NA) (NA) (NA) (NA) 711 62.5

56 Income, Poverty, and Health Insurance Coverage in the United States: 2007 U.S. Census Bureau
Table B-2.Poverty Status of People by Age, Race, and Hispanic Origin: 1959 to 2007—Con.(Numbers in thousands. People as of March of the following year. For information on confidentiality protection, sampling error, nonsampling error, anddefinitions, see www.census.gov/apsd/techdoc/cps/cpsmar08.pdf)
Race, Hispanicorigin, and year
Under 18 years 18 to 64 years 65 years and older
All people Related children in families
Total
Below poverty
Total
Below poverty
Total
Below poverty
Total
Below poverty
Number Percent Number Percent Number Percent Number Percent
ASIAN ALONE OR INCOMBINATION
2007 . . . . . . . . . . . . . . . . 3,606 431 11.9 3,558 402 11.3 9,531 892 9.4 1,293 144 11.22006 . . . . . . . . . . . . . . . . 3,573 408 11.4 3,530 398 11.3 9,553 897 9.4 1,205 142 11.82005 . . . . . . . . . . . . . . . . 3,472 359 10.3 3,435 352 10.2 9,115 999 11.0 1,144 144 12.620041 . . . . . . . . . . . . . . . 3,406 329 9.7 3,367 311 9.2 8,780 819 9.3 1,104 147 13.32003.. . . . . . . . . . . . . . . . 3,316 420 12.7 3,279 406 12.4 8,510 956 11.2 1,065 152 14.22002 . . . . . . . . . . . . . . . . 3,199 353 11.0 3,159 338 10.7 8,292 804 9.7 995 86 8.7
ASIAN ALONE10
2007 . . . . . . . . . . . . . . . . 2,980 374 12.5 2,932 345 11.8 9,012 832 9.2 1,265 143 11.32006 . . . . . . . . . . . . . . . . 2,956 360 12.2 2,915 351 12.0 9,039 851 9.4 1,182 142 12.02005 . . . . . . . . . . . . . . . . 2,871 317 11.1 2,842 312 11.0 8,591 941 11.0 1,118 143 12.820041 . . . . . . . . . . . . . . . 2,854 281 9.9 2,823 265 9.4 8,294 774 9.3 1,083 146 13.52003.. . . . . . . . . . . . . . . . 2,759 344 12.5 2,726 331 12.1 8,044 907 11.3 1,052 151 14.32002 . . . . . . . . . . . . . . . . 2,683 315 11.7 2,648 302 11.4 7,881 764 9.7 977 82 8.4
ASIAN AND PACIFICISLANDER8
2001 . . . . . . . . . . . . . . . . 3,215 369 11.5 3,169 353 11.1 8,352 814 9.7 899 92 10.220002 . . . . . . . . . . . . . . . 3,294 420 12.7 3,256 407 12.5 8,500 756 8.9 878 82 9.319993 . . . . . . . . . . . . . . . 3,212 381 11.9 3,178 367 11.5 7,879 807 10.2 864 96 11.11998 . . . . . . . . . . . . . . . . 3,137 564 18.0 3,099 542 17.5 6,951 698 10.0 785 97 12.41997 . . . . . . . . . . . . . . . . 3,096 628 20.3 3,061 608 19.9 6,680 753 11.3 705 87 12.3
1996 . . . . . . . . . . . . . . . . 2,924 571 19.5 2,899 553 19.1 6,484 821 12.7 647 63 9.71995 . . . . . . . . . . . . . . . . 2,900 564 19.5 2,858 532 18.6 6,123 757 12.4 622 89 14.31994 . . . . . . . . . . . . . . . . 1,739 318 18.3 1,719 308 17.9 4,401 589 13.4 513 67 13.01993 . . . . . . . . . . . . . . . . 2,061 375 18.2 2,029 358 17.6 4,871 680 14.0 503 79 15.619924 . . . . . . . . . . . . . . . 2,218 363 16.4 2,199 352 16.0 5,067 568 11.2 494 53 10.8
19915 . . . . . . . . . . . . . . . 2,056 360 17.5 2,036 348 17.1 4,582 565 12.3 555 70 12.71990 . . . . . . . . . . . . . . . . 2,126 374 17.6 2,098 356 17.0 4,375 422 9.6 514 62 12.11989 . . . . . . . . . . . . . . . . 1,983 392 19.8 1,945 368 18.9 4,225 512 12.1 465 34 7.419886 . . . . . . . . . . . . . . . 1,970 474 24.1 1,949 458 23.5 4,035 583 14.4 442 60 13.519876 . . . . . . . . . . . . . . . 1,937 455 23.5 1,908 432 22.7 4,010 510 12.7 375 56 15.0
See footnotes at end of table.
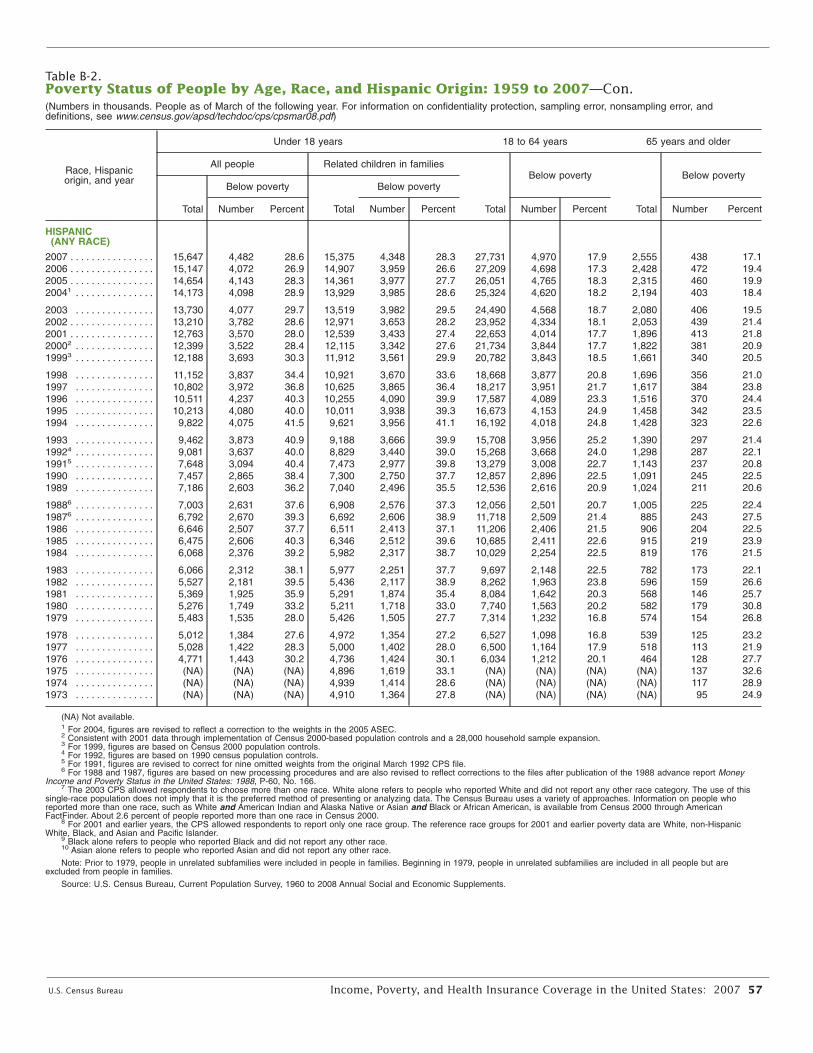
U.S. Census Bureau Income, Poverty, and Health Insurance Coverage in the United States: 2007 57
Table B-2.Poverty Status of People by Age, Race, and Hispanic Origin: 1959 to 2007—Con.(Numbers in thousands. People as of March of the following year. For information on confidentiality protection, sampling error, nonsampling error, anddefinitions, see www.census.gov/apsd/techdoc/cps/cpsmar08.pdf)
Race, Hispanicorigin, and year
Under 18 years 18 to 64 years 65 years and older
All people Related children in families
Total
Below poverty
Total
Below poverty
Total
15,64715,14714,65414,173
13,73013,21012,76312,39912,188
11,15210,80210,51110,2139,822
9,4629,0817,6487,4577,186
7,0036,7926,6466,4756,068
6,0665,5275,3695,2765,483
5,0125,0284,771(NA)(NA)(NA)
Below poverty
Total
15,37514,90714,36113,929
13,51912,97112,53912,11511,912
10,92110,62510,25510,0119,621
9,1888,8297,4737,3007,040
6,9086,6926,5116,3465,982
5,9775,4365,2915,2115,426
4,9725,0004,7364,8964,9394,910
Below poverty
Number
4,4824,0724,1434,098
4,0773,7823,5703,5223,693
3,8373,9724,2374,0804,075
3,8733,6373,0942,8652,603
2,6312,6702,5072,6062,376
2,3122,1811,9251,7491,535
1,3841,4221,443(NA)(NA)(NA)
Percent
28.626.928.328.9
29.728.628.028.430.3
34.436.840.340.041.5
40.940.040.438.436.2
37.639.337.740.339.2
38.139.535.933.228.0
27.628.330.2(NA)(NA)(NA)
Number
4,3483,9593,9773,985
3,9823,6533,4333,3423,561
3,6703,8654,0903,9383,956
3,6663,4402,9772,7502,496
2,5762,6062,4132,5122,317
2,2512,1171,8741,7181,505
1,3541,4021,4241,6191,4141,364
Percent
28.326.627.728.6
29.528.227.427.629.9
33.636.439.939.341.1
39.939.039.837.735.5
37.338.937.139.638.7
37.738.935.433.027.7
27.228.030.133.128.627.8
Number Percent Number Percent
HISPANIC(ANY RACE)
2007 . . . . . . . . . . . . . . . .2006 . . . . . . . . . . . . . . . .2005 . . . . . . . . . . . . . . . .20041 . . . . . . . . . . . . . . .
2003 . . . . . . . . . . . . . . .2002 . . . . . . . . . . . . . . . .2001 . . . . . . . . . . . . . . . .20002 . . . . . . . . . . . . . . .19993 . . . . . . . . . . . . . . .
1998 . . . . . . . . . . . . . . .1997 . . . . . . . . . . . . . . .1996 . . . . . . . . . . . . . . .1995 . . . . . . . . . . . . . . .1994 . . . . . . . . . . . . . . .
1993 . . . . . . . . . . . . . . .19924 . . . . . . . . . . . . . . .19915 . . . . . . . . . . . . . . .1990 . . . . . . . . . . . . . . .1989 . . . . . . . . . . . . . . .
19886 . . . . . . . . . . . . . . .19876 . . . . . . . . . . . . . . .1986 . . . . . . . . . . . . . . .1985 . . . . . . . . . . . . . . .1984 . . . . . . . . . . . . . . .
1983 . . . . . . . . . . . . . . .1982 . . . . . . . . . . . . . . .1981 . . . . . . . . . . . . . . .1980 . . . . . . . . . . . . . . .1979 . . . . . . . . . . . . . . .
1978 . . . . . . . . . . . . . . .1977 . . . . . . . . . . . . . . .1976 . . . . . . . . . . . . . . .1975 . . . . . . . . . . . . . . .1974 . . . . . . . . . . . . . . .1973 . . . . . . . . . . . . . . .
27,73127,20926,05125,324
24,49023,95222,65321,73420,782
18,66818,21717,58716,67316,192
15,70815,26813,27912,85712,536
12,05611,71811,20610,68510,029
9,6978,2628,0847,7407,314
6,5276,5006,034(NA)(NA)(NA)
4,9704,6984,7654,620
4,5684,3344,0143,8443,843
3,8773,9514,0894,1534,018
3,9563,6683,0082,8962,616
2,5012,5092,4062,4112,254
2,1481,9631,6421,5631,232
1,0981,1641,212(NA)(NA)(NA)
17.917.318.318.2
18.718.117.717.718.5
20.821.723.324.924.8
25.224.022.722.520.9
20.721.421.522.622.5
22.523.820.320.216.8
16.817.920.1(NA)(NA)(NA)
2,5552,4282,3152,194
2,0802,0531,8961,8221,661
1,6961,6171,5161,4581,428
1,3901,2981,1431,0911,024
1,005885906915819
782596568582574
539518464
(NA)(NA)(NA)
438472460403
406439413381340
356384370342323
297287237245211
225243204219176
173159146179154
12511312813711795
17.119.419.918.4
19.521.421.820.920.5
21.023.824.423.522.6
21.422.120.822.520.6
22.427.522.523.921.5
22.126.625.730.826.8
23.221.927.732.628.924.9
(NA) Not available.1 For 2004, figures are revised to reflect a correction to the weights in the 2005 ASEC.2 Consistent with 2001 data through implementation of Census 2000-based population controls and a 28,000 household sample expansion.3 For 1999, figures are based on Census 2000 population controls.4 For 1992, figures are based on 1990 census population controls.5 For 1991, figures are revised to correct for nine omitted weights from the original March 1992 CPS file.6 For 1988 and 1987, figures are based on new processing procedures and are also revised to reflect corrections to the files after publication of the 1988 advance report Money
Income and Poverty Status in the United States: 1988, P-60, No. 166.7 The 2003 CPS allowed respondents to choose more than one race. White alone refers to people who reported White and did not report any other race category. The use of this
single-race population does not imply that it is the preferred method of presenting or analyzing data. The Census Bureau uses a variety of approaches. Information on people whoreported more than one race, such as White and American Indian and Alaska Native or Asian and Black or African American, is available from Census 2000 through AmericanFactFinder. About 2.6 percent of people reported more than one race in Census 2000.
8 For 2001 and earlier years, the CPS allowed respondents to report only one race group. The reference race groups for 2001 and earlier poverty data are White, non-HispanicWhite, Black, and Asian and Pacific Islander.
9 Black alone refers to people who reported Black and did not report any other race.10 Asian alone refers to people who reported Asian and did not report any other race.
Note: Prior to 1979, people in unrelated subfamilies were included in people in families. Beginning in 1979, people in unrelated subfamilies are included in all people but areexcluded from people in families.
Source: U.S. Census Bureau, Current Population Survey, 1960 to 2008 Annual Social and Economic Supplements.
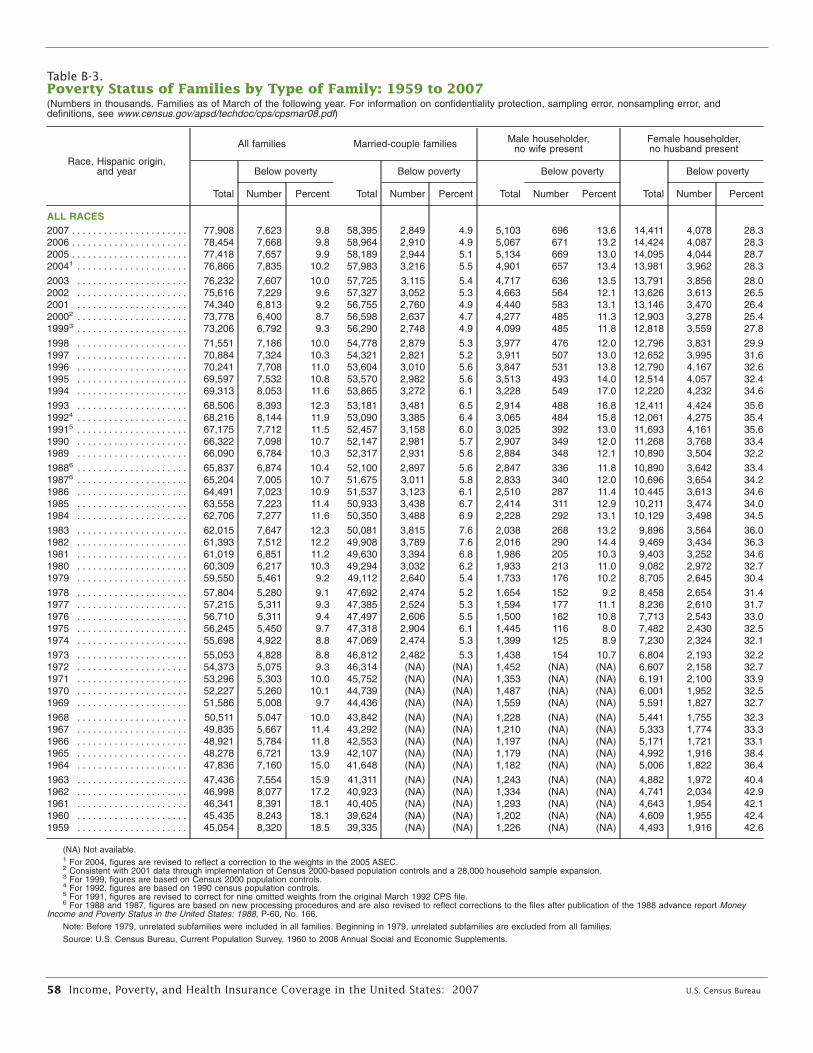
58 Income, Poverty, and Health Insurance Coverage in the United States: 2007 U.S. Census Bureau
Table B-3.Poverty Status of Families by Type of Family: 1959 to 2007(Numbers in thousands. Families as of March of the following year. For information on confidentiality protection, sampling error, nonsampling error, anddefinitions, see www.census.gov/apsd/techdoc/cps/cpsmar08.pdf)
Race, Hispanic origin,and year
All families Married-couple families Male householder,no wife present
Female householder,no husband present
Total
Below poverty
Total
Below poverty
Total
Below poverty
Total
Below poverty
Number Percent Number Percent Number Percent Number Percent
ALL RACES2007 . . . . . . . . . . . . . . . . . . . . . . 77,908 7,623 9.8 58,395 2,849 4.9 5,103 696 13.6 14,411 4,078 28.32006 . . . . . . . . . . . . . . . . . . . . . . 78,454 7,668 9.8 58,964 2,910 4.9 5,067 671 13.2 14,424 4,087 28.32005 . . . . . . . . . . . . . . . . . . . . . . 77,418 7,657 9.9 58,189 2,944 5.1 5,134 669 13.0 14,095 4,044 28.720041 . . . . . . . . . . . . . . . . . . . . . 76,866 7,835 10.2 57,983 3,216 5.5 4,901 657 13.4 13,981 3,962 28.3
2003 . . . . . . . . . . . . . . . . . . . . . 76,232 7,607 10.0 57,725 3,115 5.4 4,717 636 13.5 13,791 3,856 28.02002 . . . . . . . . . . . . . . . . . . . . . 75,616 7,229 9.6 57,327 3,052 5.3 4,663 564 12.1 13,626 3,613 26.52001 . . . . . . . . . . . . . . . . . . . . . 74,340 6,813 9.2 56,755 2,760 4.9 4,440 583 13.1 13,146 3,470 26.420002 . . . . . . . . . . . . . . . . . . . . . 73,778 6,400 8.7 56,598 2,637 4.7 4,277 485 11.3 12,903 3,278 25.419993 . . . . . . . . . . . . . . . . . . . . . 73,206 6,792 9.3 56,290 2,748 4.9 4,099 485 11.8 12,818 3,559 27.8
1998 . . . . . . . . . . . . . . . . . . . . . 71,551 7,186 10.0 54,778 2,879 5.3 3,977 476 12.0 12,796 3,831 29.91997 . . . . . . . . . . . . . . . . . . . . . 70,884 7,324 10.3 54,321 2,821 5.2 3,911 507 13.0 12,652 3,995 31.61996 . . . . . . . . . . . . . . . . . . . . . 70,241 7,708 11.0 53,604 3,010 5.6 3,847 531 13.8 12,790 4,167 32.61995 . . . . . . . . . . . . . . . . . . . . . 69,597 7,532 10.8 53,570 2,982 5.6 3,513 493 14.0 12,514 4,057 32.41994 . . . . . . . . . . . . . . . . . . . . . 69,313 8,053 11.6 53,865 3,272 6.1 3,228 549 17.0 12,220 4,232 34.6
1993 . . . . . . . . . . . . . . . . . . . . . 68,506 8,393 12.3 53,181 3,481 6.5 2,914 488 16.8 12,411 4,424 35.619924 . . . . . . . . . . . . . . . . . . . . . 68,216 8,144 11.9 53,090 3,385 6.4 3,065 484 15.8 12,061 4,275 35.419915 . . . . . . . . . . . . . . . . . . . . . 67,175 7,712 11.5 52,457 3,158 6.0 3,025 392 13.0 11,693 4,161 35.61990 . . . . . . . . . . . . . . . . . . . . . 66,322 7,098 10.7 52,147 2,981 5.7 2,907 349 12.0 11,268 3,768 33.41989 . . . . . . . . . . . . . . . . . . . . . 66,090 6,784 10.3 52,317 2,931 5.6 2,884 348 12.1 10,890 3,504 32.2
19886 . . . . . . . . . . . . . . . . . . . . . 65,837 6,874 10.4 52,100 2,897 5.6 2,847 336 11.8 10,890 3,642 33.419876 . . . . . . . . . . . . . . . . . . . . . 65,204 7,005 10.7 51,675 3,011 5.8 2,833 340 12.0 10,696 3,654 34.21986 . . . . . . . . . . . . . . . . . . . . . 64,491 7,023 10.9 51,537 3,123 6.1 2,510 287 11.4 10,445 3,613 34.61985 . . . . . . . . . . . . . . . . . . . . . 63,558 7,223 11.4 50,933 3,438 6.7 2,414 311 12.9 10,211 3,474 34.01984 . . . . . . . . . . . . . . . . . . . . . 62,706 7,277 11.6 50,350 3,488 6.9 2,228 292 13.1 10,129 3,498 34.5
1983 . . . . . . . . . . . . . . . . . . . . . 62,015 7,647 12.3 50,081 3,815 7.6 2,038 268 13.2 9,896 3,564 36.01982 . . . . . . . . . . . . . . . . . . . . . 61,393 7,512 12.2 49,908 3,789 7.6 2,016 290 14.4 9,469 3,434 36.31981 . . . . . . . . . . . . . . . . . . . . . 61,019 6,851 11.2 49,630 3,394 6.8 1,986 205 10.3 9,403 3,252 34.61980 . . . . . . . . . . . . . . . . . . . . . 60,309 6,217 10.3 49,294 3,032 6.2 1,933 213 11.0 9,082 2,972 32.71979 . . . . . . . . . . . . . . . . . . . . . 59,550 5,461 9.2 49,112 2,640 5.4 1,733 176 10.2 8,705 2,645 30.4
1978 . . . . . . . . . . . . . . . . . . . . . 57,804 5,280 9.1 47,692 2,474 5.2 1,654 152 9.2 8,458 2,654 31.41977 . . . . . . . . . . . . . . . . . . . . . 57,215 5,311 9.3 47,385 2,524 5.3 1,594 177 11.1 8,236 2,610 31.71976 . . . . . . . . . . . . . . . . . . . . . 56,710 5,311 9.4 47,497 2,606 5.5 1,500 162 10.8 7,713 2,543 33.01975 . . . . . . . . . . . . . . . . . . . . . 56,245 5,450 9.7 47,318 2,904 6.1 1,445 116 8.0 7,482 2,430 32.51974 . . . . . . . . . . . . . . . . . . . . . 55,698 4,922 8.8 47,069 2,474 5.3 1,399 125 8.9 7,230 2,324 32.1
1973 . . . . . . . . . . . . . . . . . . . . . 55,053 4,828 8.8 46,812 2,482 5.3 1,438 154 10.7 6,804 2,193 32.21972 . . . . . . . . . . . . . . . . . . . . . 54,373 5,075 9.3 46,314 (NA) (NA) 1,452 (NA) (NA) 6,607 2,158 32.71971 . . . . . . . . . . . . . . . . . . . . . 53,296 5,303 10.0 45,752 (NA) (NA) 1,353 (NA) (NA) 6,191 2,100 33.91970 . . . . . . . . . . . . . . . . . . . . . 52,227 5,260 10.1 44,739 (NA) (NA) 1,487 (NA) (NA) 6,001 1,952 32.51969 . . . . . . . . . . . . . . . . . . . . . 51,586 5,008 9.7 44,436 (NA) (NA) 1,559 (NA) (NA) 5,591 1,827 32.7
1968 . . . . . . . . . . . . . . . . . . . . . 50,511 5,047 10.0 43,842 (NA) (NA) 1,228 (NA) (NA) 5,441 1,755 32.31967 . . . . . . . . . . . . . . . . . . . . . 49,835 5,667 11.4 43,292 (NA) (NA) 1,210 (NA) (NA) 5,333 1,774 33.31966 . . . . . . . . . . . . . . . . . . . . . 48,921 5,784 11.8 42,553 (NA) (NA) 1,197 (NA) (NA) 5,171 1,721 33.11965 . . . . . . . . . . . . . . . . . . . . . 48,278 6,721 13.9 42,107 (NA) (NA) 1,179 (NA) (NA) 4,992 1,916 38.41964 . . . . . . . . . . . . . . . . . . . . . 47,836 7,160 15.0 41,648 (NA) (NA) 1,182 (NA) (NA) 5,006 1,822 36.4
1963 . . . . . . . . . . . . . . . . . . . . . 47,436 7,554 15.9 41,311 (NA) (NA) 1,243 (NA) (NA) 4,882 1,972 40.41962 . . . . . . . . . . . . . . . . . . . . . 46,998 8,077 17.2 40,923 (NA) (NA) 1,334 (NA) (NA) 4,741 2,034 42.91961 . . . . . . . . . . . . . . . . . . . . . 46,341 8,391 18.1 40,405 (NA) (NA) 1,293 (NA) (NA) 4,643 1,954 42.11960 . . . . . . . . . . . . . . . . . . . . . 45,435 8,243 18.1 39,624 (NA) (NA) 1,202 (NA) (NA) 4,609 1,955 42.41959 . . . . . . . . . . . . . . . . . . . . . 45,054 8,320 18.5 39,335 (NA) (NA) 1,226 (NA) (NA) 4,493 1,916 42.6
(NA) Not available.1 For 2004, figures are revised to reflect a correction to the weights in the 2005 ASEC.2 Consistent with 2001 data through implementation of Census 2000-based population controls and a 28,000 household sample expansion.3 For 1999, figures are based on Census 2000 population controls.4 For 1992, figures are based on 1990 census population controls.5 For 1991, figures are revised to correct for nine omitted weights from the original March 1992 CPS file.6 For 1988 and 1987, figures are based on new processing procedures and are also revised to reflect corrections to the files after publication of the 1988 advance report Money
Income and Poverty Status in the United States: 1988, P-60, No. 166.
Note: Before 1979, unrelated subfamilies were included in all families. Beginning in 1979, unrelated subfamilies are excluded from all families.
Source: U.S. Census Bureau, Current Population Survey, 1960 to 2008 Annual Social and Economic Supplements.

U.S. Census Bureau Income, Poverty, and Health Insurance Coverage in the United States: 2007 59
APPENDIX C. ESTIMATES OF HEALTH INSURANCE COVERAGE
Quality of Health InsuranceCoverage Estimates
National surveys and health insur-ance coverage. Health insurance cov-erage is likely to be underreported onthe Current Population Survey (CPS).While underreporting affects most, ifnot all, surveys, underreporting ofhealth insurance coverage in theAnnual Social and EconomicSupplement (ASEC) appears to be alarger problem than in other nationalsurveys that ask about insurance.Some reasons for the disparity mayinclude the fact that income, nothealth insurance, is the main focus ofthe ASEC questionnaire. In addition,the ASEC collects health insuranceinformation by asking in Februarythrough April about the previousyear’s coverage. Asking annual retro-spective questions appears to causefew problems when collecting incomedata (possibly because the interviewperiod is close to when people paytheir taxes), but it may be less thanideal when asking about health insur-ance coverage. Compared with othernational surveys, the CPS estimate ofthe number of people without healthinsurance more closely approximatesthe number of people who are unin-sured at a specific point in time dur-ing the year than the number of peo-ple uninsured for the entire year. Fora comparison of health insurance cov-erage rates from the major federalsurveys, see How Many People LackInsurance and for How Long?(Congressional Budget Office, May 2003).
Reporting of coverage through majorfederal health insurance programs.The CPS ASEC data underreportMedicare and Medicaid coverage com-pared with enrollment and participa-tion data from the Centers forMedicare and Medicaid Services
(CMS).39 Because the CPS is largely alabor force survey, interviewersreceive less training on health insur-ance concepts than labor concepts.Additionally, many people may not beaware that a health insurance pro-gram covers them or their children ifthey have not used covered servicesrecently. CMS data, on the otherhand, represent the actual number ofpeople who have enrolled or partici-pated in these programs.
The State Health Access DataAssistance Center (SHADAC) of theUniversity of Minnesota has workedwith the U.S. Census Bureau, CMS,and the Office of the AssistantSecretary for Planning and Evaluation(ASPE) on a research project to evalu-ate why CPS ASEC estimates of thenumber of people with Medicaid arelower than counts of the number ofpeople enrolled in the program fromCMS. Reports from Phases 1 and 2 ofthe research project are availablefrom the Census Bureau’s Web site at<www.census.gov/did/www/shadac/shadac.html>.
During Phase 2, files from theMedicaid Statistical InformationSystem (MSIS) were linked with theCPS ASEC files and individual recordscompared. A key finding indicatingsurvey response error in the CPSASEC was that 16.9 percent of peoplewith an MSIS record indicatingMedicaid coverage reported in theCPS ASEC that they were uninsured.40
The report found that those withlonger and more recent Medicaid
39 CMS is the federal agency primarilyresponsible for administering the Medicare andMedicaid programs at the national level.
40 For consistency purposes across the MSISand the CPS, SHADAC removed all MSIS enrolleeswho received only partial coverage, those whohad died before the CPS reporting cycle, and allduplicate person records. Also, all StateChildren’s Health Insurance Program (SCHIP)enrollees were removed from the MSIS count.
enrollment were more likely to reportcoverage. Respondents for enrolledchildren were more apt to report cov-erage for those children than foradults enrolled. Families with lowerincomes tended to report coveragemore frequently. Individuals whoreceived Medicaid services during thereporting cycle tended to report cov-erage more often than individualswho had not received services.Reporting differences were alsoapparent from state to state.
Last year, SHADAC released an imputa-tion adjustment for the 2007 public-use CPS ASEC microdata that are avail-able to the public through theMinnesota Population Center’s IPUMS-CPS Web site to help researchers inter-ested in partially adjusting the CPSASEC data.41 This is an experimentalimputation, and it is being producedfor interested parties to use in theirresearch. The Census Bureau has notevaluated the methodology, and usersshould be aware that this is not anofficial data product.
There are several ongoing projectsaimed at improving the quality ofhealth coverage data from the CPSASEC. This research includes: 1) cogni-tive research to improve the wordingof the CPS ASEC health coverage ques-tions; 2) editing and imputationresearch, including additional researchon the use of models that attempt toaccount for Medicaid underreporting;and 3) expanding the number of stud-ies that match administrative Medicaiddata to current survey data to includeother surveys, such as the NationalHealth Interview Survey (NHIS) and theAmerican Community Survey (ACS).Through this research, it will be possi-ble to compare and contrast CPS ASEC
41 The IPUMS-CPS Web site is available at<cps.ipums.org/cps/>.
60 Income, Poverty, and Health Insurance Coverage in the United States: 2007 U.S. Census Bureau
underreporting rates with other sur- (those who received some other ben- the definition of the population with-veys, which will, in turn, allow Census efits, usually public assistance pay- out health insurance in the supple-Bureau analysts to better understand ments, that make them eligible for ment to the March 1998 CPS, whichthe nature and impact of CPS ASEC Medicaid). Since the number of peo- collected data about coverage inhealth coverage underreporting. ple receiving public assistance has 1997. Previously, people with no cov-
been dropping, the relationship erage other than access to the IndianChanges in Medicaid coverage esti-
between Medicaid coverage and pub- Health Service were counted as part ofmates from one year to the next
lic assistance has changed, causing the insured population. Subsequently,should be viewed with caution.
the imputation process to introduce a the Census Bureau has counted theseBecause many people who are cov-
downward bias in the most recent people as uninsured. The effect ofered by Medicaid do not report that
Medicaid estimates. this change on the overall estimatescoverage, the Census Bureau assigns
of health insurance coverage wascoverage to those who are generally After consulting with health insurance
negligible.regarded as “categorically eligible” experts, the Census Bureau modified
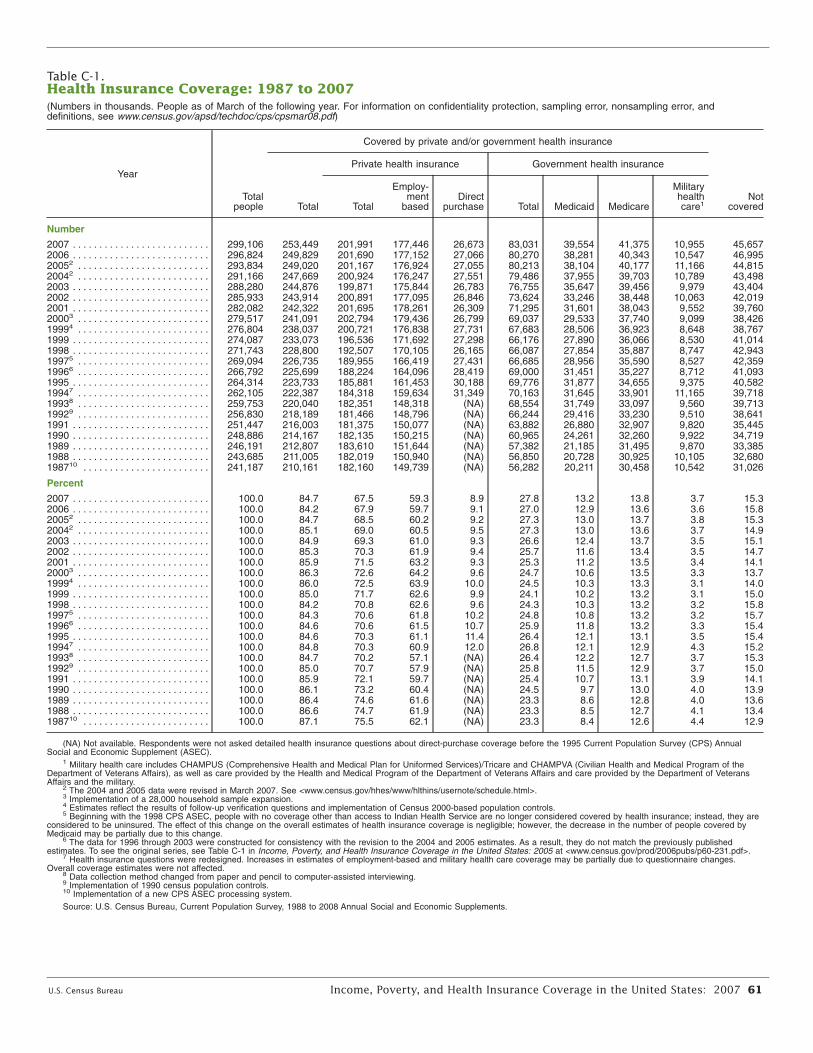
U.S. Census Bureau Income, Poverty, and Health Insurance Coverage in the United States: 2007 61
Table C-1.Health Insurance Coverage: 1987 to 2007(Numbers in thousands. People as of March of the following year. For information on confidentiality protection, sampling error, nonsampling error, anddefinitions, see www.census.gov/apsd/techdoc/cps/cpsmar08.pdf)
Year
Totalpeople
Covered by private and/or government health insurance
NotcoveredTotal
Private health insurance Government health insurance
Total
Employ-ment
basedDirect
purchase Total Medicaid Medicare
Militaryhealth
1care
Number
2007 . . . . . . . . . . . . . . . . . . . . . . . . . . 299,106 253,449 201,991 177,446 26,673 83,031 39,554 41,375 10,955 45,6572006 . . . . . . . . . . . . . . . . . . . . . . . . . . 296,824 249,829 201,690 177,152 27,066 80,270 38,281 40,343 10,547 46,99520052 . . . . . . . . . . . . . . . . . . . . . . . . . 293,834 249,020 201,167 176,924 27,055 80,213 38,104 40,177 11,166 44,81520042 . . . . . . . . . . . . . . . . . . . . . . . . . 291,166 247,669 200,924 176,247 27,551 79,486 37,955 39,703 10,789 43,4982003 . . . . . . . . . . . . . . . . . . . . . . . . . . 288,280 244,876 199,871 175,844 26,783 76,755 35,647 39,456 9,979 43,4042002 . . . . . . . . . . . . . . . . . . . . . . . . . . 285,933 243,914 200,891 177,095 26,846 73,624 33,246 38,448 10,063 42,0192001 . . . . . . . . . . . . . . . . . . . . . . . . . . 282,082 242,322 201,695 178,261 26,309 71,295 31,601 38,043 9,552 39,76020003 . . . . . . . . . . . . . . . . . . . . . . . . . 279,517 241,091 202,794 179,436 26,799 69,037 29,533 37,740 9,099 38,42619994 . . . . . . . . . . . . . . . . . . . . . . . . . 276,804 238,037 200,721 176,838 27,731 67,683 28,506 36,923 8,648 38,7671999 . . . . . . . . . . . . . . . . . . . . . . . . . . 274,087 233,073 196,536 171,692 27,298 66,176 27,890 36,066 8,530 41,0141998 . . . . . . . . . . . . . . . . . . . . . . . . . . 271,743 228,800 192,507 170,105 26,165 66,087 27,854 35,887 8,747 42,94319975 . . . . . . . . . . . . . . . . . . . . . . . . . 269,094 226,735 189,955 166,419 27,431 66,685 28,956 35,590 8,527 42,35919966 . . . . . . . . . . . . . . . . . . . . . . . . . 266,792 225,699 188,224 164,096 28,419 69,000 31,451 35,227 8,712 41,0931995 . . . . . . . . . . . . . . . . . . . . . . . . . . 264,314 223,733 185,881 161,453 30,188 69,776 31,877 34,655 9,375 40,58219947 . . . . . . . . . . . . . . . . . . . . . . . . . 262,105 222,387 184,318 159,634 31,349 70,163 31,645 33,901 11,165 39,71819938 . . . . . . . . . . . . . . . . . . . . . . . . . 259,753 220,040 182,351 148,318 (NA) 68,554 31,749 33,097 9,560 39,71319929 . . . . . . . . . . . . . . . . . . . . . . . . . 256,830 218,189 181,466 148,796 (NA) 66,244 29,416 33,230 9,510 38,6411991 . . . . . . . . . . . . . . . . . . . . . . . . . . 251,447 216,003 181,375 150,077 (NA) 63,882 26,880 32,907 9,820 35,4451990 . . . . . . . . . . . . . . . . . . . . . . . . . . 248,886 214,167 182,135 150,215 (NA) 60,965 24,261 32,260 9,922 34,7191989 . . . . . . . . . . . . . . . . . . . . . . . . . . 246,191 212,807 183,610 151,644 (NA) 57,382 21,185 31,495 9,870 33,3851988 . . . . . . . . . . . . . . . . . . . . . . . . . . 243,685 211,005 182,019 150,940 (NA) 56,850 20,728 30,925 10,105 32,680198710 . . . . . . . . . . . . . . . . . . . . . . . . 241,187 210,161 182,160 149,739 (NA) 56,282 20,211 30,458 10,542 31,026
Percent
2007 . . . . . . . . . . . . . . . . . . . . . . . . . . 100.0 84.7 67.5 59.3 8.9 27.8 13.2 13.8 3.7 15.32006 . . . . . . . . . . . . . . . . . . . . . . . . . . 100.0 84.2 67.9 59.7 9.1 27.0 12.9 13.6 3.6 15.820052 . . . . . . . . . . . . . . . . . . . . . . . . . 100.0 84.7 68.5 60.2 9.2 27.3 13.0 13.7 3.8 15.320042 . . . . . . . . . . . . . . . . . . . . . . . . . 100.0 85.1 69.0 60.5 9.5 27.3 13.0 13.6 3.7 14.92003 . . . . . . . . . . . . . . . . . . . . . . . . . . 100.0 84.9 69.3 61.0 9.3 26.6 12.4 13.7 3.5 15.12002 . . . . . . . . . . . . . . . . . . . . . . . . . . 100.0 85.3 70.3 61.9 9.4 25.7 11.6 13.4 3.5 14.72001 . . . . . . . . . . . . . . . . . . . . . . . . . . 100.0 85.9 71.5 63.2 9.3 25.3 11.2 13.5 3.4 14.120003 . . . . . . . . . . . . . . . . . . . . . . . . . 100.0 86.3 72.6 64.2 9.6 24.7 10.6 13.5 3.3 13.719994 . . . . . . . . . . . . . . . . . . . . . . . . . 100.0 86.0 72.5 63.9 10.0 24.5 10.3 13.3 3.1 14.01999 . . . . . . . . . . . . . . . . . . . . . . . . . . 100.0 85.0 71.7 62.6 9.9 24.1 10.2 13.2 3.1 15.01998 . . . . . . . . . . . . . . . . . . . . . . . . . . 100.0 84.2 70.8 62.6 9.6 24.3 10.3 13.2 3.2 15.819975 . . . . . . . . . . . . . . . . . . . . . . . . . 100.0 84.3 70.6 61.8 10.2 24.8 10.8 13.2 3.2 15.719966 . . . . . . . . . . . . . . . . . . . . . . . . . 100.0 84.6 70.6 61.5 10.7 25.9 11.8 13.2 3.3 15.41995 . . . . . . . . . . . . . . . . . . . . . . . . . . 100.0 84.6 70.3 61.1 11.4 26.4 12.1 13.1 3.5 15.419947 . . . . . . . . . . . . . . . . . . . . . . . . . 100.0 84.8 70.3 60.9 12.0 26.8 12.1 12.9 4.3 15.219938 . . . . . . . . . . . . . . . . . . . . . . . . . 100.0 84.7 70.2 57.1 (NA) 26.4 12.2 12.7 3.7 15.319929 . . . . . . . . . . . . . . . . . . . . . . . . . 100.0 85.0 70.7 57.9 (NA) 25.8 11.5 12.9 3.7 15.01991 . . . . . . . . . . . . . . . . . . . . . . . . . . 100.0 85.9 72.1 59.7 (NA) 25.4 10.7 13.1 3.9 14.11990 . . . . . . . . . . . . . . . . . . . . . . . . . . 100.0 86.1 73.2 60.4 (NA) 24.5 9.7 13.0 4.0 13.91989 . . . . . . . . . . . . . . . . . . . . . . . . . . 100.0 86.4 74.6 61.6 (NA) 23.3 8.6 12.8 4.0 13.61988 . . . . . . . . . . . . . . . . . . . . . . . . . . 100.0 86.6 74.7 61.9 (NA) 23.3 8.5 12.7 4.1 13.4198710 . . . . . . . . . . . . . . . . . . . . . . . . 100.0 87.1 75.5 62.1 (NA) 23.3 8.4 12.6 4.4 12.9
(NA) Not available. Respondents were not asked detailed health insurance questions about direct-purchase coverage before the 1995 Current Population Survey (CPS) AnnualSocial and Economic Supplement (ASEC).
1 Military health care includes CHAMPUS (Comprehensive Health and Medical Plan for Uniformed Services)/Tricare and CHAMPVA (Civilian Health and Medical Program of theDepartment of Veterans Affairs), as well as care provided by the Health and Medical Program of the Department of Veterans Affairs and care provided by the Department of VeteransAffairs and the military.
2 The 2004 and 2005 data were revised in March 2007. See <www.census.gov/hhes/www/hlthins/usernote/schedule.html>.3 Implementation of a 28,000 household sample expansion.4 Estimates reflect the results of follow-up verification questions and implementation of Census 2000-based population controls.5 Beginning with the 1998 CPS ASEC, people with no coverage other than access to Indian Health Service are no longer considered covered by health insurance; instead, they are
considered to be uninsured. The effect of this change on the overall estimates of health insurance coverage is negligible; however, the decrease in the number of people covered byMedicaid may be partially due to this change.
6 The data for 1996 through 2003 were constructed for consistency with the revision to the 2004 and 2005 estimates. As a result, they do not match the previously publishedestimates. To see the original series, see Table C-1 in Income, Poverty, and Health Insurance Coverage in the United States: 2005 at <www.census.gov/prod/2006pubs/p60-231.pdf>.
7 Health insurance questions were redesigned. Increases in estimates of employment-based and military health care coverage may be partially due to questionnaire changes.Overall coverage estimates were not affected.
8 Data collection method changed from paper and pencil to computer-assisted interviewing.9 Implementation of 1990 census population controls.10 Implementation of a new CPS ASEC processing system.
Source: U.S. Census Bureau, Current Population Survey, 1988 to 2008 Annual Social and Economic Supplements.
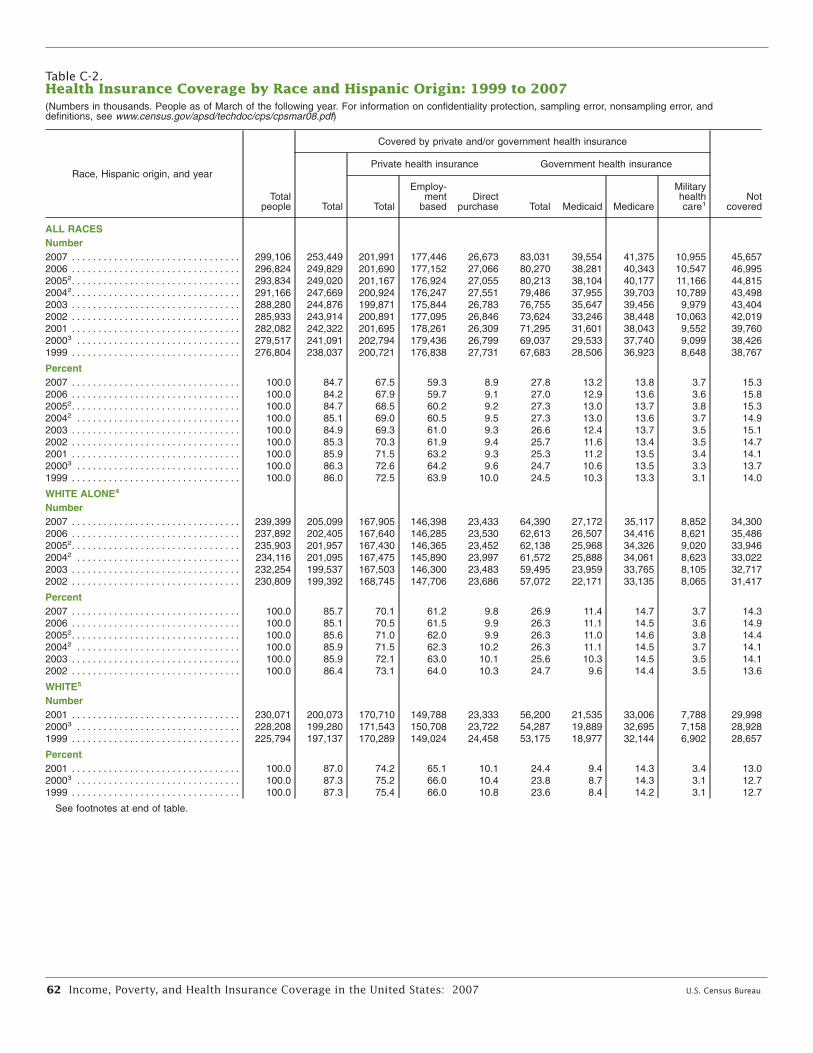
62 Income, Poverty, and Health Insurance Coverage in the United States: 2007 U.S. Census Bureau
Table C-2.Health Insurance Coverage by Race and Hispanic Origin: 1999 to 2007(Numbers in thousands. People as of March of the following year. For information on confidentiality protection, sampling error, nonsampling error, anddefinitions, see www.census.gov/apsd/techdoc/cps/cpsmar08.pdf)
Race, Hispanic origin, and year
Totalpeople
Covered by private and/or government health insurance
NotcoveredTotal
Private health insurance Government health insurance
Total
Employ-ment
basedDirect
purchase Total Medicaid Medicare
Militaryhealth
1care
ALL RACESNumber2007 . . . . . . . . . . . . . . . . . . . . . . . . . . . . . . . . 299,106 253,449 201,991 177,446 26,673 83,031 39,554 41,375 10,955 45,6572006 . . . . . . . . . . . . . . . . . . . . . . . . . . . . . . . . 296,824 249,829 201,690 177,152 27,066 80,270 38,281 40,343 10,547 46,99520052. . . . . . . . . . . . . . . . . . . . . . . . . . . . . . . . 293,834 249,020 201,167 176,924 27,055 80,213 38,104 40,177 11,166 44,81520042. . . . . . . . . . . . . . . . . . . . . . . . . . . . . . . . 291,166 247,669 200,924 176,247 27,551 79,486 37,955 39,703 10,789 43,4982003 . . . . . . . . . . . . . . . . . . . . . . . . . . . . . . . . 288,280 244,876 199,871 175,844 26,783 76,755 35,647 39,456 9,979 43,4042002 . . . . . . . . . . . . . . . . . . . . . . . . . . . . . . . . 285,933 243,914 200,891 177,095 26,846 73,624 33,246 38,448 10,063 42,0192001 . . . . . . . . . . . . . . . . . . . . . . . . . . . . . . . . 282,082 242,322 201,695 178,261 26,309 71,295 31,601 38,043 9,552 39,76020003 . . . . . . . . . . . . . . . . . . . . . . . . . . . . . . . 279,517 241,091 202,794 179,436 26,799 69,037 29,533 37,740 9,099 38,4261999 . . . . . . . . . . . . . . . . . . . . . . . . . . . . . . . .
Percent
276,804 238,037 200,721 176,838 27,731 67,683 28,506 36,923 8,648 38,767
2007 . . . . . . . . . . . . . . . . . . . . . . . . . . . . . . . . 100.0 84.7 67.5 59.3 8.9 27.8 13.2 13.8 3.7 15.32006 . . . . . . . . . . . . . . . . . . . . . . . . . . . . . . . . 100.0 84.2 67.9 59.7 9.1 27.0 12.9 13.6 3.6 15.820052. . . . . . . . . . . . . . . . . . . . . . . . . . . . . . . . 100.0 84.7 68.5 60.2 9.2 27.3 13.0 13.7 3.8 15.320042 . . . . . . . . . . . . . . . . . . . . . . . . . . . . . . . 100.0 85.1 69.0 60.5 9.5 27.3 13.0 13.6 3.7 14.92003 . . . . . . . . . . . . . . . . . . . . . . . . . . . . . . . . 100.0 84.9 69.3 61.0 9.3 26.6 12.4 13.7 3.5 15.12002 . . . . . . . . . . . . . . . . . . . . . . . . . . . . . . . . 100.0 85.3 70.3 61.9 9.4 25.7 11.6 13.4 3.5 14.72001 . . . . . . . . . . . . . . . . . . . . . . . . . . . . . . . . 100.0 85.9 71.5 63.2 9.3 25.3 11.2 13.5 3.4 14.120003 . . . . . . . . . . . . . . . . . . . . . . . . . . . . . . . 100.0 86.3 72.6 64.2 9.6 24.7 10.6 13.5 3.3 13.71999 . . . . . . . . . . . . . . . . . . . . . . . . . . . . . . . .
WHITE ALONE4
Number
100.0 86.0 72.5 63.9 10.0 24.5 10.3 13.3 3.1 14.0
2007 . . . . . . . . . . . . . . . . . . . . . . . . . . . . . . . . 239,399 205,099 167,905 146,398 23,433 64,390 27,172 35,117 8,852 34,3002006 . . . . . . . . . . . . . . . . . . . . . . . . . . . . . . . . 237,892 202,405 167,640 146,285 23,530 62,613 26,507 34,416 8,621 35,48620052. . . . . . . . . . . . . . . . . . . . . . . . . . . . . . . . 235,903 201,957 167,430 146,365 23,452 62,138 25,968 34,326 9,020 33,94620042 . . . . . . . . . . . . . . . . . . . . . . . . . . . . . . . 234,116 201,095 167,475 145,890 23,997 61,572 25,888 34,061 8,623 33,0222003 . . . . . . . . . . . . . . . . . . . . . . . . . . . . . . . . 232,254 199,537 167,503 146,300 23,483 59,495 23,959 33,765 8,105 32,7172002 . . . . . . . . . . . . . . . . . . . . . . . . . . . . . . . .
Percent
230,809 199,392 168,745 147,706 23,686 57,072 22,171 33,135 8,065 31,417
2007 . . . . . . . . . . . . . . . . . . . . . . . . . . . . . . . . 100.0 85.7 70.1 61.2 9.8 26.9 11.4 14.7 3.7 14.32006 . . . . . . . . . . . . . . . . . . . . . . . . . . . . . . . . 100.0 85.1 70.5 61.5 9.9 26.3 11.1 14.5 3.6 14.920052. . . . . . . . . . . . . . . . . . . . . . . . . . . . . . . . 100.0 85.6 71.0 62.0 9.9 26.3 11.0 14.6 3.8 14.420042 . . . . . . . . . . . . . . . . . . . . . . . . . . . . . . . 100.0 85.9 71.5 62.3 10.2 26.3 11.1 14.5 3.7 14.12003 . . . . . . . . . . . . . . . . . . . . . . . . . . . . . . . . 100.0 85.9 72.1 63.0 10.1 25.6 10.3 14.5 3.5 14.12002 . . . . . . . . . . . . . . . . . . . . . . . . . . . . . . . .
WHITE5
Number
100.0 86.4 73.1 64.0 10.3 24.7 9.6 14.4 3.5 13.6
2001 . . . . . . . . . . . . . . . . . . . . . . . . . . . . . . . . 230,071 200,073 170,710 149,788 23,333 56,200 21,535 33,006 7,788 29,99820003 . . . . . . . . . . . . . . . . . . . . . . . . . . . . . . . 228,208 199,280 171,543 150,708 23,722 54,287 19,889 32,695 7,158 28,9281999 . . . . . . . . . . . . . . . . . . . . . . . . . . . . . . . .
Percent
225,794 197,137 170,289 149,024 24,458 53,175 18,977 32,144 6,902 28,657
2001 . . . . . . . . . . . . . . . . . . . . . . . . . . . . . . . . 100.0 87.0 74.2 65.1 10.1 24.4 9.4 14.3 3.4 13.020003 . . . . . . . . . . . . . . . . . . . . . . . . . . . . . . . 100.0 87.3 75.2 66.0 10.4 23.8 8.7 14.3 3.1 12.71999 . . . . . . . . . . . . . . . . . . . . . . . . . . . . . . . . 100.0 87.3 75.4 66.0 10.8 23.6 8.4 14.2 3.1 12.7
See footnotes at end of table.

U.S. Census Bureau Income, Poverty, and Health Insurance Coverage in the United States: 2007 63
Table C-2.Health Insurance Coverage by Race and Hispanic Origin: 1999 to 2007—Con.(Numbers in thousands. People as of March of the following year. For information on confidentiality protection, sampling error, nonsampling error, anddefinitions, see www.census.gov/apsd/techdoc/cps/cpsmar08.pdf)
Race, Hispanic origin, and year
Totalpeople
Covered by private and/or government health insurance
NotcoveredTotal
Private health insurance Government health insurance
Total
Employ-ment
basedDirect
purchase Total Medicaid Medicare
Militaryhealth
1care
WHITE ALONE, NOT HISPANICNumber2007 . . . . . . . . . . . . . . . . . . . . . . . . . . . . . . . . 196,768 176,220 149,122 129,138 21,717 52,512 17,786 32,436 8,131 20,5482006 . . . . . . . . . . . . . . . . . . . . . . . . . . . . . . . . 196,252 175,091 149,592 129,618 22,068 51,445 17,731 31,860 7,869 21,16220052. . . . . . . . . . . . . . . . . . . . . . . . . . . . . . . . 195,893 174,984 149,613 130,075 21,724 51,189 17,396 31,717 8,276 20,90920042 . . . . . . . . . . . . . . . . . . . . . . . . . . . . . . . 195,347 174,793 149,882 129,766 22,346 51,002 17,462 31,624 8,005 20,5542003 . . . . . . . . . . . . . . . . . . . . . . . . . . . . . . . . 194,877 174,409 150,563 130,614 22,090 49,743 16,247 31,458 7,563 20,4682002 . . . . . . . . . . . . . . . . . . . . . . . . . . . . . . . .
Percent
194,421 174,747 151,812 132,101 22,291 47,736 14,984 30,718 7,465 19,674
2007 . . . . . . . . . . . . . . . . . . . . . . . . . . . . . . . . 100.0 89.6 75.8 65.6 11.0 26.7 9.0 16.5 4.1 10.42006 . . . . . . . . . . . . . . . . . . . . . . . . . . . . . . . . 100.0 89.2 76.2 66.0 11.2 26.2 9.0 16.2 4.0 10.820052. . . . . . . . . . . . . . . . . . . . . . . . . . . . . . . . 100.0 89.3 76.4 66.4 11.1 26.1 8.9 16.2 4.2 10.720042 . . . . . . . . . . . . . . . . . . . . . . . . . . . . . . . 100.0 89.5 76.7 66.4 11.4 26.1 8.9 16.2 4.1 10.52003 . . . . . . . . . . . . . . . . . . . . . . . . . . . . . . . . 100.0 89.5 77.3 67.0 11.3 25.5 8.3 16.1 3.9 10.52002 . . . . . . . . . . . . . . . . . . . . . . . . . . . . . . . .
WHITE, NOT HISPANICNumber
100.0 89.9 78.1 67.9 11.5 24.6 7.7 15.8 3.8 10.1
2001 . . . . . . . . . . . . . . . . . . . . . . . . . . . . . . . . 194,822 176,488 154,218 134,586 22,009 47,661 15,035 30,811 7,144 18,33320003 . . . . . . . . . . . . . . . . . . . . . . . . . . . . . . . 193,931 176,279 155,152 135,472 22,476 46,297 13,788 30,642 6,564 17,6521999 . . . . . . . . . . . . . . . . . . . . . . . . . . . . . . . .
Percent
192,858 175,045 154,407 134,436 23,110 45,540 13,157 30,256 6,326 17,813
2001 . . . . . . . . . . . . . . . . . . . . . . . . . . . . . . . . 100.0 90.6 79.2 69.1 11.3 24.5 7.7 15.8 3.7 9.420003 . . . . . . . . . . . . . . . . . . . . . . . . . . . . . . . 100.0 90.9 80.0 69.9 11.6 23.9 7.1 15.8 3.4 9.11999 . . . . . . . . . . . . . . . . . . . . . . . . . . . . . . . .
BLACK ALONE OR IN COMBINATIONNumber
100.0 90.8 80.1 69.7 12.0 23.6 6.8 15.7 3.3 9.2
2007 . . . . . . . . . . . . . . . . . . . . . . . . . . . . . . . . 39,683 32,059 21,226 19,498 1,771 13,985 9,606 4,398 1,445 7,6242006 . . . . . . . . . . . . . . . . . . . . . . . . . . . . . . . . 39,083 31,162 20,966 19,257 1,835 13,121 9,086 4,127 1,289 7,92120052. . . . . . . . . . . . . . . . . . . . . . . . . . . . . . . . 38,729 31,491 20,935 19,146 2,009 13,864 9,730 4,184 1,438 7,23920042 . . . . . . . . . . . . . . . . . . . . . . . . . . . . . . . 38,179 31,077 20,800 19,144 1,909 13,623 9,562 3,996 1,492 7,1032003 . . . . . . . . . . . . . . . . . . . . . . . . . . . . . . . . 37,651 30,543 20,376 18,885 1,773 13,195 9,292 4,080 1,283 7,1082002 . . . . . . . . . . . . . . . . . . . . . . . . . . . . . . . .
Percent
37,350 30,093 20,440 19,038 1,638 12,624 8,744 3,851 1,342 7,257
2007 . . . . . . . . . . . . . . . . . . . . . . . . . . . . . . . . 100.0 80.8 53.5 49.1 4.5 35.2 24.2 11.1 3.6 19.22006 . . . . . . . . . . . . . . . . . . . . . . . . . . . . . . . . 100.0 79.7 53.6 49.3 4.7 33.6 23.2 10.6 3.3 20.320052. . . . . . . . . . . . . . . . . . . . . . . . . . . . . . . . 100.0 81.3 54.1 49.4 5.2 35.8 25.1 10.8 3.7 18.720042. . . . . . . . . . . . . . . . . . . . . . . . . . . . . . . . 100.0 81.4 54.5 50.1 5.0 35.7 25.0 10.5 3.9 18.62003 . . . . . . . . . . . . . . . . . . . . . . . . . . . . . . . . 100.0 81.1 54.1 50.2 4.7 35.0 24.7 10.8 3.4 18.92002 . . . . . . . . . . . . . . . . . . . . . . . . . . . . . . . .
BLACK ALONE6
Number
100.0 80.6 54.7 51.0 4.4 33.8 23.4 10.3 3.6 19.4
2007 . . . . . . . . . . . . . . . . . . . . . . . . . . . . . . . . 37,775 30,403 20,169 18,525 1,691 13.234 8,986 4,303 1,358 7,3722006 . . . . . . . . . . . . . . . . . . . . . . . . . . . . . . . . 37,369 29,717 20,034 18,401 1,766 12,454 8,531 4,059 1,216 7,65220052. . . . . . . . . . . . . . . . . . . . . . . . . . . . . . . . 36,965 29,959 19,950 18,263 1,918 13,168 9,154 4,108 1,357 7,00620042 . . . . . . . . . . . . . . . . . . . . . . . . . . . . . . . 36,548 29,684 19,899 18,352 1,803 12,995 9,048 3,921 1,415 6,8642003 . . . . . . . . . . . . . . . . . . . . . . . . . . . . . . . . 36,121 29,234 19,552 18,135 1,701 12,585 8,797 3,989 1,225 6,8872002 . . . . . . . . . . . . . . . . . . . . . . . . . . . . . . . .
Percent
35,806 28,744 19,544 18,193 1,589 12,058 8,289 3,776 1,268 7,062
2007 . . . . . . . . . . . . . . . . . . . . . . . . . . . . . . . . 100.0 80.5 53.4 49.0 4.5 35.0 23.8 11.4 3.6 19.52006 . . . . . . . . . . . . . . . . . . . . . . . . . . . . . . . . 100.0 79.5 53.6 49.2 4.7 33.3 22.8 10.9 3.3 20.520052. . . . . . . . . . . . . . . . . . . . . . . . . . . . . . . . 100.0 81.0 54.0 49.4 5.2 35.6 24.8 11.1 3.7 19.020042. . . . . . . . . . . . . . . . . . . . . . . . . . . . . . . . 100.0 81.2 54.4 50.2 4.9 35.6 24.8 10.7 3.9 18.82003 . . . . . . . . . . . . . . . . . . . . . . . . . . . . . . . . 100.0 80.9 54.1 50.2 4.7 34.8 24.4 11.0 3.4 19.12002 . . . . . . . . . . . . . . . . . . . . . . . . . . . . . . . . 100.0 80.3 54.6 50.8 4.4 33.7 23.1 10.5 3.5 19.7
See footnotes at end of table.
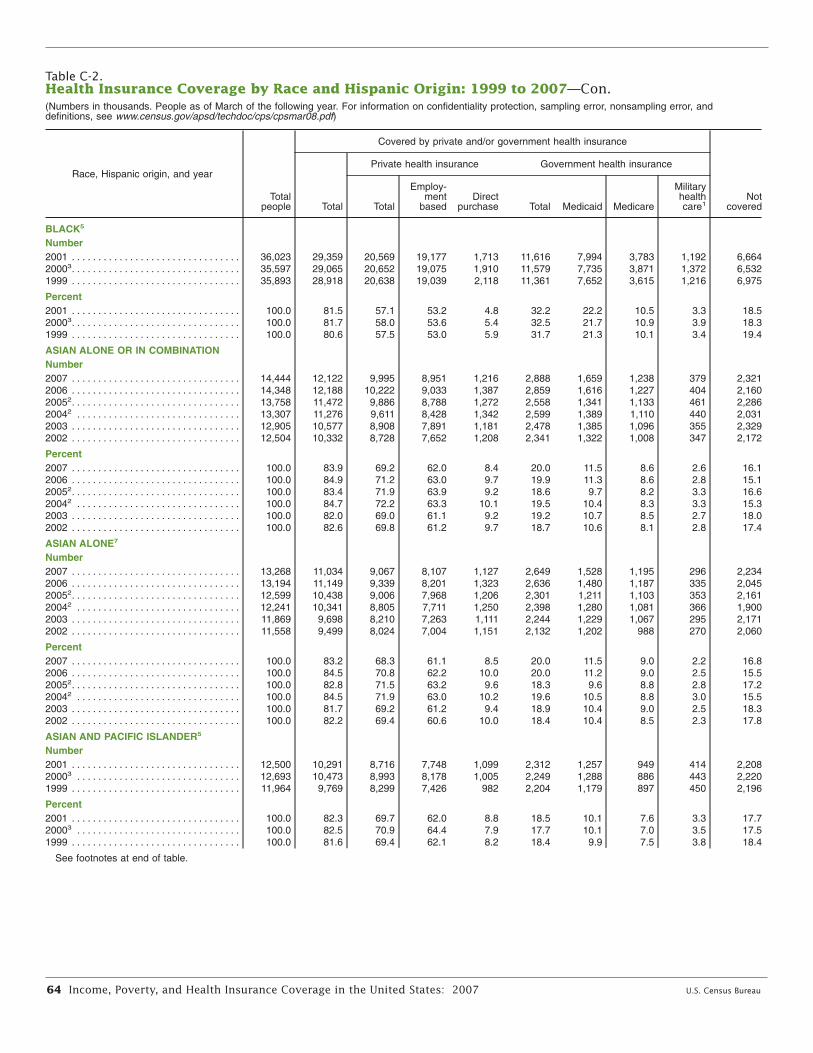
64 Income, Poverty, and Health Insurance Coverage in the United States: 2007 U.S. Census Bureau
Table C-2.Health Insurance Coverage by Race and Hispanic Origin: 1999 to 2007—Con.(Numbers in thousands. People as of March of the following year. For information on confidentiality protection, sampling error, nonsampling error, anddefinitions, see www.census.gov/apsd/techdoc/cps/cpsmar08.pdf)
Race, Hispanic origin, and year
Totalpeople
Covered by private and/or government health insurance
NotcoveredTotal
Private health insurance Government health insurance
Total
Employ-ment
basedDirect
purchase Total Medicaid Medicare
Militaryhealth
1care
BLACK5
Number2001 . . . . . . . . . . . . . . . . . . . . . . . . . . . . . . . . 36,023 29,359 20,569 19,177 1,713 11,616 7,994 3,783 1,192 6,66420003. . . . . . . . . . . . . . . . . . . . . . . . . . . . . . . . 35,597 29,065 20,652 19,075 1,910 11,579 7,735 3,871 1,372 6,5321999 . . . . . . . . . . . . . . . . . . . . . . . . . . . . . . . .
Percent
35,893 28,918 20,638 19,039 2,118 11,361 7,652 3,615 1,216 6,975
2001 . . . . . . . . . . . . . . . . . . . . . . . . . . . . . . . . 100.0 81.5 57.1 53.2 4.8 32.2 22.2 10.5 3.3 18.520003. . . . . . . . . . . . . . . . . . . . . . . . . . . . . . . . 100.0 81.7 58.0 53.6 5.4 32.5 21.7 10.9 3.9 18.31999 . . . . . . . . . . . . . . . . . . . . . . . . . . . . . . . .
ASIAN ALONE OR IN COMBINATIONNumber
100.0 80.6 57.5 53.0 5.9 31.7 21.3 10.1 3.4 19.4
2007 . . . . . . . . . . . . . . . . . . . . . . . . . . . . . . . . 14,444 12,122 9,995 8,951 1,216 2,888 1,659 1,238 379 2,3212006 . . . . . . . . . . . . . . . . . . . . . . . . . . . . . . . . 14,348 12,188 10,222 9,033 1,387 2,859 1,616 1,227 404 2,16020052. . . . . . . . . . . . . . . . . . . . . . . . . . . . . . . . 13,758 11,472 9,886 8,788 1,272 2,558 1,341 1,133 461 2,28620042 . . . . . . . . . . . . . . . . . . . . . . . . . . . . . . . 13,307 11,276 9,611 8,428 1,342 2,599 1,389 1,110 440 2,0312003 . . . . . . . . . . . . . . . . . . . . . . . . . . . . . . . . 12,905 10,577 8,908 7,891 1,181 2,478 1,385 1,096 355 2,3292002 . . . . . . . . . . . . . . . . . . . . . . . . . . . . . . . .
Percent
12,504 10,332 8,728 7,652 1,208 2,341 1,322 1,008 347 2,172
2007 . . . . . . . . . . . . . . . . . . . . . . . . . . . . . . . . 100.0 83.9 69.2 62.0 8.4 20.0 11.5 8.6 2.6 16.12006 . . . . . . . . . . . . . . . . . . . . . . . . . . . . . . . . 100.0 84.9 71.2 63.0 9.7 19.9 11.3 8.6 2.8 15.120052. . . . . . . . . . . . . . . . . . . . . . . . . . . . . . . . 100.0 83.4 71.9 63.9 9.2 18.6 9.7 8.2 3.3 16.620042 . . . . . . . . . . . . . . . . . . . . . . . . . . . . . . . 100.0 84.7 72.2 63.3 10.1 19.5 10.4 8.3 3.3 15.32003 . . . . . . . . . . . . . . . . . . . . . . . . . . . . . . . . 100.0 82.0 69.0 61.1 9.2 19.2 10.7 8.5 2.7 18.02002 . . . . . . . . . . . . . . . . . . . . . . . . . . . . . . . .
ASIAN ALONE7
Number
100.0 82.6 69.8 61.2 9.7 18.7 10.6 8.1 2.8 17.4
2007 . . . . . . . . . . . . . . . . . . . . . . . . . . . . . . . . 13,268 11,034 9,067 8,107 1,127 2,649 1,528 1,195 296 2,2342006 . . . . . . . . . . . . . . . . . . . . . . . . . . . . . . . . 13,194 11,149 9,339 8,201 1,323 2,636 1,480 1,187 335 2,04520052. . . . . . . . . . . . . . . . . . . . . . . . . . . . . . . . 12,599 10,438 9,006 7,968 1,206 2,301 1,211 1,103 353 2,16120042 . . . . . . . . . . . . . . . . . . . . . . . . . . . . . . . 12,241 10,341 8,805 7,711 1,250 2,398 1,280 1,081 366 1,9002003 . . . . . . . . . . . . . . . . . . . . . . . . . . . . . . . . 11,869 9,698 8,210 7,263 1,111 2,244 1,229 1,067 295 2,1712002 . . . . . . . . . . . . . . . . . . . . . . . . . . . . . . . .
Percent
11,558 9,499 8,024 7,004 1,151 2,132 1,202 988 270 2,060
2007 . . . . . . . . . . . . . . . . . . . . . . . . . . . . . . . . 100.0 83.2 68.3 61.1 8.5 20.0 11.5 9.0 2.2 16.82006 . . . . . . . . . . . . . . . . . . . . . . . . . . . . . . . . 100.0 84.5 70.8 62.2 10.0 20.0 11.2 9.0 2.5 15.520052. . . . . . . . . . . . . . . . . . . . . . . . . . . . . . . . 100.0 82.8 71.5 63.2 9.6 18.3 9.6 8.8 2.8 17.220042 . . . . . . . . . . . . . . . . . . . . . . . . . . . . . . . 100.0 84.5 71.9 63.0 10.2 19.6 10.5 8.8 3.0 15.52003 . . . . . . . . . . . . . . . . . . . . . . . . . . . . . . . . 100.0 81.7 69.2 61.2 9.4 18.9 10.4 9.0 2.5 18.32002 . . . . . . . . . . . . . . . . . . . . . . . . . . . . . . . .
ASIAN AND PACIFIC ISLANDER5
Number
100.0 82.2 69.4 60.6 10.0 18.4 10.4 8.5 2.3 17.8
2001 . . . . . . . . . . . . . . . . . . . . . . . . . . . . . . . . 12,500 10,291 8,716 7,748 1,099 2,312 1,257 949 414 2,20820003 . . . . . . . . . . . . . . . . . . . . . . . . . . . . . . . 12,693 10,473 8,993 8,178 1,005 2,249 1,288 886 443 2,2201999 . . . . . . . . . . . . . . . . . . . . . . . . . . . . . . . .
Percent
11,964 9,769 8,299 7,426 982 2,204 1,179 897 450 2,196
2001 . . . . . . . . . . . . . . . . . . . . . . . . . . . . . . . . 100.0 82.3 69.7 62.0 8.8 18.5 10.1 7.6 3.3 17.720003 . . . . . . . . . . . . . . . . . . . . . . . . . . . . . . . 100.0 82.5 70.9 64.4 7.9 17.7 10.1 7.0 3.5 17.51999 . . . . . . . . . . . . . . . . . . . . . . . . . . . . . . . . 100.0 81.6 69.4 62.1 8.2 18.4 9.9 7.5 3.8 18.4
See footnotes at end of table.

U.S. Census Bureau Income, Poverty, and Health Insurance Coverage in the United States: 2007 65
Table C-2.Health Insurance Coverage by Race and Hispanic Origin: 1999 to 2007—Con.(Numbers in thousands. People as of March of the following year. For information on confidentiality protection, sampling error, nonsampling error, anddefinitions, see www.census.gov/apsd/techdoc/cps/cpsmar08.pdf)
Race, Hispanic origin, and year
Totalpeople
Covered by private and/or government health insurance
NotcoveredTotal
Private health insurance Government health insurance
Total
Employ-ment
basedDirect
purchase Total Medicaid Medicare
Militaryhealth
1care
HISPANIC (any race)Number2007 . . . . . . . . . . . . . . . . . . . . . . . . . . . . . . . . 46,026 31,256 20,194 18,551 1,804 13,031 10,348 2,887 801 14,7702006 . . . . . . . . . . . . . . . . . . . . . . . . . . . . . . . . 44,854 29,558 19,434 17,934 1,587 12,207 9,646 2,757 813 15,29620052. . . . . . . . . . . . . . . . . . . . . . . . . . . . . . . . 43,168 29,214 19,252 17,597 1,856 11,958 9,357 2,771 869 13,95420042 . . . . . . . . . . . . . . . . . . . . . . . . . . . . . . . 41,840 28,527 19,090 17,499 1,788 11,530 9,205 2,614 697 13,3132003 . . . . . . . . . . . . . . . . . . . . . . . . . . . . . . . . 40,425 27,355 18,372 16,970 1,559 10,716 8,505 2,462 639 13,0702002 . . . . . . . . . . . . . . . . . . . . . . . . . . . . . . . . 39,384 26,815 18,324 16,921 1,481 10,280 7,946 2,535 724 12,5692001 . . . . . . . . . . . . . . . . . . . . . . . . . . . . . . . . 37,438 25,146 17,460 16,096 1,401 9,227 7,074 2,295 704 12,29220003 . . . . . . . . . . . . . . . . . . . . . . . . . . . . . . . 36,093 24,340 17,264 16,031 1,354 8,566 6,552 2,141 682 11,7531999 . . . . . . . . . . . . . . . . . . . . . . . . . . . . . . . . 34,773 23,445 16,786 15,419 1,414 8,168 6,253 1,979 626 11,328
Percent2007 . . . . . . . . . . . . . . . . . . . . . . . . . . . . . . . . 100.0 67.9 43.9 40.3 3.9 28.3 22.5 6.3 1.7 32.12006 . . . . . . . . . . . . . . . . . . . . . . . . . . . . . . . . 100.0 65.9 43.3 40.0 3.5 27.2 21.5 6.1 1.8 34.120052. . . . . . . . . . . . . . . . . . . . . . . . . . . . . . . . 100.0 67.7 44.6 40.8 4.3 27.7 21.7 6.4 2.0 32.320042 . . . . . . . . . . . . . . . . . . . . . . . . . . . . . . . 100.0 68.2 45.6 41.8 4.3 27.6 22.0 6.2 1.7 31.82003 . . . . . . . . . . . . . . . . . . . . . . . . . . . . . . . . 100.0 67.7 45.4 42.0 3.9 26.5 21.0 6.1 1.6 32.32002 . . . . . . . . . . . . . . . . . . . . . . . . . . . . . . . . 100.0 68.1 46.5 43.0 3.8 26.1 20.2 6.4 1.8 31.92001 . . . . . . . . . . . . . . . . . . . . . . . . . . . . . . . . 100.0 67.2 46.6 43.0 3.7 24.6 18.9 6.1 1.9 32.820003 . . . . . . . . . . . . . . . . . . . . . . . . . . . . . . . 100.0 67.4 47.8 44.4 3.8 23.7 18.2 5.9 1.9 32.61999 . . . . . . . . . . . . . . . . . . . . . . . . . . . . . . . . 100.0 67.4 48.3 44.3 4.1 23.5 18.0 5.7 1.8 32.6
1 Military health care includes CHAMPUS (Comprehensive Health and Medical Plan for Uniformed Services)/Tricare and CHAMPVA (Civilian Health and Medical Program of theDepartment of Veterans Affairs), as well as care provided by the Health and Medical Program of the Department of Veterans Affairs and care provided by the Department of VeteransAffairs and the military.
2 The 2004 and 2005 data were revised in March 2007. See <www.census.gov/hhes/www/hlthins/usernote/schedule.html>.3 Implementation of a 28,000 household sample expansion.4 The 2003 CPS asked respondents to choose one or more races. White alone refers to people who reported White and did not report any other race category. The use of this
single-race population does not imply that it is the preferred method of presenting or analyzing data. The Census Bureau uses a variety of approaches. Information on people whoreported more than one race, such as White and American Indian and Alaska Native or Asian and Black or African American, is available from Census 2000 through AmericanFactFinder. About 2.6 percent of people reported more than one race in Census 2000.
5 The 2001 CPS and earlier years asked respondents to report only one race. The reference groups for these years are White, White not Hispanic, Black, and Asian and PacificIslander.
6 Black alone refers to people who reported Black or African American and did not report any other race.7 Asian alone refers to people who reported Asian and did not report any other race.
Note: All years reflect the implementation of the verification question. The data for 1999 through 2003 were revised using an approximation method for consistency with the revisionto the 2004 and 2005 estimates. To see the original series, see Table C-1 in Income, Poverty, and Health Insurance Coverage in the United States: 2005 at <www.census.gov/prod/2006pubs/p60-231.pdf>.
Source: U.S. Census Bureau, Current Population Survey, 2000 to 2008 Annual Social and Economic Supplements.

66 Income, Poverty, and Health Insurance Coverage in the United States: 2007 U.S. Census Bureau
Table C-3.Health Insurance Coverage by Age: 1999 to 2007(Numbers in thousands. People as of March of the following year. For information on confidentiality protection, sampling error, nonsampling error, anddefinitions, see www.census.gov/apsd/techdoc/cps/cpsmar08.pdf)
Age
Totalpeople
Covered by private and/or government health insurance
NotcoveredTotal
Private health insurance Government health insurance
Total
Employ-ment
basedDirect
purchase Total Medicaid Medicare
Militaryhealth
1care
ALL AGESNumber2007 . . . . . . . . . . . . . . . . . . . . . . . . . . 299,106 253,449 201,991 177,446 26,673 83,031 39,554 41,375 10,955 45,6572006 . . . . . . . . . . . . . . . . . . . . . . . . . . 296,824 249,829 201,690 177,152 27,066 80,270 38,281 40,343 10,547 46,99520052 . . . . . . . . . . . . . . . . . . . . . . . . . 293,834 249,020 201,167 176,924 27,055 80,213 38,104 40,177 11,166 44,81520042 . . . . . . . . . . . . . . . . . . . . . . . . . 291,166 247,669 200,924 176,247 27,551 79,486 37,955 39,703 10,789 43,4982003 . . . . . . . . . . . . . . . . . . . . . . . . . . 288,280 244,876 199,871 175,844 26,783 76,755 35,647 39,456 9,979 43,4042002 . . . . . . . . . . . . . . . . . . . . . . . . . . 285,933 243,914 200,891 177,095 26,846 73,624 33,246 38,448 10,063 42,0192001 . . . . . . . . . . . . . . . . . . . . . . . . . . 282,082 242,322 201,695 178,261 26,309 71,295 31,601 38,043 9,552 39,76020003 . . . . . . . . . . . . . . . . . . . . . . . . . 279,517 241,091 202,794 179,436 26,799 69,037 29,533 37,740 9,099 38,42619994 . . . . . . . . . . . . . . . . . . . . . . . . .
Percent
276,804 238,037 200,721 176,838 27,731 67,683 28,506 36,923 8,648 38,767
2007 . . . . . . . . . . . . . . . . . . . . . . . . . . 100.0 84.7 67.5 59.3 8.9 27.8 13.2 13.8 3.7 15.32006 . . . . . . . . . . . . . . . . . . . . . . . . . . 100.0 84.2 67.9 59.7 9.1 27.0 12.9 13.6 3.6 15.820052 . . . . . . . . . . . . . . . . . . . . . . . . . 100.0 84.7 68.5 60.2 9.2 27.3 13.0 13.7 3.8 15.320042 . . . . . . . . . . . . . . . . . . . . . . . . . 100.0 85.1 69.0 60.5 9.5 27.3 13.0 13.6 3.7 14.92003 . . . . . . . . . . . . . . . . . . . . . . . . . . 100.0 84.9 69.3 61.0 9.3 26.6 12.4 13.7 3.5 15.12002 . . . . . . . . . . . . . . . . . . . . . . . . . . 100.0 85.3 70.3 61.9 9.4 25.7 11.6 13.4 3.5 14.72001 . . . . . . . . . . . . . . . . . . . . . . . . . . 100.0 85.9 71.5 63.2 9.3 25.3 11.2 13.5 3.4 14.120003 . . . . . . . . . . . . . . . . . . . . . . . . . 100.0 86.3 72.6 64.2 9.6 24.7 10.6 13.5 3.3 13.719994 . . . . . . . . . . . . . . . . . . . . . . . . .
UNDER 18 YEARSNumber
100.0 86.0 72.5 63.9 10.0 24.5 10.3 13.3 3.1 14.0
2007 . . . . . . . . . . . . . . . . . . . . . . . . . . 74,403 66,254 47,750 44,252 3,930 23,041 20,899 518 2,101 8,1492006 . . . . . . . . . . . . . . . . . . . . . . . . . . 74,101 65,440 47,906 44,257 3,890 22,109 20,067 411 2,058 8,66120052 . . . . . . . . . . . . . . . . . . . . . . . . . 73,985 65,935 48,686 45,039 4,035 21,934 19,723 538 2,264 8,05020042 . . . . . . . . . . . . . . . . . . . . . . . . . 73,791 66,070 49,017 45,274 4,271 22,023 19,917 503 2,090 7,7212003 . . . . . . . . . . . . . . . . . . . . . . . . . . 73,580 65,466 48,784 45,297 3,918 21,389 19,392 483 2,021 8,1142002 . . . . . . . . . . . . . . . . . . . . . . . . . . 73,312 65,082 49,807 46,510 3,876 19,662 17,526 524 2,148 8,2292001 . . . . . . . . . . . . . . . . . . . . . . . . . . 72,628 64,401 49,978 46,762 3,647 18,822 16,502 423 2,381 8,22720003 . . . . . . . . . . . . . . . . . . . . . . . . . 72,314 63,929 50,755 47,679 3,604 17,658 15,090 518 2,563 8,38519994 . . . . . . . . . . . . . . . . . . . . . . . . .
Percent
72,281 63,248 50,588 47,102 4,087 16,793 14,697 364 2,076 9,033
2007 . . . . . . . . . . . . . . . . . . . . . . . . . . 100.0 89.0 64.2 59.5 5.3 31.0 28.1 0.7 2.8 11.02006 . . . . . . . . . . . . . . . . . . . . . . . . . . 100.0 88.3 64.6 59.7 5.3 29.8 27.1 0.6 2.8 11.720052 . . . . . . . . . . . . . . . . . . . . . . . . . 100.0 89.1 65.8 60.9 5.5 29.6 26.7 0.7 3.1 10.920042 . . . . . . . . . . . . . . . . . . . . . . . . . 100.0 89.5 66.4 61.4 5.8 29.8 27.0 0.7 2.8 10.52003 . . . . . . . . . . . . . . . . . . . . . . . . . . 100.0 89.0 66.3 61.6 5.3 29.1 26.4 0.7 2.7 11.02002 . . . . . . . . . . . . . . . . . . . . . . . . . . 100.0 88.8 67.9 63.4 5.3 26.8 23.9 0.7 2.9 11.22001 . . . . . . . . . . . . . . . . . . . . . . . . . . 100.0 88.7 68.8 64.4 5.0 25.9 22.7 0.6 3.3 11.320003 . . . . . . . . . . . . . . . . . . . . . . . . . 100.0 88.4 70.2 65.9 5.0 24.4 20.9 0.7 3.5 11.619994 . . . . . . . . . . . . . . . . . . . . . . . . . 100.0 87.5 70.0 65.2 5.7 23.2 20.3 0.5 2.9 12.5
See footnotes at end of table.
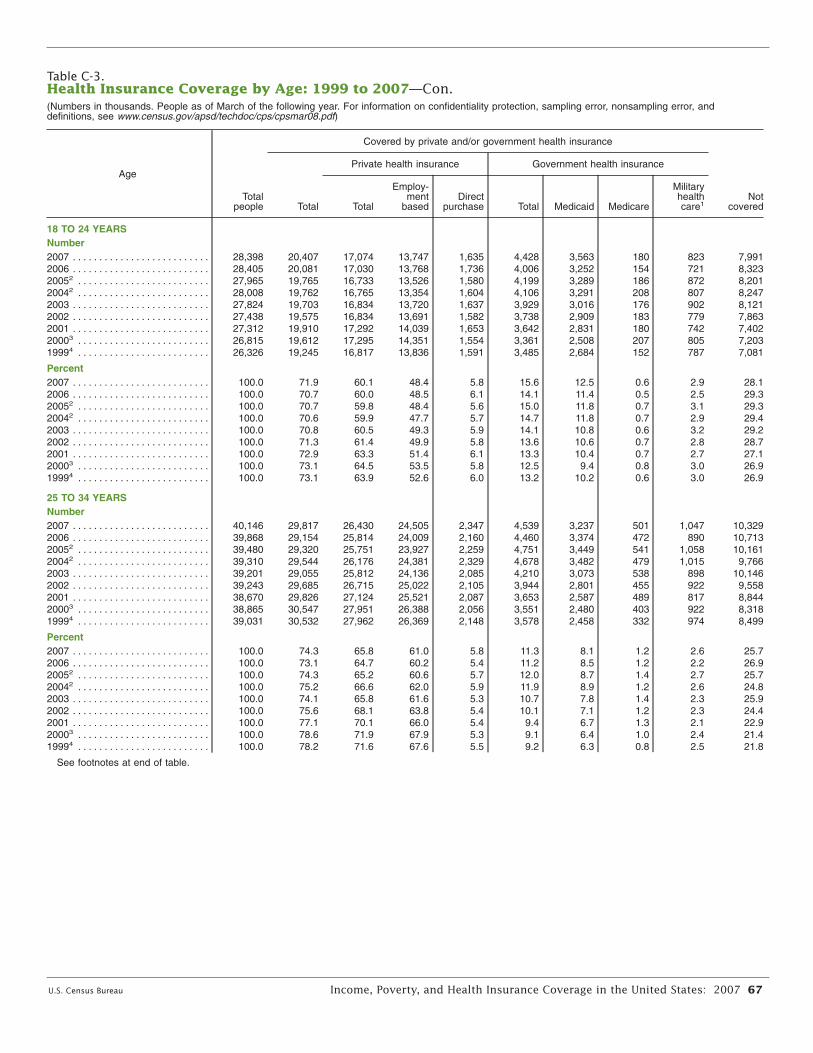
U.S. Census Bureau Income, Poverty, and Health Insurance Coverage in the United States: 2007 67
Table C-3.Health Insurance Coverage by Age: 1999 to 2007—Con.(Numbers in thousands. People as of March of the following year. For information on confidentiality protection, sampling error, nonsampling error, anddefinitions, see www.census.gov/apsd/techdoc/cps/cpsmar08.pdf)
Age
Totalpeople
Covered by private and/or government health insurance
NotcoveredTotal
Private health insurance Government health insurance
Total
Employ-ment
basedDirect
purchase Total Medicaid Medicare
Militaryhealth
1care
18 TO 24 YEARSNumber2007 . . . . . . . . . . . . . . . . . . . . . . . . . . 28,398 20,407 17,074 13,747 1,635 4,428 3,563 180 823 7,9912006 . . . . . . . . . . . . . . . . . . . . . . . . . . 28,405 20,081 17,030 13,768 1,736 4,006 3,252 154 721 8,32320052 . . . . . . . . . . . . . . . . . . . . . . . . . 27,965 19,765 16,733 13,526 1,580 4,199 3,289 186 872 8,20120042 . . . . . . . . . . . . . . . . . . . . . . . . . 28,008 19,762 16,765 13,354 1,604 4,106 3,291 208 807 8,2472003 . . . . . . . . . . . . . . . . . . . . . . . . . . 27,824 19,703 16,834 13,720 1,637 3,929 3,016 176 902 8,1212002 . . . . . . . . . . . . . . . . . . . . . . . . . . 27,438 19,575 16,834 13,691 1,582 3,738 2,909 183 779 7,8632001 . . . . . . . . . . . . . . . . . . . . . . . . . . 27,312 19,910 17,292 14,039 1,653 3,642 2,831 180 742 7,40220003 . . . . . . . . . . . . . . . . . . . . . . . . . 26,815 19,612 17,295 14,351 1,554 3,361 2,508 207 805 7,20319994 . . . . . . . . . . . . . . . . . . . . . . . . .
Percent
26,326 19,245 16,817 13,836 1,591 3,485 2,684 152 787 7,081
2007 . . . . . . . . . . . . . . . . . . . . . . . . . . 100.0 71.9 60.1 48.4 5.8 15.6 12.5 0.6 2.9 28.12006 . . . . . . . . . . . . . . . . . . . . . . . . . . 100.0 70.7 60.0 48.5 6.1 14.1 11.4 0.5 2.5 29.320052 . . . . . . . . . . . . . . . . . . . . . . . . . 100.0 70.7 59.8 48.4 5.6 15.0 11.8 0.7 3.1 29.320042 . . . . . . . . . . . . . . . . . . . . . . . . . 100.0 70.6 59.9 47.7 5.7 14.7 11.8 0.7 2.9 29.42003 . . . . . . . . . . . . . . . . . . . . . . . . . . 100.0 70.8 60.5 49.3 5.9 14.1 10.8 0.6 3.2 29.22002 . . . . . . . . . . . . . . . . . . . . . . . . . . 100.0 71.3 61.4 49.9 5.8 13.6 10.6 0.7 2.8 28.72001 . . . . . . . . . . . . . . . . . . . . . . . . . . 100.0 72.9 63.3 51.4 6.1 13.3 10.4 0.7 2.7 27.120003 . . . . . . . . . . . . . . . . . . . . . . . . . 100.0 73.1 64.5 53.5 5.8 12.5 9.4 0.8 3.0 26.919994 . . . . . . . . . . . . . . . . . . . . . . . . .
25 TO 34 YEARSNumber
100.0 73.1 63.9 52.6 6.0 13.2 10.2 0.6 3.0 26.9
2007 . . . . . . . . . . . . . . . . . . . . . . . . . . 40,146 29,817 26,430 24,505 2,347 4,539 3,237 501 1,047 10,3292006 . . . . . . . . . . . . . . . . . . . . . . . . . . 39,868 29,154 25,814 24,009 2,160 4,460 3,374 472 890 10,71320052 . . . . . . . . . . . . . . . . . . . . . . . . . 39,480 29,320 25,751 23,927 2,259 4,751 3,449 541 1,058 10,16120042 . . . . . . . . . . . . . . . . . . . . . . . . . 39,310 29,544 26,176 24,381 2,329 4,678 3,482 479 1,015 9,7662003 . . . . . . . . . . . . . . . . . . . . . . . . . . 39,201 29,055 25,812 24,136 2,085 4,210 3,073 538 898 10,1462002 . . . . . . . . . . . . . . . . . . . . . . . . . . 39,243 29,685 26,715 25,022 2,105 3,944 2,801 455 922 9,5582001 . . . . . . . . . . . . . . . . . . . . . . . . . . 38,670 29,826 27,124 25,521 2,087 3,653 2,587 489 817 8,84420003 . . . . . . . . . . . . . . . . . . . . . . . . . 38,865 30,547 27,951 26,388 2,056 3,551 2,480 403 922 8,31819994 . . . . . . . . . . . . . . . . . . . . . . . . .
Percent
39,031 30,532 27,962 26,369 2,148 3,578 2,458 332 974 8,499
2007 . . . . . . . . . . . . . . . . . . . . . . . . . . 100.0 74.3 65.8 61.0 5.8 11.3 8.1 1.2 2.6 25.72006 . . . . . . . . . . . . . . . . . . . . . . . . . . 100.0 73.1 64.7 60.2 5.4 11.2 8.5 1.2 2.2 26.920052 . . . . . . . . . . . . . . . . . . . . . . . . . 100.0 74.3 65.2 60.6 5.7 12.0 8.7 1.4 2.7 25.720042 . . . . . . . . . . . . . . . . . . . . . . . . . 100.0 75.2 66.6 62.0 5.9 11.9 8.9 1.2 2.6 24.82003 . . . . . . . . . . . . . . . . . . . . . . . . . . 100.0 74.1 65.8 61.6 5.3 10.7 7.8 1.4 2.3 25.92002 . . . . . . . . . . . . . . . . . . . . . . . . . . 100.0 75.6 68.1 63.8 5.4 10.1 7.1 1.2 2.3 24.42001 . . . . . . . . . . . . . . . . . . . . . . . . . . 100.0 77.1 70.1 66.0 5.4 9.4 6.7 1.3 2.1 22.920003 . . . . . . . . . . . . . . . . . . . . . . . . . 100.0 78.6 71.9 67.9 5.3 9.1 6.4 1.0 2.4 21.419994 . . . . . . . . . . . . . . . . . . . . . . . . . 100.0 78.2 71.6 67.6 5.5 9.2 6.3 0.8 2.5 21.8
See footnotes at end of table.
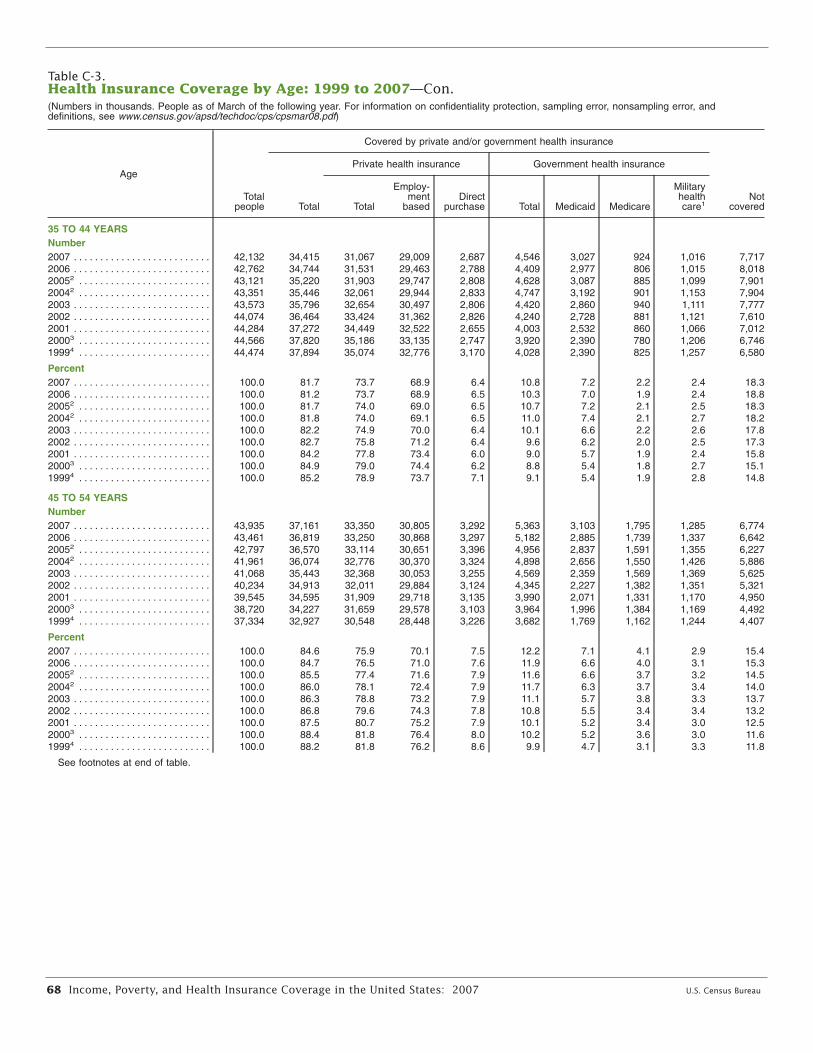
68 Income, Poverty, and Health Insurance Coverage in the United States: 2007 U.S. Census Bureau
Table C-3.Health Insurance Coverage by Age: 1999 to 2007—Con.(Numbers in thousands. People as of March of the following year. For information on confidentiality protection, sampling error, nonsampling error, anddefinitions, see www.census.gov/apsd/techdoc/cps/cpsmar08.pdf)
Age
Totalpeople
Covered by private and/or government health insurance
NotcoveredTotal
Private health insurance Government health insurance
Total
Employ-ment
basedDirect
purchase Total Medicaid Medicare
Militaryhealth
1care
35 TO 44 YEARSNumber2007 . . . . . . . . . . . . . . . . . . . . . . . . . . 42,132 34,415 31,067 29,009 2,687 4,546 3,027 924 1,016 7,7172006 . . . . . . . . . . . . . . . . . . . . . . . . . . 42,762 34,744 31,531 29,463 2,788 4,409 2,977 806 1,015 8,01820052 . . . . . . . . . . . . . . . . . . . . . . . . . 43,121 35,220 31,903 29,747 2,808 4,628 3,087 885 1,099 7,90120042 . . . . . . . . . . . . . . . . . . . . . . . . . 43,351 35,446 32,061 29,944 2,833 4,747 3,192 901 1,153 7,9042003 . . . . . . . . . . . . . . . . . . . . . . . . . . 43,573 35,796 32,654 30,497 2,806 4,420 2,860 940 1,111 7,7772002 . . . . . . . . . . . . . . . . . . . . . . . . . . 44,074 36,464 33,424 31,362 2,826 4,240 2,728 881 1,121 7,6102001 . . . . . . . . . . . . . . . . . . . . . . . . . . 44,284 37,272 34,449 32,522 2,655 4,003 2,532 860 1,066 7,01220003 . . . . . . . . . . . . . . . . . . . . . . . . . 44,566 37,820 35,186 33,135 2,747 3,920 2,390 780 1,206 6,74619994 . . . . . . . . . . . . . . . . . . . . . . . . .
Percent
44,474 37,894 35,074 32,776 3,170 4,028 2,390 825 1,257 6,580
2007 . . . . . . . . . . . . . . . . . . . . . . . . . . 100.0 81.7 73.7 68.9 6.4 10.8 7.2 2.2 2.4 18.32006 . . . . . . . . . . . . . . . . . . . . . . . . . . 100.0 81.2 73.7 68.9 6.5 10.3 7.0 1.9 2.4 18.820052 . . . . . . . . . . . . . . . . . . . . . . . . . 100.0 81.7 74.0 69.0 6.5 10.7 7.2 2.1 2.5 18.320042 . . . . . . . . . . . . . . . . . . . . . . . . . 100.0 81.8 74.0 69.1 6.5 11.0 7.4 2.1 2.7 18.22003 . . . . . . . . . . . . . . . . . . . . . . . . . . 100.0 82.2 74.9 70.0 6.4 10.1 6.6 2.2 2.6 17.82002 . . . . . . . . . . . . . . . . . . . . . . . . . . 100.0 82.7 75.8 71.2 6.4 9.6 6.2 2.0 2.5 17.32001 . . . . . . . . . . . . . . . . . . . . . . . . . . 100.0 84.2 77.8 73.4 6.0 9.0 5.7 1.9 2.4 15.820003 . . . . . . . . . . . . . . . . . . . . . . . . . 100.0 84.9 79.0 74.4 6.2 8.8 5.4 1.8 2.7 15.119994 . . . . . . . . . . . . . . . . . . . . . . . . .
45 TO 54 YEARSNumber
100.0 85.2 78.9 73.7 7.1 9.1 5.4 1.9 2.8 14.8
2007 . . . . . . . . . . . . . . . . . . . . . . . . . . 43,935 37,161 33,350 30,805 3,292 5,363 3,103 1,795 1,285 6,7742006 . . . . . . . . . . . . . . . . . . . . . . . . . . 43,461 36,819 33,250 30,868 3,297 5,182 2,885 1,739 1,337 6,64220052 . . . . . . . . . . . . . . . . . . . . . . . . . 42,797 36,570 33,114 30,651 3,396 4,956 2,837 1,591 1,355 6,22720042 . . . . . . . . . . . . . . . . . . . . . . . . . 41,961 36,074 32,776 30,370 3,324 4,898 2,656 1,550 1,426 5,8862003 . . . . . . . . . . . . . . . . . . . . . . . . . . 41,068 35,443 32,368 30,053 3,255 4,569 2,359 1,569 1,369 5,6252002 . . . . . . . . . . . . . . . . . . . . . . . . . . 40,234 34,913 32,011 29,884 3,124 4,345 2,227 1,382 1,351 5,3212001 . . . . . . . . . . . . . . . . . . . . . . . . . . 39,545 34,595 31,909 29,718 3,135 3,990 2,071 1,331 1,170 4,95020003 . . . . . . . . . . . . . . . . . . . . . . . . . 38,720 34,227 31,659 29,578 3,103 3,964 1,996 1,384 1,169 4,49219994 . . . . . . . . . . . . . . . . . . . . . . . . .
Percent
37,334 32,927 30,548 28,448 3,226 3,682 1,769 1,162 1,244 4,407
2007 . . . . . . . . . . . . . . . . . . . . . . . . . . 100.0 84.6 75.9 70.1 7.5 12.2 7.1 4.1 2.9 15.42006 . . . . . . . . . . . . . . . . . . . . . . . . . . 100.0 84.7 76.5 71.0 7.6 11.9 6.6 4.0 3.1 15.320052 . . . . . . . . . . . . . . . . . . . . . . . . . 100.0 85.5 77.4 71.6 7.9 11.6 6.6 3.7 3.2 14.520042 . . . . . . . . . . . . . . . . . . . . . . . . . 100.0 86.0 78.1 72.4 7.9 11.7 6.3 3.7 3.4 14.02003 . . . . . . . . . . . . . . . . . . . . . . . . . . 100.0 86.3 78.8 73.2 7.9 11.1 5.7 3.8 3.3 13.72002 . . . . . . . . . . . . . . . . . . . . . . . . . . 100.0 86.8 79.6 74.3 7.8 10.8 5.5 3.4 3.4 13.22001 . . . . . . . . . . . . . . . . . . . . . . . . . . 100.0 87.5 80.7 75.2 7.9 10.1 5.2 3.4 3.0 12.520003 . . . . . . . . . . . . . . . . . . . . . . . . . 100.0 88.4 81.8 76.4 8.0 10.2 5.2 3.6 3.0 11.619994 . . . . . . . . . . . . . . . . . . . . . . . . . 100.0 88.2 81.8 76.2 8.6 9.9 4.7 3.1 3.3 11.8
See footnotes at end of table.

U.S. Census Bureau Income, Poverty, and Health Insurance Coverage in the United States: 2007 69
Table C-3.Health Insurance Coverage by Age: 1999 to 2007—Con.(Numbers in thousands. People as of March of the following year. For information on confidentiality protection, sampling error, nonsampling error, anddefinitions, see www.census.gov/apsd/techdoc/cps/cpsmar08.pdf)
Age
Totalpeople
Covered by private and/or government health insurance
NotcoveredTotal
Private health insurance Government health insurance
Total
Employ-ment
basedDirect
purchase Total Medicaid Medicare
Militaryhealth
1care
55 TO 64 YEARSNumber2007 . . . . . . . . . . . . . . . . . . . . . . . . . . 33,302 29,291 25,114 22,569 3,237 6,651 2,462 3,179 2,079 4,0112006 . . . . . . . . . . . . . . . . . . . . . . . . . . 32,191 28,096 24,255 21,701 3,276 6,122 2,362 2,956 1,845 4,09520052 . . . . . . . . . . . . . . . . . . . . . . . . . 30,981 27,154 23,543 21,092 3,194 5,886 2,325 2,708 1,908 3,82620042 . . . . . . . . . . . . . . . . . . . . . . . . . 29,536 26,016 22,640 20,254 3,180 5,478 2,085 2,644 1,795 3,5192003 . . . . . . . . . . . . . . . . . . . . . . . . . . 28,375 25,039 21,963 19,692 3,051 4,893 1,757 2,494 1,471 3,3352002 . . . . . . . . . . . . . . . . . . . . . . . . . . 27,399 24,219 21,170 18,844 3,123 4,882 1,773 2,392 1,482 3,1802001 . . . . . . . . . . . . . . . . . . . . . . . . . . 25,874 22,820 19,959 17,862 2,832 4,567 1,807 2,301 1,220 3,05420003 . . . . . . . . . . . . . . . . . . . . . . . . . 24,672 21,641 18,977 16,792 2,990 4,185 1,731 2,159 1,024 3,03119994 . . . . . . . . . . . . . . . . . . . . . . . . .
Percent
23,981 21,082 18,678 16,518 3,008 4,033 1,551 2,084 1,053 2,899
2007 . . . . . . . . . . . . . . . . . . . . . . . . . . 100.0 88.0 75.4 67.8 9.7 20.0 7.4 9.5 6.2 12.02006 . . . . . . . . . . . . . . . . . . . . . . . . . . 100.0 87.3 75.3 67.4 10.2 19.0 7.3 9.2 5.7 12.720052 . . . . . . . . . . . . . . . . . . . . . . . . . 100.0 87.6 76.0 68.1 10.3 19.0 7.5 8.7 6.2 12.420042 . . . . . . . . . . . . . . . . . . . . . . . . . 100.0 88.1 76.7 68.6 10.8 18.5 7.1 9.0 6.1 11.92003 . . . . . . . . . . . . . . . . . . . . . . . . . . 100.0 88.2 77.4 69.4 10.8 17.2 6.2 8.8 5.2 11.82002 . . . . . . . . . . . . . . . . . . . . . . . . . . 100.0 88.4 77.3 68.8 11.4 17.8 6.5 8.7 5.4 11.62001 . . . . . . . . . . . . . . . . . . . . . . . . . . 100.0 88.2 77.1 69.0 10.9 17.7 7.0 8.9 4.7 11.820003 . . . . . . . . . . . . . . . . . . . . . . . . . 100.0 87.7 76.9 68.1 12.1 17.0 7.0 8.8 4.2 12.319994 . . . . . . . . . . . . . . . . . . . . . . . . .
65 YEARS AND OLDERNumber
100.0 87.9 77.9 68.9 12.5 16.8 6.5 8.7 4.4 12.1
2007 . . . . . . . . . . . . . . . . . . . . . . . . . . 36,790 36,103 21,206 12,558 9,546 34,464 3,263 34,278 2,604 6862006 . . . . . . . . . . . . . . . . . . . . . . . . . . 36,035 35,494 21,904 13,086 9,918 33,982 3,364 33,806 2,682 54120052 . . . . . . . . . . . . . . . . . . . . . . . . . 35,505 35,056 21,437 12,942 9,783 33,859 3,394 33,727 2,611 44920042 . . . . . . . . . . . . . . . . . . . . . . . . . 35,209 34,755 21,488 12,670 10,010 33,555 3,332 33,419 2,504 4542003 . . . . . . . . . . . . . . . . . . . . . . . . . . 34,659 34,373 21,457 12,448 10,032 33,345 3,190 33,257 2,206 2862002 . . . . . . . . . . . . . . . . . . . . . . . . . . 34,234 33,976 20,929 11,782 10,210 32,813 3,283 32,631 2,259 2582001 . . . . . . . . . . . . . . . . . . . . . . . . . . 33,769 33,498 20,984 11,837 10,299 32,618 3,270 32,458 2,156 27220003 . . . . . . . . . . . . . . . . . . . . . . . . . 33,566 33,314 20,971 11,512 10,746 32,398 3,339 32,289 1,410 25119994 . . . . . . . . . . . . . . . . . . . . . . . . .
Percent
33,377 33,109 21,054 11,789 10,501 32,083 2,956 32,004 1,257 268
2007 . . . . . . . . . . . . . . . . . . . . . . . . . . 100.0 98.1 57.6 34.1 25.9 93.7 8.9 93.2 7.1 1.92006 . . . . . . . . . . . . . . . . . . . . . . . . . . 100.0 98.5 60.8 36.3 27.5 94.3 9.3 93.8 7.4 1.520052 . . . . . . . . . . . . . . . . . . . . . . . . . 100.0 98.7 60.4 36.5 27.6 95.4 9.6 95.0 7.4 1.320042 . . . . . . . . . . . . . . . . . . . . . . . . . 100.0 98.7 61.0 36.0 28.4 95.3 9.5 94.9 7.1 1.32003 . . . . . . . . . . . . . . . . . . . . . . . . . . 100.0 99.2 61.9 35.9 28.9 96.2 9.2 96.0 6.4 0.82002 . . . . . . . . . . . . . . . . . . . . . . . . . . 100.0 99.2 61.1 34.4 29.8 95.8 9.6 95.3 6.6 0.82001 . . . . . . . . . . . . . . . . . . . . . . . . . . 100.0 99.2 62.1 35.1 30.5 96.6 9.7 96.1 6.4 0.820003 . . . . . . . . . . . . . . . . . . . . . . . . . 100.0 99.3 62.5 34.3 32.0 96.5 9.9 96.2 4.2 0.719994 . . . . . . . . . . . . . . . . . . . . . . . . . 100.0 99.2 63.1 35.3 31.5 96.1 8.9 95.9 3.8 0.8
1 Military health care includes CHAMPUS (Comprehensive Health and Medical Plan for Uniformed Services)/Tricare and CHAMPVA (Civilian Health and Medical Program of theDepartment of Veterans Affairs), as well as care provided by the Health and Medical Program of the Department of Veterans Affairs and care provided by the Department of VeteransAffairs and the military.
2 The 2004 and 2005 data were revised in March 2007. See <www.census.gov/hhes/www/hlthins/usernote/schedule.html>.3 Implementation of a 28,000 household sample expansion.4 Estimates reflect the results of follow-up verification questions and implementation of Census 2000-based population controls.
Note: All years reflect the implementation of the verification question. The data for 1999 through 2003 were revised using an approximation method for consistency with the revisionto the 2004 and 2005 estimates. To see the original series, see Table C-1 in Income, Poverty, and Health Insurance Coverage in the United States: 2005 at <www.census.gov/prod/2006pubs/p60-231.pdf>.
Source: U.S. Census Bureau, Current Population Survey, 2000 to 2008 Annual Social and Economic Supplements.
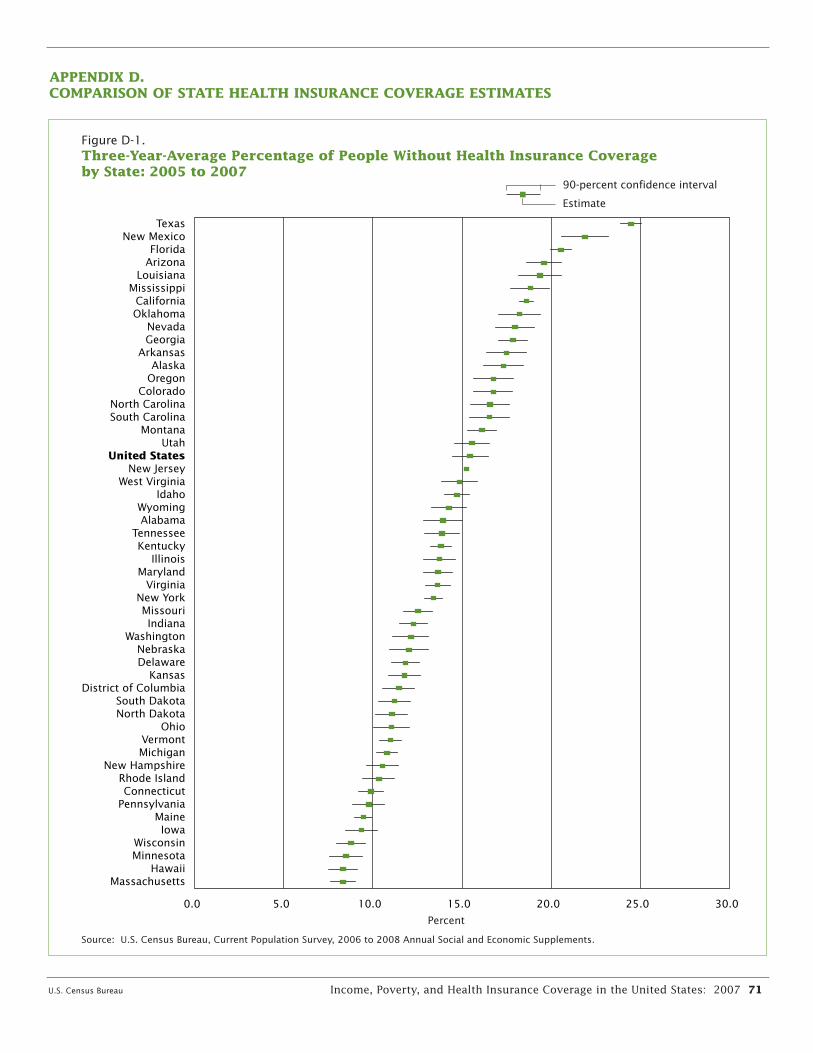
U.S. Census Bureau Income, Poverty, and Health Insurance Coverage in the United States: 2007 71
APPENDIX D.COMPARISON OF STATE HEALTH INSURANCE COVERAGE ESTIMATES
Figure D-1.Three-Year-Average Percentage of People Without Health Insurance Coverage by State: 2005 to 2007
Percent
Source: U.S. Census Bureau, Current Population Survey, 2006 to 2008 Annual Social and Economic Supplements.
90-percent confidence interval
Estimate
0.0 5.0 10.0 15.0 20.0 25.0 30.0
TexasNew Mexico
FloridaArizona
LouisianaMississippi
CaliforniaOklahoma
NevadaGeorgia
ArkansasAlaska
OregonColorado
North CarolinaSouth Carolina
MontanaUtah
United StatesNew Jersey
West VirginiaIdaho
WyomingAlabama
TennesseeKentucky
IllinoisMaryland
VirginiaNew YorkMissouriIndiana
WashingtonNebraskaDelaware
KansasDistrict of Columbia
South DakotaNorth Dakota
OhioVermontMichigan
New HampshireRhode IslandConnecticut
PennsylvaniaMaineIowa
WisconsinMinnesota
HawaiiMassachusetts


