Income Inequality and Social Dysfunction - Equality … (2007) brought together evidence sug-gesting...
22
Income Inequality and Social Dysfunction Richard G. Wilkinson 1 and Kate E. Pickett 2 1 Division of Epidemiology and Public Health, University of Nottingham, Nottingham, NG7 2UH, United Kingdom; email: [email protected] 2 Department of Health Sciences, University of York, and Hull-York Medical School, York, YO10 5DD, United Kingdom; email: [email protected] Annu. Rev. Sociol. 2009. 35:493–511 First published online as a Review in Advance on April 6, 2009 The Annual Review of Sociology is online at soc.annualreviews.org This article’s doi: 10.1146/annurev-soc-070308-115926 Copyright c 2009 by Annual Reviews. All rights reserved 0360-0572/09/0811-0493$20.00 Key Words health, social problems, social stratification, equality, relative deprivation Abstract Population health tends to be better in societies where income is more equally distributed. Recent evidence suggests that many other social problems, including mental illness, violence, imprisonment, lack of trust, teenage births, obesity, drug abuse, and poor educational per- formance of schoolchildren, are also more common in more unequal societies. Differences in the prevalence of ill health and social problems between more and less equal societies seem to be large and to extend to the vast majority of the population. Rather than referencing all the literature, this paper attempts to show which interpretations of these relationships are consistent with the research evidence. After discussing their more important and illuminating characteristics, we conclude that these relationships are likely to reflect a sensitivity of health and social problems to the scale of social stratification and status competition, underpinned by societal differences in material inequality. 493 Annu. Rev. Sociol. 2009.35:493-511. Downloaded from arjournals.annualreviews.org by 79.79.134.19 on 07/24/09. For personal use only.
Transcript of Income Inequality and Social Dysfunction - Equality … (2007) brought together evidence sug-gesting...

ANRV381-SO35-23 ARI 5 June 2009 9:34
Income Inequality andSocial DysfunctionRichard G. Wilkinson1 and Kate E. Pickett2
1Division of Epidemiology and Public Health, University of Nottingham, Nottingham,NG7 2UH, United Kingdom; email: [email protected] of Health Sciences, University of York, and Hull-York Medical School,York, YO10 5DD, United Kingdom; email: [email protected]
Annu. Rev. Sociol. 2009. 35:493–511
First published online as a Review in Advance onApril 6, 2009
The Annual Review of Sociology is online atsoc.annualreviews.org
This article’s doi:10.1146/annurev-soc-070308-115926
Copyright c© 2009 by Annual Reviews.All rights reserved
0360-0572/09/0811-0493$20.00
Key Words
health, social problems, social stratification, equality, relativedeprivation
AbstractPopulation health tends to be better in societies where income is moreequally distributed. Recent evidence suggests that many other socialproblems, including mental illness, violence, imprisonment, lack oftrust, teenage births, obesity, drug abuse, and poor educational per-formance of schoolchildren, are also more common in more unequalsocieties. Differences in the prevalence of ill health and social problemsbetween more and less equal societies seem to be large and to extendto the vast majority of the population. Rather than referencing all theliterature, this paper attempts to show which interpretations of theserelationships are consistent with the research evidence. After discussingtheir more important and illuminating characteristics, we conclude thatthese relationships are likely to reflect a sensitivity of health and socialproblems to the scale of social stratification and status competition,underpinned by societal differences in material inequality.
493
Ann
u. R
ev. S
ocio
l. 20
09.3
5:49
3-51
1. D
ownl
oade
d fr
om a
rjou
rnal
s.an
nual
revi
ews.
org
by 7
9.79
.134
.19
on 0
7/24
/09.
For
per
sona
l use
onl
y.

ANRV381-SO35-23 ARI 5 June 2009 9:34
WHAT HAS TO BE EXPLAINED
Better Health in More Equal Societies
The first evidence of a tendency for societieswith lower income inequality to have betterhealth came from an international cross-sectional analysis of 56 rich and poor countries.Life expectancy and infant mortality wereregressed against national income per capitaand the Gini coefficient of income distribution(Rodgers 1979). The paper concluded that
[t]he most striking result is the consistent sig-nificance of the income distribution variable.This is a very robust conclusion which holdsacross a variety of specifications. . . . The re-sults for life expectancy at birth suggest thatthe difference in average life expectancy be-tween a relatively egalitarian and relativelyinegalitarian country is likely to be as muchas five to ten years (p. 350).
There are now as many as 200 analyses ofthe nature of this relationship, and a number ofreviews have been published (Lynch et al. 2004,Macinko et al. 2003, Subramanian & Kawachi2004, Wilkinson & Pickett 2006).
The first large review covered 98 studies(Lynch et al. 2004). Of these, 42% were classi-fied as wholly supportive (all measures of asso-ciation showed statistically significant relation-ships between smaller income differences andbetter health); a further 25% were classified asonly partially supportive (some, but not all as-sociations were in the expected direction andstatistically significant); and the remaining 33%provided no support (no statistically significantsupportive relationships).
A more recent paper reviewed 168 analy-ses and classified them using the same criteria(Wilkinson & Pickett 2006). Of these, 87 (52%)were wholly supportive, 44 (26%) were partiallysupportive, and 37 (22%) provided no support.Eight studies reported one or more significantassociations between better health and greaterinequality, compared with 131 reporting signif-icant associations between better health and less
inequality. In both reviews, results were classi-fied after the use of whatever control variablesthe original authors thought relevant. Of the 37studies classified in the second review as unsup-portive, 21 found significant supportive associa-tions before the use of control variables. Over-all, just over 90% of analyses produced somesignificant confirmation of the hypothesized re-lation before the use of control variables. Be-cause the distinction between confounders andmediators depends on theory, it is not possi-ble to assess the quality of studies before de-ciding how the causal pathways should be the-orized. The same applies to assumptions aboutreference groups that affect whether inequalityshould be measured in larger or smaller areas.
Fewer Social Problems in MoreEqual Societies
The studies of health in relation to income in-equality need to be understood in the contextof a wider body of evidence that suggests thata broad range of social problems may also bemore common in more unequal societies. A re-view of 34 studies concluded that the tendencyfor homicides to be more common in more un-equal societies was robust (Hsieh & Pugh 1993).In a later paper analyzing data for the 50 U.S.states, Kaplan et al. (1996) reported strong as-sociations (adjusted for median state incomes)between greater state income inequality andhigher rates of low birth weight, homicide, vi-olent crime, and imprisonment and worse edu-cational outcomes for schoolchildren. In addi-tion to morbidity and mortality, Wilkinson &Pickett (2007) brought together evidence sug-gesting that inequality was also associated withrates of obesity, teenage birth, mental illness,homicide, low levels of trust, low social capi-tal, hostility, racism, poor educational perfor-mance among schoolchildren, imprisonment,drug overdose mortality, and low social mobil-ity. Outcomes were always significantly worsein more unequal, rich, developed countries and,almost always, in the more unequal of the 50U.S. states as well. Since then, the list of so-cial problems associated with inequality has
494 Wilkinson · Pickett
Ann
u. R
ev. S
ocio
l. 20
09.3
5:49
3-51
1. D
ownl
oade
d fr
om a
rjou
rnal
s.an
nual
revi
ews.
org
by 7
9.79
.134
.19
on 0
7/24
/09.
For
per
sona
l use
onl
y.

ANRV381-SO35-23 ARI 5 June 2009 9:34
Table 1 Associations of social problems with income inequalitya
OutcomeInternationalcomparison
U.S. statecomparison Key sources
Homicide—adults + + Hsieh & Pugh 1993, Kaplan et al. 1996, Kennedy et al. 1996Homicide—juvenile n.a. + Pickett et al. 2005bViolent crime + + Hsieh & Pugh 1993, Kaplan et al. 1996, Krohn 1976Property crime ∼ ∼ Krohn 1976, Kelly 2000Conflict—children + n.a. Pickett et al. 2005bObesity—adults + + Pickett et al. 2005a, Wilkinson & Pickett 2009Overweight—children + + Pickett & Wilkinson 2007Math and reading scores + + Kaplan et al. 1996, Pickett & Wilkinson 2007School drop-out rate n.a. + Kaplan et al. 1996, Pickett & Wilkinson 2007Racism n.a. + Kennedy et al. 1997Smoking ∼ ∼ Diez-Roux et al. 2000, Pampel 2002Suicide ∼ ∼ Lester 1987, Andres 2005, Kowalski et al. 1987Teenage births + + Gold et al. 2001, Pickett et al. 2005bChild well-being + n.a. Pickett & Wilkinson 2007Drug abuse + n.a. Wilkinson & Pickett 2009Drug overdose deaths n.a. + Wilkinson & Pickett 2007Alcohol abuse ∼ ∼ Henderson et al. 2004, Elgar et al. 2005Mental illness—adults + ∼ Wilkinson & Pickett 2007, 2009Mental illness—children n.a. + Pickett et al. 2005bImprisonment rate + + Kaplan et al. 1996, Wilkinson & Pickett 2007Social capital n.a. + Kawachi et al. 1997Social mobility + n.a. Wilkinson & Pickett 2007Status of women + + Kawachi et al. 1999, Wilkinson & Pickett 2009Trust + + Kawachi et al. 1997, Uslaner 2002
aAbbreviations: +, worse outcomes significantly associated with greater inequality; −, better outcomes significantly associated with greater inequality; ∼,no statistically significant association; n.a., data not available.
lengthened to include women’s status, juvenilehomicides, child conflict, children overweight,and drug abuse (Wilkinson & Pickett 2009).
Table 1 provides a summary of all 24 vari-ables for which we have been able to find pub-lished measures of association with income in-equality internationally or among the 50 U.S.states, together with the key sources. Associa-tions between inequality and 14 of the outcomeshave been measured in both settings, 6 only in-ternationally, and 4 only among the U.S. states.
Of the 38 measures of association betweeninequality and an outcome in either setting,29 showed significantly worse outcomes withgreater inequality. Only smoking, suicides, al-cohol abuse, and property crime (in contrast to
violent crime) were not related to inequality ineither setting. Although mental illness in adultswas related to inequality internationally, the re-lationship was only found among women andchildren in the 50 states.
As we discuss below, the outcomes relatedto inequality tend to be those with the steepestsocial gradients that accumulate at the bottomof society. The lack of relationships (Table 1)with suicide (in both settings) and with mentalillness in the 50 states may reflect the lack ofsocial gradients in these outcomes. Although insome countries suicide is more common amongthose with lower social status, this is not uni-versal. A social gradient in suicide has emergedin Britain only since 1970. A seminal paper on
www.annualreviews.org • Impact of Inequality 495
Ann
u. R
ev. S
ocio
l. 20
09.3
5:49
3-51
1. D
ownl
oade
d fr
om a
rjou
rnal
s.an
nual
revi
ews.
org
by 7
9.79
.134
.19
on 0
7/24
/09.
For
per
sona
l use
onl
y.

ANRV381-SO35-23 ARI 5 June 2009 9:34
death rates in Harlem, New York, reported thatsuicide was the only cause of death that wasnot more common there than in the rest of theUnited States (McCord & Freeman 1990). Sim-ilarly, although mental illness is widely associ-ated with lower social status internationally, theUnited States may be an exception to this pat-tern. Mental illness is less prevalent in ethnicminority populations than among white Amer-icans, despite minorities’ generally lower so-cioeconomic status (Centers for Disease Con-trol and Prevention 2004). Whether the same istrue of property crime is less clear. White collarcrimes—including fraud, computer crime, andembezzlement—will reduce the social gradientin property crime.
Smoking has a strong social gradient in mostcountries, yet it appears not to be related toinequality (Diez-Roux et al. 2000, Kelly 2000,Krohn 1976, Pampel 2002, Wilkinson et al.1998). We are unaware of any explanation ofwhy smoking might be an exception to whatseems to be a tendency for outcomes with socialgradients to be more common in more unequalsocieties.
Because comparison is prevented by the useof different measures of income distributionand the inclusion of different numbers of coun-tries and states, measures of association are notincluded in Table 1. However, Wilkinson &
Pickett (2009) estimate 10 of these relation-ships on a consistent basis. They included allcountries among the 50 richest in terms ofgross national product per capita, with pop-ulations of at least 3 million (to exclude taxhavens) and with income distribution data inthe UN Human Development Reports (2003,2004, 2005, 2006). Figure 5 (discussed furtherbelow) shows the 23 countries that met thesecriteria. The measure of income distributionused was the ratio of incomes of the poorest tothe richest 20% of the population in each coun-try. The U.S. analyses used the Gini coefficientof household income from the U.S. Census Bu-reau (2000, Summary File 3). Table 2 shows thecorrelation coefficients and p-values from theseanalyses.
Measures of association in two independentsettings provided a check on their reliability.With the exception of mental illness among the50 U.S. states, all measures of association showa significant tendency for worse outcomes tobe associated with greater income inequalityin both settings. Correlation coefficients rangefrom 0.4 to 0.9. Given that we are dealingwith differences in prevalence of outcomes inwhole populations, the strength, significance,and consistency of the associations in these twoindependent settings suggest that these rela-tionships deserve careful attention.
Table 2 Health and social problems in relation to income inequality and average income
Rich countries 50 U.S. states
Inequality Average income Inequality Average income
Outcome r p r p r p r pTrust −0.66 <0.001 0.49 0.02 −0.70 <0.001 0.25 0.11Mental illness 0.59 0.04 0.38 0.20 0.18 0.20 −0.03 0.84Life expectancy −0.44 0.04 0.01 0.95 −0.45 <0.001 0.43 0.002Infant mortality 0.42 0.04 0.02 0.92 0.43 0.002 −0.40 0.004Obesity 0.57 0.007 −0.08 0.74 0.47 <0.001 −0.33 0.02Educational performance −0.45 0.04 0.43 0.05 −0.47 <0.001 0.35 0.01Teenage births 0.73 <0.001 0.18 0.43 0.46 <0.001 −0.44 0.001Homicides 0.47 0.02 0.13 0.56 0.42 0.003 −0.14 0.35Imprisonment 0.67 <0.001 0.21 0.34 0.48 <0.001 −0.12 0.39Social mobility 0.93 <0.001 0.26 0.53 — — — —Index of health and social problems 0.87 <0.001 −0.05 0.82 0.59 <0.001 −0.36 0.01
496 Wilkinson · Pickett
Ann
u. R
ev. S
ocio
l. 20
09.3
5:49
3-51
1. D
ownl
oade
d fr
om a
rjou
rnal
s.an
nual
revi
ews.
org
by 7
9.79
.134
.19
on 0
7/24
/09.
For
per
sona
l use
onl
y.

ANRV381-SO35-23 ARI 5 June 2009 9:34
AustraliaAustria
Belgium
CanadaDenmark
Finland
France
Germany
Greece
Ireland
Italy
Japan
Netherlands
New Zealand
Norway
Portugal
Spain
Sweden
Switzerland
UK
USA
Better
Worse
Inde
x of
hea
lth
and
soci
al p
robl
ems
Low HighIncome inequality
Figure 1Index of Health and Social Problems in relation to income inequality in rich countries. Income inequality ismeasured by the ratio of incomes among the richest compared with the poorest 20% in each country. Theindex combines data for the 10 outcomes listed in Table 2. Raw scores for each variable were converted toz-scores and each country given its average z-score. Source: Wilkinson & Pickett 2009.
An Index of Health andSocial Problems
Wilkinson & Pickett (2009) combined the 10outcomes listed in Table 2 into a single Indexof Health and Social Problems (last row of ta-ble) by calculating z-scores for each outcomein each setting and then taking the z-score foreach country or state averaged across all thevariables.
The Index of Health and Social Problemshas a correlation coefficient of almost 0.9 withinequality among rich countries and almost 0.6among U.S. states (see Figures 1 and 2).
These associations do not reflect an unrep-resentative selection of outcomes. Pickett &Wilkinson (2007) also examined relationshipsbetween inequality and the UNICEF Index ofChild Well-Being in rich countries (UNICEFInnocenti Research Centre 2007). This in-dex combines 40 components, chosen to re-flect child well-being in rich countries, whichinclude material well-being, quality of familylife, education, health, peer relationships, risk
behaviors, violence, and psychosocial well-being. As one component (the proportion ofchildren in families on less than half the nationalaverage income) is, by definition, closely relatedto income inequality, the index was recalculatedon the basis of the remaining 39 components.The recalculated UNICEF index is closely cor-related with income inequality (r = −0.64, p <
0.001). As well as using measures of inequalityin society as a whole, they also found that theproportion of children in each country in fam-ilies on less than 60% of the national medianincome was very closely correlated with childwell-being (r = −0.79, p < 0.001).
TOWARD A CONSISTENTEXPLANATION
Inequality is Related to Outcomeswith Social Gradients
Rather than thinking of the effect of income in-equality as a previously unknown determinantof population health, could inequality work
www.annualreviews.org • Impact of Inequality 497
Ann
u. R
ev. S
ocio
l. 20
09.3
5:49
3-51
1. D
ownl
oade
d fr
om a
rjou
rnal
s.an
nual
revi
ews.
org
by 7
9.79
.134
.19
on 0
7/24
/09.
For
per
sona
l use
onl
y.

ANRV381-SO35-23 ARI 5 June 2009 9:34
Better
Worse
Inde
x of
hea
lth
and
soci
al p
robl
ems
Low HighIncome inequality
AL
AKAZ
AR
CA
CO
CT
DE
FL
GA
ID
IL
IN
IA
KS
KY
LA
ME
MD
MA
MI
MN
MS
MO
MT
NE
NV
NH
NJ
NM
NY
NC
ND
OH
OK
OR
PA
RI
SC
SD
TN
TX
UT
VT
VA
WA
WV
WI
WY
HI
Figure 2Index of Health and Social Problems in relation to income inequality among the 50 U.S. states. Incomeinequality was measured by the Gini coefficients taken from the U.S. Census Bureau. Source: Wilkinson &Pickett 2009.
through the same social processes that give riseto social gradients in so many health and so-cial outcomes? To test this hypothesis, we se-lected 10 death rates known to have widely dif-fering social gradients—some weak and somestrong—and collected median income and thedeath rates for all 3139 counties of the UnitedStates (Wilkinson & Pickett 2008). For exam-ple, breast and prostate cancer were chosen be-cause they usually show little or no tendency tobe associated with low social status, and homi-cide and all-cause mortality among working-age men and women were chosen as deathrates known to have strong social gradients.We found, as predicted, a strong tendency forthose death rates that were most strongly asso-ciated with median county household incometo be those most strongly associated (in multi-level models) with state income inequality (r =−0.81; p = 0.004).
Confounding by Absolute Income?
Could these relationships between incomeinequality and so many health and social
outcomes reflect confounding by absolute ma-terial standards? As well as associations withinequality, Table 2 shows associations withaverage income (measured internationally bygross national income per capita at purchas-ing power parities), and by median house-hold income per capita among the 50 states(Wilkinson & Pickett 2009). Internationally,only trust and—marginally—educational per-formance (math and literacy scores) are re-lated to average income. All associations arestronger with inequality than with average in-come, and, in most cases, controlling for av-erage income strengthens the associations withinequality. Among the 50 states, five outcomesare significantly related to average income: lifeexpectancy, infant mortality, obesity, educa-tional performance, and teenage births. In eachcase, these associations are weaker than thosewith inequality, and controlling for average in-come does not attenuate the associations withinequality. If Washington, DC, had been in-cluded, associations with inequality would havebeen strengthened and, with average income,weakened in every case.
498 Wilkinson · Pickett
Ann
u. R
ev. S
ocio
l. 20
09.3
5:49
3-51
1. D
ownl
oade
d fr
om a
rjou
rnal
s.an
nual
revi
ews.
org
by 7
9.79
.134
.19
on 0
7/24
/09.
For
per
sona
l use
onl
y.

ANRV381-SO35-23 ARI 5 June 2009 9:34
AustraliaAustria
Belgium
CanadaDenmark
Finland
France
Germany
Greece
Ireland
Italy
Japan
Netherlands
New Zealand
Norway
Portugal
Spain
Sweden
Switzerland
UK
USA
20,000 25,000 30,000 35,000 40,000Better
Worse
Inde
x of
hea
lth
and
soci
al p
robl
ems
National income per person ($)
Figure 3Index of Health and Social Problems in relation to average income in rich countries. Average income ismeasured by gross national income per capita at purchasing power parity. Source: Wilkinson & Pickett 2009.
As Figures 3 and 4 demonstrate, the Indexof Health and Social Problems was unrelated toaverage income internationally, but was weaklyrelated among the 50 states. The UNICEF In-dex of Child Well-Being in rich countries wasunrelated to average living standards (r = 0.15,p = 0.50) (Pickett & Wilkinson 2007).
The United States is both the wealthiestand the most unequal among this group ofrich countries, but the poor performance ofthe nation as a whole on most health andsocial outcomes is predicted by its inequality(Figure 1), not by its high average income. In-equality trumps average income. A possible ex-planation for the association among the U.S.states between average incomes and some so-cial problems is that average state income mayserve as an indicator not of absolute materialstandards but of relative income or social sta-tus within the United States as a whole—asFigures 1 and 3 suggest. The evidence pointsstrongly to the conclusion that these outcomesare related to inequality rather than to differ-ences in real incomes between societies.
Relative or Absolute Income?Leaving aside the association between betterhealth and greater equality, it appears that rel-ative income or social position may be a bet-ter predictor of the social gradient in healthwithin rich countries than are absolute mate-rial living standards. Although differences inhealth may sometimes have purely materialcauses with no affective component, there canbe no doubt that many of the social problemsrelated to inequality also involve psychosocialprocesses.
Over the course of long-term economic de-velopment, the international relation betweenincome and life expectancy is curvilinear. Lifeexpectancy rises rapidly as poor countries be-gin to develop but then gradually flattens outuntil, among the richest countries, it seems un-affected by further economic growth (Preston1975, World Bank 1993). Among poorer coun-tries, economic development makes an impor-tant contribution to health, but gains to fur-ther growth diminish during the epidemiolog-ical transition and cease among the richest.
www.annualreviews.org • Impact of Inequality 499
Ann
u. R
ev. S
ocio
l. 20
09.3
5:49
3-51
1. D
ownl
oade
d fr
om a
rjou
rnal
s.an
nual
revi
ews.
org
by 7
9.79
.134
.19
on 0
7/24
/09.
For
per
sona
l use
onl
y.

ANRV381-SO35-23 ARI 5 June 2009 9:34
AL
AK
AZ
AR
CA
COCT
DE
FL
GA
HIID
ILIN
IA
KS
KY
LA
ME
MD
MA
MI
MN
MS
MO
MT
NE
NV
NH
NJ
NM
NY
NC
ND
OH
OK
OR
PA
RI
SC
SD
TN
TX
UT
VT
VA
WA
WV
WIWY
15,000 20,000 25,000 30,000
Better
Worse
Inde
x of
hea
lth
and
soci
al p
robl
ems
Income per person ($)
Figure 4Index of Health and Social Problems in relation to per capita income in the 50 U.S. states. Source:Wilkinson & Pickett 2009.
Figure 5 shows the lack of associationbetween average income and life expectancyamong the rich countries (Wilkinson & Pickett2009). Currencies have been converted at pur-chasing power parities to reflect real differencesin material living standards in each country.The assumption that health is determined bymaterial living standards is so ubiquitous that itis worth pointing out that Figure 5 shows notsimply a lack of a statistically significant relationwith life expectancy, but no relation whatsoever.Average real incomes can be almost twice ashigh in some developed countries as in otherswithout consequences for life expectancy. As thedata in Figure 5 are for whole populations, thiscan have nothing to do with sampling errors.
However, this lack of relation between in-come and health when looking at differencesbetween rich countries contrasts sharply withwhat is found within each country. Withincountries, health is finely graded by incomeright across society. As an example, Figure 6shows mortality rates of white men in theUnited States according to the median income
of the zip code area in which they lived (Smithet al. 1996). Social gradients in health of vary-ing steepness have been found in all developedsocieties for which there are data (Elo 2009).Rather than distinguishing simply between thehealth of the poor and the rest of society, thesehealth gradients run right across society as inFigure 6.
Together, Figures 5 and 6 present a para-dox. Health in rich nations is strongly graded byincome within societies but is unrelated to thedifferences in average income between them.If individual income within societies is highlypredictive of health but differences in the aver-age incomes of whole populations are not, thisimplies that what matters may be social posi-tion, or income relative to others, rather thanmaterial living standards regardless of others.
The Role of Individual Income
It need not concern us here how much orhow little the social gradient in health (or so-cial problems) within societies may result from
500 Wilkinson · Pickett
Ann
u. R
ev. S
ocio
l. 20
09.3
5:49
3-51
1. D
ownl
oade
d fr
om a
rjou
rnal
s.an
nual
revi
ews.
org
by 7
9.79
.134
.19
on 0
7/24
/09.
For
per
sona
l use
onl
y.

ANRV381-SO35-23 ARI 5 June 2009 9:34
Australia
Austria
Belgium
Canada
Denmark
Finland
France
GermanyGreece
Ireland
Israel
Italy
Japan
NetherlandsNew Zealand
Norway
Portugal
Singapore
Spain
Sweden
Switzerland
UK
USA
76
78
80
82
20,000 25,000 30,000 35,000 40,000
Life
exp
ecta
ncy
− m
en a
nd w
omen
National income per person ($)
Figure 5Population health is unrelated to average income in rich countries. Male and female life expectancy at birthin rich countries by gross national income per head. The lack of relation shown here contrasts sharply withthe strong income-related gradient in health within countries shown in Figure 2.
40
50
60
70
80
90
100
Age
-adj
uste
d m
orta
lity
per 1
0,00
0
Poor RichAverage income of U.S. zip codes
Figure 6Individual health is closely graded by income within rich societies. Mortality of white men classified by median income of zip codeareas. Redrawn from Smith et al. 1996.
www.annualreviews.org • Impact of Inequality 501
Ann
u. R
ev. S
ocio
l. 20
09.3
5:49
3-51
1. D
ownl
oade
d fr
om a
rjou
rnal
s.an
nual
revi
ews.
org
by 7
9.79
.134
.19
on 0
7/24
/09.
For
per
sona
l use
onl
y.
ANRV381-SO35-23 ARI 5 June 2009 9:34
selective social mobility as the healthy im-prove their social status relative to the sick: Noamount of social mobility could explain why thetotal burden of poor health (or social problems)is greater in more unequal societies.
The relation with income distribution wasinitially interpreted as a reflection of a curvi-linear relation between individual incomeand health (Gravelle 1998, Rodgers 1979,Wilkinson 1992). If income redistribution fromrich to poor enabled the poor to buy better food,housing, heating, etc., while the loss of that in-come to the better-off led merely to the choiceof cheaper holiday destinations, then each $100transferred from rich to poor might be expectedto improve the health of the poor by more thanit harmed the health of the rich. Redistributionwould then improve average health through thehealth-purchasing power of individual incomerather than through any process inherently todo with inequality or where people’s incomeplaced them in relation to others. Note, how-ever, that this model assumes that individual in-come influences health primarily through ma-terial rather than psychosocial pathways anddoes not address the importance of relativeincome.
Could more unequal societies have worsehealth because their populations include ahigher proportion of less well-off people—less
Perc
ent
Nations States, regionsand cities
Small areas
Wholly supportive
Unsupportive
0
20
40
60
80
100
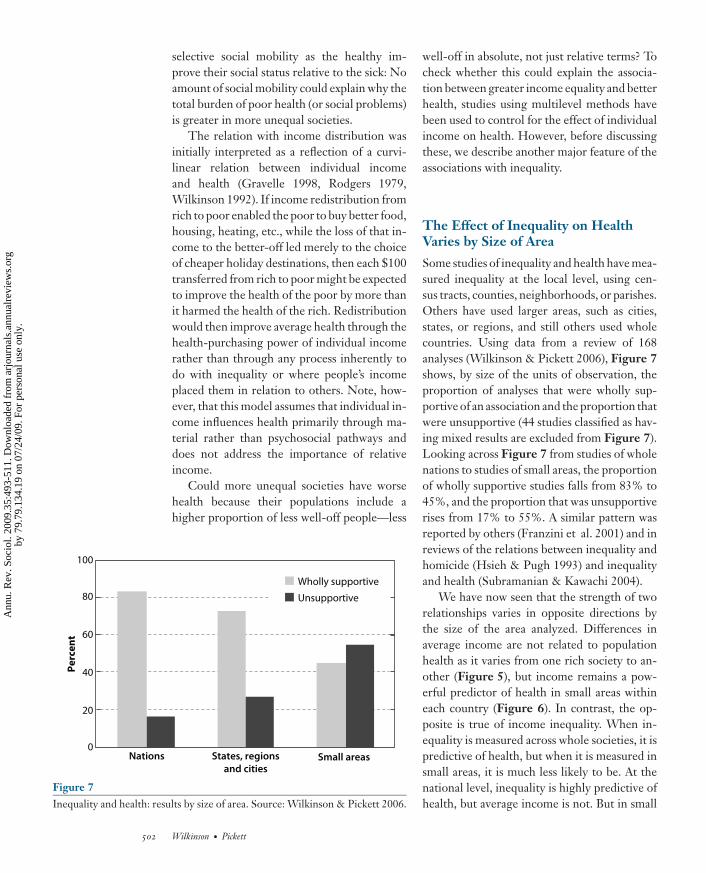
Figure 7Inequality and health: results by size of area. Source: Wilkinson & Pickett 2006.
well-off in absolute, not just relative terms? Tocheck whether this could explain the associa-tion between greater income equality and betterhealth, studies using multilevel methods havebeen used to control for the effect of individualincome on health. However, before discussingthese, we describe another major feature of theassociations with inequality.
The Effect of Inequality on HealthVaries by Size of Area
Some studies of inequality and health have mea-sured inequality at the local level, using cen-sus tracts, counties, neighborhoods, or parishes.Others have used larger areas, such as cities,states, or regions, and still others used wholecountries. Using data from a review of 168analyses (Wilkinson & Pickett 2006), Figure 7shows, by size of the units of observation, theproportion of analyses that were wholly sup-portive of an association and the proportion thatwere unsupportive (44 studies classified as hav-ing mixed results are excluded from Figure 7).Looking across Figure 7 from studies of wholenations to studies of small areas, the proportionof wholly supportive studies falls from 83% to45%, and the proportion that was unsupportiverises from 17% to 55%. A similar pattern wasreported by others (Franzini et al. 2001) and inreviews of the relations between inequality andhomicide (Hsieh & Pugh 1993) and inequalityand health (Subramanian & Kawachi 2004).
We have now seen that the strength of tworelationships varies in opposite directions bythe size of the area analyzed. Differences inaverage income are not related to populationhealth as it varies from one rich society to an-other (Figure 5), but income remains a pow-erful predictor of health in small areas withineach country (Figure 6). In contrast, the op-posite is true of income inequality. When in-equality is measured across whole societies, it ispredictive of health, but when it is measured insmall areas, it is much less likely to be. At thenational level, inequality is highly predictive ofhealth, but average income is not. But in small
502 Wilkinson · Pickett
Ann
u. R
ev. S
ocio
l. 20
09.3
5:49
3-51
1. D
ownl
oade
d fr
om a
rjou
rnal
s.an
nual
revi
ews.
org
by 7
9.79
.134
.19
on 0
7/24
/09.
For
per
sona
l use
onl
y.
ANRV381-SO35-23 ARI 5 June 2009 9:34
areas, the opposite is true—average incomes arehighly predictive of health, but inequality is not.
This pattern has received little attention inthe literature. What does it tell us? Two con-trasting interpretations of the effect of incomeinequality on health are (a) that it hinges on so-cial comparisons between better- and worse-offpeople of a kind that might be expected to bemost salient in face-to-face encounters betweenneighbors, or (b) that it reflects the importanceof social class stratification and the scale of so-cial distances in society as a whole.
If inequality within small areas is less im-portant than inequality across the whole soci-ety, perhaps what we are seeing is a reflectionless of social comparisons between neighborsthan of the effects of the extent of social classdifferentiation in society as a whole.
Measures of societal income inequality canbe disaggregated into inequality between areasand inequality within those areas (Lobmayer &Wilkinson 2002). Differences in the average in-comes of local areas and neighborhoods maybe predictive of health because they reflect theresidential segregation of rich and poor in so-ciety. The reason a small, deprived neighbor-hood within a rich nation is likely to have poorhealth is not because of the inequality withinthat neighborhood, but because the neighbor-hood is deprived in relation to the rest of society.Its low socioeconomic status in relation to therest of society is indicated by its relatively lowaverage income.
Thus, income inequality measured acrosswhole societies may be predictive of popula-tion health because it serves as a measure of theoverall burden of stratification relative to otherswithin each society.
Multilevel Analyses
Multilevel studies of inequality and health werereviewed by Subramanian & Kawachi (2004).However, most of the multilevel studies re-viewed used data for areas too small to providea proper test of the effect of inequality itself.Studies that were conceived as tests of whetheran apparent inequality effect could be explained
in terms of a curvilinear effect of absolute in-come may, if the actual processes instead in-volved the effects of social status differentiation,have overcontrolled for social status.
In a later review, Wilkinson & Pickett (2006)found no international multilevel studies thatcontrolled for individual income—presumablybecause of the lack of data sources. At the largesubnational level (regions, states, metropolitanareas), there were six wholly supportive multi-level studies, six partially supportive, and threeunsupportive (classified from models includingall controls). Of the three unsupportive stud-ies, one was of mental health among the U.S.states for which there is no relation with in-equality even before controlling for individualincome (Tables 1 and 2). This study there-fore never had the potential to shed light onwhy other aspects of health (and mental healthinternationally) are related to inequality. Themodeling techniques used in the two other un-supportive multilevel studies were criticized bySubramanian & Kawachi (2004), who demon-strated that if the appropriate model had beenused, the expected relationships would havebeen shown. They concluded, “These findingssuggest that, while individual race, educationalattainment, and income attenuate the baselineeffect of state income inequality, they do notfully account for the observed association be-tween self-rated poor health and state incomeinequality in the United States” (Subramanian& Kawachi 2004, p. 85).
Despite using other measures of status ascontrols, the remaining 12 studies of larger ar-eas that we reviewed found that the associationbetween worse health and greater inequalitycould not be explained on the assumption thata given level of individual income bought thesame amount of health regardless of inequal-ity. More unequal areas do not seem to haveworse health simply because they have morepoor people.
Individual income is now more often as-sumed to be related to health for inherentlycontextual reasons: as a determinant and markerof social position (Marmot 2004). The initialassumption—that multilevel studies distinguish
www.annualreviews.org • Impact of Inequality 503
Ann
u. R
ev. S
ocio
l. 20
09.3
5:49
3-51
1. D
ownl
oade
d fr
om a
rjou
rnal
s.an
nual
revi
ews.
org
by 7
9.79
.134
.19
on 0
7/24
/09.
For
per
sona
l use
onl
y.

ANRV381-SO35-23 ARI 5 June 2009 9:34
between direct material effects of individual in-come and a stranger, contextual psychosocialeffect of inequality—is now highly dubious. AsFigures 5 and 6 show, in rich countries it is thedifferences in relative income between peoplewithin each country that matter.
The hypothesis that inequality is associatedwith health because of a curvilinear relation be-tween individual income and health has otherweaknesses. First, it fails to explain why inequal-ity measured in smaller areas is less clearly re-lated to health. Second, as discussed below, theproportion of the population that benefits fromreduced income differentials is too large, andthe effect on population health too big, to beexplained by what happens to the least well-offalone. Third, that inequality has psychosocialeffects is now confirmed by the evidence thatinequality is also associated with social prob-lems that are inherently behavioral.
Material Inequality and StatusDifferentiation
We need to explain why a wide range of healthand social problems tend to be more commonin more unequal societies. As the evidence indi-cates both that the health and social problemsrelated to inequality are those with marked so-cial gradients and that inequality is best mea-sured at the societal level to reflect the scale ofsocial differentiation across the whole societalpyramid, or onion, then this suggests a coher-ent picture. The obvious interpretation is thathealth and social problems whose frequency isaffected by social status are made worse by in-creased status differentiation. This view alsoaccords with the evidence that the control vari-ables that most attenuate relationships with in-equality are those that capture related aspectsof social status differentiation. Subramanian& Kawachi (2004) have reviewed studies thatexamine possible confounding by education,individual income, race, and regional effects.Deaton & Lubotsky (2003) reported that in theUnited States controlling for the proportion ofthe population that is black removed any effectof inequality. Ethnicity is of course a powerful
marker for status differentiation, and a largerproportion black is associated with bigger in-come differences between black and white pop-ulations and higher death rates in both groups.However, Ash & Robinson (2009) replicatedDeaton & Lubotsky’s study and found a cod-ing error that, when corrected, reinstated theindependent effect of income inequality. Theprimacy of income inequality over ethnicity wasalso shown by Ram (2005). Lastly, ethnic differ-ences do not explain the international associa-tion between income inequality and populationhealth (Ram 2006).
Although sociologists might think it desir-able to replace income inequality in the researchwe have described with some other metric ofstatus differentiation, there are two reasons thishas not been done. First, social classificationsusually provide only nominal or ordinal scales,rather than interval or ratio scales. This meansthat even if comparable measures were avail-able internationally they would not allow us tosee whether the whole stratification system wasmore stretched out, with bigger social distances,in one society compared with another. Second,if the psychological salience of social status dif-ferentiation is part of our evolved makeup, thendifferential access to scarce resources (and somaterial inequalities) may be constitutive. Thescale of material inequality in a society (whichwould ideally include differences in propertyand wealth if comparable international datawere available) may provide the skeleton, orframework, around which all the cultural as-pects of status differentiation develop. Crudedifferences in wealth gradually become overlaidby differences in clothing, aesthetic taste, edu-cation, sense of self, and other markers of socialposition, as Bourdieu (1984) has described.
Status and Stress
The view that social status itself matters tohealth finds some corroboration in studies ofthe physiological effects of low social statusamong nonhuman primates (Sapolsky 2005,Sapolsky 2004). Low social status among ba-boons studied in the wild has been shown to lead
504 Wilkinson · Pickett
Ann
u. R
ev. S
ocio
l. 20
09.3
5:49
3-51
1. D
ownl
oade
d fr
om a
rjou
rnal
s.an
nual
revi
ews.
org
by 7
9.79
.134
.19
on 0
7/24
/09.
For
per
sona
l use
onl
y.

ANRV381-SO35-23 ARI 5 June 2009 9:34
to higher levels of the central stress hormonecortisol. Among macaques studied in captivity,the effects of social status have been observedunder strict experimental conditions. Social sta-tus has been manipulated by moving animalsbetween groups, and material conditions havebeen kept the same by feeding all animals thesame diets and keeping them in the same com-pounds. Under these conditions animals thatmoved down the dominance hierarchy weremore likely to suffer a number of conditions,including higher levels of stress hormones anda much more rapid buildup of atherosclerosis(Shively & Clarkson 1994).
The recognition of the importance of psy-chosocial factors working through chronicstress is one of the most important devel-opments in our understanding of the so-cial determinants of health in recent decades(Brunner & Marmot 2006, Sapolsky 2005). Ithas led to much greater attention to the socialenvironment—particularly to low social status,a difficult early childhood, and weak friendshipnetworks—as sources of chronic stress and de-terminants of health (Berkman & Glass 2000,Marmot 2004, Marmot & Wilkinson 2006). Ex-posure to chronic stress shifts physiological pri-orities: Processes that are not essential whenresponding to immediate threat or danger—such as tissue maintenance and repair, diges-tion, growth, and reproductive functions—areall downregulated in favor of processes that im-prove reaction times and provide energy formuscular activity. If the stress is over quickly,no harm is done. If it lasts more than about anhour, immunity is also downregulated. Whenwe worry about things for weeks and months,the effects, including wear on the cardiovas-cular system, are so widespread that we be-come more vulnerable to a wide range of healthproblems.
Who Benefits From Greater Equality?
When comparing more and less equal soci-eties, there are two surprising, but closely con-nected, features that add substantially to theimportance of the issues we have discussed.
First, the differences in the prevalence of healthand social problems associated with inequal-ity are very large: Related to inequality, thereare threefold differences in rates of mental ill-ness, two- or threefold differences in obesityand homicide rates, and even bigger differencesin the proportion of the population imprisoned(Wilkinson & Pickett 2007, 2009). Second, al-though greater equality seems to make mostdifference to rates of problems among the leastwell-off, rates also seem to be reduced amonga large majority of the population, includingthe top tertiles or quartiles by education or in-come. It looks as if the vast majority benefitfrom greater equality.
These two features are linked because suchlarge differences in the total population preva-lence rates could not easily be produced if in-equality affected only a small minority of thepopulation. For instance, if the three- or four-year difference between countries in average lifeexpectancy were produced simply by health dif-ferences confined to the poorest 10% of thepopulation, their life expectancy would have tobe 30 or 40 years shorter in the most unequalsocieties than the poorest in a more equal soci-ety. That benefits of greater equality are spreadacross society is also consistent with the fact thathealth inequalities are not distinctions betweenthe health of the poor and the rest of societybut form a gradient right across society.
The evidence that the benefits of greaterequality are indeed widespread by socio-economic status comes mainly from healthresearch. Two early studies compared socialgradients in adult male mortality and infantmortality in Sweden and in England and Wales(Leon et al. 1992, Vagero & Lundberg 1989).To facilitate comparisons, a large sample ofSwedish deaths was classified according tothe British occupational class classificationsystem. The findings are shown in Figures 8and 9. Sweden, as the more equal of the twocountries, has lower mortality rates acrossall occupational classes. For both infant andadult mortality, the differences are greatest inthe lowest classes (class IV semiskilled, andclass V unskilled manual occupations) but are
www.annualreviews.org • Impact of Inequality 505
Ann
u. R
ev. S
ocio
l. 20
09.3
5:49
3-51
1. D
ownl
oade
d fr
om a
rjou
rnal
s.an
nual
revi
ews.
org
by 7
9.79
.134
.19
on 0
7/24
/09.
For
per
sona
l use
onl
y.

ANRV381-SO35-23 ARI 5 June 2009 9:34
5
0
10
15In
fant
dea
ths
per 1
000
England and Wales
Sweden
Single mothers Father's social classLow High
Figure 8Infant mortality by occupational class of father in Sweden compared with England and Wales. Sweden had lower infant mortality in allclasses and a shallower social gradient than England and Wales. Redrawn from Leon et al. 1992.
Dea
ths
per 1
00,0
00
0
200
400
600
800
1000
England and Wales
Sweden
Social classLow High
Figure 9Mortality of working-age men by occupational class in Sweden compared with England and Wales. Note that as well as having smallerincome differences, Sweden has lower mortality in all classes and that the social gradient is less steep than in England and Wales.Redrawn from Vagero & Lundberg 1989.
506 Wilkinson · Pickett
Ann
u. R
ev. S
ocio
l. 20
09.3
5:49
3-51
1. D
ownl
oade
d fr
om a
rjou
rnal
s.an
nual
revi
ews.
org
by 7
9.79
.134
.19
on 0
7/24
/09.
For
per
sona
l use
onl
y.

ANRV381-SO35-23 ARI 5 June 2009 9:34
0
10
20
30
40
50
Diabetes Hypertension Cancer Lung disease Heart disease
Perc
ent
England
USA
Low High Low High Low High Low HighLow High
Figure 10Morbidity rates (diabetes, hypertension, cancer, lung disease, and heart disease) by tertiles of education comparing whites aged 55–64 inthe United States and England. Note that morbidity rates are lower in England even in the top educational tertile for all morbiditiesexcept lung disease. Data source: Banks et al. 2006.
also apparent even in the highest class (class Iprofessional occupations).
More recent research compared healthamong non-Hispanic white men aged 55–64 years classified by income and education inthe United States and England (Banks et al.2006). Comparisons covered morbidity fromdifferent conditions; biological indicators in-cluding blood pressure, cholesterol, and C-reactive protein (a chronic stress marker); andmortality. The differences in morbidity rates bytertiles of education are shown in Figure 10.England, as the less unequal country, was foundto have lower morbidity rates in all tertiles. Infurther analysis of the same data, the authorssaid:
[T]here exists a steep negative health gradientfor men in both countries where men at thebottom of the economic hierarchy are in muchworse health than those at the top. This socialhealth gradient exists whether education, in-come, or financial wealth is used as the markerof one’s SES status. While the negative socialgradient in male health characterizes men inboth countries, it appears to be steeper in the
United States. These conclusions are main-tained even after controlling for a standardset of behavioral risk factors such as smok-ing, drinking, and obesity and are equally trueusing either biological measures of diseaseor individual self-reports (Banks et al. 2007,p. 27).
Other studies of who is affected by in-equality have used data for the U.S. states.Papers from Subramanian & Kawachi (2006)and from Wolfson et al. (1999) found that thehealth benefits associated with greater equalityamong the more equal states were widespread.Subramanian & Kawachi concluded that“income inequality exerts a comparable effectacross all population subgroups” whetherpeople are classified by education, race, orincome—so much so that the authors suggestedthat inequality acted like a pollutant spreadthroughout society. Wilkinson & Pickett (2008)found in a comparison of county mortalityrates for men and women in the 25 more equaland the 25 less equal U.S. states that mortalityrates were higher at all levels of county medianincome and that the gradient was steeper in the
www.annualreviews.org • Impact of Inequality 507
Ann
u. R
ev. S
ocio
l. 20
09.3
5:49
3-51
1. D
ownl
oade
d fr
om a
rjou
rnal
s.an
nual
revi
ews.
org
by 7
9.79
.134
.19
on 0
7/24
/09.
For
per
sona
l use
onl
y.

ANRV381-SO35-23 ARI 5 June 2009 9:34
Counties in less equal states
Counties in more equal states
0 20,000 40,000 60,000 80,000County median household income ($)
Deaths from all causes among men and women of working age
Low
High
Stan
dard
ized
mor
talit
y ra
tes
Figure 11The relation between median county income and county death rates among working-age people accordingto whether the counties were in the 25 more equal or the 25 less equal states. Note that mortality rates arehigher at all levels of county median income in the more unequal states and that the social gradient is steeper.Source: Wilkinson & Pickett 2008.
more unequal states (see Figure 11). Like theinternational comparisons, this suggests thatgreater equality may benefit all groups but thatthe absolute difference is likely to be biggerlower down the social scale.
Although there is little evidence of this kindoutside health, the scale of the international dif-ferences in health and social problems related toinequality is so large that it is unlikely that theyare predominantly reflections of differences inrates confined to a poor minority in each coun-try. A paradoxical implication of the widespreadnature of the benefits is that narrower incomedifferences do less to narrow health inequalitiesthan they would if only the least well-off bene-fited. This may explain why health inequalitieswhen expressed in relative terms (for instance asthe death rates in low-status groups divided bythat in high-status groups) do not show a con-sistent tendency to be smaller in more equalsocieties, even though they may be smaller inabsolute terms (as expressed for example bythe death rate in low-status groups minus the
death rate in high-status groups) (Mackenbachet al. 1997). If even the better-off groups enjoysome reduction in death rates, then this wouldmean that the impact on health inequalities (ex-pressed in relative terms) would be less than ifthe better-off were unaffected.
We have discussed elsewhere (Wilkinson& Pickett 2009) the social processes throughwhich wider income differences might affectthe majority of the population. The evidence ofincreased violence, reduced trust, and a weak-ening of community life suggests that wider in-come differences damage the quality of socialrelations as affiliative social strategies give wayto increased status competition.
SUMMARY AND FUTURE ISSUES
Given that the wide range of health and so-cial problems related to inequality tend to bethose with social gradients, it would be a mis-take to imagine that the scale of income inequal-ity influences social outcomes through hitherto
508 Wilkinson · Pickett
Ann
u. R
ev. S
ocio
l. 20
09.3
5:49
3-51
1. D
ownl
oade
d fr
om a
rjou
rnal
s.an
nual
revi
ews.
org
by 7
9.79
.134
.19
on 0
7/24
/09.
For
per
sona
l use
onl
y.

ANRV381-SO35-23 ARI 5 June 2009 9:34
unknown processes running parallel to socialstatus differentiation. It is much more plausiblethat it works through all the processes of socialstatus stratification that have been central to thesocial sciences for so long, including the ways inwhich so many marks of social position becomeimprinted on us from early childhood onward.
The fact that health is worse and socialproblems are more prevalent in more unequalsocieties does, however, tell us somethingfundamental about those processes. Althoughopinions vary as to how much the social gradi-ents in health and other outcomes result fromsocial selection, selection is essentially a sortingprocess, acting on a given prevalence of a prob-lem. No amount of selective mobility could, ofitself, produce major differences in the preva-lence of social problems from one society to an-other. Nor could it explain why the prevalence issystematically higher in more unequal societies.
Several important conclusions suggestthemselves. First, income inequality serves as ameasure that allows us to compare the scale orimportance of social stratification in differentsocieties. Second, because it is problems withsocial gradients that are related to inequality,this is probably a reflection of their sensitivity,
on the one hand, to the existing status differ-entiation and, on the other, to the size andimportance of the status differences as they varyfrom one society to another. Third, the formsof social dysfunction associated with greaterinequality are not confined to the poor butextend to almost all sections of society. Fourth,the most plausible explanation of the effects ofincome inequality is that material inequalityserves as a determinant and measure of thescale of social status differentiation in society.The ability to compare income distribution indifferent societies may therefore show the costsof different degrees of status differentiation.Fifth, standards of health and social well-beingin rich societies may now depend more onreducing income differences than on economicgrowth without redistribution.
Future research should measure inequalityin whole societies or across large populationsand should avoid adjusting for variables that re-move some of the effects of social status differ-entiation. Important areas for further researchare likely to include the psychosocial processesthat connect the scale of social stratificationto the various social problems associated withinequality.
DISCLOSURE STATEMENT
The authors are not aware of any biases that might affect the objectivity of this review, but theyhave recently established The Equality Trust (http://www.equalitytrust.org.uk) as a not-for-profit organization intended to make the evidence outlined in this review better known.
LITERATURE CITED
Andres AR. 2005. Income inequality, unemployment and suicide: a panel data analysis of 15 European countries.Appl. Econ. 37:439–51
Ash M, Robinson DE. 2009. Inequality, race, and mortality in U.S. cities: a political and econometric review.Soc. Sci. Med. In press
Banks J, Marmot M, Oldfield Z, Smith JP. 2006. Disease and disadvantage in the United States and in England.JAMA 295:2037–45
Banks J, Marmot M, Oldfield Z, Smith JP. 2007. The SES Health Gradient on Both Sides of the Atlantic.Cambridge, MA: Natl. Bur. Econ. Res.
Berkman L, Glass T. 2000. Social integration, social networks, social support, and health. In Social Epidemiology,ed. L Berkman, I Kawachi, pp. 137–73. New York: Oxford Univ. Press
Bourdieu P. 1984. Distinction: A Social Critique of the Judgement of Taste. London: RoutledgeBrunner E, Marmot M. 2006. Social organization, stress, and health. In Social Determinants of Health, ed. M
Marmot, R Wilkinson, pp. 6–30. Oxford: Oxford Univ. Press
www.annualreviews.org • Impact of Inequality 509
Ann
u. R
ev. S
ocio
l. 20
09.3
5:49
3-51
1. D
ownl
oade
d fr
om a
rjou
rnal
s.an
nual
revi
ews.
org
by 7
9.79
.134
.19
on 0
7/24
/09.
For
per
sona
l use
onl
y.

ANRV381-SO35-23 ARI 5 June 2009 9:34
Centers for Disease Control and Prevention. 2004. Self-reported frequent mental distress among adults—United States, 1993–2001. MMWR Weekly 53:963–66
Deaton A, Lubotsky D. 2003. Mortality, inequality and race in American cities and states. Soc. Sci. Med.56:1139–53
Diez-Roux AV, Link BG, Northridge ME. 2000. A multilevel analysis of income inequality and cardiovasculardisease risk factors. Soc. Sci. Med. 50:673–87
Elgar FJ, Roberts C, Parry-Langdon N, Boyce W. 2005. Income inequality and alcohol use: a multilevelanalysis of drinking and drunkenness in adolescents in 34 countries. Eur. J. Public Health 15:245–50
Elo IT. 2009. Social class differentials in health and mortality: patterns and explanation in comparative per-spective. Annu. Rev. Sociol. 35:553–72
Franzini L, Ribble J, Spears W. 2001. The effects of income inequality and income level on mortality vary bypopulation size in Texas counties. J. Health Soc. Behav. 42:373–87
Gold R, Kawachi I, Kennedy BP, Lynch JW, Connell FA. 2001. Ecological analysis of teen birth rates:association with community income and income inequality. Matern. Child Health J. 5:161–67
Gravelle H. 1998. How much of the relation between population mortality and unequal distribution of incomeis a statistical artefact? BMJ 316:382–85
Henderson C, Liu X, Diez-Roux AV, Link BG, Hasin D. 2004. The effects of US state income inequality andalcohol policies on symptoms of depression and alcohol dependence. Soc. Sci. Med. 58:565–75
Hsieh C-C, Pugh MD. 1993. Poverty, income inequality, and violent crime: a meta-analysis of recent aggregatedata studies. Crim. Justice Rev. 18:182–202
Kaplan GA, Pamuk ER, Lynch JW, Cohen RD, Balfour JL. 1996. Inequality in income and mortality in theUnited States: analysis of mortality and potential pathways. BMJ 312:999–1003
Kawachi I, Kennedy BP, Gupta V, Prothrow-Stith D. 1999. Women’s status and the health of women andmen: a view from the States. Soc. Sci. Med. 48:21–32
Kawachi I, Kennedy BP, Lochner K, Prothrow-Stith D. 1997. Social capital, income inequality, and mortality.Am. J. Public Health 87:1491–98
Kelly M. 2000. Inequality and crime. Rev. Econ. Stat. 82:530–39Kennedy BP, Kawachi I, Lochner K, Jones C, Prothrow-Stith D. 1997. (Dis)respect and black mortality. Ethn.
Dis. 7:207–14Kennedy BP, Kawachi I, Prothrow-Stith D. 1996. Income distribution and mortality: cross sectional ecological
study of the Robin Hood index in the United States. BMJ 312:1004–7Kowalski GS, Faupel CE, Starr PD. 1987. Urbanism and suicide: a study of American counties. Soc. Forces
66:85–101Krohn MD. 1976. Inequality, unemployment and crime: A cross-national analysis. Sociol. Q. 17:303–13Leon DA, Vagero D, Olausson PO. 1992. Social class differences in infant mortality in Sweden: comparison
with England and Wales. BMJ 305:687–91Lester D. 1987. Relation of income inequality to suicide and homicide rates. J. Soc. Psychol. 127:101–2Lobmayer P, Wilkinson RG. 2002. Inequality, residential segregation by income, and mortality in US cities.
J. Epidemiol. Community Health 56:183–87Lynch J, Smith GD, Harper S, Hillemeier M, Ross N, et al. 2004. Is income inequality a determinant of
population health? Part 1. A systematic review. Milbank Q. 82:5–99Macinko JA, Shi L, Starfield B, Wulu JT Jr. 2003. Income inequality and health: a critical review of the
literature. Med. Care Res. Rev. 60:407–52Mackenbach JP, Kunst AE, Cavelaars AE, Groenhof F, Geurts JJ. 1997. Socioeconomic inequalities in
morbidity and mortality in western Europe. The EU Working Group on Socioeconomic Inequalitiesin Health. Lancet 349:1655–59
Marmot M. 2004. Status Syndrome: How Your Social Standing Directly Affects Your Health and Life Expectancy.London: Bloomsbury
Marmot M, Wilkinson R. 2006. Social Determinants of Health. Oxford: Oxford Univ. PressMcCord C, Freeman HP. 1990. Excess mortality in Harlem. N. Engl. J. Med. 322:173–77Pampel FC Jr. 2002. Inequality, diffusion, and the status gradient of smoking. Soc. Probl. 49:35–57Pickett KE, Kelly S, Brunner E, Lobstein T, Wilkinson RG. 2005a. Wider income gaps, wider waistbands?
An ecological study of obesity and income inequality. J. Epidemiol. Community Health 59:670–74
510 Wilkinson · Pickett
Ann
u. R
ev. S
ocio
l. 20
09.3
5:49
3-51
1. D
ownl
oade
d fr
om a
rjou
rnal
s.an
nual
revi
ews.
org
by 7
9.79
.134
.19
on 0
7/24
/09.
For
per
sona
l use
onl
y.
ANRV381-SO35-23 ARI 5 June 2009 9:34
Pickett KE, Mookherjee J, Wilkinson RG. 2005b. Adolescent birth rates, total homicides, and income in-equality in rich countries. Am. J. Public Health 95:1181–83
Pickett KE, Wilkinson RG. 2007. Child wellbeing and income inequality in rich societies: ecological crosssectional study. BMJ 335:1080–87
Preston SH. 1975. The changing relation between mortality and level of economic development. Popul. Stud.(Camb.) 29:231–48
Ram R. 2005. Income inequality, poverty, and population health: evidence from recent data for the UnitedStates. Soc. Sci. Med. 61:2568–76
Ram R. 2006. Further examination of the cross-country association between income inequality and populationhealth. Soc. Sci. Med. 62:779–91
Rodgers GB. 1979. Income and inequality as determinants of mortality: an international cross-section analysis.Popul. Stud. 33:343–51
Sapolsky R. 2005. Sick of poverty. Sci. Am. 293:92–99Sapolsky RM. 2004. Social status and health in humans and other animals. Annu. Rev. Anthropol. 33:393–418Shively CA, Clarkson TB. 1994. Social status and coronary artery atherosclerosis in female monkeys. Arte-
rioscler. Thromb. 14:721–26Smith GD, Wentworth D, Neaton JD, Stamler R, Stamler J. 1996. Socioeconomic differentials in mortality
risk among men screened for the Multiple Risk Factor Intervention Trial: II. Black men. Am. J. PublicHealth 86:497–504
Subramanian SV, Kawachi I. 2004. Income inequality and health: What have we learned so far? Epidemiol.Rev. 26:78–91
Subramanian SV, Kawachi I. 2006. Whose health is affected by income inequality? A multilevel interactionanalysis of contemporaneous and lagged effects of state income inequality on individual self-rated healthin the United States. Health Place 12:141–56
UNICEF Innocenti Research Centre. 2007. Child Poverty in Perspective: An Overview of Child Well-Being inRich Countries. Rep. 3. Florence: Innocenti Report Card
United Nations Development Program. 2003. Human Development Report. New York: Oxford Univ. PressUnited Nations Development Program. 2004. Human Development Report. New York: Oxford Univ. PressUnited Nations Development Program. 2005. Human Development Report. New York: Oxford Univ. PressUnited Nations Development Program. 2006. Human Development Report. New York: Oxford Univ. PressU.S. Census Bur. 2000. Summary File 3. Washington, DC: U.S. Census Bur.Uslaner E. 2002. The Moral Foundations of Trust. Cambridge, UK: Cambridge Univ. PressVagero D, Lundberg O. 1989. Health inequalities in Britain and Sweden. Lancet 2:35–36Wilkinson RG. 1992. Income distribution and life expectancy. BMJ 304:165–68Wilkinson RG, Kawachi I, Kennedy B. 1998. Mortality, the social environment, crime and violence. Soc. Health
Illn. 20:578–97Wilkinson RG, Pickett KE. 2006. Income inequality and population health: a review and explanation of the
evidence. Soc. Sci. Med. 62:1768–84Wilkinson RG, Pickett KE. 2007. The problems of relative deprivation: why some societies do better than
others. Soc. Sci. Med. 65:1965–78Wilkinson RG, Pickett KE. 2008. Income inequality and socioeconomic gradients in mortality. Am. J. Public
Health 98:699–704Wilkinson RG, Pickett KE. 2009. The Spirit Level: Why More Equal Societies Almost Always Do Better. London:
PenguinWolfson M, Kaplan G, Lynch J, Ross N, Backlund E. 1999. Relation between income inequality and mortality:
empirical demonstration. BMJ 319:953–55World Bank. 1993. World Development Report 1993: Investing in Health. Oxford: Oxford Univ. Press
www.annualreviews.org • Impact of Inequality 511
Ann
u. R
ev. S
ocio
l. 20
09.3
5:49
3-51
1. D
ownl
oade
d fr
om a
rjou
rnal
s.an
nual
revi
ews.
org
by 7
9.79
.134
.19
on 0
7/24
/09.
For
per
sona
l use
onl
y.

AR348-FM ARI 2 June 2009 9:48
Annual Reviewof Sociology
Volume 35, 2009Contents
FrontispieceHerbert J. Gans � � � � � � � � � � � � � � � � � � � � � � � � � � � � � � � � � � � � � � � � � � � � � � � � � � � � � � � � � � � � � � � � � � � � � � � � � � � � � � xiv
Prefatory Chapters
Working in Six Research Areas: A Multi-Field Sociological CareerHerbert J. Gans � � � � � � � � � � � � � � � � � � � � � � � � � � � � � � � � � � � � � � � � � � � � � � � � � � � � � � � � � � � � � � � � � � � � � � � � � � � � � � � � 1
Theory and Methods
Ethnicity, Race, and NationalismRogers Brubaker � � � � � � � � � � � � � � � � � � � � � � � � � � � � � � � � � � � � � � � � � � � � � � � � � � � � � � � � � � � � � � � � � � � � � � � � � � � � � � �21
Interdisciplinarity: A Critical AssessmentJerry A. Jacobs and Scott Frickel � � � � � � � � � � � � � � � � � � � � � � � � � � � � � � � � � � � � � � � � � � � � � � � � � � � � � � � � � � � � �43
Nonparametric Methods for Modeling Nonlinearityin Regression AnalysisRobert Andersen � � � � � � � � � � � � � � � � � � � � � � � � � � � � � � � � � � � � � � � � � � � � � � � � � � � � � � � � � � � � � � � � � � � � � � � � � � � � � � �67
Gender Ideology: Components, Predictors, and ConsequencesShannon N. Davis and Theodore N. Greenstein � � � � � � � � � � � � � � � � � � � � � � � � � � � � � � � � � � � � � � � � � � � � �87
Genetics and Social InquiryJeremy Freese and Sara Shostak � � � � � � � � � � � � � � � � � � � � � � � � � � � � � � � � � � � � � � � � � � � � � � � � � � � � � � � � � � � � 107
Social Processes
Race Mixture: Boundary Crossing in Comparative PerspectiveEdward E. Telles and Christina A. Sue � � � � � � � � � � � � � � � � � � � � � � � � � � � � � � � � � � � � � � � � � � � � � � � � � � � � 129
The Sociology of Emotional LaborAmy S. Wharton � � � � � � � � � � � � � � � � � � � � � � � � � � � � � � � � � � � � � � � � � � � � � � � � � � � � � � � � � � � � � � � � � � � � � � � � � � � � 147
Societal Responses toTerrorist AttacksSeymour Spilerman and Guy Stecklov � � � � � � � � � � � � � � � � � � � � � � � � � � � � � � � � � � � � � � � � � � � � � � � � � � � � � 167
Intergenerational Family Relations in Adulthood: Patterns, Variations,and Implications in the Contemporary United StatesTeresa Toguchi Swartz � � � � � � � � � � � � � � � � � � � � � � � � � � � � � � � � � � � � � � � � � � � � � � � � � � � � � � � � � � � � � � � � � � � � � � 191
v
Ann
u. R
ev. S
ocio
l. 20
09.3
5:49
3-51
1. D
ownl
oade
d fr
om a
rjou
rnal
s.an
nual
revi
ews.
org
by 7
9.79
.134
.19
on 0
7/24
/09.
For
per
sona
l use
onl
y.

AR348-FM ARI 2 June 2009 9:48
Institutions and Culture
Sociology of Sex WorkRonald Weitzer � � � � � � � � � � � � � � � � � � � � � � � � � � � � � � � � � � � � � � � � � � � � � � � � � � � � � � � � � � � � � � � � � � � � � � � � � � � � � � 213
The Sociology of War and the MilitaryMeyer Kestnbaum � � � � � � � � � � � � � � � � � � � � � � � � � � � � � � � � � � � � � � � � � � � � � � � � � � � � � � � � � � � � � � � � � � � � � � � � � � � 235
Socioeconomic Attainments of Asian AmericansArthur Sakamoto, Kimberly A. Goyette, and ChangHwan Kim � � � � � � � � � � � � � � � � � � � � � � � � � 255
Men, Masculinity, and Manhood ActsDouglas Schrock and Michael Schwalbe � � � � � � � � � � � � � � � � � � � � � � � � � � � � � � � � � � � � � � � � � � � � � � � � � � � � 277
Formal Organizations
American Trade Unions and Data Limitations: A New Agendafor Labor StudiesCaleb Southworth and Judith Stepan-Norris � � � � � � � � � � � � � � � � � � � � � � � � � � � � � � � � � � � � � � � � � � � � � � 297
Outsourcing and the Changing Nature of WorkAlison Davis-Blake and Joseph P. Broschak � � � � � � � � � � � � � � � � � � � � � � � � � � � � � � � � � � � � � � � � � � � � � � � � 321
Taming Prometheus: Talk About Safety and CultureSusan S. Silbey � � � � � � � � � � � � � � � � � � � � � � � � � � � � � � � � � � � � � � � � � � � � � � � � � � � � � � � � � � � � � � � � � � � � � � � � � � � � � � � 341
Political and Economic Sociology
Paradoxes of China’s Economic BoomMartin King Whyte � � � � � � � � � � � � � � � � � � � � � � � � � � � � � � � � � � � � � � � � � � � � � � � � � � � � � � � � � � � � � � � � � � � � � � � � � 371
Political Sociology and Social MovementsAndrew G. Walder � � � � � � � � � � � � � � � � � � � � � � � � � � � � � � � � � � � � � � � � � � � � � � � � � � � � � � � � � � � � � � � � � � � � � � � � � � 393
Differentiation and Stratification
New Directions in Life Course ResearchKarl Ulrich Mayer � � � � � � � � � � � � � � � � � � � � � � � � � � � � � � � � � � � � � � � � � � � � � � � � � � � � � � � � � � � � � � � � � � � � � � � � � � 413
Is America Fragmenting?Claude S. Fischer and Greggor Mattson � � � � � � � � � � � � � � � � � � � � � � � � � � � � � � � � � � � � � � � � � � � � � � � � � � � 435
Switching Social Contexts: The Effects of Housing Mobility andSchool Choice Programs on Youth OutcomesStefanie DeLuca and Elizabeth Dayton � � � � � � � � � � � � � � � � � � � � � � � � � � � � � � � � � � � � � � � � � � � � � � � � � � � � 457
Income Inequality and Social DysfunctionRichard G. Wilkinson and Kate E. Pickett � � � � � � � � � � � � � � � � � � � � � � � � � � � � � � � � � � � � � � � � � � � � � � � � � 493
Educational Assortative Marriage in Comparative PerspectiveHans-Peter Blossfeld � � � � � � � � � � � � � � � � � � � � � � � � � � � � � � � � � � � � � � � � � � � � � � � � � � � � � � � � � � � � � � � � � � � � � � � � � 513
vi Contents
Ann
u. R
ev. S
ocio
l. 20
09.3
5:49
3-51
1. D
ownl
oade
d fr
om a
rjou
rnal
s.an
nual
revi
ews.
org
by 7
9.79
.134
.19
on 0
7/24
/09.
For
per
sona
l use
onl
y.

AR348-FM ARI 2 June 2009 9:48
Individual and Society
Nonhumans in Social InteractionKaren A. Cerulo � � � � � � � � � � � � � � � � � � � � � � � � � � � � � � � � � � � � � � � � � � � � � � � � � � � � � � � � � � � � � � � � � � � � � � � � � � � � � 531
Demography
Social Class Differentials in Health and Mortality: Patterns andExplanations in Comparative PerspectiveIrma T. Elo � � � � � � � � � � � � � � � � � � � � � � � � � � � � � � � � � � � � � � � � � � � � � � � � � � � � � � � � � � � � � � � � � � � � � � � � � � � � � � � � � � 553
Policy
The Impacts of Wal-Mart: The Rise and Consequences of the World’sDominant RetailerGary Gereffi and Michelle Christian � � � � � � � � � � � � � � � � � � � � � � � � � � � � � � � � � � � � � � � � � � � � � � � � � � � � � � � 573
Indexes
Cumulative Index of Contributing Authors, Volumes 26–35 � � � � � � � � � � � � � � � � � � � � � � � � � � � 593
Cumulative Index of Chapter Titles, Volumes 26–35 � � � � � � � � � � � � � � � � � � � � � � � � � � � � � � � � � � � � 597
Errata
An online log of corrections to Annual Review of Sociology articles may be found athttp://soc.annualreviews.org/errata.shtml
Contents vii
Ann
u. R
ev. S
ocio
l. 20
09.3
5:49
3-51
1. D
ownl
oade
d fr
om a
rjou
rnal
s.an
nual
revi
ews.
org
by 7
9.79
.134
.19
on 0
7/24
/09.
For
per
sona
l use
onl
y.