Income Inequality and Labor Market Dynamics in Brazil · Income Inequality and Labor Market...
21
Income Inequality and Labor Market Dynamics in Brazil Fernando de Holanda Barbosa Filho IBRE – FGV Brazilian Institute of Economics – Getulio Vargas Foundation
Transcript of Income Inequality and Labor Market Dynamics in Brazil · Income Inequality and Labor Market...

Income Inequality and Labor Market Dynamics in Brazil
Fernando de Holanda Barbosa Filho
IBRE – FGV Brazilian Institute of Economics – Getulio Vargas
Foundation

Facts
• Income inequality declined in Brazil over the last decade.
• Several factors explain this drop: 1 - Minimum wage real gains policy 2 – Bolsa Família (Family Grant) 3 – Education Attainment improvement 4 – New Labor Market Dynamics
• Brazilian macroeconomic environment became more stable: credit market is booming.

Facts
Figure 1: Gini Index
0,480
0,500
0,520
0,540
0,560
0,580
0,600
0,620
0,640
0,660
19
81
19
82
19
83
19
84
19
85
19
86
19
87
19
88
19
89
19
90
19
92
19
93
19
95
19
96
19
97
19
98
19
99
20
01
20
02
20
03
20
04
20
05
20
06
20
07
20
08
20
09
Source: IPEA.

Minimum Wage Increase
• Barros et al (2000) show that minimum wage increases reduced inequality.
• Firpo and Reis (2007) show that increases in minimum wage were more important for inequality reduction in periods of high inflation.

Minimum Wage Increase
Table 1: Minimum Wage (MW) and Average Wage Evolution
Nominal MW Real MW Real AW MW/AW
1995 100.00 288.25 1250.36 23.1%
1996 112.00 284.13 1279.23 22.2%
1997 120.00 291.76 1267.65 23.0%
1998 130.00 305.75 1254.42 24.4%
1999 136.00 302.86 1169.35 25.9%
2000 151.00 314.26 0.00 28.1%
2001 180.00 349.14 1154.90 30.2%
2002 200.00 354.71 1128.77 31.4%
2003 240.00 362.19 1044.50 34.7%
2004 260.00 369.13 1035.93 35.6%
2005 300.00 405.64 1082.81 37.5%
2006 350.00 459.46 1158.84 39.6%
2007 380.00 475.09 1194.72 39.8%
2008 415.00 484.90 1210.60 40.1%
2009 465.00 522.43 1242.31 42.1%
2010 510.00 545.70
2011 545.00 545.00
2001 - 2009 Variation
158.3% 49.6% 7.6% 39.4%
Source: Self made with PNAD data.
Minimum Wage Increase
• Barros and Carvalho (2005) argue that minimum wage increases are not cost effective in reducing inequality.
• Soares (2006) and Barros (2007) use household data to show that BF is more effective in reducing inequality than raising minimum wage.
• Sabóia (2007) finds that the effect of minimum wages on poverty reduction is small.
• Afonso, Pereda, Giambiagi and Franco (2011) argue that the minimum wage is no longer a cost effective way to reduce extreme poverty.
• Neri (2010) also indicates that the government should use target social programs, such as BF to further reduce inequality.

Bolsa Família
• The most important conditionality is the requirement to keep children at school.
• BF benefited 6.5 million families in 2004.
• In 2011, it benefited 13.3 million families.

Bolsa Família • BF is a cost effective program. An increase of R$1 minimum wage
increase costs around R$300 million, while giving the same R$1 increase to BF recipients would cost 13.3 million reais.
Table 2: Number of Bolsa Família Benefits, average Value and Minimum Wage
Number of BF
Beneficiaries Average Value of Benefit BF as % GDP Minimum Wage
2004 6.571.839 67 0.3% 260
2005 8.700.445 63 0.3% 300
2006 10.965.810 63 0.3% 350
2007 11.043.076 75 0.4% 380
2008 10.557.996 86 0.4% 415
2009 12.370.915 95 0.4% 465
2010 12.778.220 97 0.4% 510
2011 13.352.306 120 0.5% 545
Source: IPEA and Ministério do Desenvolvimento Social e Combate à Fome (MDS)

Labor Market Dynamics
• GDP growth accelerated from 2003 to 2010.
• Higher economic growth raised employment levels.
Table 3: Brazil´s GDP Growth Rate
1995-1998 2.5%
1999-2002 2.1%
2003-2006 3.4%
2007-2010 4.5%
Source: IBGE.

Labor Market Dynamics
Figure 2: Unemployment Rate
0,0%
2,0%
4,0%
6,0%
8,0%
10,0%
12,0%
14,0%
mar
/02
set/02
mar
/03
set/03
mar
/04
set/04
mar
/05
set/05
mar
/06
set/06
mar
/07
set/07
mar
/08
set/08
mar
/09
set/09
mar
/10
set/10
mar
/11
set/11
mar
/12

Labor Market Dynamics
Figure 3: Informality Rate
15,0%
20,0%
25,0%
30,0%
35,0%
40,0%
mar/0
2
jul/
02
no
v/0
2
mar/0
3
jul/
03
no
v/0
3
mar/0
4
jul/
04
no
v/0
4
mar/0
5
jul/
05
no
v/0
5
mar/0
6
jul/
06
no
v/0
6
mar/0
7
jul/
07
no
v/0
7
mar/0
8
jul/
08
no
v/0
8
mar/0
9
jul/
09
no
v/0
9
mar/1
0
jul/
10
no
v/1
0
mar/1
1
jul/
11
no
v/1
1
mar/1
2
Fonte: PME

Labor Market Dynamics
• Increase in Educational Attainment
Table 4: Labor Force by Education Group
Schooling Years 2002 2009
0-3 23.3% 16.3%
4-7 29.0% 23.1%
8-10 16.4% 17.0%
11-14 23.5% 33.0%
>15 7.8% 10.6%
Total 86,335,873 101,110,213
Source: Barbosa Filho and Pessôa (2011)

Labor Market Dynamics • Impact of Education on the Average Wage
• Of the 15.8% real mean wage increase between 2002 and 2009, 4.3 p.p. were due to
higher real wages and 11.5 p.p. stemmed from changes in the educational composition of the labor force.
Table 5: Employment by Educational Group, Average wage and counter factual Average Wage
2002 2009
Emp (%) RW RW/AW (%) Emp (%) RW RW/AW (%) 2002 Emp(%) RW/AW (%)
0-3 24 473 45 17 565 47 565 52
4-7 29 698 67 23 935 78 935 86
8-10 16 844 81 16 859 71 859 79
11-14 23 1336 128 33 1235 102 1235 114
>15 8 3489 335 11 3192 264 3192 294
AW 1042 1207 1087
Source: Author´s calculations using PNAD data.

Labor Market Dynamics Table 6: Labor Market Transition Matrix
2002
Informal Formal Unemployed Out of Labor Force Total
Informal 68.1 21.1 3.2 7.6 100.0 Formal 5.1 89.3 1.2 4.3 100.0
Unemployed 7.1 8.6 53.7 30.7 100.0 Out of Labor Force 1.9 3.4 4.3 90.4 100.0
Total 10.2 38.4 6.2 45.3 100.0
2011
Informal Formal Unemployed Out of Labor Force Total
Informal 66.6 23.0 2.0 8.4 100.0 Formal 4.2 91.0 0.8 4.0 100.0
Unemployed 7.3 13.2 47.0 32.6 100.0 Out of Labor Force 1.9 3.8 2.7 91.6 100.0
Total 8.9 44.3 3.3 43.5 100.0
Change between 2002 and 2011
Informal Formal Unemployed Out of Labor Force Total
Informal -1.6 1.9 -1.2 0.8 0.0
Formal -0.9 1.7 -0.4 -0.4 0.0 Unemployed 0.2 4.6 -6.7 1.9 0.0
Out of Labor Force 0.0 0.4 -1.6 1.2 0.0
Source: Barbosa Filho and Moura (2012).

Beneficiaries Groups • Unemployment Reduction was higher for high unemployment rate
groups.
• It benefited the most the “marginal workers”.
• In 2009, unemployment increase was also higher for “marginal workers”.
Table 7: Unemployment by Education Group
2002 2008 2009
1 5,5% 4,2% 5,0%
4 9,6% 6,3% 7,8%
8 13,8% 10,7% 12,2%
11 10,4% 8,4% 9,7%
15 4,6% 4,0% 4,1%
Source: Barbosa Filho and Pessôa (2011)

Digression • “Marginal workers” are usually the most affect by macroeconomics
shocks.
Unemployment rate by Educational group in the US
0
2
4
6
8
10
12
14
16
jan
/00
jun
/00
no
v/0
0
abr/
01
set/
01
fev/
02
jul/
02
de
z/0
2
mai
/03
ou
t/0
3
mar
/04
ago
/04
jan
/05
jun
/05
no
v/0
5
abr/
06
set/
06
fev/
07
jul/
07
de
z/0
7
mai
/08
ou
t/0
8
mar
/09
ago
/09
jan
/10
jun
/10
no
v/1
0
abr/
11
set/
11
fev/
12
Less than High School
High School
College
Graduate
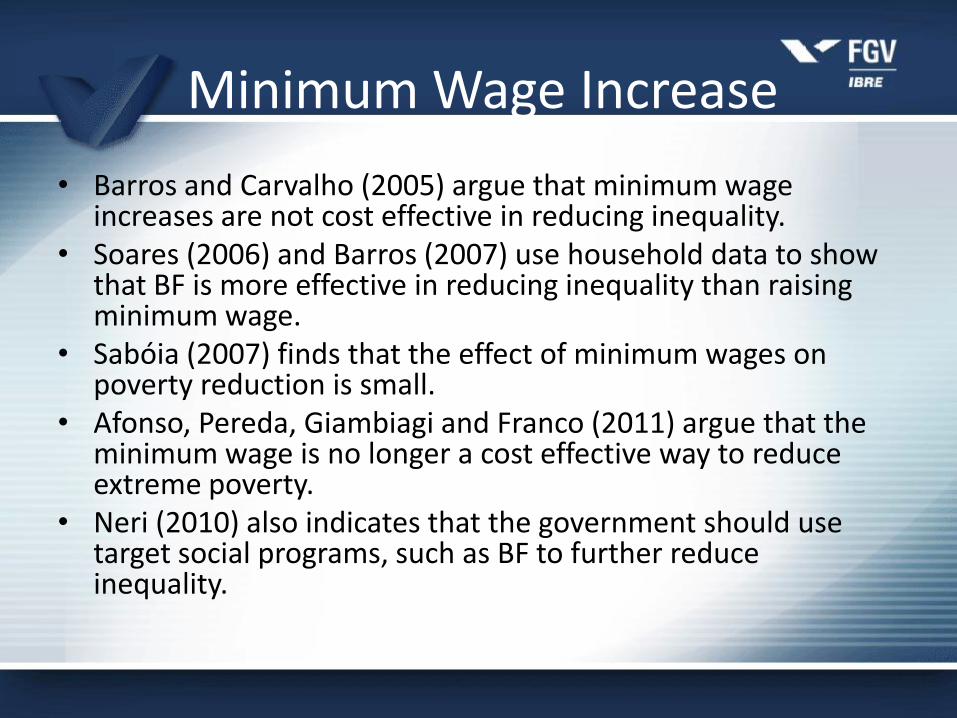
Beneficiaries • The decline in Informality was particularly important for highly
educated workers .
• Barbosa Filho and Moura (2012) show that almost 60% of the drop in informality between 2002 and 2009 is due to compositional effects stemming from increase in education levels.
Table 8: Informality by Education Group
2002 2008 2009
0-3 62.8% 59.7% 59.1%
4-7 50.4% 47.9% 48.7%
8-10 42.1% 42.1% 41.9%
11-14 28.7% 25.4% 24.7%
>15 26.1% 24.5% 23.4%
Source: Barbosa Filho and Moura (2012)

Digression • Brazil has a dual labor market, with formal and informal workers.
• Rights of informal workers are usually respected. The government is the looser. The employer avoids labor tax and social security contributions but pays employees benefits in order to avoid dealing with labor courts.
• It seems that informal labor in Brazil plays the role of temporary workers in Europe. The difference is that informal workers in Brazil are illegal while temporary jobs seem legal.

Beneficiaries Groups • The probability of moving from any other state in the economy to the
formal job increased for almost every group in the last 9 years.
Table 9: Transition change Towards Formal Job per Educational Group
2011-2002
Previous Period state 0-3 4-7 8-10 11-14 >15
Informal -1.5 1.1 -0.5 1.3 -5.2
Formal 3.2 1.2 0.9 0.4 0.0
Unemployed 28.7 4.1 5.5 6.8 2.0
Out of labor Force -0.3 0.1 0.6 1.1 0.5
Source: Barbosa Filho and Moura (2012).

20
Conclusions
• Increases in the real Minimum wage were important for reducing inequality.
• BF also played an important role in lowering inequality.
• With the significant real raise in minimum wage of the last 17 years, this policy is no longer cost effective.
• The literature also shows the BF program is a very effective program that targets the poor and costs only 0.5% ofGDP. It also has a considerable coverage, benefiting more than 13.3 million people.

21
Conclusions
• In recent years, the unemployment rate and informality declined substantially.
• Unemployment declined more among the less educated. These suffered the larger increase in unemployment rates during the crisis.
• The increase in the relative importance of more highly educated workers accounts for 60% of the reduction in informality through the compositional effect.
• Structural change combined with a greater macroeconomic stability increased the probability of finding a formal job irrespective of one´s education.